Article

Promoting Sustainability in the Recycling of End-of-Life Photovoltaic Panels and Li-Ion Batteries Through LIBS-Assisted Waste Sorting

Department of Building Materials Technology, Faculty of Materials Science and Ceramics, AGH University of Krakow, Mickiewicza 30, 30-059 Krakow, Poland
*
Author to whom correspondence should be addressed.
Sustainability 2025, 17(3), 838; https://doi.org/10.3390/su17030838
Submission received: 6 December 2024 / Revised: 8 January 2025 / Accepted: 10 January 2025 / Published: 21 January 2025

Abstract

:
To promote sustainability and reduce the ecological footprint of recycling processes, this study develops an analytical tool for fast and accurate identification of components in photovoltaic panels (PVs) and Li-Ion battery waste, optimizing material recovery and minimizing resource wastage. The laser-induced breakdown spectroscopy (LIBS) technique was selected and employed to identify fluoropolymers in photovoltaic back sheets and to determine the thickness of layers containing fluorine. LIBS was also used for Li-Ion batteries to reveal the elemental composition of anode, cathode, and separator materials. The analysis not only revealed all the elements contained in the electrodes but also, in the case of cathode materials, allowed distinguishing a single-component cathode (cathode A containing LiCoO2) from multi-component materials (cathode B containing a mixture of LiMn2O4 and LiNi0.5Mn1.5O4). The results of LIBS analysis were verified using SEM-EDS analysis and XRD examination. Additionally, an indirect method for identifying fluoropolymers (polytetrafluoroethylene (PTFE) or poly(vinylidene fluoride) (PVDF)) employed to prepare dispersions of cathode materials was proposed according to the differences in wettability of both polymers. By enabling efficient material identification and separation, this study advances sustainable recycling practices, supporting circular economy goals in the renewable energy sector.

1. Introduction

Photovoltaic energy production and energy storage are inseparable components of the efficient process of providing fossil fuel-free energy to industrial and individual users. In 2023, global solar energy production exceeded 1600 TWh [1], indicating that approximately one billion photovoltaic panels (PVs) were used worldwide. Most photovoltaic installations are expected to produce energy for 25–30 years [2] or even longer in special cases [2,3,4]. However, panels installed at the beginning of the twentieth century will soon end their operational life, being replaced with new units.
Photovoltaic systems generate clean energy, but their output is weather- and time-dependent, causing instability in supply. To smooth out peaks and dips in energy production without resorting to fossil fuels and storing surplus energy generated during periods of high intensity, energy storage systems are needed. Battery energy storage systems (BESS) are essential to overcome variability in energy production during the day and seasons. The total installed power generation capacity from battery storage is expected to increase dramatically over the next three decades, reaching approximately 945 gigawatts by 2050 [5]. In 2022, the estimated installed battery storage power capacity around the world reached the 52 gigawatt level [5]. When considering energy storage, more than 25,000 energy storage projects around the world used lithium-ion batteries, which represents 87.1% of all projects [5]. Projects utilizing lithium-free energy storage technologies, such as sodium-ion cells and flow batteries, which enable the reduction in scarce lithium consumption and, in the case of flow batteries, also allow for large-scale energy storage [6] and extended operational lifetimes, currently account for only 5.5% and 4.9% of ongoing projects, respectively [5]. This dominance is attributed to the fact that Li-ion batteries are considered to be one of the most efficient and cost-effective electrochemical technologies available. Despite their widespread use, relatively little research has been conducted on the estimation of the useful life of lithium-ion batteries for BESS applications. Few studies dedicated to this topic indicate that the operational life of BESS is approximately 8 years [7].
Li-ion batteries are also widely used in electric vehicles (EVs). In 2022, there were about 25.9 million electric vehicles operating around the world [8]. If a battery capacity decrease of 2% per year of EV operation is assumed, the residual capacity will reach 80% after ten years [9] of use. Repurposing retired EV batteries for second-life applications after evaluation of their performance test strategy is possible [10] and represents an optimal solution to prevent energy waste and utilize their remaining value but it is not always feasible.
Another area that requires the use of lithium-ion batteries is portable electronics, particularly in the production of smartphones, notebook computers, and tablets and small devices such as headphones, speakers, and microphones with batteries that are generally expected to last two years [11].
Therefore, there is an urgent need to develop safe technologies to manage these wastes, recover valuable materials, and reuse them in accordance with the principles of a circular economy. These efforts are essential to promote fossil fuel-free energy systems and advance sustainability goals.
Accurate identification of components in electronic waste is complex because of the diverse materials and chemical compounds present in these devices [12]. The materials used in production are multi-component, and the products themselves are multilayered, with only certain components separable by simple mechanical methods. Examples of multilayered structures of PV panels and Li-ion batteries are shown in Figure S1 in Supporting Materials.
In the case of PV panels, performing safe thermal treatment requires confirmation or ruling out the presence of fluoropolymers in the waste, as processing these materials may release toxic and volatile fluorine compounds [13]. Fluorine compounds can be present in both the front and back sheets of the panels (Figure S1a).
A typical process for recycling lithium-ion batteries involves cell discharging followed by shredding. As a result, this processing produces a material known as ‘black mass’, which typically contains components of lithium-containing cathodes, graphite anodes, current collectors such as aluminum and copper, binders, and conductive additives.
Preliminary separation of the anode and cathode is not performed currently, despite the fact that the laboratory-scale process does not require much effort and seems scalable and feasible for automatization. The important challenge is the diversity of active cathode materials (Table S1) already in use. Each of these materials has different chemical compositions and reactivities, with some (e.g., NMCs with high content of nickel) being particularly reactive. Although accurate identification of cathode compounds is challenging, the efficient identification of its components, applicable in industrial settings, seems to be beneficial for both safety and economic considerations.
Given that current technologies for processing lithium-ion battery waste are not yet fully optimized [14], a different way of approaching the battery recycling process can be explored.
To accomplish this task, it is necessary to employ elemental composition identification methods that enable rapid analysis without the need for a prior sample preparation and that are feasible for industrial applications. Laser-induced breakdown spectroscopy (LIBS) appears to be a suitable technique for this purpose. The LIBS spectrometer not only allows analysis of elements on the sample surface but also allows stratigraphic analysis, a characteristic of crucial importance for multilayered materials [15]. LIBS analyzers have been applied in various branches of industry [16,17], but many potential uses are still under investigation. These include, among others, LIBS-assisted waste sorting [16], the determination of lead in used car batteries [18], elemental analysis of old Zn–Mn batteries [19], and the analysis of cathodic materials in Li-ion batteries [20]. Our team recently demonstrated the applicability of LIBS to monitoring the thermal treatment of photovoltaic waste [21].
The purpose of the study is to develop a LIBS-based, safe, and effective procedure for (i) the identification of components of back sheets of photovoltaic panels to separate fluorine and fluorine-free waste before thermal processing and (ii) the identification of components of anode, cathode, and separator of Li-Ion batteries to separate and subject them to different treatments, depending on the chemistry of the cathode active material. Successful identification of components can serve as an initial step toward the development of automated sorters utilizing LIBS spectroscopy, which could be employed in the recycling plants of PV panels and lithium-ion battery waste.

2. Materials and Methods

2.1. Sample Collection and Preparation

For the study, a randomly selected photovoltaic panel was obtained from a company that specializes in the installation and recycling of panels. A single-sided silicon panel measuring 1650 × 1000 mm, featuring a white back sheet and enclosed in an aluminum frame, was cut into three sections and then further cut into 50 × 50 mm square pieces using a diamond blade. The pieces cut from the panel were not subjected to additional processing. A photograph of a typical sample used in the study is presented in Figure S2. Two prismatic Li-ion batteries were examined. Battery A was a 3.7 V replaceable battery taken from a damaged approximately 10-year-old mobile phone. Its external dimensions, including the casing, were 53 × 43 × 5 mm. Battery B, 3.7 V, with external dimensions of 35 × 25 × 8 mm, was purchased in 2024 and was intended for use as a nonbranded replacement battery for wireless headphones. The interior of battery B and the cathode extracted from battery A are shown in Figure S3. Neither battery provided information on the materials used in its manufacture. Both batteries were stored in a 5% NaCl solution before disassembly to discharge them [22,23] to avoid short-circuit causing temperature rise, gas release, fire, or even explosion [23]. After disassembly, the electrodes and separators were rinsed with dimethyl carbonate (DMC). In some cases, they were also subjected to ultrasonic treatment in a detergent solution for three 45 s sessions.

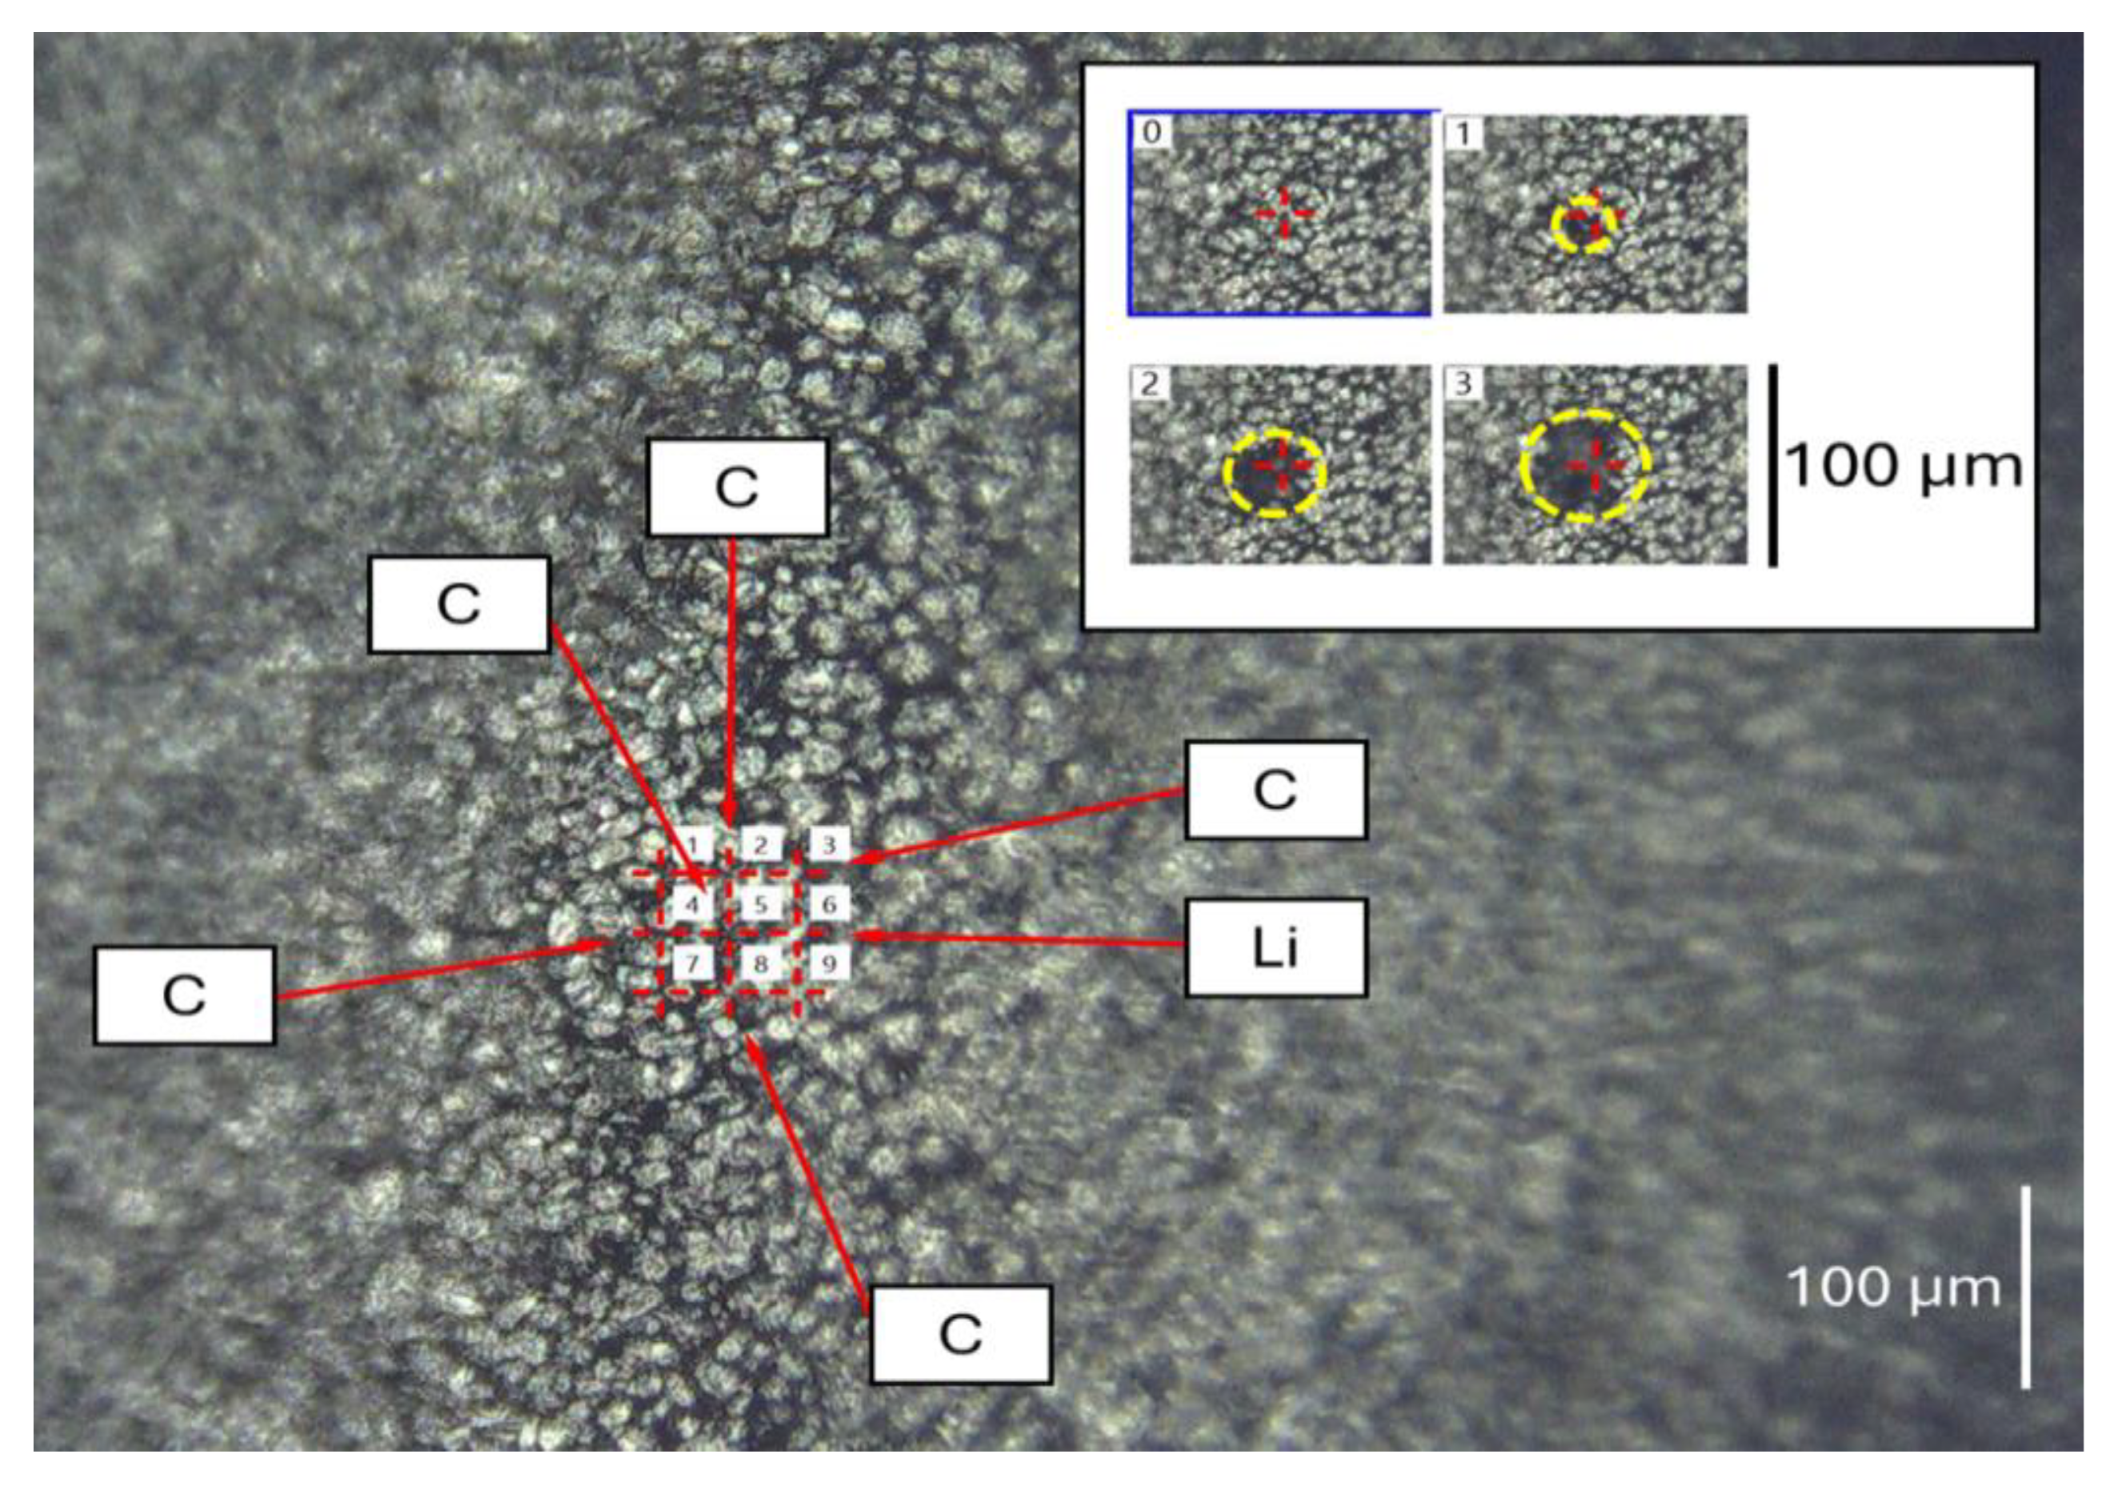
2.2. Microscopic Examination and LIBS Analysis

The samples were subjected to microscopic examination (Keyence microscope VHX-700 with LIBS head equipped with a 355 nm nanosecond Nd:YAG laser, Keyence International, Osaka, Japan). During microscopic observation, elemental analysis was performed using the laser-induced breakdown spectroscopy (LIBS) technique. The analyzer allowed for three settings of laser power, weak (ablation A), normal (ablation B), and strong (ablation C). The LIBS analyzer in one run allowed elemental surface mapping for nine points or performed depth profile (stratigraphic) analysis at the same sampling point. The device allowed for the measurement of surface topography profiles—surface roughness over lines and areas—which was used to determine the dimensions of ablation craters and visualize them in 3D.
Comparative analyses were performed using a scanning electron microscope (SEM) equipped with an energy-dispersive X-ray spectroscopy (EDS) detector (Apreo 2, Scios 2, ThermoFisher Scientific, Waltham, MA, USA).

2.3. Contact Angle Measurements

Contact angle (CA) measurements were made using an optical tensiometer, a Hamilton® syringe, and a stainless-steel needle (size 22 ga), all supplied by Theta Lite, Biolin Scientific, Finland. Measurements were made using distilled water at room temperature. Before CA measurement, the surface tension of the water was verified using the pendant drop method. A value of 70 ± 2 mN/m was used as the cleanliness threshold.
Polymer separator samples were affixed to microscope slides using double-sided adhesive tape prior to contact angle measurements. This preparation step was essential for smoothing the surface, thereby facilitating the observation of the deposited water droplet. Similarly, anode samples were mounted. The cathode material was sufficiently rigid and smooth and therefore the samples did not require any additional treatments.
Contact angle measurements were performed on five strips representing separators, anodes, and cathodes. For each strip, water droplets were placed at approximately 0.9 cm intervals. Depending on the length of the strip, between three (Battery B) and five (Battery A) droplets were deposited. This methodology yielded between 15 and 25 individual contact angle measurements for each material under investigation.

2.4. X-Ray Diffraction Studies

Diffractometric studies were carried out using a Philips PW 1050/70 diffractometer equipped with a copper (Cu) lamp and a nickel (Ni) filter.

3. Results

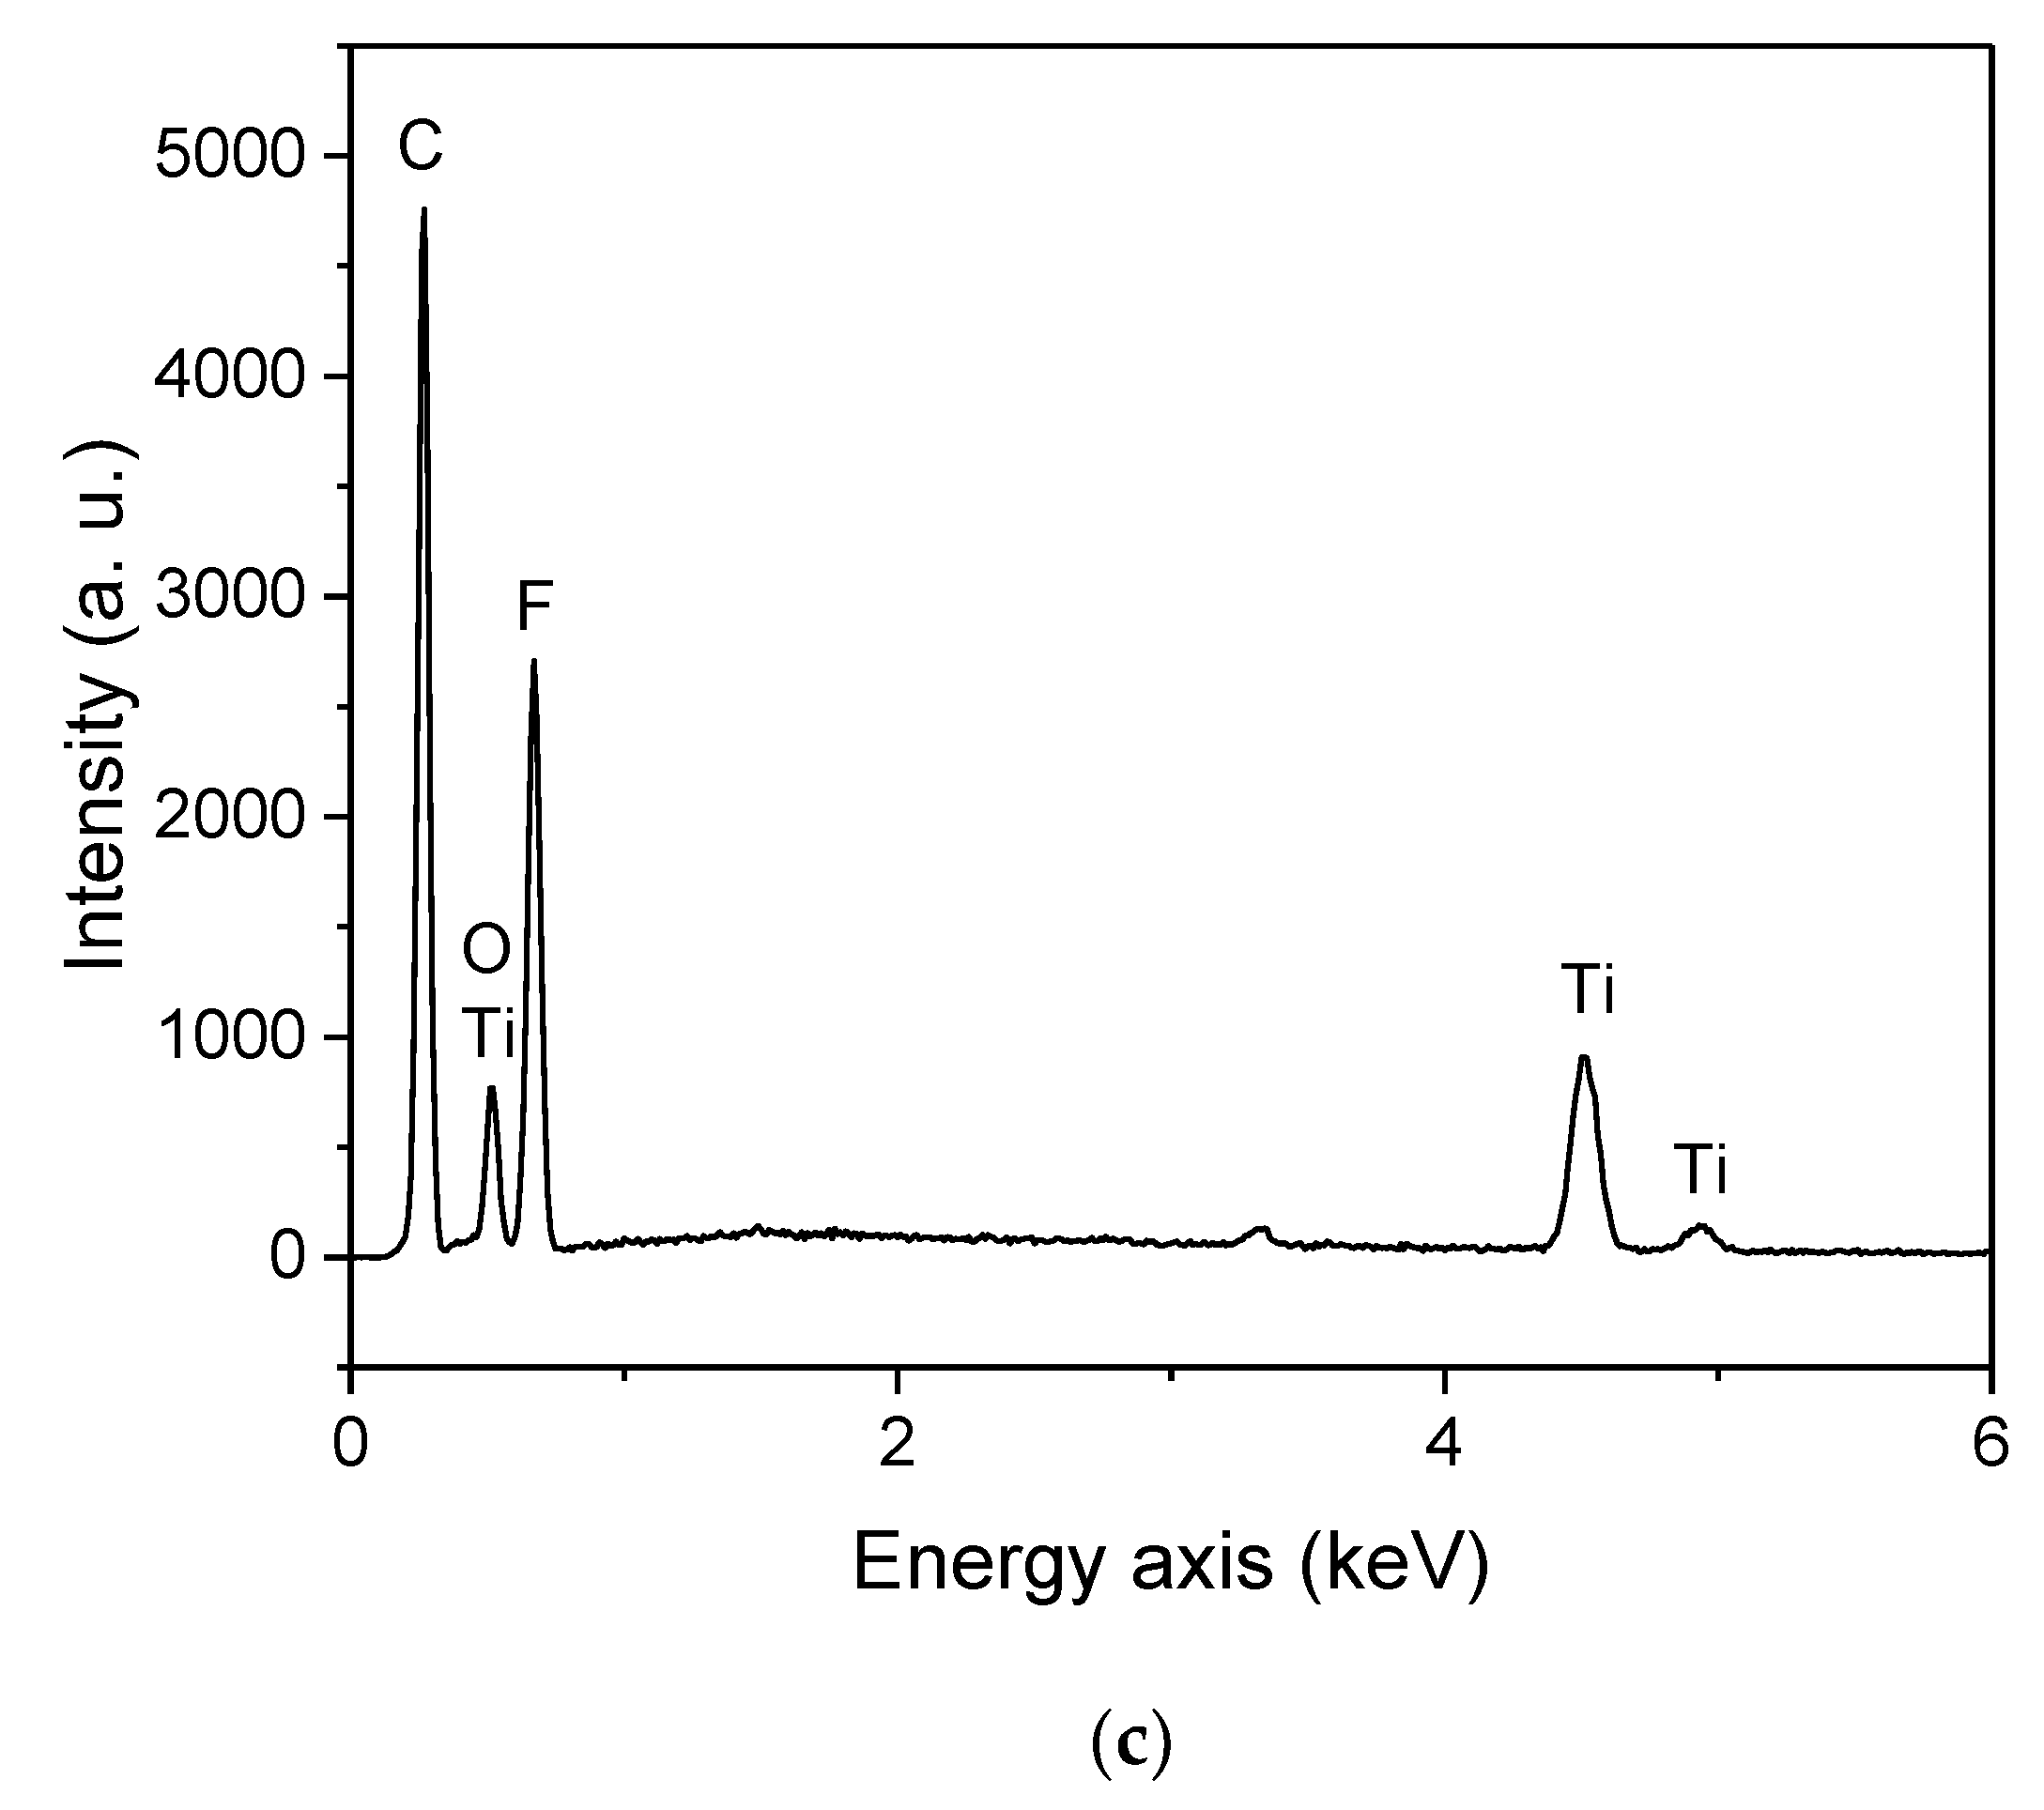
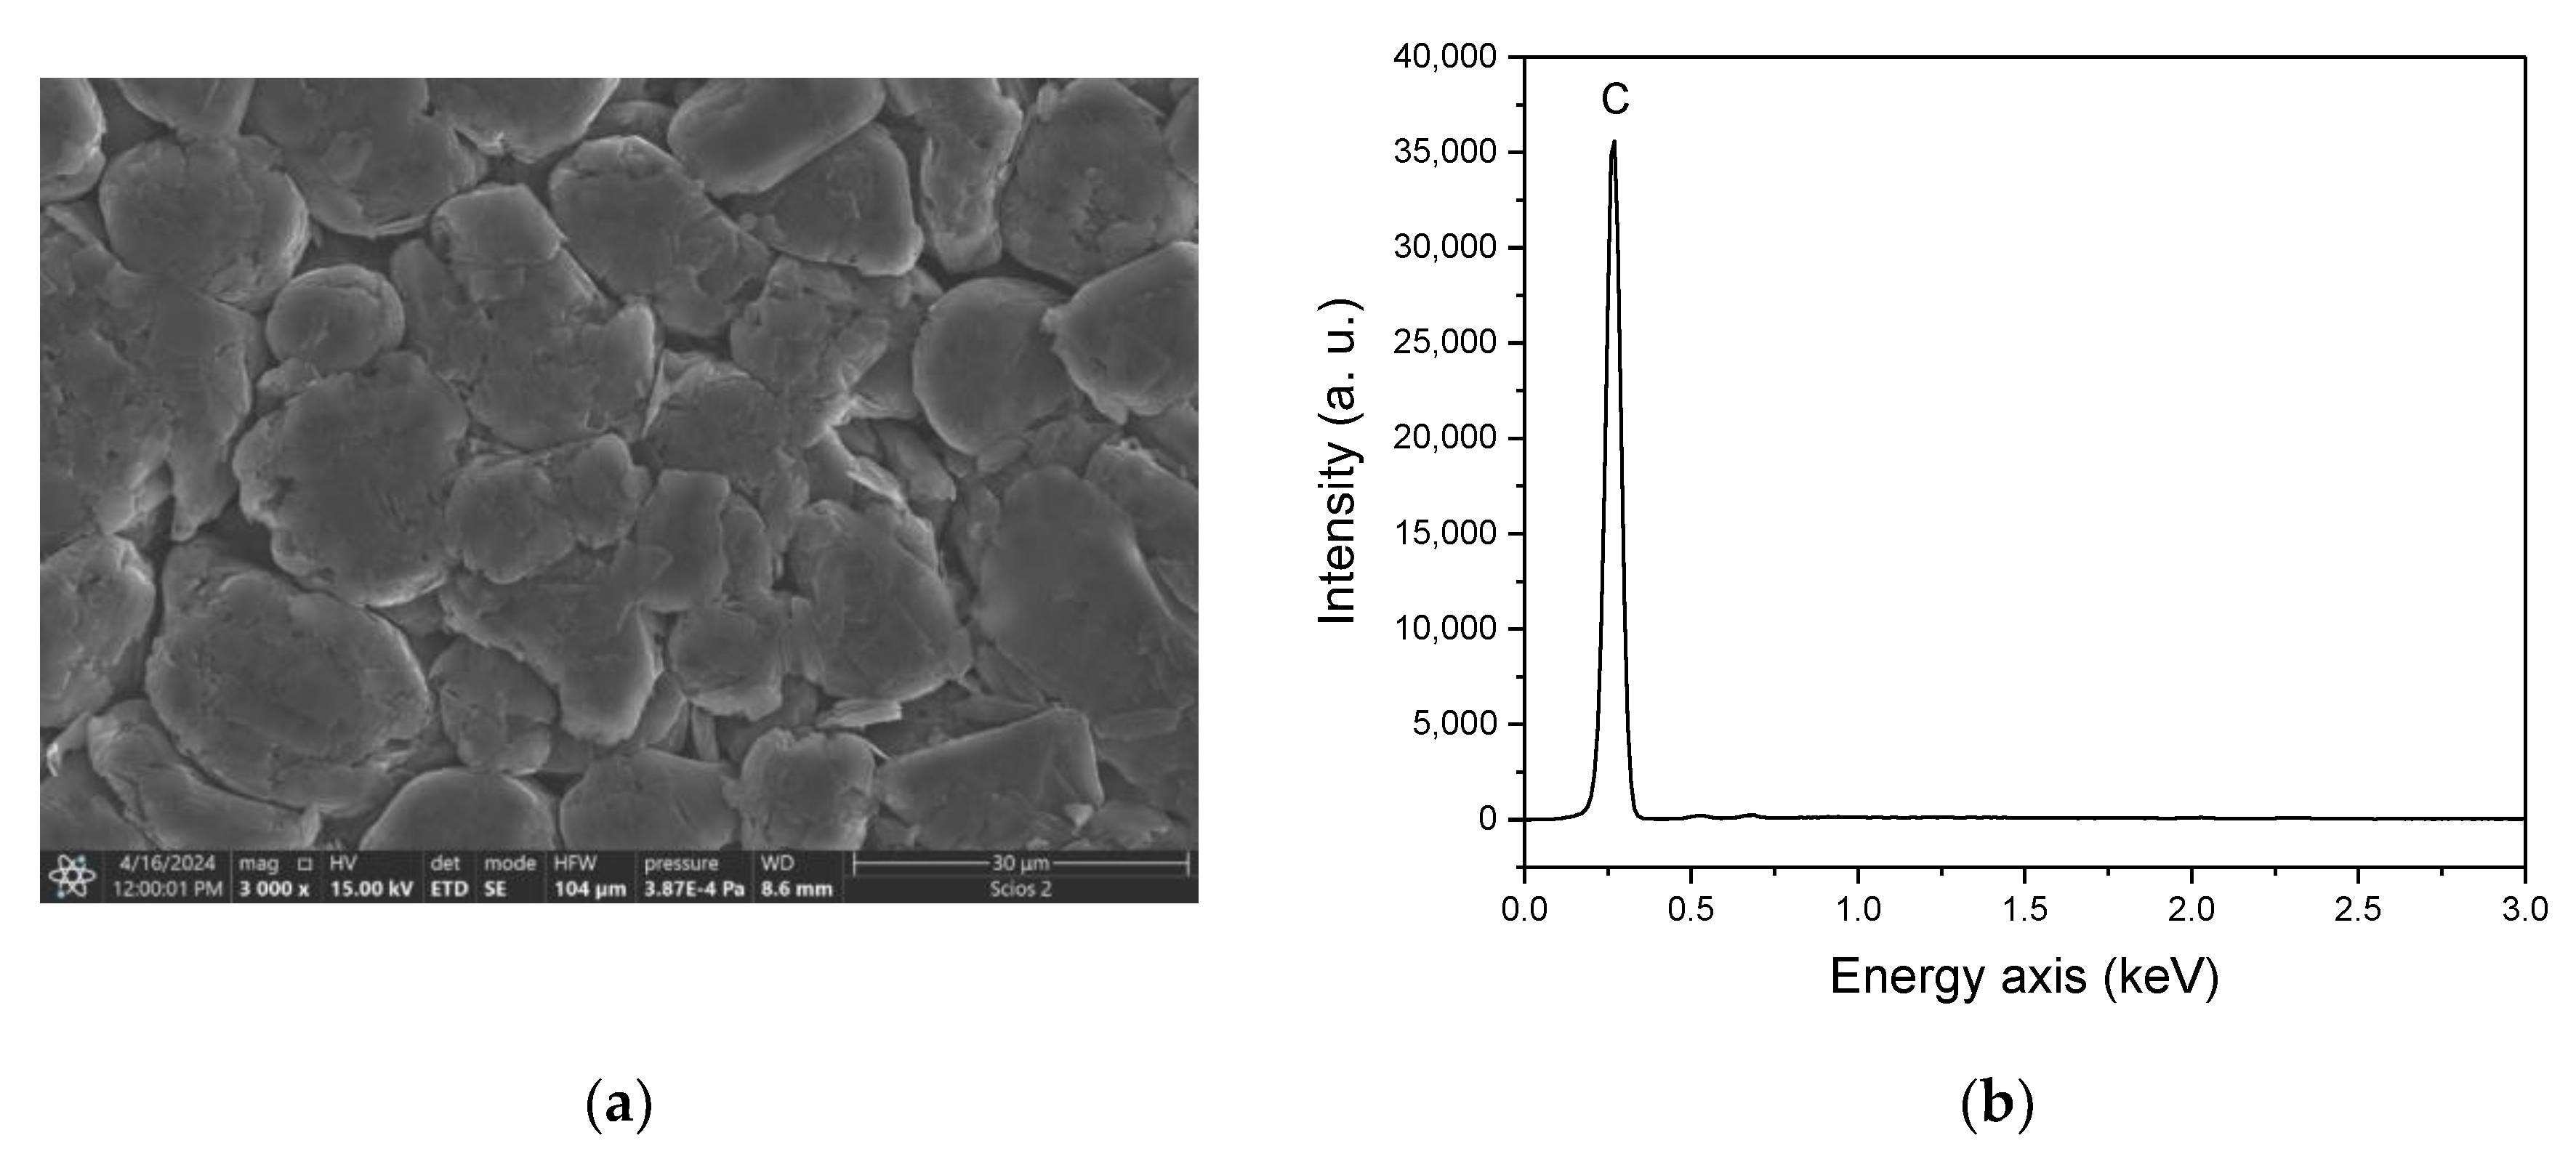
3.1. Analysis of PV Panels’ Back Sheets

The microscopic image and the schematic diagram of the cross-section of the photovoltaic panel are shown in Figure S1a presenting its main components, including a multilayered polymeric back sheet. The analysis of the sample by LIBS occurs in a micro-area exposed to laser radiation. As a result of the evaporation, a crater is formed, and the radiation emitted by the atoms of the elements originating from the material evaporated by the laser pulse is analyzed. Figure 1a shows a microscopic image recorded after the LIBS analysis of the PV panel back sheet, performed in three ablation series A, B, and C, each with nine evaporations. The craters labeled A were made with the weakest power pulses (ablation A), B with medium power (ablation B), and C with the highest power (ablation C). The craters A–C differ in diameter (Figure 1a) and depth (Figure 1b–d). Detailed data on the dimensions of the craters are presented in Table 1.
The craters formed in each series of A–C ablation have similar diameters, with differences between individual craters not exceeding 6.5%. When considering the depth of the craters, the variation is much greater, as illustrated by the three-dimensional images shown in Figure 1b–d. The most reproducible results were obtained for ablation with the lowest power pulse (RSD = 10%). In the other cases, the repeatability was around 15%. In addition to the difference in the depth of the crater, its shape also depended on the power of the laser pulse (Figure S4). Symmetrical, conical craters were obtained with low and medium laser power (Figure S4A,B), while ablation with the highest power beam resulted in more complex geometries and asymmetrical craters (Figure S4C,D). To highlight the differences in crater geometry, the Y scale was stretched in Figure S4a–c, while Figure 2a shows the actual geometry, with identical x- and y-scales. Furthermore, the ablation profile was compared with SEM images showing the microstructure of the sample at magnifications of 10,000× (Figure 2a) and 2000× (Figure 2b). Microscopic images taken at lower magnifications (Figure 2b) clearly show the non-uniform distribution of the pigment, identified as TiO2 using SEM-EDS analysis (Figure 2c). To illustrate the relationship between the ablation areas and the distribution of pigment clusters, circles corresponding to the diameters of the ablation craters were added to Figure 2b. The presence of TiO2 clusters can explain the varying depths and asymmetry of the craters (Figure S4C,D). In areas with high concentrations of TiO2 particles, due to the high thermal resistance of this oxide, evaporation is much more difficult than in areas with fewer particles. These observations indicate the need for multiple sampling in the micro-areas of the examined sample to obtain reliable results.
The power of the laser pulse affects not only the extent of ablation but also the detectability of elements. LIBS analysis results for the lowest power of laser beam showed only the presence of Ti and O, while medium power detected also C, and H (Table 1). Only the highest-power laser beam revealed the presence of fluorine (Table 1) in three points marked with circles on the microscopic image (Figure 2a).
Ablation performed at the same point (stratigraphic analysis) using a medium-power laser pulse showed the presence of fluorine from the second to fifth evaporation layer and the absence of fluorine in deeper layers. Two craters resulting from two ablations at the same point (stratigraphic analysis) are visible in Figure 2a, next to the craters labeled A and B. The lack of a fluorine signal for the first evaporation layer could have been caused by surface contamination of the sample. Previous studies have shown that cleaning the sample surface with distilled water improves fluorine detectability [21]. However, considering the application of LIBS analysis as part of an at-line waste sorting installation, it seems more appropriate to treat the first laser pulse as ‘pretreatment’ and use subsequent pulses to provide analytical information, rather than washing the panels before thermal processing. Employing an automatic laser cleaning would not significantly affect the total analysis time but would yield more reliable results, enabling the safe processing of photovoltaic panel waste.

3.2. Analysis of Components of Li-Ion Batteries

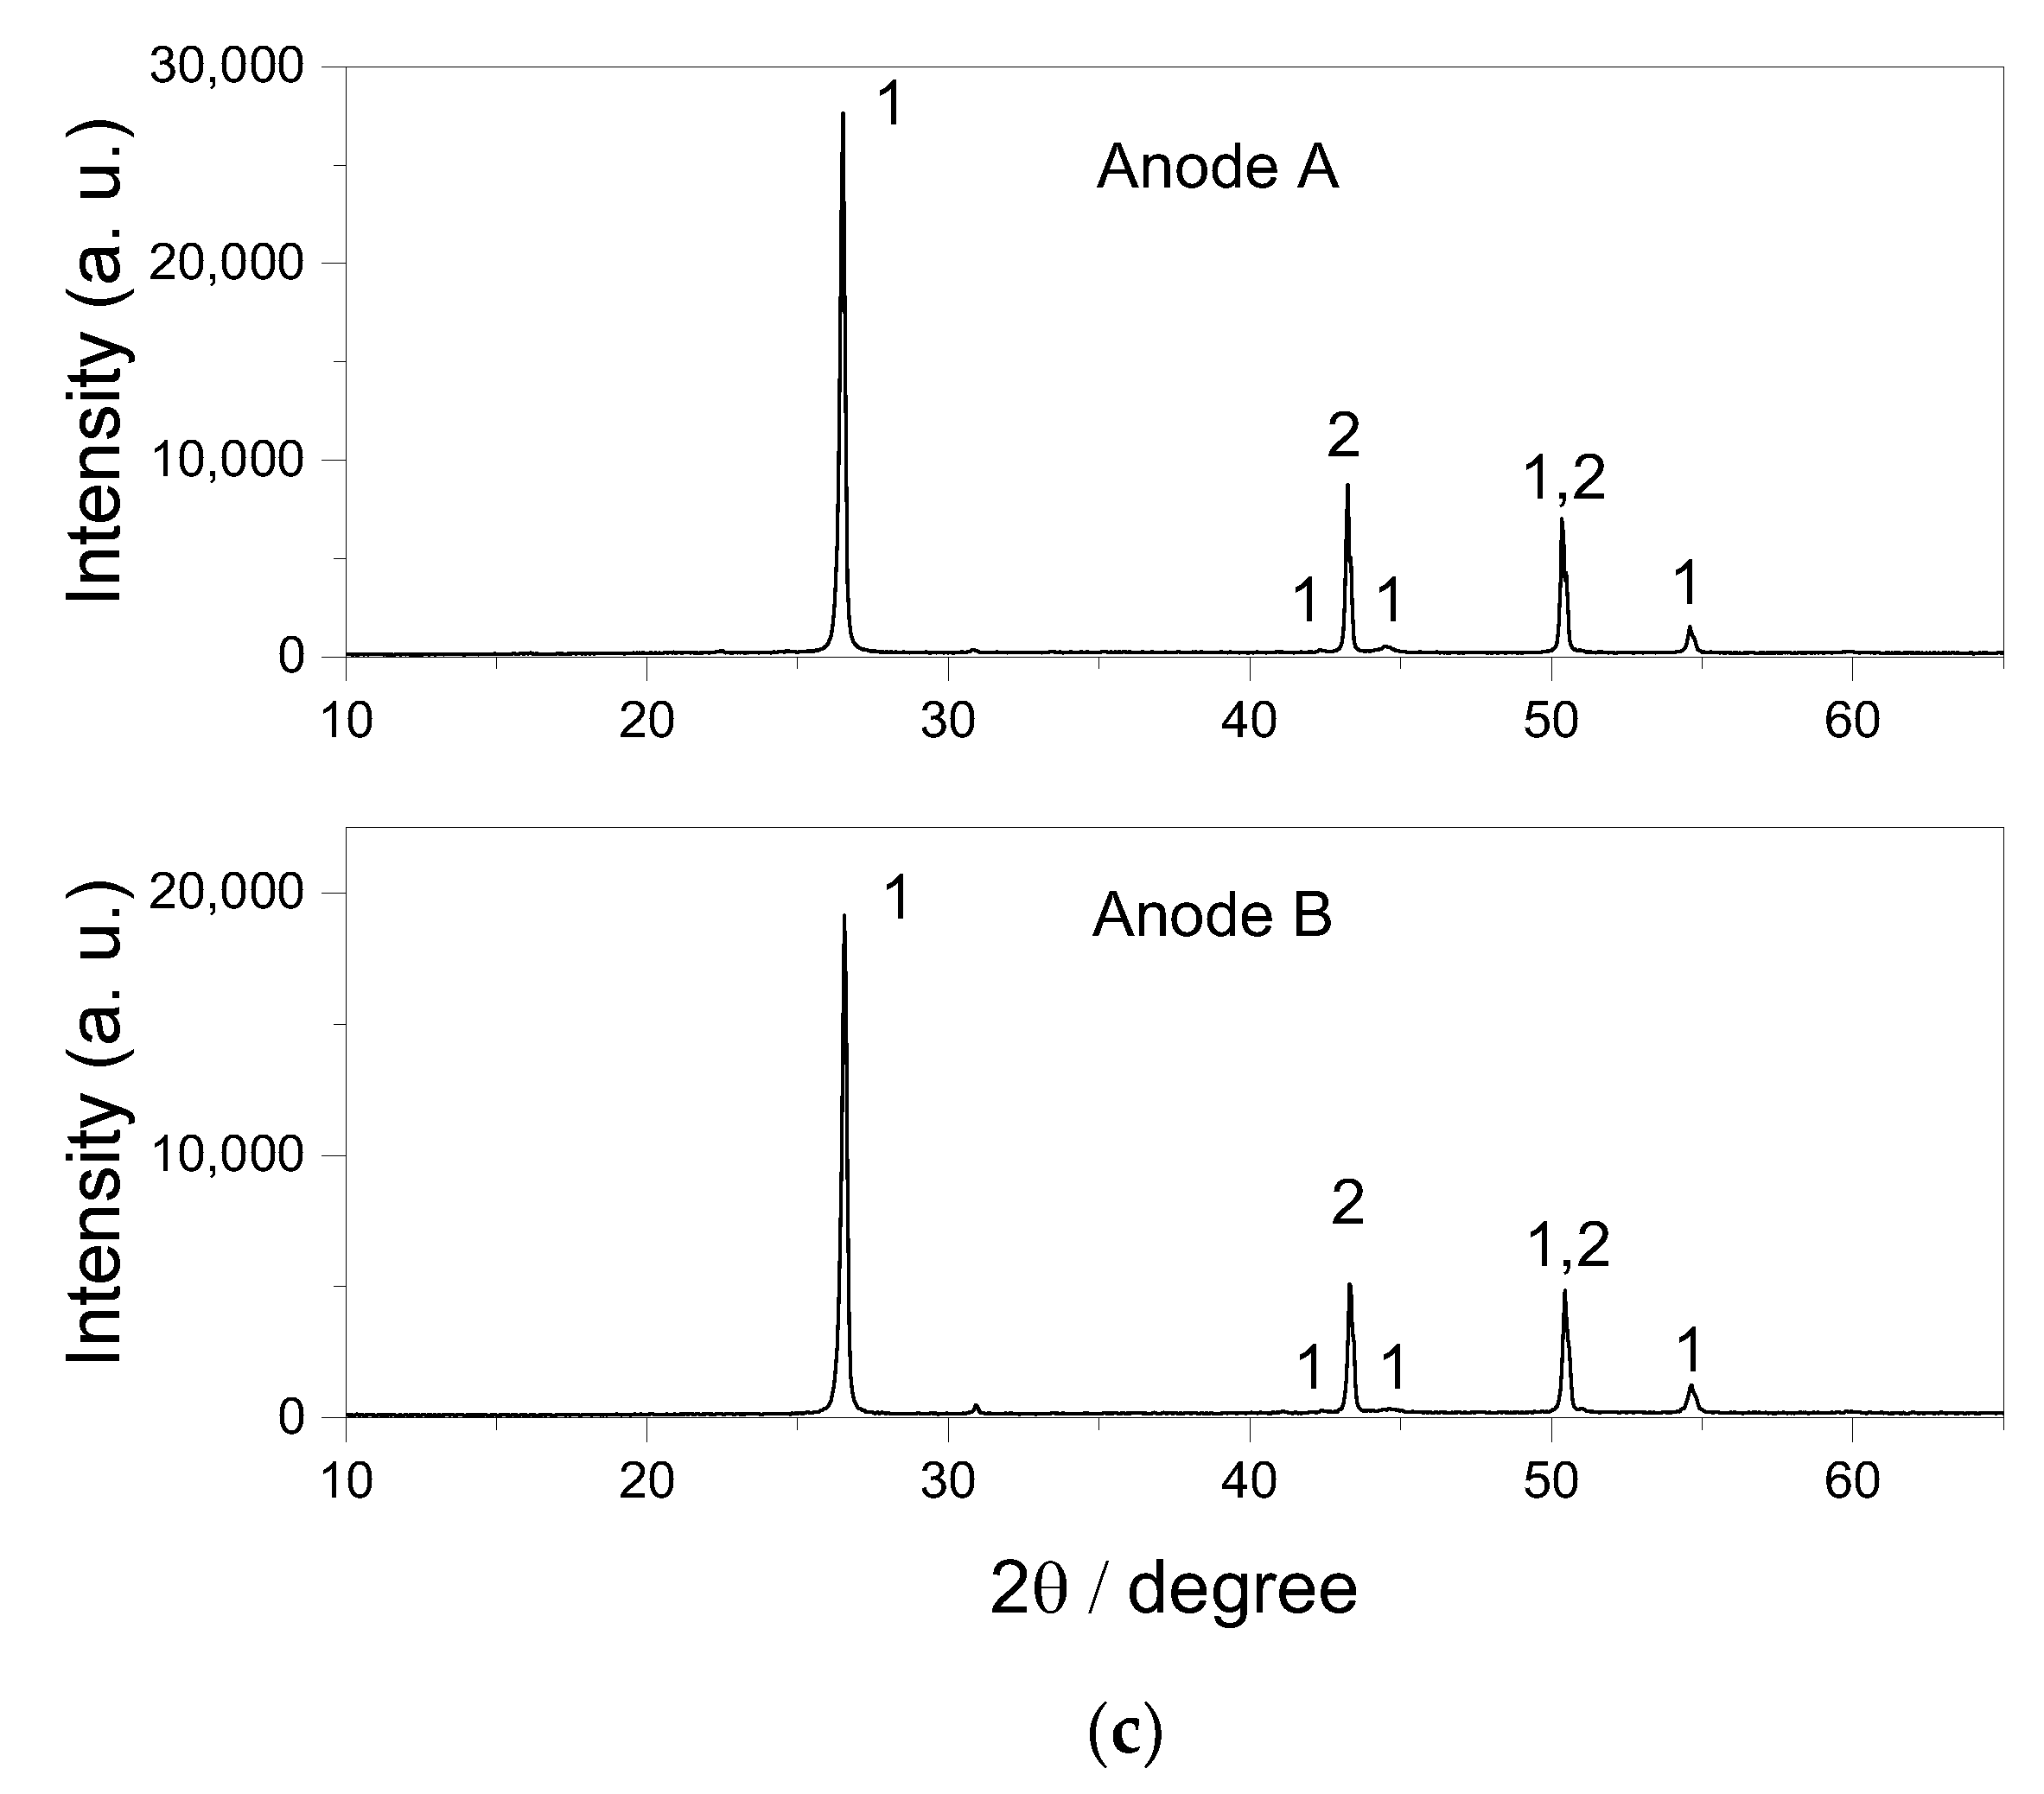
3.2.1. Analysis of Li-Ion Anodes

The cross-section of a Li-ion battery is shown in Figure S1b with anodic, cathodic, and separator tapes labeled on both the microscopic image and the illustrative scheme. The anode consists of copper tape coated on both sides with carbon-based material. Anode materials used in commercially available Li-ion batteries are predominantly carbon-based, such as graphite, conductive acetylene black, conductive carbon black, or, in more advanced cases, mesocarbon microbeads (MCMB). To apply these materials onto copper foils and prepare the anodes, it is necessary to disperse the carbon material in a suitable binder, which ensures proper adhesion [24]. The most commonly used dispersing agents are carboxymethyl cellulose (CMC) [25] and styrene-butadiene rubber (SBR) [26]. The mentioned materials are relatively inexpensive and environmentally safe, making thermal processing for energy recovery a justified form of recycling.
Scanning electron microscopy (SEM) combined with energy-dispersive X-ray spectroscopy (EDS) was employed to analyze anodes sourced from disassembled Li-ion batteries. The results revealed the presence of carbon-containing grains with a flaky structure typical of natural graphite (Figure 3a,b), a material commonly used in the production of Li-ion anodes [27,28,29]. The presence of graphite was also confirmed by XRD analysis (Figure 3c).
The LIBS analysis also indicated the presence of carbon and additionally detected lithium (Figure 4), which is undetectable by techniques such as EDS (Figure 3b). These findings demonstrate the utility of LIBS for the detection of lithium in anode materials, not only in pristine laboratory-prepared [30,31] or artificially aged samples [32] but also in materials originating from routine operational use. The stratigraphic analysis conducted at the same point for three successive laser pulses allowed for the assessment of sampling area sizes, corresponding to ablation craters with diameters of 20, 35, and 45 μm (at medium laser power). These crater sizes were comparable to those obtained from the ablation of the polymer materials used on the back sheets of photovoltaic panels (Table 1). The stratigraphic analysis carried out at the point shown in Figure 4 (inset) revealed the presence of carbon in the surface layer and then lithium as a result of the second and third laser ablations. The surface wettability analysis of the anodes provided similar contact angle values, with 47 ± 2° for anode A and 52 ± 3° for anode B, indicating that dispersing agents with similar properties were used to form anodes.

3.2.2. Analysis of Separator

Another critical component of Li-ion cells is the porous separator, soaked with liquid electrolyte, which separates the anode and cathode, preventing direct contact while allowing the passage of lithium ions between them during charge and discharge cycles. The literature mentions a wide range of fluorinated (PTFE, PVDF) and non-fluorinated (PE, PP) polymer materials proposed for use as separators [33]; however, polyethylene (PE) is predominantly used in commercial applications.
A quick method for qualitatively distinguishing between different polymers is the measurement of the contact angle, as polymers typically used as separators differ significantly in wettability (contact angle: PTFE 111-122° [34,35], PE 100° [35], PVDF 80° [34]). The separators recovered from used batteries were white in color and exhibited moderate surface hydrophobicity (contact angle: 96.9 ± 1.3° for separator A and 95.04 ± 4.4° for separator B). The differences in contact angles recovered from batteries A and B were not statistically significant. Additionally, for reference analysis, the contact angle for a PTFE sample, used for the manufacturing of laboratory vessels, was measured, revealing a significantly higher contact angle of 108.01 ± 2.4°. The contact angle values for the examined polymers are summarized in Figure 5a. Considering the obtained results and the information regarding polymers used in the production of commercial separators, it can be expected that the polymer used for the production of the separators was polyethylene (PE).
The separators originating from battery A and B samples and the PTFE block were further analyzed using LIBS. The results excluded the presence of fluorine in the separator samples (Figure 5b) and confirmed its presence in the PTFE sample (Figure 5c). These findings demonstrate that LIBS is an appropriate technique for rapid qualitative analysis of materials used as separators and can serve as an effective tool for the efficient identification of polymer waste from spent Li-ion batteries.

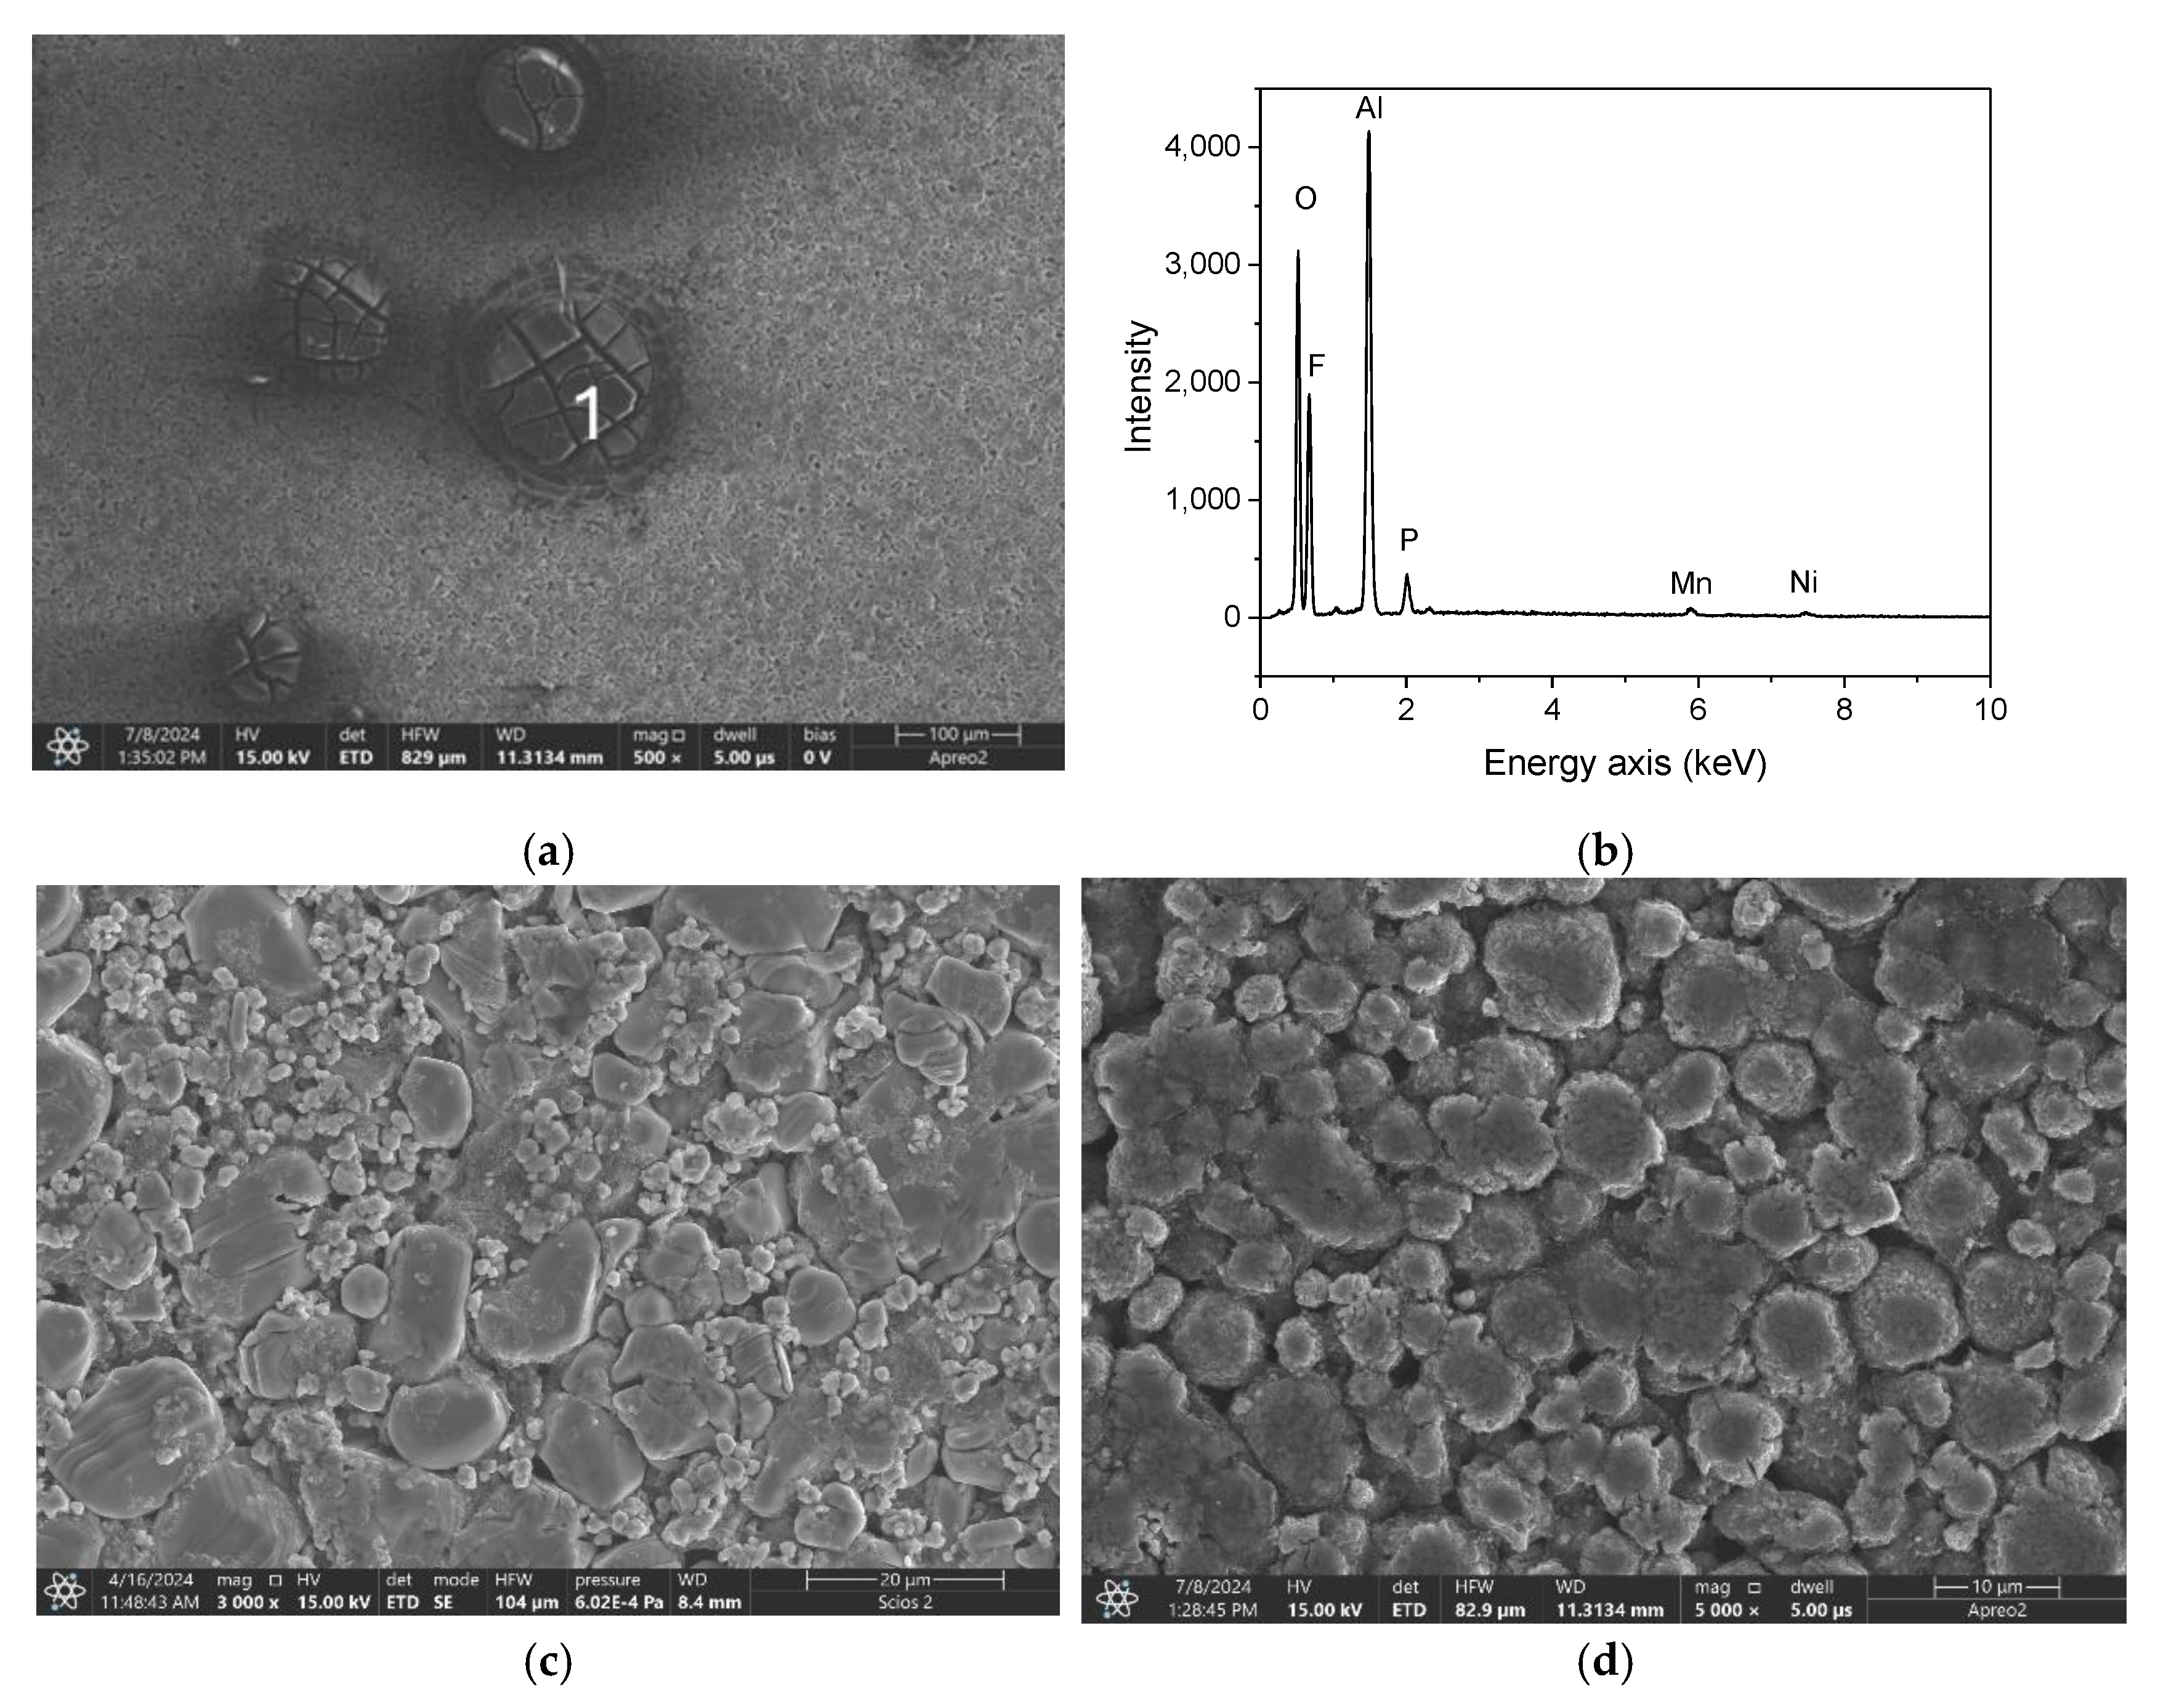
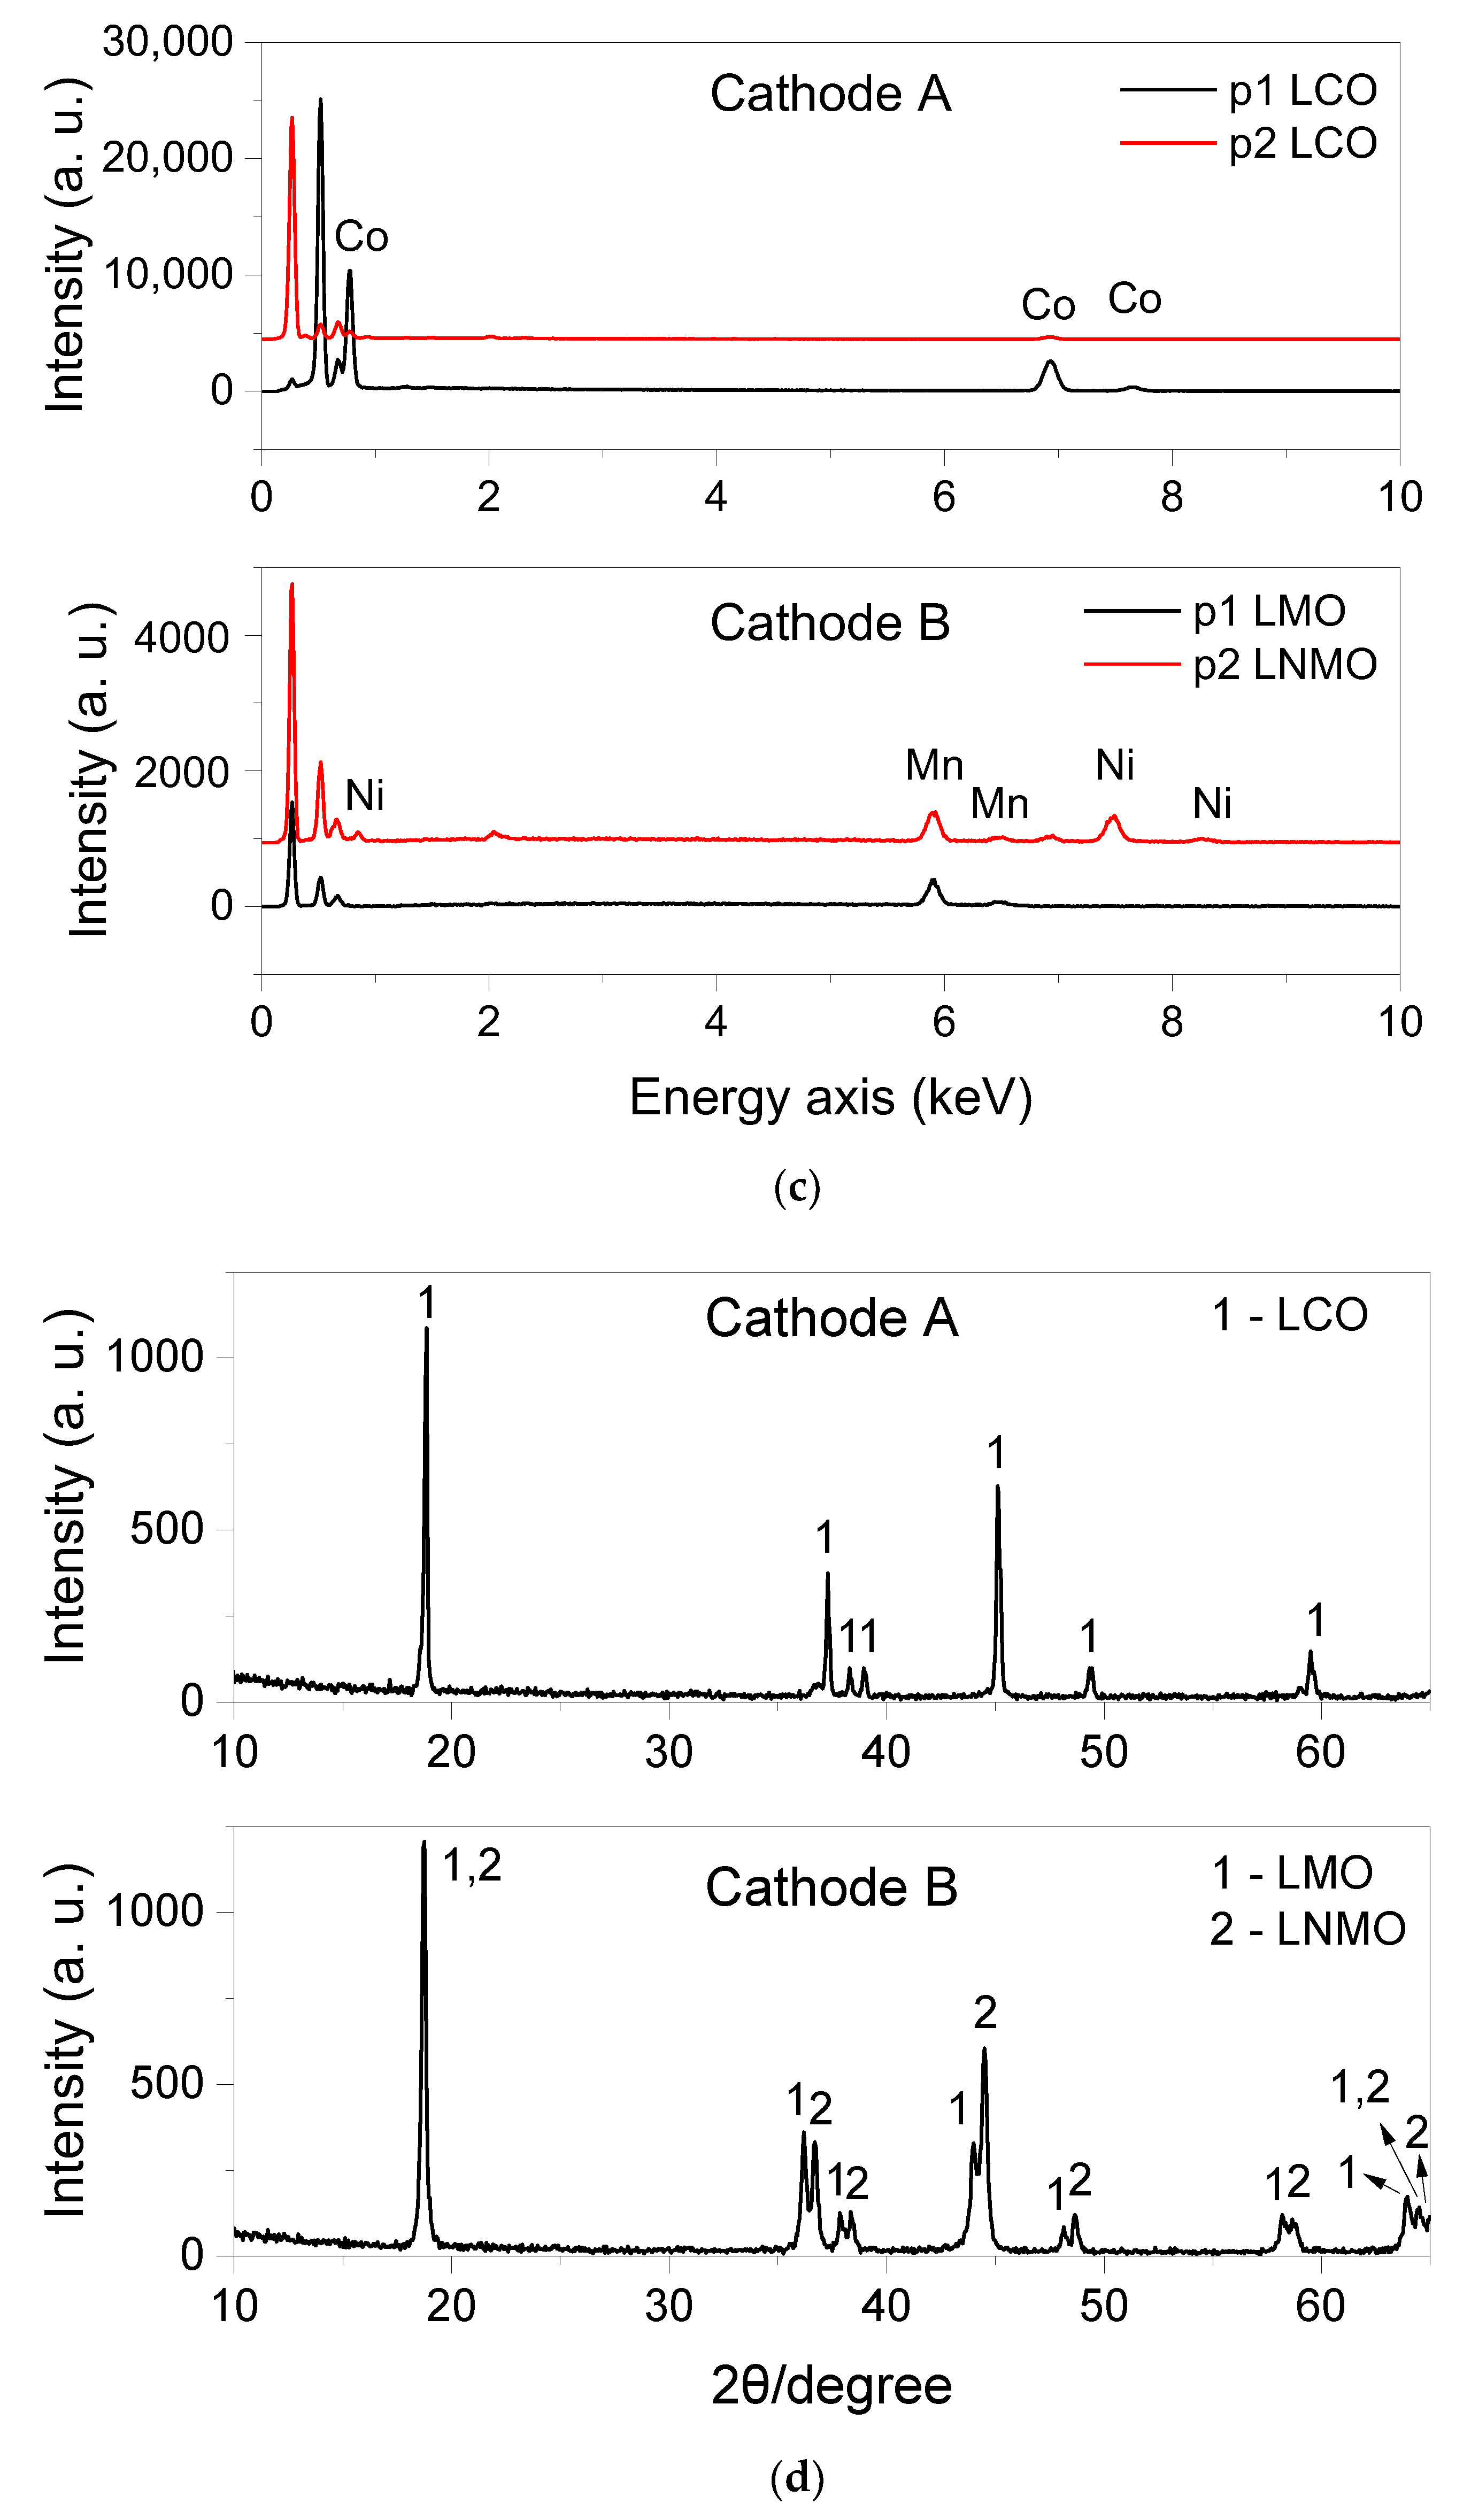
3.2.3. Analysis of Cathode

While discharging battery A was quick and straightforward, the discharging process for battery B involved intense gas evolution. This process continued even after the battery components had separated, resulting in changes in the surface of the cathode material. The anode material was not affected by this process. Figure 6a shows a fragment of battery B’s cathode with bulky reaction products. The presence of aluminum compounds (Figure 6b) indicates that the current collector material, aluminum, participated in the reaction [36]. The SEM images captured at higher magnifications in areas not affected by corrosion reveal detailed features of the cathode materials’ morphology. The cathode materials A (Figure 6c) and B (Figure 6d) exhibit significant differences in microstructure. A striking feature of cathode material A is the sharp contrast between large, well-defined particles (55.6 ± 7.1 µm in diameter) and much smaller agglomerates (1.9 ± 0.1 µm in diameter). The intergranular spaces were filled with dense, compact matter. In contrast, the cathode material B shows a different morphology, formed by uniformly distributed round particles of an average diameter of 6.7 ± 0.7 µm. Furthermore, the structure of individual grains of material B is complex, indicating that separate granules are made up of smaller crystallites. The grains are flattened on top as a result of tight packing within the battery, indicating lower mechanical strength compared to the large crystalline grains of the cathode material A.
The cathodes separated from the Li-ion battery contained residual electrolytes and were water-wettable (Figure 6e,f). Removal of the residual electrolyte required the use of dimethyl carbonate (DMC) and subsequent ultrasonically assisted treatment with water containing a surfactant. Cathode A did not show damage from ultrasound treatment, although slight turbidity appeared in the solution when cathode B was sonicated, but the electrode surface showed no noticeable changes. After such treatment, the surface of cathode A was highly hydrophobic (contact angle > 120°, Video S1). Cathode B was wettable, and the contact angle changed rapidly from a value close to 90° measured immediately after placing the drop of water to 40° after 10 s (Video S2). As the test results indicate, contact angle measurements can serve as a tool for the preliminary identification of the polymer used to disperse the cathode material, distinguishing between hydrophobic PTFE and hydrophilic PVDF. These polymers differ in decomposition temperature; therefore, separating materials containing PVDF and PTFE would allow for lower thermal treatment temperatures for electrodes containing PVDF. The presence of fluorine in both cathodes was confirmed using SEM-EDS analysis (Figure S5).
The identification of compounds contained in the active cathode materials was significantly more challenging. Visually, the differences between the cathodes were minimal: cathode A was dark gray, while cathode B was intense black. The cathodes were examined using LIBS spectroscopy (Figure 7). The arrangement of the measurement points was identical to that shown in Figure 4, which presents the analysis of the anode materials. The cathode material proved to be significantly more difficult to ablate using the laser beam as a result of the higher thermal resistance of the compounds used in cathode manufacturing. This is evidenced by the noticeably smaller ablation craters visible in Figure 7a. A comparison of the diameters of LIBS craters formed during ablation of cathode and anode material is shown in Figure S6. Despite smaller dimensions, the ablation efficiency was sufficient to obtain clear LIBS spectra (Figure 7b) and perform a thorough analysis of the cathode material. For cathode A, the results were fairly conclusive indicating that the cathode material was LiCoO2 (LCO) (Figure 7c) as the experimental data closely matched the elemental composition calculated for pure stoichiometric LCO. The results were confirmed by SEM-EDS analysis (Figure 8a,c—upper panel). Detection of lithium is not possible using EDS, but the only elements detected for cathode A were oxygen and cobalt.
In the case of cathode B, the situation was much more complex. The elements detected using LIBS were Li, Mn, Ni, and O, which could suggest that the material used is LiNi₀.₅Mn₁.₅O₄ (LNMO). However, the percentage composition did not correspond to the compound mentioned (Figure 7d). It was assumed that the tested cathode material is a mixture of several compounds, containing Li, Mn, Ni, and O, such as LNMO and LMO. To confirm this hypothesis and verify the LIBS results, SEM images coupled with EDS and XRD patterns were recorded. The results obtained are presented in Figure 8b (SEM) and Figure 8c (EDS, lower panel). The grains containing manganese and oxygen (Figure 8b, point 1) and grains containing manganese, nickel, and oxygen (Figure 8b, point 2) were detected, which seems to confirm the hypothesis of a complex composition for cathode B.
The final test performed to reveal the composition of the electrode materials was XRD analysis (Figure 8d). The presence of sharp and narrow peaks in the diffraction pattern of cathode material A confirmed that it is a single-phase material (Figure 8d, upper panel). The split double peaks observed in the diffraction pattern provided in Figure 8d (lower panel) indicated that the cathode material B was biphasic, composed of the mixed phases of LMO [37,38] and LNMO [39,40,41]. The further evidence supporting the correct identification of electrode material B was provided by a study [42] in which the authors investigated LMO-LNMO mixtures, obtaining XRD results similar to those shown in Figure 8d. However, it should be noted that interpreting diffractograms for electrode materials is not easy, as electrode material undergoes changes during charge and discharge cycles, leading to alterations in peak positions in diffractograms, both toward higher and lower angle values [29]. Oxide diffraction patterns are also affected by the manufacturing process [42] as well as the type of precursor for LMO [37] or LNMO [39] containing cathode manufacturing.
The identification results of the active material appear to also be consistent with the date of production of these electrode materials. Battery A was manufactured at least ten years before it was tested when LCO was almost exclusively used for cathodes of Li-ion batteries. On the contrary, LNMO is a relatively new electrode material and a potential candidate for high-voltage Co-free cathodes in lithium-ion batteries [43,44]. It is commercially available as a raw material for the production of lithium-ion batteries, although its price is relatively high, and only lithium nickel cobalt aluminum oxide is more expensive (Table S1). However, LMO is the cheapest electrode material. According to data from the literature, combining LMO and LNMO as cathode material improves discharge capacity, and cyclic and thermostability compared to single-component LMO and LNMO-based cathodes [42,45,46]. It can be expected that the use of hybrid materials in practical applications will become more widespread, leading to an increase in the volume of waste generated. Other hybrids such as LNMO/graphite [47] and LNMO/carbon black [48] are also recommended because they offer longer service life, lower cost, and easier recyclability.
The presented results of the Li-ion battery composition analysis demonstrate that the use of LIBS makes it possible to identify individual components such as the anode, separator, and cathode and distinguish between different oxides forming the cathodes. The LIBS-assisted sorting approach eliminates the need for shredding Li-ion battery waste, which often produces hard-to-separate mixed materials. Instead, streamlined sorting enables an efficient closure of the battery life cycle with the high potential for multiple reuse of active components (Figures S7 and S8, Table S2).

4. Conclusions

The study demonstrated that LIBS spectroscopy can be considered an effective, rapid, and reliable analytical tool capable of distinguishing between the various materials present in photovoltaic and Li-ion battery waste.
In the analysis of photovoltaic panel waste, a key challenge was the detection of fluorine-containing polymer layers and the determination of their depth profile. The presence of fluoropolymers in the back sheet layers of photovoltaic panels after optimization of LIBS laser impulse power was effectively identified, and the thickness of the fluoropolymer layer was estimated. One challenge that was noticed was the presence of surface contamination that hindered the determination of fluorine. It was overcome by the use of a pretreatment phase, namely, ablative surface cleaning by low-power laser pulses to enhance the fluorine signal.
In the analysis of Li-ion battery waste, the differentiation between the anode materials and the separator posed no significant challenges. LIBS analysis confirmed the presence of carbon in the anode material and indicated that the polymer used for the separator was fluorine-free. However, the identification of cathode materials presents a considerably greater challenge. When Li-Ion cathodes were examined, LIBS allowed the identification of the different active components of cathode materials, including LCO, LMO, and LNMO. The analysis not only detected all the elements but also allowed one to distinguish whether the cathode material was a single component (cathode A) or a hybrid of two oxides (cathode B). After identification, cathode materials of different chemistry can be collected separately and subjected to recycling with respect to their specific chemical properties. The use of LIBS for lithium-ion batteries is particularly beneficial because it allows for the determination of all elements contained in the active material, including lithium.
In addition, an indirect method for the identification of the type of fluoropolymer used as a dispersing agent for the cathode material was proposed. The developed procedure is based on the wettability differences of fluoropolymers used in cathode manufacturing, namely, PTFE and PVDF, where the former is highly hydrophobic and the latter is hydrophilic.
The presented results suggest that LIBS analysis could enable the development of automated sorting systems for PV panels and Li-ion battery waste, which would significantly facilitate the recycling of these difficult-to-process materials. This approach can facilitate efficient resource recovery, support the circular economy, and minimize environmental impact through greener and more tailored waste management practices.

Supplementary Materials

The following supporting information can be downloaded at: https://www.mdpi.com/article/10.3390/su17030838/s1, Table S1. Cathode active materials used for Li-Ion batteries manufacturing. Table S2. Li-ion battery treatment process divided into separation steps controlled by LIBS. The numbering corresponds to the stages indicated in Figure S7. Figure S1. Microscopic images and schematic diagrams of photovoltaic panel (a) and Li-Ion battery (b) cross-sections. Figure S2. A fragment of a silicon photovoltaic panel, measuring approximately 5 × 5 cm, shown from the front side (left photo) and from the backsheet side (right photo), cut from the photovoltaic module. The cracks visible in the photo occurred during cutting the panel with a diamond saw. Figure S3. (a) The interior of battery B (3.7 V, external dimensions including the casing: 35 × 25 × 8 mm) after removal of the protective casing. Only the white separator foil and the electrical contact are visible. (b) The interior of battery B after sanding with sandpaper to expose the internal components. On the left side, from top to bottom, the partially separated strips/tapes of the anode deposited on the copper collector, separator, and cathode can be seen. The position of the electrical contact in pictures taken before and after sanding is indicated by dashed lines. (c) A fragment of battery A’s cathode, a strip measuring 44 × 12 mm, cut from the cathode tape after it was separated from the rest of battery A’s components during disassembly. A 3.7 V battery with external dimensions (including casing) of 53 × 43 × 5 mm was used in these tests. Figure S4. Comparison of the cross-sections of craters formed during ablation with laser pulses of low (ablation A), medium (ablation B), and high (ablation C) power. Panel D shows a three-dimensional image of the craters formed for ablation C. Figure S5. The results of the EDS analysis conducted for cathode A and B in two points (enlarged fragment of spectrum). Figure S6. A comparison of ablation crater diameters formed during LIBS analysis, conducted by subjecting the same areas to successive laser pulses (stratigraphic analysis), for cathode material A and cathode material B. Figure S7. The lithium-ion battery life cycle involving LIBS-assisted recycling comprising separation of anode, separator, and cathode components, as well as the sorting of cathode materials. Figure S8. Diagram illustrating the procedure for analyzing cathode materials. (i) If cobalt is detected and no other metals are present (apart from lithium, which is a component of all tested compounds), the cathode material is identified as LCO. (ii) If manganese is detected and no other metals are present, the cathode material is LMO. (iii) If iron is detected, the cathode material is LiFePO₄. (iv) If both nickel and manganese are detected, the cathode material is LMNO. (v) If both nickel and cobalt are detected, the cathode material may belong to the NMC or NCA group. Video S1: Cathode A, Video S2: Cathode B.

Author Contributions

Conceptualization, A.K.; investigation, A.K., A.M., and G.Ł.; writing—original draft preparation, A.K. and A.M.; writing—review and editing, A.K., A.M., and G.Ł.; visualization, A.K. and A.M. All authors have read and agreed to the published version of the manuscript.

Funding

This work was supported by the Ministry of Science and Higher Education Program, Industrial Doctoral Program IV, Grant number DWD/4/28/2020, Poland (A.M.). This work was supported by the ‘Excellence initiative-research university’ for the AGH University of Science and Technology (A.K. and G.Ł.).

Institutional Review Board Statement

Not applicable.

Informed Consent Statement

Not applicable.

Data Availability Statement

The data set can be obtained from the corresponding author upon request.

Acknowledgments

The authors thank Keyence, Poland, for providing the equipment that contributed to this research.

Conflicts of Interest

The authors declare no conflicts of interest.

Abbreviations

BESSbattery energy storage system
CAcontact angle
CMCcarboxymethyl cellulose
DMCdimethyl carbonate
JCPDSJoint Committee on Powder Diffraction Standards
LCOlithium cobalt oxide
LIBSlaser-induced breakdown spectroscopy
LNMOlithium manganese nickel oxide
MCMBmesocarbon microbeads
Nd:YAGneodymium-doped yttrium aluminum garnet laser
NMClithium nickel manganese cobalt oxides
PEpolyethylene
PPpolypropylene
PTFEpolytetrafluoroethylene
PVphotovoltaic panel
PVDFpolyvinylidene fluoride
RSDrelative standard deviation
SBRstyrene-butadiene rubber
SEM-EDSscanning electron microscopy–energy-dispersive X-ray spectroscopy
XRDX-ray diffraction

References

  1. Solar Power Generation. Available online: https://ourworldindata.org/ (accessed on 29 October 2024).
  2. Jordan, D.; Kurtz, S. Photovoltaic Degradation Rates-an Analytical Review. Prog. Photovolt. 2013, 21, 12–29. [Google Scholar] [CrossRef]
  3. Jordan, D.; Kurtz, S.; VanSant, K.; Newmiller, J. Compendium of photovoltaic degradation rates. Prog. Photovolt. 2016, 24, 978–989. [Google Scholar] [CrossRef]
  4. Theristis, M.; Livera, A.; Jones, C.; Makrides, G.; Georghiou, G.; Stein, J. Nonlinear Photovoltaic Degradation Rates: Modeling and Comparison Against Conventional Methods. IEEE J. Photovolt. 2020, 10, 1112–1118. [Google Scholar] [CrossRef]
  5. Energy Storage Worldwide (Report). Available online: https://www.statista.com/study/55020/energy-storage-worldwide (accessed on 29 October 2024).
  6. Huan, Z.; Sun, C.; Ge, M. Progress in Profitable Fe-Based Flow Batteries for Broad-Scale Energy Storage. Wiley Interdiscip. Rev.-Energy Environ. 2024, 13, e541. [Google Scholar] [CrossRef]
  7. Choi, J.; Jo, H.; Han, S. BESS life span evaluation in terms of battery wear through operation examples of BESS for frequency Regulation. In Proceedings of the 2017 IEEE Innovative Smart Grid Technologies—Asia (Isgt-Asia), Auckland, New Zealand, 4–7 December 2017; pp. 682–686. [Google Scholar]
  8. Statista. Estimated Number of Electric Vehicles in Use Worldwide Between 2016 and 2022, by Type. 2024. Available online: https://www.statista.com/statistics/1101415/number-of-electric-vehicles-by-type/ (accessed on 29 October 2024).
  9. Keil, P.; Schuster, S.F.; von Lüders, C.; Hesse, H.; Arunachala, R.; Jossen, A. Lifetime Analyses of Lithium-Ion EV Batteries. In Proceedings of the 3rd Electromobility Challenging Issues conference (ECI), Singapore, 1–4 December 2015. [Google Scholar]
  10. Xu, J.; Sun, C.; Ni, Y.; Lyu, C.; Wu, C.; Zhang, H.; Yang, Q.; Feng, F. Fast Identification of Micro-Health Parameters for Retired Batteries Based on a Simplified P2D Model by Using Pade Approximation. Batteries 2023, 9, 64. [Google Scholar] [CrossRef]
  11. Spotnitz, R. Simulation of capacity fade in lithium-ion batteries. J. Power Sources 2003, 113, 72–80. [Google Scholar] [CrossRef]
  12. Niu, B.; Shanshan, E.; Song, Q.; Xu, Z.; Han, B.; Qin, Y. Physicochemical reactions in e-waste recycling. Nat. Rev. Chem. 2024, 8, 569–586. [Google Scholar] [CrossRef] [PubMed]
  13. Gehrmann, H.-J.; Taylor, P.; Aleksandrov, K.; Bergdolt, P.; Bologa, A.; Blye, D.; Dalal, P.; Gunasekar, P.; Herremanns, S.; Kapoor, D.; et al. Mineralization of fluoropolymers from combustion in a pilot plant under representative european municipal and hazardous waste combustor conditions. Chemosphere 2024, 365, 143403. [Google Scholar] [CrossRef] [PubMed]
  14. Biswal, B.; Zhang, B.; Tran, P.; Zhang, J.; Balasubramanian, R. Recycling of spent lithium-ion batteries for a sustainable future: Recent advancements. Chem. Soc. Rev. 2024, 53, 5552–5592. [Google Scholar] [CrossRef]
  15. Królicka, A.; Maj, A.; Łój, G. Application of laser-induced breakdown spectroscopy for depth profiling of multilayer and graded materials. Materials 2023, 16, 6641. [Google Scholar] [CrossRef]
  16. Legnaioli, S.; Campanella, B.; Poggialini, F.; Pagnotta, S.; Harith, M.; Abdel-Salam, Z.; Palleschi, V. Industrial applications of laser-induced breakdown spectroscopy: A review. Anal. Methods 2020, 12, 1014–1029. [Google Scholar] [CrossRef]
  17. Cui, M.; Xiong, S.; Yang, N.; Wang, Y.; Wang, Z.; Luo, M.; Yao, C.; Deguchi, Y. Applications of laser-induced breakdown spectroscopy in industrial measurement and monitoring: Multi-technology combination. Appl. Spectrosc. Rev. 2024. [Google Scholar] [CrossRef]
  18. Costa, V.; de Mello, M.; Babos, D.; Castro, J.; Pereira-Filho, E. Calibration strategies for determination of Pb content in recycled polypropylene from car batteries using laser-induced breakdown spectroscopy (LIBS). Microchem. J. 2020, 159, 105558. [Google Scholar] [CrossRef]
  19. Peng, L.; Sun, D.; Su, M.; Han, J.; Dong, C. Rapid analysis on the heavy metal content of spent zinc-manganese batteries by laser-induced breakdown spectroscopy. Opt. Laser Technol. 2012, 44, 2469–2475. [Google Scholar] [CrossRef]
  20. Paradis, M.; Doucet, F.; Rousselot, S.; Hernández-García, A.; Rifai, K.; Touag, O.; Özcan, L.; Azami, N.; Dollé, M. Deep Learning Classification of Li-Ion Battery Materials Targeting Accurate Composition Classification from Laser-Induced Breakdown Spectroscopy High-Speed Analyses. Batteries 2022, 8, 231. [Google Scholar] [CrossRef]
  21. Królicka, A.; Maj, A.; Łój, G.; Murzyn, P.; Mochalski, P. Atypical methods for characterization of used photovoltaic panels during their pre- and Post-Thermal treatment assessment. Waste Manag. 2024, 175, 315–327. [Google Scholar] [CrossRef]
  22. Rouhi, H.; Serna-Guerrero, R.; Santasalo-Aarnio, A. Electrochemical discharge of Li-ion batteries—A methodology to evaluate the potential of discharge electrolytes without corrosion. J. Energy Storage 2022, 55, 105734. [Google Scholar] [CrossRef]
  23. Torabian, M.; Jafari, M.; Bazargan, A. Discharge of lithium-ion batteries in salt solutions for safer storage, transport, and resource recovery. Waste Manag. Res. 2022, 40, 402–409. [Google Scholar] [CrossRef] [PubMed]
  24. Chou, S.; Pan, Y.; Wang, J.; Liu, H.; Dou, S. Small things make a big difference: Binder effects on the performance of Li and Na batteries. Phys. Chem. Chem. Phys. 2014, 16, 20347–20359. [Google Scholar] [CrossRef] [PubMed]
  25. Park, J.; Kim, S.; Ahn, K. Role of carboxymethyl cellulose binder and its effect on the preparation process of anode slurries for Li-ion batteries. Colloids Surf. A-Physicochem. Eng. Asp. 2023, 664, 131130. [Google Scholar] [CrossRef]
  26. Park, J.; Willenbacher, N.; Ahn, K. How the interaction between styrene-butadiene-rubber (SBR) binder and a secondary fluid affects the rheology, microstructure and adhesive properties of capillary-suspension-type graphite slurries used for Li-ion battery anodes. Colloids Surf. A-Physicochem. Eng. Asp. 2019, 579, 123692. [Google Scholar] [CrossRef]
  27. Gallego, N.; Contescu, C.; Meyer, H.; Howe, J.; Meisner, R.; Payzant, E.; Lance, M.; Yoon, S.; Denlinger, M.; Wood, D. Advanced surface and microstructural characterization of natural graphite anodes for lithium ion batteries. Carbon 2014, 72, 393–401. [Google Scholar] [CrossRef]
  28. Nam, K.; Cho, J.; Yeo, H. Thermomechanical Behavior of Polymer Composites Based on Edge-Selectively Functionalized Graphene Nanosheets. Polymers 2018, 10, 29. [Google Scholar] [CrossRef] [PubMed]
  29. Verma, P.; Maire, P.; Novák, P. A review of the features and analyses of the solid electrolyte interphase in Li-ion batteries. Electrochim. Acta 2010, 55, 6332–6341. [Google Scholar] [CrossRef]
  30. Imashuku, S.; Taguchi, H.; Fujieda, S.; Suzuki, S.; Wagatsuma, K. Three-dimensional lithium mapping of graphite anode using laser-induced breakdown spectroscopy. Electrochim. Acta 2019, 293, 78–83. [Google Scholar] [CrossRef]
  31. Zheng, Y.; Pfäffl, L.; Seifert, H.; Pfleging, W. Lithium Distribution in Structured Graphite Anodes Investigated by Laser-Induced Breakdown Spectroscopy. Appl. Sci. 2019, 9, 4218. [Google Scholar] [CrossRef]
  32. Petz, D.; Baran, V.; Park, J.; Schökel, A.; Kriele, A.; Kornmeier, J.; Paulmann, C.; Koch, M.; Nilges, T.; Müller-Buschbaum, P.; et al. Heterogeneity of Lithium Distribution in the Graphite Anode of 21700-Type Cylindrical Li-Ion Cells during Degradation. Batteries 2024, 10, 68. [Google Scholar] [CrossRef]
  33. Li, A.; Yuen, A.; Wang, W.; Cordeiro, I.; Wang, C.; Chen, T.; Zhang, J.; Chan, Q.; Yeoh, G. A Review on Lithium-Ion Battery Separators towards Enhanced Safety Performances and Modelling Approaches. Molecules 2021, 26, 478. [Google Scholar] [CrossRef] [PubMed]
  34. Lee, S.; Park, J.; Lee, T. The wettability of fluoropolymer surfaces: Influence of surface dipoles. Langmuir 2008, 24, 4817–4826. [Google Scholar] [CrossRef] [PubMed]
  35. Zdziennicka, A.; Krawczyk, J.; Szymczyk, K.; Janczuk, B. Components and parameters of liquids and some polymers surface tension at different temperature. Colloids Surf. A-Physicochem. Eng. Asp. 2017, 529, 864–875. [Google Scholar] [CrossRef]
  36. Hawley, W.; Parejiya, A.; Bai, Y.; Meyer, H.; Wood, D.; Li, J. Lithium and transition metal dissolution due to aqueous processing in lithium-ion battery cathode active materials. J. Power Sources 2020, 466, 228315. [Google Scholar] [CrossRef]
  37. Cui, X.; Feng, H.; Xue, Y.; Geng, S.; Li, S. Convenient synthesis and electrochemical performance investigation of nano-sized LiMn2O4. J. Mater. Sci.-Mater. Electron. 2017, 28, 8529–8536. [Google Scholar] [CrossRef]
  38. Tian, L.; Yuan, A. Electrochemical performance of nanostructured spinel LiMn2O4 in different aqueous electrolytes. J. Power Sources 2009, 192, 693–697. [Google Scholar] [CrossRef]
  39. Cui, X.; Li, H.; Li, S.; Geng, S.; Zhao, J. Effects of different precipitants on LiNi0.5Mn1.5O4 for lithium ion batteries prepared by modified co-precipitation method. Ionics 2017, 23, 2993–2999. [Google Scholar] [CrossRef]
  40. Lobo, L.; Kumar, A. Synthesis, structural and electrical properties of spinel LiNi0.5Mn1.5O4 synthesized by sol-gel method. J. Sol-Gel Sci. Technol. 2016, 80, 821–826. [Google Scholar] [CrossRef]
  41. Chen, R.; Mei, J.; Xu, J.; Xu, W.; Wang, L.; Chen, Y.; Peng, D. Preparation of LiNi0.5Mn1.5O4 cathode materials by using different-sized Mn3O4 nanocrystals as precursors. J. Solid State Electrochem. 2022, 26, 1359–1368. [Google Scholar] [CrossRef]
  42. Wang, J.; Yu, Y.; Wu, B.; Lin, W.; Li, J.; Zhao, J. A homogeneous intergrown material of LiMn2O4 and LiNi0.5Mn1.5O4 as a cathode material for lithium-ion batteries. J. Mater. Chem. A 2015, 3, 2353–2360. [Google Scholar] [CrossRef]
  43. Okudur, F.; Mylavarapu, S.; Safari, M.; De Sloovere, D.; D’Haen, J.; Joos, B.; Kaliyappan, P.; Kelchtermans, A.; Samyn, P.; Van Bael, M.; et al. LiNi0.5Mn1.5O4−δ (LNMO) as Co-free cathode for lithium ion batteries via solution-gel synthesis: Particle size and morphology investigation. J. Alloys Compd. 2022, 892, 162175. [Google Scholar] [CrossRef]
  44. Jin, J.; Wei, J.; Zhou, Z.; Xie, Z. Application of 5V spinel material LiNi0.5Mn1.5O4 in Li-ion batteries: Single crystalline or polycrystalline? Rsc. Adv. 2023, 13, 12394–12401. [Google Scholar] [CrossRef] [PubMed]
  45. Kebede, M. An investigation of the lattice parameter and micro-strain behaviour of LiMn2O4 coated with LiMn1.5Ni0.5O4 to attain high-rate capability and cycling stability. J. Energy Storage 2023, 72, 108602. [Google Scholar] [CrossRef]
  46. Potapenko, A.; Kirillov, S. Enhancing high-rate electrochemical properties of LiMn2O4 in a LiMn2O4LiNi0.5Mn1.5O4 core/shell composite. Electrochim. Acta 2017, 258, 9–16. [Google Scholar] [CrossRef]
  47. Künne, S.; Hesper, J.; Lein, T.; Voigt, K.; Mikhailova, D.; Michaelis, A.; Winter, M.; Placke, T.; Heubner, C. Hybrid High-Voltage LiNi0.5Mn1.5O4 Graphite Cathodes Enabling Rechargeable Batteries with Simultaneous Anion- and Cation Storage. Batter. Supercaps 2023, 6, e202300284. [Google Scholar] [CrossRef]
  48. Chen, K.; Barai, P.; Kahvecioglu, O.; Wu, L.; Pupek, K.; Ge, M.; Ma, L.; Ehrlich, S.; Zhong, H.; Zhu, Y.; et al. Cobalt-free composite-structured cathodes with lithium-stoichiometry control for sustainable lithium-ion batteries. Nat. Commun. 2024, 15, 430. [Google Scholar] [CrossRef] [PubMed]
Figure 1. Microscopic images of the back sheet surface of the photovoltaic panel sample after completing the LIBS spectroscopy studies: (a) View of the nine ablation sites for laser pulses of low (ablation A), medium (ablation B), and high (ablation C) power. The ablation sites where fluorine was detected are marked with yellow circles. Two ablation points formed during stratigraphic studies (6 laser pulses in the same place) are visible next to the sampling areas of ablation A and B. (bd) Three-dimensional representation of samples after ablation with low (b), medium (c), and high (d) power of laser pulses. For ablation C presented in panels (a,d), the craters were numbered 1, 2, and 3 for identification.
Sustainability 17 00838 g001
Figure 2. (a,b) SEM images of the back sheet surface of the photovoltaic panel and the relation of their microstructure to (a) the depth of ablation craters (ablation C) and (b) the diameter of ablation craters A–C. (c) Result of the EDS analysis conducted for the back sheet sample of the photovoltaic panel.
Sustainability 17 00838 g002aSustainability 17 00838 g002b
Figure 3. (a) SEM microscopic image of the surface of anode A. (b) The results of the EDS analysis of anode A. (c) Diffractograms of anode A and B with identified components (1—graphite, 2—copper).
Sustainability 17 00838 g003aSustainability 17 00838 g003b
Figure 4. Microscopic image of the anode surface with marked points where LIBS spectroscopy was performed, along with information on the detected elements. Inset: Microscopic image of the surface of the anode after three successive ablations conducted at the same point. The boundaries of the ablation craters are highlighted in yellow.
Sustainability 17 00838 g004
Figure 5. (a) The results of contact angle measurements for separators obtained from batteries A and B, as well as the PTFE block sample. (b,c) LIBS analysis results for the separator A (a) and the Teflon block (c).
Sustainability 17 00838 g005aSustainability 17 00838 g005b
Figure 6. (a) SEM microscopic image of the surface of cathode B with four regions affected by corrosion initiated by contact of the cathode with water. (b) The results of the EDS analysis conducted at point 1, located in the middle of the area affected by corrosion. (c,d) SEM images of cathode A (c) and cathode B (d). (eh) Contact angle measurements of cathode A (e,g) and cathode B (f,h) before (e,f) and after (g,h) cleaning of cathodes with DMC followed by sonication in a mixture of water and detergent.
Sustainability 17 00838 g006aSustainability 17 00838 g006b
Figure 7. (a) Microscopic image of the surface of cathode A after seven successive ablations conducted at the same point. The boundaries of the ablation craters are highlighted in yellow. (b) LIBS spectrum recorded during the analysis of cathode A. (c,d) Results of the LIBS analysis conducted for cathode A (c) and cathode B (d). The red points in Figure 7c indicate the calculated elemental composition of pure LCO.
Sustainability 17 00838 g007
Figure 8. (a,b) SEM images of cathode A (a) and cathode B (b). (c) Results of the EDS analysis conducted at points 1 and 2 on the surface of the cathodes, with components identified as LCO (cathode A) and LMO or LNMO (cathode B). (d) Diffractograms of cathode A and B with identified components. JCPDS cards used for identification: LCO (PDF #75-0532), LMO (PDF #35-0782), LNMO (PDF #80-2162).
Sustainability 17 00838 g008aSustainability 17 00838 g008b
Table 1. The effect of laser power on the size of ablation craters and the results of the LIBS analysis of the back sheet sample.
AblationLaser Pulse PowerCrater Depth (mm)Crater Diameter (mm)Detected Elements
AWeak1.0 ± 0.124 ± 2Ti, O
BNormal1.9 ± 0.326 ± 2Ti, O, C, H
CStrong6.7 ± 1.033 ± 1Ti, O, C, H, F
Disclaimer/Publisher’s Note: The statements, opinions and data contained in all publications are solely those of the individual author(s) and contributor(s) and not of MDPI and/or the editor(s). MDPI and/or the editor(s) disclaim responsibility for any injury to people or property resulting from any ideas, methods, instructions or products referred to in the content.

