Article

Construction and Zoning of Ecological Security Patterns in Yichang City

1
Hubei Key Laboratory of Biologic Resources Protection and Utilization, Hubei Minzu University, Enshi 445000, China
2
College of Forestry and Horticulture, Hubei Minzu University, Enshi 445000, China
*
Author to whom correspondence should be addressed.
These authors contributed equally to this work.
Sustainability 2025, 17(6), 2354; https://doi.org/10.3390/su17062354
Submission received: 27 January 2025 / Revised: 21 February 2025 / Accepted: 5 March 2025 / Published: 7 March 2025

Abstract

:
The study of ecological security patterns is of great significance to the balance between regional economic development and environmental protection. By optimizing the regional ecological security pattern through reasonable land-use planning and resource management strategies, the purpose of maintaining ecosystem stability and improving ecosystem service capacity can be achieved, and ultimately regional ecological security can be achieved. As a typical ecological civilization city in the middle reaches of the Yangtze River, Yichang City is also facing the dual challenges of urban expansion and environmental pressure. The construction and optimization of its ecological security pattern is the key to achieving the harmonious coexistence of economic development and environmental protection and ensuring regional sustainable development. Based on the ecological environment characteristics and land-use data of Yichang City, this paper uses morphological spatial pattern analysis and landscape connectivity analysis to identify core ecological sources, constructs a comprehensive ecological resistance surface based on the sensitivity–pressure–resilience (SPR) model, and combines circuit theory and Linkage Mapper tools to extract ecological corridors, ecological pinch points, and ecological barrier points and construct the ecological security pattern of Yichang City with ecological elements of points, lines, and surfaces. Finally, the community mining method was introduced and combined with habitat quality to analyze the spatial topological structure of the ecological network in Yichang City and conduct ecological security zoning management. The following conclusions were drawn: Yichang City has a good ecological background value. A total of 64 core ecological sources were screened out with a total area of 3239.5 km². In total, 157 ecological corridors in Yichang City were identified. These corridors were divided into 104 general corridors, 42 important corridors, and 11 key corridors according to the flow centrality score. In addition, 49 key ecological pinch points and 36 ecological barrier points were identified. The combination of these points, lines, and surfaces formed the ecological security pattern of Yichang City. Based on the community mining algorithm in complex networks and the principle of Thiessen polygons, Yichang City was divided into five ecological functional zones. Among them, Community No. 2 has the highest ecological security level, high vegetation coverage, close distribution of ecological sources, a large number of corridors, and high connectivity. Community No. 5 has the largest area, but it contains most of the human activity space and construction and development zones, with low habitat quality and severely squeezed ecological space. In this regard, large-scale ecological restoration projects should be implemented, such as artificial wetland construction and ecological island establishment, to supplement ecological activity space and mobility and enhance ecosystem service functions. This study aims to construct a multi-scale ecological security pattern in Yichang City, propose a dynamic zoning management strategy based on complex network analysis, and provide a scientific basis for ecological protection and restoration in rapidly urbanizing areas.

1. Introduction

Ecological security refers to the state in which the ecological environment required for the survival and development of a country, region, or human society is not threatened or is less threatened by destruction. It is an important guarantee and condition for the sustainable and stable development of a complex ecological security system and a city [1]. The concept of ecological security aims to ensure the safety, health, and sustainable development of resources, environment, and ecosystem services, strengthen beneficial ecological processes, control harmful ecological processes, and seek ways to ensure ecological security [2]. Constructing a regional ecological security pattern can achieve effective regulation of ecological processes, thereby ensuring the full play of ecosystem functions and services, ensuring the sustainable supply of regional ecosystem services, and ultimately achieving ecological security [3]. The research on the construction of ecological security patterns originated from the research on land health issues in the 1940s [4]. Large-scale industrial construction has greatly damaged biological habitats and ecological environments. In order to prevent human activities from further affecting biodiversity and ecological security, researchers began to focus on related aspects such as biodiversity conservation and ecological restoration [5]. Later, with the rapid development of regional economy and rapid urbanization, the research on the construction of regional security patterns has become more comprehensive, focusing on reducing regional ecological risks and enhancing the stability of regional ecological structure [6]. For example, Liu J et al. used the multi-index evaluation method, the minimum cumulative resistance (MCR) model, and the circuit connectivity model to construct an ecological security pattern for the ecological security issues in the Songnen Plain [7]. Gong D et al. identified ecological sources through the “ecosystem service function-ecological sensitivity-landscape connectivity” evaluation system, extracted ecological corridors and nodes using methods such as the minimum cumulative resistance and gravity model, and constructed the ecological security pattern of Nanchang City, emphasizing the organic unity of urban expansion and ecological protection [8]. Wenqi Q et al. constructed a new framework of the ecological security pattern ESP for the coastal city of Qingdao: surface (ecological source)–line (ecological network)–point (pinch point, obstacle point) to balance the development of coastal urban areas and the protection of the ecological environment [9]. Qiong Q et al. constructed the ecological security pattern (ESP) of Taiyuan City, located in the eastern part of the Loess Plateau, to analyze the severe ecological problems caused by urban expansion and enhance urban resilience [10]. Xiaoying L et al. constructed an ecological security pattern for important biodiversity protection areas in the Yangtze River Delta, protected severely damaged natural habitats, and provided scientific guidance on ecosystem changes and corridor construction [11].
Ecological security patterns are based on the interaction mechanism between patterns and processes, with the goal of protecting the ecological function in the region. By building a regional ecological security pattern, the ecological process in the region can be effectively intervened and regulated, so as to achieve a balance between the ecosystem and human activities, protect the virtuous cycle of ecological function and regional economic development in the region, and achieve regional ecological security [1,4]. Since the concept of ecological security patterns was introduced by Yu Kongjian [12] in the 1990s, scholars in China have paid more and more attention to the issue of ecological security; from early concept analysis to the study of small-scale nature reserves and biodiversity, to the analysis of regional ecosystem functions and the study of multi-indicator regional comprehensive ecological security [13,14], to now, the basic model of “ecological source identification—ecological resistance surface setting—ecological corridor extraction—ecological node analysis” and the ecological network structure composed of points, lines, networks, and surfaces have been formed [15,16].
As a civilized city, Yichang won the highest honor for ecological civilization construction in China on 19 November 2022. As a national ecological civilization demonstration area, Yichang is known as the “Gateway to the Three Gorges”. It has rich mineral resources and water resources and is home to two world-class water conservancy projects, the Gezhouba Dam and the Three Gorges Dam, which are of great significance to regional ecological security and stability. Therefore, based on the ecological and environmental characteristics of Yichang City, this paper uses the morphological spatial pattern analysis (MSP) model to identify ecological sources, evaluate the ecological vulnerability of Yichang City and extract the ecological resistance surface, use circuit theory and Linkage Mapper tools to identify ecological corridors, ecological pinch points, and other ecological elements, construct the ecological security pattern of Yichang City, and introduce the community mining method to manage the ecological network of the study area in different areas, providing a reference for the health and sustainable development of the Yichang ecosystem. In this study, we constructed a multidimensional ecological security pattern analysis framework by integration (MSPA), circuit theory, complex network community mining method, and habitat quality assessment using the InVEST model. Compared with existing studies, this method not only focuses on the identification of ecological sources and corridors but also incorporates the management of spatial topology zoning, which provides a dynamic governance perspective for regional ecological security optimization.

2. Materials and Methods

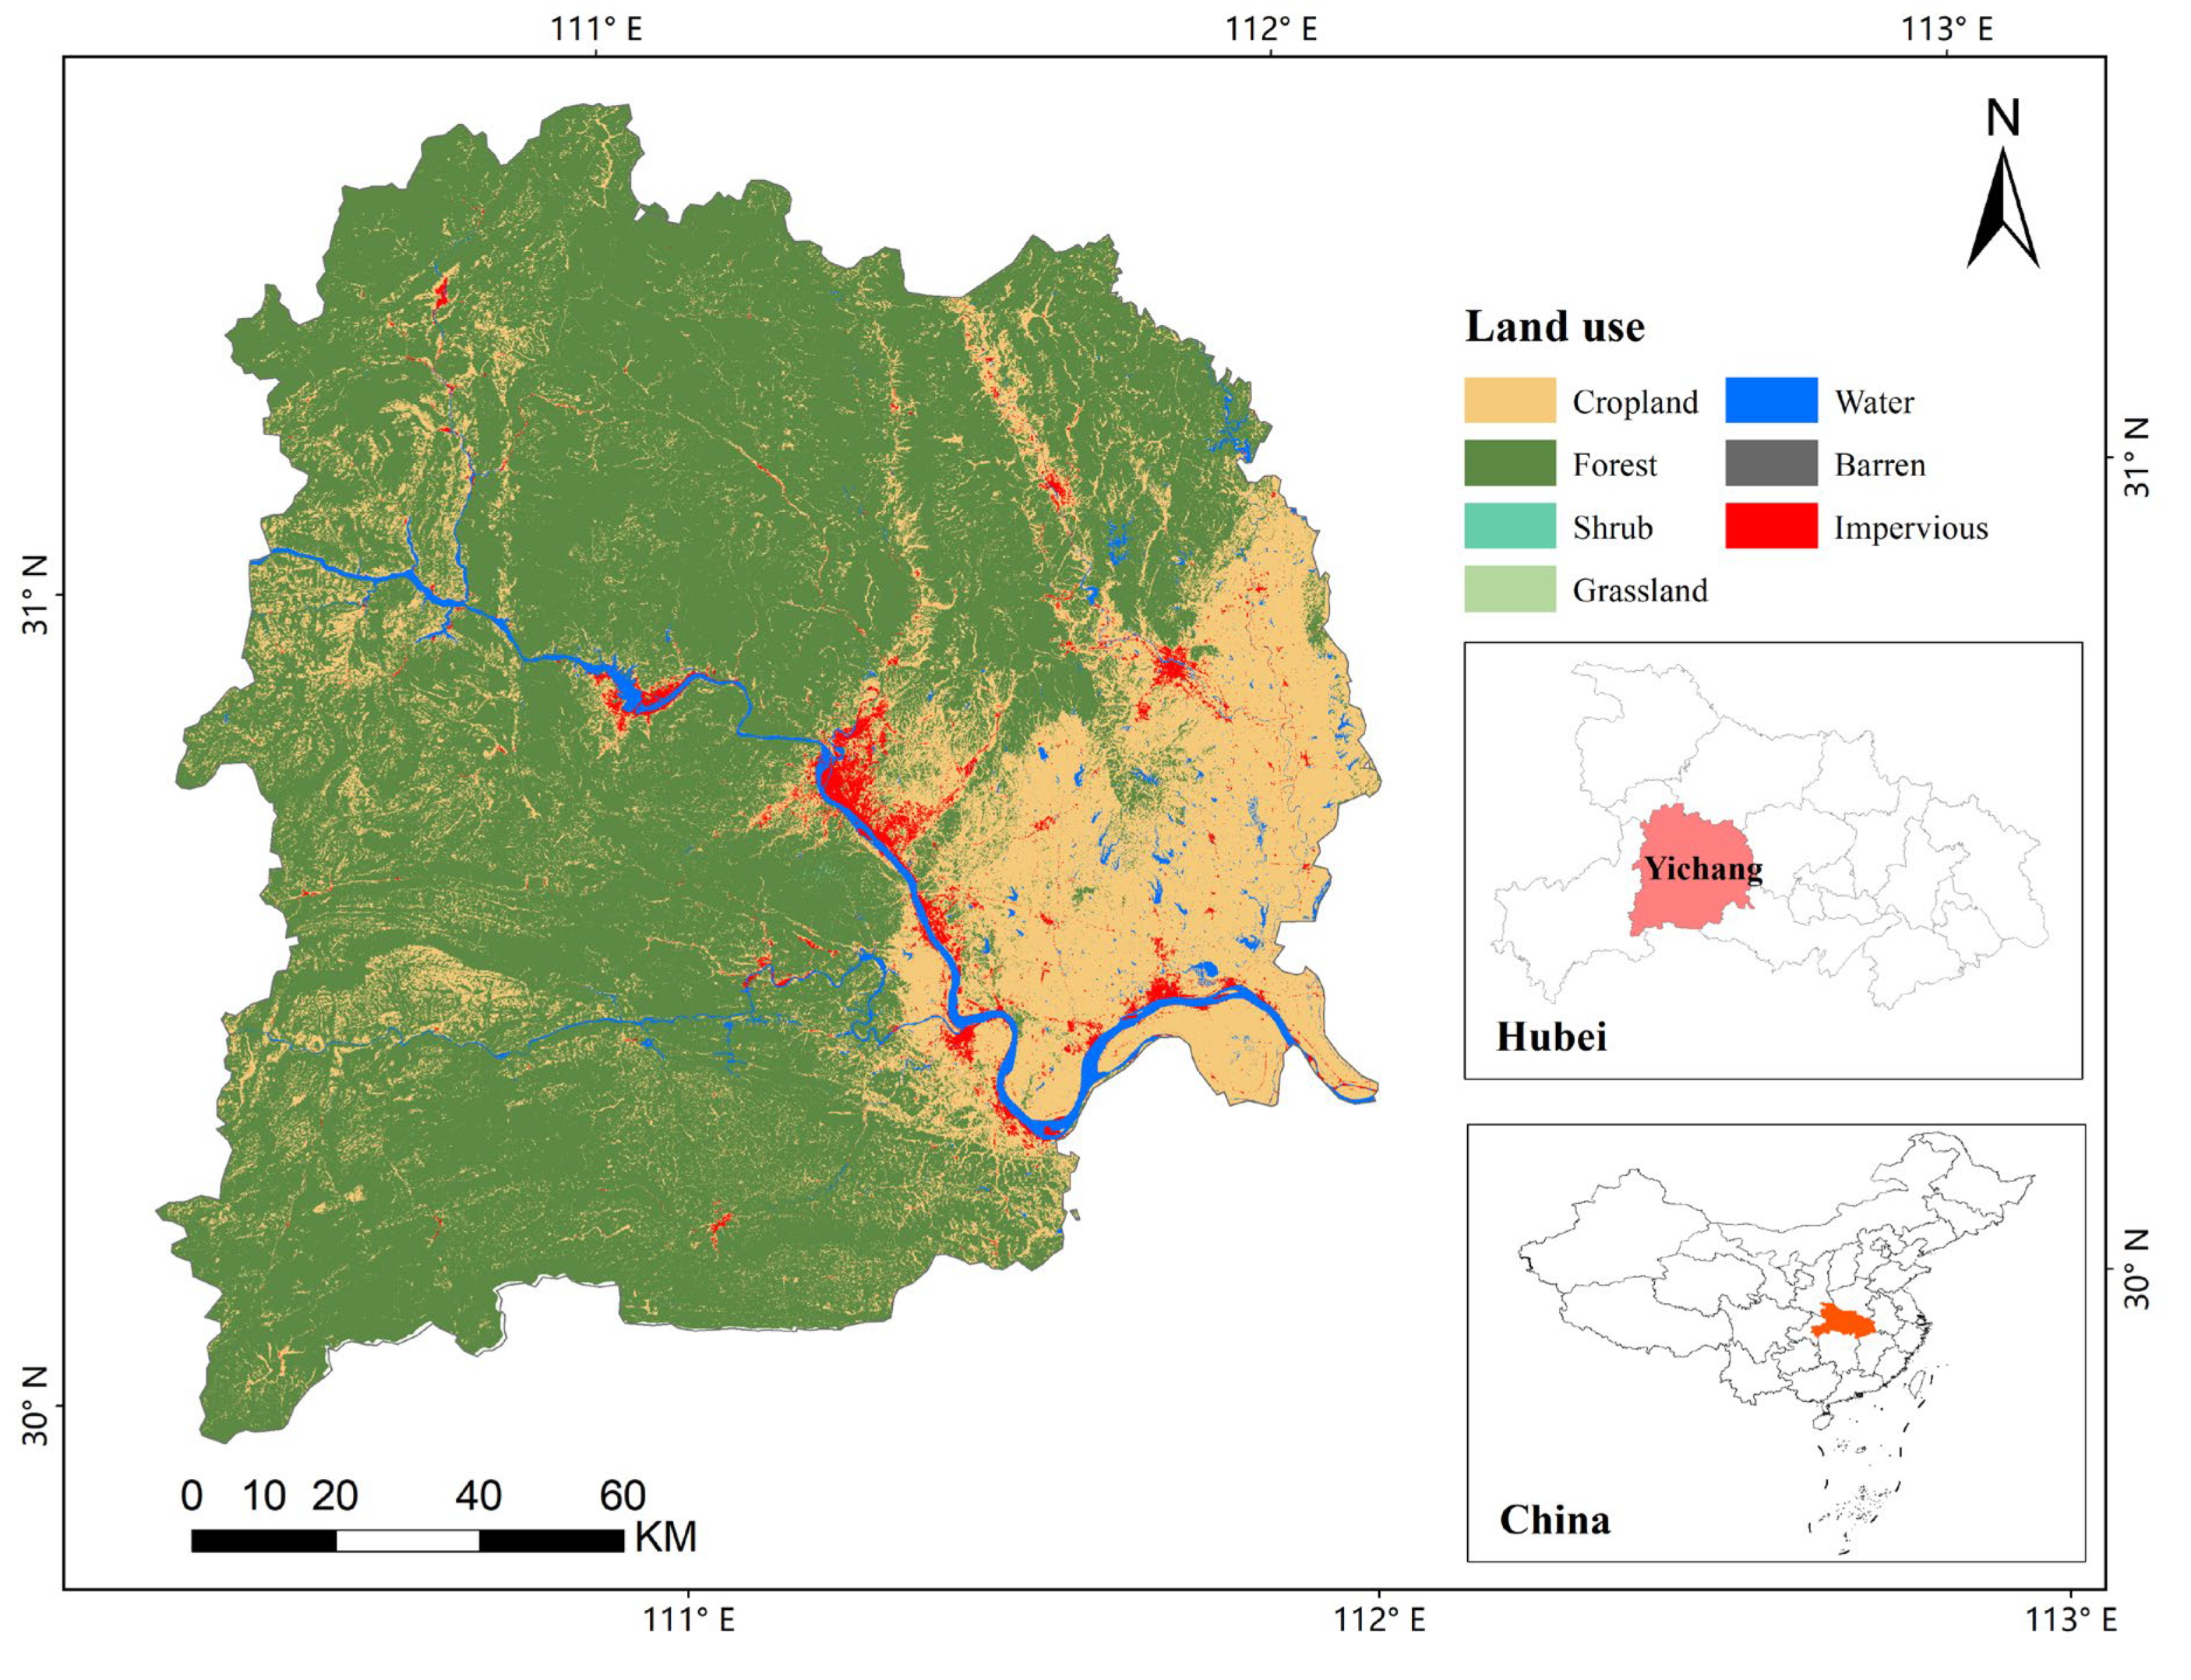
2.1. Overview of the Study Area

Yichang City, a sub-central city of Hubei Province, an important member of the Yangtze River Middle Reaches Urban Agglomeration, and the “World Hydropower Capital”, was formerly known as Yiling. The starting point of the Three Gorges of the Yangtze River, it is known as the “Gateway to the Three Gorges” and the “Throat of Sichuan and Hubei”. It is located between 110°15′~112°04′ east longitude and 29°56′~31°34′ north latitude, at the boundary of central China, southwestern Hubei and the upper and middle reaches of the Yangtze River, with a total area of 21,000 square kilometers.
Yichang has a complex terrain with great differences in height. The altitude ranges from 2427 m to 35 m, with a vertical height difference of 2392 m. It shows a trend of gradually descending from west to east, with an average slope of 14.5‰, forming three basic landform types: mountains (high mountains, semi-high mountains, low mountains), hills, and plains. Yichang has four distinct seasons, with water and heat in the same period. The annual average water volume is between 992.1 and 1404.1 mm. There is abundant rainfall, mostly in summer, and the longer precipitation process occurs in June and July. Rain and heat are in the same season, the accumulated temperature is high throughout the year, the frost-free period is long, and the annual average temperature is 13.1 °C~18 °C. The water system in Yichang belongs to the outflow water system, with the Yangtze River as the main artery. There are many rivers, high density, and abundant water, with an average annual total water volume of 474.14 billion cubic meters. There are 99 rivers with a length of more than 10 km in the territory, of which 64 rivers have a catchment area of more than 50 square kilometers, with a total length of 3793 km, and the total catchment area accounts for 83.9% of the city. The hydropower reserves are more than 30 million kilowatts, and the exploitable amount is 25 million kilowatts. It is one of the regions with the richest hydropower resources in China. The overview of the study area was shown in Figure 1.

2.2. Data Source

The main data used in this paper include Normalized Difference Vegetation Index (NDVI), Net Primary Productivity (NPP), elevation, slope, precipitation, temperature, land-use data, population density distribution data, and road network data. To ensure the consistency of spatial analysis of each data source, the data resolution is resampled to 30 m × 30 m based on ArcGIS 10.8 software, Esri, Redlands, California, USA. The data sources are as follows:
NDVI data, NPP data, precipitation data, and temperature data are all from the Resources and Environmental Science and Data Center (https://www.resdc.cn) accessed on 1 January 2024, with a resolution of 1000 m × 1000 m.
The elevation data come from the Geospatial Data Cloud (http://www.gscloud.cn/) with a resolution of 30 m. The slope data were obtained by spatial analysis of the elevation data using the GIS10.8 platform.
The land-use data come from the China Annual Land Cover Dataset (https://zenodo.org, accessed on 1 January 2024) produced by Professors Yang Jie and Huang Xin of Wuhan University based on Google Earth Engine, with a resolution of 30 m × 30 m.
The population density data come from the world population density map released by WorldPop (https://hub.worldpop.org/, accessed on 1 January 2024), with a resolution of 1000 m × 1000 m.
The 1:1 million public version of basic geographic information dataset can be found in the National Geographic Information Resource Directory Service System (www.webmap.cn, accessed on 1 January 2024).

2.3. Research Methods

This paper constructs a comprehensive framework (Figure 2). First, the ecological source and ecological resistance surface are extracted based on the natural ecological characteristics of Yichang City. Then, the circuit theory is used to identify the ecological corridors and ecological nodes in the study area, and the ecological security pattern of Yichang City is constructed in the form of “point-line-surface”. Finally, the ecological security pattern of the study area is divided into ecological security zones through the community mining method, and relevant suggestions are put forward.

2.3.1. Ecological Source Areas Identification

Through morphological spatial pattern analysis (MSPA model), the core source areas of the study area were extracted, and some source areas that were too small were excluded. At the same time, the source areas with poor connectivity were eliminated in combination with landscape connectivity analysis, and finally the ecological source areas of the study area were identified.

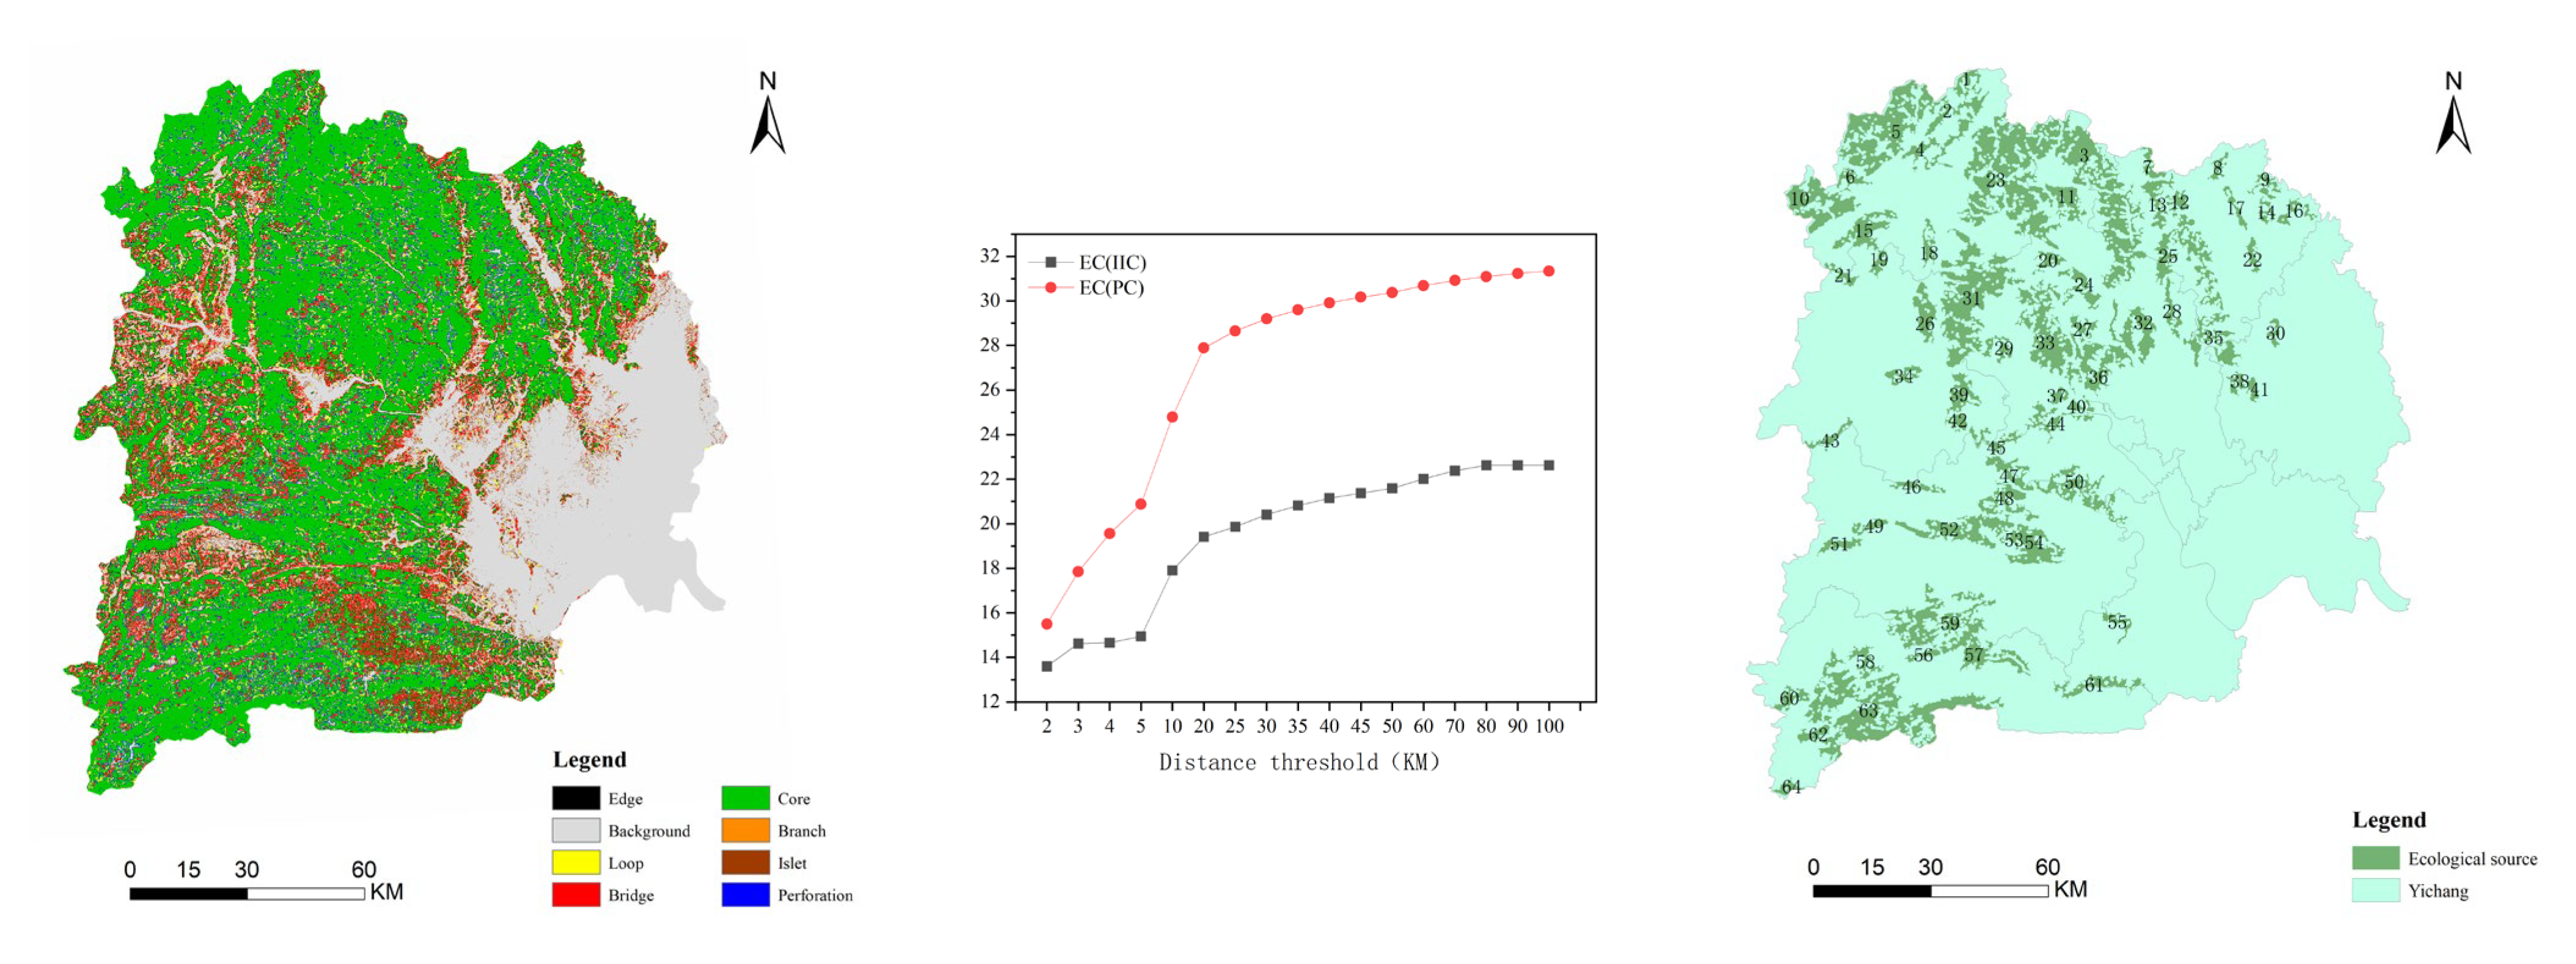
Identification of Ecological Sources Based on Morphological Spatial Patterns

Morphological spatial pattern analysis (MSPA) is a method based on image processing and spatial statistical techniques to evaluate and analyze the spatial distribution pattern and morphology of landscapes. It is used to describe and quantify the spatial pattern characteristics of land cover and can identify patches that are important for inter-regional connections [17]. This method is based on the land-use type data of the study area and uses the eight-domain algorithm to identify the spatial topological relationship between the target pixel set and the structural elements [18].
In this study, the Guidos tool was used to divide the study area into seven areas: core area, island, gap, edge area, roundabout area, bridge area, and branch line, with Yichang forest land as the foreground value and other land-use types as the background value according to factors such as topography and landscape spatial distribution. The ecological significance of each landscape type is shown in Table 1.

Landscape Connectivity Analysis

The strength of landscape connectivity is an important determinant for judging whether species in the region can successfully exchange information and migrate [19]. By evaluating the degree of connection and connectivity between various landscape elements in the region, the integrity of the landscape pattern, the protection of biodiversity, and the health of the ecosystem are assessed, which is an important indicator for judging the quality of ecological sources. This paper uses the representative overall connectivity index (IIC) and possible connectivity index (PC) to analyze the landscape connectivity of the ecological source in Yichang City based on Conefor2.6 software (a tool for landscape connectivity analysis).
Overall connectivity index (IIC):
I I C = i = 1 n   j = 1 n   a i · a j 1 + n l i j A L 2
where n represents the number of patches in the study area, a i and a j represent the areas of patch i and patch j, respectively, and AL is the total area of all landscapes in the study area.
Possible connectivity index (PC):
P C = i = 1 n   j = 1 n   p i j · a i · a j A L 2
where a i and a j represent the areas of patch i and patch j, respectively, pij is the maximum probability of species diffusion between patch i and patch j, and AL is the total area of all landscapes in the study area.
In landscape connectivity analysis, the distance threshold is an important parameter that affects the connectivity of landscape patches. The distance threshold refers to the maximum distance between two locations. Its significance lies in determining what distance ranges of locations are considered to be interconnected, thus affecting aspects such as biological migration, population distribution, and ecosystem function. Different distance thresholds may lead to different interpretations of the same landscape structure. A shorter distance threshold may emphasize the connectivity of smaller fragments, while a longer distance threshold may focus more on the connectivity of a wide area. When conducting ecological model and landscape connectivity analysis, the choice of distance threshold will directly affect the accuracy of model output. Inappropriate threshold setting may lead to misunderstanding of actual connectivity. Therefore, correctly setting the distance threshold is crucial for analyzing the connectivity of landscape patches. Based on the size of the study area and referring to the distance threshold setting of other scholars, this paper uses a step-by-step approach to set the distance threshold range of 2000~70000 m to explore the optimal distance threshold in the landscape connectivity of Yichang City.

2.3.2. Construction of Ecological Vulnerability

Based on the SPR model, the comprehensive ecological vulnerability of Yichang City was evaluated using three indicators, ecological sensitivity, ecological pressure, and ecological resilience, which served as the comprehensive resistance surface in ecological circulation. Based on ecological sources and ecological resistance surfaces, circuit theory and Linkage Mapper tools were used to identify ecological security elements such as ecological corridors, ecological pinch points, and ecological barrier points in the study area. The ecological security pattern of the entire study area was formed through the connections between corridors, ecological sources, and ecological nodes.

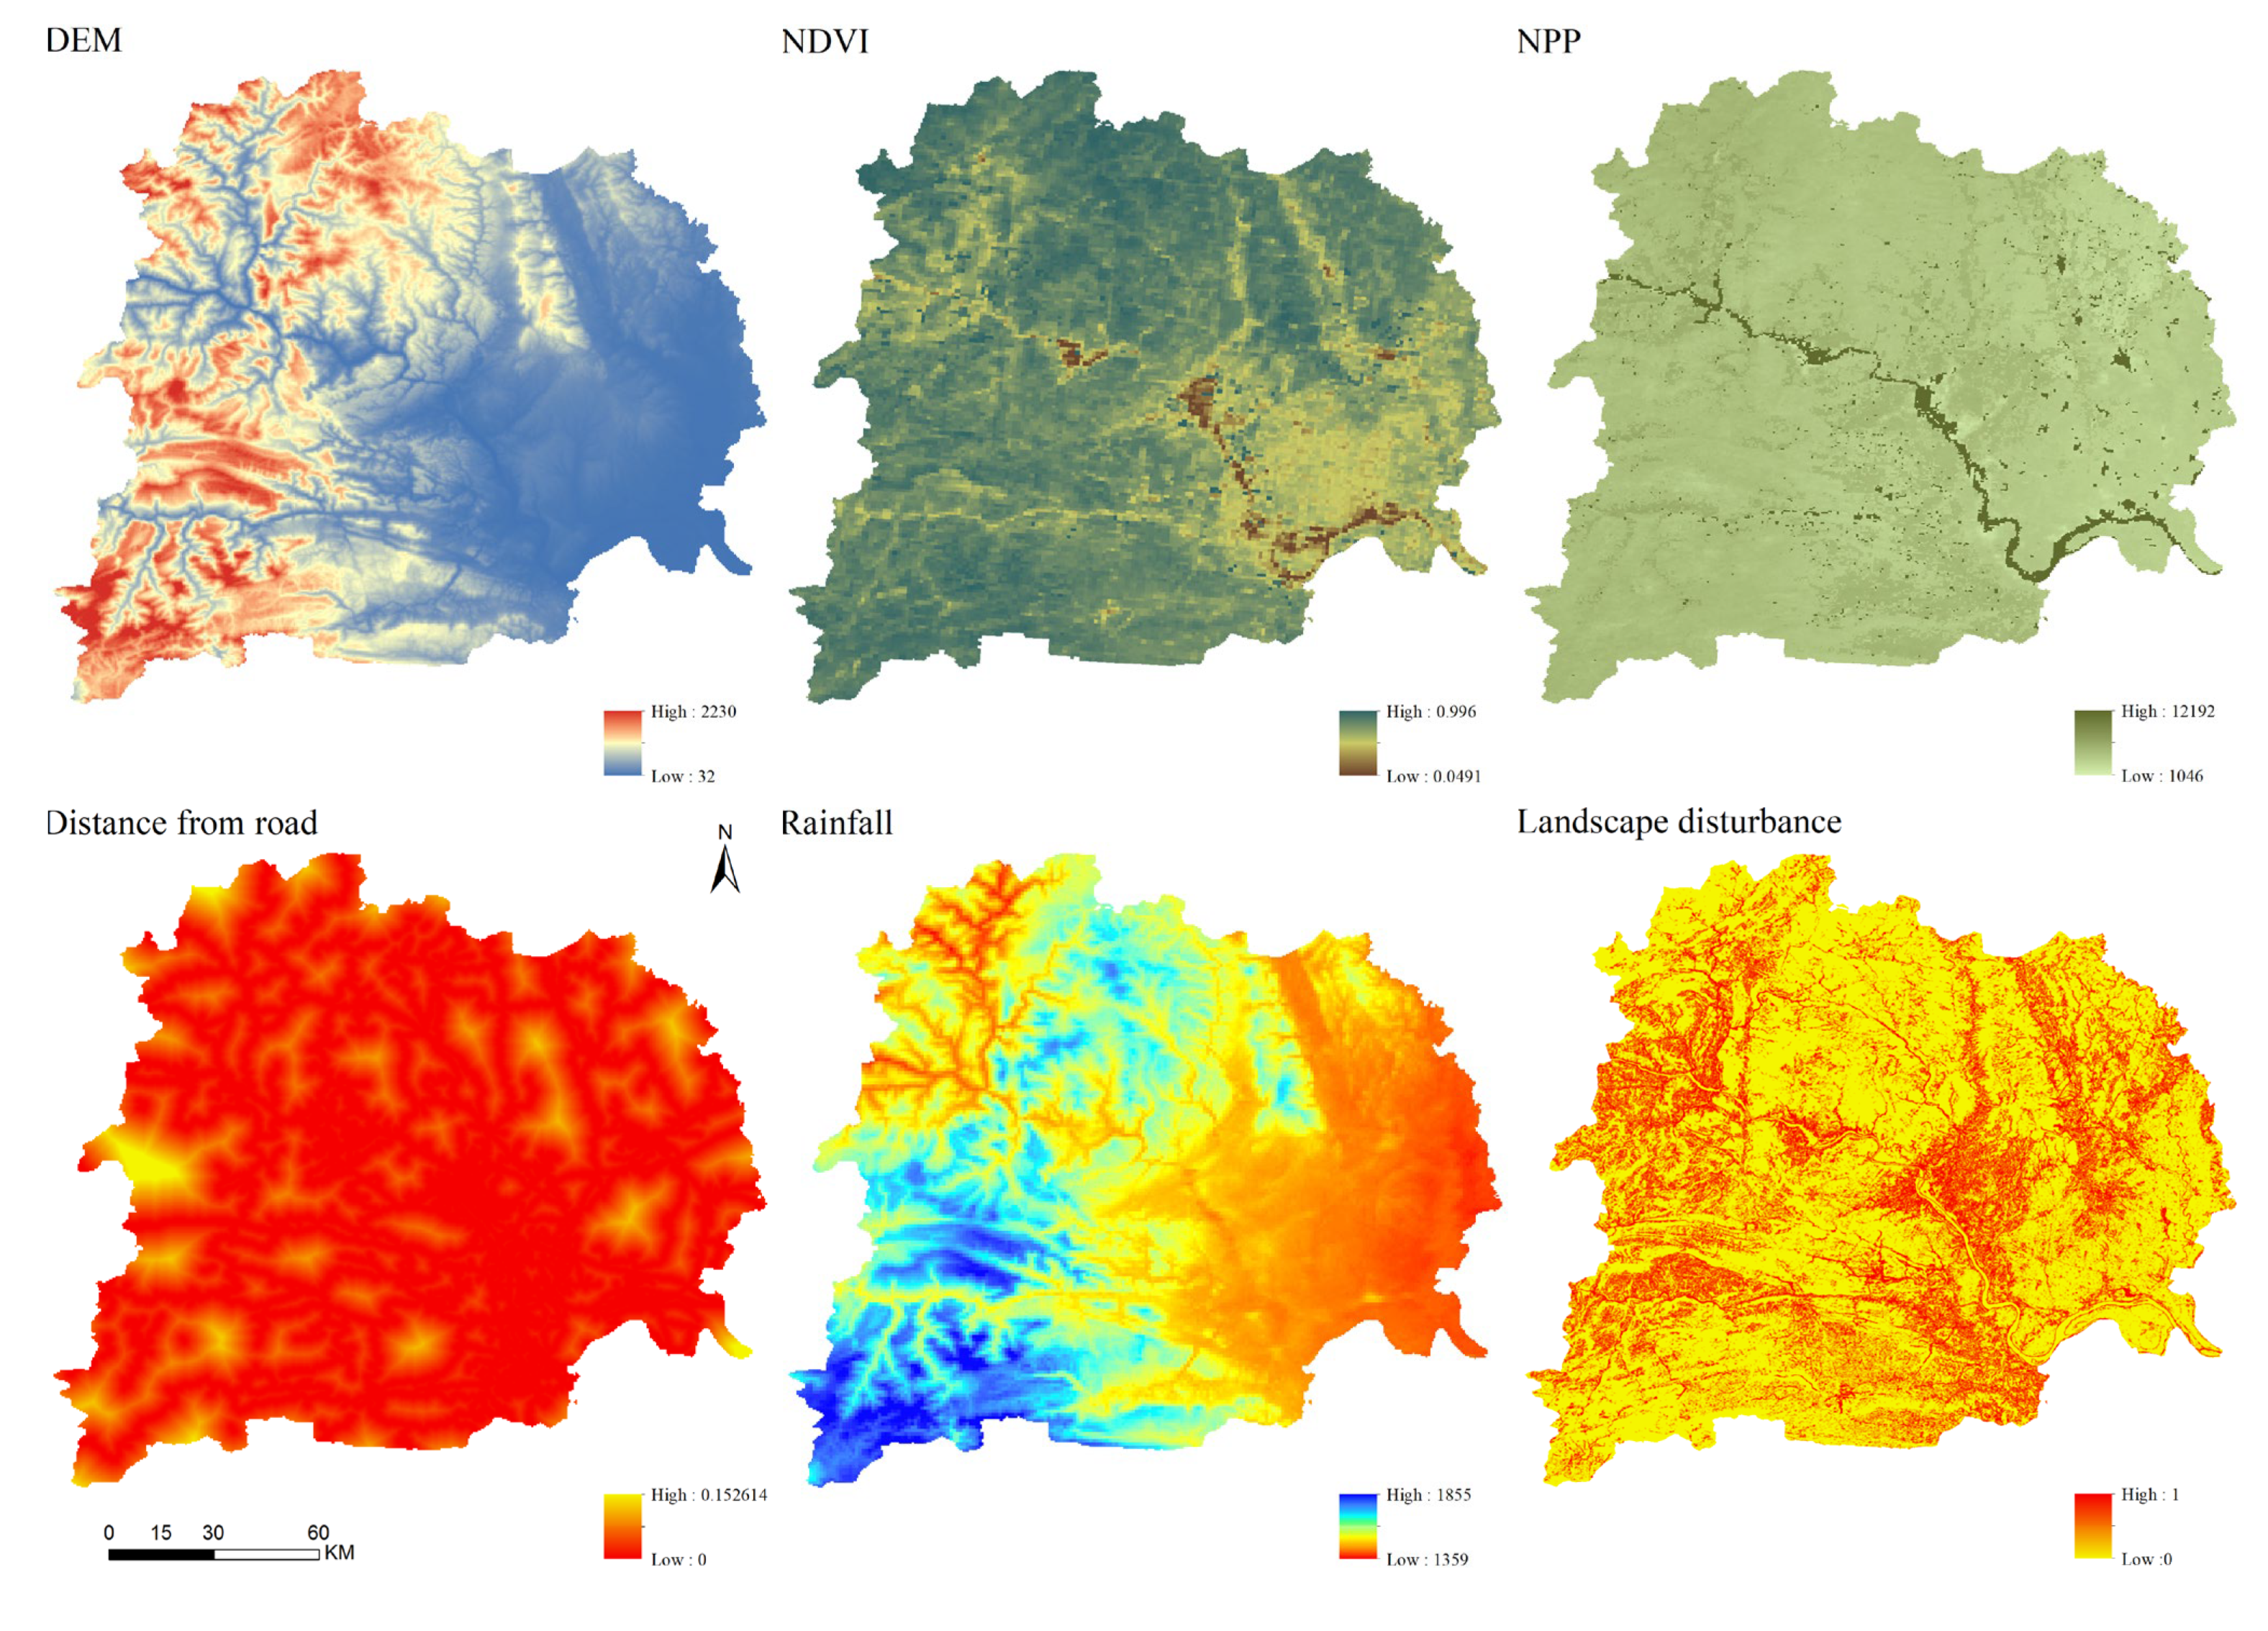
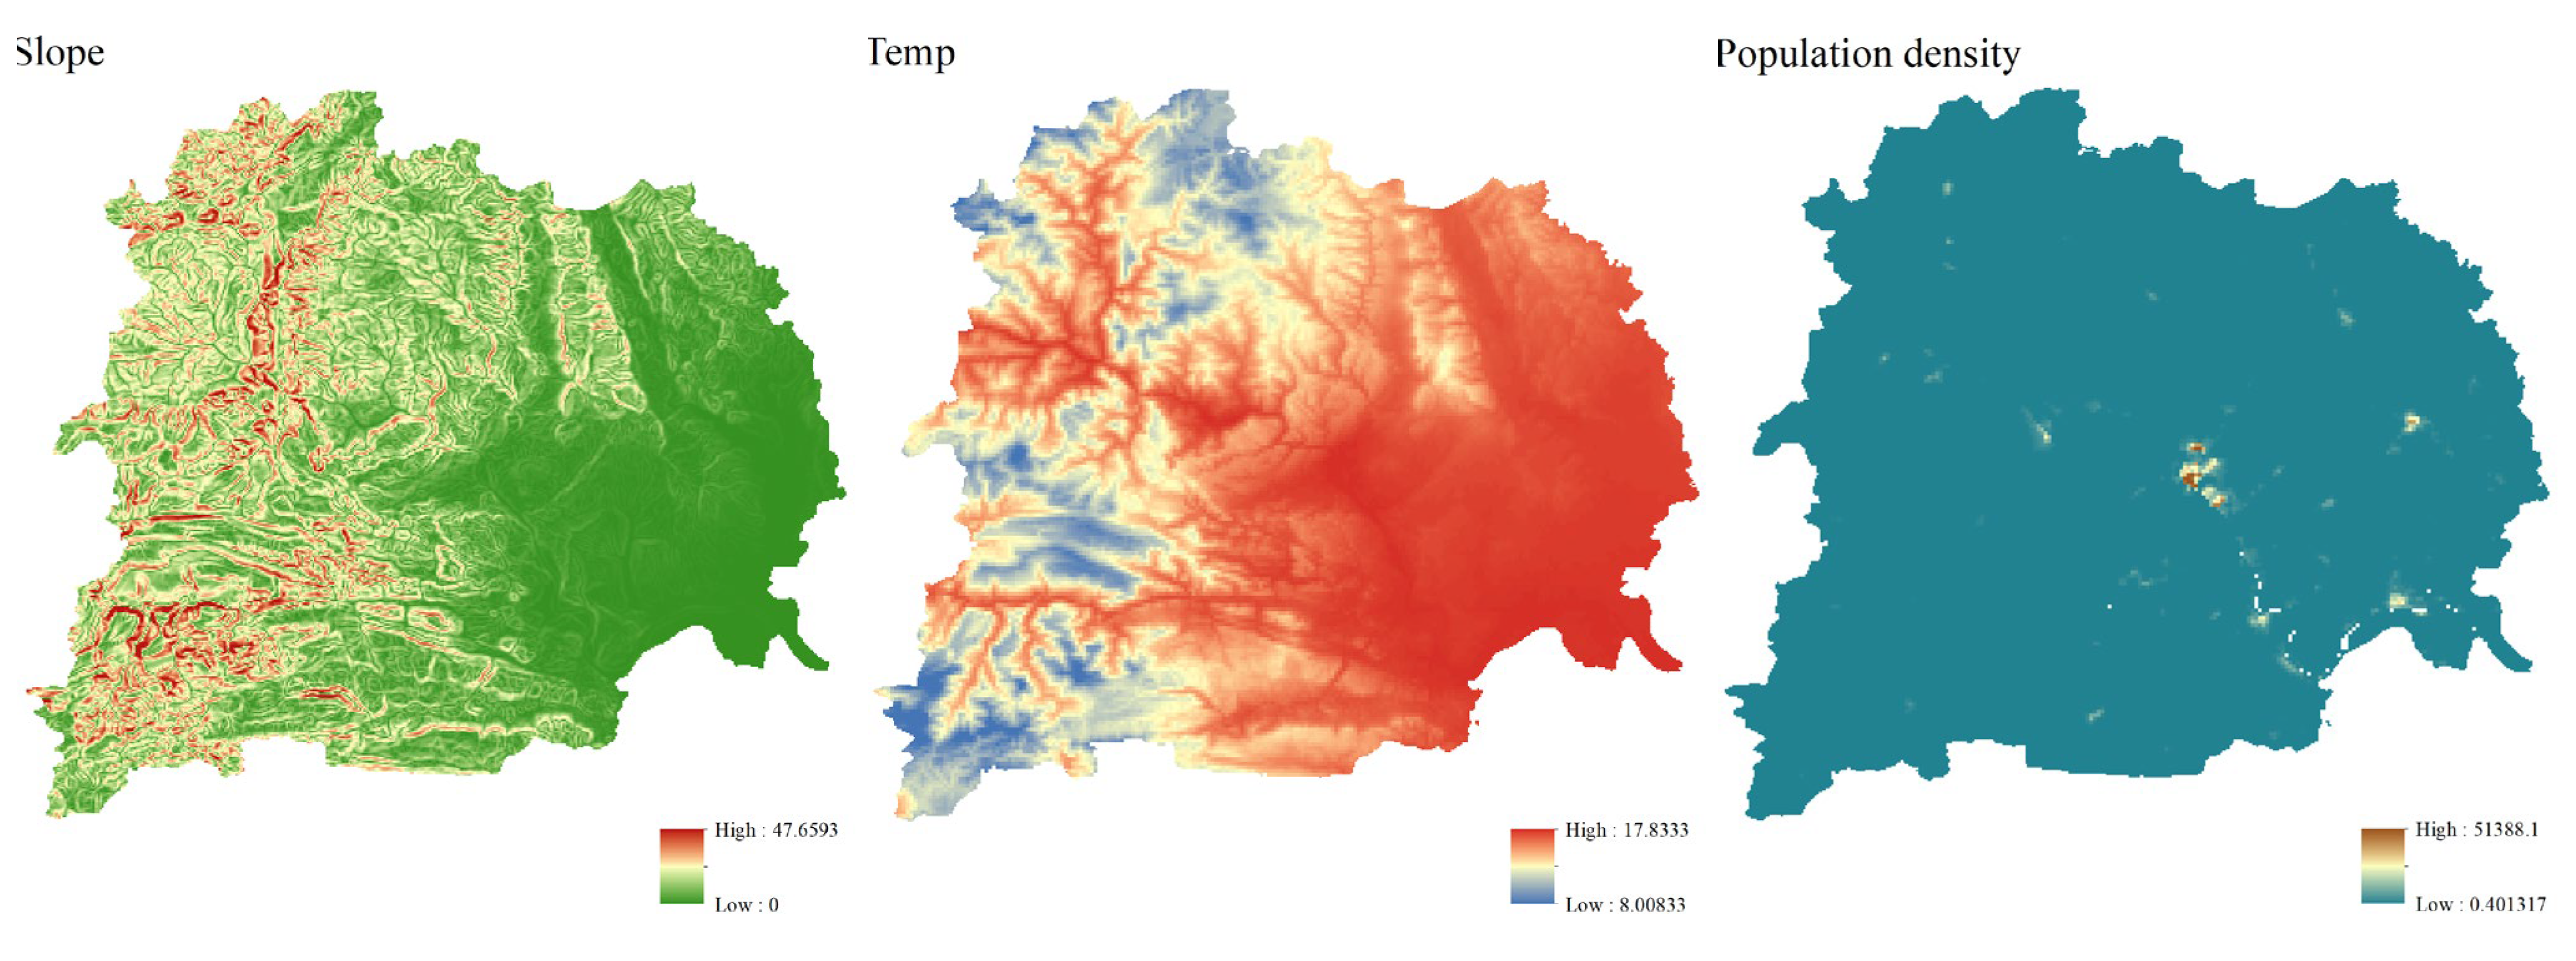
Selection of Resistance Factor

Ecological sensitivity refers to the degree to which an ecosystem responds to changes in the natural environment and human interference and the difficulty and possibility of regional ecological and environmental problems. It is usually related to the natural attributes of the regional ecosystem. This paper selects four basic ecological attributes, namely elevation, slope, average annual rainfall, and average annual temperature, from topographic factors and climatic factors to judge the ecological basis of the study area and selects the landscape disturbance factor to reflect the degree to which the regional ecological landscape is disturbed by the outside world. The greater the ecological landscape pattern is affected by human and natural interference, the stronger the ecological sensitivity. The calculation process is as follows below.
Landscape disturbance S i is reflected by the landscape disturbance index (see Equation (3)). This paper selects the landscape fragmentation index, landscape separation index, and landscape sub-dimension index and constructs the landscape disturbance index based on ArcGIS 10.8 and Fragstats 4.2. The formula is as follows:
S i = a C i + b N i + c D i
C i = n i A i
N i = A 2 A i n i A
D i = Q i + M i 4 + L i 2
In the formula, C i   is the landscape fragmentation index, n i   is the number of patches of A i   landscape type, i   is the area of the landscape type i , A   is the area of all landscapes, N i   is the landscape separation index, D i   is the landscape dominance, Q i   is the ratio of the number of plots of M i   landscape type to the total number of plots, i   is the ratio of the number of i patches of the landscape type to the total number of patches, L i     is the ratio of the patch area of the landscape type to the total area of the plots, and a, b, c are weight values, a + b + c = 1, and according to relevant research, they are assigned 0.5, 0.3, and 0.2, respectively.
Ecological restoration refers to the self-regulation and resistance of an ecosystem after it is damaged. This paper selects the Normalized Difference Vegetation Index (NDVI) and the Net Primary Productivity (NPP) of plants to reflect the level of self-sustaining capacity of an ecosystem.
Ecological pressure refers to the external disturbance to the ecosystem and the resulting physiological effects, which are mainly affected by population activities. This paper selects population density and distance from roads to reflect the pressure on organisms in the circulation of ecosystems.

Weighting Method Combining Subjective and Objective Factors

(1) Coefficient of variation method
The coefficient of variation method is an objective way to determine the weight of an indicator based on its existing data. Generally, the greater the difference in the attribute values of the indicator data, the greater the amount of information contained in the indicator and the more important it is in the evaluation. Therefore, the coefficient of variation method can be used to determine the weight of the indicator based on the amount of information contained in the indicator. The formula is as follows:
C V i = σ i / x i ¯ i = 1 ,   2 ,   3 ,   ,   n
W i = V i / i = 1 n   V i
where C V i   is the coefficient of variation of the th indicator; σ i   is the standard deviation of the th indicator; x i ¯ is the average of the th indicator. W i is the weight of the th indicator; V i is the coefficient of variation of the th indicator.
(2) Analytical Hierarchy Process
The analytic hierarchy process (AHP) decomposes decision-making elements into multiple levels such as goals, criteria, and plans. By comparing the relative importance of each level, the judgment matrix D is constructed. The weight value of each indicator is obtained by normalizing the eigenvector, and the consistency ratio CR is used for consistency test. The formula is as follows:
D = D 1 D 1 D 1 D 2 D 1 D n D 2 D 1 D 2 D 2 D 2 D n   D n D 1 D n D 2 D n D n
C R = C I R I = λ m a x n R I n 1
where CI is the consistency index, RI is the corresponding average random consistency index, n is the number of elements, and λ m a x is the maximum eigenvalue. The consistency ratio (CR) in this study was 0.002, which is less than the threshold of 0.1, indicating that the judgment matrix passed the consistency test. This ensures the reliability of the weight allocation in the analytic hierarchy process (AHP).
(3) Weighting by combining coefficient of variation method and analytic hierarchy process
In order to better determine the impact of each factor weight on the comprehensive ecological sensitivity of the region, this paper combines subjective and objective weighting methods, introduces the Lagrangian function, and establishes an optimization decision-making model [20]. By introducing the Euclidean distance function, it ensures that the difference between the subjective and objective weights and their corresponding preference levels are consistent and finally obtains the ideal weight.
Optimizing decision-making models:
W j = α w A j + β w B j α + β = 1
Euclidean distance function D w A j ,   w B j :
D w A j ,   w B j = j = 1 n   w A j w B j 2   D w A j ,   w B j 2 = α β 2
where w A j is the subjective weight, w B j is the objective weight, and α and β are the subjective and objective preference coefficients, respectively. By combining Equations (13) and (14), the comprehensive weight can be obtained W j .

Circuit Theory

In order to more accurately assess the paths and connectivity of species movement in ecosystems, McRae et al. [21] used the open-source software Circuitscape [22] to determine the random movement of charges in circuits, simulating the flow of organisms in nature and better expressing the random walk characteristics of ecological flows [23]. Circuitscape links circuits with movement ecology, using the characteristics of random walks of electrons in circuits to simulate the migration and diffusion process of species individuals in a certain landscape [24]. The movement paths of species are analogized to the flow of current in circuits, and different types of habitats or terrains are given different resistance values, reflecting the difficulty of movement in these environments. The current intensity between ecological sources reflects the relative importance of corridors, identifies diffusion paths, and is more in line with the actual movement of species. Today, with the in-depth study of circuit theory in landscape ecological patterns, scholars have developed the Linkage Mapper toolkit based on Circuitscape. This is a plug-in that is connected to ArcGIS in the form of a toolbox and has been widely used in the study of ecological security patterns and biodiversity conservation.
(1) Ecological corridors
Linkage Pathways Tool module in the Linkage Mapper tool was used to import the ecological source and ecological resistance surfaces extracted in the early stage. The cost-weighted distance surface was created by calculating the cost-weighted distance of each pixel from the node, and the ecological corridor was further obtained based on the minimum cost-weighted distance. Using the centrality tool in Circuitscape 4.0, under “Additional tools”, the extracted corridors are analyzed for flow centrality in the mapper module. Flow centrality is a measure of the importance of a corridor in maintaining the connection of the entire network. The principle is to regard the ecological source and corridor as a link network and use Circuitscape to calculate the current flow centrality on the link network. Each core area is regarded as a node, and each link is assigned a resistance equal to the cost-weighted distance of the corresponding minimum cost corridor. Then, Centrality Mapper iterates all core area pairs, injecting 1 ampere of current into one core area and setting the other core area to ground. It adds the results of all core areas and corridors to obtain a centrality score.
(2) Ecological pinch point
The Pinchpoint Mapper module in the Linkage Mapper tool is used, and the all-to-one mode is selected. The principle is to ground one core area and inject current into the remaining cores and iterate on all cores. The current will then flow through these areas between all connected core areas, and the results of each core area will be summed in the output current map. The areas with high current flow centrality are ecological pinch points, indicating that they are important for maintaining the connection of the entire network.
(3) Ecological barrier points
The Barrier Mapper module in the Linkage Mapper tool is used to identify ecological barriers by calculating the size of the connectivity recovery value after removing the barrier points to identify the areas in the habitat that have the greatest impact on connectivity. At the same time, you can also choose the percentage option between the improvement score and the minimum cost path LCD (least-cost distance) in the settings. By calculating the improvement score of each area of the corridor, the barrier areas that affect the quality of the corridor are detected. Removing and repairing areas with high scores can effectively improve the connectivity of the ecological corridor, thereby reducing the resistance to species migration.

2.3.3. Zoning Management of Ecological Security Patterns

The INVEST model was used to evaluate the background value of habitat quality in the study area, and the community mining method in complex networks was used to divide the ecological source areas into different communities. Finally, Thiessen polygons were formed based on each ecological source as the functional radiation range of its source, and the ecological functional zones of the study area were comprehensively divided according to the habitat quality of different communities and the area of ecological sources covered.

Habitat Quality Assessment

The habitat quality evaluation of the study area is realized through the habitat quality module in the inVEST model; it is based on land-use data and introduces threat source factors. It evaluates the adaptability of organisms to different land-use types and the ability of regional ecosystems to provide suitable conditions for the sustainable development and survival of individuals and populations through the impact of threat source factors and the sensitivity of different land-use types to threat source factors [25]. Its value range is between 0 and 1. The larger the value, the higher the habitat quality value of this environment, which is conducive to the development of biodiversity.
D x y = r = 1 R   r = 1 Y r   w r r = 1 R   w r r y i r x y β x S j r
i r x y = 1 d x y / d r m a x
i r x y = e x p 2.99 d r m a x d x y
Q x j = H j 1 D x j z D x j z + k z
Here, Dxy is the degree of habitat degradation; R is the number of factors threatening the habitat; Yr is the number of grids in the threat layer on the land class layer; wr is the weight of threat factor r; ry is the threat level of grid y; irxy is the threat level of ry to habitat grid x; βx is the accessibility level of grid x; Sjr is the sensitivity of land cover type j to threat factor r; dxy is the straight-line distance between grid x and grid y; drmax is the maximum impact distance of threat factor r; Qxj is the habitat quality index of grid x in land cover type j; Hj is the habitat suitability in land cover type j; Dzxj is the degree of habitat degradation of grid x in land cover type j; z is the model default parameter; k is the half-saturation constant.
With reference to the InVEST model instruction manual and the research results of scholars in the middle and lower reaches of the Yangtze River in recent years [26,27], the maximum impact distance and impact weight of each threat source factor in the study area, as well as the habitat value of each land-use type and its sensitivity to the threat source, were finally set, as shown in Table 2 and Table 3.

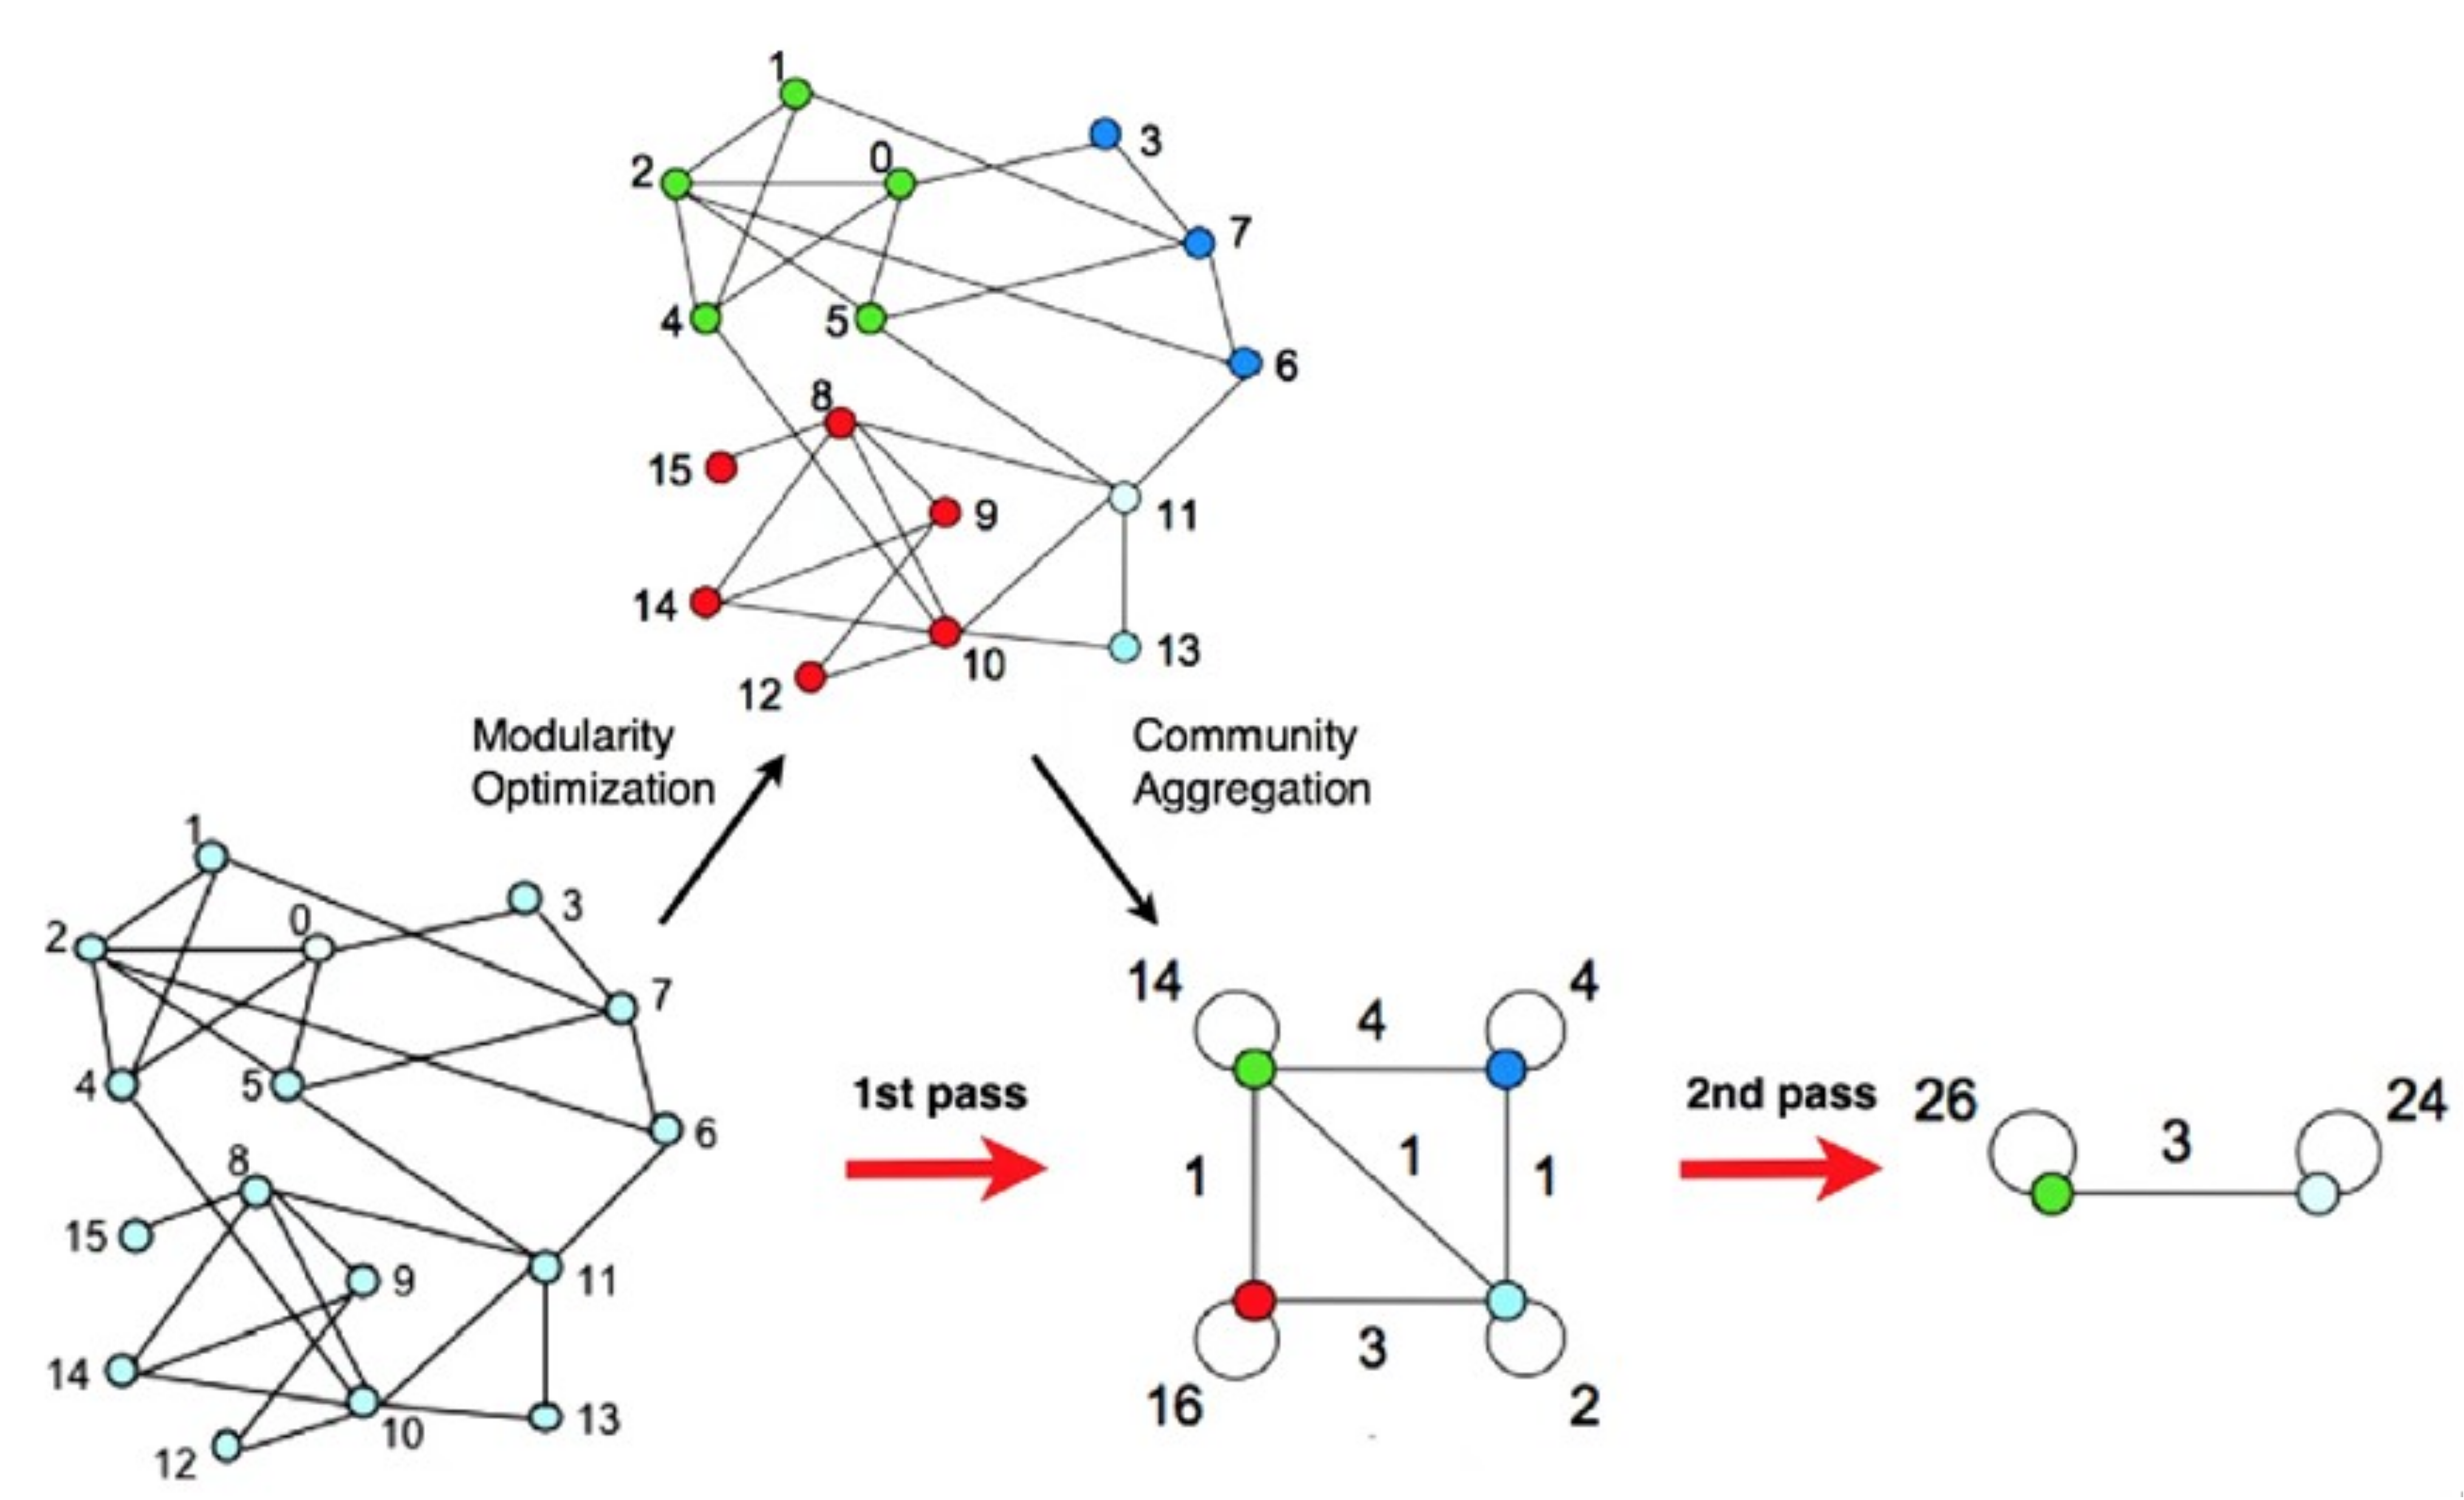
Community Mining Method

In the ecological security pattern, ecological sources can be regarded as nodes in the network, and ecological corridors can be regarded as edges in the network. The ecological network composed of the interconnection between nodes and edges can be abstracted into a complex network [28]. In this network, the topological relationship between nodes and edges determines the properties of the entire network.
In a complex network, the connections between nodes constitute the structure of the entire network. In the network, some nodes are closely connected, while some nodes are sparsely connected. The closely connected part can be regarded as a community, in which the nodes inside it are closely connected, while the connection between two communities is relatively sparse. Community mining is to detect communities in the network. The goal is to divide the nodes in the network into several communities, so that the connection within the community is close and the connection between communities is sparse, so as to better understand the structure and function of the network [29].
This paper uses the Louvain algorithm [30] in community mining to explore the set of ecological sources in the ecological network that are closely connected internally and sparsely connected externally. The basic idea is that the nodes in the network try to traverse the community labels of all neighbors and select the community label that maximizes the modularity increment. After maximizing the modularity, each community is regarded as a new node, and the process is repeated until the modularity no longer increases. The algorithm process is implemented by the community module of the python-Louvain library in Python 3.8.10 software. As shown in Figure 3, Louvain’s algorithm divides network nodes into internally connected communities by iteratively optimizing the modularity (Modularity). In this study, it was applied to the ecological source area network to identify five ecological functional areas.

3. Results and Analysis

3.1. Identification of Ecological Sources

This study used the Guidos and Conefor tools to identify the ecological core area based on the MSPA model. Combined with landscape connectivity analysis, the distance threshold was set at 20,000 m, and the overall connectivity index (IIC) and possible connectivity index (PC) between patches were analyzed. By screening out patches with an area less than 10 km2 and an index mean lower than 0.37, the core ecological source area of Yichang City was finally extracted, as shown in Figure 4.
As the core source of the ecosystem, the total area of the ecological source is 3239.5 km2 after area and connectivity screening, accounting for 15.4% of the total area of the study area and 33.1% of the total area of ecological prospect elements. The distribution of ecological sources is shown in Figure 3. From a spatial perspective, the ecological source of Yichang City is distributed from north to south. The northern core area has the largest area and is densely distributed. The southeastern area is a high-quality plain area in Yichang City, which carries a large amount of construction land and is the main gathering place for human activities. There are almost no ecological sources. Overall, the ecological source area of Yichang City accounts for a large proportion and has a high degree of clustering, and the ecological foundation is good, but the connection between the eastern ecological source is almost cut off; as a sub-provincial city in Hubei Province, in the future balance between industrial expansion and ecological protection, attention should be paid to strengthening the connection between the eastern ecological sources and maintaining the overall share of the current ecological sources.

3.2. Construction of Ecological Resistance Surface

The distribution diagram of nine resistance factors is shown in Figure 5. After standardization, each factor was weighted subjectively and objectively using the coefficient of variation method and hierarchical analysis method to obtain the final weight of each resistance factor (see Equations (9)–(14)). Finally, the comprehensive resistance surface of Yichang City was obtained through superposition analysis, as shown in Figure 6.
Figure 5 shows the spatial distribution of nine resistance factors, including elevation, slope, and population density. High-resistance areas are concentrated in the western high-altitude regions, primarily due to steep slopes and low vegetation cover. In contrast, low-resistance areas are found in the eastern plains, where flat terrain and high connectivity facilitate species movement. As shown in Figure 6, the comprehensive resistance surface value of the study area is between 0.101 and 0.528, and the overall resistance value is at a medium–low level; from a spatial point of view, the high-resistance area group is distributed in the high-altitude areas in the west, which are mainly affected by altitude, slope, temperature, and landscape disturbance factors. The low-resistance area is mainly distributed in the eastern plain area with flat terrain and high landscape connectivity.

3.3. Construction of Ecological Security Patterns

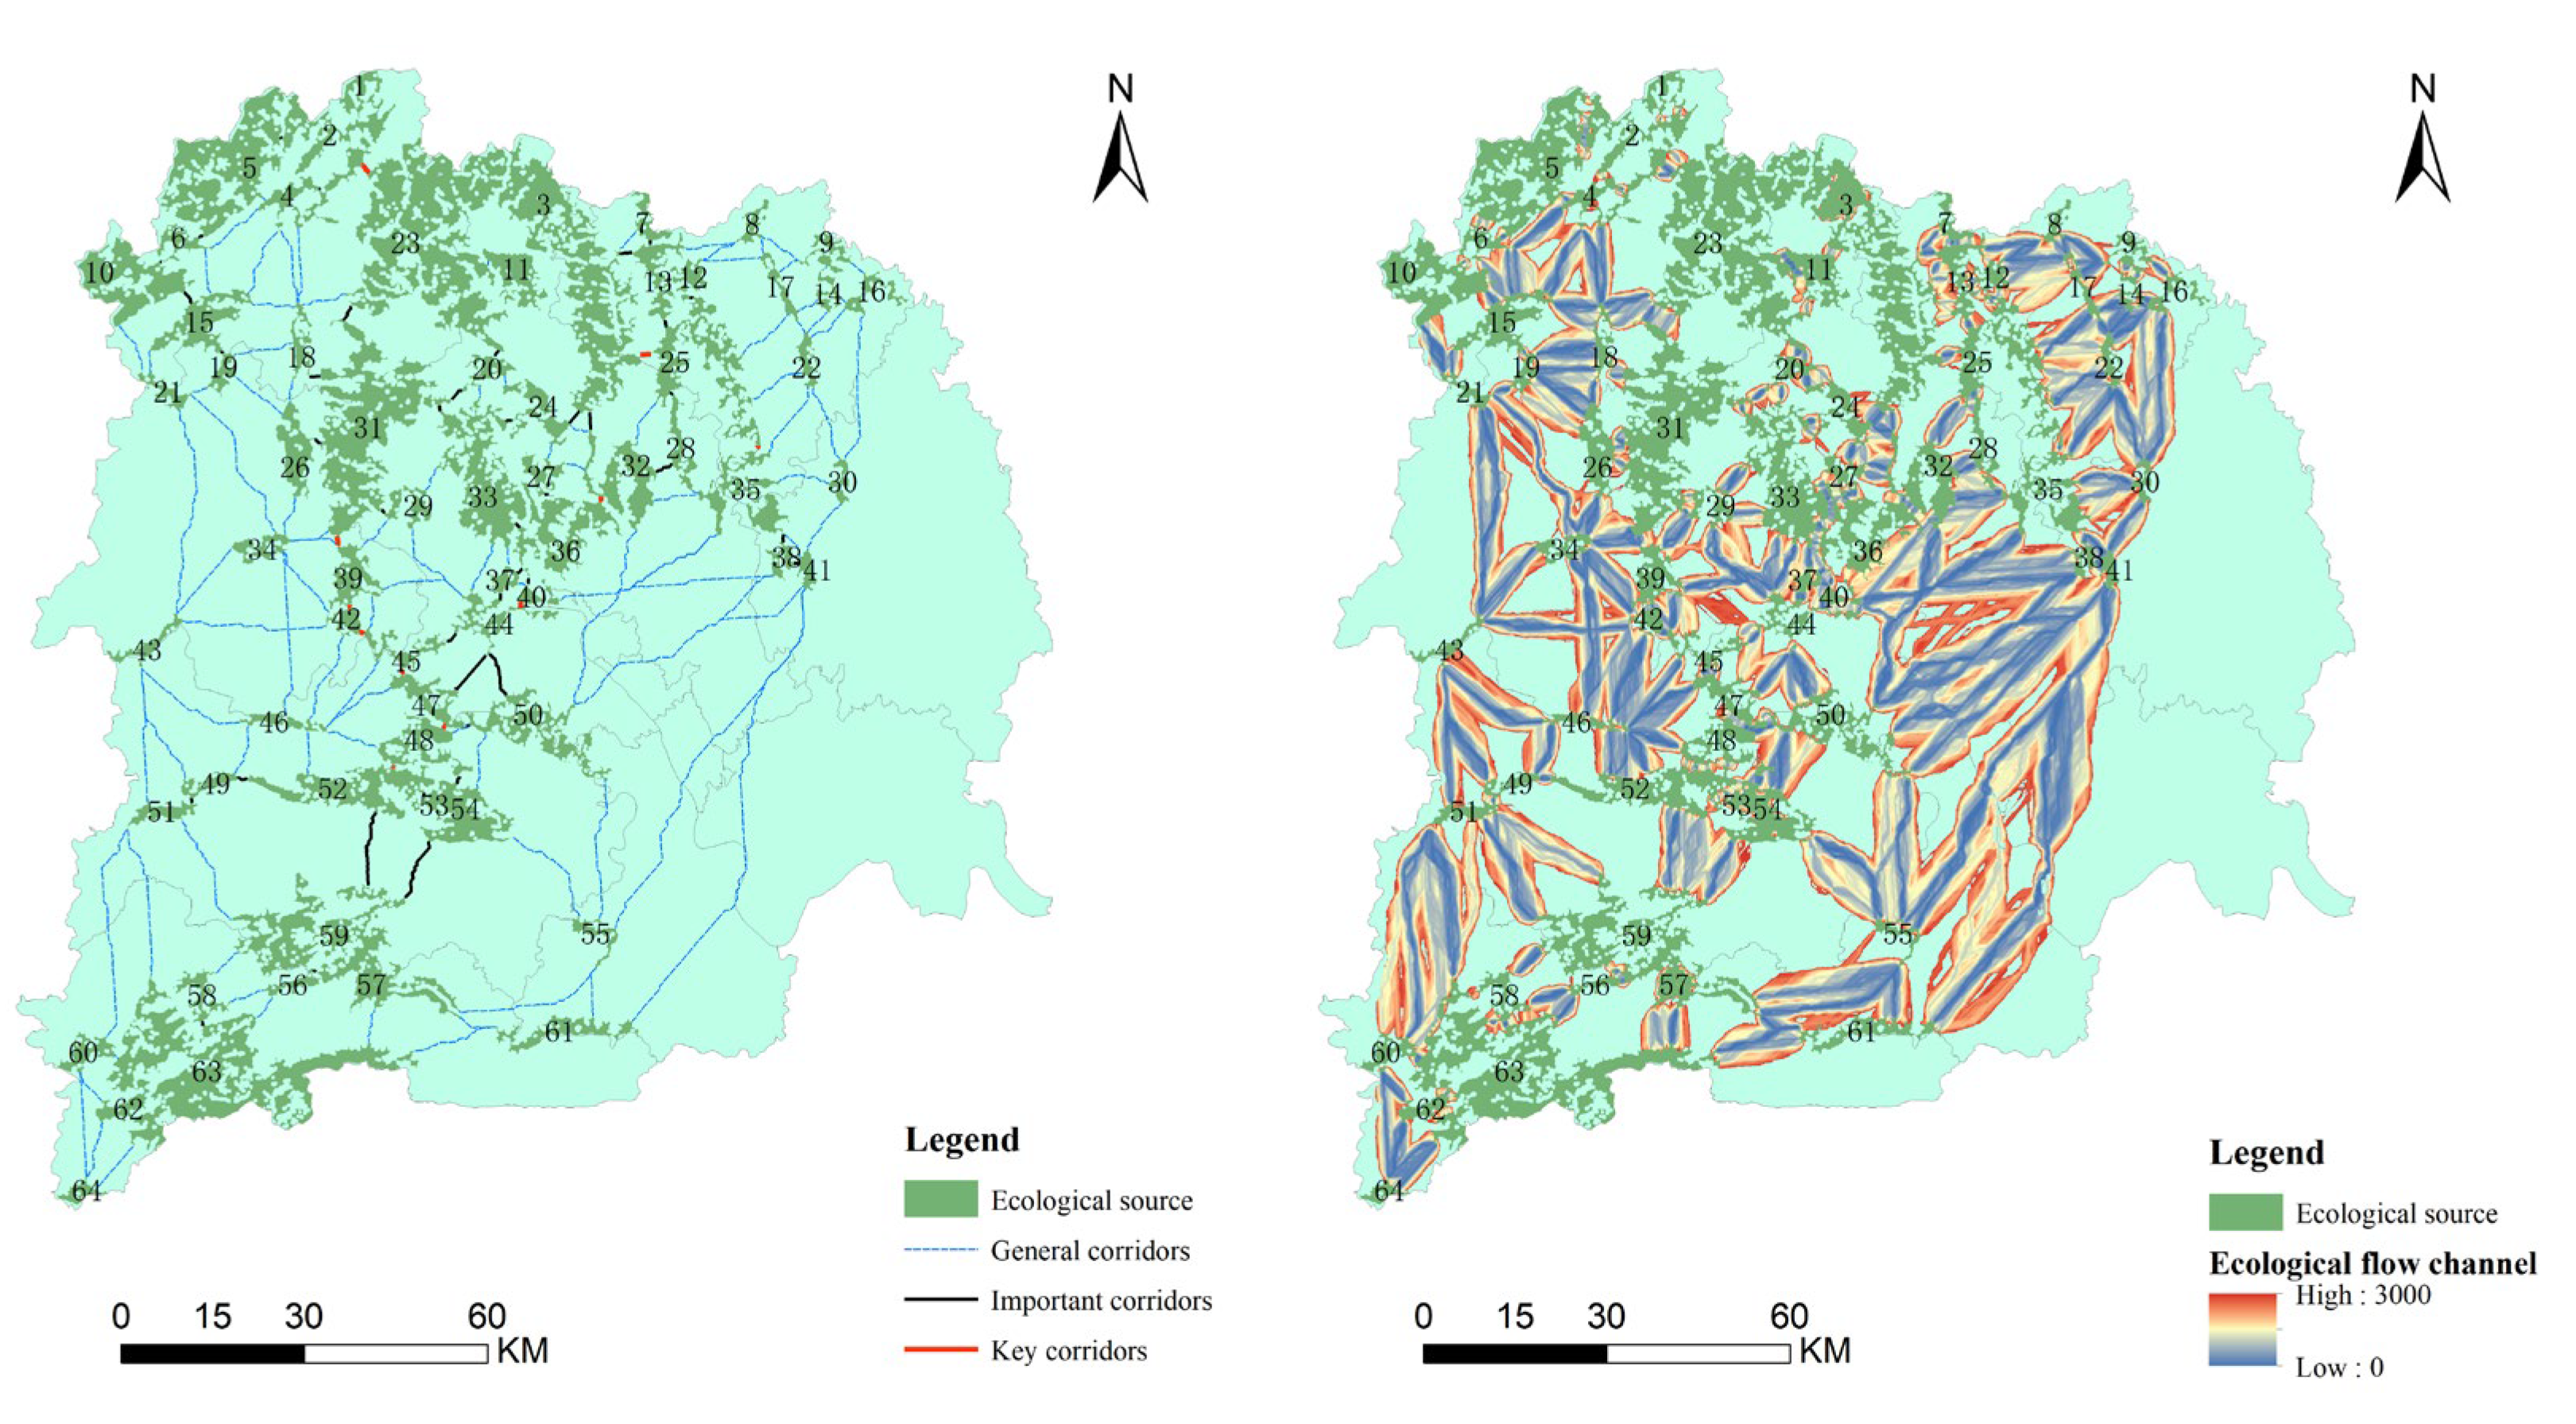
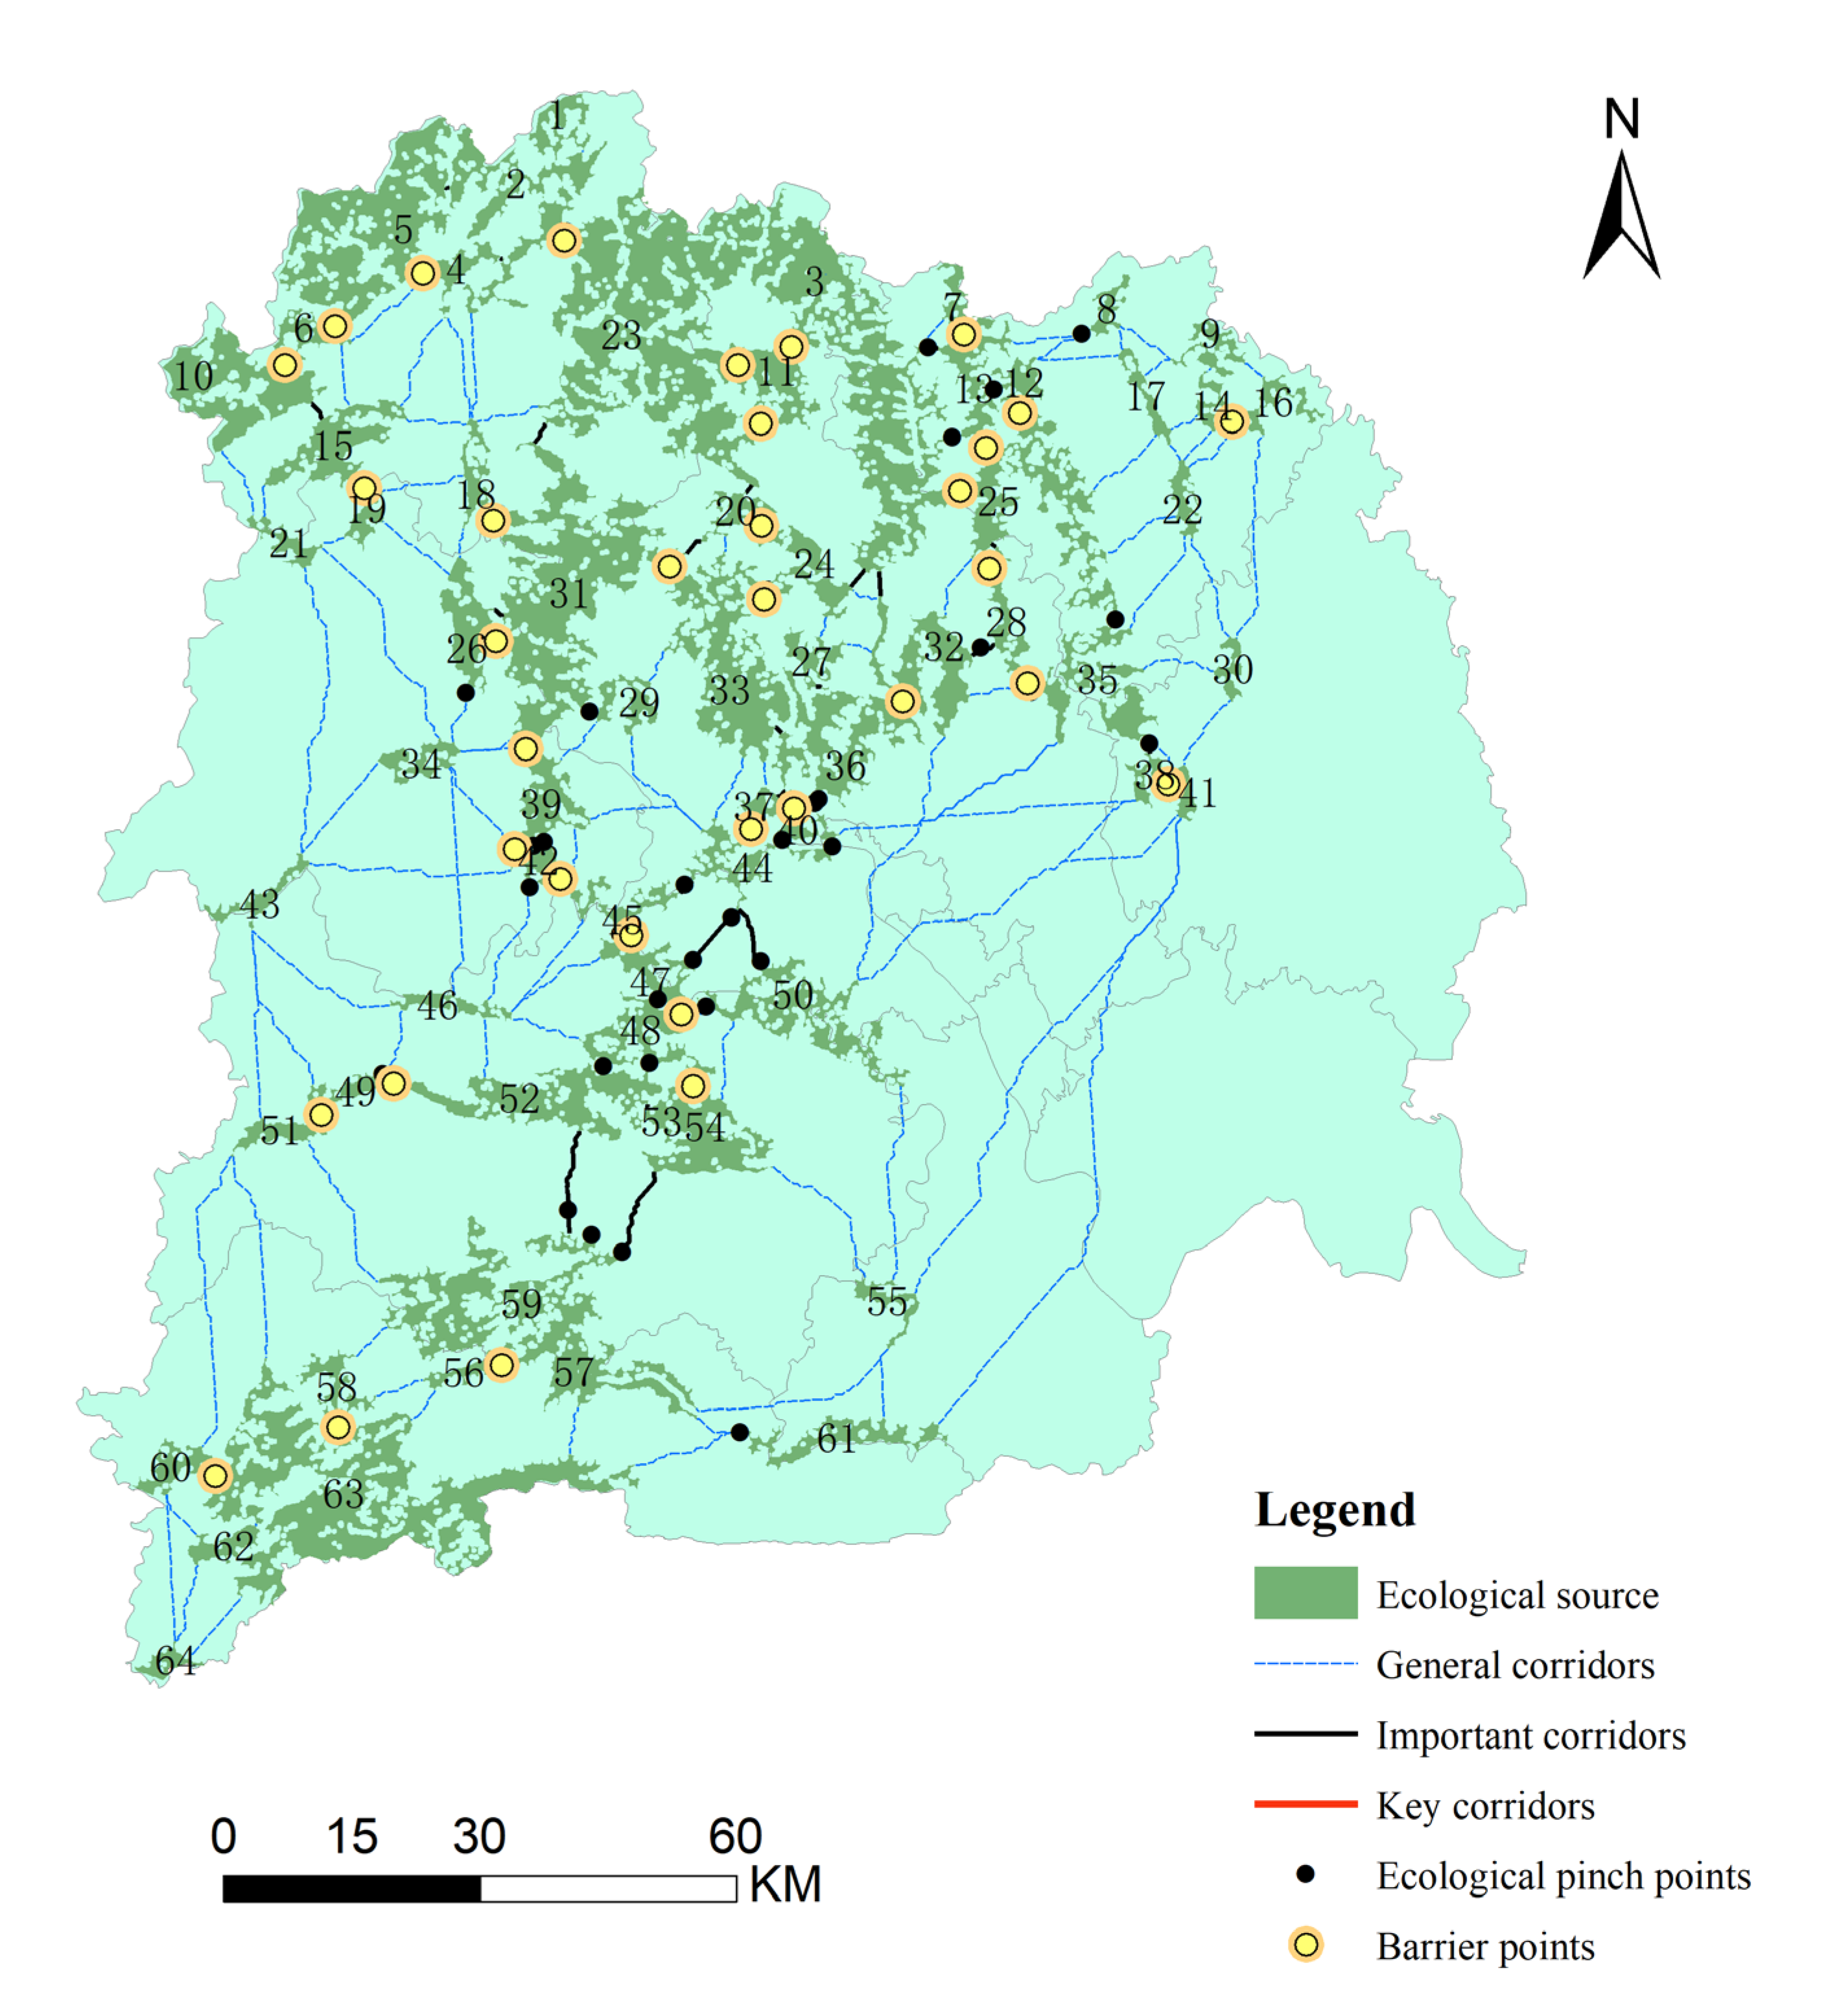
3.3.1. Construction of Ecological Corridors

Ecological corridors are continuous corridors connecting different ecosystems. They can facilitate the exchange and migration of various wild animal and plant populations, thereby reducing the risk of species separation and extinction and helping to maintain the stability and diversity of ecosystems [31]. Ecological corridors can increase the resilience of ecosystems, making them more adaptable to environmental changes and natural disasters, and help to reduce the impact of external pressures on ecosystems. In general, ecological corridors are of great significance in maintaining ecological balance, promoting sustainable development, and improving ecosystem health.
Based on circuit theory and referring to the experience of other scholars, the cost distance channel was set to 3000 m according to the area of Yichang City, and 157 ecological corridors and ecological flow channels were finally extracted, as shown in the figure below. The corridors were divided into three levels according to the centrality score using the natural breakpoint method in GIS and were divided into three categories according to score: general corridors, important corridors, and key corridors.
As shown in Figure 7 and Table 4, in terms of space, since the ecological sources are mainly concentrated in the north and the north–south distribution is relatively loose, the ecological corridors in the central and northern parts of the study area are short and densely distributed, and the longer corridors mainly connect the ecological sources distributed in the north and south. There are 157 corridors in the study area, with Euclidean distances ranging from 50 m to 75.721 km and an average Euclidean distance of 8.094 km. The cost-weighted distance (CWD) length ranges from 89.55 m to 141.70 km, with an average cost-weighted distance of 18.78 km. The minimum cost path (LCPL) ranges from 50 m to 82.90 km, with an average minimum cost path of 8.85 km. The 157 corridors are divided into three levels using the natural breakpoint method in GIS based on the centrality score and are divided into three categories according to score: general corridors, important corridors, and key corridors.
Overall, most of the ecological corridors are distributed in the contiguous cluster of ecological sources in the northern part of the study area, which almost covers all the key corridors and important corridors. This area is located in the northern mountains, has high vegetation coverage, and is far away from the southeastern population concentration area. It is the core area of ecological activities in the study area, carries the largest part of the ecological flow in Yichang City, and is a key area for ecological environmental protection; general corridors are mainly distributed between ecological sources that are farther away or more marginal and are the most distributed corridors in the study area. Affected by ecological resistance and ecological circulation costs, the ecological circulation of general corridors is relatively low. Among them, the southeastern plain area is the main place for human activities, with almost no ecological sources distributed, and there is a conflict between ecological space and living space. Long-distance ecological activities and high ecological resistance have caused a sharp increase in the ecological cost of biological activities. It is necessary to pay attention to increasing ecological restoration and improving the background value of the ecological environment. Ecological protection areas or artificial green spaces can also be repaired to improve the efficiency of biological circulation and maintain the stability of ecological activities.

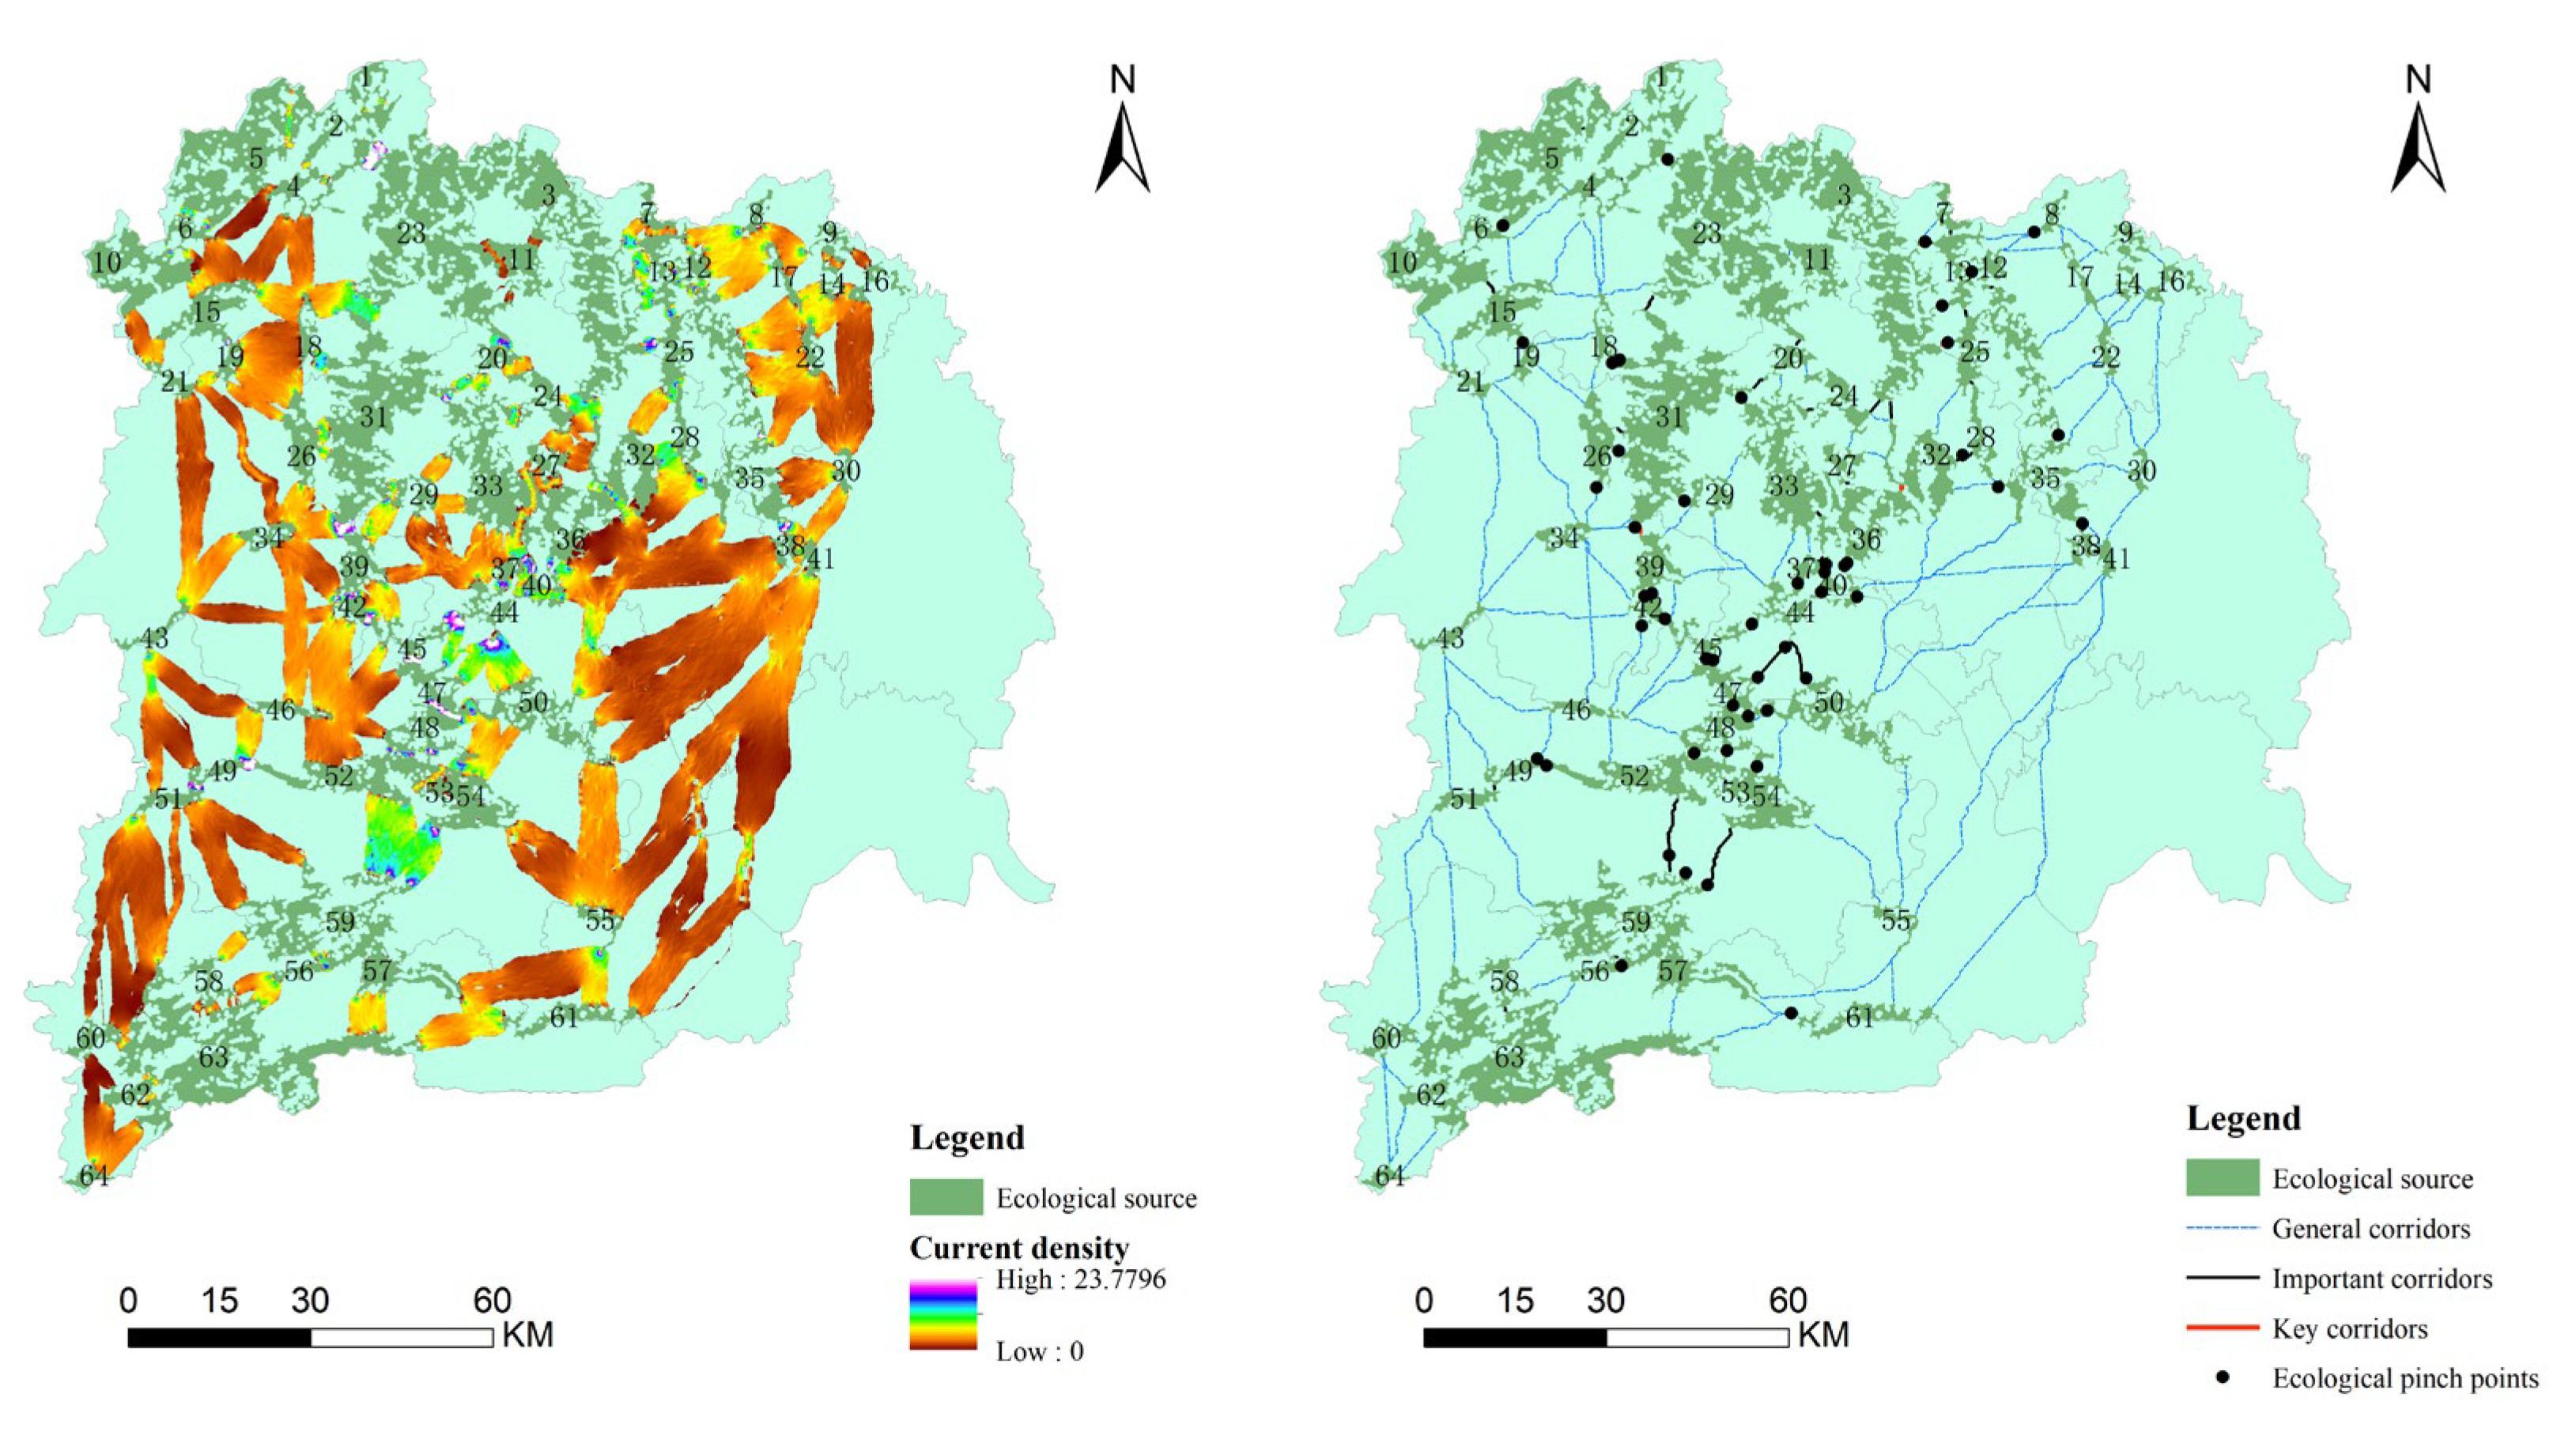
3.3.2. Identification of Ecological Pinch Points

In circuit theory, gridded landscape data are converted into a resistor network model. Each grid cell is used as a node in the ecological network, and a resistor value is assigned according to the difficulty of species crossing the cell. The Circuitscape software is used to simulate the flow of current in the ecological network to calculate the current distribution in the landscape. These high current density areas are ecological pinch points [32], which are key channels for biological migration.
As shown in Figure 8, the highest current density is 27.78, and the high current density areas are basically distributed in key corridors and important corridors, which echoes the results of the corridor flow centrality evaluation in the previous article. The high current density values are extracted in GIS and converted into point elements, and a total of 49 key ecological pinch points are extracted; from the perspective of spatial distribution, these nodes are widely distributed near the endpoints of key corridors and important corridors and are close to the ecological source; among them, the ecological pinch points are concentrated in the central area of the study area, mainly 40, 42, 44, 45, 47, and 48. As a vital area for species migration, in the future ecological environment protection and infrastructure construction, to avoid damage to these key areas, we can strengthen the maintenance of landscape connectivity and ensure the smooth flow of species migration channels. There are almost no pinch points in the southeast and south of the study area. Attention should be paid to strengthening ecological environment construction in these ecologically weak areas, improving the natural ecological background value, reducing the ecological and environmental resistance in biological migration, and maintaining regional ecological security and stability.

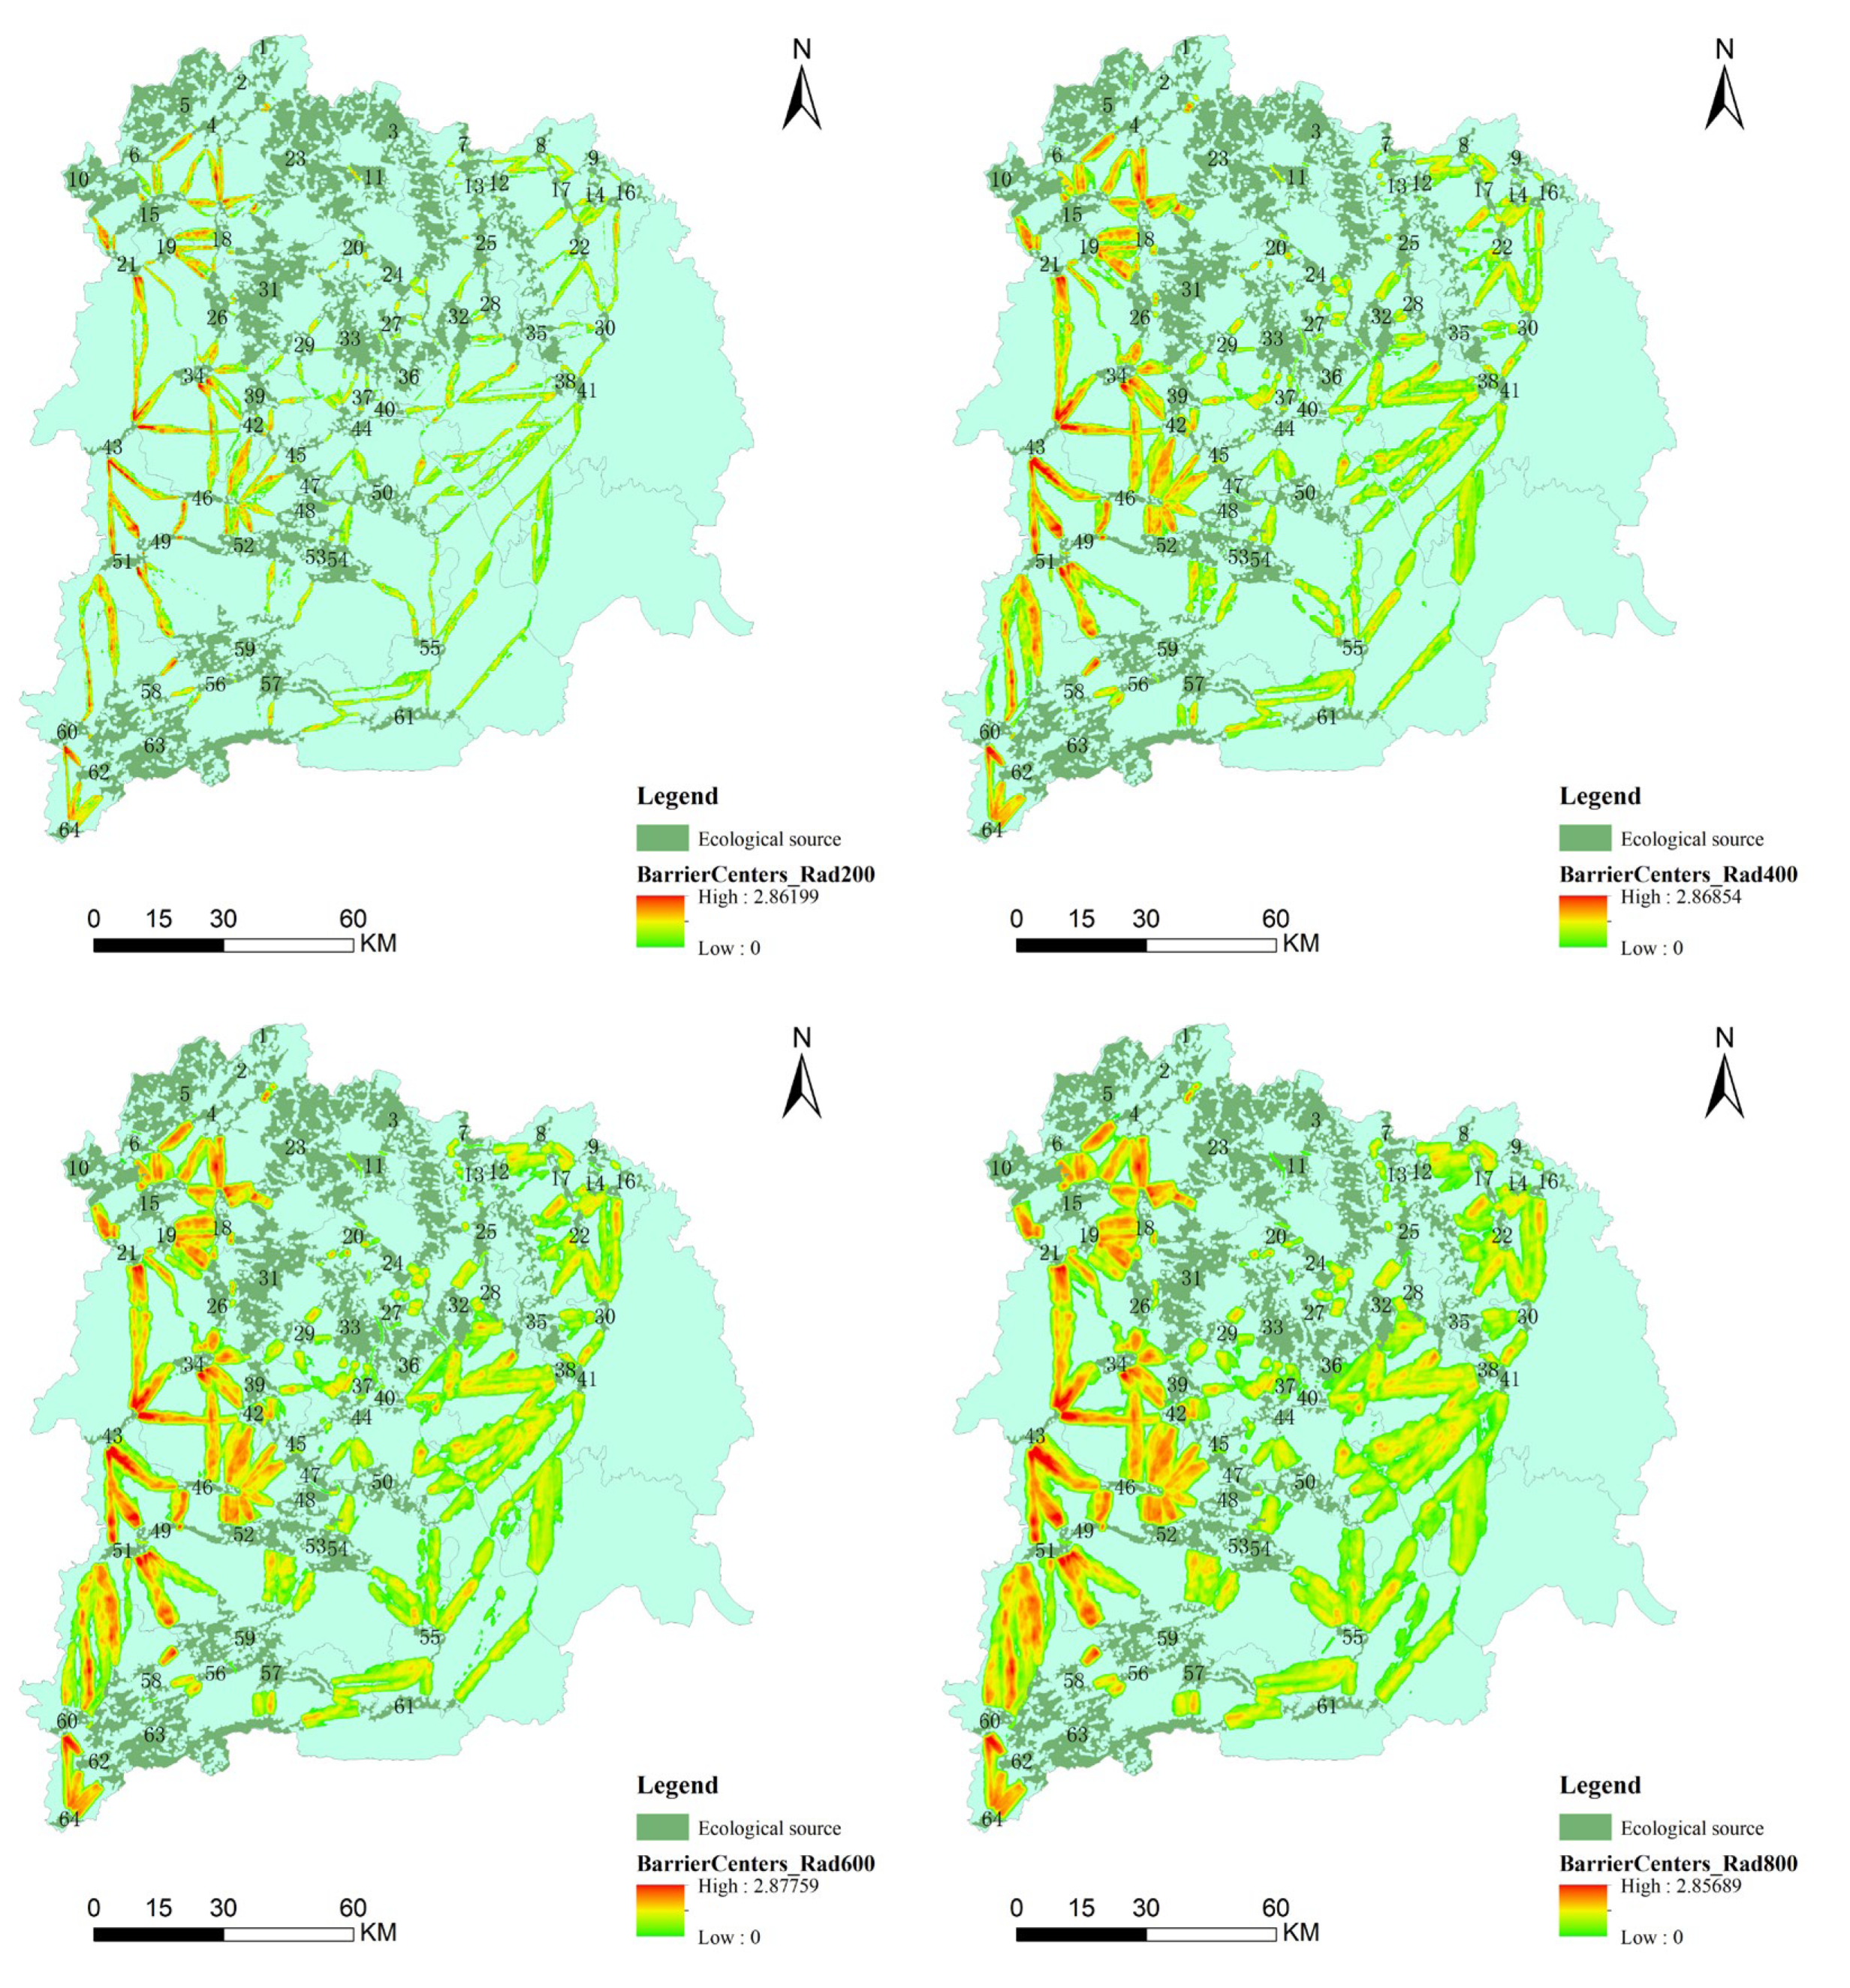
3.3.3. Identification of Ecological Obstacles

In circuit theory, ecological barrier points refer to areas with high “resistance” values in simulated biological flows, that is, areas that significantly hinder the flow of current on the migration path. In reality, they are areas in the landscape that significantly hinder species migration activities [33]. Identified ecological barrier points can be used to address bottlenecks on species migration paths and guide related ecological restoration and construction.
In the Barrier Mapper module, the moving window method is used to search for obstacles with a radius of 200–800 m and a step length of 200 m according to the pixel resolution. The results are shown in Figure 9. As can be seen from the figure, high obstacle areas are mainly distributed in the general corridors in the west. These areas have large slopes and terrain fluctuations, and the resistance to biological migration is large. After expanding the search radius, it can be seen that the distribution of high obstacle areas has not changed significantly, only the width of the obstacle area has increased. The excessively large range of obstacle areas will greatly increase the cost of subsequent ecological restoration. Considering it comprehensively, this paper selects 400 m as the obstacle area search radius. At the same time, in the Barrier Mapper module, the percentage option between the improvement score and the least cost path LCD (least-cost distance) is selected, the value of the center pixel of the search window with the minimum cost distance value between the source areas is replaced, and 400 m is used as the obstacle area search radius. The unit minimum cost distance improvement value is used to represent the improvement of connectivity after the obstacle point is removed. The area with a large value is the obstacle point in the corridor. The comparison of the ecological obstacle point extraction results of the two is shown in the figure below.
As shown in Figure 10, a total of 64 obstacle points were extracted using the high-value area of cumulative current recovery as the obstacle point mode, and a total of 36 obstacle points were extracted based on the LCD improvement percentage score mode; among them, the obstacle points identified using the high-value area of cumulative current recovery as the obstacle point mode are widely distributed in various corridors and are distributed at the ends and middle of the corridors, and the number is much greater than that based on the LCD improvement percentage score mode; the obstacle points identified based on the LCD improvement percentage score mode are mainly distributed in the corridors of the concentrated contiguous areas of the central source area, and most of them are distributed near the ends of the corridors. Different from the direct use of the high-value area of cumulative current recovery as the obstacle point mode, there are few obstacle points distributed on the large-scale corridors in the east and west.
Comparing the distribution characteristics of the number of ecological barrier points extracted by the two models, and taking into account the actual situation in the process of biological migration, directly using the high-value area of cumulative current recovery as the barrier point may lead to the identification of too many natural barriers formed by the natural environment, such as steep slopes and cliffs, or roads and towns that have been built during human activities. Most of these areas are not the preferred channels for biological migration. Taking all these areas as barrier points will make it difficult to carry out later ecological restoration and transformation work; the barrier points extracted based on the LCD improved percentage score model are mostly distributed at both ends of the corridor, which is the “gateway” area for biological migration in the source area, directly affecting the ecological circulation efficiency, and most of them are distributed in the corridors in the concentrated area of ecological sources, with large ecological flow, which is the area with the most restoration value. After comprehensive consideration, this paper selects 36 barrier points extracted based on the LCD improved percentage score model as the ecological barrier points of the study area.
Finally, the extracted ecological sources, ecological corridors, and ecological nodes are superimposed to obtain the ecological security pattern of Yichang City, as shown in Figure 11 below.

3.4. Ecological Security Pattern Zoning

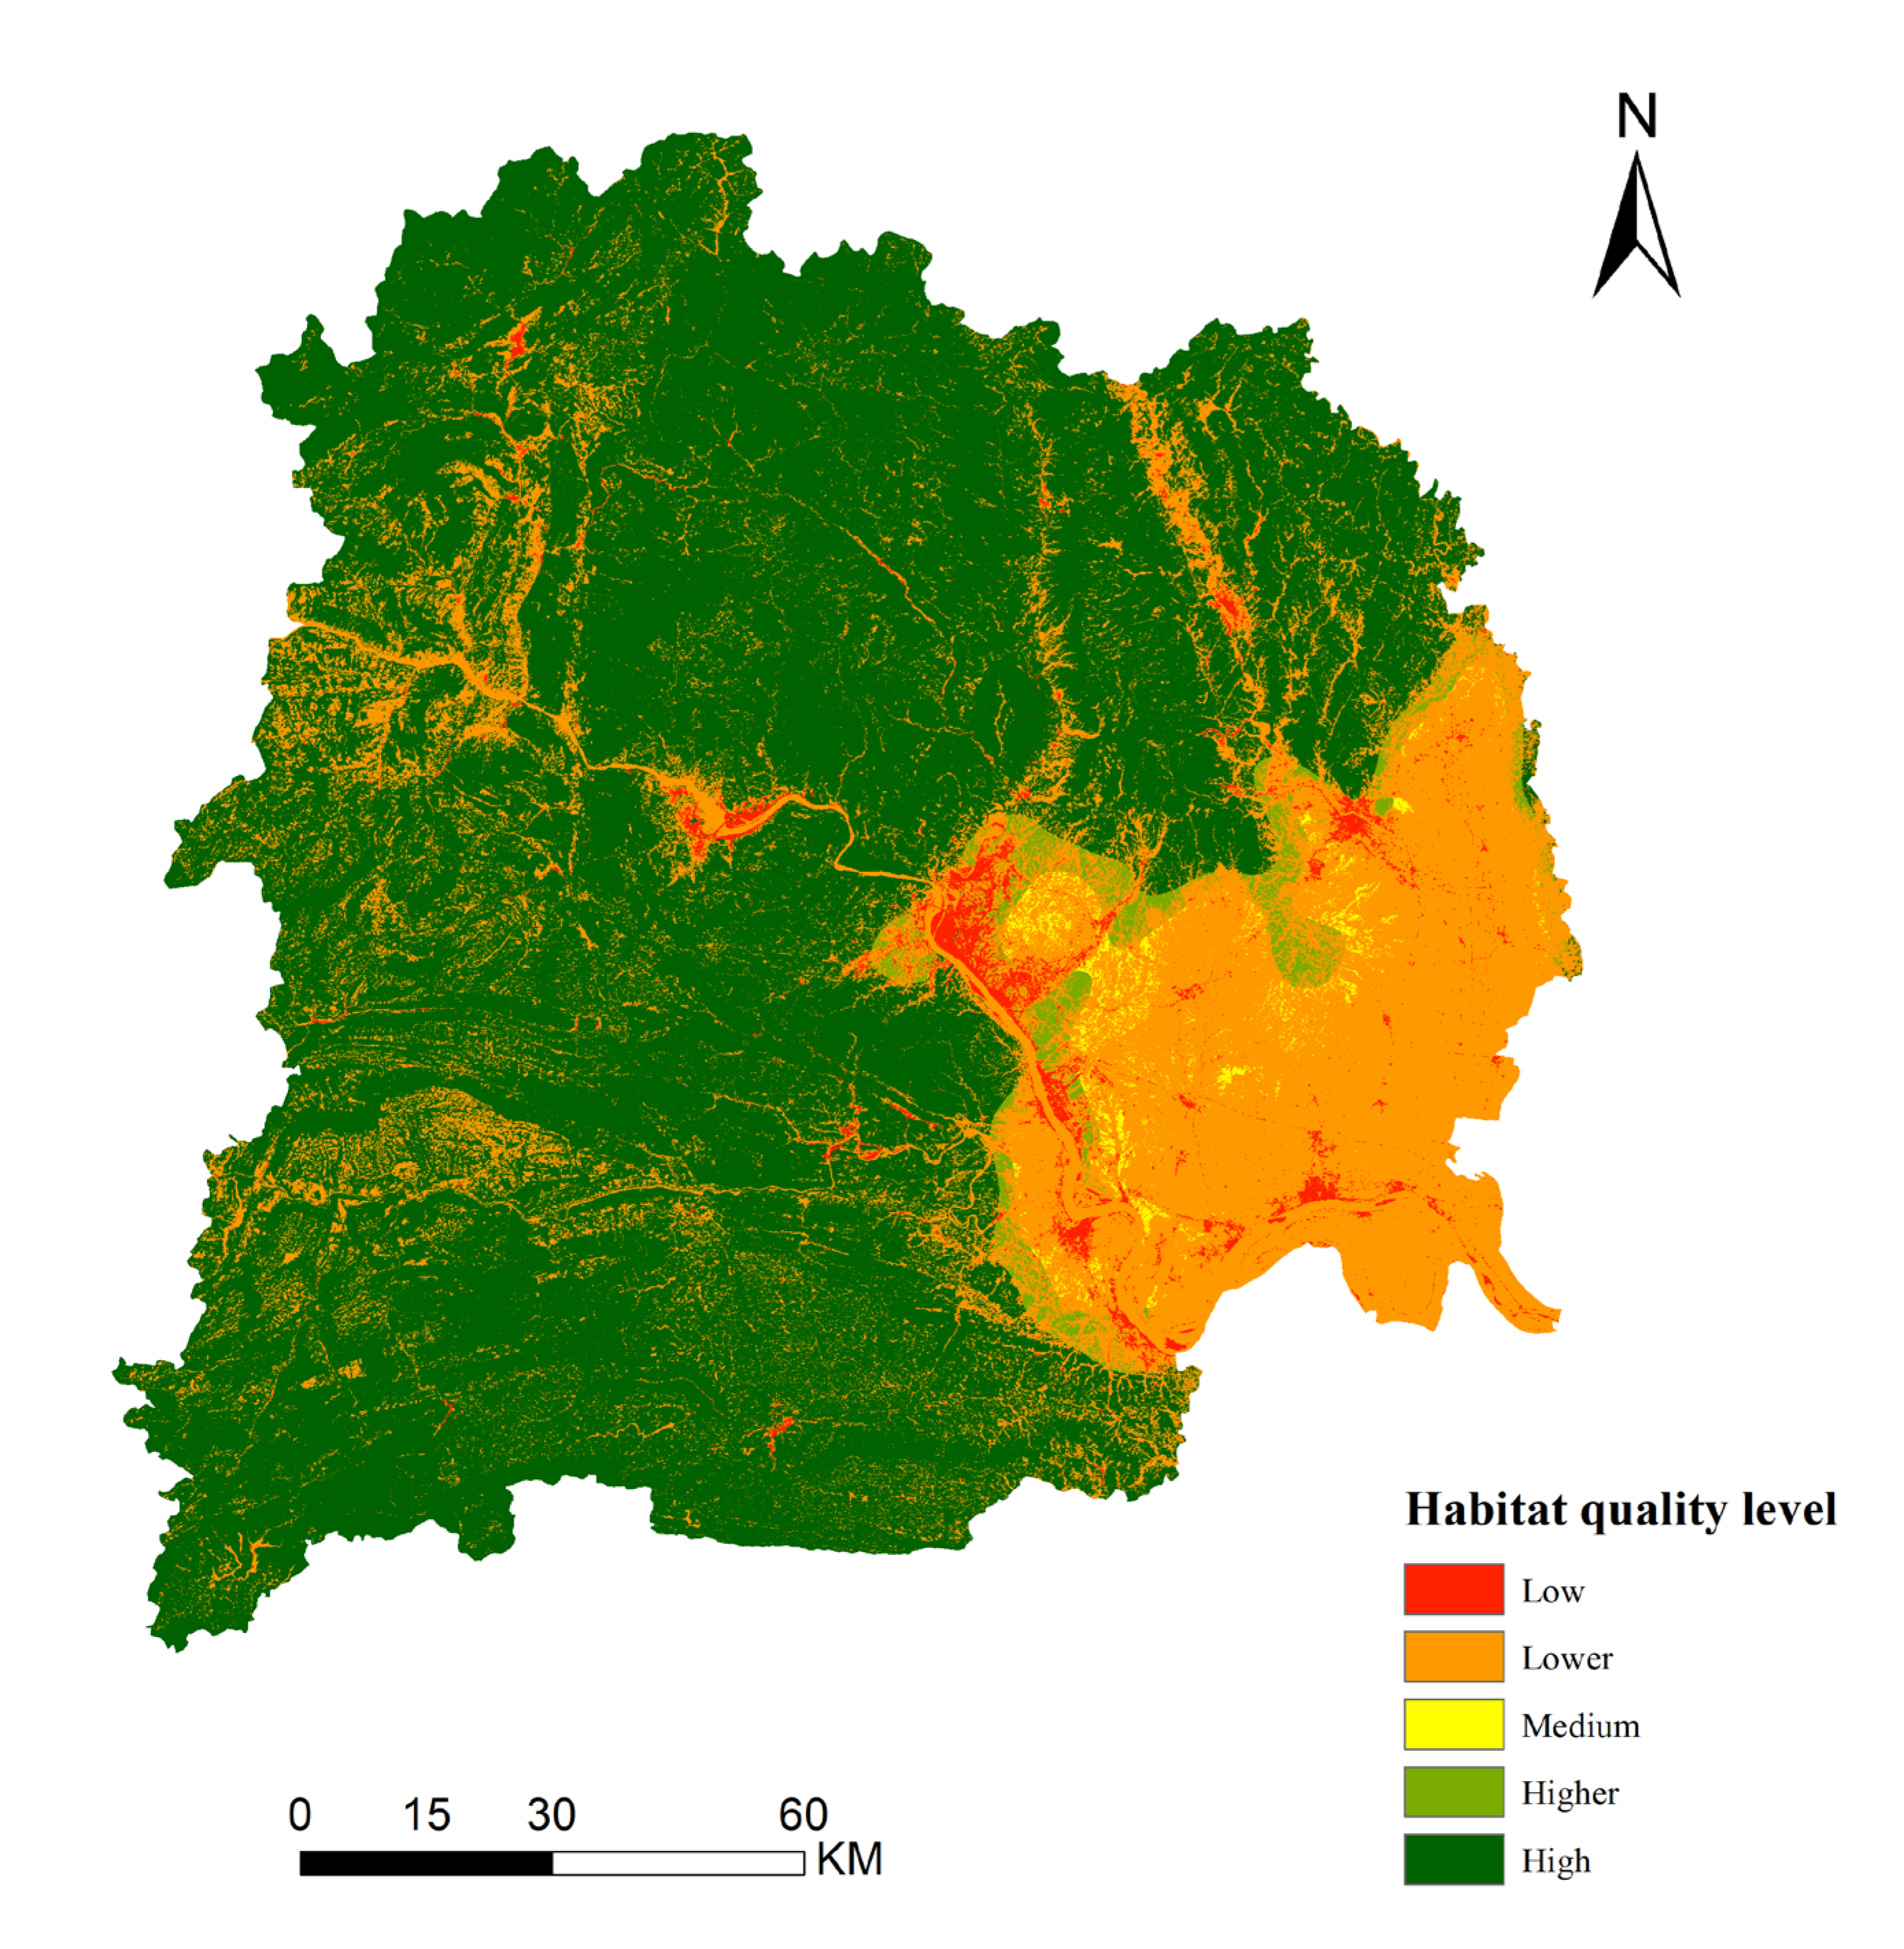
3.4.1. Habitat Quality Assessment Results

InVEST3.12.1 software was used to obtain the habitat quality distribution map of the study area. Then, the habitat quality of the study area was divided into five levels by the natural breakpoint method through the Arcgis 10.8 software, as shown in Figure 12. The mean value of the habitat quality in the study area is 0.79, and the overall habitat quality is at a high level. Among them, the high-level habitat quality area accounts for the largest proportion, with a total of 14,700 square kilometers, accounting for 69.2% of the total area of the study area. It is mainly distributed in the mountainous areas in the north, west, and southwest. These areas have a low degree of development, a large proportion of forest land, and are generally less affected by human activities. They basically cover the entire ecological source area. The low-level habitat quality area has a total of 0.04 square kilometers, accounting for 1.8%, which is basically located in the construction land area. Most of the low-level and lower habitat quality areas are distributed in the southeastern plain area. This area is a densely populated area, carrying most of the human living space, the ecological space is severely squeezed, and the ecological environment quality is low.

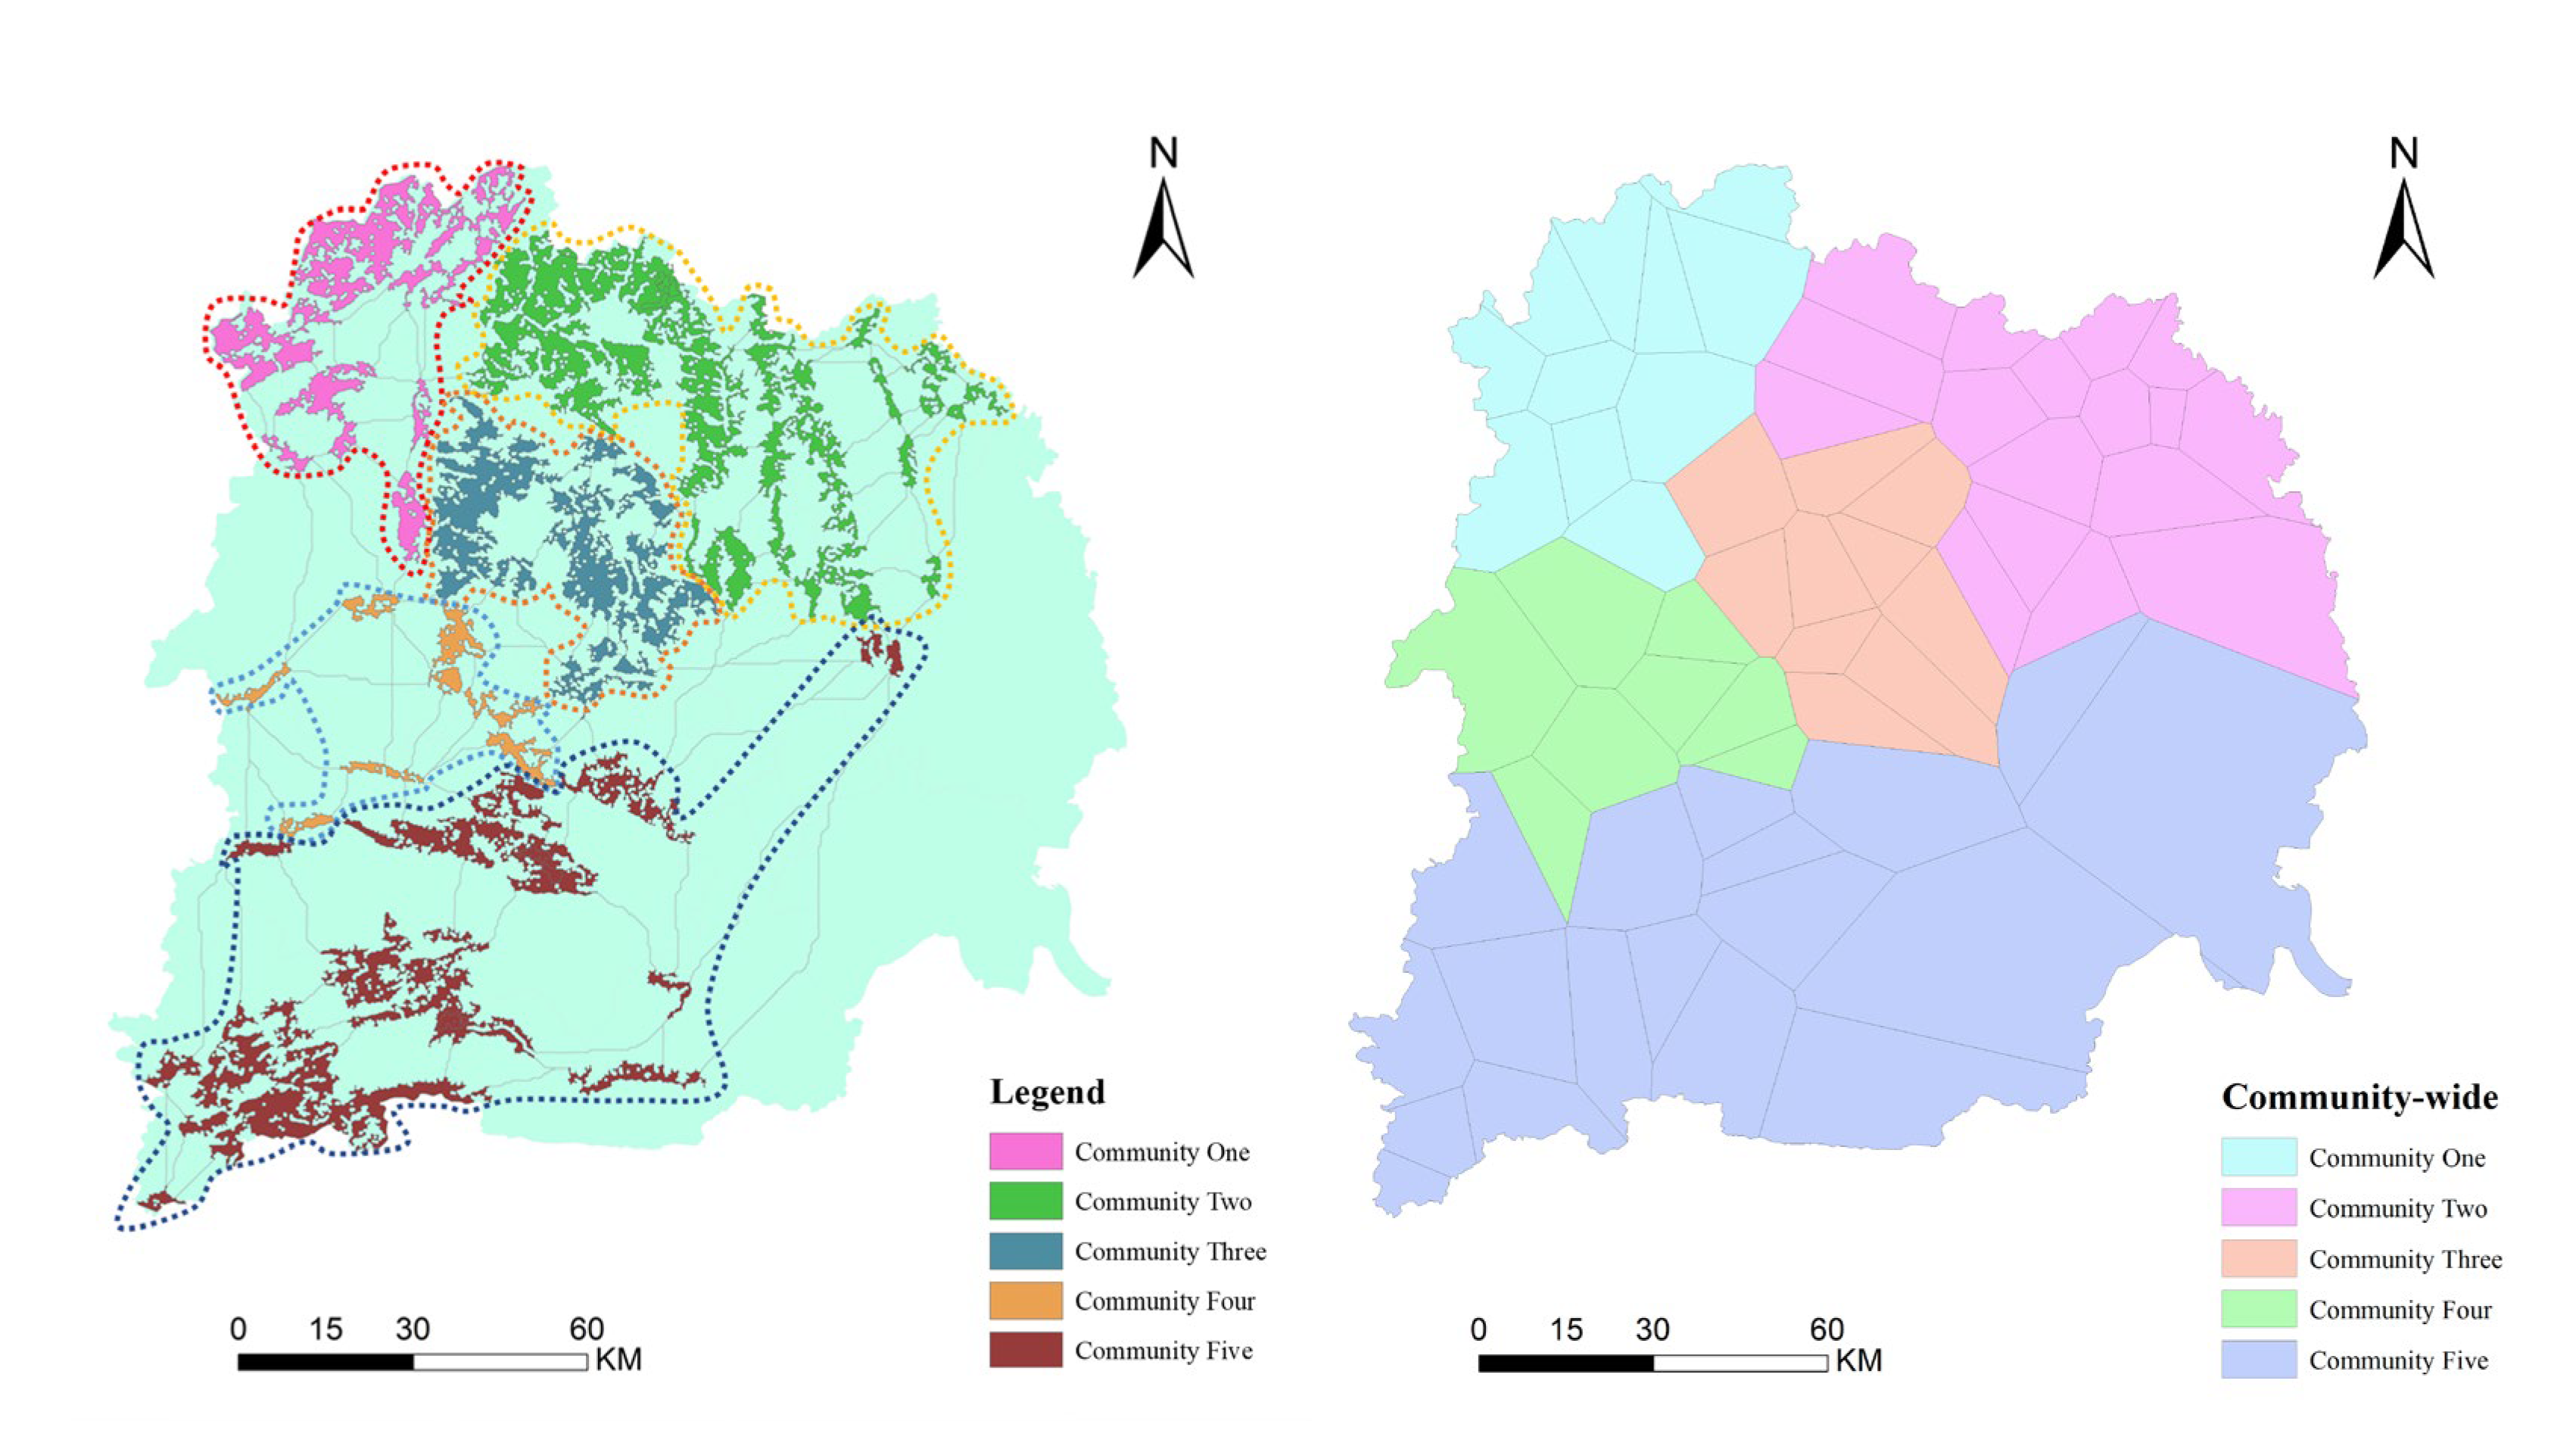
3.4.2. Ecological Zoning Results

The results of community mining in complex networks can only reflect the network characteristics in the topological structure. In the ecological network, each ecological source has an area and a certain range of influence. This paper links the community mining results to the ecological source based on ArcGIS 10.8 software and simulates the functional scope of each ecological source through the Thiessen polygon principle to more intuitively show the distribution of each community in the study area. Finally, the level of each community is determined based on the habitat quality of each community and the total area of the ecological source included. The results are shown in Table 5 and Figure 13.
In this paper, a total of five communities were excavated in the study area by a Louvain algorithm. From No. 1 to No. 5, the communities contain 11, 17, 10, 8, and 18 ecological sources, respectively. Community No. 5 has the largest number of ecological sources, but the degree of aggregation between internal sources is not as high as that of other communities, and most of them are concentrated in the south; Community No. 2 has one less internal source than Community No. 5, but its internal structure is tighter, and the frequency of connection between sources is higher, and it is concentrated in the northeastern part of the study area; Community No. 4 contains the least number of ecological sources and is distributed in the western part of the study area.
Based on the domain analysis tool in GIS 10.8 software Analysis Tools, Thiessen polygons were constructed based on the geometric center of the ecological source, the functional range of the ecological source was simulated and clipped to the scope of the study area, and finally the area of each community was obtained by community number classification. Among the five communities, the total area of Community No. 2 including the source was the largest, which was 1 001.04 km 2. After constructing Thiessen polygons, its total community area reached 4187.91, and the ecological source area accounted for almost 1/4 of its community area. The mean value of habitat quality reached 0.84, indicating that its internal source areas were closely connected, the ecological circulation efficiency was high, and at the same time, forest land was the main land type, far away from habitat threat sources, with a stable ecological structure and sufficient ecological space, which was conducive to the development of biodiversity, and had the highest ecological security level in the study area. The average habitat quality of Community No. 1 reached the highest value of 0.89, but the total number and area of ecological sources within the community were not high, which lowered its ecological security level; Community No. 5 had the largest number of ecological sources, but due to the wide scope of the community, the distribution of sources was relatively sparse, the ecological circulation efficiency was low, and the ecological stability needed to be improved. In addition, the community was greatly affected by human activities and was close to habitat threat sources. The ecological activity space was squeezed, resulting in the lowest ecological security level. It was the main remediation area for ecological restoration projects.

4. Discussion

This study constructs a multi-scale ecological security pattern for Yichang City through the integration of morphological spatial pattern analysis (MSPA), circuit theory, and complex network community detection methods, while proposing dynamic zoning management strategies. The results reveal the spatial distribution characteristics of ecological sources, corridor connectivity, and the critical role of ecological pinch points in Yichang City. However, the following aspects warrant further investigation.

4.1. Scientific Significance and Practical Value of Ecological Pinch Points

The 49 identified ecological pinch points predominantly cluster at key corridor intersections (e.g., Nodes 47 and 48), aligning with the findings by Wu et al. [11] in the middle Yangtze River region, which underscores the bottleneck effects of transitional terrains (e.g., mountain–plain interfaces) on species migration. These areas serve as biological “chokepoints” and hotspots for human–ecological conflicts (e.g., road construction). Compared to Gong et al.’s [8] gravity model-based corridor optimization, this study quantifies pinch points’ ecological flow contributions more intuitively through current density simulations derived from circuit theory, providing quantitative criteria for prioritizing restoration areas. However, seasonal or interannual variations in pinch points remain unaddressed. Future research should integrate hydrological dynamics (e.g., NDWI) to assess aquatic connectivity’s impacts on pinch point stability.

4.2. Innovations and Limitations of Community Partitioning Methodology

This study pioneers the integration of the Louvain community detection algorithm with Voronoi polygon principles to delineate five ecological functional zones. The high ecological security level of Community No. 2 correlates with dense source distribution and low anthropogenic disturbance, consistent with Liu et al.’s [7] findings in the Songnen Plain. Conversely, the low security level of Community No. 5 highlights urbanization-driven spatial compression, particularly in the southeastern plains where construction land expansion isolates ecological sources. Compared to Qian et al.’s [9] “area-line-point” framework, our zoning method enhances functional connectivity through topological analysis but neglects spatiotemporal heterogeneity in habitat quality within communities. Future work should incorporate time-series remote sensing data to dynamically evaluate long-term zoning efficacy.

4.3. Potential Improvements for Ecological Resistance Surface Construction

The composite resistance surface developed using the spatial pattern resistance (SPR) model integrates topographic, climatic, and anthropogenic factors but omits hydrological conditions and climate change variables. For instance, western high-resistance zones align with steep terrain, while southeastern anomalies may stem from impervious surface expansion, partially corroborating Shi et al.’s [28] findings on the Tibetan Plateau ecological network. However, the current resistance surface fails to quantify short-term disruptions from extreme precipitation or drought, potentially underestimating network vulnerability. Subsequent studies should couple climate models (e.g., CMIP6) to simulate resistance surface dynamics under future scenarios, enhancing predictive capacity for ecological security patterns.

4.4. Universality and Regional Adaptability of Management Strategies

The proposed “stepping-stone” restoration strategy (e.g., artificial wetlands) for Community No. 5 theoretically mitigates source isolation but requires empirical validation against regional habitat characteristics. For example, intensive agriculture in eastern plains may degrade wetland functionality, necessitating a balanced evaluation of artificial interventions versus natural restoration. Additionally, the high connectivity of Community No. 2 relies on existing forest cover, aligning with Xue et al.’s [15] “supply-demand” ecosystem service model. However, excessive conservation risks socioeconomic conflicts (e.g., restricted tourism development). Thus, ecological security optimization must reconcile ecological benefits with regional sustainable development goals.

4.5. Limitations and Future Directions

This study has three primary limitations: (1) insufficient integration of hydrological dynamics (e.g., river discharge, NDWI), potentially overlooking aquatic corridor contributions; (2) static topological assumptions in community partitioning, neglecting spatiotemporal behavioral variations in species migration; and (3) expert-based resistance weight allocation requiring machine learning optimization for objectivity. Future research should integrate multi-source remote sensing data with species distribution models to establish a dynamic “pattern-process-service” assessment framework, enabling precise decision making for ecological security governance.

5. Conclusions

This paper mainly draws the following conclusions by constructing the ecological security pattern of Yichang City:
(1) Based on the morphological spatial pattern analysis, the spatial pattern characteristics of the surface cover in Yichang City show that the proportion of forest land in the foreground value in Yichang City reached 71.04%. A total of 64 core ecological source areas in Yichang City were extracted, with a total area of 3239.5 km2, accounting for 15.4% of the total area of the study area. In terms of space, the ecological source areas are distributed from north to south as a whole, among which the northern core area has the largest area and is densely distributed. The southeastern region is a high-quality plain area in Yichang City, which carries a large amount of construction land and is the main gathering place for human activities, with almost no ecological source areas.
(2) The comprehensive ecological resistance surface of Yichang City was constructed through the three comprehensive indicators of ecological sensitivity, ecological pressure, and ecological resilience. Among them, landscape disturbance has the greatest impact on the ecological resistance surface of Yichang City, and the high resistance area is mainly distributed in the high-altitude mountainous areas in the west. Based on the circuit theory and the Linkage Mapper tool, a total of 157 ecological corridors in Yichang City were identified, which were classified into 104 general corridors, 42 important corridors, and 11 key corridors according to flow centrality score; there are also 49 key ecological pinch points and 36 ecological barrier points, which together constitute the ecological security pattern of Yichang City in the form of points, lines, and surfaces.
(3) The mean value of habitat quality in Yichang City is 0.79, which is at a relatively high level. Among them, the high-level habitat quality area accounts for the largest proportion, with a total of 14,700 square kilometers, accounting for 69.2% of the total area of the study area. It is mainly distributed in the mountainous areas in the north, west, and southwest where the forest coverage rate is high and the impact of human activities is small. Combining the community mining algorithm in complex networks and the Thiessen polygon principle, Yichang City is divided into five ecological zones. Among them, Community No. 2 has the highest ecological security level, with a high vegetation coverage rate and a good natural ecological foundation; Community No. 1 has a slightly lower ecological security level than the ecological conservation area. The overall ecological environment quality in the region is very high, but the area of ecological sources is slightly lower. The ecological space has great potential, the overall ecological network has a certain ability to resist pressure, and the ecological functions are relatively complete; Community No. 3 is located in the central area of the study area and is a transit station in the ecological flow process. There are a large number of ecological pinch points distributed in the region, the ecological flow is huge and too close, the overall ecological space is mediocre, and the overall ecological environment is under certain pressure; Community No. 4 has a low ecological security level, the least number of ecological sources in the region, low participation in the ecological flow process, and much room for improvement in habitat quality; Community No. 5 is the area with the lowest ecological security level in the study area. The ecological resistance between its internal ecological sources is large, connections are difficult, and the overall ecological flow efficiency is low; it is greatly affected by habitat threat sources, and its ecological space is severely squeezed.

Author Contributions

Conceptualization, Y.S. and Q.Z.; methodology, Y.S.; software, D.T.; validation, H.C., Y.T. and Q.Z.; formal analysis, Y.S.; investigation, Q.Z.; resources, H.C.; data curation, Q.Z.; writing—original draft preparation, Y.T.; writing—review and editing, Q.Z.; visualization, Y.S.; supervision, Y.S.; project administration, Y.S.; funding acquisition, Y.S. All authors have read and agreed to the published version of the manuscript.

Funding

This research was funded by the National Natural Science Foundation of China (42367070), the Open Fund of Hubei Key Laboratory of Biological Resources Protection and Utilization (Hubei Minzu University) (KYPT012405).

Institutional Review Board Statement

Not applicable.

Informed Consent Statement

Not applicable.

Data Availability Statement

The original contributions presented in this study are included in this article. Further inquiries can be directed to the corresponding authors.

Conflicts of Interest

The authors declare no conflicts of interest.

References

  1. Dong, X.; Wang, F.; Fu, M. Research Progress and Prospects for Constructing Ecological Security Pattern Based on Ecological Network. Ecol. Indic. 2024, 168, 112800. [Google Scholar] [CrossRef]
  2. Ying, L.X.; Kong, L.Q.; Xiao, Y.; Ouyang, Z. The Research Progress and Prospect of Ecological Security and Its Assessing Approaches. Acta Ecol. Sin. 2022, 42, 1679–1692. [Google Scholar] [CrossRef]
  3. Li, T.; Li, L.; Tang, M.F.; Deng, H. Heterogeneous Impacts of Human Activity Intensity on Regional Ecological Security Patterns: The Case of Southwest China. Land 2024, 13, 2172. [Google Scholar] [CrossRef]
  4. Hua, X. Review and the Outlook of Land Use Ecological Security Pattern. Acta Ecol. Sin. 2008, 28, 6305–6311. [Google Scholar]
  5. Yaxian, G.; Wei, L.; Gang, H.; Shuhang, Z. Evaluation of Industrial Ecological Security in Industrial Transformation Demonstration Area Based on Spatiotemporal Differentiation. Geomat. Nat. Hazards Risk 2022, 13, 1422–1440. [Google Scholar] [CrossRef]
  6. Li, C.; Wu, Y.; Gao, B.; Zheng, K.; Wu, Y.; Wang, M. Construction of Ecological Security Pattern of National Ecological Barriers for Ecosystem Health Maintenance. Ecol. Indic. 2023, 146, 109801. [Google Scholar] [CrossRef]
  7. Liu, J.; Chen, B.; Zhang, M.; Wan, D.; Liu, X. Construction and Optimization of Ecological Security Patterns in the Songnen Plain. Front. Environ. Sci. 2024, 12, 1302896. [Google Scholar] [CrossRef]
  8. Gong, D.; Huang, M.; Lin, H. Construction of an Ecological Security Pattern in Rapidly Urbanizing Areas Based on Ecosystem Sustainability, Stability, and Integrity. Remote Sens. 2023, 15, 5728. [Google Scholar] [CrossRef]
  9. Qian, W.; Zhao, Y.; Li, X. Construction of Ecological Security Pattern in Coastal Urban Areas: A Case Study in Qingdao, China. Ecol. Indic. 2023, 154, 110754. [Google Scholar] [CrossRef]
  10. Qiao, Q.; Zhen, Z.; Liu, L.; Luo, P. The Construction of Ecological Security Pattern under Rapid Urbanization in the Loess Plateau: A Case Study of Taiyuan City. Remote Sens. 2023, 15, 1523. [Google Scholar] [CrossRef]
  11. Wu, Z.L.; Yang, J.Y.; Xie, H.L. Construction, Optimization and Restoration of Ecological Security Pattern in the Southern Hilly and Mountainous Region of China: A Case Study in Ruijin City. Acta Ecol. Sin. 2022, 42, 3998–4010. [Google Scholar] [CrossRef]
  12. Yu, K. Security Patterns and Surface Model in Landscape Ecological Planning. Landsc. Urban Plan. 1996, 36, 1–17. [Google Scholar] [CrossRef]
  13. Yao, Z.; Jiang, C.; Zong-Cheng, C.; Shi-Yuan, Z.; Guo-Dong, Z. Construction of Ecological Security PatternBased on Ecological Sensitivity Assessmentin Jining City, China. Pol. J. Environ. Stud. 2022, 31, 5383–5404. [Google Scholar] [CrossRef] [PubMed]
  14. Wen, J.; Hou, K. Research on the Progress of Regional Ecological Security Evaluation and Optimization of Its Common Limitations. Ecol. Indic. 2021, 127, 107797. [Google Scholar] [CrossRef]
  15. Xue, F.; Yang, Y.; Hu, Y. Integrating Supply and Benefits of Ecosystem Services into Ecological Security Pattern: A Spatial Flow Perspective. Ecol. Indic. 2024, 166, 112455. [Google Scholar] [CrossRef]
  16. Lin, W.H.; Wen, Z.F.; Wu, S.J.; Bi, Y. Identification and Optimization of Ecological Security Pattern in the Chengdu-Chongqing Economic Zone. Acta Ecol. Sin. 2023, 43, 973–985. [Google Scholar] [CrossRef]
  17. Xu, X.; Wang, S.; Rong, W. Construction of Ecological Network in Suzhou Based on the PLUS and MSPA Models. Ecol. Indic. 2023, 154, 110740. [Google Scholar] [CrossRef]
  18. Li, M.; Zhang, Z.; Liu, X.; Hui, Y. Multi-Scenario Analysis of Land Space Based on PLUS and MSPA. Environ. Monit. Assess. 2023, 195, 817. [Google Scholar] [CrossRef]
  19. Xin, C.; Jian, P.; Yanxu, L.I.U.; Yang, Y.; Guicai, L.I. Constructing Ecological Security Patterns in Yunfu City Based on the Framework of Importance-Sensitivity-Connectivity. Geogr. Res. 2017, 36, 471–484. [Google Scholar]
  20. Feng, Z.H.U.; Hongwei, Z. “AHP+entropy Weight Method” Based CW-TOPSIS Model for Predicting Rockburst. China Saf. Sci. J. 2020, 27, 128. [Google Scholar] [CrossRef]
  21. McRae, B.H.; Dickson, B.G.; Keitt, T.H.; Shah, V.B. Using Circuit Theory to Model Connectivity in Ecology, Evolution, and Conservation. Ecology 2008, 89, 2712–2724. [Google Scholar] [CrossRef] [PubMed]
  22. Shah, V.B.; McRae, B. Circuitscape: A Tool for Landscape Ecology. In Proceedings of the 7th Python in Science Conference, Austin, Texas, 28–30 June 2008; pp. 62–65. [Google Scholar] [CrossRef]
  23. An, Y.; Liu, S.; Sun, Y.; Shi, F.; Beazley, R. Construction and Optimization of an Ecological Network Based on Morphological Spatial Pattern Analysis and Circuit Theory. Landsc. Ecol. 2021, 36, 2059–2076. [Google Scholar] [CrossRef]
  24. Yu, H.; Gu, X.; Liu, G.; Fan, X.; Zhao, Q.; Zhang, Q. Construction of Regional Ecological Security Patterns Based on Multi-Criteria Decision Making and Circuit Theory. Remote Sens. 2022, 14, 527. [Google Scholar] [CrossRef]
  25. Liu, H.; Tang, D. Ecological Zoning and Ecosystem Management Based on Landscape Ecological Risk and Ecosystem Services: A Case Study in the Wuling Mountain Area. Ecol. Indic. 2024, 166, 112421. [Google Scholar] [CrossRef]
  26. Jiang, Z.; Gan, X.; Liu, J.; Bi, X.; Kang, A.; Zhou, B. Landscape Ecological Risk Assessment and Zoning Control Based on Ecosystem Service Value: Taking Sichuan Province as an Example. Appl. Sci. 2023, 13, 12103. [Google Scholar] [CrossRef]
  27. Wang, X.; Zhao, X.; Xu, Y.; Ran, Y.; Ye, X.; Zhou, Y.; Wu, B.; Chu, B. Quantifying the Supply-Demand Relationship of Ecosystem Services to Identify Ecological Management Zoning: A Case Study in Mountainous Areas of Northwest Yunnan, China. Heliyon 2024, 10, e32006. [Google Scholar] [CrossRef] [PubMed]
  28. Shi, Q.; Lu, J.; Han, J. Studying the Spatiotemporal Variations of the Ecological Network and Carbon Utilization Efficiency in Southeast Tibet Based on Complex Network Theory. Ecol. Indic. 2024, 166, 112521. [Google Scholar] [CrossRef]
  29. Song, S.; Xu, D.; Hu, S.; Shi, M. Ecological Network Optimization in Urban Central District Based on Complex Network Theory: A Case Study with the Urban Central District of Harbin. Int. J. Environ. Res. Public. Health 2021, 18, 1427. [Google Scholar] [CrossRef]
  30. Zhang, W. Improving Commuting Zones Using the Louvain Community Detection Algorithm. Econ. Lett. 2022, 219, 110827. [Google Scholar] [CrossRef]
  31. Shifaw, E.; Sha, J.; Li, X.; Bao, Z.; Ji, J.; Huang, J.; Kassaye, A.Y.; Hao, Z. Spatiotemporal Dynamics of Ecological Security Pattern Based on an Optimized Assessment Framework and Circuit Theory: A Case of Fuzhou City, China. Hum. Ecol. Risk Assess. Int. J. 2024, 30, 352–377. [Google Scholar] [CrossRef]
  32. Wang, Y.; Qu, Z.; Zhong, Q.; Zhang, Q.; Zhang, L.; Zhang, R.; Yi, Y.; Zhang, G.; Li, X.; Liu, J. Delimitation of Ecological Corridors in a Highly Urbanizing Region Based on Circuit Theory and MSPA. Ecol. Indic. 2022, 142, 109258. [Google Scholar] [CrossRef]
  33. Gao, C.; Pan, H.; Wang, M.; Zhang, T.; He, Y.; Cheng, J.; Yao, C. Identifying Priority Areas for Ecological Conservation and Restoration Based on Circuit Theory and Dynamic Weighted Complex Network: A Case Study of the Sichuan Basin. Ecol. Indic. 2023, 155, 111064. [Google Scholar] [CrossRef]
Figure 1. Overview of the study area.
Sustainability 17 02354 g001
Figure 2. Ecological security pattern framework of Yichang City.
Sustainability 17 02354 g002
Figure 3. Principle of Louvain algorithm.
Sustainability 17 02354 g003
Figure 4. Ecological source identification.
Sustainability 17 02354 g004
Figure 5. Resistance factor distribution.
Sustainability 17 02354 g005aSustainability 17 02354 g005b
Figure 6. Comprehensive ecological resistance surface.
Sustainability 17 02354 g006
Figure 7. Ecological corridors and ecological flow channels in Yichang City.
Sustainability 17 02354 g007
Figure 8. Identification of ecological pinch points in the study area.
Sustainability 17 02354 g008
Figure 9. Identification of ecological obstacle points under different search radius.
Sustainability 17 02354 g009
Figure 10. Distribution of ecological obstacles under two modes.
Sustainability 17 02354 g010
Figure 11. Distribution of ecological security patterns in Yichang City.
Sustainability 17 02354 g011
Figure 12. Habitat quality distribution map of Yichang City.
Sustainability 17 02354 g012
Figure 13. Classification and distribution of ecological source communities.
Sustainability 17 02354 g013
Table 1. Ecological significance of each landscape in MSPA.
Landscape TypeEcological Significance
CoreA nature reserve, wildlife habitat, or an important core part of an ecosystem.
IsletOften leads to habitat fragmentation and loss of biodiversity.
PerforationIt is the boundary area between different vegetation types, land-use types, or ecosystem types.
EdgeIt has unique habitat characteristics and also faces influences and pressures from different habitats.
LoopConnected to the core area, the presence of pores may affect biological migration and gene flow.
BridgeProviding pathways for species migration helps maintain biodiversity and ecosystem integrity.
BranchIt often affects biological migration and landscape connectivity, which can have important impacts on ecosystems.
Table 2. Weights and maximum impact distances of threat sources.
Threat FactorsMaximum Impact DistanceWeightRecession Type
Construction land101Index
Arable land60.6Linear
Unused land40.4Linear
Table 3. Sensitivity of each land-use type to threat factors.
Land TypeHabitat SuitabilityThreat Factors
Construction LandArable LandUnused Land
Arable land0.30.800.4
Woodland10.80.60.2
Grassland10.70.50.6
Waters0.90.70.40.4
Unused land0.60.60.40
Construction land0000
Table 4. Ecological corridor attribute information table.
Distance and ScoreFeatureGeneral CorridorImportant CorridorsKey Corridors
Number of corridors1044211
Euclidean distance (m)Mean11,394.561815.31865.82
Maximum75,72111,1411703
Minimum50117226
CWD (m)Mean26,397.794262.172163.63
Maximum141,896.3625,591.844884.06
Minimum89.55930.27986.59
LCPL (m)Mean12,451.352012.62972.82
Maximum82,89612,6071826
Minimum50362362
Flow centrality scoreNatural breakpoint method10.84–98.5798.57–217.11217.11–421.85
Table 5. Ecological community characteristics.
CommunitySource NumberTotal Source AreaTotal Area of the CommunityMean Habitat QualityEcological Safety Level
11, 2, 4, 5, 18, 6, 15, 10, 21, 19, 26548.852806.600.89Higher
223, 3, 7, 13, 8, 9, 12, 17, 14, 16, 11, 25, 22, 30, 35, 32, 281001.044187.910.8 4High
331, 20, 24, 33, 27, 36, 29, 44, 37, 40572.662257.900.85Medium
434, 43, 39, 42, 46, 45, 49, 47166.652300.730.8 7Lower
541, 50, 38, 55, 61, 51, 48, 52, 54, 59, 60, 63, 53, 56, 58, 57, 62, 64950.319646.960.73Low
Disclaimer/Publisher’s Note: The statements, opinions and data contained in all publications are solely those of the individual author(s) and contributor(s) and not of MDPI and/or the editor(s). MDPI and/or the editor(s) disclaim responsibility for any injury to people or property resulting from any ideas, methods, instructions or products referred to in the content.

