Shipping Patterns at the Port of Sines: A Temporal Analysis from 2010 to 2023
Abstract
1. Introduction
2. Materials and Methods
2.1. Bibliometric Analysis
- Research Question Formulation: The bibliometric analysis was framed around the following question: “How does vessel dwell time affect port efficiency?” This provided guidance in the selection of relevant publications and keywords.
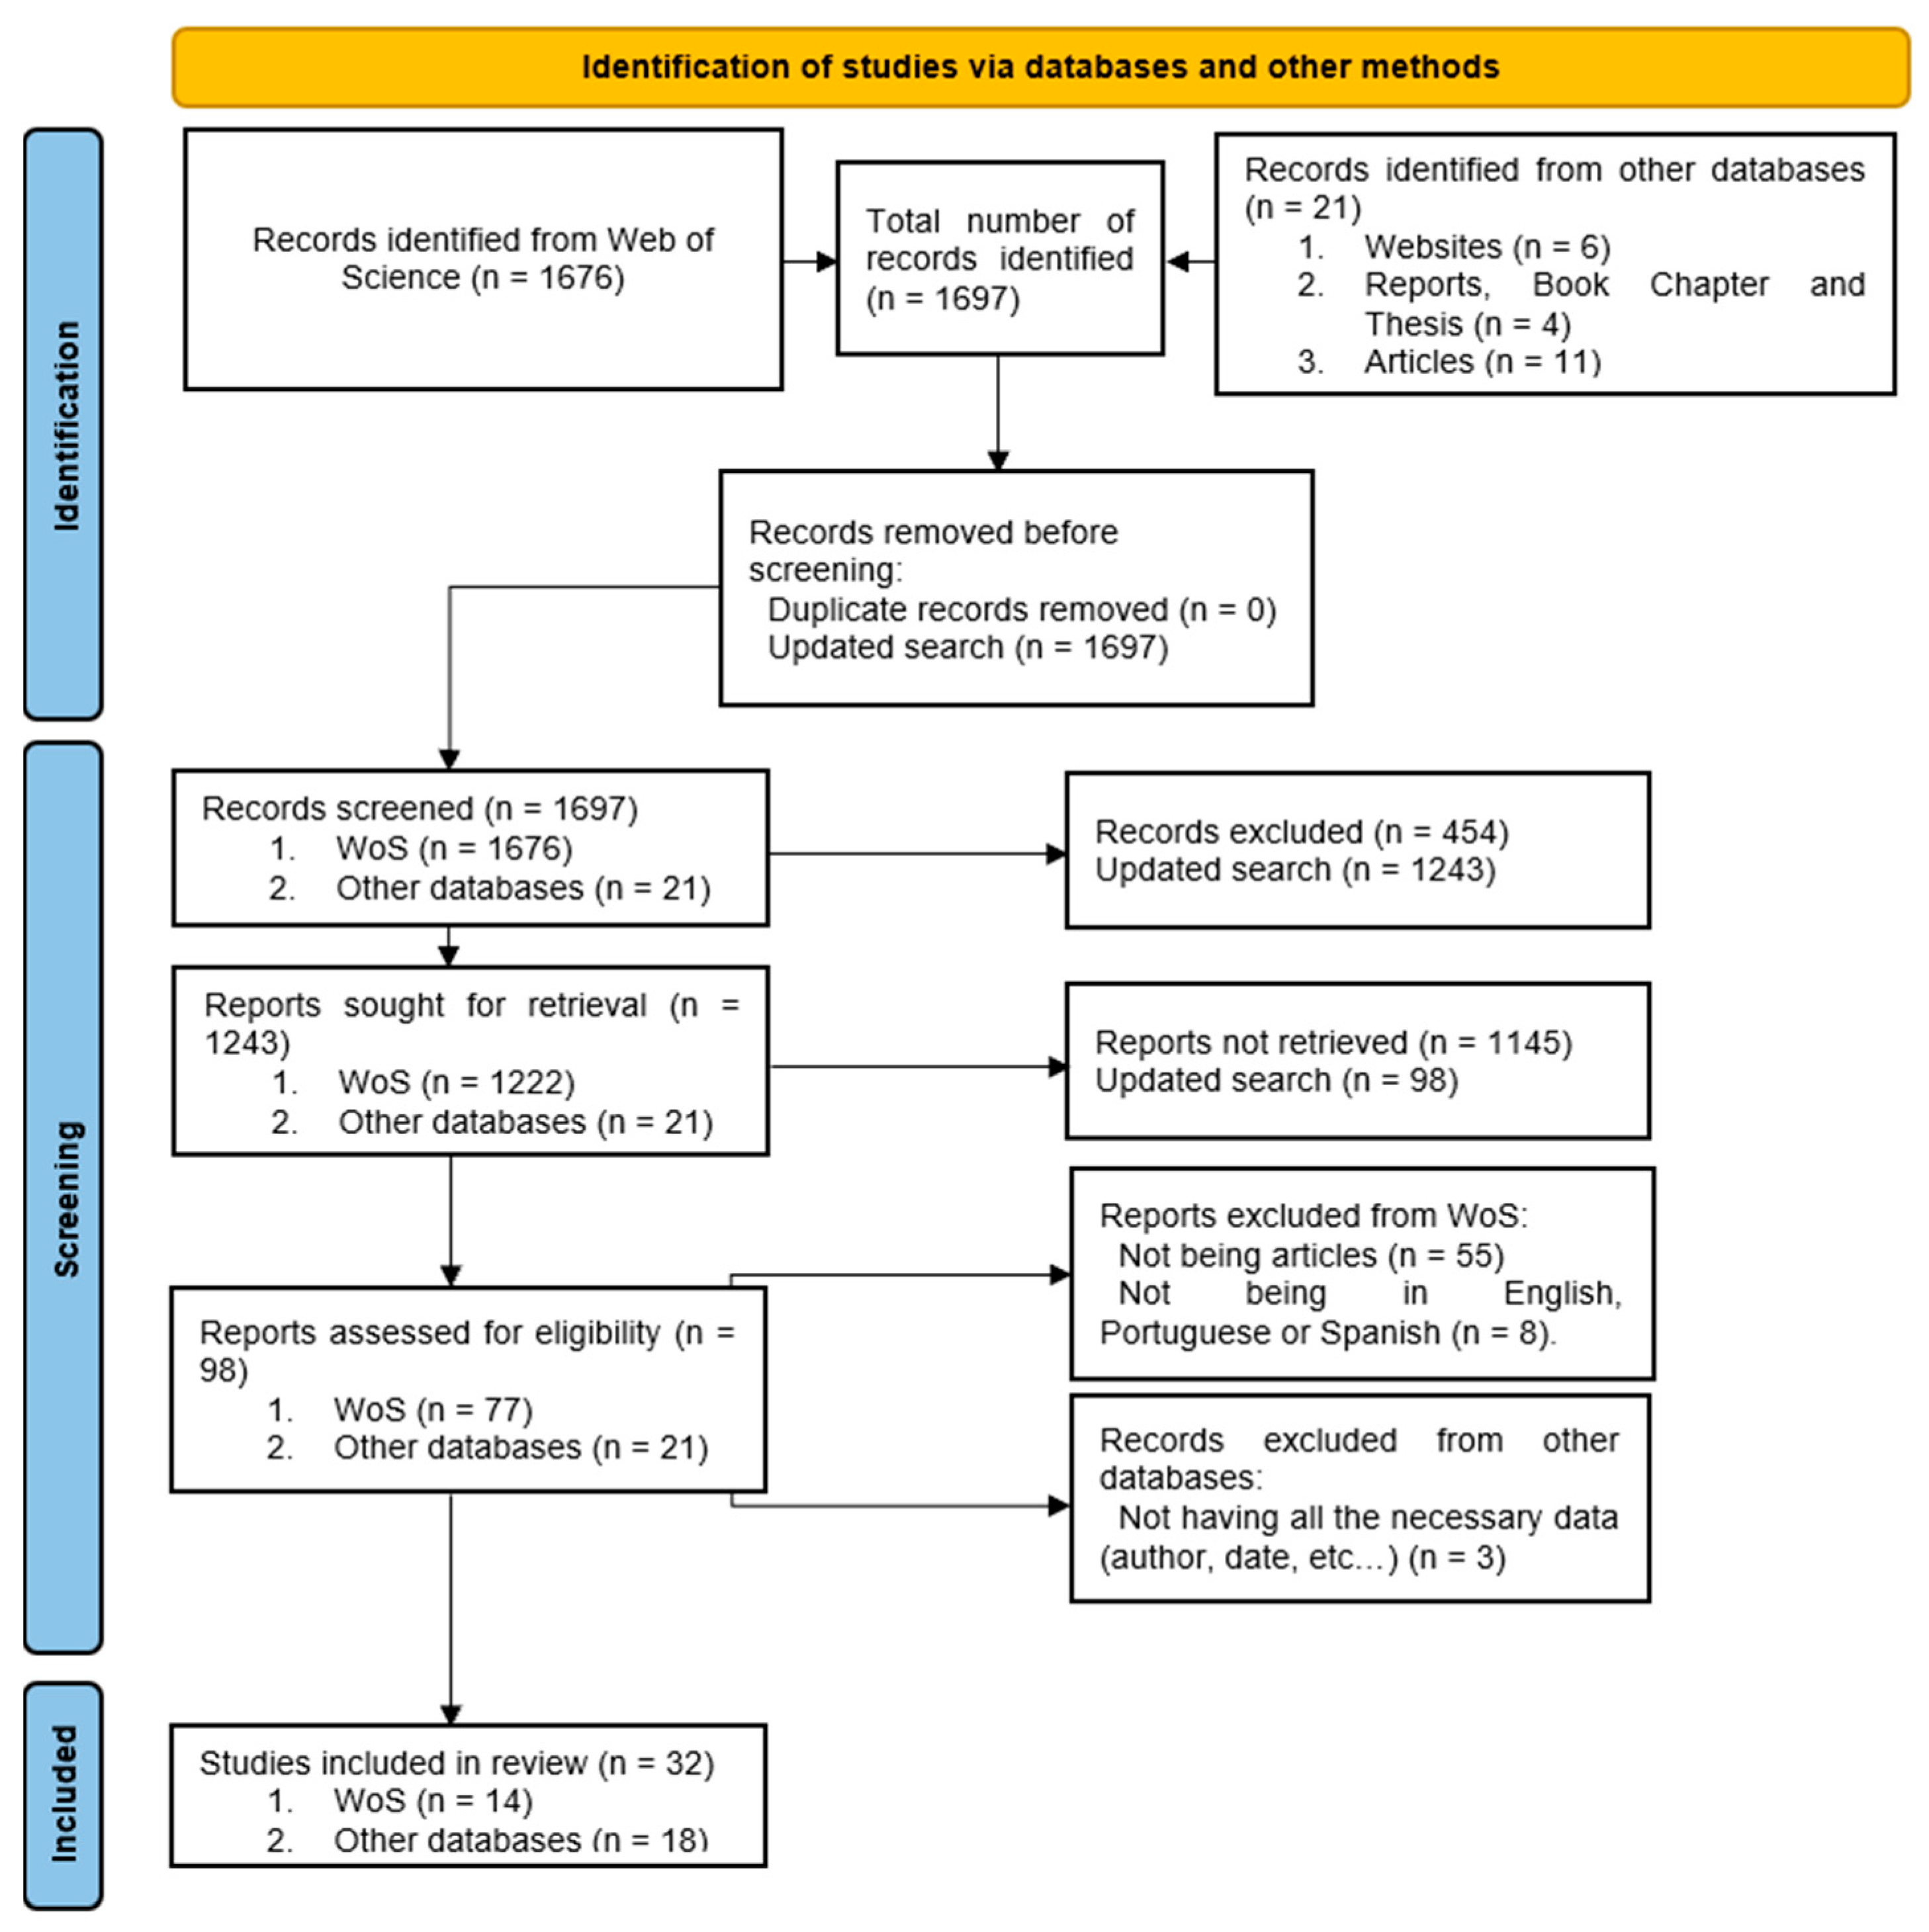
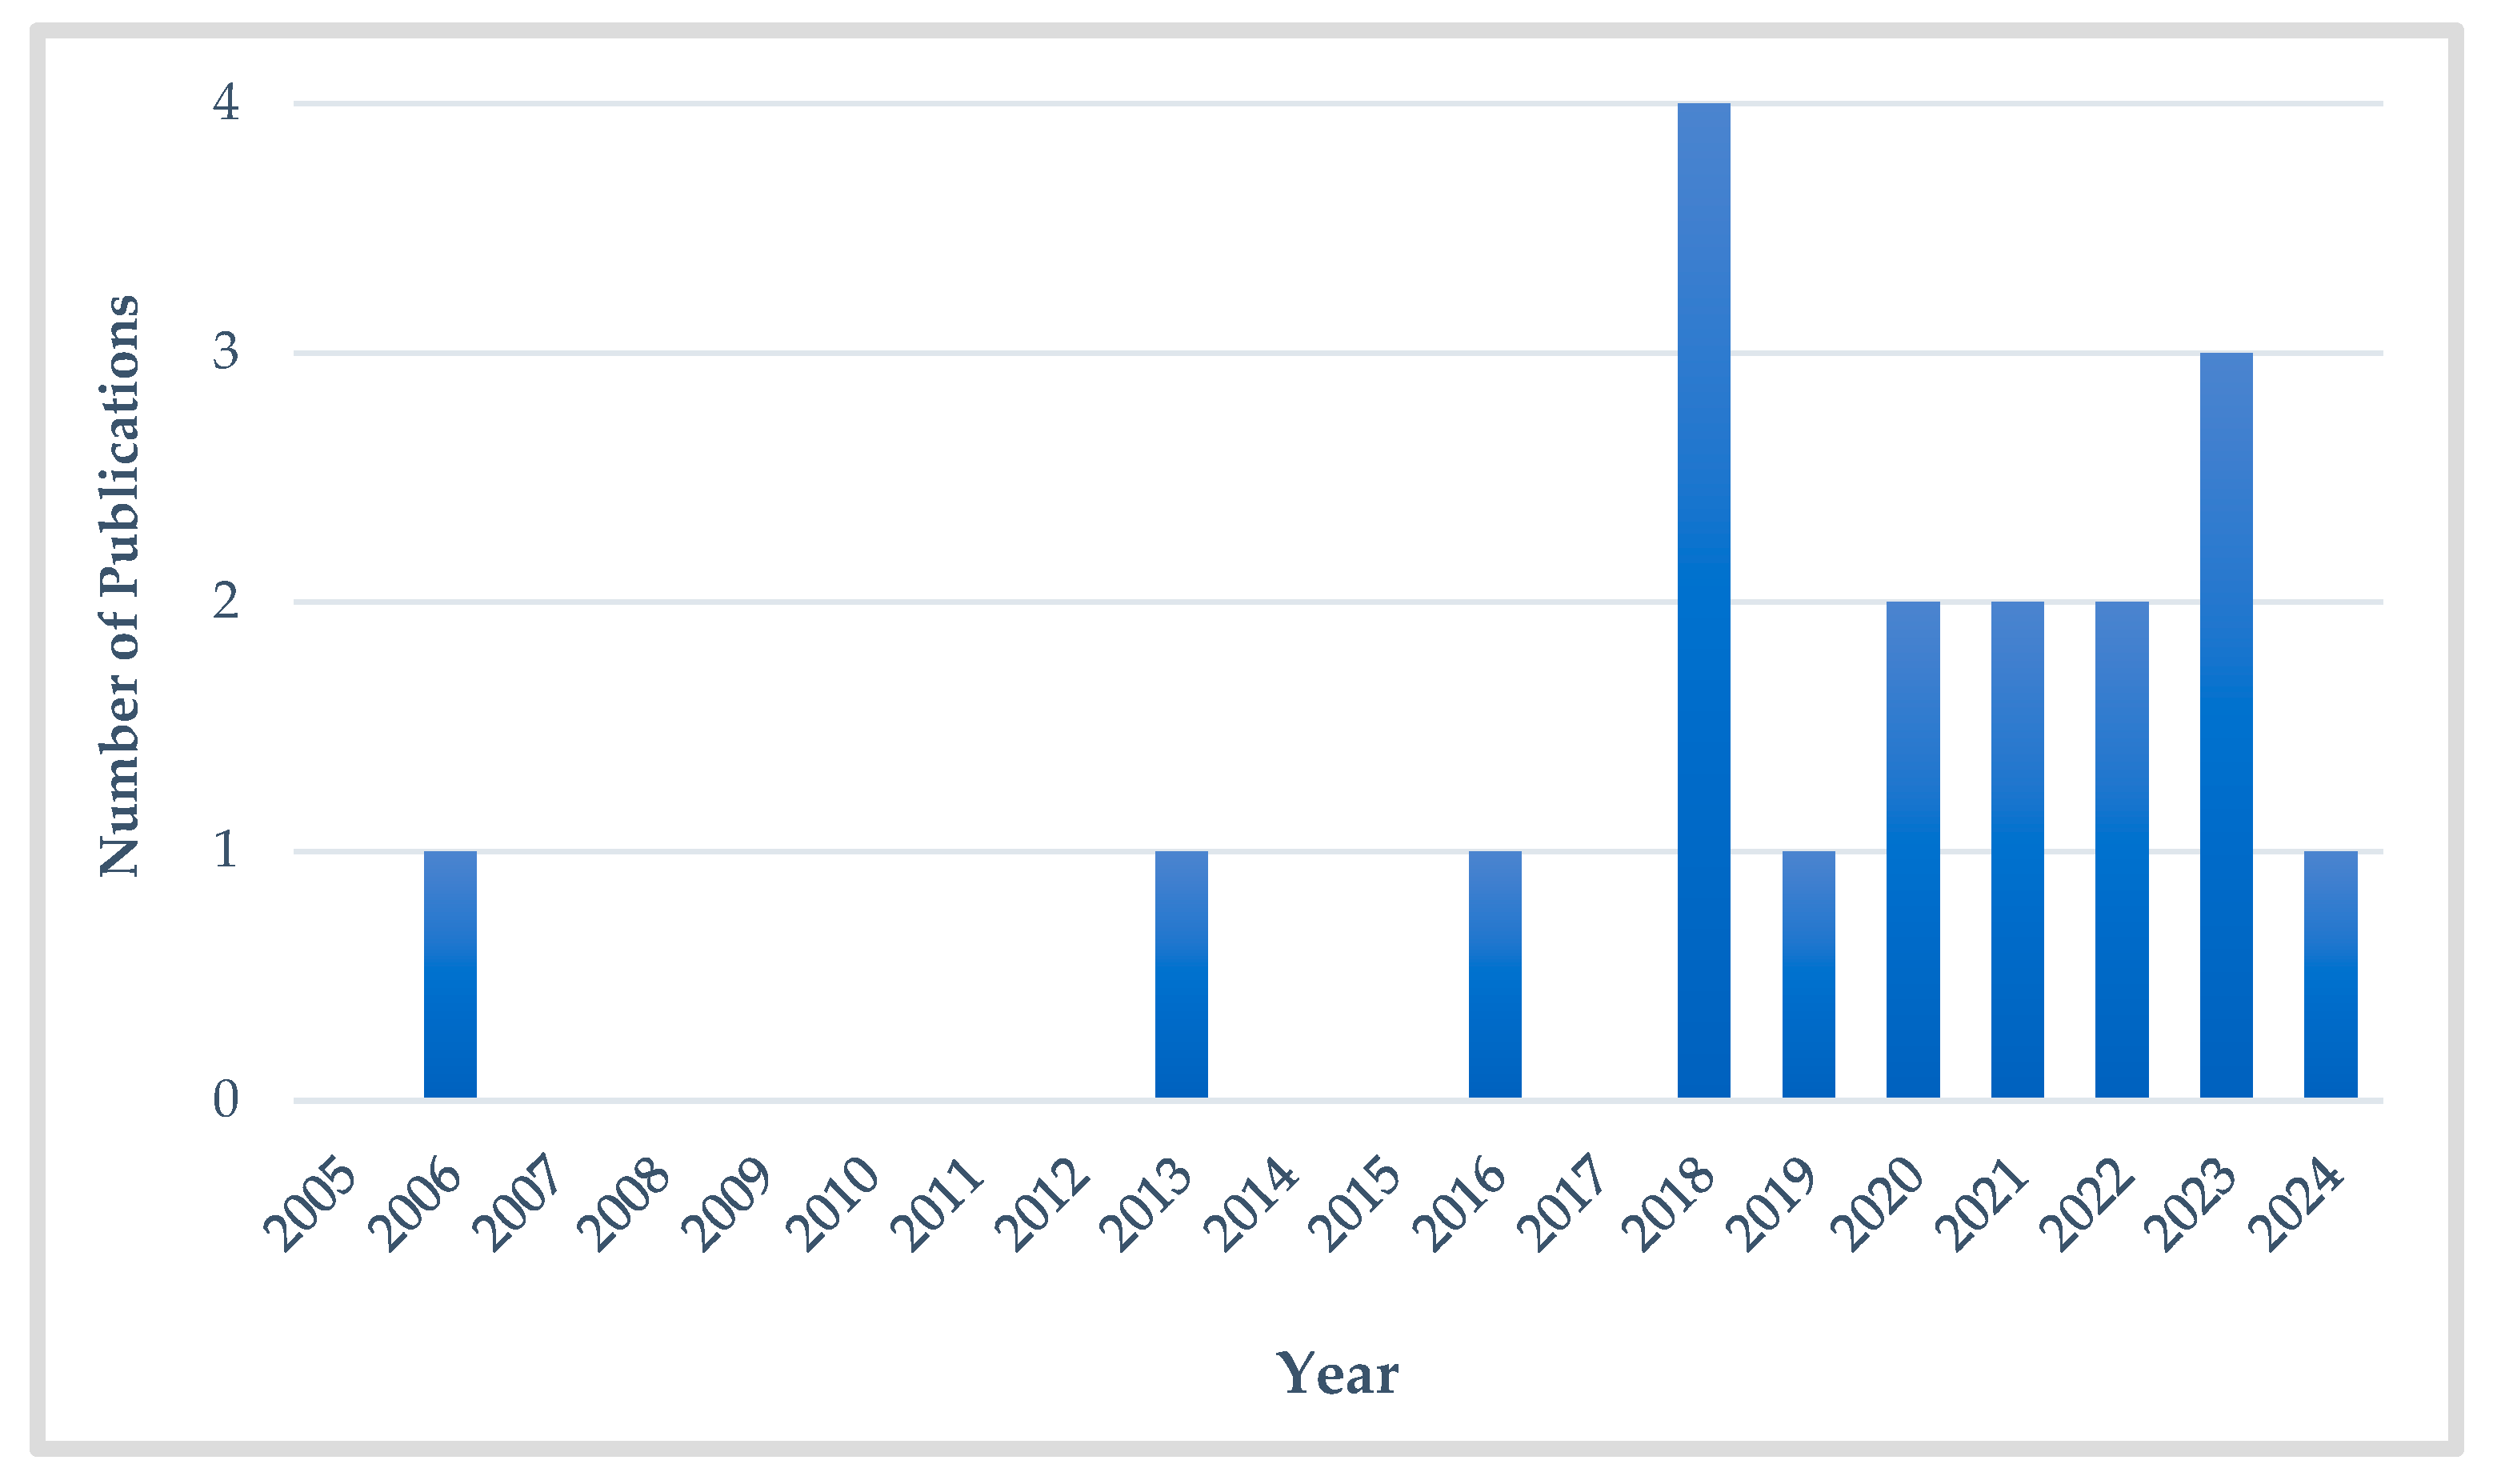
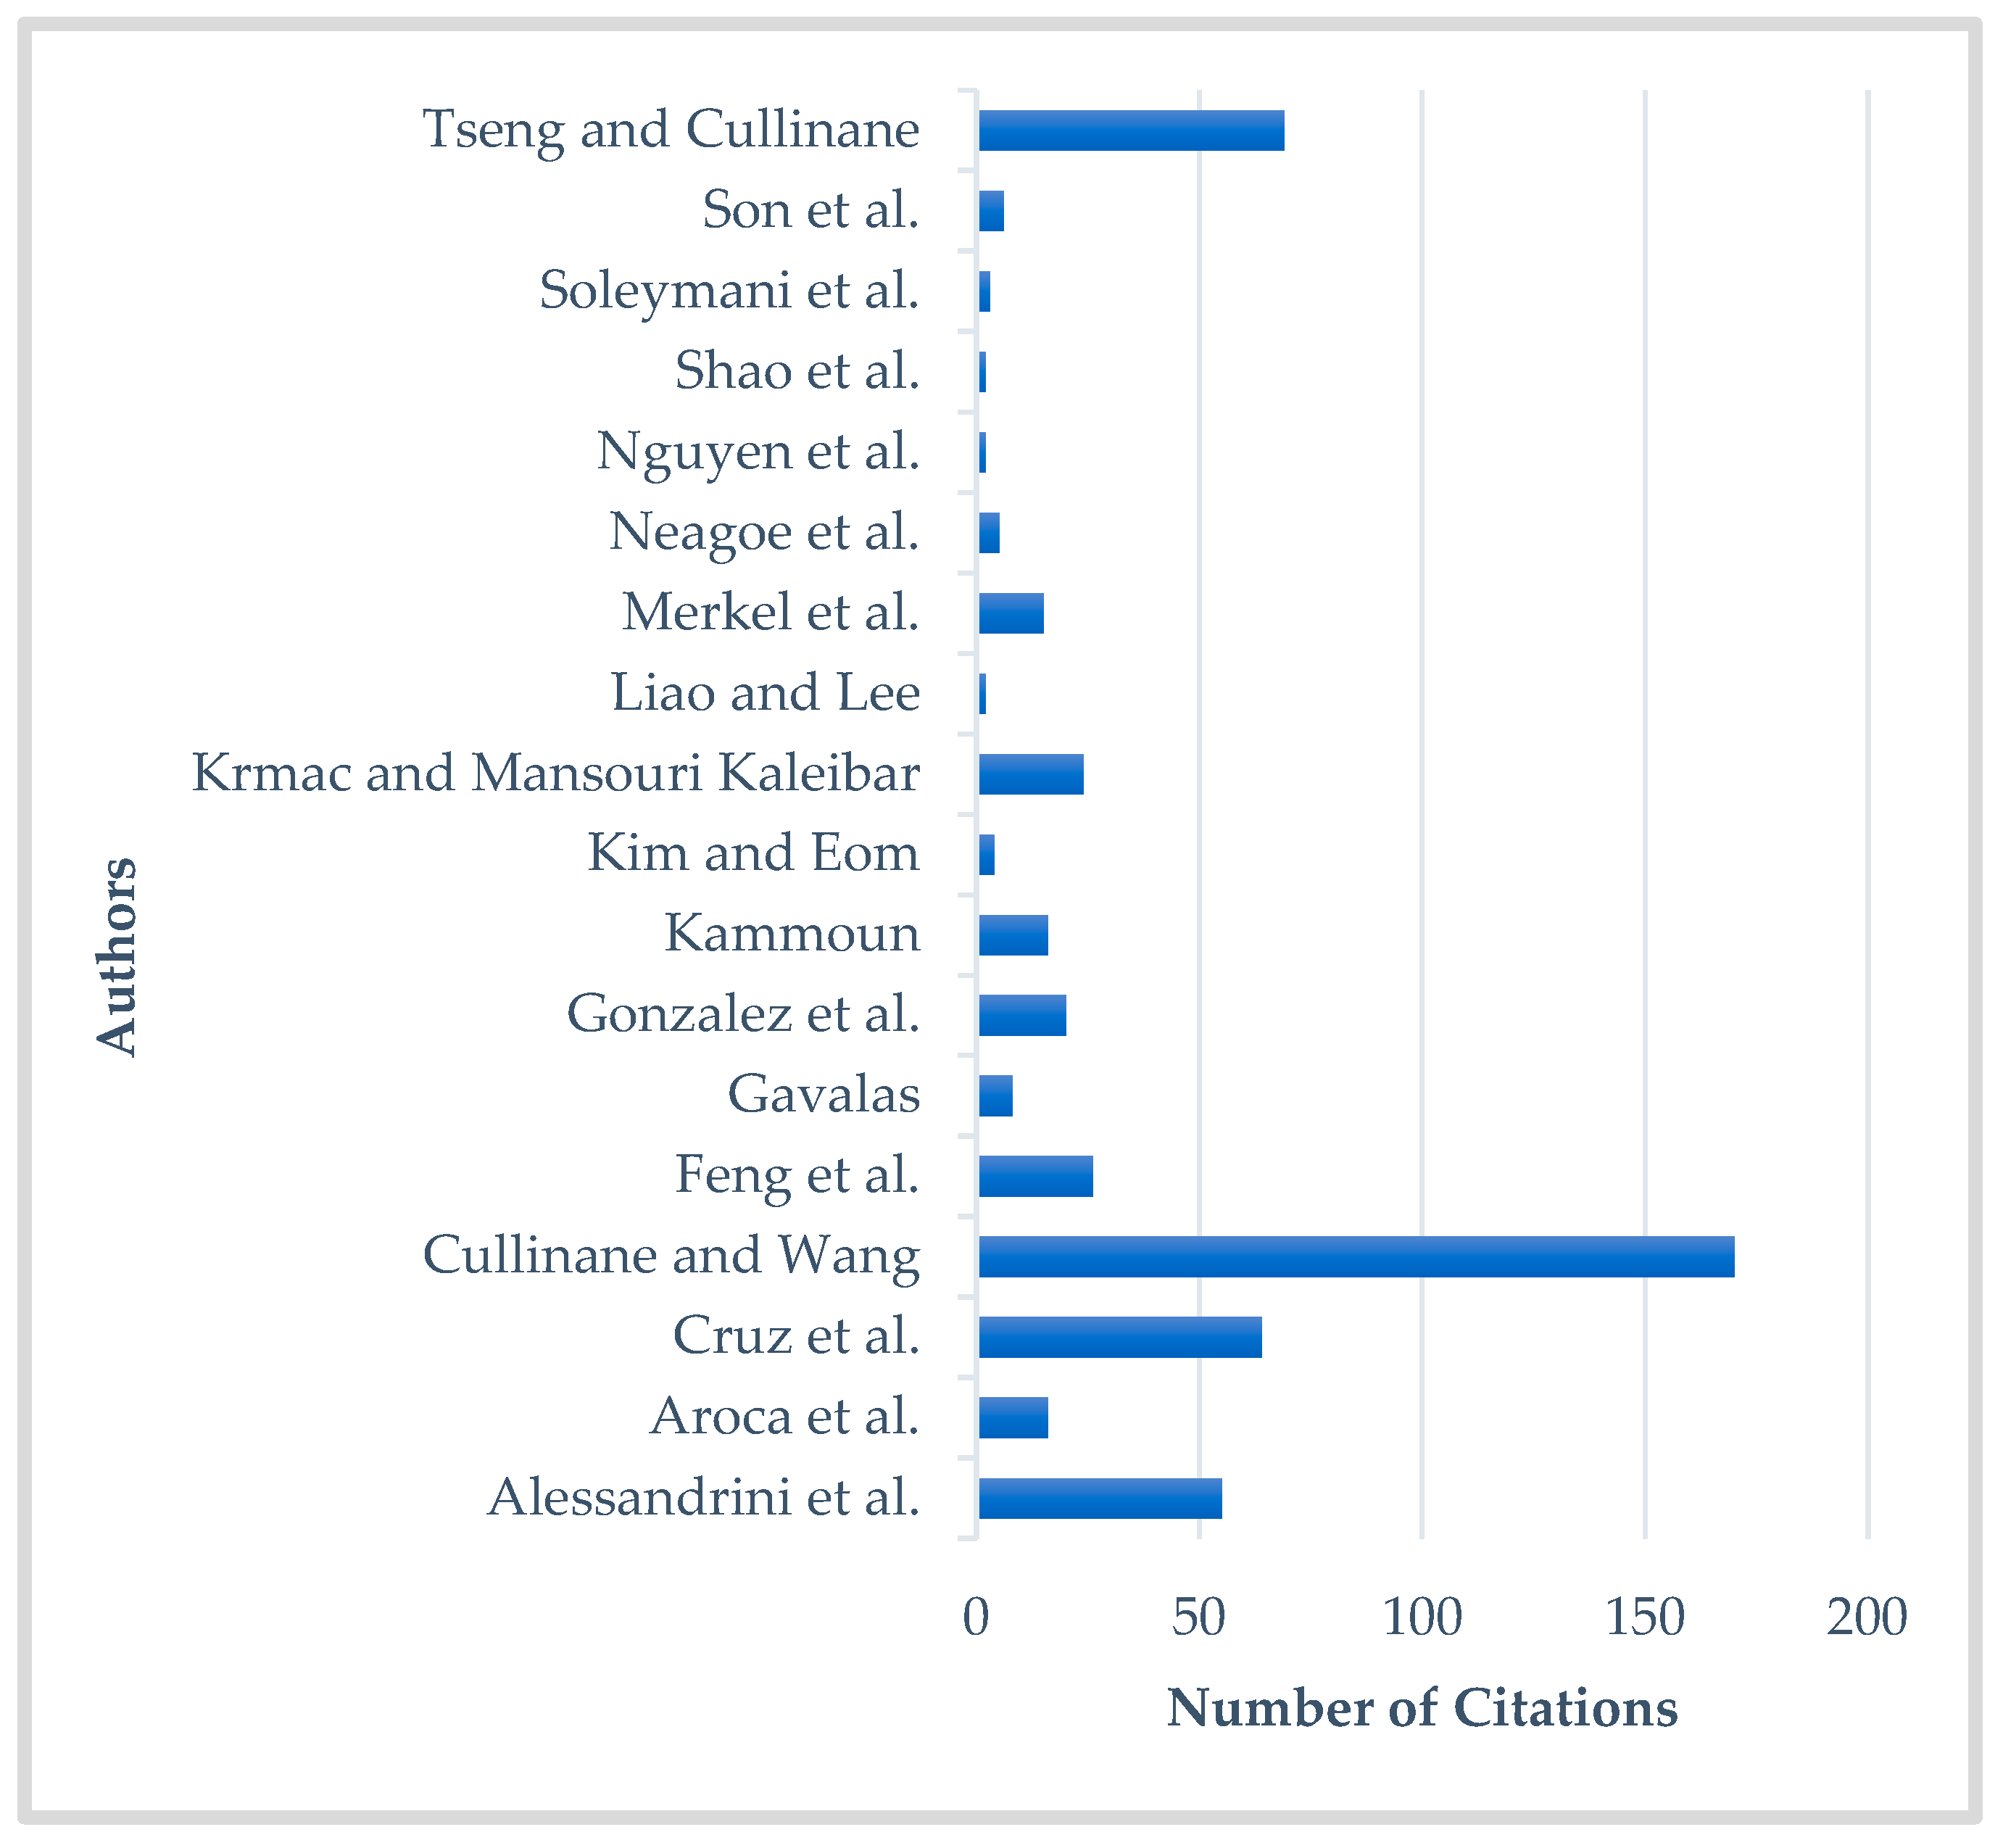
- Data Collection and Keyword Extraction: The search terms “port efficiency”, “port operations”, and “ship time” were entered into the Web of Science (WoS) database, resulting in the identification of relevant publications. This query yielded a corpus of research publications central to the topic.
- Keyword Co-Occurrence Analysis: VOSviewer 1.6.20 software was utilized to analyze keyword co-occurrence, thereby creating a network of terms that frequently appear together. This co-occurrence analysis reveals thematic clusters within the research, highlighting key areas such as port efficiency, emissions, and just-in-time arrival.
- Data Organization: publications that met the inclusion criteria were organized with EndNote software (version 21.3), allowing for the systematic tracking of sources.
2.2. Data Collection, Pre-Processing, and Statistical Analysis of Vessel Dwell Time
- Data Quality Check: the raw data were examined to remove duplicate records, address missing values, and rectify inconsistencies in timestamps.
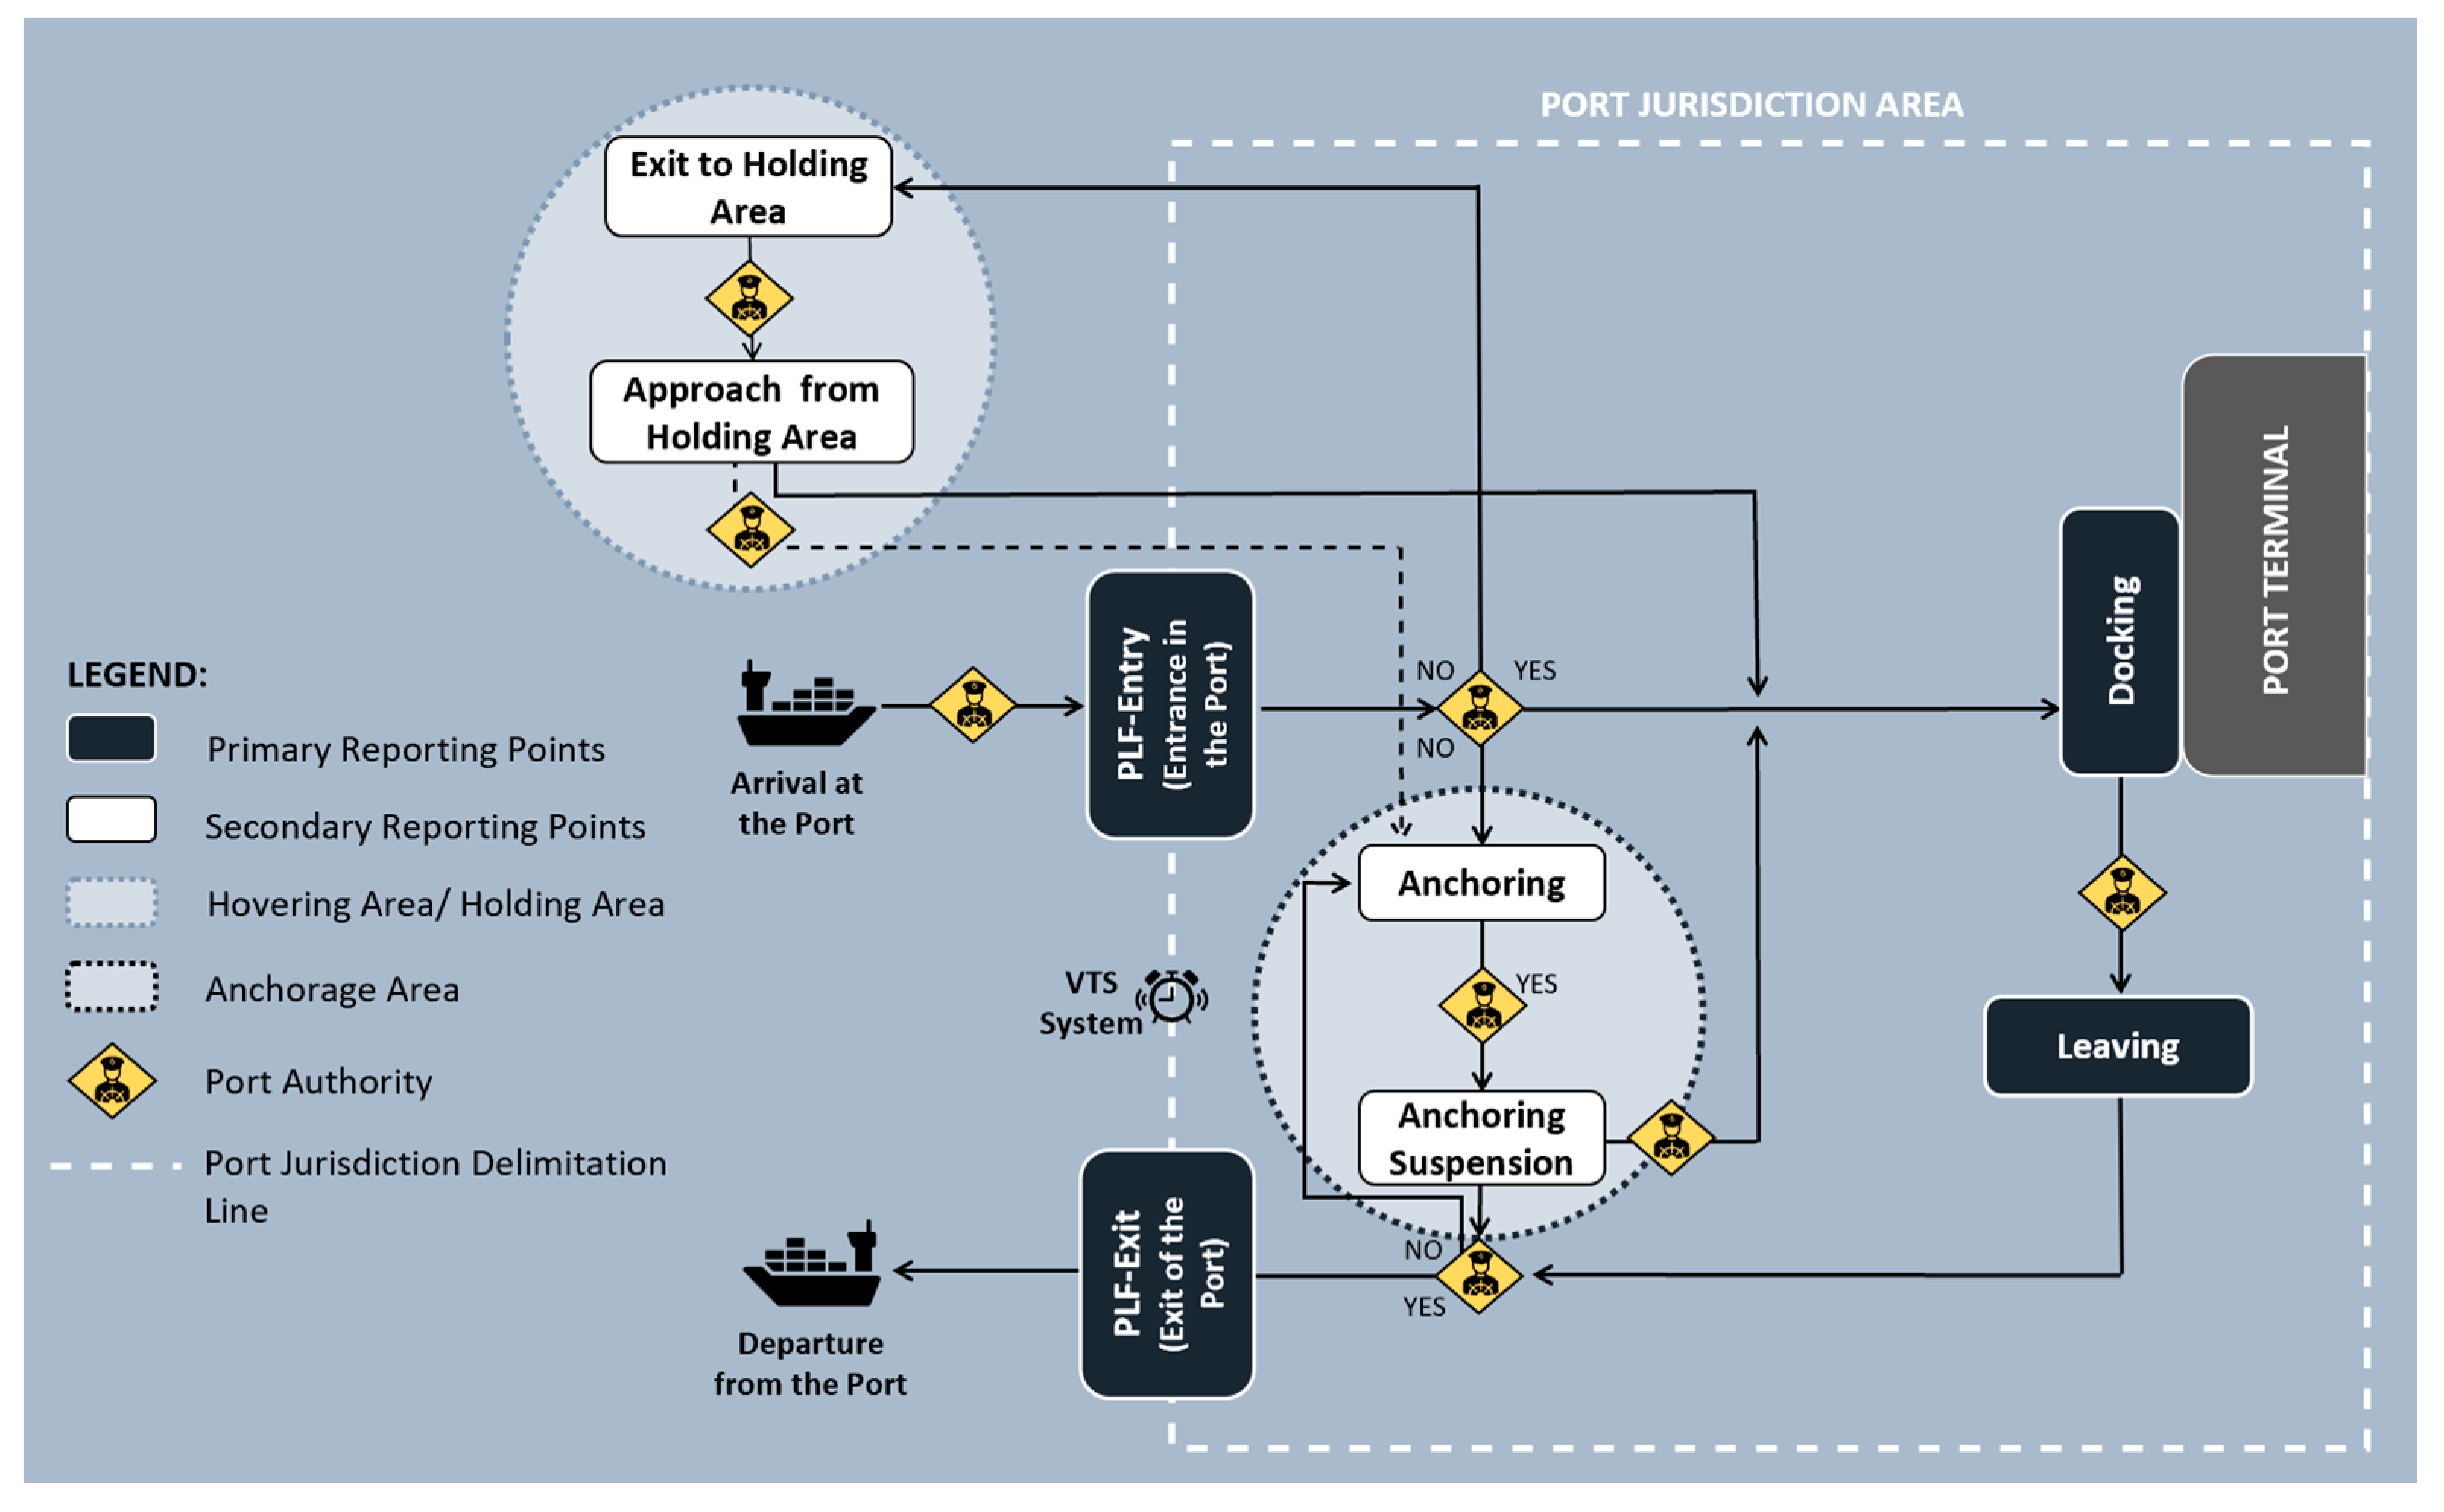
- Categorization of Movements: Vessel movements were categorized into specific stages, including entry into port jurisdiction, anchoring, docking, and exit from port jurisdiction. This categorization enabled a clear understanding of each maneuver’s duration within the port.
- Data Curation: movement records were curated to filter out incomplete records and ensure that only verified data points were included in the analysis.
- Mean Dwell Time Calculation: for each terminal (Liquid Bulk Terminal, Petrochemical Terminal, Multipurpose Terminal, Liquified Natural Gas Terminal, and Container Terminal), the average dwell time was calculated based on vessel turnaround data, allowing for a terminal-specific comparison of time efficiency.
- Maneuver Duration Analysis: Each maneuver was analyzed to determine its average duration, by calculating the time difference between the start date and time of a maneuver and the start date and time of the next maneuver, based on JUP and JUL data. Furthermore, the data were examined to identify changes in operations from 2010 to 2023.
- Anchoring Analysis: given the established correlation between anchoring and dwell time, a focused analysis was conducted on anchorage patterns, particularly at the Liquid Bulk Terminal, where the majority of anchoring events occurred.
- Outlier Analysis: the outliers for each terminal were analyzed to assess both their quantitative impact on the results and their overall frequency.
3. Results and Discussion
3.1. Bibliometric Analysis Results
3.2. Statistical Analysis of Vessel Dwell Time Results
4. Conclusions
Author Contributions
Funding
Institutional Review Board Statement
Informed Consent Statement
Data Availability Statement
Acknowledgments
Conflicts of Interest
References
- Rodrigue, J.P.; Notteboom, T. Chapter 1.1—Maritime Shipping and International Trade. In Port Economics, Management and Policy; Rodrigue, J.P., Notteboom, T., Eds.; Routledge: New York, NY, USA, 2021; Available online: https://porteconomicsmanagement.org/pemp/contents/part1/maritime-shipping-and-international-trade/ (accessed on 28 May 2024).
- Gonzalez, O.; Koivisto, H.; Mustonen, J.; Keinänen-Toivola, M. Digitalization in just-in-time approach as a sustainable solution for maritime logistics in the Baltic Sea Region. Sustainability 2021, 13, 1173. [Google Scholar] [CrossRef]
- Shao, T.; Wu, D.; Ye, Y.; Li, H.; Dong, G.; Liu, G.; Zheng, P. A Novel Virtual Arrival Optimization Method for Traffic Organization Scenarios. Sustainability 2024, 16, 403. [Google Scholar] [CrossRef]
- Pallis, A.; Rodrigue, J.P. Chapter 6.2—Port Efficiency. In Port Economics, Management and Policy, 1st ed.; Routledge: London, UK, 2022; pp. 424–437. [Google Scholar] [CrossRef]
- Son, J.; Kim, D.-H.; Yun, S.-W.; Kim, H.-J.; Kim, S. The Development of Regional Vessel Traffic Congestion Forecasts Using Hybrid Data from an Automatic Identification System and a Port Management Information System. J. Mar. Sci. Eng. 2022, 10, 1956. [Google Scholar] [CrossRef]
- Kim, S.; Eom, G. Ship Carbon Intensity Indicator Assessment via Just-in-Time Arrival Algorithm Based on Real-Time Data: Case Study of Pusan New International Port. Sustainability 2023, 15, 13875. [Google Scholar] [CrossRef]
- Neagoe, M.; Hvolby, H.-H.; Turner, P. Why are we still queuing? Exploring landside congestion factors in Australian bulk cargo port terminals. Marit. Transp. Res. 2021, 2, 100036. [Google Scholar] [CrossRef]
- UNCTAD. Review of Maritime Transport 2019. 2020. Available online: https://unctad.org/system/files/official-document/rmt2019ch3_en.pdf (accessed on 28 May 2024).
- Aroca, J.; Maldonado, J.; Clari, G.; García, N.; Calabria, L.; Lara, J. Enabling a green just-in-time navigation through stakeholder collaboration. Eur. Transp. Res. 2020, 12, 22. [Google Scholar] [CrossRef]
- GEF-UNDP-IMO; GloMEEP Project; GIA. Just-in-Time Arrival Guide—Barriers and Potential Solutions. 2020. Available online: https://portcalloptimization.org/images/JIT%20Guide%20Final.pdf (accessed on 28 March 2024).
- Merkel, A.; Kalantari, J.; Mubder, A. Port call optimization and CO2-emissions savings—Estimating feasible potential in tramp shipping. Marit. Transp. Res. 2022, 3, 100054. [Google Scholar] [CrossRef]
- Nguyen, S.; Leman, A.; Xiao, Z.; Fu, X.; Zhang, X.; Wei, X.; Zhang, W.; Li, N. Blockchain-Powered Incentive System for JIT Arrival Operations and Decarbonization in Maritime Shipping. Sustainability 2023, 15, 15686. [Google Scholar] [CrossRef]
- Cullinane, K.; Wang, T. Data Envelopment Analysis (DEA) and Improving Container Port Efficiency. Res. Transp. Econ. 2006, 17, 1. [Google Scholar] [CrossRef]
- Krmac, E.; Mansouri Kaleibar, M. A comprehensive review of data envelopment analysis (DEA) methodology in port efficiency evaluation. Marit. Econ. Logis. 2023, 25, 3. [Google Scholar] [CrossRef]
- Gavalas, D. Shipping Firms’ Efficiency Evaluation through Stochastic Frontier Analysis. Mod. Econ. 2016, 7, 8. [Google Scholar] [CrossRef][Green Version]
- Kammoun, R. The Technical Efficiency of Tunisian Ports: Comparing Data Envelopment Analysis and Stochastic Frontier Analysis Scores. Logist. Sustain. Transp. 2018, 9, 2. [Google Scholar] [CrossRef]
- Soleymani, A.; Sharifi, S.M.H.; Edalat, P.; Sharifi, S.M.M.; Zadeh, S.K. Linear Modeling of Marine Vessels Fuel Consumption for Ration of Subsidized Fuel. Int. J. Marit. Technol. (IJMT) 2018, 10, 7–13. [Google Scholar] [CrossRef]
- Rosa Pires da Cruz, M.; Ferreira, J.; Garrido Azevedo, S. Key factors of seaport competitiveness based on the stakeholder perspective: An Analytic Hierarchy Process (AHP) model. Marit. Econ. Logis. 2013, 15, 4. [Google Scholar] [CrossRef]
- Tseng, P.-H.; Cullinane, K. Key criteria influencing the choice of Arctic shipping: A fuzzy analytic hierarchy process model. Marit. Policy Manag. 2018, 45, 4. [Google Scholar] [CrossRef]
- Liao, Y.-H.; Lee, H.-S. Using a Directional Distance Function to Measure the Environmental Efficiency of International Liner Shipping Companies and Assess Regulatory Impact. Sustainability 2023, 15, 3821. [Google Scholar] [CrossRef]
- Feng, M.; Shaw, S.-L.; Peng, G.; Fang, Z. Time efficiency assessment of ship movements in maritime ports: A case study of two ports based on AIS data. J. Transp. Geogr. 2020, 86, 102741. [Google Scholar] [CrossRef]
- Alessandrini, A.; Mazzarella, F.; Vespe, M. Estimated Time of Arrival Using Historical Vessel Tracking Data. IEEE Trans. Intell. Transp. Syst. 2019, 20, 1. [Google Scholar] [CrossRef]
- NEXUS. Innovation Agenda for the Port, Multimodal and Transport Sector. 2025. Available online: https://nexuslab.pt/ (accessed on 28 January 2025).
- Öztürk, O. Bibliometric Review of Resource Dependence Theory Literature: An Overview. Manage. Rev. Q. 2021, 71, 3. [Google Scholar] [CrossRef]
- Morales-Alarcón, C.H.; Bodero-Poveda, E.; Villa-Yánez, H.M.; Buñay-Guisñan, P.A. Blockchain and Its Application in the Peer Review of Scientific Works: A Systematic Review. Publications 2024, 12, 40. [Google Scholar] [CrossRef]
- PRISMA. PRISMA 2020 Flow Diagram. Available online: https://www.prisma-statement.org/prisma-2020-flow-diagram (accessed on 18 February 2025).
- Page, M.J.; McKenzie, J.E.; Bossuyt, P.M.; Boutron, I.; Hoffmann, T.C.; Mulrow, C.D.; Shamseer, L.; Tetzlaff, J.M.; Akl, E.A.; Brennan, S.E.; et al. The PRISMA 2020 statement: An updated guideline for re-porting systematic reviews. BMJ 2021, 372, n71. [Google Scholar] [CrossRef] [PubMed]
- UNC Library. PRISMA: Systematic Reviews & Meta-Analyses. 2025. Available online: https://guides.lib.unc.edu/prisma (accessed on 28 January 2025).
- Hoaglin, D.C.; Iglewicz, B.; Tukey, J.W. Performance of Some Resistant Rules for Outlier Labeling. J. Am. Stat. Assoc. 1986, 81, 396. [Google Scholar] [CrossRef]
- Koren, O.; Koren, M.; Peretz, O. A Procedure for Anomaly Detection and Analysis. Eng. Appl. Artif. Intell. 2023, 117, 105503. [Google Scholar] [CrossRef]
- Ship Technology Global. Digitally Controlling Port Arrivals: Timing Is Everything. 2021. Available online: https://ship.nridigital.com/ship_sep21/digital_automated_port_arrivals (accessed on 3 January 2025).



| Glossary—Analysis of Ship Movement Data | |
|---|---|
| PLF—Entry | Entry of the vessel into the maritime port’s jurisdiction area. |
| Anchoring | Anchoring of the vessel in the anchorage areas. |
| Exit to Holding Area | Leaving the port area to wait for docking. |
| Approach from Holding Area | Entry into the port area to dock after hovering. |
| Anchoring Suspension | Weighing of the anchor for departure in order to dock. |
| Docking | Docking of the vessel into the terminal and cargo loading/unloading. |
| Leaving | Departure of the vessel from the terminal. |
| PLF—Exit | Exit of the vessel from the port’s maritime jurisdiction area. |
| Terminal | Total Number of Port Calls (Total) | Average Number of Port Calls (per Year) | Average Dwell Time (in Days) | Average Anchoring Time Consumption (in Days) | Maximum Vessel Dwell Time (in Days) | Average Docking Time Consumption (in Days) | Percentage of Vessels That Anchor (%) |
|---|---|---|---|---|---|---|---|
| Liquid Bulk Terminal | 10,473 | 748 | 0.59 | 0.19 | 11.85 | 0.38 | 60 |
| Petrochemical Terminal | 1811 | 129 | 0.55 | 0.18 | 16.67 | 0.35 | 46 |
| Multipurpose Terminal | 3101 | 222 | 1.08 | 0.35 | 349.17 | 0.69 | 20 |
| Liquified Natural Gas Terminal | 649 | 46 | 0.60 | 0.19 | 8.53 | 0.38 | 11 |
| Container Terminal | 13,533 | 967 | 0.38 | 0.12 | 598.83 | 0.24 | 18 |
| Port Total | 29,567 | 2112 | 0.55 | 0.18 | 598.83 | 0.35 | 38 |
| Terminal | Maximum Vessel Dwell Time Without Outliers | Average Dwell Time Without Outliers | Number of Port Calls (Outliers) | Percentage of Outliers |
|---|---|---|---|---|
| Liquid Bulk Terminal | 2.80 | 0.53 | 628 | 6 |
| Petrochemical Terminal | 3.10 | 0.44 | 163 | 9 |
| Multipurpose Terminal | 6.30 | 0.49 | 801 | 26 |
| Liquified Natural Gas Terminal | 1.42 | 0.53 | 25 | 4 |
| Container Terminal | 1.61 | 0.28 | 1267 | 9 |
| Port Total | 6.30 | 0.45 | 2884 | 10 |
| Country | Number of Port Calls | Liquid Bulk | Dry Bulk | Containers | Break Bulk | Liquified Natural Gas | Liquified Petroleum Gas | Average |
|---|---|---|---|---|---|---|---|---|
| Japan | 180,400 | 0.31 | 0.90 | 0.35 | 1.12 | 0.99 | 0.32 | 0.67 |
| USA | 72,485 | 1.64 | 1.84 | 1.00 | 1.79 | 1.28 | 2.03 | 1.60 |
| Singapore | 60,712 | 0.60 | 0.12 | 0.77 | 0.65 | 2.22 | 1.12 | 0.91 |
| Norway | 49,339 | 0.61 | 0.87 | 0.33 | 0.34 | 0.32 | 0.75 | 0.54 |
| Turkey | 47,488 | 1.11 | 4.00 | 0.63 | 1.52 | 1.31 | 1.36 | 1.66 |
| Brazil | 27,546 | 1.74 | 2.67 | 0.81 | 2.45 | 2.94 | 1.66 | 2.05 |
| Canada | 27,225 | 1.12 | 0.32 | 1.49 | 0.28 | - | - | 0.80 |
| Sines | 2042 | 0.59 | 1.08 | 0.38 | 1.08 | 0.60 | 0.55 | 0.55 |
| Total | 1,884,818 | 0.94 | 2.05 | 0.70 | 1.11 | 1.11 | 1.02 | 1.16 |
Disclaimer/Publisher’s Note: The statements, opinions and data contained in all publications are solely those of the individual author(s) and contributor(s) and not of MDPI and/or the editor(s). MDPI and/or the editor(s) disclaim responsibility for any injury to people or property resulting from any ideas, methods, instructions or products referred to in the content. |
© 2025 by the authors. Licensee MDPI, Basel, Switzerland. This article is an open access article distributed under the terms and conditions of the Creative Commons Attribution (CC BY) license (https://creativecommons.org/licenses/by/4.0/).
Share and Cite
Batista, T.; Rosa, L.; Borges, F.A.; Isbaex, C.; Martins, S. Shipping Patterns at the Port of Sines: A Temporal Analysis from 2010 to 2023. Sustainability 2025, 17, 2344. https://doi.org/10.3390/su17062344
Batista T, Rosa L, Borges FA, Isbaex C, Martins S. Shipping Patterns at the Port of Sines: A Temporal Analysis from 2010 to 2023. Sustainability. 2025; 17(6):2344. https://doi.org/10.3390/su17062344
Chicago/Turabian StyleBatista, Teresa, Luís Rosa, Francisco António Borges, Crismeire Isbaex, and Samuel Martins. 2025. "Shipping Patterns at the Port of Sines: A Temporal Analysis from 2010 to 2023" Sustainability 17, no. 6: 2344. https://doi.org/10.3390/su17062344
APA StyleBatista, T., Rosa, L., Borges, F. A., Isbaex, C., & Martins, S. (2025). Shipping Patterns at the Port of Sines: A Temporal Analysis from 2010 to 2023. Sustainability, 17(6), 2344. https://doi.org/10.3390/su17062344


