Abstract
With a focus on reducing building energy consumption, approaches that simultaneously optimize multiple passive design parameters in industrial buildings have received limited attention. Most existing studies tend to examine building geometry or individual design parameters under limited scenarios, underscoring the potential benefits of adopting a comprehensive, multiparameter approach that integrates climate-responsive and sustainable design strategies. This study bridges that gap by systematically optimizing key passive design parameters—building geometry, orientation, window-to-wall ratio (WWR), and glazing type—to minimize energy loads and enhance sustainability across five distinct climate zones. Fifteen different building geometries with equal floor areas and volumes were analyzed, considering fifteen glazing types and multiple orientations varying by 30° increments. DesignBuilder simulations yielded 16,900 results, and due to the inherent challenges in directly optimizing building geometry within simulation environments, the data were restructured to reveal underlying relationships. An Energy Performance Optimization Model, based on a Particle Swarm Optimization (PSO) algorithm integrated with an Artificial Neural Network (ANN), was developed to identify optimal design solutions tailored to specific climatic conditions. The optimization results successfully determined the optimal combinations of building geometry, orientation, WWR, and glazing type to reduce heating and cooling loads, thereby promoting energy efficiency and reducing carbon emissions in industrial buildings. This study offers a practical design solution set and provides architects with actionable recommendations during the early design phase, establishing a machine learning-based framework for achieving sustainable, energy-efficient, and climate-responsive industrial building designs.
1. Introduction
Today, the rapid rise in global energy consumption has led to significant environmental and economic challenges, including the depletion of fossil fuels and the exacerbation of global warming [1,2,3]. Buildings constitute a major share of total energy use—up to one-third globally and account for approximately 39% of energy-related carbon emissions [4,5]. Heating, cooling, water heating, lighting, and cooking are particularly energy-intensive [5,6] with heating and cooling alone consuming around 38% of the energy used in buildings [6]. Many researchers, driven by the global climate agenda, are thus focusing on projects aimed at reducing building energy consumption [7]. Improving energy efficiency in buildings has been widely recognized as an effective strategy to mitigate climate change by curbing both energy use and greenhouse gas emissions. In Turkey, primary energy consumption grew by 36% between 2005 and 2014 and by 85.6% from 2000 to 2020 [1,8,9,10]. Parallel to these increases, the final energy consumption in the building sector rose by 91%, from 19.5 MTEP (million tonnes of oil equivalent) in 2000 to 37.2 MTEP in 2015, ultimately surpassing the industrial sector’s share of electricity use after 2015 [1]. By 2021, Turkey’s total final energy consumption reached 123,859 Mtoe, of which roughly 30% was used in buildings [11], including 36% of total natural gas consumption [12] and 48.49% of electricity consumption [11]. Given that buildings are responsible for around 37% of global energy-induced CO2 emissions [5], Turkey’s rate similarly stands at approximately 37%. To address these challenges, Turkey has implemented various regulations. The TSE 825 Regulation on Thermal Insulation Rules in Buildings, enacted in 2008 and updated in 2013, mandates energy-efficient designs to reduce building energy use and carbon emissions [13]. The Regulation on Energy Performance in Buildings (BEP-TR), in force since 2009, likewise requires minimizing heating, cooling, ventilation, and lighting needs during the design process [14]. In 2023, Turkey submitted its first updated Nationally Determined Contribution to the UNFCCC Secretariat, pledging to reduce greenhouse gas emissions by 41% by 2030, compared to the baseline scenario [10]. The updated contribution includes strategies for constructing high-efficiency buildings and increasing renewable energy use [6,10]. Such efforts are crucial for meeting climate targets, particularly given the expansion of industrial zones, which often occupy the largest areas in urban contexts after residential zones [15]. The existing literature highlights a range of sustainability measures in industrial and commercial settings, from utilizing waste heat for residential heating [16] to performing life cycle and cost analyses [17,18] and adopting renewable energy systems [19,20].
In order to create sustainable environments in cities, it is important and necessary to carry out studies to reduce energy demand in the design of industrial areas. Reducing the energy demand in industrial zones in cities will contribute significantly to energy conservation [21]. Industrial buildings that make up industrial zones consist of many design variables, like all other building types. In some definitions, design variables in terms of building energy performance are defined as the elements of the building that are allowed to be changed during the optimization process to reach the optimum solution [22,23]. Climate is the main factor to be considered in terms of building energy performance [24,25]. Climate characteristics are the main determinant of the heating and cooling energy needs of the building. In addition, building geometry is an important design parameter that should be considered according to climate characteristics [26,27]. Selecting the appropriate building geometry according to different climatic conditions will provide significant improvements in energy performance. In addition, the optimization of shell parameters is a critical aspect of building energy consumption, and research has shown that optimizing the WWR and other parameters can significantly reduce energy consumption and promote sustainable cities [28]. Building performance optimization (BPO) can be applied during the early design stage to refine and enhance design parameters that influence a building’s energy performance. This process helps identify optimal solutions before construction begins, leading to more energy-efficient buildings. Design decisions made at the design stage not only have a significant impact on the esthetics and functionality of the building but are also crucial for building performance [29]. BPO is a method that integrates optimization algorithms and building performance simulation to achieve designs that meet building energy performance targets defined by designers [30]. Given the increasing importance of improving building energy efficiency due to serious environmental and energy concerns and the public’s desire for sustainable living, BPO has been a significant research area in recent years [31]. Grande-Acosta et al. [32] reported that façade optimization in a tropical climate can achieve a 30% reduction in cooling energy consumption. Ahmed et al. [33] used DesignBuilder (DB) software (Version 7.0.2.006) to simulate a typical office building and achieve near-zero energy consumption. Many studies such as these have been carried out and continue to be carried out in this direction. However, the real effects of BPO with the DB simulation method are very limited in terms of guiding the early design decisions of designers. For example, while building mass is directly linked to the overall geometry of a structure, BPO focuses on optimizing specific design variables within the given mass. Instead of altering the fundamental shape or size of the building, BPO allows adjustments to parameters such as material properties, insulation levels, or window-to-wall ratios to improve performance [34]. It is therefore important to develop a new and effective model based on BPO. Starting from the questions of whether the transformation from geometries to numbers will be applicable for early-stage design tasks, and if it will limit the diversity of design results, this study focuses on investigating the optimum building geometry parameters for different climate zones and industrial buildings. The transparent surface properties of the building envelope are also considered as another design parameter. In addition to these, the orientation parameter, which has a significant effect on climate and building energy gains, is also important. In this study, we aimed to optimize design parameters such as optimum building geometry, orientation, WWR, and window properties for industrial buildings according to different climate zones. For this purpose, five different climate zones, fifteen different building geometries, a 10% increased WWR, and fifteen different window types were determined as variable passive design parameters. In addition to these, the buildings were rotated by 30° angles, and the effect of orientation was also considered as a variable. In this study, a method was developed based on the necessity to include the optimum building geometry in the design process by using BPO as a stage with DB software. Initially, optimization simulations were performed using DB software for each of the 15 different building geometries. At this stage, the aim was to obtain energy simulation data for each design parameter to be included in the process. The obtained data were organized for each climate zone and the building geometry was also reconstructed as a design variable by editing the datasets. By evaluating these data with scatter and correlation graphs, it was revealed that there is no linear relationship, and it was concluded that these variables can be related through machine learning. In this context, an Artificial Neural Network (ANN) model was developed to predict the effect of all design parameters on building energy performance with simulation data obtained from BPO results. The Particle Swarm Optimization (PSO) algorithm was used to incorporate this ANN model into the optimization process. This algorithm is a population-based stochastic optimization technique developed by Eberhart and Kennedy in 1995 [35]. The PSO model developed in this study is designed to perform the optimization process using an ANN model that predicts the parameters. The data obtained through this model were analyzed to propose a solution set that includes optimal building geometry, WWR, window glazing properties, and orientation, minimizing heating and cooling loads for five different climate zones. This study presents a machine learning-based framework for optimizing building energy performance in the early design stage. Additionally, it examines the impact of passive design parameters on building energy performance across five different climate types in Turkey and provides improvement suggestions. The findings of this study serve as a valuable resource for guiding decision-making processes in the early design phase, offering essential insights for designers.
2. Literature Background and Workflow Overview
2.1. Literature Review
The geometry of buildings is an important passive design parameter in this study. Firstly, previous studies on building geometry were analyzed. A summary of these studies in terms of investigated building geometries, studied climate zone, building function, and focused energy parameters is given in Table 1.

Table 1.
Summary of the literature review on building geometry.
The literature review on building geometry highlights the valuable contributions of previous studies. However, certain gaps remain, which have motivated this research. Most existing studies focus on residential and office buildings, while industrial buildings, despite occupying large urban areas, have received limited attention in energy performance research. Examining the form and design parameters of industrial buildings is therefore both essential and necessary. Furthermore, this study investigates five distinct climate zones in Turkey. Given Turkey’s diverse climate conditions, it is crucial to explore different building geometries suited to local characteristics. Additionally, numerous studies on building energy performance have been conducted in Turkey. Table 2 summarizes the key aspects of these studies, including the cities where they were conducted, the functional characteristics of the buildings examined, the design parameters analyzed, the primary focus in terms of energy performance, and the methodologies used.
Table 2.
Energy-efficient building design studies in Turkey.
As can be understood from the research, studies on the energy performance of buildings in Turkey have been carried out for a long time and continue to be carried out. Based on the findings of the studies, firstly, the quantitative relationship between urban form and energy and environmental performance has been widely discussed. However, performance-oriented building geometry optimization has not been sufficiently investigated at the early design stage. Secondly, geometry optimization that integrates performance objectives such as energy consumption has not been sufficiently studied. Therefore, there is a need for further studies to fill these gaps. The studies so far have been carried out mainly for buildings with residential functions. The amount of energy used in buildings with different functions should not be ignored. There are deficiencies in the issues related to the optimization of multiple parameters such as building geometry, WWR, orientation, and window type for industrial buildings in the different climatic regions of Turkey. At this point, this study will be unique and qualified in terms of taking the studies one step further by utilizing the previous studies.
2.2. Overview Workflow
This study focuses on minimizing building energy consumption in terms of heating and cooling load in different climatic zones in Turkey and in areas with similar conditions to these climatic zones, and for this purpose, it is based on examining the passive design parameters of buildings such as optimum building geometry, building orientation, WWR, and glazing type for the determined climate types. In this context, the primary aim of this study is to evaluate the impact of passive design parameters—such as optimum building geometry, orientation, window-to-wall ratio (WWR), and glazing type—on the energy performance of industrial buildings in the different climatic zones of Turkey and regions with similar climatic conditions. The goal is to minimize energy consumption related to the heating and cooling loads in these buildings.
Specific Objectives of this Study
- Filling the Gap in the Literature: Existing studies generally focus on a limited climatic context or predefined scenarios constrained by specific parameters. This study aims to address this gap by analyzing the interaction between building form and passive design parameters from a broader perspective across different climatic conditions.
- Providing an Optimization Model for Early Design Phases: Considering the limitations of the traditional trial-and-error approach in the early design phase of buildings, this study aims to develop a machine learning-based multi-objective optimization model to enhance decision-making efficiency.
- Developing Strategies for Industrial Buildings: This study seeks to establish strategies and design guidelines for optimizing the passive design parameters of industrial buildings, ensuring more livable and energy-efficient designs.
- Integration of Optimization Scenarios and Parameters: This study aims to create a roadmap for integrating design variables that cannot be directly defined as parameters in dynamic simulation optimization processes, thereby enhancing the effectiveness of the optimization workflow and improving design accuracy. In line with these objectives, the following steps were applied in this study (Figure 1).
 Figure 1. Workflow diagram of the study.
As can be seen from Figure 1, the methodology used in this study includes various techniques and steps such as DB simulation and optimization, statistical data analysis, the machine learning approach with ANN, and PSO model building. General information about the steps of this study is given below.
- Step 1. In this step, the literature research on the relationship between building geometry and energy performance and building energy performance studies in the determined climate zones has been carried out extensively. At the same time, reference building features were determined, and variable passive design parameters were constructed.
- Step 2. Fifteen different building geometries were modelled in DB dynamic simulation software and multiple simulation data were obtained according to variable design parameters by using the multi-objective optimization feature of the software.
- Step 3. The simulation data obtained for each building geometry were arranged to include the building geometries in the optimization, and the linear relationship between the data was investigated and evaluated. At this stage, the Python-Pandas (Version: Python 3.10 Pandas 2.2.3) library and MATLAB (Version: R2024a) were utilized to create the graphs.
- At this stage, an ANN model that accurately predicts the design parameters according to the input and output parameters for the optimization of the design parameters according to the climate zones was developed, and a PSO code was created using the data of this model in the optimization process. The code was run in MATLAB and the optimization process was performed.
- Step 5. The optimum design parameters that minimize the heating and cooling load for five different climate zones are presented, and evaluations are presented.
In order to increase readability and consistency, this study is divided into several sections. Section 2 presents the literature review and general structure of this study. Section 3 provides the details of the methodology adopted. The application of the proposed framework, the results obtained, and the discussions are presented in Section 4. Finally, Section 5 concludes this study, addresses the limitations, and suggests avenues for further research.
3. Materials and Methods
In order to address the research gaps mentioned in the previous section, this study develops a framework for the ANN-PSO-based optimization model by using machine learning methods. At the same time, this study aims to determine the optimum passive design parameters to minimize the energy performance of industrial buildings in different climatic zones in Turkey. The methodology used in this study includes several steps as shown in Figure 1. In this section, firstly, the climate types in Turkey and the climate zones selected in this study are explained. Subsequently, it is mentioned which design parameters of buildings will be considered for optimum energy performance in buildings and how. Then, the techniques used to obtain optimum passive design parameters in climate zones are mentioned.
3.1. Location and Climate Type
Within the scope of this research, Turkey, which has geographical characteristics where many climate types are experienced together, is being studied. The TSE 825 standard, which was adopted by the Turkish government in 2007 and updated in 2013, has been published. This standard is to limit the amount of energy used in the heating of buildings, to save energy, and to determine the standard calculation method and values to be used when calculating the net heating energy requirement. In this standard, Turkey is divided into five climate zones when determining the climate data used in building energy performance calculations [13]. Although TSE 825 has been criticized for neglecting cooling loads and heat storage capacity [75], it is still a mandatory document that determines the thermal properties of facade materials according to climate zones [76]. In this study, a representative city (Figure 2), namely Antalya, Rize, Malatya, Sivas and Kars, was selected for each climate zone defined by TSE 825.
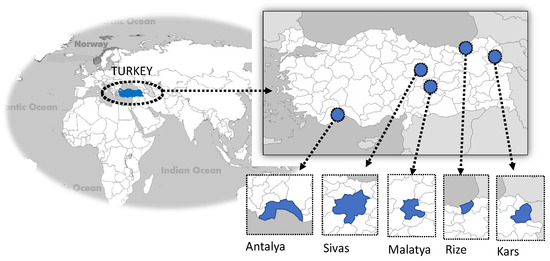
Figure 2.
Map representation of selected cities for different climate zones in Turkey.
In order to describe the climatic characteristics of these selected cities, the abbreviation CT was used as the abbreviation of ‘climate type’ for ease of explanation, and Table 3 shows the abbreviations according to climate types. In addition, the definitions of the climatic characteristics of these selected cities according to different climate classifications accepted as universal climate classification are given in Table 3.
Table 3.
Evaluation of the investigated climate types according to different climate categories.
The climate values of the provinces show differences according to all accepted classifications. Although some of the provinces are close and neighbouring to each other, they show very different climatic characteristics. The climate values of the provinces according to different climate classifications are given in Table 4.
Table 4.
Climate values of the investigated climate types according to different climate categories.
There is a temperature difference of 21.3 degrees Celsius between winter temperature averages among the selected provinces, while there is a temperature difference of 10.6 degrees Celsius between summer temperature values. This difference is important and should be taken into consideration in the design process. From these data, it is understood that the determined climate types differ in terms of temperature averages and other climatic characteristics.
3.2. Case Study and Input Parameters/Variable Design Parameters and Ranges
This study focuses on optimizing passive design parameters to minimize energy consumption in industrial buildings. To ensure a clearer analysis for five different climate zones, the building model has been simplified, preserving only the essential elements. The thermo-physical properties of the building elements used in this model are presented in Table 5.
Table 5.
Thermo-physical properties of basic building structural elements.
The U-values presented in Table 5 have been simplified to facilitate the computational process by reducing the complexity of the material layers assigned to the building envelope. The selected wall type represents a common construction method composed of plaster, brick, and plaster layers, which results in the given U-value. Since the thermal properties of the building envelope materials are not the primary focus of this study, a simplified approach was adopted to minimize computational complexity. For this reason, a base wall structure was defined with a composition of 19.5 cm of brick, 3 cm of EPS insulation, and 2 cm of plaster. A similar simplification method was applied to the ground and roof slabs to ensure consistency in calculations. Although the U-values obtained appear to differ from the standard values, this approach was chosen to avoid an excessive computational burden while maintaining the integrity of the simulation process.
A single thermal zone is used in the building models created, and this is due to the need to eliminate possible confounding variables. In the DB simulations to be performed, the ‘industrial process area’ was defined as the building template, ‘Indust_ Indprocess_Occ’ as schedule properties, and for metabolic activity, ‘light manual work’ was defined. Occupied density (people/m2): 0.050, Metabolic Factor (Men = 1.00, Women: 0.85, Children = 0.75): 0.90, and metabolic CO2 generation rate (m3/S-W): 0.0000000382 were used in the calculations. In addition, the data given in the table below (Table 6) are taken into consideration for the user clothing characteristics of industrial buildings and space thermal comfort values for buildings.
Table 6.
User and comfort data defined in the basic building model.
Occupied density refers to the number of people present in a specific space during defined time periods and varies depending on the building function and occupied density values that are derived based on schedules. The occupied density values used in this study are based on data from predefined templates available in the DesignBuilder software (Version 7.0.2.006), specifically from the United Kingdom (UK) NCM (National Calculation Method) dataset, ASHRAE 90.1, and ASHRAE 62.1 library templates [77]. The occupancy density value (0.050) used in this study was obtained from the predefined datasets available in the DesignBuilder software, the database under the category ’General Industrial/Special Industrial’. This database provides standardized input values for energy simulations based on industry-accepted norms and regulations. The selected occupancy density value of 0.050 persons/m2 is part of the standard occupancy assumptions for industrial buildings in the dataset. These values define the typical number of occupants per unit floor area for different building types, ensuring consistency in energy modelling across studies. Additionally, the corresponding occupancy schedule settings were used to define how the building is utilized throughout different time periods. The occupancy schedule follows a compact schedule format in DesignBuilder, specifying operational patterns for the following: Weekdays (summer design day): Occupancy starts at 05:00, remains active until 21:00, and is then set to zero for the rest of the night.
Weekends and holidays: The same pattern is followed as in weekdays.
Winter design day and all other days: No occupancy is considered for non-operational periods.
This predefined occupancy schedule reflects typical industrial processes where workers follow shift-based operations rather than continuous 24 h occupancy. The adoption of these values ensures that the simulation aligns with commonly used industrial energy modelling practises and adheres to recognized database standards.
For building geometry optimization, 15 different building geometries were considered based on the fixed dimensions described above. While determining the building geometries, the literature studies made in the previous section were taken into consideration, and the geometries were created by determining general forms and a previously unstudied scope for the determined climate zones. In this study, the abbreviation BG is used for the concept of ‘building geometry’ in order to facilitate the expression. Building geometries and their nomenclature are given in Table 7.
Table 7.
Building geometries considered in this study.
In this study, 15 building geometries were examined, consisting of 5 simple geometric forms, 5 courtyard forms, and 5 segmented forms. As summarized in Table 1, the selection of these 15 building geometries was influenced by the limited number of studies in the literature that systematically analyzed such simple geometric configurations. Additionally, simple geometric, courtyard, and segmented forms are widely utilized in architectural design and frequently appear in various building typologies. Therefore, the selection of these geometries reflects both the dominant trends observed in architectural practice and the need to address gaps identified in previous research, forming the core motivation behind this selection.
For all building geometries, the floor areas and mass indoor volumes of the buildings are equal, and the floor area is 500 (±10) m2 with a floor height of 6 m. These 15 buildings with different geometries were modelled in DB and prepared for energy performance simulations and optimisations. Other variables considered together with these building geometries are the WWR and the orientation of the buildings. The influence of window systems on the design of the building envelope depends on the orientation of the windows, WWR, and weather conditions [78]. Many studies have been carried out on the effect of window design on the thermal load of buildings, taking into account factors such as size, location, material properties, and orientations of openings. As the design of buildings becomes more complex and dynamic, more detailed analyses should be performed on the design factors of openings [79]. Based on this, the building orientation and WWR and window glass properties are considered as design variables. A schematic representation of the consideration of the orientation and WWR parameters is given in Figure 3.
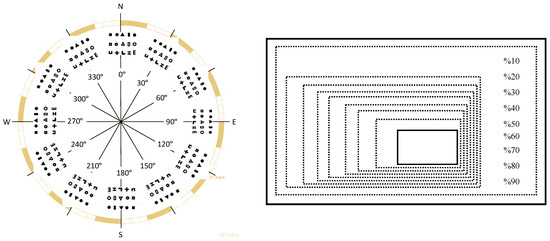
Figure 3.
Diagrammatic representation of orientation and WWR parameters.
As an orientation parameter, the buildings were rotated clockwise by 30° with respect to the north direction and 11 orientation alternatives were created. In determining the orientation parameter, the broad scope of the different climate regions considered in the study was taken into account, and previous studies on orientation were examined. These studies are summarized in Table 2, where the orientation parameter has been analyzed with varying angles in different research. For example, in the study by Ashrafian and Moazzen [62], orientation was evaluated only along the east–west axis, while Koç and Kalfa [66] considered three different scenarios, including east, west, and south orientations. In the study conducted by Acar et al. [70], the orientation parameter was analyzed by varying it between 0° and 180° at 30° intervals. Similarly, Aksoy and İnallı [54] examined the relationship between orientation and solar gains from a broad perspective through computational analyses. In this study, the reason for selecting 30° orientation intervals was to enable a more detailed analysis of the impact of building orientation on energy performance. Unlike most studies in the literature, which typically use only the main cardinal directions (north, south, east, and west), this study defines orientation at 30° increments, allowing for the evaluation of a broader range of orientation options. Additionally, incorporating orientation intervals alongside the other defined parameters facilitates a more comprehensive analysis of the impact of these scenarios on energy performance. Furthermore, as the second phase of this study involves an optimization process that includes building orientation, defining different orientation scenarios has provided a crucial dataset for determining the most energy-efficient orientation. A broader orientation perspective was adopted during the optimization process, enabling a more detailed evaluation of the effects of different orientations on building energy performance. In conclusion, the orientation scenarios used in this study align with the methodologies presented in previous research (Table 2) and aim to establish a comprehensive dataset for the optimization process.
For the WWR, 9 different ratios ranging from 0 to 100% with a range of 10% were used. In this study, the window-to-wall ratio (WWR) was varied in 10% increments to examine its effects on building energy performance. This stepwise approach was used to understand the balance between energy losses caused by an increased glazing area and solar energy gains. The determination of the WWR parameter was based on previous studies conducted in the climatic context presented in Table 2, similar to the orientation parameter. Various scenarios presented in the literature were also considered. For example, Ashrafian and Moazzen [62] analyzed the impact of the WWR values of 30%, 40%, and 50% on energy performance. Similarly, Özer [65] demonstrated that increasing the window-to-wall ratio directly affects both heat gains and heat losses, with a strong correlation to glazing properties. Accordingly, the WWR selection process in this study took into account not only window area but also glazing properties. To establish a comprehensive dataset for the optimization phase, the WWR was increased in 10% increments (e.g., 10%, 20%, 30%, … 90%) to compare the effects of different WWR values on building energy consumption. This approach not only facilitates the determination of the optimal window-to-wall ratio during the optimization process but also provides an opportunity to explore the relationship between glazing area and building energy performance in greater detail.
The properties of the glass used in the windows were also considered as a design parameter. The properties of the window glasses and the values considered in the calculations are given in Table 8 below.
Table 8.
Names of the selected window types and calculation values.
This study considers single, double, and triple glazing configurations, along with low emissivity (Low-E) and reflective glass types, to enhance diversity and provide a broad perspective. Within this scope, 15 different glass types with varying Solar Heat Gain Coefficients (SHGCs) and U-values (W/m2K) were analyzed. The selected glass types are detailed in Table X and include a range of glazing options with varying insulation properties, from low to high. The SHGC values range between 0.1 and 0.9, while the U-values of the glass types vary from 0.78 to 5.89 W/m2K.
This diversity allows for a comprehensive evaluation of the impact of different glass types on building energy performance. The inclusion of this wide range of glass types in simulation scenarios enables a more detailed analysis of the thermal performance of glazing options. Additionally, the extensive dataset obtained in this study establishes a solid foundation for the subsequent optimization process. As a result, the advantages and disadvantages of different glazing options in terms of energy efficiency can be identified, leading to a more comprehensive assessment of the optimal window glazing selection.
3.3. Methods Used in the Development of the Optimization Model
After the passive design parameters and parameter ranges of the building to be optimized are determined, modelling, simulation and optimization processes are carried out, respectively. The methods used for these processes are shown schematically below (Figure 4).

Figure 4.
Diagrammatic representation of the methods used in the construction of the optimization model.
In this study, firstly, reference building geometries created in the DesignBuilder (Version 7.0.2.006) software were modelled. Then, the steady-state optimization simulations of these buildings were performed. DB software was used to estimate and quantify the energy requirements of the buildings. DB can be used to obtain highly reliable building simulation datasets, and the software is based on the Energy-Plus dynamic building energy simulation. Dynamic simulation tools such as EnergyPlus provide reliable results, as noted by, but the accuracy of input parameters can be prone to errors. To address this issue, the Building Energy Simulation Test serves as a comparative diagnostic procedure for the ASHRAE (American Society of Heating, Refrigerating and Air-Conditioning Engineers). The test confirms that the DesignBuilder software has a highly accurate diagnostic method [28]. In addition, in order to test the accuracy of DesignBuilder simulation in the Liu et al. study, the parameter values of the building model were entered into the software for simulation, and the simulation data obtained were compared with the actual building data obtained according to the energy consumption bill. As a result of the comparisons, the results of the building simulations using DB were found to be accurate and reliable [80]. Another reason for choosing DB is its ability to use multi-objective optimization algorithms [23,81,82,83]. During the optimization process of the building, the software performed many simulations, and these simulation data were obtained from the program. Since it is a long and difficult process to simulate the energy performance of the buildings modelled in this software according to the variable design parameters, the optimization feature of the DB software was used. The optimization process used in this study was carried out by running EnergyPlus simulations in multiple iterations within the DesignBuilder (DB) software [84]. DesignBuilder employs the Non-Dominated Sorting Genetic Algorithm II (NSGA-II) optimization method for parameter-based building performance optimization (BPO) processes. The optimization function, commonly referred to as the fitness function or objective function, is computed through simulation tools. One of the most commonly used methods in multi-objective optimization is Pareto optimization [85]. Pareto optimization enables the determination of optimal solution sets for specific objectives [86]. In recent years, this method has been widely applied in studies on building energy performance [87,88,89,90,91]. Therefore, in this study, the NSGA-II optimization method was chosen to conduct multiple simulations and obtain data. This feature is suitable for automatically obtaining optimal or near-optimal design options of buildings and is more effective than the traditional ‘trial and error’ design method, which relies heavily on the knowledge and experience of designers [92]. Each building geometry was modelled in the DB program and prepared for the optimization of the design parameters for each model. The fixed design parameters given in Section 3.2 are defined for all building models. At this stage, the aim is to perform many simulations during the optimization process of each building model and to obtain data through simulations. Table 9 shows the optimization simulation inputs for buildings’ properties and operation details.
Table 9.
Simulation inputs for buildings’ properties and operation details.
In line with the objectives of this study, the data obtained separately for each building geometry as a result of DB optimization were defined as building geometry input parameters for five different climate types with the help of Microsoft Excel, and the datasets were created. Correlation analyses were performed to evaluate the relationships of the obtained data. Correlation analysis is a statistical method used to discover whether there is a relationship between two variables and how strong this relationship may be, and relationships can be expressed as heat maps. In a correlation heat map, each variable is represented by a row and a column, and the cells show the correlation between them. The colour of each cell represents the strength and direction of the correlation; darker colours indicate stronger correlations [93]. The correlation matrix showing the data relationships was prepared using the Pandas library in Phyton. Non-linearity in data relationships is shown in this figure. In the continuation of this study, it is thought that a model that accurately predicts the data can be developed with the ANN machine learning method used in non-linear data relationships. ANN simulates the functions of biological neural networks using computer and mathematical operations to address complex problems [94,95]. Similarly, to the recognition and prediction functions of the human brain, ANNs collect information, establish a generalized mathematical relationship, and accordingly make a decision about this information using the interactions established between variables [96,97]. Therefore, this method is widely used to develop mathematical models for predicting the behaviour of systems [98,99]. This ANN prediction model was included in the optimization process, and the relationship between the input and output values was taken from this model to construct the optimization. In this study, an optimization model is developed by the PSO method to determine the optimum design parameters that minimize the energy performance of buildings. PSO [100] is inspired by the information circulation and social behaviour observed in flocks of birds and schools of fish and is a global optimization algorithm that is particularly suitable for solving problems where the optimum solution is a point in the multidimensional space of the parameter [101]. The PSO method is initialized with a group of random particles and then searches for an optimum by updating generations. In each generation, each particle is updated with the following two best values [102,103]. The steps of the model to be developed using the ANN method of the PSO algorithm in the MATLAB (Version: R2024a) software are as follows:
- Setting PSO parameters;
- ANN training and usage;
- Determination of fitness function (objective function);
- Optimization of building geometries with PSO.
For the development of the PSO algorithm using the ANN method, the input and output data were determined for each of the five different climate zones for which priorities were determined and the data were organized. In the dataset, the first input is building geometry, the second input is the WWR, the third input is window U-value, and the fourth input is orientation parameter. The dataset is organized as two outputs. The first output is the cooling load, and the second output is the heating load. In the ANN training and utilization step, a network structure with four inputs, two outputs, and ten hidden layers was used. The Levenberg–Marquard backpropagation algorithm was used to develop the ANN model. This algorithm is a standard method for solving non-linear least squares problems. The method developed by Levenberg (1994) and Marquardt (1963) shows an adaptive behaviour according to the solution distance in many cases, so reliable solutions can be obtained [98].
In the rest of this study, the fitness function of PSO is defined, and this function helps PSO to find the best input values in each iteration. The fitness function that PSO will evaluate in this study is to minimize the output values of the optimized inputs. At each optimization step, PSO assigns positions to the particles. At each iteration, PSO applies the optimized input data to the ANN model, and the error between the simulated results and the actual results is calculated. PSO tries to find better input combinations in each iteration by updating the velocity and position of the particles. In the developed PSO model, the number of particles is 30, the number of iterations is 100, the best position coefficient (c1) is 1.5, the global best position coefficient (c2) is 2, and the inertia coefficient (w) is 0.7. The initial positions of the particles were determined as random initial positions. Particle velocities, best local (pBest) and global (gBest) positions, and best scores were defined. The fitness function helps PSO to find the best input values in each iteration. The objective function to be evaluated by PSO is to find the input values (building geometry, WWR, glass type, and orientation) that minimize the heating and cooling load.
4. Results and Discussion
In this section, firstly, the results obtained as a result of DB optimization simulations are explained. After that, the classification of the arrangement of the data as a result of DB and the examination of their relationships are given. Then, the creation and testing processes of the ANN-PSO model are mentioned. Finally, the optimum design parameters obtained from the ANN-PSO model are presented and interpreted.
4.1. Building Optimization Simulations in DB Program
This section analyzes the findings obtained from multiple simulations performed using DesignBuilder’s NSGA-II feature. Within the scope of this study, the variables defined in Section 3.2 were assigned to each building geometry, and then variable passive design parameters were set in DesignBuilder, followed by the execution of optimization simulations. Baseline simulations for each building geometry were carried out using EnergyPlus (Version: 24.2.0), integrated with DesignBuilder. This study aimed to develop solutions for five different climate types. Accordingly, the climate types defined in Section 3.1 were accurately integrated into DesignBuilder. The climate data files for the relevant cities were obtained in “.epw” format and used in the simulations conducted within DesignBuilder. After defining the climate properties in the software, the optimization settings described in Section 3.3 were configured. Since passive design parameters and variable ranges affecting building energy performance required a large series of simulations, the optimization feature of DesignBuilder was used in this study. Each building geometry was modelled separately, NSGA-II optimizations were conducted individually, and different datasets were obtained for each geometry.
The convergence/completion generations for each building geometry are given in the table below (Table 10).
Table 10.
Iteration condition of DB optimization simulations.
As a result of the optimisations performed through the DB program, the optimisations for each building form were finished, and at the end of the process, a Pareto facade containing the optimum design solutions for each building was obtained. The results for some samples (BG-1, 2, 3) from these data are given in the table below (Table 11).
Table 11.
Results of DB optimization simulations for BG-1, 2, 3.
The graph on the left and the data below it in Table 11 contain the evaluation of the data as a result of the optimization performed for the first building type. For this building geometry, a Pareto front with 50 design solutions was obtained. According to the results of the optimum design solutions for the first building type, minimum cooling: 10% WWR for CT-5, and it is seen in GT-5. Min. Heating: 90% WWR for CT-1 is observed in GT-1. And min. heating–cooling total: 10% WWR for the CT-4 and GT-5 glass types. Among these, the best performance of the heating–cooling load total was shown by GT-5, 10% WWR, and the non-rotated version of the building, i.e., the 0-degree angle version. Among the optimal design solutions, combinations with 90% WWR for CT-1, 60% for CT-2, 40% for CT-4, and 20% for CT-5 were found. The graphs in the centre and the graphs on the right and the information below them in Table 11 contain solutions for the second and third building geometries and can be interpreted in a similar way. The properties are similar for the other 12 building geometries. The data obtained at this stage can provide the best solutions for fixed building geometry cases. However, these results are not meaningful for geometry optimization. With these data, the best design solutions for each climate type cannot be reached and building geometry cannot be included in the optimization process. The data obtained during the DB optimization process performed at this stage were analyzed in the next stage and the relationship between them was investigated.
4.2. DB Investigation and Analysis of Data as a Result of Optimization Simulations
Since the aim of this study was to obtain the optimum passive design parameters for five different climate types, the data for each climate type were separated and organized. In the dataset created for the CT-1 climate type, a dataset containing 4237 design combinations and results was created. In this dataset, building geometry, WWR, glass type, orientation data, and heating and cooling load values obtained from DB are included. The scatter plots and correlation matrices (Figure 5a,b) of these data were created and analyzed.
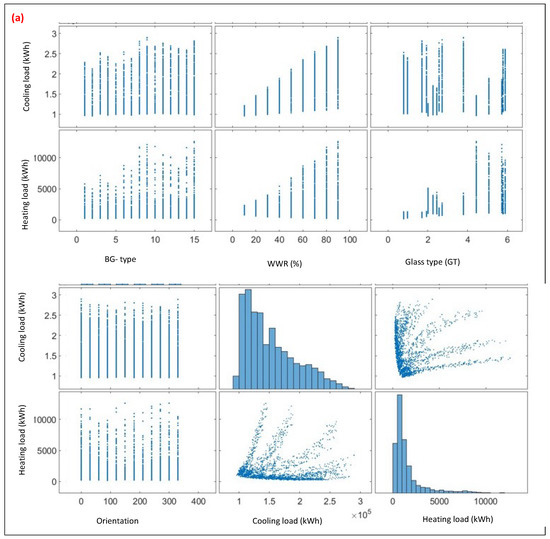

Figure 5.
(a). Scatter plot of data for CT-1 (b). Correlation matrix of data for CT-1.
Figure 5a presents the scatter plot of the CT-1 dataset, illustrating the distribution and relationships between variables. The histograms along the diagonal represent the individual distributions of each variable, while the off-diagonal scatter plots depict the relationships between variable pairs. A strong positive trend is observed between the WWR and both heating load and cooling load. However, the relationships among other variables appear more complex, without a clear linear trend. To gain deeper insights into these relationships, further analysis is required. Therefore, a correlation analysis was conducted, as shown, to better understand the interdependencies among the variables.
The correlation matrix of the dataset is given in Figure 5b and was created to provide a statistical overview of the dataset. With this matrix, the Pearson correlation coefficient between variables was calculated. The colour of each cell in the correlation heat map represents the strength and direction of the correlation [93]. The correlation value varies between −1 and +1. A value of −1 indicates perfect negative correlation, +1 indicates perfect positive correlation, and 0 indicates no correlation between variables [104]. As the correlation coefficient approaches zero in both directions, the strength of the relationship decreases, and as it approaches one, it increases [105]. The strength of the relationship in general is as follows: 0.00–0.19 means no relationship or a negligible relationship, 0.20–0.39 means a weak relationship, 0.40–0.69 means a moderate relationship, 0.70–0.89 means a strong relationship, and 0.90–1.00 means a very strong relationship [106,107]. In the correlation matrix graph, it is concluded that the WWR and cooling load are strongly correlated (R = 0.80), and heating load and glazing type data are moderately correlated (66%). R values show the linear correlation between the variables. It was important to observe that in-depth research is required to establish significant relationships between certain parameters. For example, heating load does not have a very strong linear relationship with all the variables because the R values reach a maximum of 0.66. These analyses were carried out for the other four climate types, and similar results were obtained. Considering the fact that the WWR and the glazing material affect the amount of heating load, it is concluded that more in-depth data can be analyzed, and accurate results can be obtained by establishing non-linear relationships.
4.3. Development of ANN-PSO Model That Minimizes Building Energy Performance for Optimum Passive Design Parameters
Building geometry cannot be included as an optimization design parameter in the DB optimization process. In addition, the relationships of the data obtained as a result of DB optimization were compared by creating a correlation matrix and a relationship matrix in the previous section, and it was revealed that a relationship cannot be established between them in this way. Therefore, the ANN model was used to train the data samples obtained as a result of DB optimization simulation, and PSO was used in passive design parameter optimization for the minimum energy requirement of buildings. In this process, the codes for PSO were created in Matlab (Version: R2024a) software. While creating these codes, firstly, the dataset was organized for each of the five different climate types in which the study was conducted. In the dataset, the first input is the building geometry, the second input is the WWR, the third input is the window U-value, and the fourth input is the orientation parameter. The dataset is organized as two outputs. The first output is cooling load, and the second output is heating load. Matrices of 6x4235 for CT-1, 6x3727 for CT-2, 6x2902 for CT-3, 6x2425 for CT-4, and 6x2835 for CT-5 were created. The working stages of the generated code are explained in the graph below (Figure 6). The dataset used in this study was entirely generated by the author using computational methods and simulations. No physical equipment was utilized in the data collection process.

Figure 6.
Steps of the ANN-PSO code.
This code works with the edited DB optimization data and ANN model to find the optimum BG, WWR, GT, and orientation passive design values to minimize the heating and cooling loads. The following network structure was used for ANN training and utilization in this study (Figure 7).
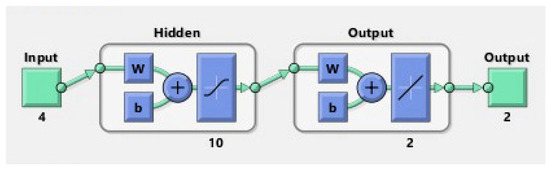
Figure 7.
ANN structure.
The ANN used in the PSO model is a structure with four inputs and two outputs, and the number of hidden layers is ten. Input 1 is building geometry, input 2 is the WWR, input 3 is window U, and input 4 is orientation values. The output 1 is the cooling load, and the output 2 is the heating load. A total of 4235 values were defined for CT-1, 3727 values for CT-2, 2902 values for CT-3, 2425 values for CT-4, and 2835 values for CT-5, and the ANN model was created for each climate type. The Levenberg–Marquardt backpropagation algorithm was used in the ANN model. The results of the ANN models for the CT-2 and CT-3 climate types are shown in the figure below (Figure 8a,b). This process was repeated for the other three climate types and similar results were obtained. Two examples are given in this study for ease of expression.
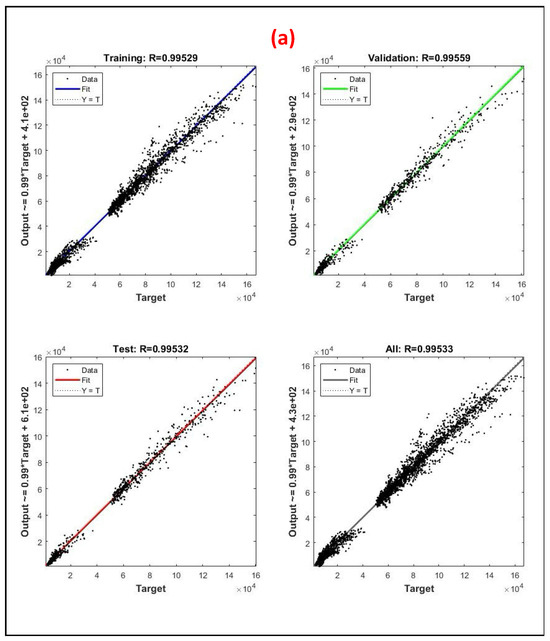
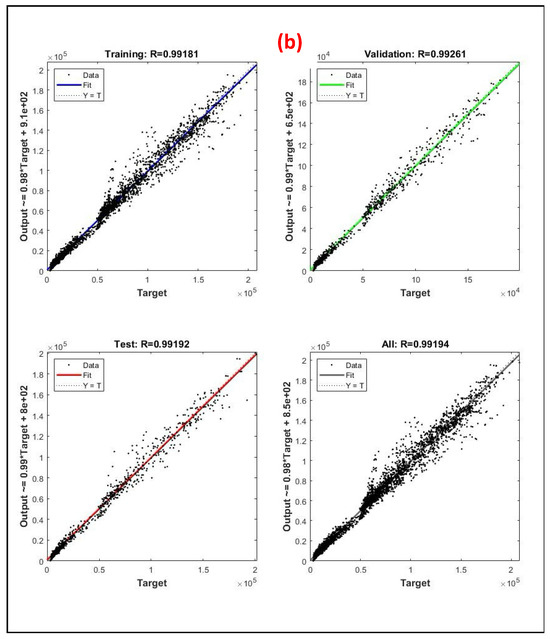
Figure 8.
(a) ANN test graphs for CT-2. (b) ANN test graphs for CT-3.
Each panel in these graphs shows the performance of a model on different datasets. In this type of analysis, the interpretation of the R values between the training, validation, and test sets is based on how well the training is generalized and whether there is low bias and memorisation in the validation and test sets. The upper graphs are for the training and validation datasets, the lower graphs are for the test and general dataset, and in each graph, the linear relationship between target and prediction is analyzed. The degree of accuracy is indicated by the R value. In the upper left graphs of Figure 8a,b, where the ANN regression graphs created with two different climate data are given, the R values obtained in the training data are 0.995 and 0.992, and these values are above 0.99 for other climate types. These values are quite high, and this shows that the model predicts the targets well in the training data. The lower left graphs (test) show the R value on the test data. An R value close to the validation set on the test data indicates that the model provides reasonable accuracy on new data and that there is no memorization. The lower right graphs (All) show the R value over the entire dataset. This graph summarizes the overall performance of the model. Since there is also a high R value here, we can say that the model performs consistently on the entire dataset.
This ANN structure was used in the PSO model. In the developed PSO model, the number of particles is 30, the number of iterations is 100, the best position coefficient (c1) is 1.5, the global best position coefficient (c2) is 2, and the inertia coefficient (w) is 0.7. The initial positions of the particles were determined as random initial positions. Particle velocities, best local (pBest) and global (gBest) positions, and best scores are defined. The fitness function helps PSO to find the best input values in each iteration. The objective function to be evaluated by PSO is to find the input values (building geometry, WWR, glazing type, and orientation) that minimize the heating and cooling load. As PSO updates, the velocities and positions of the particles are updated, and it tries to find better input combinations in each iteration. A for loop is used to update the velocities and positions of the particles. As a result, the PSO model gives the best input values that minimize the heating and cooling load. This PSO model was used separately for each climate model, and optimum design solutions were obtained. These solutions are evaluated in the next section.
4.4. Estimation and Evaluation of the Best Building Energy Performance According to Climate Types, Building Geometry, WWR, Glass Type, and Orientation Design Parameters
The optimization process is based on a dataset that is structured to ensure the accurate learning of the ANN model. The model predicts optimum input parameters that minimize the output values, while also considering interpolated values not explicitly present in the dataset. Since the PSO searches for the best solution by exploring these interpolated values, it generates optimized input parameters (WWR, BG, orientation, and GT) rather than explicit output values for all design scenarios. The building design process is difficult and complex. There are many parameters and limits in the building design process. Therefore, considering that a single solution proposal would not be sufficient, the optimization process was repeated several times for each climate zone, and the optimum solutions obtained were evaluated. The PSO model results for CT-1 are given in the table below (Table 12).
Table 12.
Optimal design solutions for CT-1.
CT-1 is a temperate humid climate zone, also referred to as a Mediterranean climate. The PSO model identifies the optimum building geometries for this region as BG-8, BG-13, and BG-15. Regarding window U-values, the model suggests optimal design solutions with the U-value characteristic of GT-1, which corresponds to one of the lowest limits defined in DB optimization simulations. Additionally, the PSO model generally produces optimum results for courtyard and segmented building forms in this climate type. When determining building geometry, the climatic conditions of the region play a crucial role. In the CT-1 climate zone, summers are very hot, and winters are mild. As a result, the cooling energy demand is significantly high, and optimizing design solutions for cooling can enhance the energy performance of buildings in this region.
The findings from the PSO model align with previous studies in the literature. For instance, Umuroğulları and Cihangir [108] emphasized the necessity of wind exposure and shaded areas in hot humid climate zones. In their study, buildings were designed to provide natural ventilation and shading, and large surface areas with partial structures were recommended to take advantage of the wind. For the temperate humid climate zone, they suggested the use of free-form designs. The optimization results obtained from the PSO model also supports this perspective.
Considering that building design needs vary depending on the WWR, the PSO model provides solutions for different WWR values by running multiple simulations. The optimal results indicate that the best-performing building geometries are those with orientations between a fixed (non-rotating) state and a rotation angle of 0–20 degrees relative to the north. The results obtained from the PSO model for CT-2, the second identified climate type, are presented in Table 13.
Table 13.
Optimal design solutions for CT-2.
The second climate type CT-2 shows the characteristics of temperate climate type with four-season rainfall. The optimum building geometries given by the PSO model for this region are BG-10, BG-11, and BG15. As for the window U-values, the PSO model gives optimum solutions at the U-value of the GT-1 feature, which is one of the window types given at the lowest limit defined for DB optimization simulations, and at values very close to it, and at values close to the values of GT-6-7 window types corresponding to the midpoints of the determined values. In the same building geometry, the PSO model gave different optimum solutions as different design combinations with the rotation of the building to the north and the change in the WWR. When the WWR increased, it gave optimum solution results for window types with window characteristics with lower window U-values. For this climate type, as for CT-1, it produces optimum solutions for courtyard and fragmented forms. Optimum results are obtained for the building geometries determined as building orientations between 0 and 10 degrees of the rotation angle with the north or between 0 and 10 degrees of the rotation angle with the north. The results obtained from the PSO model for CT-3, the second of the identified climate types, are given in Table 14.
Table 14.
Optimal design solutions for CT-3.
The third climate type CT-3 shows hot dry summers and cold dry winters. It is one of the common climate types in Turkey. The PSO model created for this climate type produced optimum solution suggestions in courtyard and fragmented forms. For this climate type, buildings need cooling energy as well as heating energy. Both heating and cooling energy needs are important in this climate type. Therefore, heat losses/gains on the surfaces of the buildings are of great importance for this climate type. The heat loss/gain of buildings increases or decreases depending on the ratio of the floor area of the building to the building volume [109]. For different shapes surrounding the same volume, the external surface area of the building and the amount of heat lost and gained from the external surfaces will also be different [110]. The heating and cooling loads of buildings are influenced by multiple factors, including thermal gains and losses, which depend on building design, material properties, and climatic conditions. In hot dry climate zones, buildings are exposed to high solar radiation, wind carrying sand and dust, and extremely dry air conditions. To mitigate these effects, compact building forms are often preferred to minimize the surface area exposed to solar radiation. Additionally, interwoven building layouts are used to create shaded areas and enhance cooling effects through courtyard designs [108].
During periods with high heating energy demands, enhancing energy efficiency by minimizing heat losses through an optimized building envelope and insulation strategies is crucial. The PSO model results indicate that in buildings with identical geometries, lower window U-values lead to reduced heating loads as the WWR increases. This suggests that improving window insulation can effectively mitigate heat losses through glazing elements. During periods with high heating energy demands, enhancing energy efficiency by minimizing heat losses through an optimized building envelope and insulation strategies is crucial. The PSO model results indicate that in buildings with identical geometries, lower window U-values lead to reduced heating loads as the WWR increases. This suggests that improving window insulation can effectively mitigate heat losses through glazing elements. While these findings align with general thermal performance principles applicable to buildings in similar climate conditions, the results presented in this study are specifically derived from the PSO process, considering distinct climatic and design parameters unique to the analyzed cases, and these findings confirm this situation, which is valid for other climate types.
The results obtained from the PSO model for CT-4, the fourth identified climate type, are presented in Table 15.
Table 15.
Optimal design solutions for CT-4.
In the CT-4 climate type, winters are very cold and arid and summers are dry, and hot climate characteristics are observed. For this climate type, the characteristics of the cold climate zone should be taken into consideration during periods when heating energy is needed. In periods when cooling energy is required, solutions should be produced by taking into account the characteristics of a hot arid climate type. The PSO model has produced solutions for this climate zone with piecewise compact building geometry. It is a common opinion that buildings in the cold climate zone should be designed in such a way that minimum heat loss is experienced, generally by preferring compact forms. The geometries obtained with the PSO model partially support this idea. It shows that the effect of these building geometries on reducing the cooling load in hot seasons is also effective in the solutions for the PSO model. For different solutions of the WWR, low window U-values are observed for optimum solutions. This situation is related to the reduction in heat loss through windows to reduce the heating energy requirement. The results obtained from the PSO model for CT-5, the fifth of the determined climate types, are given in Table 16.
Table 16.
Optimal design solutions for CT-5.
The fifth climate type has very cold winters with snowfall and cool summers. Since winters are very cold in this climate zone, the need for heating energy is high. Since the summers are cooler, the cooling load is very low. For this climate type, the PSO model has produced optimum solutions for BG-1 and BG-9. As a building geometry, solutions supporting more compact and closed introverted forms that are suitable for this climate type were obtained. According to Umruoğulları and Cihangirin [108], buildings in the cold climate zone should be designed in such a way that minimum heat loss is experienced, generally preferring compact forms. In the design, solutions that support the view that outer contours that are too mobile cause unnecessary growth of the building surface and increase the heating energy have emerged. Although the WWR increased for the model building geometry, the U-value gave a high solution. This shows that the compactness of the building geometry prevents heat losses. The PSO model produced design solutions for the building geometry with courtyard buildings. For this geometry, as the WWR increases, the U-value produces lower solutions. The increase in transparent surfaces in the building envelope increases the heat transfer and reduces the thermal insulation effect that may occur in occupied areas [111]. It shows that the increase in heat losses that will occur with the increase in the window ratio on the facade can be prevented by increasing the insulation value of the glass. Orientation was not effective for these building geometries. Optimum solutions have emerged in the current state of the building.
In this study, the PSO model gave optimum solutions for the 15th building geometry for the other four climate types except CT-5. This building geometry is a geometry that can create shade for other buildings where squares are formed in a fragmented interior. The fact that this geometry gives optimum results in terms of energy performance is based on the reduction in cooling energy. So far, the studies conducted for climate types in Turkey have mainly investigated the heating energy requirements of buildings. The findings obtained in this study have shown that the cooling energy needs of most of the climate types in the region should be taken into consideration, and studies on this subject should be increased.
4.5. Limitations and Scope of This Study
This study primarily focuses on evaluating the impact of passive design parameters—such as building geometry, orientation, window-to-wall ratio (WWR), and glazing type—on the energy performance of industrial buildings in different climatic zones. The research is conducted within the scope of building energy performance optimization and does not explicitly incorporate economic and social factors into the analysis.
One of the main limitations of this study is that it does not consider the economic feasibility of the proposed design solutions. While the energy efficiency of different passive design strategies is comprehensively analyzed, a cost–benefit assessment of these solutions is beyond the scope of this research. However, future studies could integrate life-cycle cost analysis (LCCA) or return on investment (ROI) evaluations to enhance the practical applicability of the findings.
Another limitation is that social- and occupant-related factors (such as user behaviour, thermal comfort preferences, and social acceptance of passive design strategies) are not directly addressed. This research assumes standard occupancy and operational conditions, focusing primarily on objective performance metrics such as energy consumption and thermal efficiency. Future work may incorporate occupant-driven simulations and post-occupancy evaluations to assess the real-world implications of the proposed design solutions.
Additionally, the scope of this study is limited to the evaluation of passive design parameters that significantly impact energy performance. Parameters such as HVAC system efficiency, renewable energy integration, and advanced control strategies were not included in this study, as the focus was on early-stage design decisions rather than operational efficiency improvements. The selected design parameters were chosen based on their significant influence on thermal performance and their applicability in industrial building design. Future research could explore the combined effects of passive and active strategies for a more holistic approach to energy efficiency in industrial buildings.
Despite these limitations, this study provides a scientific foundation for optimizing passive design parameters in industrial buildings. The findings can serve as a basis for further multidisciplinary research that integrates economic feasibility, user-centric design approaches, and socio-environmental aspects into building energy performance assessments.
5. Conclusions and Recommendations
This study developed a model for optimizing building energy performance across different climate zones by integrating Artificial Neural Networks (ANNs) and Particle Swarm Optimization (PSO). This study highlights how these computational methods can be incorporated into the early design phase of buildings to enhance sustainability and energy efficiency. A dataset consisting of approximately 16,900 simulation results was generated, covering fifteen different building geometries, five climate zones, various glazing types, and multiple orientation alternatives. The results emphasize that passive design parameters such as building geometry, orientation, WWR, and glazing type significantly impact energy consumption across different climatic conditions.
5.1. Findings
One of the key findings of this study is that the developed ANN-PSO-based optimization model effectively determines the optimal passive design parameters that maximize energy efficiency for each climate zone. The model provides climate-specific design solutions, producing results that align with the literature while also generating new data insights.
The ANN-PSO-based optimization model successfully delivered optimal design solutions tailored to various climatic conditions, enabling fast and efficient analyses over large datasets. This serves as a valuable example of how machine learning and optimization techniques can be effectively applied in building design. Additionally, a roadmap is presented, demonstrating that design parameters often excluded from traditional dynamic simulation-based optimization processes can also be incorporated into the optimization as variables.
This study confirmed that passive design parameters—such as building geometry, orientation, WWR, and glazing type—play a crucial role in reducing energy consumption across five different climate zones. The optimization results successfully identified the specific design parameters that maximize energy efficiency for each climate type. The passive design parameters obtained for each climate zone can be summarized as follows:
Temperate Humid Climates: In these climate zones, optimal results have been obtained for fragmented building forms. This indicates the importance of increasing the surface area of the building exposed to outdoor air and providing shading through fragmented and courtyard building forms. Optimal results were not achieved for building forms such as BG-2, BG-12, and BG-14, primarily due to their extensive and outward-facing surface areas. Increasing the surface area enhances exposure to solar radiation, which can negatively affect cooling energy performance. Therefore, generating building forms that incorporate shading elements emerges as an effective strategy for improving energy efficiency in this climate type.
Arid Climates: Optimal results have been obtained for courtyard, inward-oriented, and fragmented building forms. The shading effect provided by these building forms has been effective in minimizing cooling energy demand during summer. Additionally, the ability of inward-oriented and courtyard forms to reduce the impact of adverse winds has contributed to their superior performance in arid climates. Optimal results were not achieved for building forms with extensive surface areas exposed to outdoor air. The reason for this is that such forms have large exterior surfaces directly exposed to outdoor conditions. During summer, excessive exposure to solar radiation leads to overheating, while in winter, heat losses occur through the exposed surfaces, reducing the energy performance of these forms. However, as the WWR increases, the selection of glass types with low U-values has been found to be beneficial in reducing heat losses during winter, thereby improving energy performance.
Cold Climates: In line with findings from the literature, compact building geometries have provided optimal solutions. In addition to compact forms, courtyard-integrated compact forms have also demonstrated high energy performance. The preference for inward-oriented and compact building geometries has been found to be crucial for energy optimization. In a fully compact square form, optimal energy performance can be achieved using a high WWR and relatively high U-value glass types. However, as the building geometry deviates from compactness and the surface area exposed to outdoor air increases, it has been observed that the WWR should be reduced and glass types with lower U-values should be used. It was also determined that no single glass type is optimal for cold climates; instead, the best solutions can be identified based on the relationship between different glass types and other design parameters. This finding indicates that architectural design processes can maintain flexibility by considering both energy performance and other design constraints. Furthermore, an increase in the WWR generally requires better-insulated glass solutions.
In general, outward-facing building surfaces have not provided optimal solutions across all climate zones, particularly for building forms such as BG-2, BG-11, and BG-14. This is due to excessive solar exposure in summer, which leads to overheating, and direct exposure to heat losses and adverse weather conditions in winter. However, integrating parameters such as geometry, WWR, glazing type, and orientation in the optimization of building energy performance allows for more precise and effective solutions, ultimately contributing to the development of sustainable and energy-efficient industrial buildings.
The findings of this study can serve as a valuable guide in the early design phase of buildings. Particularly for industrial facilities, the results facilitate optimal design decisions that minimize energy consumption and reduce carbon emissions, making them highly applicable for the development of sustainable, low-carbon industrial buildings.
The optimization results highlight that selecting the ideal combination of building geometry, orientation, WWR, and glazing type for each climate zone can significantly reduce heating and cooling loads. This underscores the importance of climate-specific and sustainable design strategies in achieving energy efficiency while promoting environmental sustainability.
Finally, this study indicates that cooling energy demand is at least as crucial as heating in many climate regions of Turkey. This finding underscores the need for future optimization studies to focus more on cooling strategies, particularly in the context of climate change adaptation and sustainable energy use.
5.2. Recommendations for Future Studies
- Integration into climate-specific design standards: Incorporating passive design strategies into regional building regulations can promote climate-responsive architectural approaches.
- Using the ANN-PSO model as a decision support tool: The developed model can be utilized as a decision support tool for architects and engineers, enabling rapid energy performance evaluations during the early design phase.
- Adaptation to different building types: The model can be extended beyond industrial buildings to residential, office, and commercial structures, and future studies can explore its applicability to these building types.
- Incorporating future climate scenarios: The impact of climate change on passive design optimizations should be investigated, and the model should be updated to align with future climate projections.
- Economic feasibility analysis: Evaluating the cost-effectiveness of optimized design parameters in terms of initial investment and long-term energy savings could provide valuable guidance for practical implementation.
- Development as a software application: The ANN-PSO framework could be transformed into a user-friendly software or application, making it accessible to architects and engineers.
Funding
This research received no external funding.
Institutional Review Board Statement
Not applicable.
Informed Consent Statement
Not applicable.
Data Availability Statement
The data that support the findings of this study are available from the corresponding author upon reasonable request.
Conflicts of Interest
The author declares no conflict of interest.
References
- Kükrer, E.; Aker, T.; Eskin, N. Data-driven building energy benchmark modeling for bank branches under different climate conditions. J. Build. Eng. 2023, 66, 105915. [Google Scholar] [CrossRef]
- González-Torres, M.; Pérez-Lombard, L.; Coronel, J.F.; Maestre, I.R.; Paolo, B. Activity and efficiency trends for the residential sector across countries. Energy Build. 2022, 273, 112428. [Google Scholar] [CrossRef]
- Brady, L.; Abdellatif, M. Assessment of energy consumption in existing buildings. Energy Build. 2017, 149, 142–150. [Google Scholar] [CrossRef]
- IEA. Buildings—Sectorial Overview—2021 Tracking Report. 2022. Available online: https://www.iea.org/reports/buildings (accessed on 23 July 2023).
- United Nations Environment Programme (UNEP). Energy Efficiency for Buildings Report; United Nations Environment Programme (UNEP): Nairobi, Kenya, 2023. [Google Scholar]
- Senturk, A.; Ozcan, M. Nearly zero energy building design and optimization: A residential building transformation in Türkiye. Energy Explor. Exploit. 2024, 42, 997–1026. [Google Scholar] [CrossRef]
- Dena, A.J.G.; Hípola, M.D.C.G.; Bandera, C.F. Optimization Testing for the Modeling and Characterization of Three-Dimensional Elements to Enhance Interoperability from Building Information Modeling (BIM) to Building Energy Modeling (BEM). Energy Build. 2024, 317, 114394. [Google Scholar] [CrossRef]
- CEIC. Turkey Energy Consumption (% of Total Energy Consumption-Industry). CEIC. 2025. Available online: https://www.ceicdata.com/en/turkey/environmental-energy-production-and-consumption-oecd-member-annual/tr-energy-consumption--of-total-energy-consumption-industry (accessed on 6 March 2025).
- Republic of Türkiye Ministry of Environment, Urbanisation and Climate Change (MEUCC). Elektrik Enerjisinin Birincil Enerji ve Sera Gazı Salımı Katsayıları. 2022. Available online: https://meslekihizmetler.csb.gov.tr/elektrik-enerjisinin-birincil-enerji-ve-sera-gazi-salimi-katsayilari-2021-yilindan-itibaren-kullanilmak-uzereguncellenmistir-duyuru-411795 (accessed on 3 May 2023).
- Republic of Türkiye Ministry of Environment, Urbanisation and Climate Change (MEUCC). Yüksek Fen Kurulu Başkanlığı-Birim Fiyatlar [Presidency of the High Council of Science-Unit Prices]. 2023. Available online: https://yfk.csb.gov.tr/birim-fiyatlar-i-100468 (accessed on 16 May 2023).
- Turkey Ministry of Energy and Natural Resources, Denge Tablolari (Energy Balance Tables). 2022. Available online: https://enerji.gov.tr/Preview/tr/63d0007a-f593-458b-9610-353eb2545897 (accessed on 10 October 2019).
- Turkey Ministry of Energy and Natural Resources. Ulusal Enerji Verimliliği Eylem Planı 2017–2023, Ankara, n.d. Available online: http://www.resmigazete.gov.tr/eskiler/2018/01/20180102M1-1-1.pdf (accessed on 7 June 2021).
- TSE 825; Türk Standardı TSE 825, Binalarda Isı Yalıtım Kuralları. Türk Standartları Enstitüsü (Turkish Standards Institution): Ankara, Türkiye, 2013.
- Uşma, G. Enerji Etkin Konutlarda Kullanıcı Memnuniyetinin Değerlendirilmesine Yönelik bir Model Geliştirilmesi [Developing a Model for Evaluating user Satisfaction in Energy-Efficient Housing]. Ph.D. Thesis, Yıldız Teknik Üniversitesi [Yildiz Technical University], Istanbul, Turkey, 2021. Available online: https://books.google.com.tr/books?hl=tr&lr=&id=X4o0EQAAQBAJ&oi=fnd&pg=PA192 (accessed on 1 November 2024).
- Özer Yaman, G.; Oral, M.; Dincer, K.; Canan, F. Rule-based Mamdani-type fuzzy modelling of buildings’ annual heating energy need in design of industrial buildings in Konya-Turkey. Online J. Art Des. 2023, 11. [Google Scholar]
- Brückner, S.; Schäfers, H.; Peters, I.; Lävemann, E. Using Industrial and Commercial Waste Heat for Residential Heat Supply: A Case Study from Hamburg, Germany. Sustain. Cities Soc. 2014, 13, 139–142. [Google Scholar] [CrossRef]
- Lee, B.; Trcka, M.; Hensen, J.L.M. Embodied energy of building materials and green building rating systems—A case study for industrial halls. Sustain. Cities Soc. 2011, 1, 67–71. [Google Scholar] [CrossRef]
- Brinks, P.; Kornadt, O.; Oly, R. Development of concepts for cost-optimal nearly zeroenergy buildings for the industrial steel building sector. Appl. Energy 2016, 173, 343–354. [Google Scholar] [CrossRef]
- Margolis, R.; Gagnon, P.; Melius, J.; Phillips, C.; Elmore, R. Using GIS-based methods and lidar data to estimate rooftop solar technical potential in US cities. Environ. Res. Lett. 2017, 12, 074013. [Google Scholar] [CrossRef]
- Horan, W.; Byrne, S.; Shawe, R.; Moles, R.; O’Regan, B. A geospatial assessment of the rooftop decarbonisation potential of industrial and commercial zoned buildings: An example of Irish cities and regions. Sustain. Energy Technol. Assess. 2020, 38, 100651. [Google Scholar] [CrossRef]
- Özer, G. Endüstriyel Alanların Enerji Performanslı Tasarlanmasına Yönelik bir Model Yaklaşımı;Konya Oto Sanayi Yerleşkesi Örneği [A Model Approach to The Energy Performance Design of Industrial Areas: Example of Konya Auto Industry Campus]. Ph.D. Thesis, Konya Technical University, Konya, Turkey, 2019. Available online: https://gcris.ktun.edu.tr/handle/20.500.13091/1112 (accessed on 1 November 2024).
- Hosamo, H.; Solvang, M.; Kofoed, H.; Ragnar, P. Energy & buildings multiobjective optimization of building energy consumption and thermal comfort based on integrated BIM framework with machine. Energy Build. 2022, 277, 112479. [Google Scholar] [CrossRef]
- Mehrpour, Y.; Balali, A.; Valipour, A.; Yunusa-Kaltungo, A.; Shamsnia, S.A. Envelope design optimisation for residential net zero energy buildings within cold and semi-arid climate: A case study of Shiraz. Energy Sustain. Dev. 2024, 78, 101352. [Google Scholar] [CrossRef]
- International Energy Agency (IEA). Buildings—Topics. 2022. Available online: https://www.iea.org/ (accessed on 28 June 2024).
- Yıldız, C. Binalarda Enerji Verimliliğinde Son Gelişmeler: Türkiye Örneği [Recent Developments in Energy Efficiency of Buildings: The Case of Türkiye]. Gazi Üniversitesi Fen Bilim. Derg. Part C Tasarım Ve Teknol. Gazi Univ. J. Sci. Part C Des. Technol. 2023, 11, 1234–1245. [Google Scholar]
- Canan, F. Enerji Etkin Tasarımda Parametrelerin Denetlenmesi İçin Bir Model Denemesi. Uluslararası Hakemli Tasarım Ve Mimar. Derg. 2017, 10, 45–60. [Google Scholar]
- Taleghani, M.; Tenpierik, M.J.; van den Dobbelsteen, A. Environmental impact of building geometry: Case study of three climate zones. J. Green Build. 2012, 7, 143–160. [Google Scholar]
- Mousavi, S.; Gheibi, M.; Wacławek, S.; Smith, N.R.; Hajiaghaei-Keshteli, M.; Behzadian, K. Low-energy residential building optimisation for energy and comfort enhancement in semi-arid climate conditions. Energy Convers. Manag. 2023, 291, 117264. [Google Scholar] [CrossRef]
- Attia, S.; Gratia, E.; De Herde, A.; Hensen, J.L. Simulation-based decision support tool for early stages of zero-energy building design. Energy Build. 2012, 49, 2–15. [Google Scholar] [CrossRef]
- Nguyen, A.T.; Reiter, S.; Rigo, P. A review on simulation-based optimization methods applied to building performance analysis. Appl. Energy 2014, 113, 1043–1058. [Google Scholar] [CrossRef]
- Bamdad, K.; Cholette, M.E.; Guan, L.; Bell, J. Building energy optimisation under uncertainty using ACOMV algorithm. Energy Build. 2018, 167, 322–333. [Google Scholar] [CrossRef]
- Grande-Acosta, G.K.; Islas-Samperio, J.M. Boosting energy efficiency and solar energy inside the residential, commercial, and public services sectors in Mexico. Energies 2020, 13, 5601. [Google Scholar] [CrossRef]
- Ahmed, S.M.; Ahmed, S.M.; Zeyad, M. An approach of a Nearly Zero-Energy Building (nZEB) to build an official zone with Micro-grid. In Proceedings of the 6th IEEE International Energy Conference (ENERGYCon), Gammarth, Tunisia, 28 September–1 October 2020; pp. 662–667. [Google Scholar]
- Lu, S.; Luo, Y.; Gao, W.; Lin, B. Supporting early-stage design decisions with building performance optimisation: Findings from a design experiment. J. Build. Eng. 2024, 82, 108298. [Google Scholar] [CrossRef]
- Reyes-Sierra, M.; Coello, C.A. Multi-objective particle swarm optimizers: A survey of the state-of-the-art. Int. J. Comput. Intell. Res. 2006, 2, 287–308. [Google Scholar]
- Pessenlehner, W.; Mahdavi, A. Building morphology, transparence, and energy performance. In Proceedings of the 8th International IBPSA Conference, Eindhoven, The Netherlands, 11–14 August 2003; pp. 1025–1032. [Google Scholar]
- Catalina, T.; Virgone, J.; Iordache, V. Study on the Impact of the Building Form on the Energy Consumption. Build. Simul. 2011, 12, 1726–1729. [Google Scholar]
- Erdim, B.; Manioglu, G. Impacts of building form on energy efficient heat pump applications. In Proceedings of the Eleventh International Conference Enhanced Building Operations, New York, NY, USA, 18–20 October 2011. [Google Scholar]
- Stamenković, M. Building Form Impact on Efficient Energy Use Achievement. In Proceedings of the International Science Conference Raporting for Sustainability, Becici, Montenegro, 2013; Available online: https://www.researchgate.net/profile/Marija-Stamenkovic/publication/335568282_Building_form_impact_on_efficient_energy_use_achievement/links/5d6d7b66299bf1808d61b84a/Building-form-impact-on-efficient-energy-use-achievement.pdf (accessed on 6 March 2025).
- Erdim, B.; Manioğlu, G. Building form effects on energy efficient heat pump application for different climatic zones. A|Z ITU J. Fac. Archit. 2014, 11, 335–349. [Google Scholar]
- Hemsath, T.L.; Bandhosseini, K.A. Sensitivity analysis evaluating basic building geometry’s effect on energy use. Renew. Energy 2015, 76, 526–538. [Google Scholar] [CrossRef]
- Fallahtafti, R.; Mahdavinejad, M. Optimisation of building shape and orientation for better energy efficient architecture. Int. J. Energy Sect. Manag. 2015, 9, 593–618. [Google Scholar] [CrossRef]
- Zhang, H.; Pan, Y.; Wang, L. Influence of plan shapes on annual energy consumption of residential buildings. Int. J. Sustain. Dev. Plan. 2017, 12, 1178–1191. [Google Scholar] [CrossRef]
- Konis, K.; Gamas, A.; Kensek, K. Passive performance and building form: An optimization framework for early-stage design support. Sol. Energy 2016, 125, 161–179. [Google Scholar] [CrossRef]
- Chen, K.W.; Janssen, P.; Schlueter, A. Multi-Objective Optimisation of Building Form, Envelope and Cooling System for Improved Building Energy Performance. Autom. Constr. 2018, 94, 449–457. [Google Scholar] [CrossRef]
- Akbari, H.; Hosseini Nezhad, F.S. Optimum Form, Aspect Ratio and Orientation of Building Based on Solar Energy Receiving in Hot-Dry Climate; Case Studies of Isfahan, Semnan, Kashan and Kerman Cities, Iran. J. Sol. Energy Res. 2020, 5, 341–350. [Google Scholar]
- Deng, X.; Wang, M.; Sun, D.; Fan, Z. Effect of Building Form on Energy Consumption of Academic Library Buildings in Different Climate Zones in China. In Proceedings of the IOP Conference Series: Earth and Environmental Science, Qingdao, China, 5–7 June 2020; Volume 531, p. 012060. [Google Scholar]
- Mohsenzadeh, M.; Marzbali, M.H.; Tilaki, M.J.M.; Abdullah, A. Building form and energy efficiency in tropical climates: A case study of Penang, Malaysia. Urbe Rev. Bras. Gestão Urbana. 2021, 13, e20200280. [Google Scholar] [CrossRef]
- Haseeb, Q.S.; Yunus, S.M.; Shoshan, A.A.A.; Aziz, A.I. A study of the optimal form and orientation for more energy efficiency to mass model multi-storey buildings of Kirkuk city, Iraq. Alex. Eng. J. 2023, 71, 731–741. [Google Scholar] [CrossRef]
- El Bat, A.M.S.; Romani, Z.; Bozonnet, E.; Draoui, A.; Allard, F. Optimizing urban courtyard form through the coupling of outdoor zonal approach and building energy modeling. Energy 2023, 264, 126176. [Google Scholar] [CrossRef]
- Ying, X.; Huangfu, F.; Tao, C. Low energy consumption form of the U-shaped plan office building in the Yangtze River Delta. Sci. Rep. 2023, 13, 11250. [Google Scholar] [CrossRef]
- Ayçam, İ.; Utkutuğ, G. Farklı Malzemelerle Üretilen Pencere Tiplerinin Isıl Performanslarının İncelenmesi ve Enerji Etkin Pencere Seçimi [Investigation of the Thermal Performance of Window Types Produced with Different Materials and Energy-Efficient Window Selection]. 4. Ulusal Tesisat Mühendisliği Kongresi [4th National Congress on HVAC Engineering], İzmir, Turkey. 1999. Available online: https://mmoteskon.org/wp-content/uploads/2014/12/1999-04.pdf (accessed on 11 December 2024).
- Inanici, M.N.; Demirbilek, F.N. Thermal performance optimization of building aspect ratio and south window size in five cities having different climatic characteristics of Turkey. Build. Environ. 2000, 35, 41–52. [Google Scholar] [CrossRef]
- Aksoy, U.T.; Inalli, M. Impacts of some building passive design parameters on heating demand for a cold region. Build. Environ. 2006, 41, 1742–1754. [Google Scholar] [CrossRef]
- Keleşoğlu, Ö.; Aksoy, U.T.; Ekıcı, B.B. Bina Isıtma ve Soğutma Enerjisi İhtiyaçlarının Yapay Sinir Ağı ile Belirlenmesi [Determination of Building Heating and Cooling Energy Needs Using Artificial Neural Network]. Technol. Appl. Sci. 2009, 4, 294–304. [Google Scholar]
- Mangan, S.D.; Oral, G.K. Türkiye’nin Farklı İklim Bölgelerinde Bir Konut Binasının Enerji Etkin İyileştirilmesi [Energy-Efficient Improvement of a Residential Building in Different Climatic Regions of Turkey]. In Proceedings of the 11th National Congress on HVAC Engineering, İzmir, Türkiye, 17–20 April 2013 ; Available online: https://mmoteskon.org/wp-content/uploads/2014/09/2013-57.pdf (accessed on 9 December 2024).
- Turhan, C.; Kazanasmaz, T.; Uygun, I.E.; Ekmen, K.E.; Akkurt, G.G. Comparative study of a building energy performance software (KEP-IYTE-ESS) and ANN-based building heat load estimation. Energy Build. 2014, 85, 115–125. [Google Scholar] [CrossRef]
- Kazanasmaz, T.; Uygun, I.E.; Akkurt, G.G.; Turhan, C.; Ekmen, K.E. On the relation between architectural considerations and heating energy performance of Turkish residential buildings in Izmir. Energy Build. 2014, 72, 38–50. [Google Scholar] [CrossRef]
- Manioğlu, G.; Oral, G.K. Effect of courtyard shape factor on heating and cooling energy loads in hot-dry climatic zone. Energy Procedia 2015, 78, 2100–2105. [Google Scholar] [CrossRef]
- Sağlam, N.G.; Yılmaz, A.Z.; Becchio, C.; Corgnati, S.P. A comprehensive cost-optimal approach for energy retrofit of existing multi-family buildings: Application to apartment blocks in Turkey. Energy Build. 2017, 150, 224–238. [Google Scholar] [CrossRef]
- Çetintaş, K.F. Bina Kabuğunda Form ve Malzeme Seçiminin Kabuğun Oluşum Enerjisi, Karbon Salımı ve Maliyetine Etkisinin Incelenmesi [Examination of the Effects of Form and Material Selection in the Building Envelope on the Embodied Energy, Carbon Emission, and Cost of the Envelope]. In Proceedings of the 14th National Conference on Installation Engineering, İzmir, Türkiye, 12–20 April 2019. [Google Scholar]
- Ashrafian, T.; Moazzen, N. The impact of glazing ratio and window configuration on occupants’ comfort and energy demand: The case study of a school building in Eskisehir, Turkey. Sustain. Cities Soc. 2019, 47, 101483. [Google Scholar] [CrossRef]
- Atmaca, M.; Yılmaz, Z. A study on energy and cost efficiency for existing hotel buildings in Turkey. In Proceedings of the E3S Web of Conferences, Bucharest, Romania, 26–29 May 2019; Volume 111, p. 03037. [Google Scholar]
- Uslusoy Şenyurt, S.; Altin, M. Ofis Yapıları İçin Çevreyle Uyumlu Yapı Dış Kabuğu Tasarım Parametrelerinin Enerji Tüketimine Etkisini Belirlemede Kullanılabilecek Bir Yaklaşım [A Method to be Use for Defining Effect of Environmentally Friendly Façade Design Parameters on Energy Consumption for Office Buildings]. Megaron 2020, 15, 55–66. [Google Scholar]
- Özer, G. Binaların Pencere/Duvar Oranı ve Yönlenme Parametrelerinin Güneş Enerjisi Kazancına Etkisi [The Effect of Buildings’ Window/Wall Ratio and Orientation Parameters on Solar Energy Gain]. Uluslararası Doğu Anadolu Fen Mühendislik ve Tasarım Derg. (Int. East. Anatolia J. Sci. Eng. Des.) 2021, 3, 425–441. [Google Scholar]
- Koç, S.G.; Kalfa, S.M. The effects of shading devices on office building energy performance in Mediterranean climate regions. J. Build. Eng. 2021, 44, 102653. [Google Scholar] [CrossRef]
- Erdemir Kocagil, İ.; Koçlar Oral, G. Enerji Etkin Yerleşme Dokusu ve Bina Tasarımına Yönelik Parametrik Bir Model Önerisi: Ilımlı-Nemli İklim Bölgesi [A Parametric Model Proposal for Energy Efficient Settlement Texture and Building Design: Temperate-Humid Climate Zone]. Megaron 2021, 16, 735–750. [Google Scholar]
- Mangan, S.D.; Oral, G.K.; Kocagil, I.E.; Sozen, I. The impact of urban form on building energy and cost efficiency in temperate-humid zones. J. Build. Eng. 2021, 33, 101626. [Google Scholar] [CrossRef]
- Aksin, F.N.; Selçuk, S.A. Energy performance optimization of school buildings in different climates of Turkey. Future Cities Environ. 2021, 7, 1–11. [Google Scholar] [CrossRef]
- Acar, U.; Kaska, O.; Tokgoz, N. Multi-objective optimization of building envelope components at the preliminary design stage for residential buildings in Turkey. J. Build. Eng. 2021, 42, 102499. [Google Scholar] [CrossRef]
- Yigit, S. A machine-learning-based method for thermal design optimization of residential buildings in highly urbanized areas of Turkey. J. Build. Eng. 2021, 38, 102225. [Google Scholar] [CrossRef]
- Yaman, G.Ö.; Kılınç, C.; İpek, S.; Oral, M. Yapay Sinir Ağları Tabanlı Sayısal Tasarım Modeli Ile Atölye ve Imalat Mekanlarında Enerji Performansı Tahmini [Energy Performance Prediction in Workshop and Manufacturing Spaces by Artificial Neural Networks-Based Numerical Design Model]. 2022. Available online: https://gcris.ktun.edu.tr/bitstream/20.500.13091/5314/1/MSTAS2022_ISBN_V4.pdf (accessed on 8 December 2024).
- Tamer, T.; Dino, I.G.; Akgül, C.M. Data-driven, long-term prediction of building performance under climate change: Building energy demand and BIPV energy generation analysis across Turkey. Renew. Sustain. Energy Rev. 2022, 162, 112396. [Google Scholar] [CrossRef]
- Yaman, G.Ö. The effect of building facades window/wall ratio and window properties on energy performance. J. Fac. Eng. Archit. Gazi Univ. 2023, 38, 851–863. [Google Scholar]
- Aktacir, M.A.; Büyükalaca, O.; Yılmaz, T. A case study for influence of building thermal insulation on cooling load and air-conditioning system in the hot and humid regions. Appl. Energy 2010, 87, 599–607. [Google Scholar] [CrossRef]
- Dino, I.G.; Akgül, C.M. Impact of climate change on the existing residential building stock in Turkey: An analysis on energy use, greenhouse gas emissions and occupant comfort. Renew Energy 2019, 141, 828–846. [Google Scholar] [CrossRef]
- DesignBuilder Software Ltd. DesignBuilder User Guide and Tuturials. Available online: https://designbuilder.co.uk/training/tutorials (accessed on 1 March 2025).
- Nedhal, A.; Fadzil, S. The potential of shading devices for temperature reduction in high-rise residential buildings in the tropics. Procedia Eng. 2011, 21, 273–282. [Google Scholar]
- Kim, S.; Zadeh, P.A.; Staub-French, S.; Froese, T.; Cavka, B.T. Assessment of the impact of window size, position and orientation on building energy load using BIM. Procedia Eng. 2016, 145, 1424–1431. [Google Scholar] [CrossRef]
- Liu, Y.; Li, T.; Xu, W.; Wang, Q.; Huang, H.; He, B.J. Building information modelling-enabled multi-objective optimization for energy consumption parametric analysis in green buildings design using hybrid machine learning algorithms. Energy Build. 2023, 300, 113665. [Google Scholar] [CrossRef]
- Lu, Z.; Gao, Y.; Xu, C.; Li, Y. Configuration optimization of an off-grid multi-energy microgrid based on modified NSGA-II and order relation-TODIM considering uncertainties of renewable energy and load. J. Clean. Prod. 2023, 383, 135312. [Google Scholar] [CrossRef]
- Martínez-Comesaña, M.; Eguía-Oller, P.; Martínez-Torres, J.; Febrero-Garrido, L.; Granada-Álvarez, E. Optimisation of thermal comfort and indoor air quality estimations applied to in-use buildings combining NSGA-III and XGBoost. Sustain. Cities Soc. 2022, 80, 103723. [Google Scholar] [CrossRef]
- Xu, Y.; Zhang, G.; Yan, C.; Wang, G.; Jiang, Y.; Zhao, K. A two-stage multi-objective optimization method for envelope and energy generation systems of primary and secondary school teaching buildings in China. Build. Environ. 2021, 204, 108142. [Google Scholar] [CrossRef]
- Mughala, S.; Khosoa, A.R.; Najeeba, H.; Khana, M.S.N.; Alia, T.H.; Khahrob, S.H. Green Retrofitting of Building using BIM-based Sustainability Optimization. J. Kejuruter. 2024, 36, 179–189. [Google Scholar] [CrossRef]
- Machairas, V.; Tsangrassoulis, A.; Axarli, K. Algorithms for optimization of building design: A review. Renew. Sustain. Energy Rev. 2014, 31, 101–112. [Google Scholar] [CrossRef]
- Sun, C.; Han, Y.; Feng, H. Multi-objective building form optimization method based on GANN-BIM model. Next Gener. Build. 2015, 2, 141–154. [Google Scholar] [CrossRef]
- Ayoobi, A.W.; Inceoğlu, M. Developing an Optimized Energy-Efficient Sustainable Building Design Model in an Arid and Semi-Arid Region: A Genetic Algorithm Approach. Energies 2024, 17, 6095. [Google Scholar] [CrossRef]
- Wu, C.; Pan, H.; Luo, Z.; Liu, C.; Huang, H. Multi-objective optimization of residential building energy consumption, daylighting, and thermal comfort based on BO-XGBoost-NSGA-II. Build. Environ. 2024, 254, 111386. [Google Scholar] [CrossRef]
- Lotfinejad, P.; Tarkashvand, A.; Sanaieian, H. A computational approach for integration of greenhouse and “Shanashir” to enhance thermal comfort of occupants, utilizing NSGA-II algorithm. Build. Environ. 2025, 273, 112717. [Google Scholar] [CrossRef]
- Harshalatha; Patil, S.; Kini, P.G. A review on simulation based multi-objective optimization of space layout design parameters on building energy performance. J. Build. Pathol. Rehabil. 2024, 9, 69. [Google Scholar] [CrossRef]
- Yao, B.; Salehi, A.; Baghoolizadeh, M.; Khairy, Y.; Baghaei, S. Multi-objective optimization of office egg shadings using NSGA-II to save energy consumption and enhance thermal and visual comfort. Int. Commun. Heat. Mass. Transfer. 2024, 157, 107697. [Google Scholar] [CrossRef]
- Huang, Y.; Niu, J.L. Optimal building envelope design based on simulated performance: History, current status and new potentials. Energy Build. 2016, 117, 387–398. [Google Scholar] [CrossRef]
- Turan, T. Makine Öğrenmesi Algoritmaları İle su Kalitesi ve İçilebilirlik Tahmini (Water Quality and Potability Prediction with Machine Learning Algorithms). Uluborlu J. Vocat. Sci. Uluborlu Mesleki Bilim. Derg. 2023, 6, 65–80. [Google Scholar]
- Shanmuganathan, S.E.; Samarasinghe, S.E. Artificial Neural Network Modelling; Springer International Publishing: Chem, Switzerland, 2016. [Google Scholar] [CrossRef]
- İpek, S.; Güneyisi, E. Application of Eurocode 4 design provisions and development of new predictive models for eccentrically loaded CFST elliptical columns. J. Build. Eng. 2022, 48, 103945. [Google Scholar] [CrossRef]
- Soni, A.; Yusuf, M.; Beg, M.; Hashmi, A.W. An application of artificial neural network (ANN) to predict the friction coefficient of nuclear grade graphite. Mater. Today Proc. 2022, 68, 701–709. [Google Scholar] [CrossRef]
- Ahmadi, M.; Naderpour, H.; Kheyroddin, A. A proposed model for axial strength estimation of non-compact and slender square CFT columns. Iran. J. Sci. Technol. Trans. Civ. Eng. 2019, 43, 131–147. [Google Scholar] [CrossRef]
- İpek, S.; Özer Yaman, G.; Kılınç, C. Investigation of thermal conductivity of rubberized concrete as an energy-efficient building material and modeling by artificial intelligence. Archiv. Civ. Mech. Eng. 2023, 23, 168. [Google Scholar] [CrossRef]
- Nejad, R.M.; Sina, N.; Ma, W.; Liu, Z.; Berto, F.; Gholami, A. Optimization of fatigue life of pearlitic grade 900A steel based on the combination of genetic algorithm and artificial neural network. Int. J. Fatigue. 2022, 162, 106975. [Google Scholar] [CrossRef]
- Kennedy, J.; Eberhart, R. Particle swarm optimization. In Proceedings of the ICNN’95-International Conference on Neural Networks, Perth, WA, Australia, 27 November–1 December 1995; Volume 4, pp. 1942–1948. [Google Scholar]
- Marini, F.; Walczak, B. Particle swarm optimization (PSO). A tutorial. Chemom. Intell. Lab. Syst. 2015, 149, 153–165. [Google Scholar] [CrossRef]
- Delgarm, N.; Sajadi, B.; Kowsary, F.; Delgarm, S. Multi-Objective Optimization of the Building Energy Performance: A Simulation-Based Approach by Means of Particle Swarm Optimization (PSO). Appl. Energy 2016, 170, 293–303. [Google Scholar] [CrossRef]
- Stoppato, A.; Cavazzini, G.; Ardizzon, G.; Antonio Rossetti, A. PSO (Particle Swarm Optimization)-Based Model for the Optimal Management of a Small PV (Photovoltaic)-Pump Hydro Energy Storage in a Rural Dry Area. Energy 2014, 76, 168–174. [Google Scholar] [CrossRef]
- Çetin, M. Entropi Ekseninde Orman Yangınları Fenomeni Üzerine Bir İnceleme [A Study on the Forest Fire Phenomenon on the Axis of Organizational Entropy]. J. Anatol. Geogr. 2024, 1, 1–16. [Google Scholar]
- Öztuna, D.; Elhan, A.H.; Kurşun, N. Sağlık araştırmalarında kullanılan ilişki katsayıları [Correlation coefficients in medical research: Review]. Turk. Klin. J. Med. Sciences. 2008, 28, 160–165. [Google Scholar]
- Choi, J.; Peters, M.; Mueller, R.O. Correlation Analysis of Ordinal Data: From Pearson’s r to Bayesian Polycoric Correlation. Asia Pac. Educ. Rev. 2010, 11, 459–466. [Google Scholar] [CrossRef]
- Sheskin, D. Handbook of Parametric and Nonparametric Statistical Procedures Test, 5th ed.; Chapman and Hall/CRC: Boca Raton, FL, USA, 2011. [Google Scholar]
- Umaroğulları, F.; Motor, C. Toplu konutların iklimsel konfor tasarım parametrelerine göre değerlendirilmesi: “Ilıman nemli iklim bölgesi: Edirne Binevler (1. Kısım) konut yapı kooperatifi örneği” [Evaluation of mass houses according to climatic comfort design parameters: “Temperate humid climate zone: Edirne Binevler (Part 1) mass housing example”]. Mimar. Yaşam 2019, 5, 105–122. [Google Scholar]
- Evans, M. Housing, Climate and Comfort, 1st ed.; The Architectural Press Limited: London, UK, 1980. [Google Scholar]
- Yılmaz, Z.; Koçlar, G.; Manioğlu, G. Isıtma Enerjisi Tasarrufu Açısından Bina Kabuğu ısı Yalıtım Değerinin Bina Formuna Bağlı Olarak Belirlenmesi [Determination of Building Envelope Thermal Insulation Value Depending on Building Form in Terms of Heating Energy Conservation]; İTÜ Araştırma: İstanbul, Turkey, 2000. [Google Scholar]
- Zorer, G. Yapılarda Isısal Tasarım Ilkeleri [Thermal Design Principles in Buildings]. Ph.D. Thesis, YTÜ Mimarlık Fakültesi, Baskı İşliği, İstanbul, Turkey, 1992. [Google Scholar]
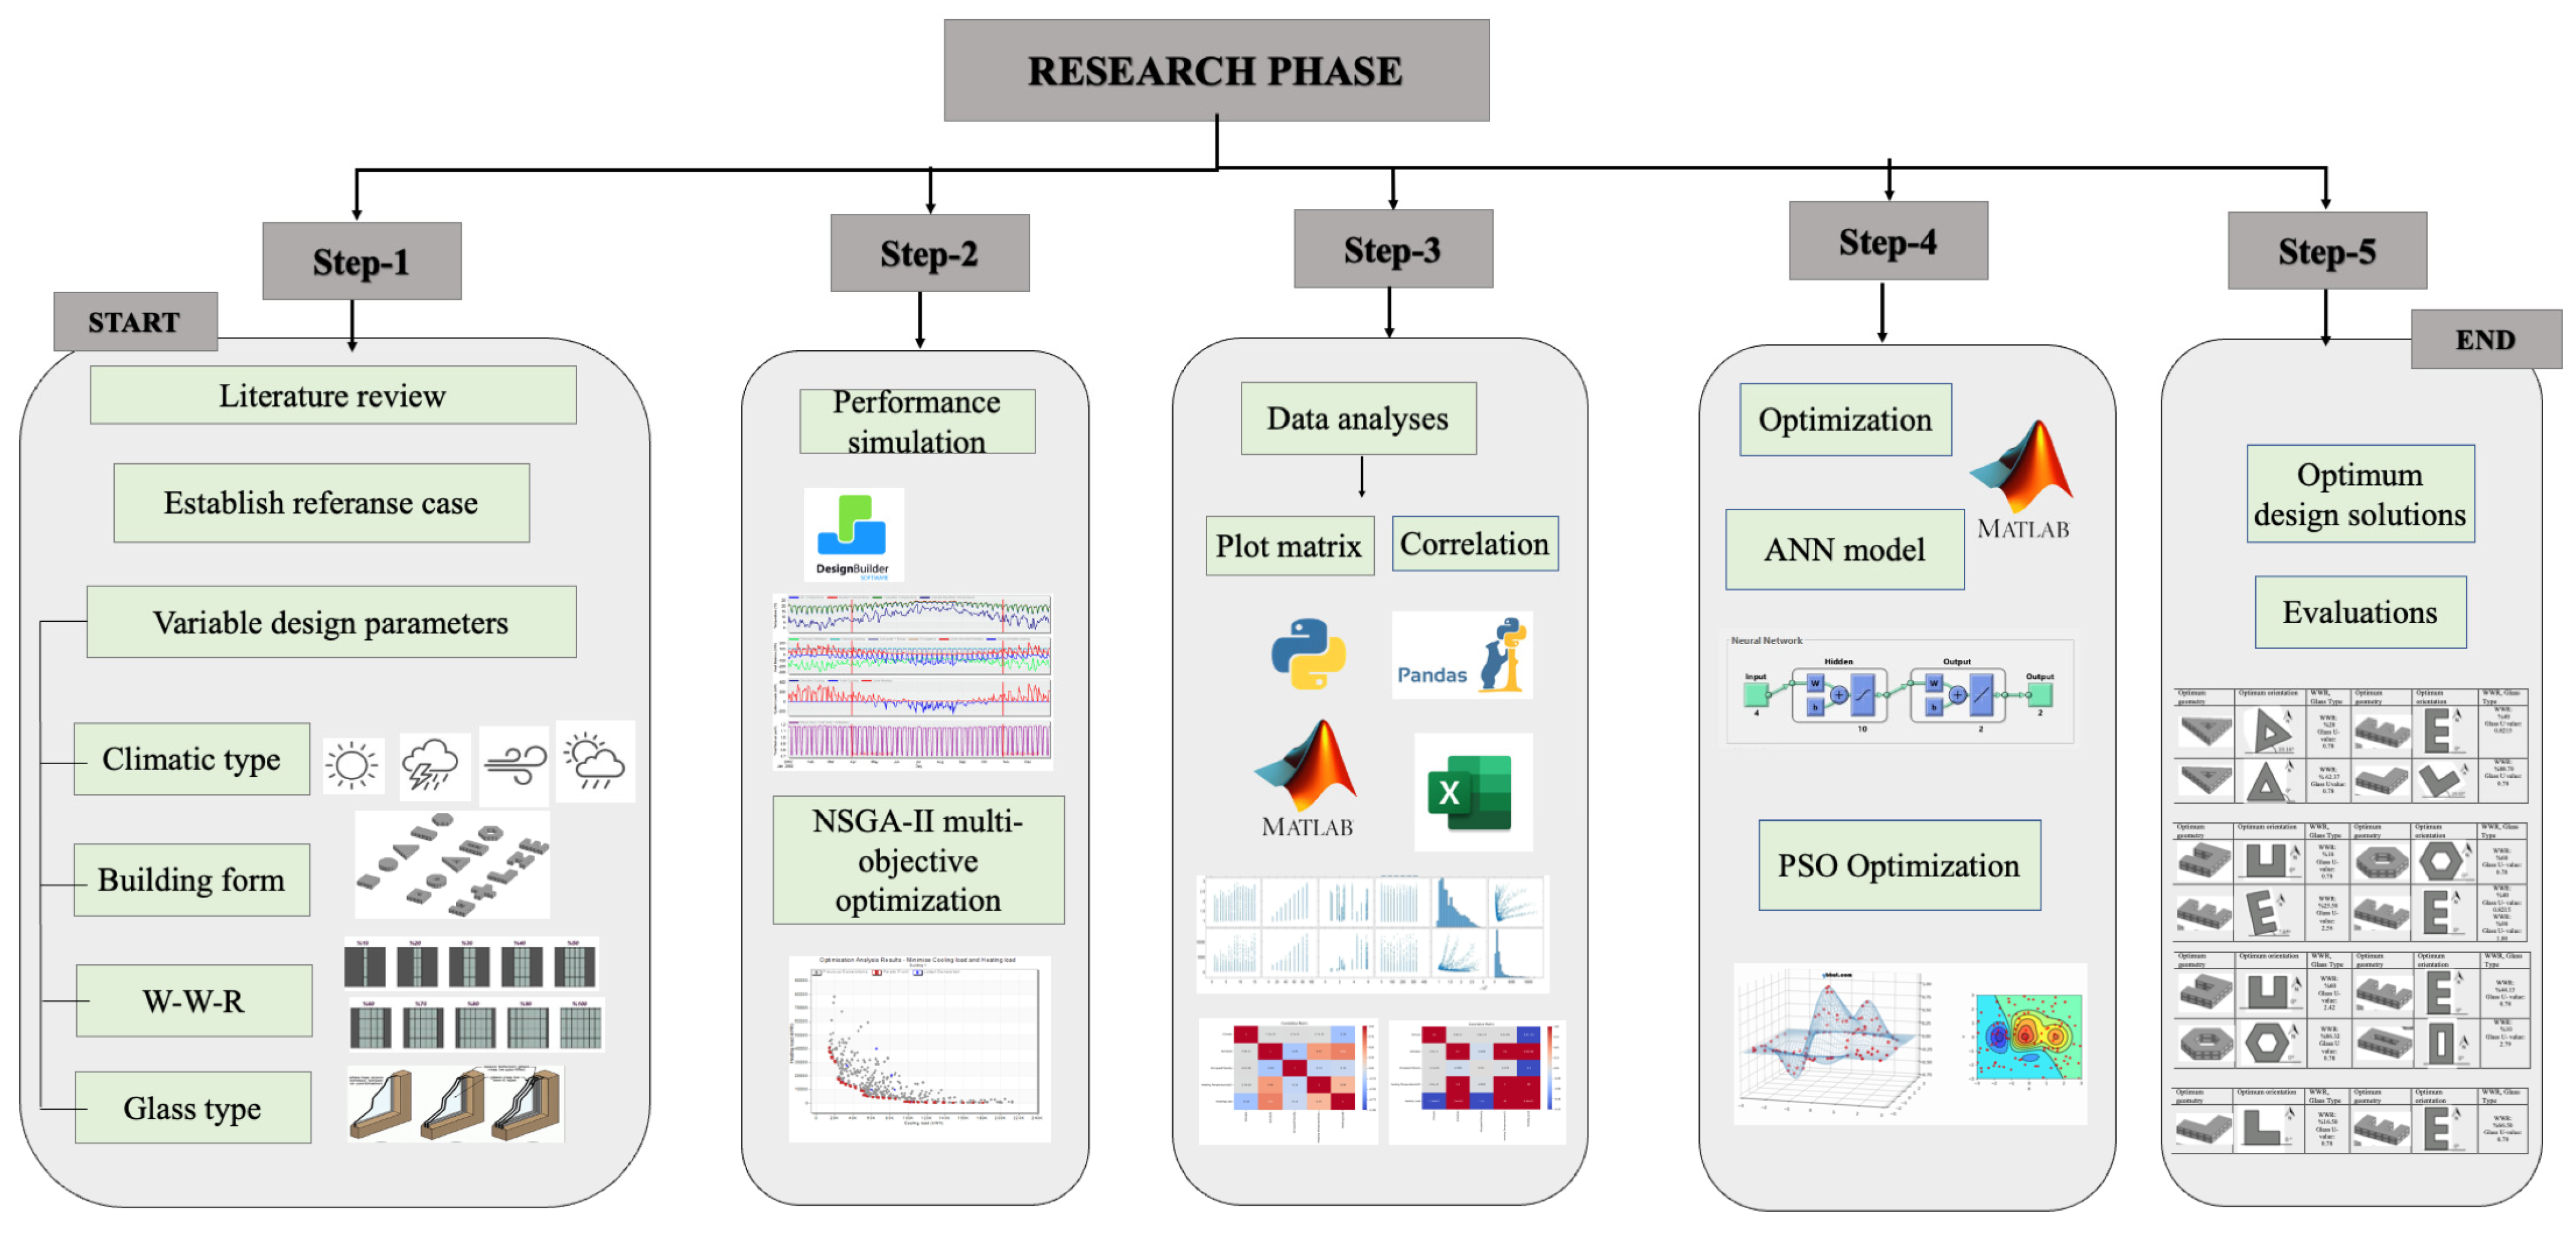
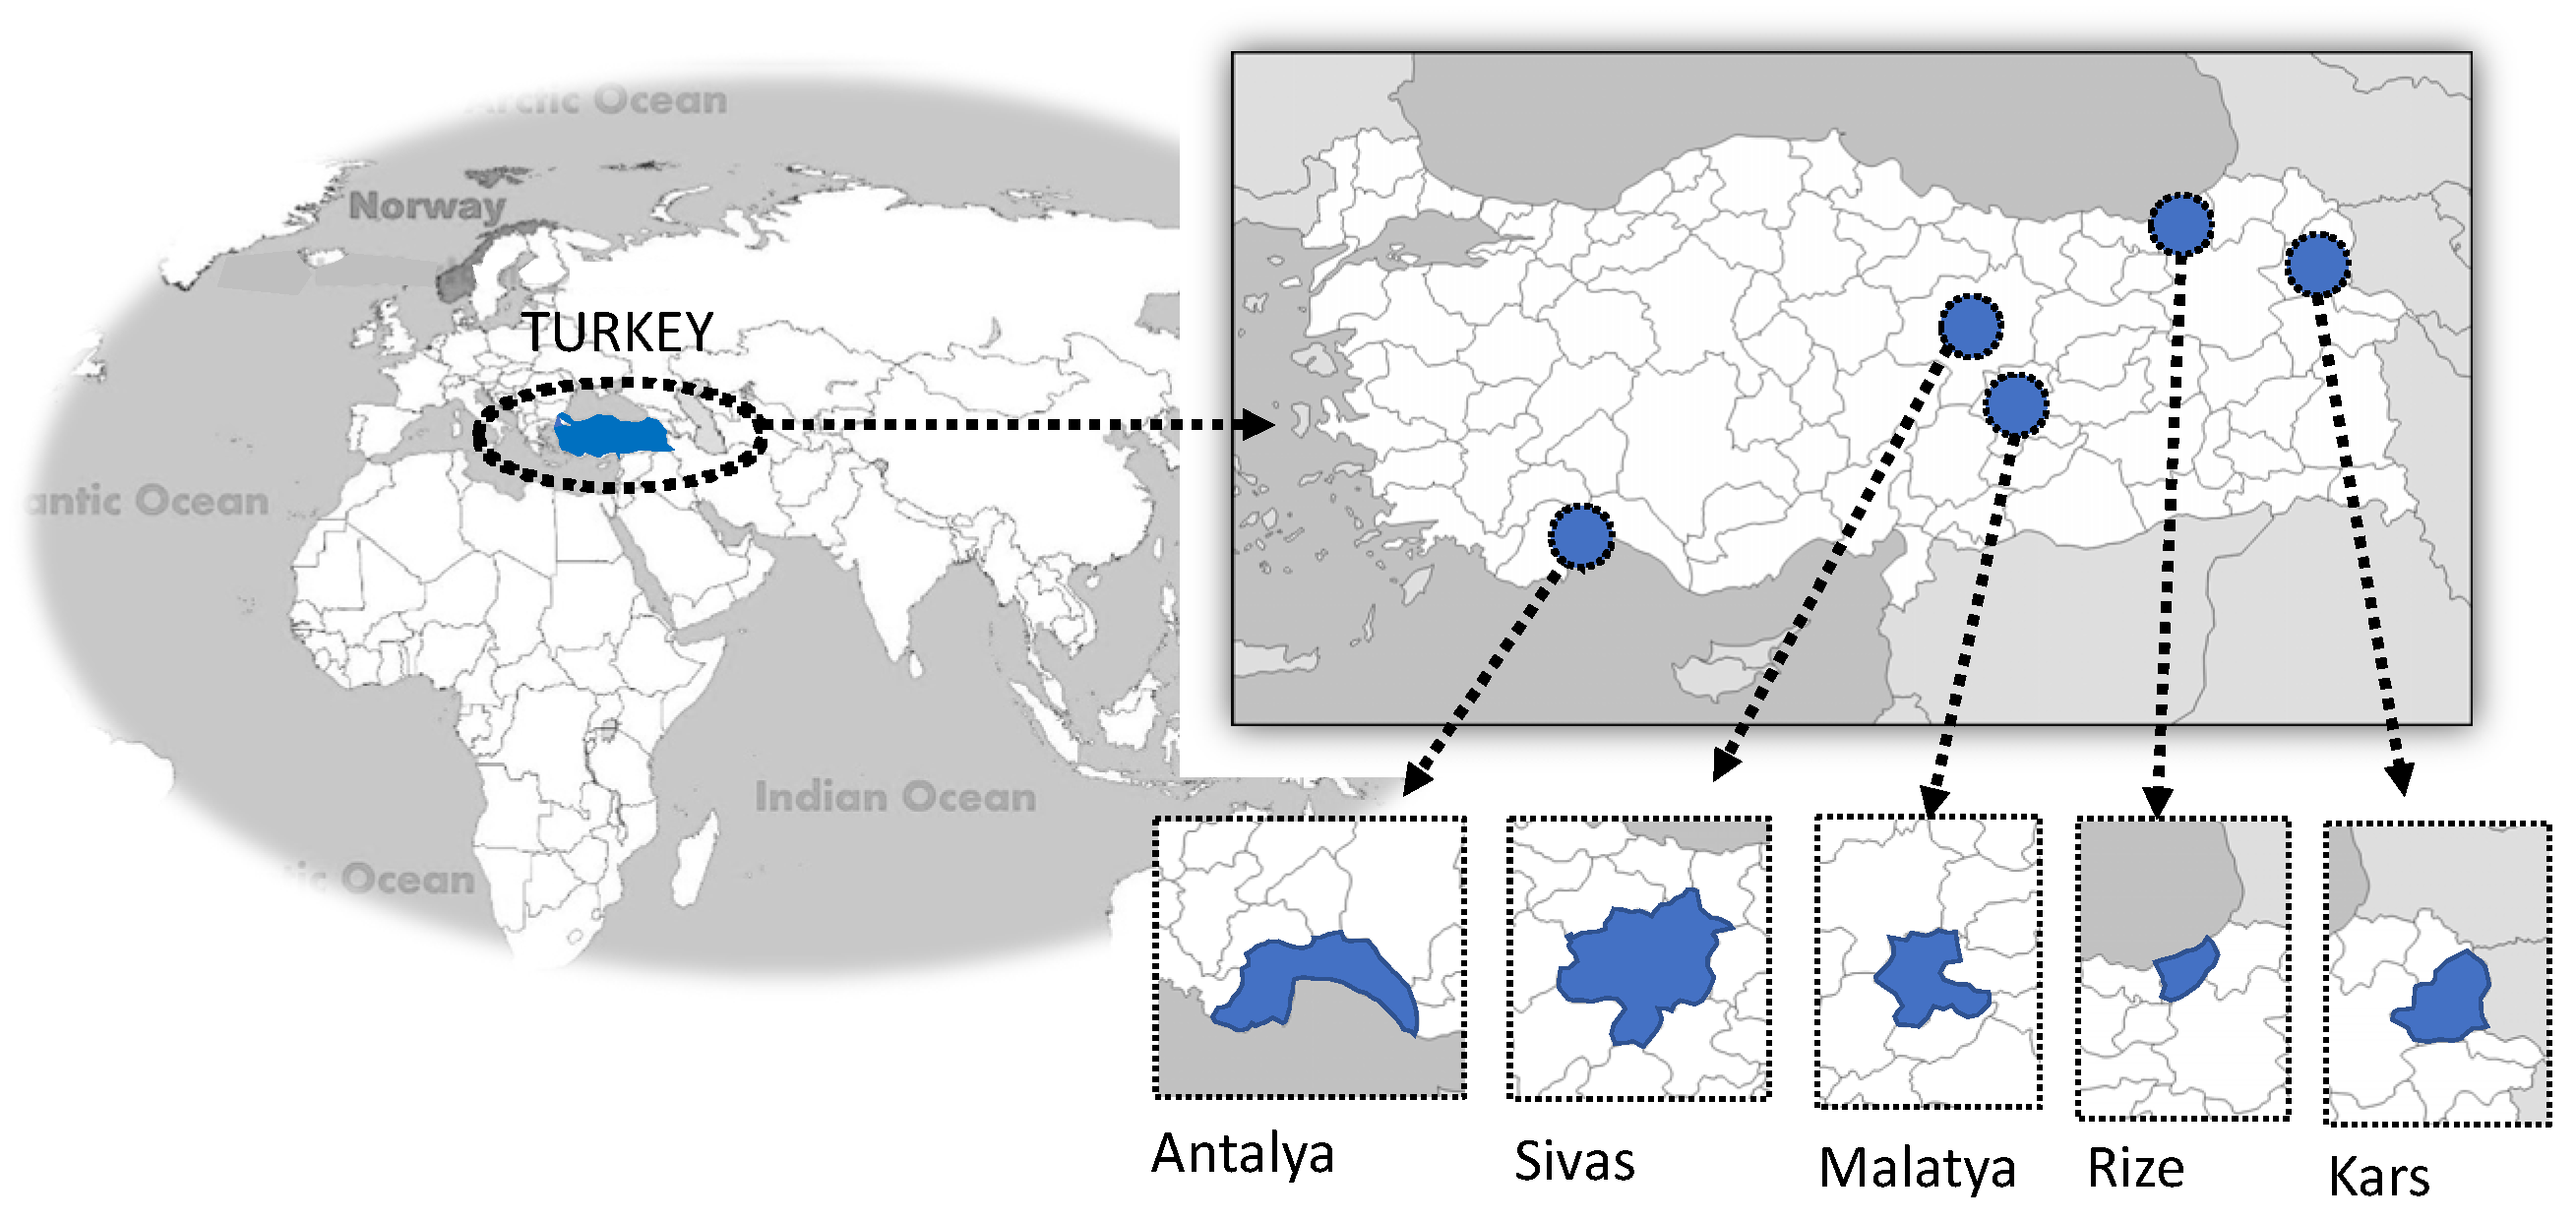


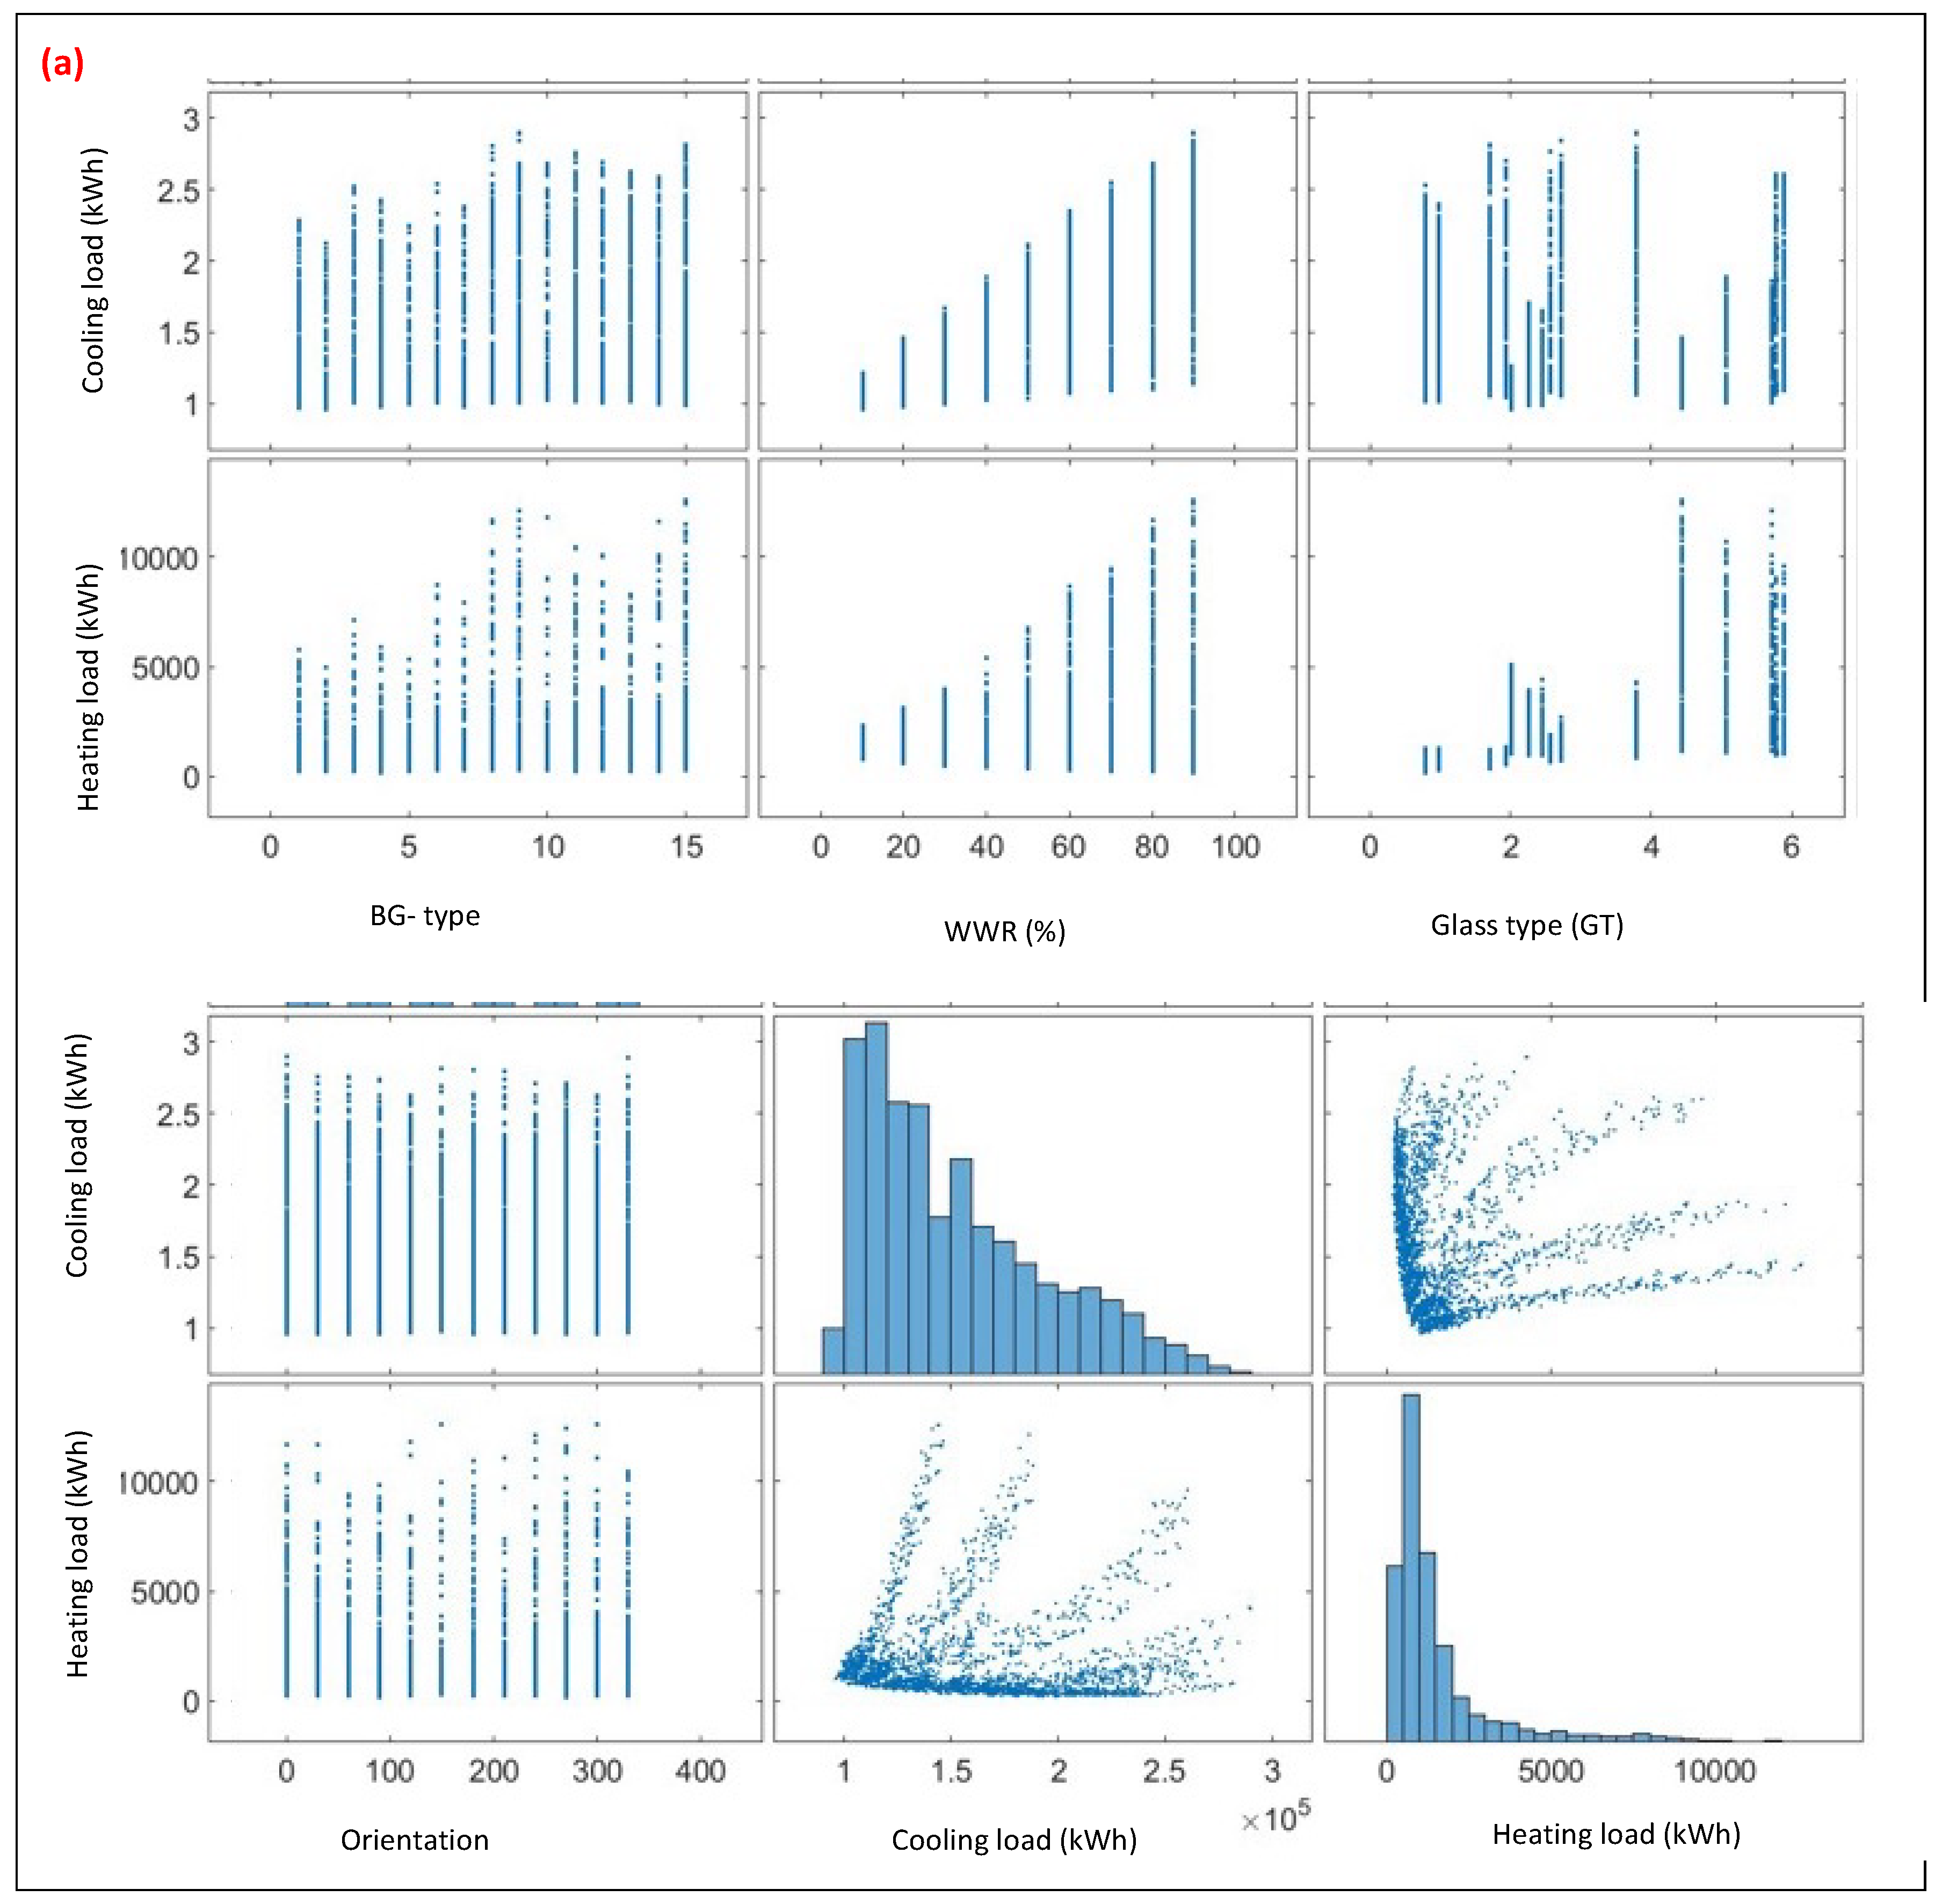
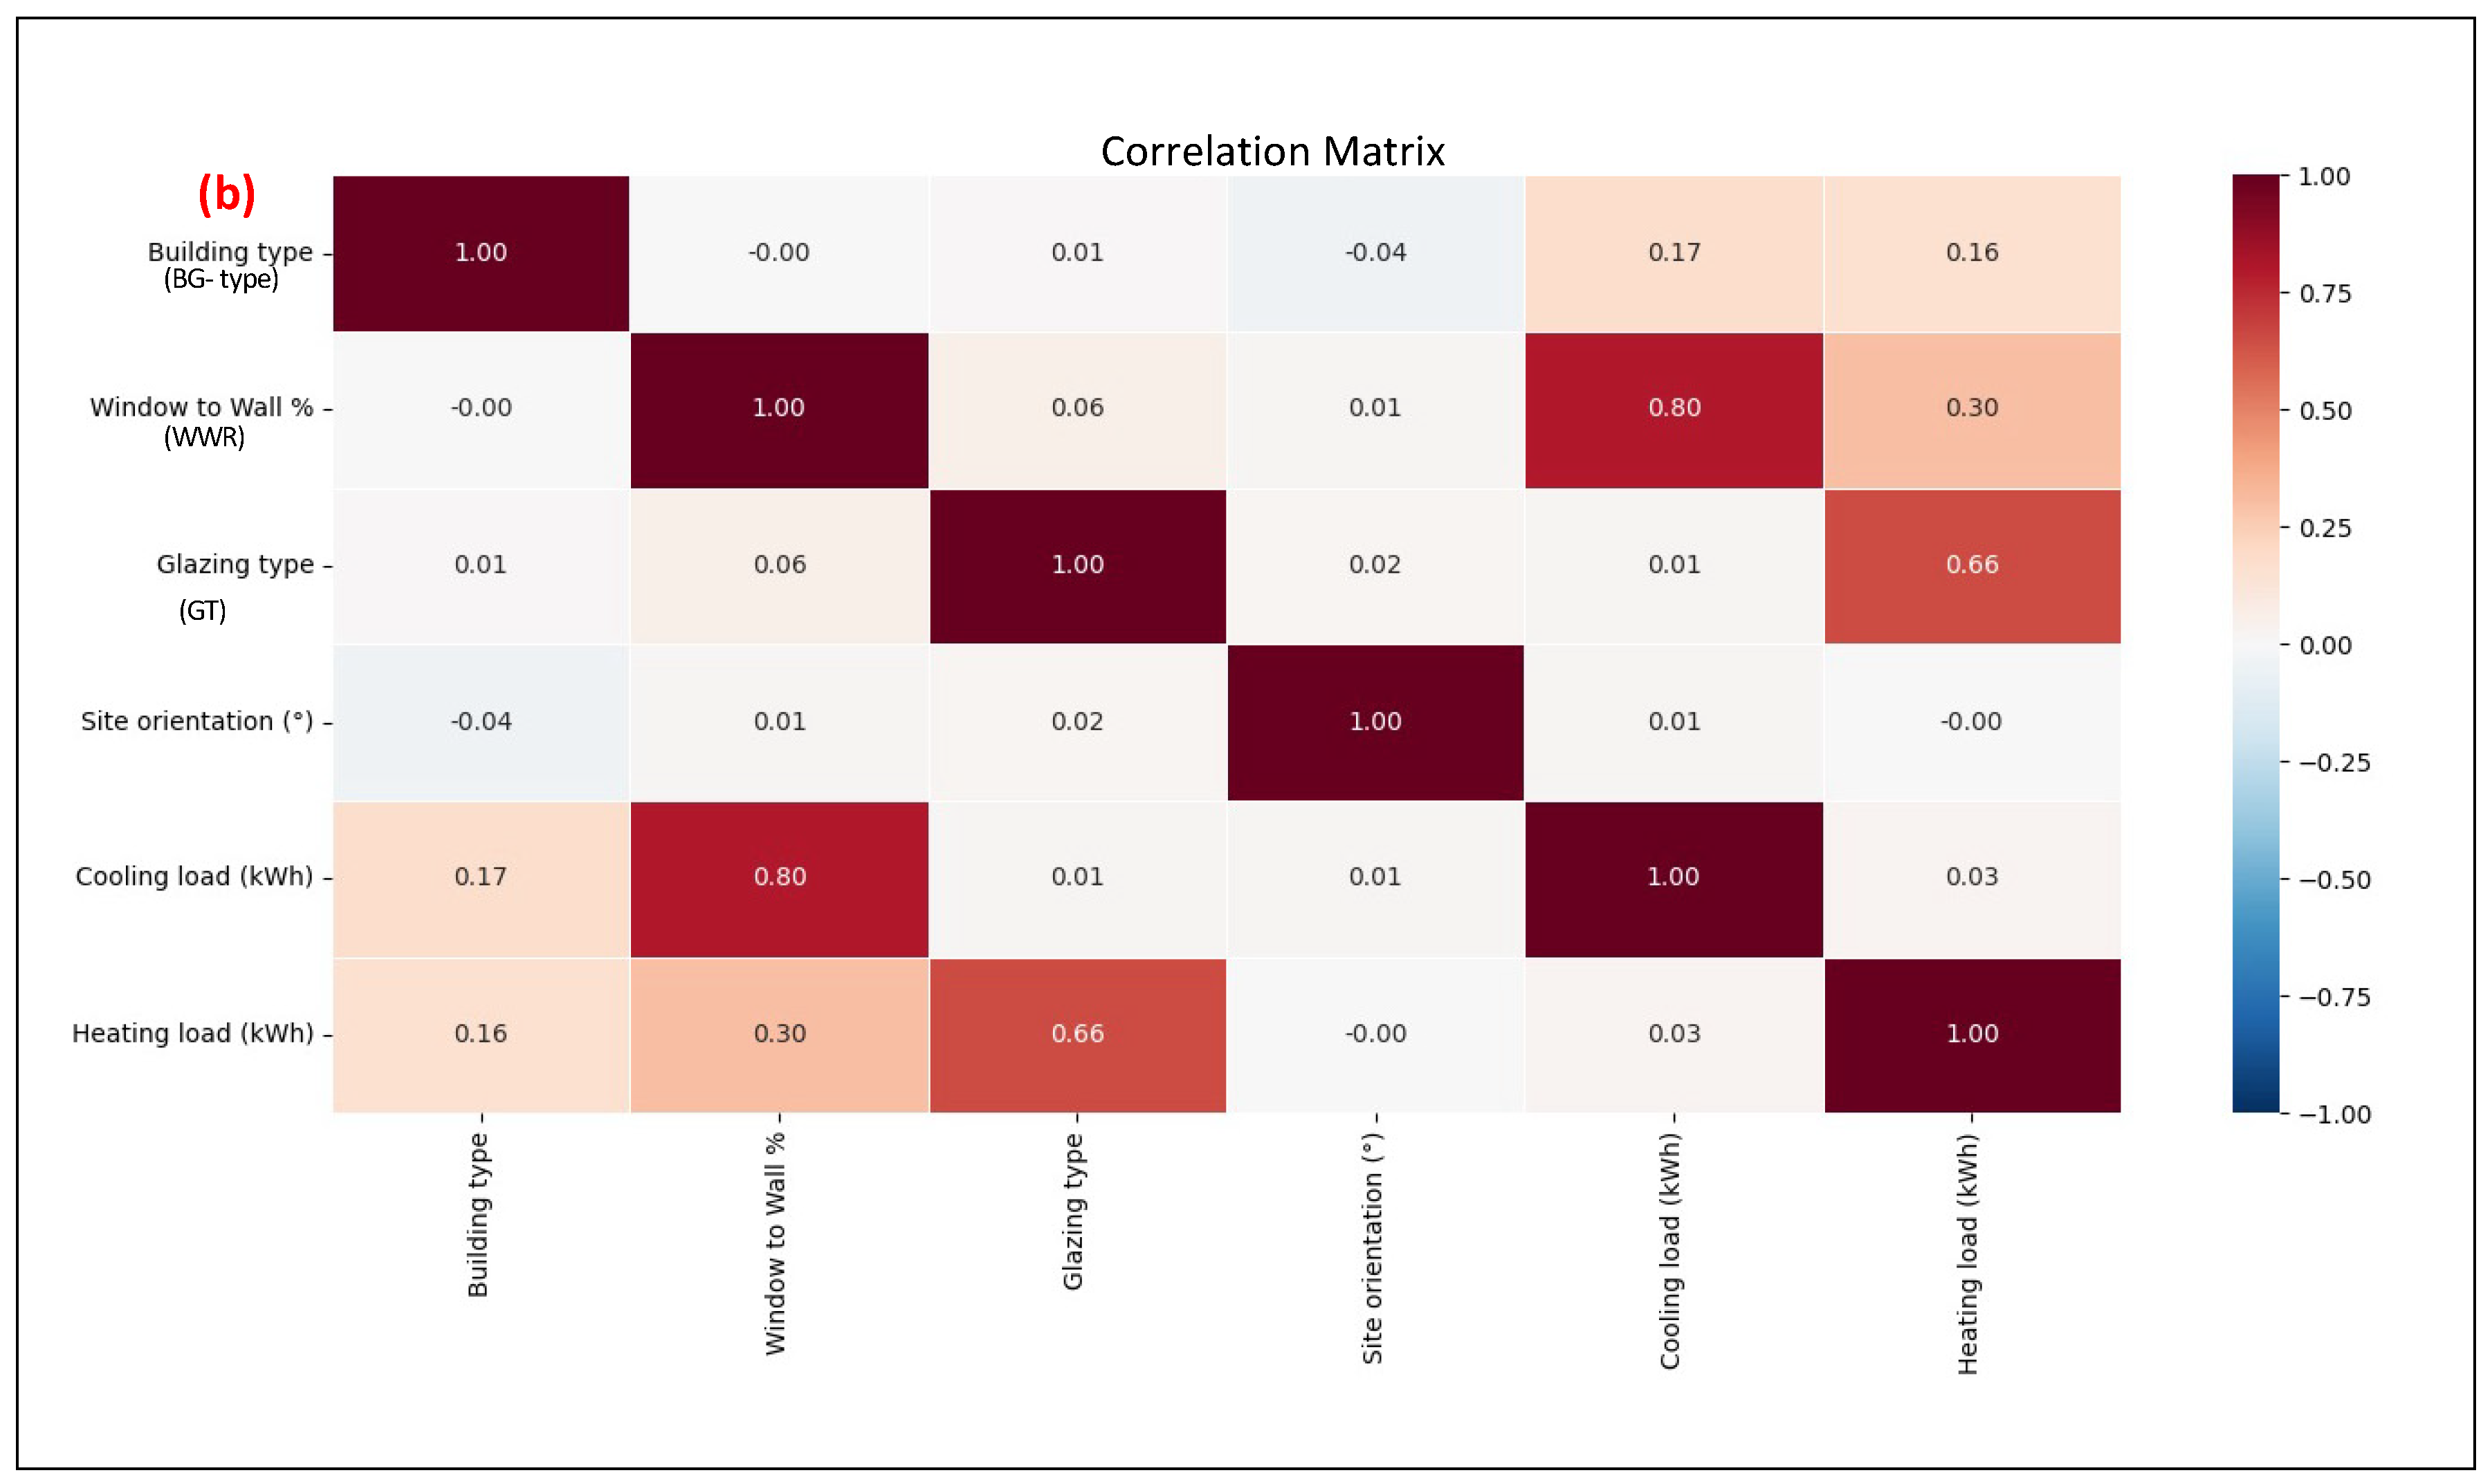
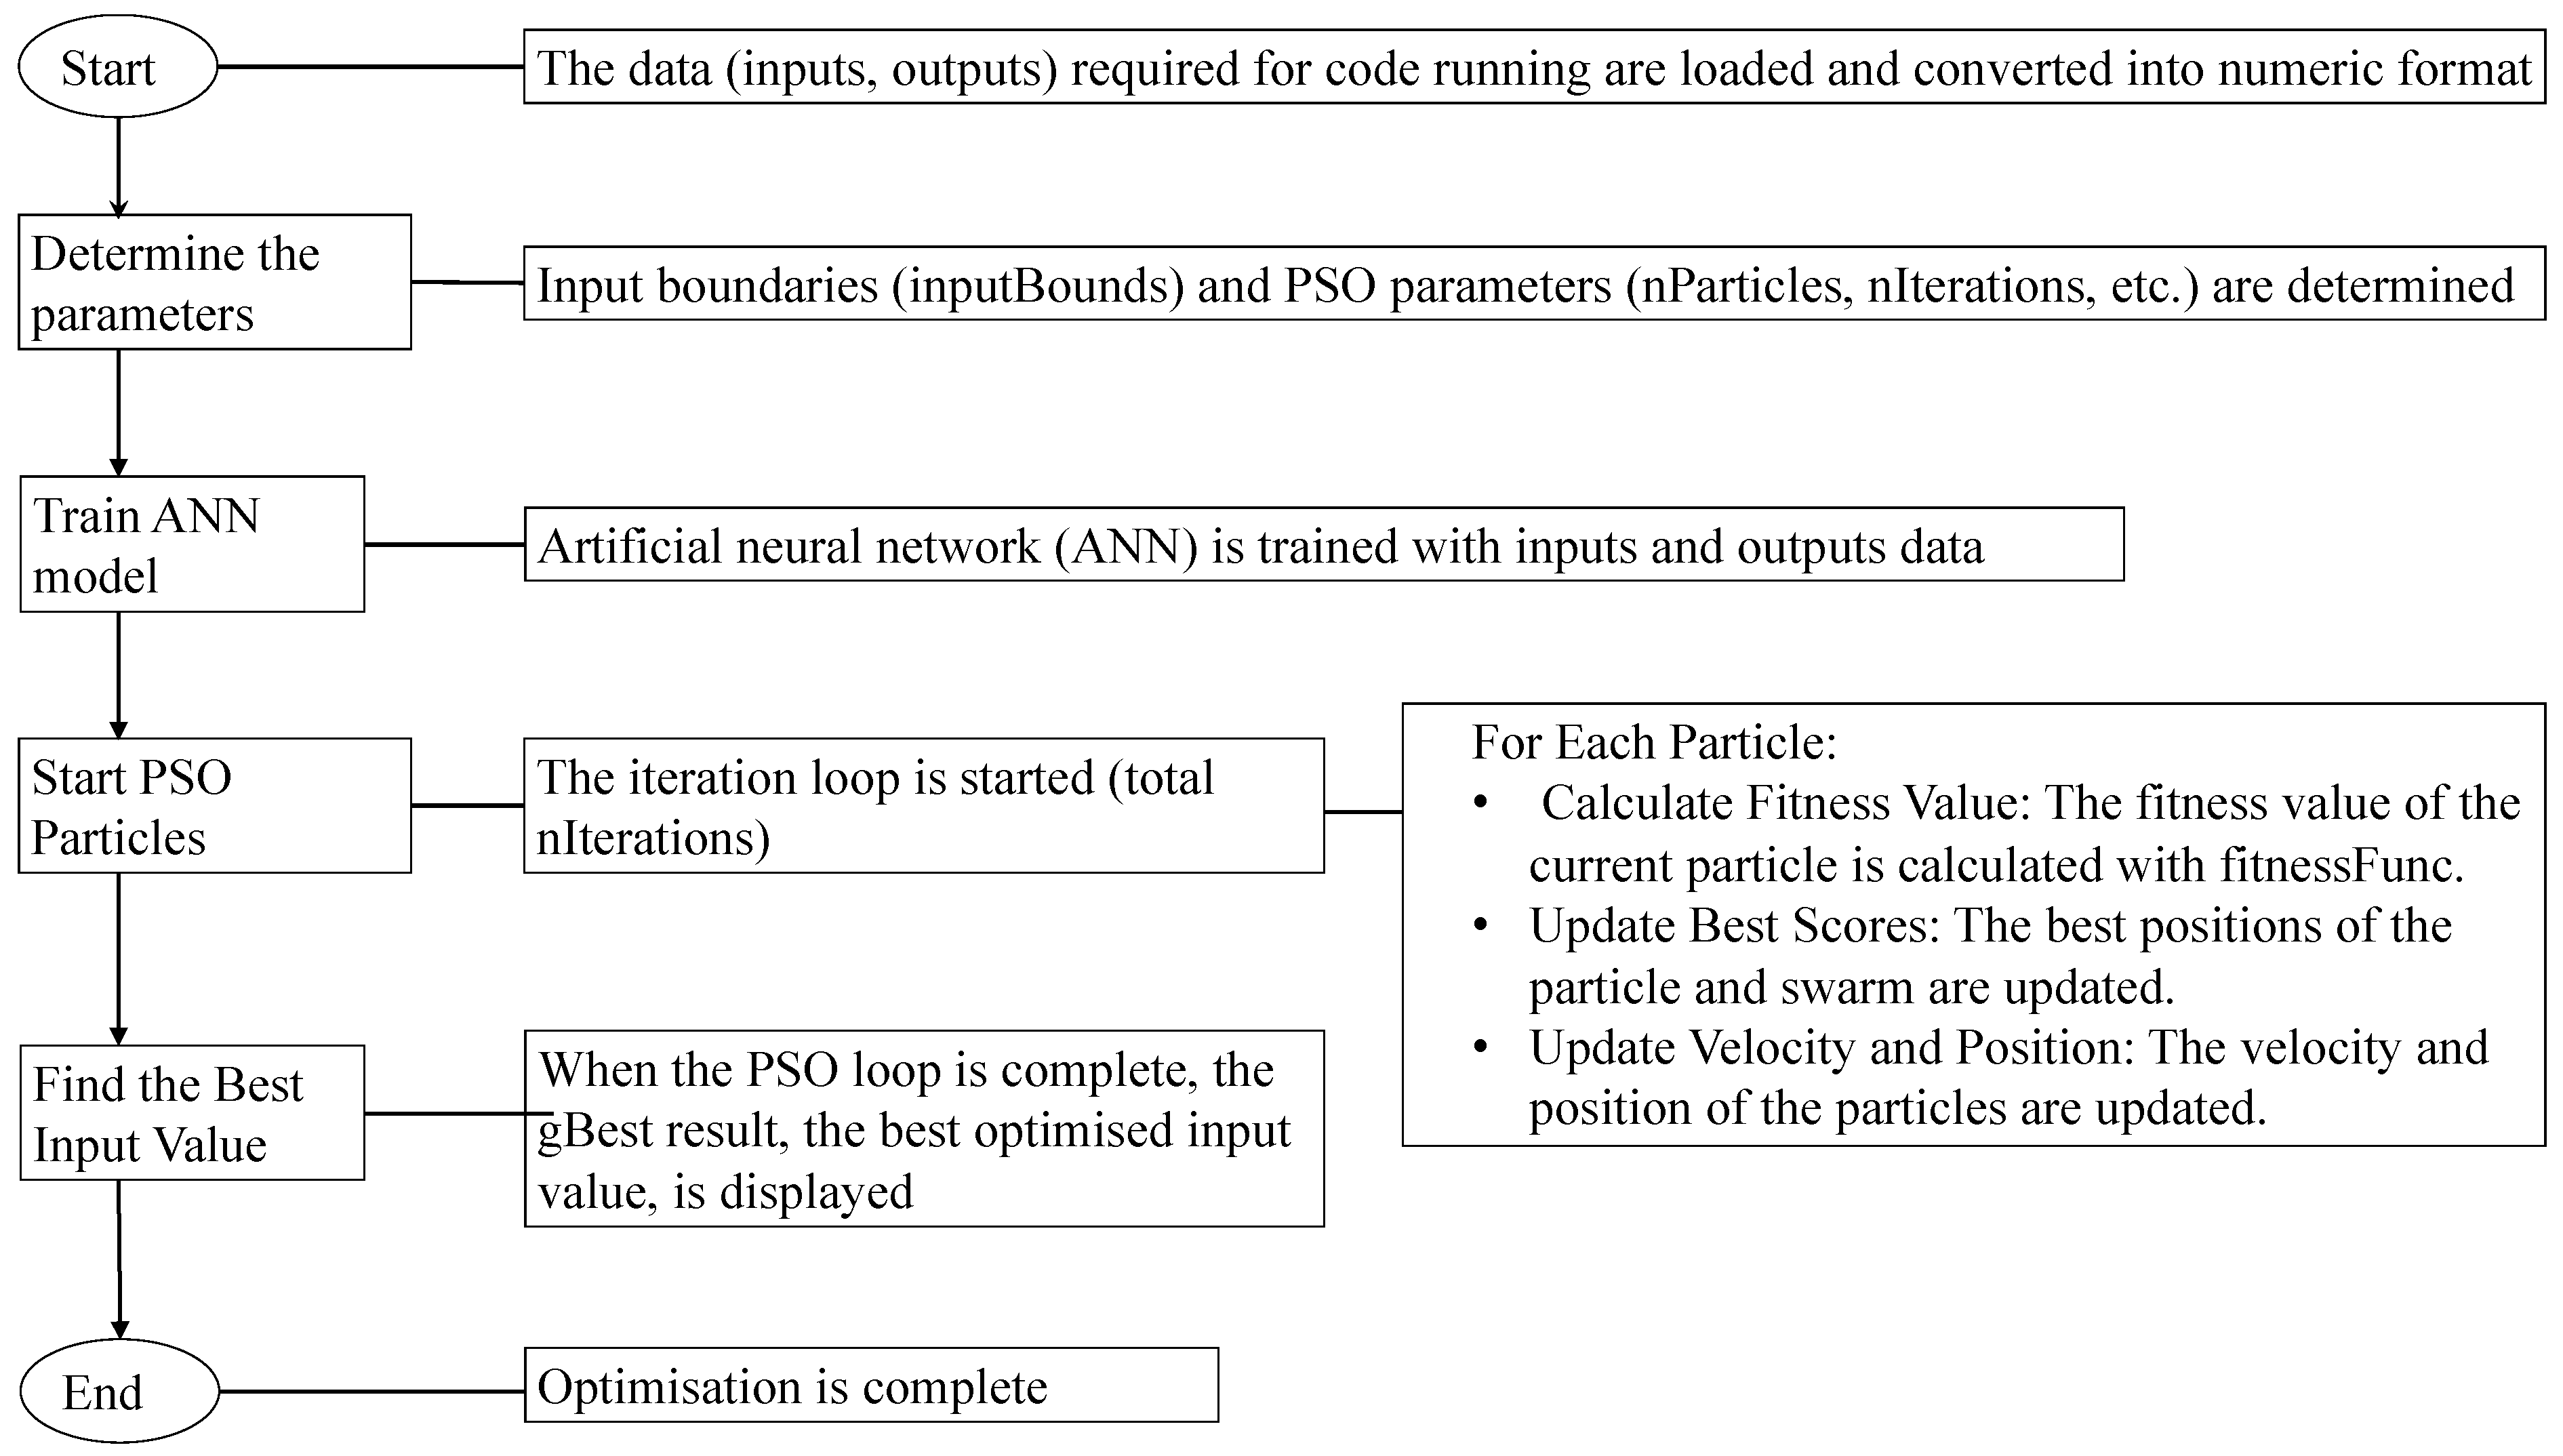

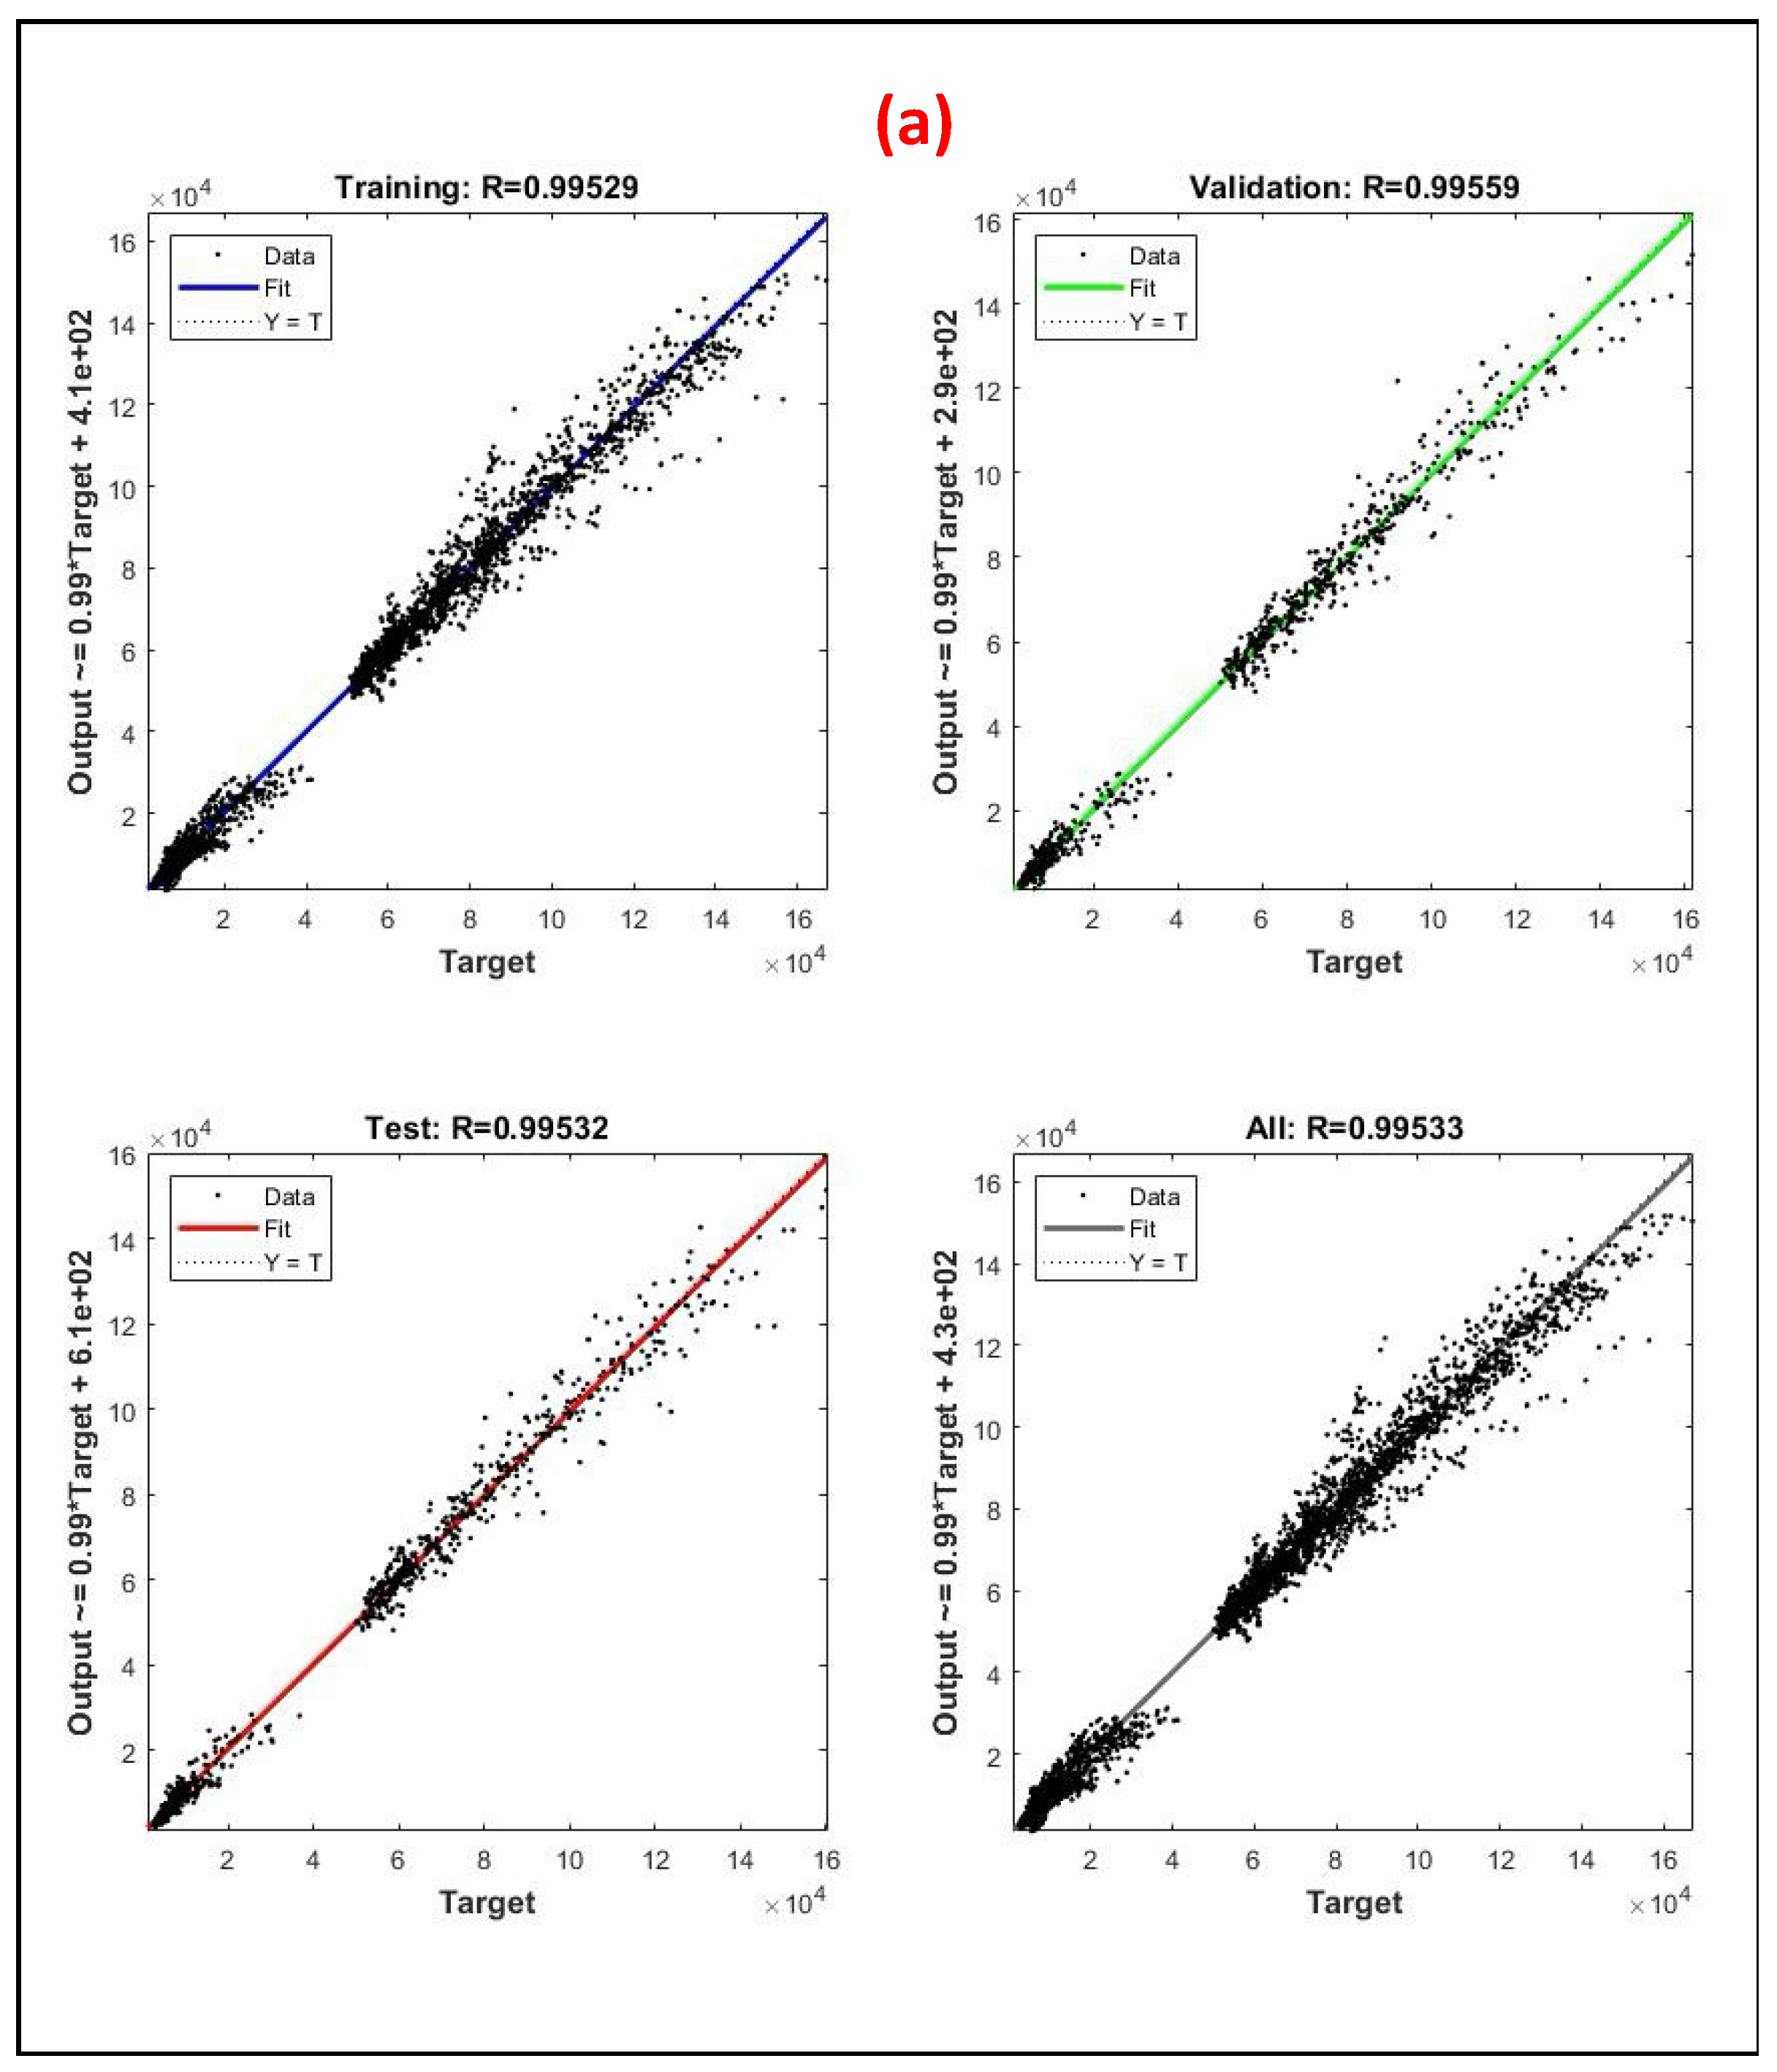
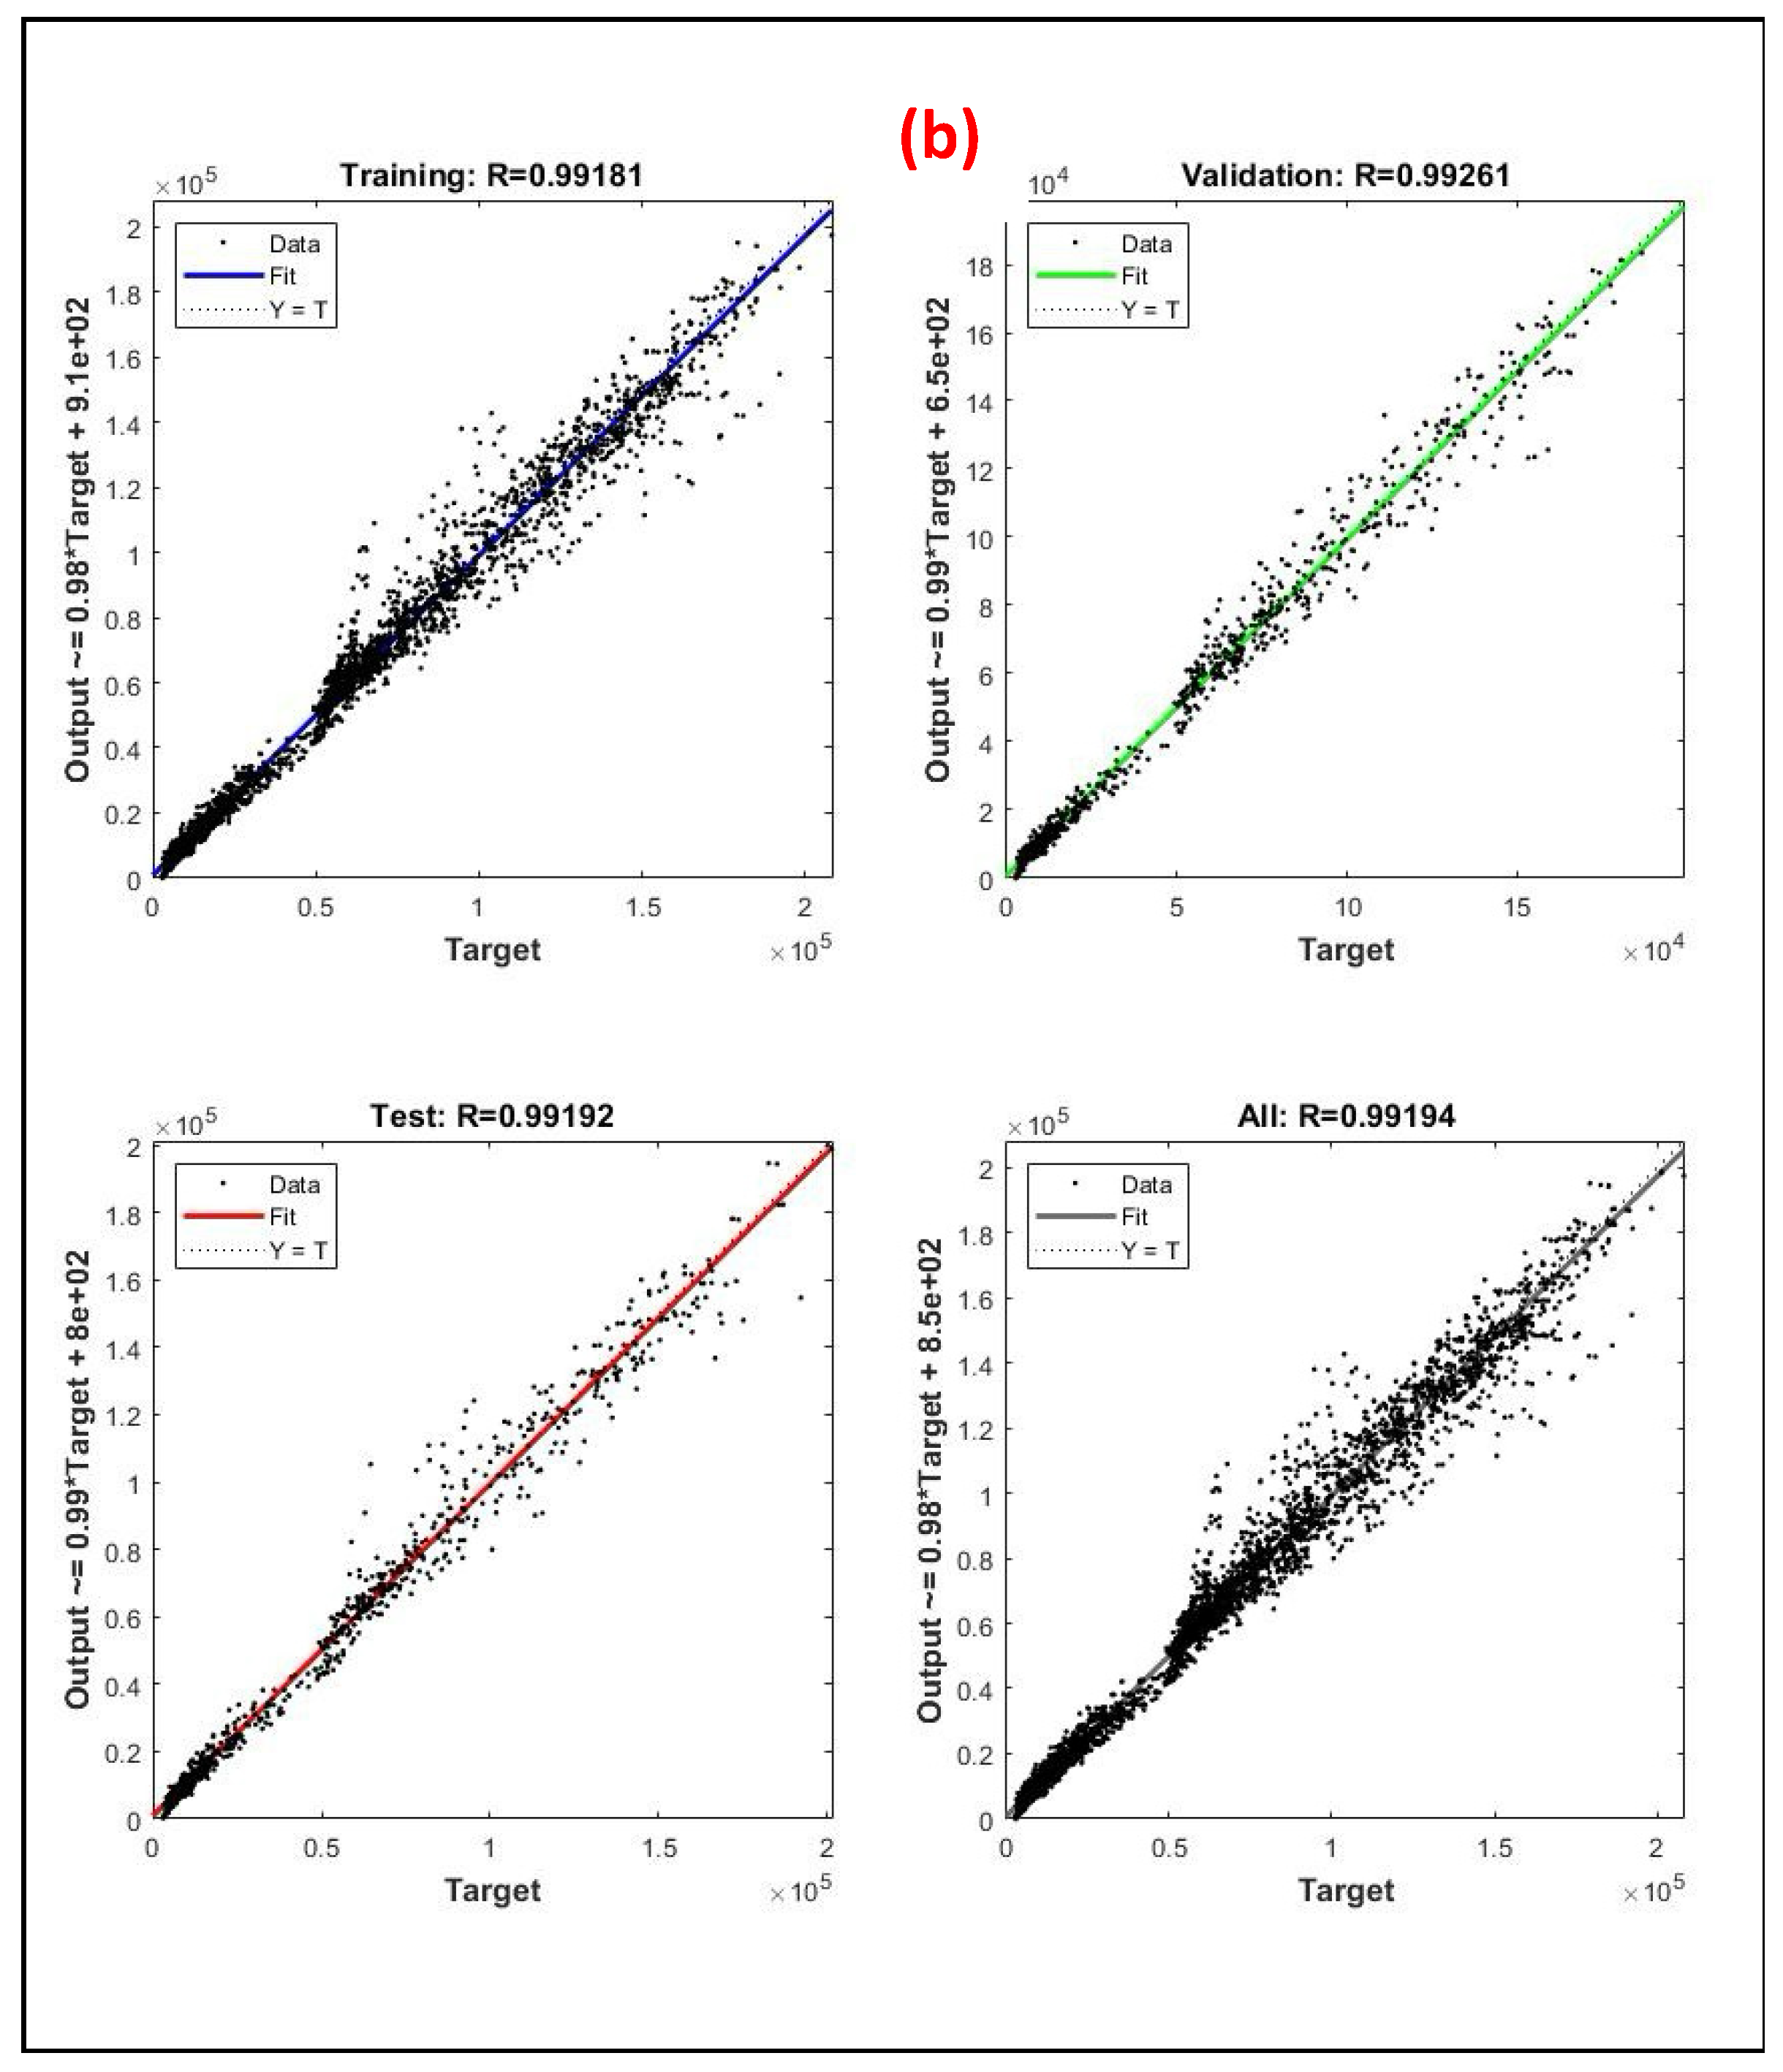
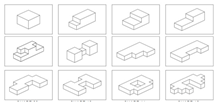
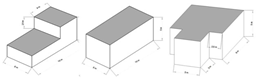

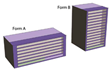
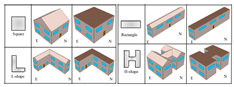

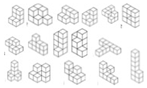
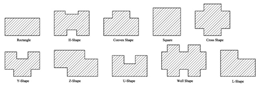
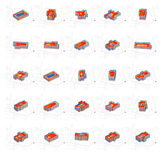
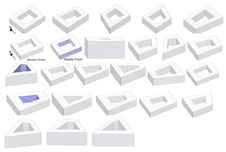
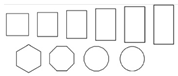
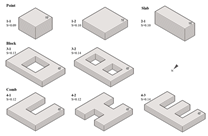

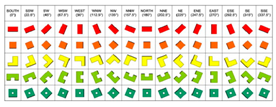
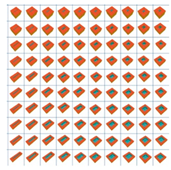


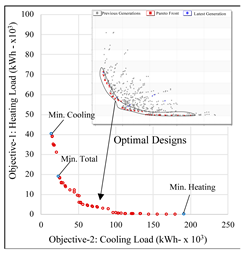
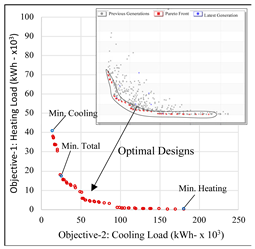
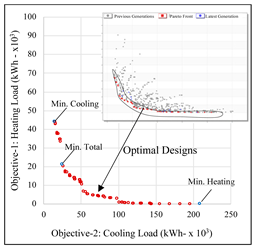


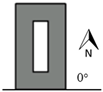
Disclaimer/Publisher’s Note: The statements, opinions and data contained in all publications are solely those of the individual author(s) and contributor(s) and not of MDPI and/or the editor(s). MDPI and/or the editor(s) disclaim responsibility for any injury to people or property resulting from any ideas, methods, instructions or products referred to in the content. |
© 2025 by the author. Licensee MDPI, Basel, Switzerland. This article is an open access article distributed under the terms and conditions of the Creative Commons Attribution (CC BY) license (https://creativecommons.org/licenses/by/4.0/).