Article

Resource Intensity in the Japanese Transportation System: Integration of Vehicle and Infrastructure

1
Department of Mechanical Engineering, College of Science and Engineering, Ritsumeikan University, Noji-Higashi 1-1-1, Kusatsu-shi 525-8577, Shiga, Japan
2
Global Innovation Research Organization, Ritsumeikan University, Noji-Higashi 1-1-1, Kusatsu-shi 525-8577, Shiga, Japan
3
Graduate School of Environmental Studies, Nagoya University, Nagoya 464-8601, Aichi, Japan
*
Author to whom correspondence should be addressed.
Sustainability 2025, 17(6), 2437; https://doi.org/10.3390/su17062437
Submission received: 9 December 2024 / Revised: 23 February 2025 / Accepted: 5 March 2025 / Published: 11 March 2025
(This article belongs to the Section Resources and Sustainable Utilization)

Abstract

:
An evaluation of resource efficiency by the transportation system is essential. Resource efficiency was examined from the perspective of mining activity in the form of resource intensity of transportation systems by combining transportation means and infrastructure. The framework of transport infrastructure was developed under a standardized classification to compare the entire transportation sector for various modes of transportation. This framework consists of links, support for links, nodes, fuel supply, and tanks for roadways, railways, aviation, and waterways. The developed framework was then applied to the Japanese transportation system, and resource efficiency in terms of passengers per vehicle was estimated by integrating means of transportation with associated infrastructure using the total material requirement as an indicator of mining intensity. It was identified that the transport infrastructure accounts for a high share of the resource intensity of passenger cars (15–30%) and railways (50–80%). Notably, even considering the massive mining demand for the development of transport infrastructure, the resource efficiency of railways is the highest among various transportation modes.

1. Introduction

Global energy consumption has grown tremendously in the last few decades. The energy consumption in the transportation sector is significant among various energy-intensive sectors [1]. Although energy consumption is expected to increase in the future, greenhouse gas emissions in the transportation sector must be reduced by approximately 20% to 5.7 Gt by 2030 to achieve net zero emissions by 2050 [2].
Towards a zero carbon emission society, studies on the energy and resource efficiency in the transportation system have widely gained attention from the lifecycle perspective, comparing different types of transportation means. It has been commonly reported that the energy efficiency, defined as energy consumption for one person with a mileage of 1 km, of railways is better than that of roadways and of aviation (e.g., in Japan [3], the United States [4], China [5], and some Asian countries [6]).
Notably, these studies do not include the energy consumption associated with transport infrastructure in the energy efficiency study. The form of infrastructure varies depending on transportation mode. For example, regarding the infrastructure of railways, various materials (e.g., Fe for rail) are required to be used as inputs, causing a significant amount of energy consumption [7]. Thus, the integration of vehicles and associated infrastructure might bring different trends in the energy and resource efficiency of various transportation modes.
Although the transport infrastructure gained much less attention compared with individual vehicles, some studies have analyzed the environmental impacts of the associated infrastructure. However, the classification of constituents of infrastructure in the transportation system varies in different studies. For example, Gabriel et al. [8], while evaluating the infrastructure in roadways, included fuel charging stations for automobiles as a constituent of infrastructure but excluded roads. Merchan et al. [7], while evaluating the infrastructure in railways, included rail tracks and overhead wires but excluded stations for passengers. Therefore, a comparison of land transportation between roadways (e.g., [8]) and railways (e.g., [7]) cannot be performed because of the differences in the framework of infrastructure considered. This implies that the development of a framework for infrastructure under a standardized classification is required to enable comparisons of the entire transportation sector including infrastructure development for various transportation modes.
In this study, resource efficiency is used as an evaluation indicator of transportation systems. In recent years, the estimation of resource use as an input in the transportation system has received increasing attention. Economic growth across the globe has resulted in intensive resource use associated with transportation systems in excess of their needs for supporting the well being of people [9]. The increasing demand for resources due to vehicle electrification leads to an imbalance between supply and demand for specific mineral resources [10], reduced resource efficiency [11], the risk of mineral depletion [12], and the decline in ore grade [13].
Resource-related issues of infrastructure gain attention in the topic of the volume of resource input. Over the past few decades, as the economy has grown, the infrastructure related to the transportation system has been rapidly developed in many countries, requiring a significant quantity of resources [14] and resulting in the continuous accumulation of materials used for transport infrastructure [15]. The development of infrastructure consumes huge quantities of resources, posing a serious threat to the environment [16]. Stock analysis associated with the construction of infrastructure in the transportation sector was conducted in several countries, including India [16], Canada [17], and China [18], including an estimate for the future [19]. In addition, the importance of resource use in infrastructure development was highlighted through environmental impact analyses of the construction of infrastructure such as roadways [20], railways [21], aviation [22], and waterways [23].
A primary limitation of prior research examining resource use within the transport system lies in the restricted scope of system boundaries employed for resource accounting. While direct material weight has been frequently utilized to assess resource use for transport infrastructure development, this approach presents challenges in accurately estimating the practical environmental impact. Given that the majority of resources are extracted through mining activities and considering the documented negative environmental [24] and biodiversity [25] impacts associated with these operations, the explicit consideration of mining activity volume is crucial for informed resource management discourse. The increasing extraction of natural resources via mining poses a substantial threat to the long-term sustainability of resources essential for the global energy transition [26]. Therefore, the volume of resource use, as viewed from the perspective of mining activity, should be adopted as a key indicator.
Limited scholarly attention has been directed towards analyzing resource utilization within the transportation sector from a mining perspective. While studies such as Takimoto et al. [27] and Watari et al. [26] have identified substantial increases in mining demand driven by the automotive industry based on the mining intensity of various vehicle types [28], a gap remains in the literature. Even within the automotive sector, resource use associated with infrastructure development has received scant analysis. Furthermore, other crucial transportation modes, including railways, waterways, and aviation, have been largely overlooked. This omission precludes a comprehensive comparative analysis of different transportation modalities that considers both vehicle production and infrastructure requirements. Consequently, this study aims to develop a standardized classification framework for transport infrastructure, enabling comparisons across diverse transportation modes. Subsequently, by integrating transportation means with their associated infrastructure (roadways, railways, aviation, and waterways), the research will estimate the resource efficiency of the transportation system from a mining demand perspective. The contributions of this study are twofold: (1) the provision of a standardized transport infrastructure framework for intermodal comparison, applicable also to the analysis of other environmental indicators within the transport system; and (2) the identification of the most resource-efficient transportation mode, considering mining activity, through the integrated assessment of both vehicle and infrastructure.

2. Framework of Transport Infrastructure

First, we present an overview of the system boundaries of the transport infrastructure. Then, we categorize the transport infrastructure within the system boundaries.

2.1. System Boundaries of Transport Infrastructure

It is necessary to define terms related to transportation for classification. The transportation mode is defined as a particular transport style that corresponds to roadways, railways, aviation, and waterways. Transportation means is defined as a vehicle for moving from one place to another, such as a passenger car, bus, train, airplane, or ship.
Infrastructure is a collective name for all the elements that support the foundation of human activities, including industry and life. Infrastructure is classified into social (e.g., educational, health, cultural, and financial) and economic (e.g., energy, communication, and transportation) sectors [29,30]. Based on these, in this study, transport infrastructure is defined as the facilities that support human and material mobility.
It is necessary to clarify the system boundaries of the transport infrastructure, which can be applied to different transportation modes. Transportation infrastructure is classified into primary and secondary transport infrastructures to set its system boundaries. The infrastructure that supports the economic foundation in various fields is classified into categories of energy, communication, and transport. Each of these categories is associated with social services, that is, the infrastructure necessary for performing work, sharing information, and moving goods and people corresponding to energy, communication, and transportation, respectively.
In this study, the primary transport infrastructure is defined as being associated with the moving of transportation means without interaction with other categories of infrastructure. For instance, essential facilities that are required by transportation modes in the primary transport infrastructure include roads, railroads, stations, and fuel stations. The secondary transport infrastructure is that which supplementarily supports mobility across multiple categories of infrastructure. Examples of secondary transport infrastructure include 1. facilities for electricity supply such as power stations, electric wires, and telegraph poles that are primarily included in the energy infrastructure, which supplementarily supports traffic lights and outside lights used in the transportation sector, and 2. facilities, such as satellites, that share operational information associated with transportation means that are included in the communication sector, which supplementarily supports transportation systems.
We focus on the primary transport infrastructure in this study and exclude secondary infrastructure to restrict only the transportation sector and show the differences between different transportation modes.

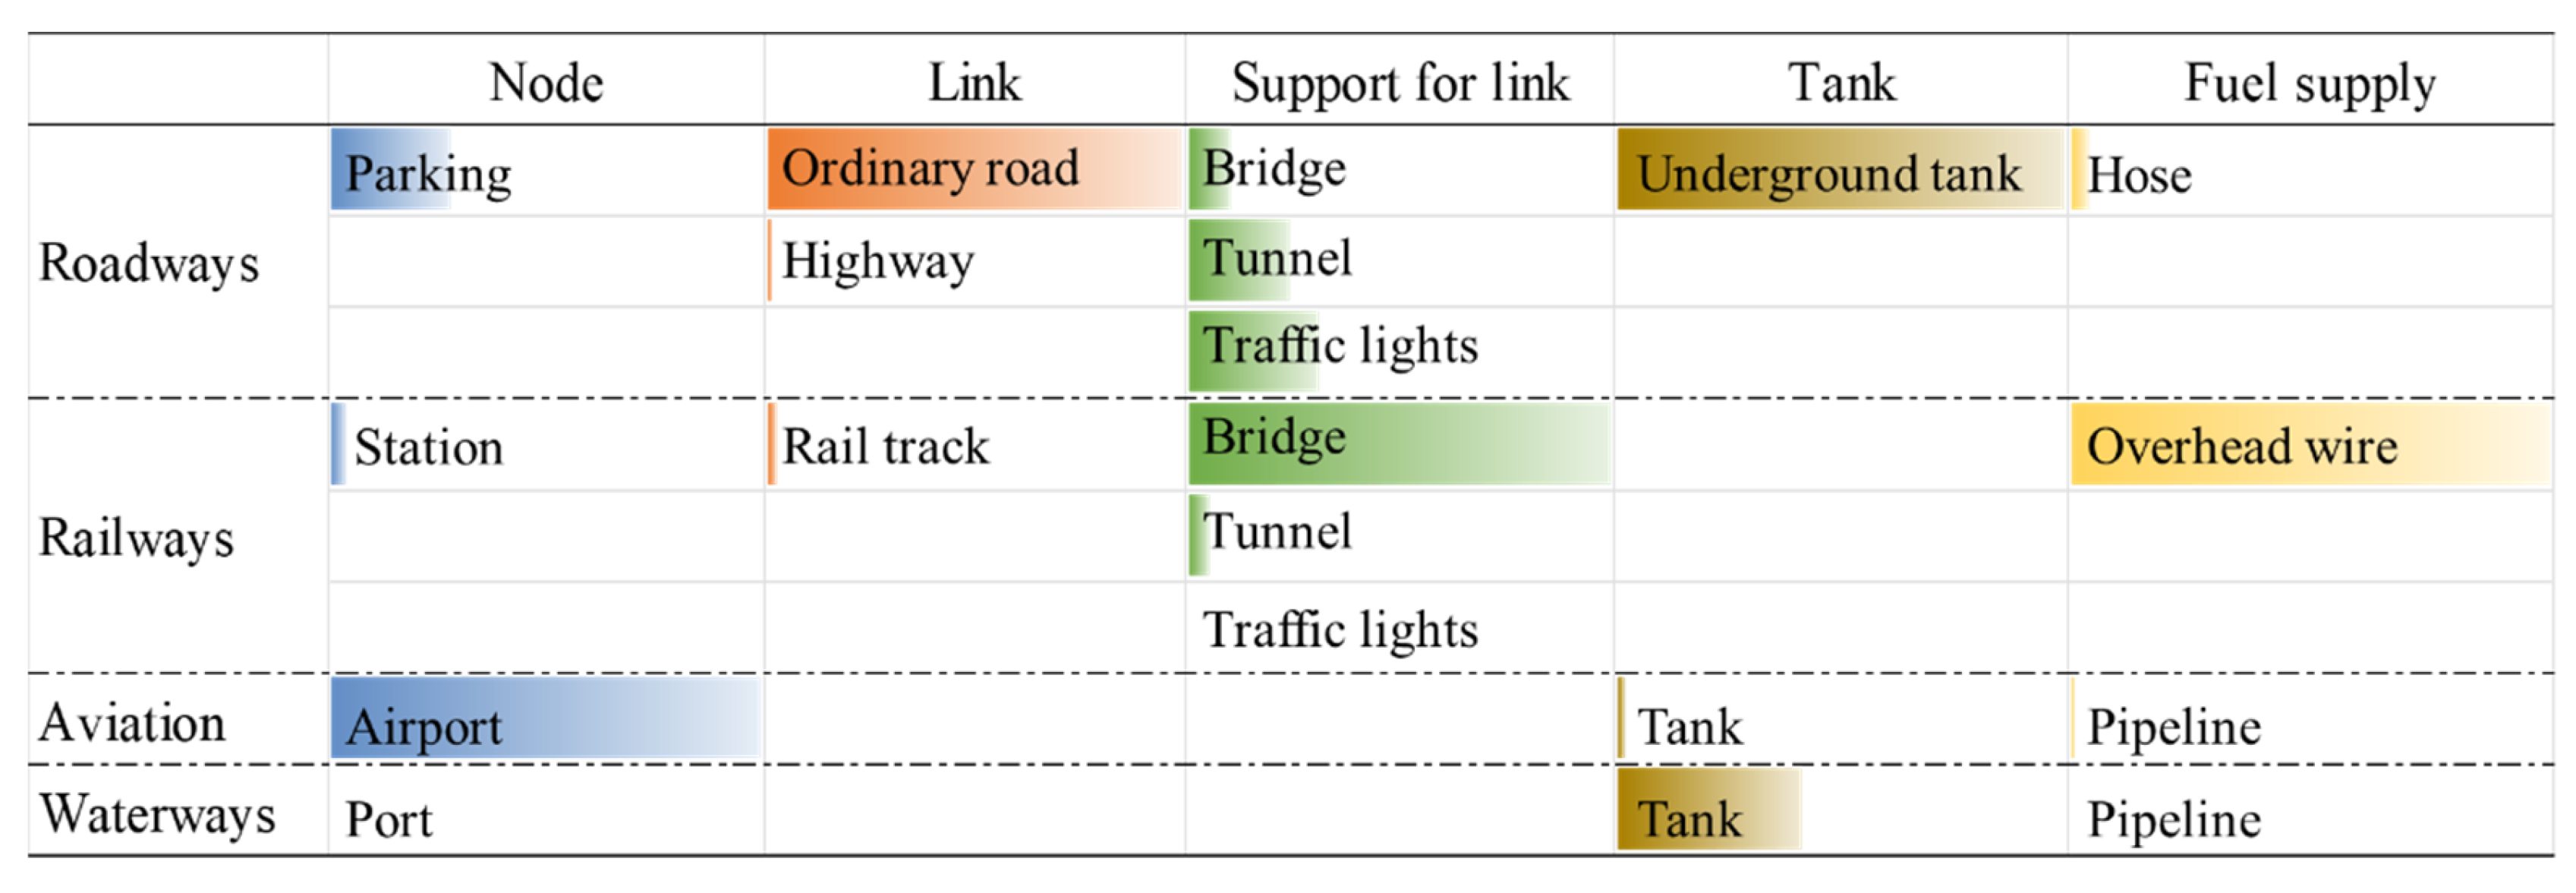
2.2. Categorization of the Primary Transport Infrastructure

Primary transport infrastructure was categorized into a mobility foundation and a fuel station to develop its framework and compare it based on different transportation modes.
The mobility foundation is the essential component of the primary transport infrastructure as it leads movement from one place to another, especially the foundation with a specially prepared surface or space that can be used by transportation means. The concepts of “node” and “link”, which are commonly used in the logistics industry, are applied to the category of the mobility foundation. A “node” is defined as a place where transportation means stop and passengers get on and off. The node in this study corresponds to parking lots for roadways, train stations for railways, airports for aviation, and ports for waterways. A “link” is defined as a route connecting a node. The link in this study corresponds to roads for roadways and railway lines for railways. And, “support for link” is defined as facilities attached to a link, such as a tunnel, bridge, traffic light, and outside light, which assist the transportation means in operating smoothly.
Fuel stations are the other essential components of the primary transport infrastructure, which are needed to supply fuel for use in various transportation means. The fuel station is categorized as the “tank” in which fuel for transportation means is stored, and “fuel supply” is the equipment used to supply fuel to various transportation means. It must be noted that a support vehicle used for fuel supply from the tank to aircraft in aviation and ferries in waterways was not considered in this study.
The overview of the primary transportation mode is shown in Figure 1, and the detailed facilities for each transportation mode are shown in Table 1.

3. Methodology

3.1. Total Material Requirement

To evaluate the resource efficiency of various transportation modes from the perspective of mining activity, the resource indicator needs to be selected.
Natural resources are extracted from the lithosphere and ultimately dispersed into the ecosphere [31]. This process of natural resource utilization engenders environmental impacts [32], for which various methodological approaches within Life Cycle Impact Assessment (LCIA) have been documented [33]. This study focuses on the quantification of natural resource use volume. Natural resources, originating within the lithosphere, are subject to extraction and exploitation through mining activities, which represent the depletion of lithospheric natural capital stocks. Evaluating the scale of mining activities enables the quantification of natural resource extraction.
One potential approach to estimating the mining activity scale involves measuring the associated land area, given that mining activities are categorized as a form of anthropogenic land use [34]. Land use is a recognized factor influencing environmental impacts within LCIA frameworks. Common indicators of land use include land occupation and transformation areas [35]. Notably, the quantification of land surface area (m2) does not comprehensively reflect the total volume of extracted resources, including mine waste, as it fails to account for variables such as mine depth. Given the absence of a universally accepted quantification approach for land use, the exclusive application of land surface area to evaluate mining activities and resource use may be deemed inadequate.
Therefore, in lieu of land surface area, a specific metric for quantifying resource use derived from mining activities is warranted. Weight provides an alternative measure of the scale of land disturbance associated with mining. Indeed, mining activities globally displace over 57 billion tons of lithospheric material annually [36]. To evaluate the volume of natural resource use in the transportation system, this study focuses on the quantification of land disturbance weight resulting from the mining of primary lithospheric resources. This aligns with the principle of total material requirement (TMR), which is an indicator to quantify resource use [37].
TMR considers all material inputs involved in the mining activity, including hidden flows, which allows for including a most extensive range of system boundaries compared to other resource-related indicators, such as direct material input and raw material equivalent [38]. TMR encompasses not only direct and indirect resource inputs but also hidden flows. Hidden flows are defined as mining waste, such as mining overburden or soil excavation, associated with the extraction of raw materials. Mining activity brings negative damage to the surrounding environment and the local biodiversity [25], which implies the importance of considering hidden flows in discussing resource use. In recent years, TMR has been applied to the transportation sector for the estimates of resource use (e.g., various types of automobiles [28], global automotive sector [26,27]) and gained great attention.
The quantity of resource use on a TMR basis was estimated using Equation (1). “TMR” represents the weight of the product on a TMR basis (kg-TMR), X n represents the TMR coefficient of each material, and W n represents the weight of the material (kg).
T M R = X n   ·   W n

3.2. Resource Intensity Evaluation

Four transportation modes, including roadways, railways, aviation, and waterways, were considered and the stages of production, operation, and maintenance for transportation means and primary transport infrastructure were analyzed.
Firstly, the use of resources by transportation means was calculated per unit, and the use of resources by the primary transport infrastructure was calculated on a national scale by referring to Equation (1). The detailed calculation process is presented in the Supplementary Information.
To compare the resource efficiency of various transportation modes, resource use was converted to resource intensity as a functional unit. Resource intensity is defined as the quantity of resource use required to transport one person by 1 km, represented as Pkm. A lower resource intensity corresponds to higher resource efficiency.
The resource use of the primary transport infrastructure was calculated on a national scale, which is different in terms of the evaluation subject from that of the use of resources by transportation means per unit. Before estimating the resource intensity of each transportation mode, the estimated resource use of the primary transport infrastructure on a national scale must be allocated to an individual transportation means. The allocation process is as follows.
It is necessary to discuss the lifetime of the primary transport infrastructure based on the transportation means. The quantity of resource use associated with the primary transport infrastructure was modified by adopting the rate of the lifetime of the primary transport infrastructure to that of transportation means as a weighting factor. Then, the use of resources by the primary transport infrastructure was converted to each transportation means to be integrated with that of transportation means. The resource use associated with the primary transport infrastructure was allocated based on the number of transportation means (roadways and railways), the number of aircraft switching away (aviation), and the number of ships entering ports (waterways).
Based on these, the quantity of resource use based on the TMR of each stage for primary transport infrastructure per transportation means was calculated using the following equation:
I i = U i Z   ·   S T S I
where I i represents the TMR of the primary transport infrastructure per each transportation means under the stage of i (production, operation, and maintenance), U i represents the TMR the primary transport infrastructure on a national scale under the stage of i (production, operation, and maintenance), Z represents the allocation indicator of each transportation means explained above, such as the number of transportation means, aircraft switching away, and ports, S T represents the lifetime of transportation means, and S I represents the lifetime of the primary transport infrastructure.
Finally, resource intensity was calculated using the following equation:
Q = T i + I i   L   ·   N
where Q represents the resource intensity of each transportation mode, T i represents the TMR of each transportation means under stage i (production, operation, and maintenance), I i represents the TMR of the primary transport infrastructure per each transportation means under stage i (production, operation, and maintenance), L represents total mileage, and N represents the number of passengers.

3.3. Data Collection

The Japanese transportation system is selected as a case study for the quantitative analysis of resource efficiency. In this study, it is required to select, for a comparative analysis, a country in which various transportation modes including roadways, railways, airways, and waterways are well developed. In Japan, most of the cities are connected through these transportation modes and thus, Japan is suitable for this assessment.
Inventory data for each transportation mode, including transportation means and associated primary transport infrastructure, in Japan are summarized in the Supplementary Information.

4. Results

4.1. Resource Use Under the Production of Primary Transport Infrastructure in Japan

The quantity of use of resources by the primary transport infrastructure on a national scale in Japan for each transportation mode was calculated. The results are shown in Figure 2.
The quantity of use of resources by the primary transport infrastructure increases in the order of waterways, railways, aviation, and roadways. Specifically, roadways have resource use that is 18 times higher than railways, 13 times higher than aviation, and 450 times higher than waterways. Each category under the developed framework of the primary transport infrastructure was compared between each transportation mode (Figure 3). The contribution of an airport in aviation is the highest among the nodes. Ordinary roads in roadways constitute the highest link. Bridges in railways form the highest support for links. Underground tanks in roadways constitute the highest tank. The overhead wire for railways is the highest in terms of fuel supply.
For roadways, roads have a significant impact on resource use, followed by maintenance associated with roads, and these two components account for approximately 95% of resource use. Ordinary roads and highways accounted for approximately 98 and 2%, respectively. Japan has the highest road density among the G20 countries, and ordinary roads have been developed in many routes through mountains, accounting for approximately 70%. On the other hand, the use of resources by nodes (e.g., parking lots), support for links (e.g., tunnels, bridges, and traffic lights), fuel stations, and operation of the primary transport infrastructure are negligibly low.
For railways, bridges and rail tracks have an impact on the use of resources by the primary transport infrastructure. Both links and support for links accounted for approximately 75% of the resource use. As Japan has many mountains and rivers, numerous constructions of support for links, especially bridges, were implemented to connect cities more easily.
For aviation, airports have a significant impact in terms of the use of resources by the primary transport infrastructure, accounting for approximately 70%. For the construction of airports, a higher quantity of resources (e.g., asphalt and cement) is needed to improve the suitability of the ground (e.g., runway) compared to other components in aviation (e.g., tanks and pipelines).
For waterways, the operation stage for primary transport infrastructure accounts for 60% of the whole requirement of resource use because they do not require links and the infrastructure development for the transportation means remains intact for a long duration, which is different from those of other transportation modes.
The use of resources by the primary transport infrastructure based on TMR accounts for approximately 50% of the total annual quantity of resource use in Japan, which was estimated using a top-down approach in a previous study [39]. Studies on the analysis of the transportation sector have quantitatively confirmed that the quantity of resource use associated with infrastructure cannot be ignored. Enormous quantities of resources are expected to be used in the transportation sector, particularly in developing countries where the transport infrastructure has not been sufficiently developed. Even in Japan, where transport infrastructure has been well developed, continuous resource use is required for the maintenance of primary transport infrastructure.

4.2. Resource Efficiency

The resource intensity of each transportation mode based on TMR in Japan is shown in Figure 4. The resource intensity of each transportation means integrated with the associated primary transport infrastructure was focused on to compare resource intensity in detail according to individual vehicle types of different transportation modes.
Resource intensity varied depending on transportation means, increasing in the order of high-speed railways, conventional trains, ICE buses, aircraft, ICEVs, FCVs, HEVs, ferries, and BEVs.
The trend in resource use of vehicles as transportation means without including the primary transport infrastructure was examined as follows. Depending on transportation means, two trends were observed as follows: (1) every lifecycle stage has a contribution to resource intensity and (2) only the operational stage has an impact on resource intensity. For passenger cars, CRs, and HSRs, each lifecycle stage of transportation means has an impact on resource intensity. Especially, for HEVs, BEVs, and FCVs, the use of metals and materials used in traction batteries have high TMR coefficients and cause an increase in resource intensities of both the production and maintenance stages [28]. The operational stage dominates resource intensity in the cases of ICE buses, aircraft, and ferries because of the higher value of the TMR coefficient of fuels and the relatively higher quantity of fuel requirements in the total lifetime mileage.
The impact of the primary transport infrastructure on the integration of resource intensity was examined as follows. The stages of development and maintenance of the primary transport infrastructure have impacts on resource intensity in passenger cars (e.g., 30%, 20%, 15%, and 25% for ICEVs, HEVs, BEVs, and FCVs, respectively) and railways (e.g., approximately 50 and 80% for conventional trains and high-speed railways, respectively). On the other hand, the infrastructure stage accounted for less than 1% of the resource intensity of aircraft, ferries, and ICE buses. As mentioned above, the resource input under the operation stage of transportation means is significant. In addition, for ICE buses, as the number of vehicles is much less than that of passengers, the limited use of resources by the primary transport infrastructure was evidenced.
Thus far, the transport infrastructure has not been integrated into the analysis of the resource efficiency of transportation means. This study shows that primary transport infrastructure has an impact on resource intensity in some transportation modes. Notably, even after considering transport infrastructure, the resource efficiency of railways was the highest among various transportation modes. To efficiently use resources in the transportation sector, the promotion of railways would be the most effective from the resource perspective, even if a high quantity of resources is invested in the primary transport infrastructure associated with it.

5. Discussion

5.1. Sensitivity Analysis

A sensitivity analysis was performed to identify the influential factors. The parameters for the calculation of resource intensity included occupation rate, fuel economy, total mileage, and resource intensity of energy mix. These were changed within ±30%, and the results are shown in Figure 5. Here, the case of BEVs, high-speed railways, aircraft, and ferries was picked up to demonstrate the features of different transportation modes.
For all transportation means, the occupation rate is the most influential factor in the calculation of resource intensity. The total mileage in passenger cars and railways and the fuel economy in aircraft and ferries are the second most influential factors. As the operational stage of passenger cars and railways have a limited share in resource intensity, fuel economy and change in the energy mix for these vehicles is not as influential as in aviation and ferries. Total mileage has an impact on all lifecycle stages because the functional unit of resource intensity in terms of Pkm is more sensitive.
Japan is facing a turning point in terms of transportation systems in anticipation of the decrease in population and the advent of a super-aged society. This might have an influence on the resource intensity of the domestic transportation sector. In particular, based on the sensitivity assessment, strategies for reducing resource intensity associated with socioeconomic aspects, such as occupation rate, are required for each transportation mode.
For passenger cars, the effective strategy associated with the occupation rate would be ridesharing. In Japan, the population is decreasing while the number of privately owned vehicles is increasing [40], which will further reduce the occupation rate and increase resource intensity. The introduction of a ridesharing system will contribute to an increase in the occupation rate. However, there are many problems associated with the development of legislation for promoting ridesharing in Japan due to opposition from the taxi industry and a lack of understanding of the concept. The legal framework should be reviewed by referring to practices adopted by other countries. A demonstration site of a special district for ridesharing should be implemented.

5.2. Implications and Future Work

Resource efficiency was examined from the mining perspective in the form of the resource intensity of transportation systems by combining transportation means and infrastructure. It was presented that transport infrastructure accounts for a high share of resource intensity of passenger cars (30, 20, 15, and 25% for internal combustion engines, hybrid electric, battery electric, and fuel cell vehicles, respectively) and railways (approximately 50 and 80% for conventional and high-speed railways, respectively).
It was acknowledged that the resource intensity of battery electric vehicles is significantly high among various transportation means, whereas it was newly shown in this study that the previous results would be comparatively underestimated when considering the impact of infrastructure development. In addition, it was identified that the amount of resources used for the railway infrastructure is much less than that for roadways and slightly less than that for aviation, and even considering the transport infrastructure, the resource efficiency of railways is the highest among various transportation modes.
In this study, the framework of the primary transport infrastructure was developed, and it is composed of a link, support for link, node, fuel supply, and tank. The developed framework can indicate the resource-intensive components for each transportation mode (e.g., ordinary roads as links for roadways, rail tracks as links and bridges as support for links for railways, and airports as nodes for aviation). This indicates that the comprehensive framework that includes all components in the primary transport infrastructure is essential for the analysis of multiple transportation modes, as intensive components of the primary transport infrastructure vary depending on each transportation mode.
Our framework suggests that existing studies lack an important part of infrastructure in their assessments. For instance, the study by Ribeiro et al. [41] did not consider the node including the airport in aviation, which may have underestimated the emissions of aviation. Kaewunruen et al. [42] showed that bridges are the only important component in railways, whereas, according to our framework, rail tracks are equally important in railways. Rungskunroch et al. [43] indicated that the impact of fuel supply facilities is low, whereas next-generation fuels should be considered. These missing components in the infrastructure analysis were exposed as important factors through our framework. Thus, an effective comparison of different transport infrastructures requires a comprehensive framework that includes various categories.
In this study, the use of natural resources was selected as an indicator for evaluating the performance of transportation modes. The resource intensity of automobiles was the highest among various transportation means. Although automobiles are commonly considered to have high resource and carbon intensities, including infrastructure development, the benefit of roadways cannot be simply ignored. Even if railways, aviation, and ferries are used for specific forms of mobility, the roadways might be used to cover a part of the mobility as a supplement. For example, automobiles are used to reach a station in railways, an airport in aviation, or a terminal in waterways. To consider the importance of roadways in mobility, it is further important to evaluate the overall performance of each transportation mode considering various indicators such as greenhouse gas emissions, resource use, construction cost, and benefits.
After the identification and estimation of resource use in the national transportation system by this study, the next step would be to evaluate resource circularity. The use of secondary materials extracted from transportation means and infrastructure is expected to reduce resource intensity. As the adoption of resource circularity depends on countries and regions, the spatial boundaries should be expanded from the national scale to the global scale diachronically to evaluate the mitigation effects of resources in the transportation system through resource circularity.

Supplementary Materials

The following supporting information can be downloaded at https://www.mdpi.com/article/10.3390/su17062437/s1. Refs. [3,28,44,45,46,47,48,49,50,51,52,53,54,55,56,57,58,59,60,61,62,63,64,65,66,67] are cited on the Supplementary Materials.

Author Contributions

Conceptualization, S.K. (Shoki Kosai), E.Y. and H.T.; methodology, S.K. (Shoki Kosai) and E.Y.; software, N.H.; validation, S.K. (Shunsuke Kashiwakura) and H.T.; formal analysis, N.H.; investigation, N.H. and H.T.; data curation, N.H.; writing—original draft preparation, N.H. and S.K. (Shoki Kosai); writing—review and editing, S.K. (Shunsuke Kashiwakura) and E.Y.; visualization, N.H.; supervision, E.Y.; project administration, E.Y.; funding acquisition, S.K. (Shoki Kosai), E.Y. All authors have read and agreed to the published version of the manuscript.

Funding

This study was partly supported by research funds from KAKENHI (grant numbers 22K18433, 22H03805, 23H00531, 24K20964) and by the Ritsumeikan Global Innovation Research Organization (R-GIRO), Ritsumeikan University.

Institutional Review Board Statement

Not applicable.

Informed Consent Statement

Not applicable.

Data Availability Statement

All data are provided in the article and Supplementary Information.

Conflicts of Interest

The authors declare no conflicts of interest.

Abbreviations

BEVBattery electric vehicle
FCVFuel cell vehicle
HEVHybrid electric vehicle
ICEVInternal combustion engine vehicle
TMRTotal material requirement

References

  1. International Energy Agency. World Energy Outlook 2023. 2023. Available online: https://www.iea.org/reports/world-energy-outlook-2023 (accessed on 4 March 2025).
  2. International Energy Agency. Tracking Transport 2021; IEA: Paris, France, 2021.
  3. Kosai, S.; Yuasa, M.; Yamasue, E. Chronological Transition of Relationship between Intracity Lifecycle Transport Energy Efficiency and Population Density. Energies 2020, 13, 2094. [Google Scholar] [CrossRef]
  4. Lipscy, P.Y.; Schipper, L. Energy efficiency in the Japanese transport sector. Energy Policy 2013, 56, 248–258. [Google Scholar] [CrossRef]
  5. Duan, H.; Hu, M.; Zhang, Y.; Wang, J.; Jiang, W.; Huang, Q.; Li, J. Quantification of carbon emissions of the transport service sector in China by using streamlined life cycle assessment. J. Clean. Prod. 2015, 95, 109–116. [Google Scholar] [CrossRef]
  6. Yang, L.; Wang, Y.; Lian, Y.; Han, S. Factors and scenario analysis of transport carbon dioxide emissions in rapidly-developing cities. Transp. Res. Part D Transp. Environ. 2020, 80, 102252. [Google Scholar] [CrossRef]
  7. Merchan, L.A.; Belboom, S.; Leonard, A. Life cycle assessment of rail freight transport in Belgium. Clean Technol. Environ. Policy 2020, 22, 1109–1131. [Google Scholar] [CrossRef]
  8. Gabriel, R.N.; Martin, K.; Haslam, J.S.; Faile, C.J.; Kamens, M.R.; Gheewala, H.S. A comparative life cycle assessment of electric, compressed natural gas, and diesel buses in Thailand. J. Clean. Prod. 2021, 314, 128013. [Google Scholar] [CrossRef]
  9. Saade, M.; Erradhouani, B.; Pawlak, S.; Appendino, F.; Peuportier, B.; Roux, C. Combining circular and LCA indicators for the early design of urban projects. Int. J. Life Cycle Assess. 2022, 27, 1–19. [Google Scholar] [CrossRef]
  10. Elshkaki, A. Long-term analysis of critical materials in future vehicles electrification in China and their national and global implications. Energy 2020, 202, 117697. [Google Scholar] [CrossRef]
  11. Pauliuk, S.; Heeren, N.; Berrill, P.; Fishman, T.; Nistad, A.; Tu, Q.S.; Wolfram, P.; Hertwich, E.G. Global scenarios of resource and emission savings from material efficiency in residential buildings and cars. Nat. Commun. 2021, 12, 5097. [Google Scholar] [CrossRef]
  12. Xu, C.; Dai, Q.; Gaines, L.; Hu, M.; Tukker, A.; Steubing, B. Future material demand for automotive lithium-based batteries. Commun. Mater. 2020, 1, 99. [Google Scholar] [CrossRef]
  13. Mudd, G.M. The environmental sustainability of mining in Australia: Key mega-trends and looming constraints. Resour. Policy 2010, 35, 98–115. [Google Scholar] [CrossRef]
  14. Pradhan, P. Investigating the causal relationship between transportation infrastructure, financial penetration and economic growth in G-20 countries. Res. Transp. Econ. 2019, 78, 100766. [Google Scholar] [CrossRef]
  15. Mohit, A.; Felix, R.; Lynette, C.; Arlindo, S. Buildings and the circular economy: Estimating urban mining, recovery and reuse potential of building components. Resour. Conserv. Recycl. 2020, 154, 104581. [Google Scholar]
  16. Mhatre, P.; Gedam, V.V.; Unnikrishnan, S. Material circularity potential for construction materials—The case of transportation infrastructure in India. Resour. Policy 2021, 74, 102446. [Google Scholar] [CrossRef]
  17. Kloostra, B.; Makarchuk, B.; Saxe, S. Bottom-up estimation of material stocks and flows in Toronto’s road network. J. Ind. Ecol. 2022, 26, 875–890. [Google Scholar] [CrossRef]
  18. Mao, R.; Bao, Y.; Duan, H.; Liu, G. Global urban subway development, construction material stocks, and embodied carbon emissions. Humanit. Soc. Sci. Commun. 2021, 8, 83. [Google Scholar] [CrossRef]
  19. Gassner, A.; Lederer, J.; Kovacic, G.; Mollay, U.; Schremmer, C.; Fellner, J. Projection of material flows and stocks in the urban transport sector until 2050—A scenario-based analysis for the city of Vienna. J. Clean. Prod. 2021, 311, 127591. [Google Scholar] [CrossRef]
  20. Liljenström, C.; Miliutenko, S.; O’Born, R.; Brattebø, H.; Birgisdóttir, H.; Toller, S.; Lundberg, K.; Potting, J. Life cycle assessment as decision-support in choice of road corridor: Case study and stakeholder perspectives. Int. J. Sustain. Transp. 2021, 15, 678–695. [Google Scholar] [CrossRef]
  21. Liu, M.; Jia, S.; Wang, X. Environmental impact analysis for the construction of subway stations: Comparison between open-excavation and underground-excavation scheme. Environ. Impact Assess. Rev. 2021, 91, 106644. [Google Scholar] [CrossRef]
  22. Alabi, B.N.T.; Saeed, T.U.; Amekudzi-Kennedy, A.; Keller, J.; Labi, S. Evaluation criteria to support cleaner construction and repair of airport runways: A review of the state of practice and recommendations for future practice. J. Clean. Prod. 2021, 312, 127776. [Google Scholar] [CrossRef]
  23. Mańkowska, M.; Kotowska, I.; Pluciński, M. Seaports as Nodal Points of Circular Supply Chains: Opportunities and Challenges for Secondary Ports. Sustainability 2020, 12, 3926. [Google Scholar] [CrossRef]
  24. Werner, T.T.; Mudd, G.M.; Schipper, A.M.; Huijbregts, M.A.J.; Taneja, L.; Northey, S.A. Global-scale remote sensing of mine areas and analysis of factors explaining their extent. Glob. Environ. Change 2020, 60, 102007. [Google Scholar] [CrossRef]
  25. Sonter, L.J.; Dade, M.C.; Watson, J.E.M.; Valenta, R.K. Renewable energy production will exacerbate mining threats to biodiversity. Nat. Commun. 2020, 11, 6–11. [Google Scholar] [CrossRef] [PubMed]
  26. Watari, T.; Nansai, K.; Nakajima, K.; Giurco, D. Sustainable energy transitions require enhanced resource governance. J. Clean. Prod. 2021, 312, 127698. [Google Scholar] [CrossRef]
  27. Takimoto, H.; Kosai, S.; Watari, T.; Yamasue, E. Circular economy can mitigate rising mining demand from global vehicle electrification. Resour. Conserv. Recycl. 2024, 209, 107748. [Google Scholar] [CrossRef]
  28. Kosai, S.; Matsui, K.; Matsubae, K.; Yamasue, E.; Nagasaka, T. Natural resource use of gasoline, hybrid, electric and fuel cell vehicles considering land disturbances. Resour. Conserv. Recycl. 2021, 166, 105256. [Google Scholar] [CrossRef]
  29. Silva, J.; Wheeler, E. Ecosystems as infrastructure. Perspect. Ecol. Conserv. 2017, 15, 32–35. [Google Scholar] [CrossRef]
  30. Fulmer, J. What in the world is infrastructure? Infrastruct. Investig. 2009, 9, 30–32. [Google Scholar]
  31. Bringezu, S.; Schqtz, H.; Steger, S.; Baudisch, J. International comparison of resource use and its relation to economic growth The development of total material requirement, direct material inputs and hidden flows and the structure of TMR. Ecol. Econ. 2004, 51, 97–124. [Google Scholar] [CrossRef]
  32. Sonderegger, T.; Berger, M.; Alvarenga, R.; Bach, V.; Cimprich, A.; Dewulf, J.; Frischknecht, R.; Guinee, J.; Helbig, C.; Huppertz, T.; et al. Mineral resources in life cycle impact assessment-part I: A critical review of existing methods. Int. J. Life Cycle Assess. 2020, 25, 784–797. [Google Scholar] [CrossRef]
  33. Dewulf, J.; Benini, L.; Mancini, L.; Sala, S.; Blengini, G.A.; Ardente, F.; Recchioni, M.; Maes, J.; Pant, R.; Pennington, D. Rethinking the area of protection “natural resources” in life cycle assessment. Environ. Sci. Technol. 2015, 49, 5310–5317. [Google Scholar] [CrossRef] [PubMed]
  34. Taelman, S.E.; Schaubroeck, T.; De Meester, S.; Boone, L.; Dewulf, J. Accounting for land use in life cycle assessment: The value of NPP as a proxy indicator to assess land use impacts on ecosystems. Sci. Total Environ. 2016, 550, 143–156. [Google Scholar] [CrossRef]
  35. Koellner, T.; de Baan, L.; Beck, T.; Brandao, M.; Civit, B.; Margni, M.; Canals, L.M.I.; Saad, R.; Souza, D.M.; Muller-Wenk, R. UNEP-SETAC guideline on global land use impact assessment on biodiversity and ecosystem services in LCA. Int. J. Life Cycle Assess. 2013, 18, 1185–1187. [Google Scholar] [CrossRef]
  36. Douglas, I.; Lawson, N. Material flows due to mining and urbanization. In A Handbook of Industrial Ecology; Ayers, U., Ayers, L.W., Eds.; Elgar: Cheltenham, UK; Northampton, MA, USA, 2000; pp. 351–364. [Google Scholar]
  37. Kosai, S.; Yamasue, E. Global warming potential and total material requirement in metal production: Identification of changes in environmental impact through metal substitution. Sci. Total Environ. 2019, 651, 1764–1775. [Google Scholar] [CrossRef] [PubMed]
  38. Fischer-Kowalski, M.; Krausmann, F.; Giljum, S.; Lutter, S.; Mayer, A.; Bringezu, S.; Moriguchi, Y.; Schütz, H.; Schandl, H.; Weisz, H. Methodology and Indicators of Economy-wide Material Flow Accounting: State of the Art and Reliability Across Sources. J. Ind. Ecol. 2011, 15, 855–876. [Google Scholar] [CrossRef]
  39. Kosai, S.; Yamasue, E. Economy-Wide Material Flow Analysis and Its Projection: DMI Versus TMR in Japan. In EcoDesign and Sustainability II; Sustainable Production, Life Cycle Engineering and Management; Springer: Singapore, 2021. [Google Scholar] [CrossRef]
  40. Ministry of Land, Infrastructure and Transport. Analysis of Current Transport Trend in Japan. 2019. Available online: http://www.mlit.go.jp/road/ir/kihon/26/1-1_s1.pdf (accessed on 20 January 2023). (In Japanese)
  41. Ribeiro, F.B.; Do Nascimento, F.A.C.; da Silva, M.A.V. Environmental performance analysis of railway infrastructure using life cycle assessment: Selecting pavement projects based on global warming potential impacts. J. Clean. Prod. 2022, 365, 132558. [Google Scholar] [CrossRef]
  42. Kaewunruen, S.; AbdelHadi, M.; Kongpuang, M.; Pansuk, W.; Remennikov, A.M. Digital Twins for Managing Railway Bridge Maintenance, Resilience, and Climate Change Adaptation. Sensors 2023, 23, 252. [Google Scholar] [CrossRef]
  43. Rungskunroch, P.; Shen, Z.; Kaewunruen, S. Getting It Right on the Policy Prioritization for Rail Decarbonization: Evidence From Whole-Life CO2e Emissions of Railway Systems. Front. Built Environ. 2021, 7, 638507. [Google Scholar] [CrossRef]
  44. Kosai, S.; Noguchi, H.; Fuse, M.; Yamasue, E. Transport Energy Efficiency in Domestic Long-Distance Travel in Japan. Transp. Res. Rec. 2022, 2676, 636–648. [Google Scholar] [CrossRef]
  45. Yue, Y.; Wang, T.; Liang, S.; Yang, J.; Hou, P.; Qu, S.; Zhou, J.; Jia, X.; Wang, H.; Xu, M. Life cycle assessment of High Speed Rail in China. Transp. Res. Part D Transp. Environ. 2015, 41, 367–376. [Google Scholar] [CrossRef]
  46. Ikaros Publications, Ltd. Monthly Publiciation AIRLINE; Ikaros Publications, Ltd.: Tokyo, Japan, 2019. [Google Scholar]
  47. Japan Craft Inspection Organization. About the Kinds and Period for Inspection. Available online: https://jci.go.jp/inspection/shurui.html (accessed on 1 June 2021).
  48. Inazu, R.; Naito, M.; Tanigawa, H.; Hashimoto, S. A study on estimation of material input intensity of urban structures over the time. Proc. Annu. Conf. Jpn. Soc. Waste Manag. Experts 2008, 19, 45. (In Japanese) [Google Scholar]
  49. Ministry of Land, Infrastructure, Transport and Tourism. Wite Paper 2019; Ministry of Land, Infrastructure, Transport and Tourism: Tokyo, Japan, 2021.
  50. Saito, R.; Moriguchi, Y.; Nakatani, J.; Kurisu, K. Time-series material flow and stock analysis for TOKAIDO-SHINKANSEN. J. Jpn. Soc. Civ. Eng. Ser. G Environ. Res. 2018, 74, II_255–II_265. [Google Scholar]
  51. Kosai, S.; Badin, A.B.; Qiu, Y.; Matsubae, K.; Suh, S.; Yamasue, E. Evaluation of resource use in the household lighting sector in Malaysia considering land disturbances through mining activities. Resour. Conserv. Recycl. 2021, 166, 105343. [Google Scholar] [CrossRef]
  52. Japan Traffic Lights Construction Association. Handbooks of Traffic Lights Construction; Japan Traffic Lights Construction Association: Tokyo, Japan, 2019.
  53. National Police Agency. The Number of Traffic Light by Prefecture. 2022. Available online: https://www.npa.go.jp/bureau/traffic/seibi2/annzen-shisetu/hyoushiki-shingouki/hyousikisinngouki.html (accessed on 5 September 2022). (In Japanese)
  54. Agency for Natural Resources and Energy. About a Policy for Rasources and Energy. 2022. Available online: https://www.enecho.meti.go.jp/category/resources_and_fuel/distribution/hinnkakuhou/210730a.html (accessed on 10 September 2022). (In Japanese)
  55. Toyota Industries Corporation. Chargin Stand. 2022. Available online: https://electronics.toyota-shokki.co.jp/evc1-ic.php (accessed on 10 May 2022). (In Japanese).
  56. Next Generation Vehicle Promotion Center. Spot of Charging and Hydrogen Station. 2022. Available online: http://www.cev-pc.or.jp/lp_clean/spot/ (accessed on 10 May 2022).
  57. Ministry of Economy, Trade and Industry. A State of FCV and Hydrogen Station in Japan. 2021. Available online: https://www.meti.go.jp/shingikai/energy_environment/suiso_nenryo/pdf/024_01_00.pdf (accessed on 10 December 2021). (In Japanese)
  58. Alazemi, J.; Andrews, J. Automotive hydrogen fuelling stations: An international review. Renew. Sustain. Energy Rev. 2015, 48, 483–499. [Google Scholar] [CrossRef]
  59. NEXCO CENTRAL Group. Annual Report 2019; NEXCO CENTRAL Group: Nagoya, Japan, 2020. [Google Scholar]
  60. Ministry of Finance. The Ministerial Ordinance Concerning the Useful Life, etc. of Depreciable Assets; Ministry of Finance: Tokyo, Japan, 1965.
  61. Japan Railway Construction, Transport and Technology Agency. Enviromental Report; Japan Railway Construction, Transport and Technology Agency: Yokohama, Japan, 2021.
  62. KINTETSU Railway Co., Ltd. Enviromental Initiatives. 2022. Available online: https://www.kintetsu.jp/kouhou/kankyou/en_energysaving.html (accessed on 1 June 2022).
  63. Kansai Airports. Kansai International Airports Profile. 2021. Available online: http://www.kansai-airports.co.jp/en/company-profile/about-airports/kix.html (accessed on 1 June 2022).
  64. Kagawa Prefecture. Introduction to Takamatsu Port. 2021. Available online: https://www.pref.kagawa.lg.jp/takamatsukokanri/port_takamatsu/kfvn.html (accessed on 1 October 2021).
  65. Kagawa Prefecture. Natural Disaster Measures in Takamatsu Port. 2020. Available online: https://www.pref.kagawa.lg.jp/documents/3893/5.pdf (accessed on 1 October 2020).
  66. Ministry of Land, Infrastructure, Transport and Tourism, Port and Airport Department. Study for CNP Formation at Takamatsu Port; Ministry of Land, Infrastructure, Transport and Tourism, Port and Airport Department: Tokyo, Japan, 2022. (In Japanese)
  67. The Kansai Electric Power Co., Inc. The Effort to an Enviromental Problems. 2022. Available online: https://www.kepco.co.jp/corporate/notice/notice_pdf/20220208_1.pdf (accessed on 1 August 2022).
Figure 1. Overview of the primary transport infrastructure. A “node” is defined as a place where transportation means stop and passengers get on and off. A “link” is defined as a route connecting a node. A “support for link” is defined as facilities attached to a link, such as a tunnel, bridge, traffic light, and outside light, which assist the transportation means in operating smoothly. The fuel station is categorized as the “tank” in which fuel for transportation means is stored, and “fuel supply” is the equipment used to supply fuel to various transportation means.
Sustainability 17 02437 g001
Figure 2. Resource use of the production of primary transport infrastructure on a national scale in Japan.
Sustainability 17 02437 g002
Figure 3. Comparison of resource use of each category of the production of primary transport infrastructure on a national scale in Japan for the four transportation modes (roadways, railways, aviation, waterways).
Sustainability 17 02437 g003
Figure 4. Resource intensity of each transportation mode in Japan considering roadways (ICEVs, HEVs, BEVs, FCVs, ICE buses), railways (conventional trains, high-speed railways), aviation (aircraft), and waterways (ferries).
Sustainability 17 02437 g004
Figure 5. Sensitivity analysis of resource intensity of each transportation means under the case of BEVs, high-speed railways, aircraft, and ferries.
Sustainability 17 02437 g005
Table 1. Summary of the primary transport infrastructure for each transportation mode.
Transportation ModeTransportation MeansLinkSupport for LinkNodeTankFuel Supply
RoadwaysInternal combustion engine vehicle (ICEV)RoadBridge, tunnel, traffic lightParking lotUnderground tankHose
Hybrid electric vehicle (HEV)RoadBridge, tunnel, traffic lightParking lotUnderground tankHose
Battery electric vehicle (BEV)RoadBridge, tunnel, traffic lightParking lotCharging stationHose
Fuel cell vehicle (FCV)RoadBridge, tunnel, traffic lightParking lotHydrogen producer
Compressor
Dispenser
Internal combustion engine bus (ICE bus)RoadBridge, tunnel, traffic lightParking lotUnderground tankHose
RailwaysConventional railways (CRs)Rail truckBridge, tunnel, traffic lightStationN/AOverhead wire
High-speed railways (HSRs)Rail truckBridge, tunnel, traffic lightStationN/AOverhead wire
AviationAircraftN/AN/AAirportTankPipeline
WaterwaysFerryN/AN/APortTankPipeline
N/A: not applicable.
Disclaimer/Publisher’s Note: The statements, opinions and data contained in all publications are solely those of the individual author(s) and contributor(s) and not of MDPI and/or the editor(s). MDPI and/or the editor(s) disclaim responsibility for any injury to people or property resulting from any ideas, methods, instructions or products referred to in the content.

