Article

Analyses of Variation Trends of Winter Cold Snaps in Subarctic and Arctic Alaska

1
Civil Engineering Department, University of Alaska Anchorage, Anchorage, AK 99508, USA
2
School of Hydraulic and Electric Power, Heilongjiang University, Harbin 150080, China
3
Institute of International Rivers and Eco-Security, Yunnan University, Kunming 650500, China
*
Authors to whom correspondence should be addressed.
Sustainability 2025, 17(6), 2438; https://doi.org/10.3390/su17062438
Submission received: 21 January 2025 / Revised: 28 February 2025 / Accepted: 7 March 2025 / Published: 11 March 2025

Abstract

:
Arctic Alaska is warming at twice the rate of the rest of the nation, severely impacting infrastructure built on permafrost. As winters warm, the effectiveness of thermosyphons used to stabilize foundations diminishes, increasing the risk of infrastructure failure. Because thermosyphons operate with the highest efficiency during winter cold snaps, studying the variation trends and patterns of winter cold snaps in Alaska is particularly important. To address this issue, this study analyzes the historical temperature data of four selected locations in Subarctic and Arctic Alaska, including Bethel, Fairbanks, Nome, and Utqiagvik. The winter cold snap is defined as a period when the average daily temperature drops below a specific site’s mean winter air temperature. The frequency, duration, and intensity of the winter cold snaps are computed to reveal their trends. The results indicate that the mean annual air temperature (MAAT) shows a warming trend, accompanied by sudden warming after 1975 for all study sites. The long-term average monthly air temperature also indicates that the most significant warming occurs in the winter months from December to March. While the frequencies of winter cold snaps remain relatively unchanged, the mean intensity and duration of cold snaps show a declining trend. Most importantly, the most intense cold snap during which the thermosyphons are the most effective is becoming much milder over time for all study sites. This study focuses specifically on the impact of changes in winter cold spells on thermosyphon effectiveness while acknowledging the complexity of other influencing factors, such as temperature differences, design features, coolant properties, and additional climatic parameters (e.g., wind speed, precipitation, and humidity). The data for this study were obtained from the NOAA NCEI website. The findings of this study can serve as a valuable reference for the retrofit or design of foundations and for decision making in selecting appropriate foundation stabilizing measures to ensure the long-term stability and resilience of infrastructure in permafrost regions. Moreover, the insights gained from this research on freeze–thaw dynamics, which are also relevant to black soils, align with the journal’s focus on sustainable soil utilization and infrastructure resilience.

1. Introduction

Global climate change has emerged as one of the most pressing environmental issues in recent years, attracting widespread attention. Rising global temperatures have reached unprecedented levels, leading to significant environmental consequences, including shifts in ecosystems and increased frequency of extreme weather events. One of the most affected regions is the Arctic, where temperatures have risen twice as fast as the global average [1,2]. The National Oceanic and Atmospheric Administration (NOAA) attributes this to several feedback loops, such as the decrease in snow and ice to reflect sunlight, the release of heat from warmer oceans into the atmosphere during the fall, and the increasing winter cloudiness that moderates cold conditions [3]. Recent trends in global temperature patterns suggest a clear and persistent upward trajectory, with temperatures consistently rising over the past few decades. According to the Intergovernmental Panel on Climate Change (IPCC), global warming is projected to increase by 1.5 °C between 2030 and 2052 if the current rate continues [4,5].
The warming observed in the Arctic is a critical factor in driving the overall trend of global temperature increase. The increased warming in the Arctic during the past 10 years has played a significant role in maintaining a continuous global warming trend [6]. Subarctic and Arctic Alaska is one of the most rapidly warming regions, experiencing a temperature increase twice as fast as the global average [7,8]. The increasing trend has been extensively documented through various approaches and is now widely accepted as a consensus among researchers [9,10,11,12]. Since the availability of recorded instrument data, there has been a general trend of rising temperatures in Alaska [13]. Based on information obtained from an expanded monitoring network consisting of 31 stations in the Alaskan Arctic, the surface air temperature (SAT) in this region has risen by 2.19 °C, with a rate of 0.23 °C/decade during the period of 1921–2015. Furthermore, the analysis has revealed that the SAT has increased at a faster rate of 0.71 °C/decade throughout 1998–2015, which is two to three times higher than the rate estimated from the gridded datasets [6]. Thoman and Walsh reported that air temperatures in Alaska and its surrounding regions have been rising since the 1970s, with the annual average now ranging from 0.56 °C to 1.11 °C higher compared to the early and mid-20th centuries [14]. Additionally, in 1976, Alaska underwent a significant shift to a new climate regime compared to the preceding 25 years. Notably, winter and spring temperatures have increased markedly, while the increases in summer and autumn have been less pronounced [15]. This warming trend significantly impacts the regional climate and ecosystems, potentially affecting human communities and infrastructure.
In particular, winter cold snaps, which are characterized by extremely low temperatures and high wind speeds, pose a significant risk to the local population, infrastructure, and industries [16,17]. Winter cold snap is a meteorological phenomenon characterized by a sudden and significant drop in temperature, accompanied by harsh weather conditions, such as snow, ice, and strong winds [18,19]. It typically occurs during the winter months in regions with cold climates, and its effects can be felt for days or even weeks. In the Arctic region, winter cold snaps typically occur between October and April of the following year [20]. Winter cold snaps near the Arctic Ocean in Alaska, such as Utqiagvik, typically occur between September and May of the following year [21].
Winter climate warming may negatively impact the foundations of buildings in cold regions like Alaska [22]. Numerous studies have reported that permafrost thaw, driven by climate change and human activities, significantly impacts structural deformations and causes differential settlement in the built environment, potentially leading to structural problems or damage to buildings [23,24,25]. Hinkel et al. suggested that with ongoing climate warming, civil infrastructure in permafrost regions of Alaska may become unstable, experience excessive deformation, and potentially incur significant damage [26]. As a result, effective solutions are needed to mitigate these impacts. One such solution is the thermosyphon, which has been widely used in the field of frozen soil engineering. The thermosyphon is a common permafrost heat dissipation device in the Arctic region [27]. This technology leverages natural convection phenomena in low-temperature environments to transfer heat from frozen soil to the surface, thereby achieving the desired cooling effect. It exhibits the highest efficiency during extreme cold snaps, making it particularly effective in mitigating permafrost thaw [28,29]. The thermosyphon’s cooling capacity heavily depends on the freezing index. As the climate in the Arctic and especially Subarctic Alaska warms, the freezing index drops significantly, decreasing the cooling capacity of installed thermosyphons and resulting in permafrost degradation and differential foundation settlement [30,31]. During winter cold snaps, the working efficiency of thermosyphons significantly improves. For example, many installed thermosyphons have required additional condensers to enhance their capacity and prevent the deterioration of building foundations [32,33]. Therefore, studying the historical trends and evolution of winter cold snaps in Subarctic and Arctic Alaska is crucial for protecting infrastructure in these regions.
Therefore, analyzing the intensity and variation trends of winter cold snaps induced by climate change is essential for effectively applying thermosyphons in the Subarctic and Arctic regions of Alaska. Currently, numerous studies related to winter cold snaps on a global scale provide a reference for addressing extreme cold weather in the broad cold regions that affect infrastructure and transportation. However, there is limited research on the variation trends of winter cold snaps, and even fewer studies address the impacts of these changes on the existing infrastructure in Subarctic and Arctic Alaska [34,35]. Based on long-term historical temperature data from the NOAA NCEI, this study investigates the trends in winter cold snaps by analyzing the historical temperature records from four selected locations in Alaska: Bethel, Fairbanks, Nome, and Utqiagvik [36]. For each site, both the mean annual air temperature and the long-term average monthly air temperature were calculated. Additionally, the frequency, duration, and intensity of each cold snap were assessed. A linear regression analysis of the freezing index was performed, and the maximum freezing index for each winter season was computed to identify trends in the frequency of cold snaps and temperature fluctuations over the study period. Through this comprehensive approach, this study aims to provide a detailed understanding of the changes in cold snap patterns and their potential implications for the region. The results of this study offer valuable insights that can contribute to the safety and protection of building foundations in cold regions.

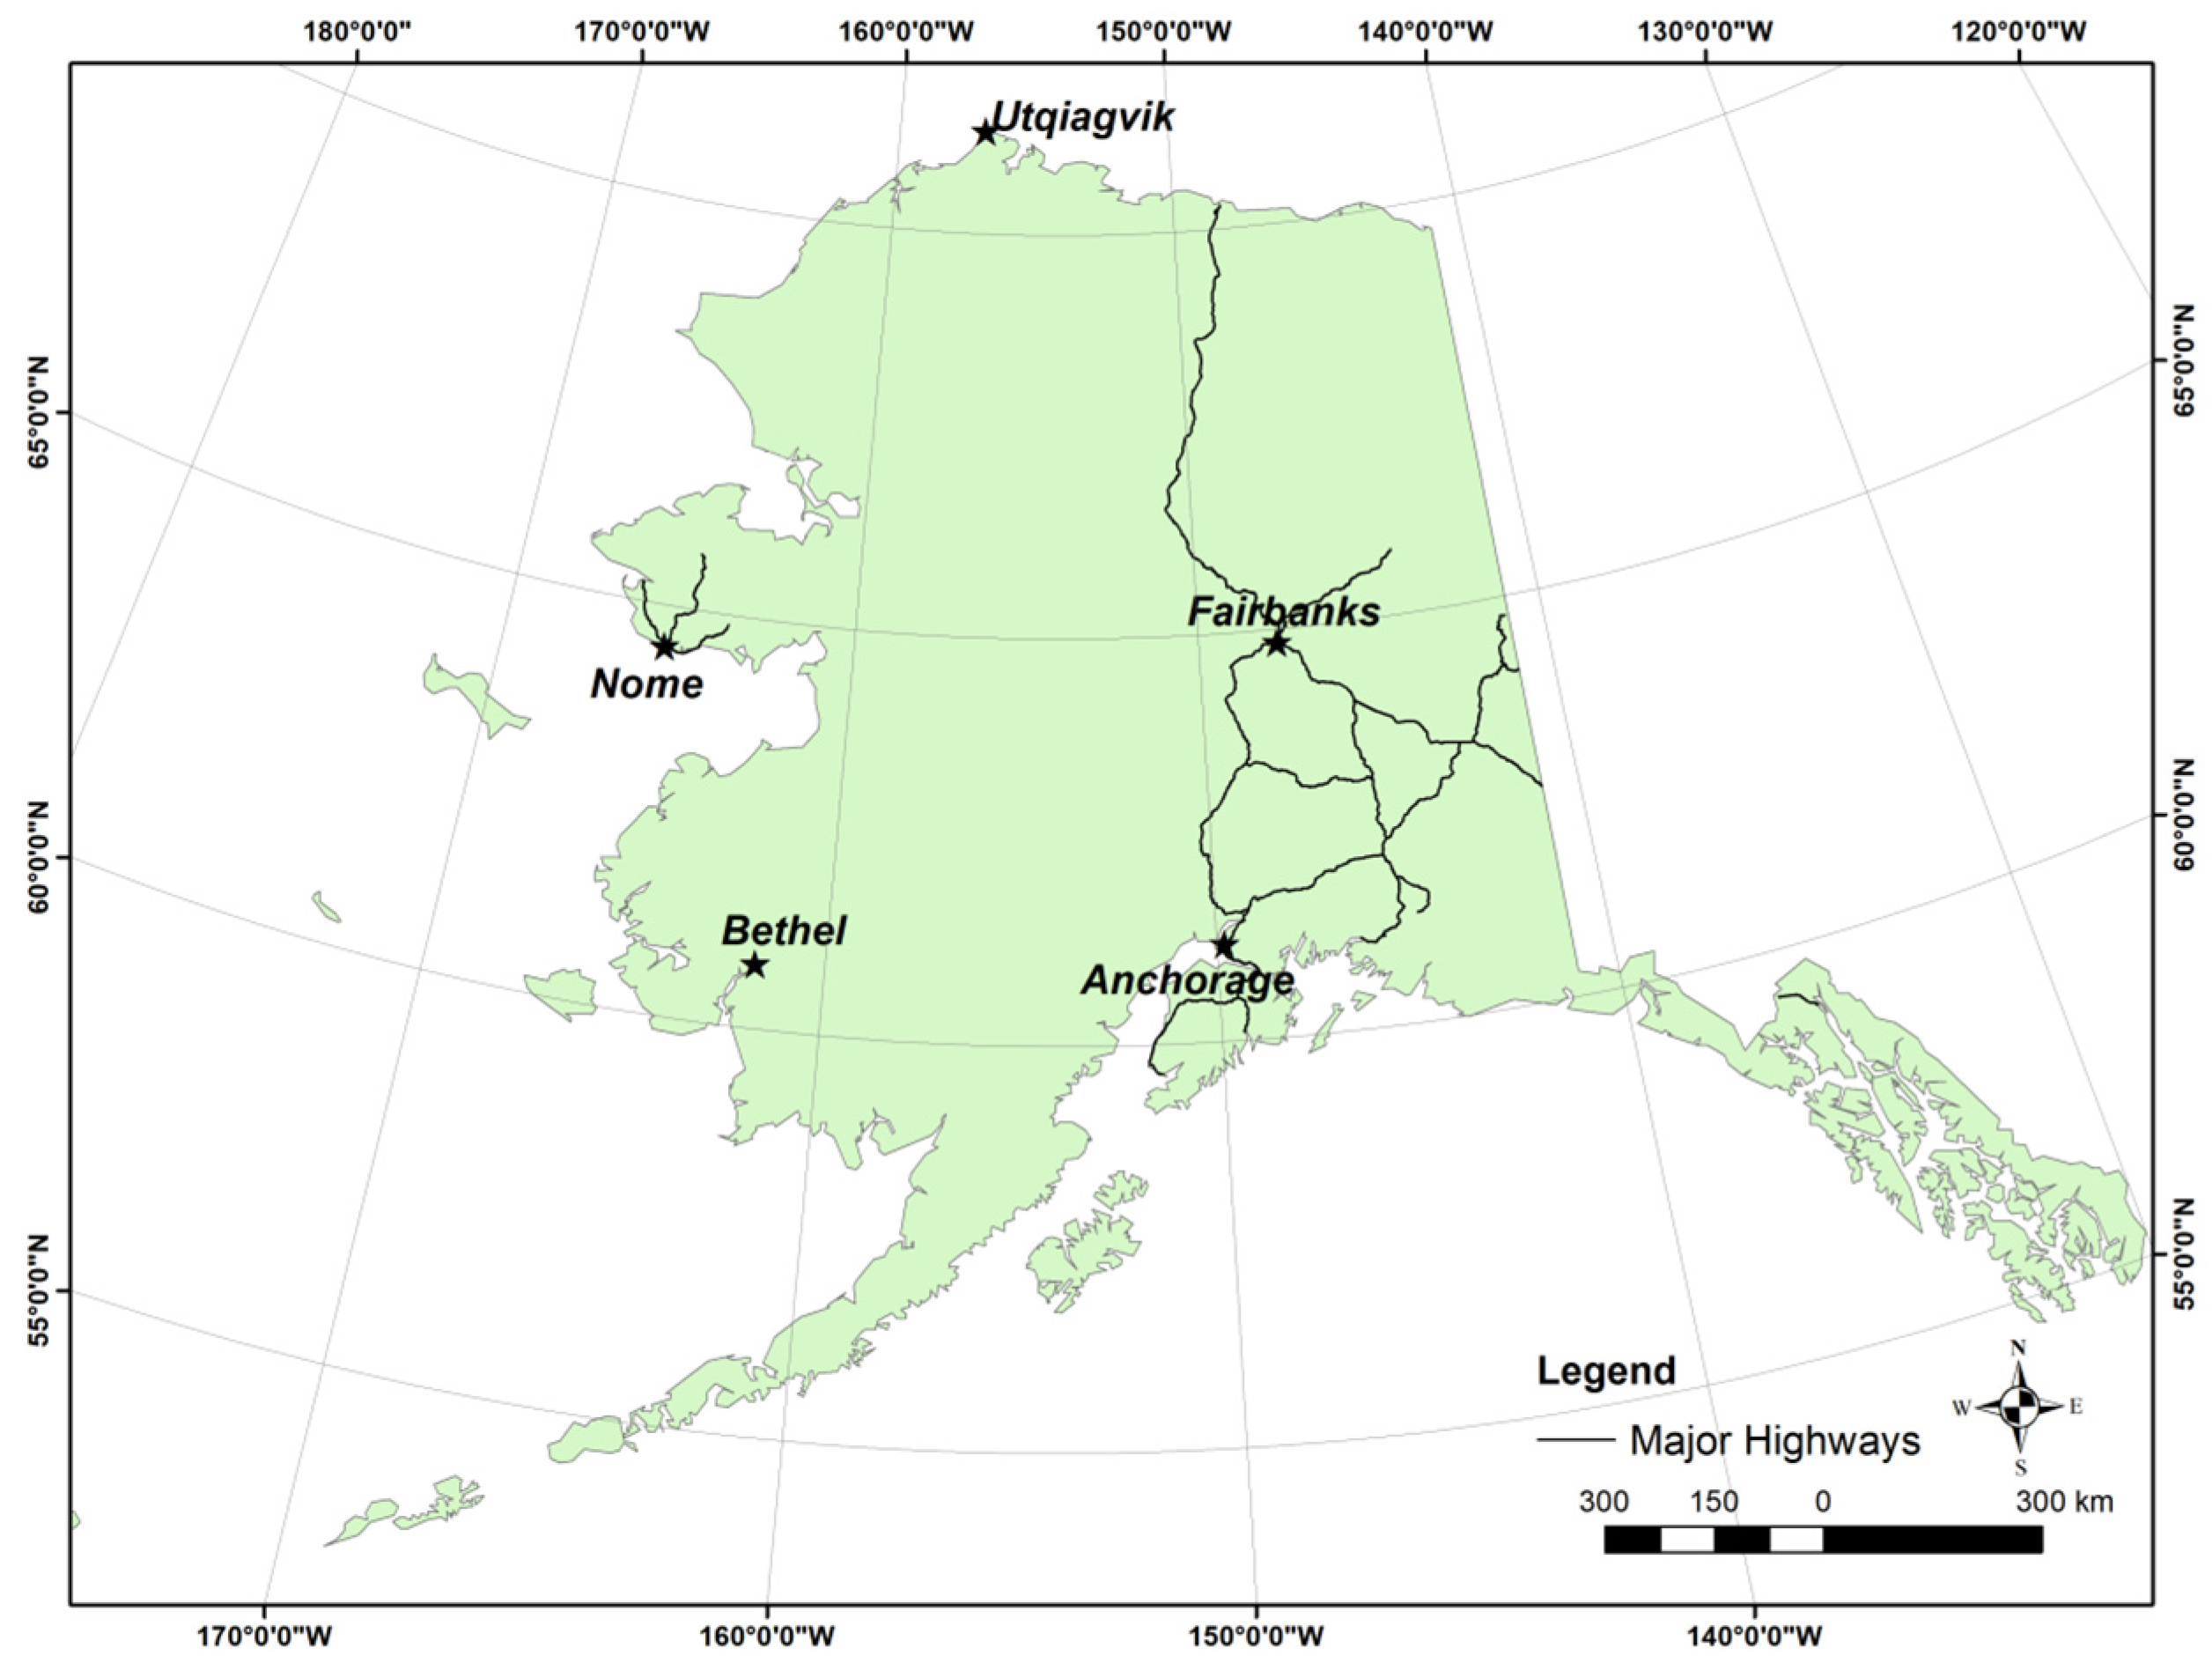
2. Location of Study Sites

The study sites for this research include four typical cities in Subarctic and Arctic Alaska: Bethel, Fairbanks, Nome, and Utqiagvik. Fairbanks is situated in the interior region of Alaska, located some distance from the coastal areas, whereas Bethel and Nome are in western Alaska along the coast of the Bering Sea. In contrast, Utqiagvik is located in the northernmost part of the state, bordering the Arctic Ocean (Figure 1).
Bethel (60.78° N, 161.48° W) is a small town located along the Bering Sea in western Alaska, with a Subarctic climate featuring long, cold winters and short, warm summers typical of polar regions. The mean annual air temperature (MAAT) is approximately −1.2 °C, but its temperature variation is relatively mild due to the moderating influence of the oceanic climate. The area is dominated by continuous permafrost, with temperatures close to the freezing point. Given these climate conditions, buildings and infrastructure in Bethel rely on thermosyphons for foundation stabilization, making them particularly vulnerable to the impacts of climate change.
Fairbanks (64.84° N, 147.72° W) is a city in the interior region of Alaska experiencing a typical Subarctic climate with cold, prolonged winters and relatively warm summers. Discontinuous permafrost is present in various parts of the city. The MAAT is −2.8 °C, with winter temperatures typically falling below −20 °C and summer temperatures averaging above 15 °C.
Nome (64.50° N, 165.41° W) is a region hub located on the coast of the Bering Sea in western Alaska, characterized by a polar climate with cold, extended winters and cool, short summers. The city has a MAAT of −3.1 °C, and both Nome and its surrounding areas are underlain by discontinuous permafrost.
Utqiagvik (71.29° N, 156.79° W), located on the coast of the Arctic Ocean, is one of the northernmost cities in the United States and a key location for studying Arctic climate dynamics. Due to its unique location, the city experiences prolonged periods of polar days and polar nights, with approximately 80 days of continuous daylight and darkness each year. The MAAT is −11.7 °C, and the region’s geological structure primarily comprises continuous permafrost.

3. Climate Analyses

3.1. Mean Annual Air Temperature (MAAT)

The MAAT is a key indicator of the long-term climate trend. Usually, it is calculated as the mean value over multiple years. This indicator is often used to describe the climate characteristics of a region and to compare the climates of different regions. The calculation method for mean air temperature is to add up the mean air temperature of each month and then divide the sum by 12 to obtain the MAAT.
Linear analyses are performed on the MAAT data to understand their historical trends. The p-value is an important statistical indicator in linear analysis used to measure the consistency or difference in observed data and hypothesis models [37]. In linear analysis, a hypothesis model is typically established, such as a hypothesis that there is a linear trend in the dataset, and the sample data are used to test whether the hypothesis is valid for the larger population. The result of this test yields a p-value. The linear regression p-value for each independent variable tests the null hypothesis that the variable has no correlation with the dependent variable. If the p-value is below the significance level (typically, 0.05), the null hypothesis is rejected, indicating a significant correlation between the variables; otherwise, if the p-value exceeds the significance level, the null hypothesis is not rejected, suggesting no significant correlation.
Alaska experienced a significant temperature rise around 1975, closely linked to global warming and the phase shift of the Pacific Decadal Oscillation (PDO) [38]. In the mid-1970s, the PDO shifted from a cold to a warm phase, leading to a rapid temperature increase across Alaska and its surrounding regions. Studies have shown that since 1976, the annual average temperature in Alaska has risen notably, with the most significant warming occurring in winter and spring. This warming trend has had profound effects on permafrost stability, ecosystems, glacier retreat, and local infrastructure. Based on this, our study analyzes MAAT trends before and after 1975 for each study area.
The MAAT for Bethel is shown in Figure 2a. The statistical year range is from 1925 to 2021. The lowest MAAT was −4.2 °C in 1956, and the highest was 2.9 °C in 1925. There was a total of 19 years where the MAAT was above 0 °C. The black line in the figure represents the fitted curve of the multi-year mean temperature, which shows that the multi-year mean temperature has increased from −1.9 °C to −0.4 °C, with an average rate of 0.015 °C/year. The p-value was 0.111. From 1925 to 1975, the mean temperature decreased from −1 °C to −2.5 °C, a decrease of 1.5 °C, with a mean annual decrease of 0.031 °C. From 1976 to 2021, the mean temperature increased from −1.4 °C to −0.2 °C, an increase of 1.2 °C.
The MAAT for Fairbanks is shown in Figure 2b. The statistical year range is from 1930 to 2021. The lowest MAAT was −6 °C in 1956, and the highest was 0.3 °C in 2019. The multi-year mean temperature increased from −3.9 °C to −1.7 °C, with a mean annual increase of 0.025 °C. The p-value was 0.033. From 1930 to 1975, the MAAT decreased from −3.5 °C to −3.8 °C, a decrease of 0.3 °C, with a mean annual decrease of 0.002 °C. From 1976 to 2021, the mean temperature increased from −2.3 °C to −1.9 °C, an increase of 0.4 °C, with a mean annual increase of 0.009 °C.
The MAAT for Nome is shown in Figure 2c. The statistical year range is from 1908 to 2021. The lowest MAAT was −6.1 °C in 1920, and the highest was 0.3 °C in 2016. The highest temperatures occurred in the last 10 years, namely −0.2 °C in 2014, 0.3 °C in 2016, −0.4 °C in 2018, and −0.1 °C in 2019. The black line in the figure represents the fitted curve of the multi-year mean temperature, which shows that the multi-year mean temperature increased from −4 °C to −2.1 °C, with a mean annual increase of 0.016 °C. The p-value was 0.051. The mean temperature from 1930 to 1975 decreased from −3.4 °C to −3.8 °C, a decrease of 0.4 °C. The mean temperature from 1976 to 2021 increased from −2.8 °C to −1.9 °C, an increase of 0.9 °C.
Figure 2d illustrates the MAAT for Utqiagvik from 1921 to 2021. The lowest MAAT was −15.2 °C in 1964, and the highest was −6.2 °C in 2019. From 1921 to 2021, the MAAT increased from −13.3 °C to −10.1 °C, an increase of 3.2 °C, with a mean annual increase of 0.031 °C. The p-value was 0.024. From 1921 to 1975, the MAAT decreased from −12.1 °C to −13 °C, a decrease of 0.9 °C. From 1976 to 2021, the MAAT increased from −12.9 °C to −8.7 °C, an increase of 4.2 °C.

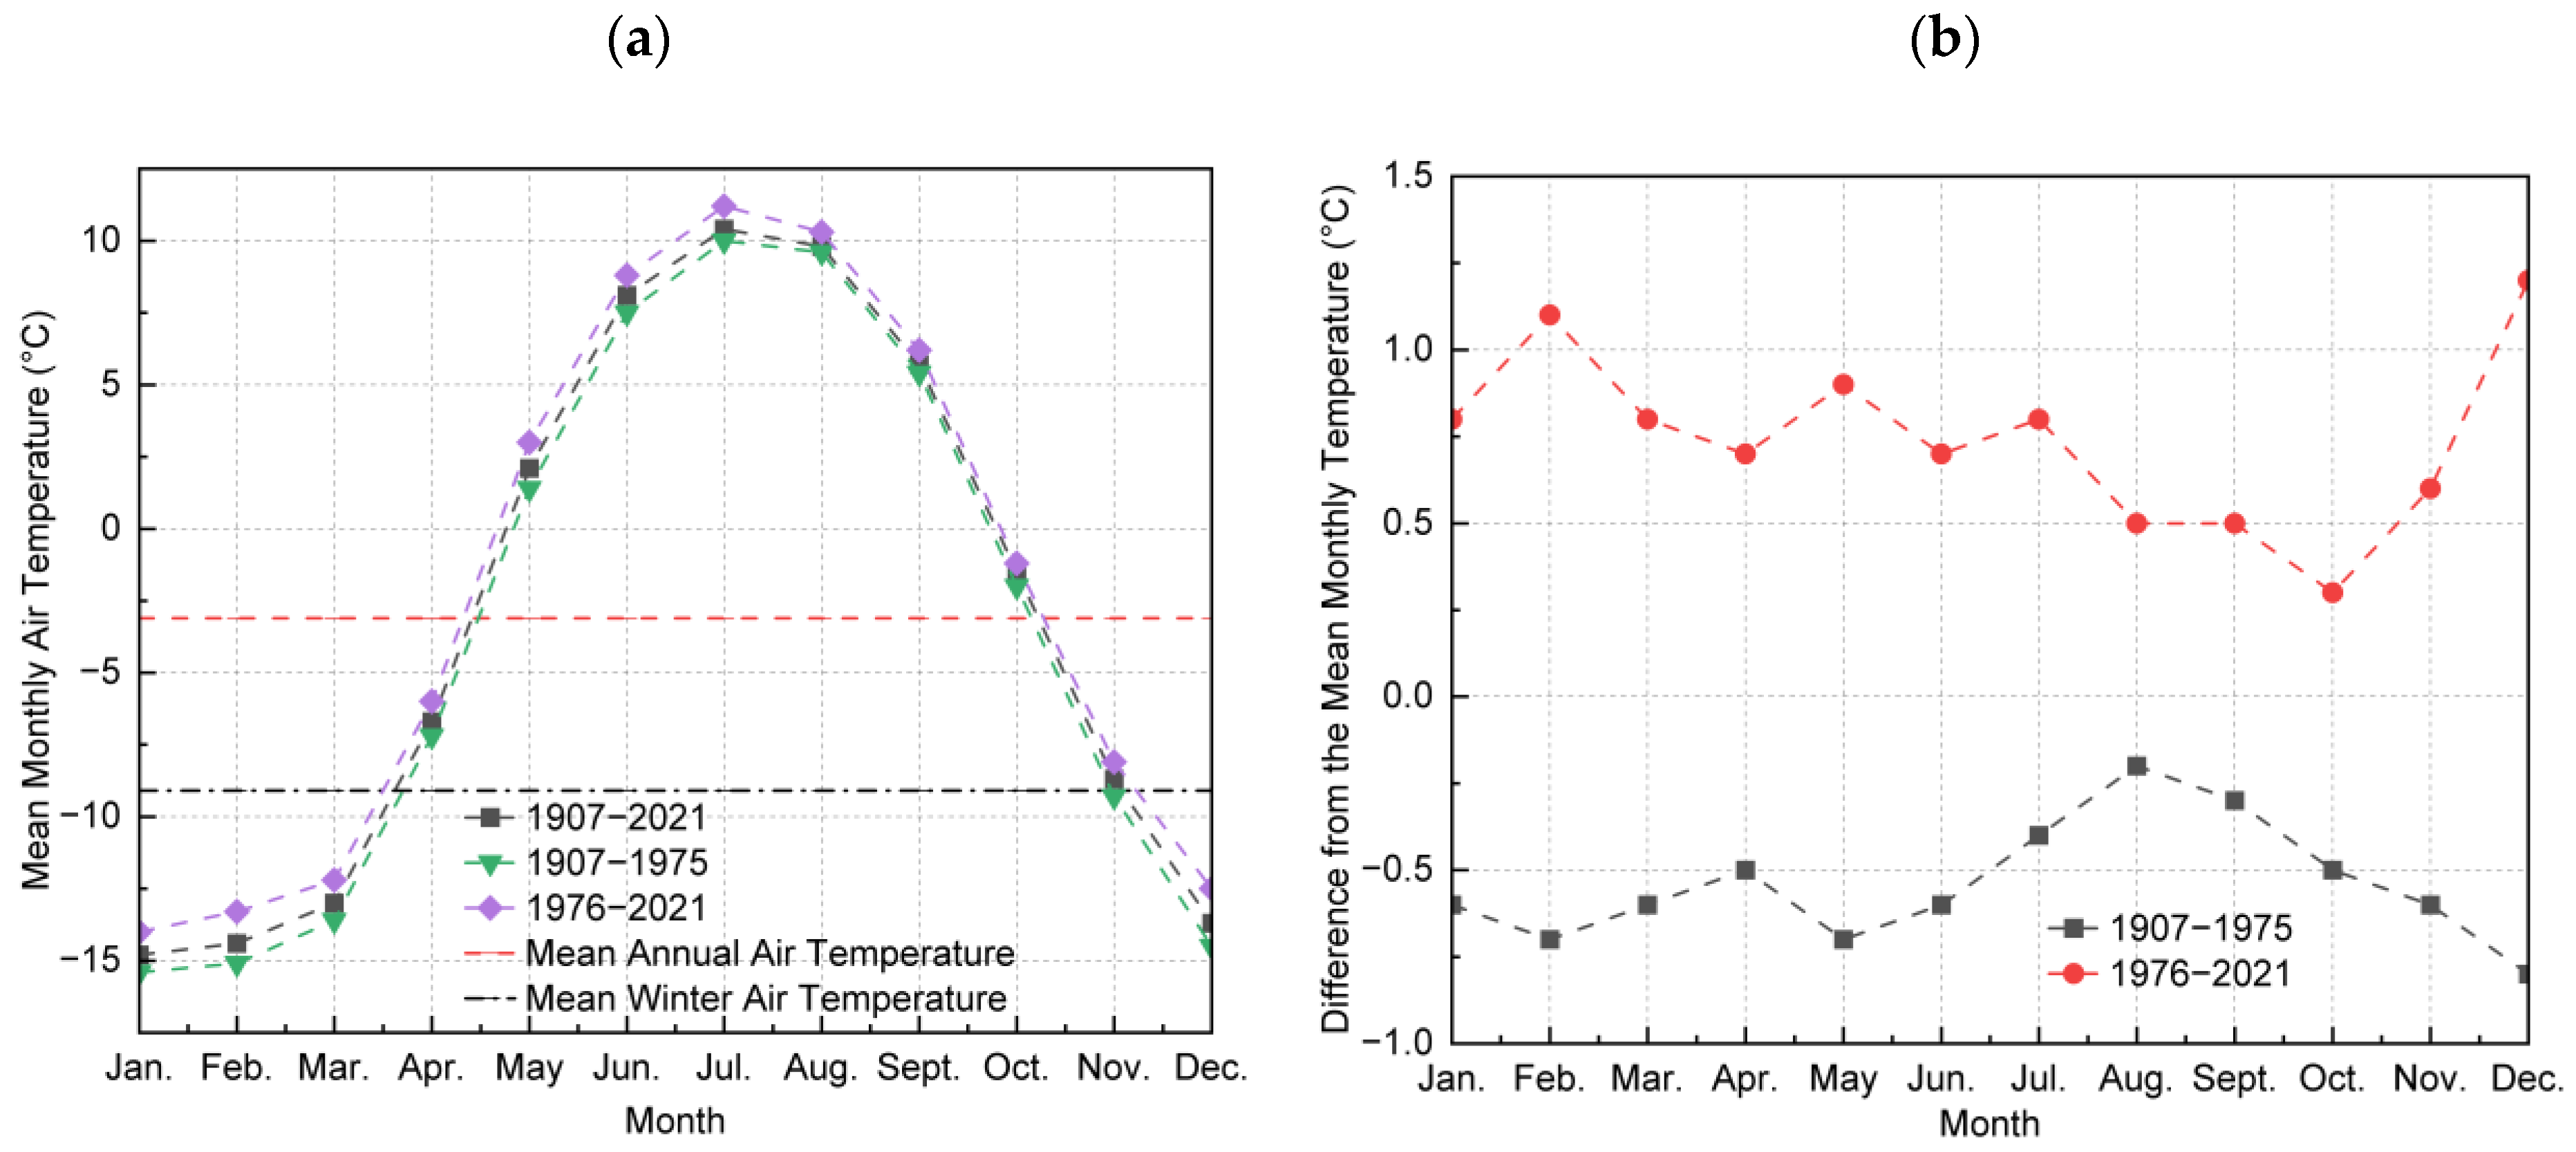
3.2. Long-Term Average Monthly Air Temperature

Winter is defined as the coldest season of the year when a hemisphere is oriented away from the sun. Different cultures and countries may have different definitions of winter. Meteorologists generally define winter as the three months with the lowest average temperatures, which are December, January, and February for the Northern Hemisphere and June, July, and August for the Southern Hemisphere [15].
Winter season is longer than the typical duration of three months in Subarctic and Arctic regions. In this study, we calculated the long-term average monthly air temperatures for four study sites in Subarctic and Arctic Alaska and selected months with mean monthly air temperatures below 0 °C as winter months. The average of the mean monthly air temperatures for the winter months was found and defined as the mean winter air temperature, which was used as a reference to define cold snaps for a site. During winter months, any period with temperatures below the mean winter air temperature was considered a cold snap, allowing us to identify the occurrence dates and frequency of cold snaps for each study site, as well as their duration.
The earliest historical temperature data available for Bethel date back to 1925. The long-term average monthly air temperature from 1925 to 2021 and the historical monthly averages were calculated (Figure 3a). The MAAT from 1925 to 2021 was −1.2 °C. Because the mean temperatures for January to April and October to December were below 0 °C, we defined these 7 months as winter and calculated the mean winter temperature, which was −7.8 °C. Figure 3a shows that before 1975, the mean monthly air temperature was generally lower, while, after 1975, the mean monthly air temperature was generally higher, with the differences in January to March and December being more pronounced. The long-term average monthly air temperature falls between these two trends.
Figure 3b shows that the mean monthly temperature from 1925 to 1975 was lower than the historical mean temperature, while the mean monthly temperature from 1976 to 2021 was higher than the historical mean temperature. The differences in temperature for December and March were more significant, with the mean monthly temperature for December being about 1.6 °C lower than the historical mean temperature from 1925 to 1975 and about 1.5 °C higher than the historical mean temperature from 1976 to 2021, respectively. The mean monthly temperature for March was about 1.1 °C lower than the historical mean temperature from 1925 to 1975 and about 1.2 °C higher than the historical mean temperature from 1976 to 2021.
The mean temperature for each month in Fairbanks from 1929 to 2021 was calculated and illustrated in Figure 4a. Additionally, the MAAT from 1929 to 2021 was −2.8 °C. Because the mean monthly air temperature from January to April and from October to December is below 0 °C, we define these 7 months as winter months in Fairbanks, with a mean winter air temperature of −13.7 °C. Figure 4a shows that before 1975, the temperature was generally lower for each month, while, after 1975, the mean monthly air temperature was generally higher, with the differences in January to March and December being more pronounced. The long-term average monthly air temperature falls between these two trends.
Figure 4b shows that the mean monthly temperature from 1925 to 1975 was lower than the historical mean temperature, while the mean monthly temperature from 1976 to 2021 was higher than the historical mean temperature. The differences in temperature for December and January were more significant, with the mean monthly temperature for December and January being about 1.6 °C lower than the historical mean temperature from 1925 to 1975 and about 1.6 °C and 1.5 °C higher than the historical mean temperature from 1976 to 2021, respectively. This confirms the gradual increase in air temperature, with the greatest warming occurring in winter months.
The earliest historical temperature data available for Nome date back to 1907. The long-term average monthly air temperature and monthly averages were determined for Nome from 1907 to 2021, as shown in Figure 5a. The MAAT of Nome from 1907 to 2021 was −3.1 °C. Because the mean temperatures for January to April and October to December were below 0 °C, these 7 months were defined as Nome’s winter, and the mean winter temperature was determined to be −9.1 °C. Figure 5a shows that before 1975, the mean monthly temperature was generally lower, while, after 1975, the mean monthly temperature was generally higher, with the historical mean temperature falling between these two trends.
Figure 5b reveals that the mean monthly temperature from 1925 to 1975 was lower than the historical mean temperature, while the mean monthly temperature from 1976 to 2021 was higher than the historical mean temperature. The differences in temperature for December were most pronounced, with the mean monthly temperature from 1925 to 1975 being about 0.8 °C lower than the historical mean temperature and about 1.2 °C higher than the historical mean temperature from 1976 to 2021, with a difference of about 2 °C.
The earliest available historical temperature data for Utqiagvik date back to 1921. The mean monthly air temperature of Utqiagvik from 1921 to 2021 and the long-term average monthly air temperature have been calculated (Figure 6a). The MAAT of Utqiagvik from 1921 to 2021 was −11.7 °C. As the mean temperature for January to May and September to December is below 0 °C each year, we defined these nine months as Utqiagvik’s winter, with a mean temperature of −15 °C. Figure 6a shows that before 1975, the mean monthly temperature was generally lower, while, after 1975, the mean monthly temperature was generally higher, with the historical mean temperature between these two trends. The temperature difference from January to March is more pronounced, while the temperature difference in summer is not significant but still shows an upward trend.
Figure 6b shows that the mean monthly temperature from 1925 to 1975 was lower than the historical mean temperature, while the mean monthly temperature from 1976 to 2021 was higher than the historical mean temperature. The temperature difference between February and the historical mean temperature is most pronounced. The mean temperature for December from 1925 to 1975 was about 1.5 °C lower than the historical mean temperature, while the mean temperature for December from 1976 to 2021 was about 1.7 °C higher than the historical mean temperature, with a difference of about 3.3 °C.

4. Variation Trends of Winter Cold Snaps

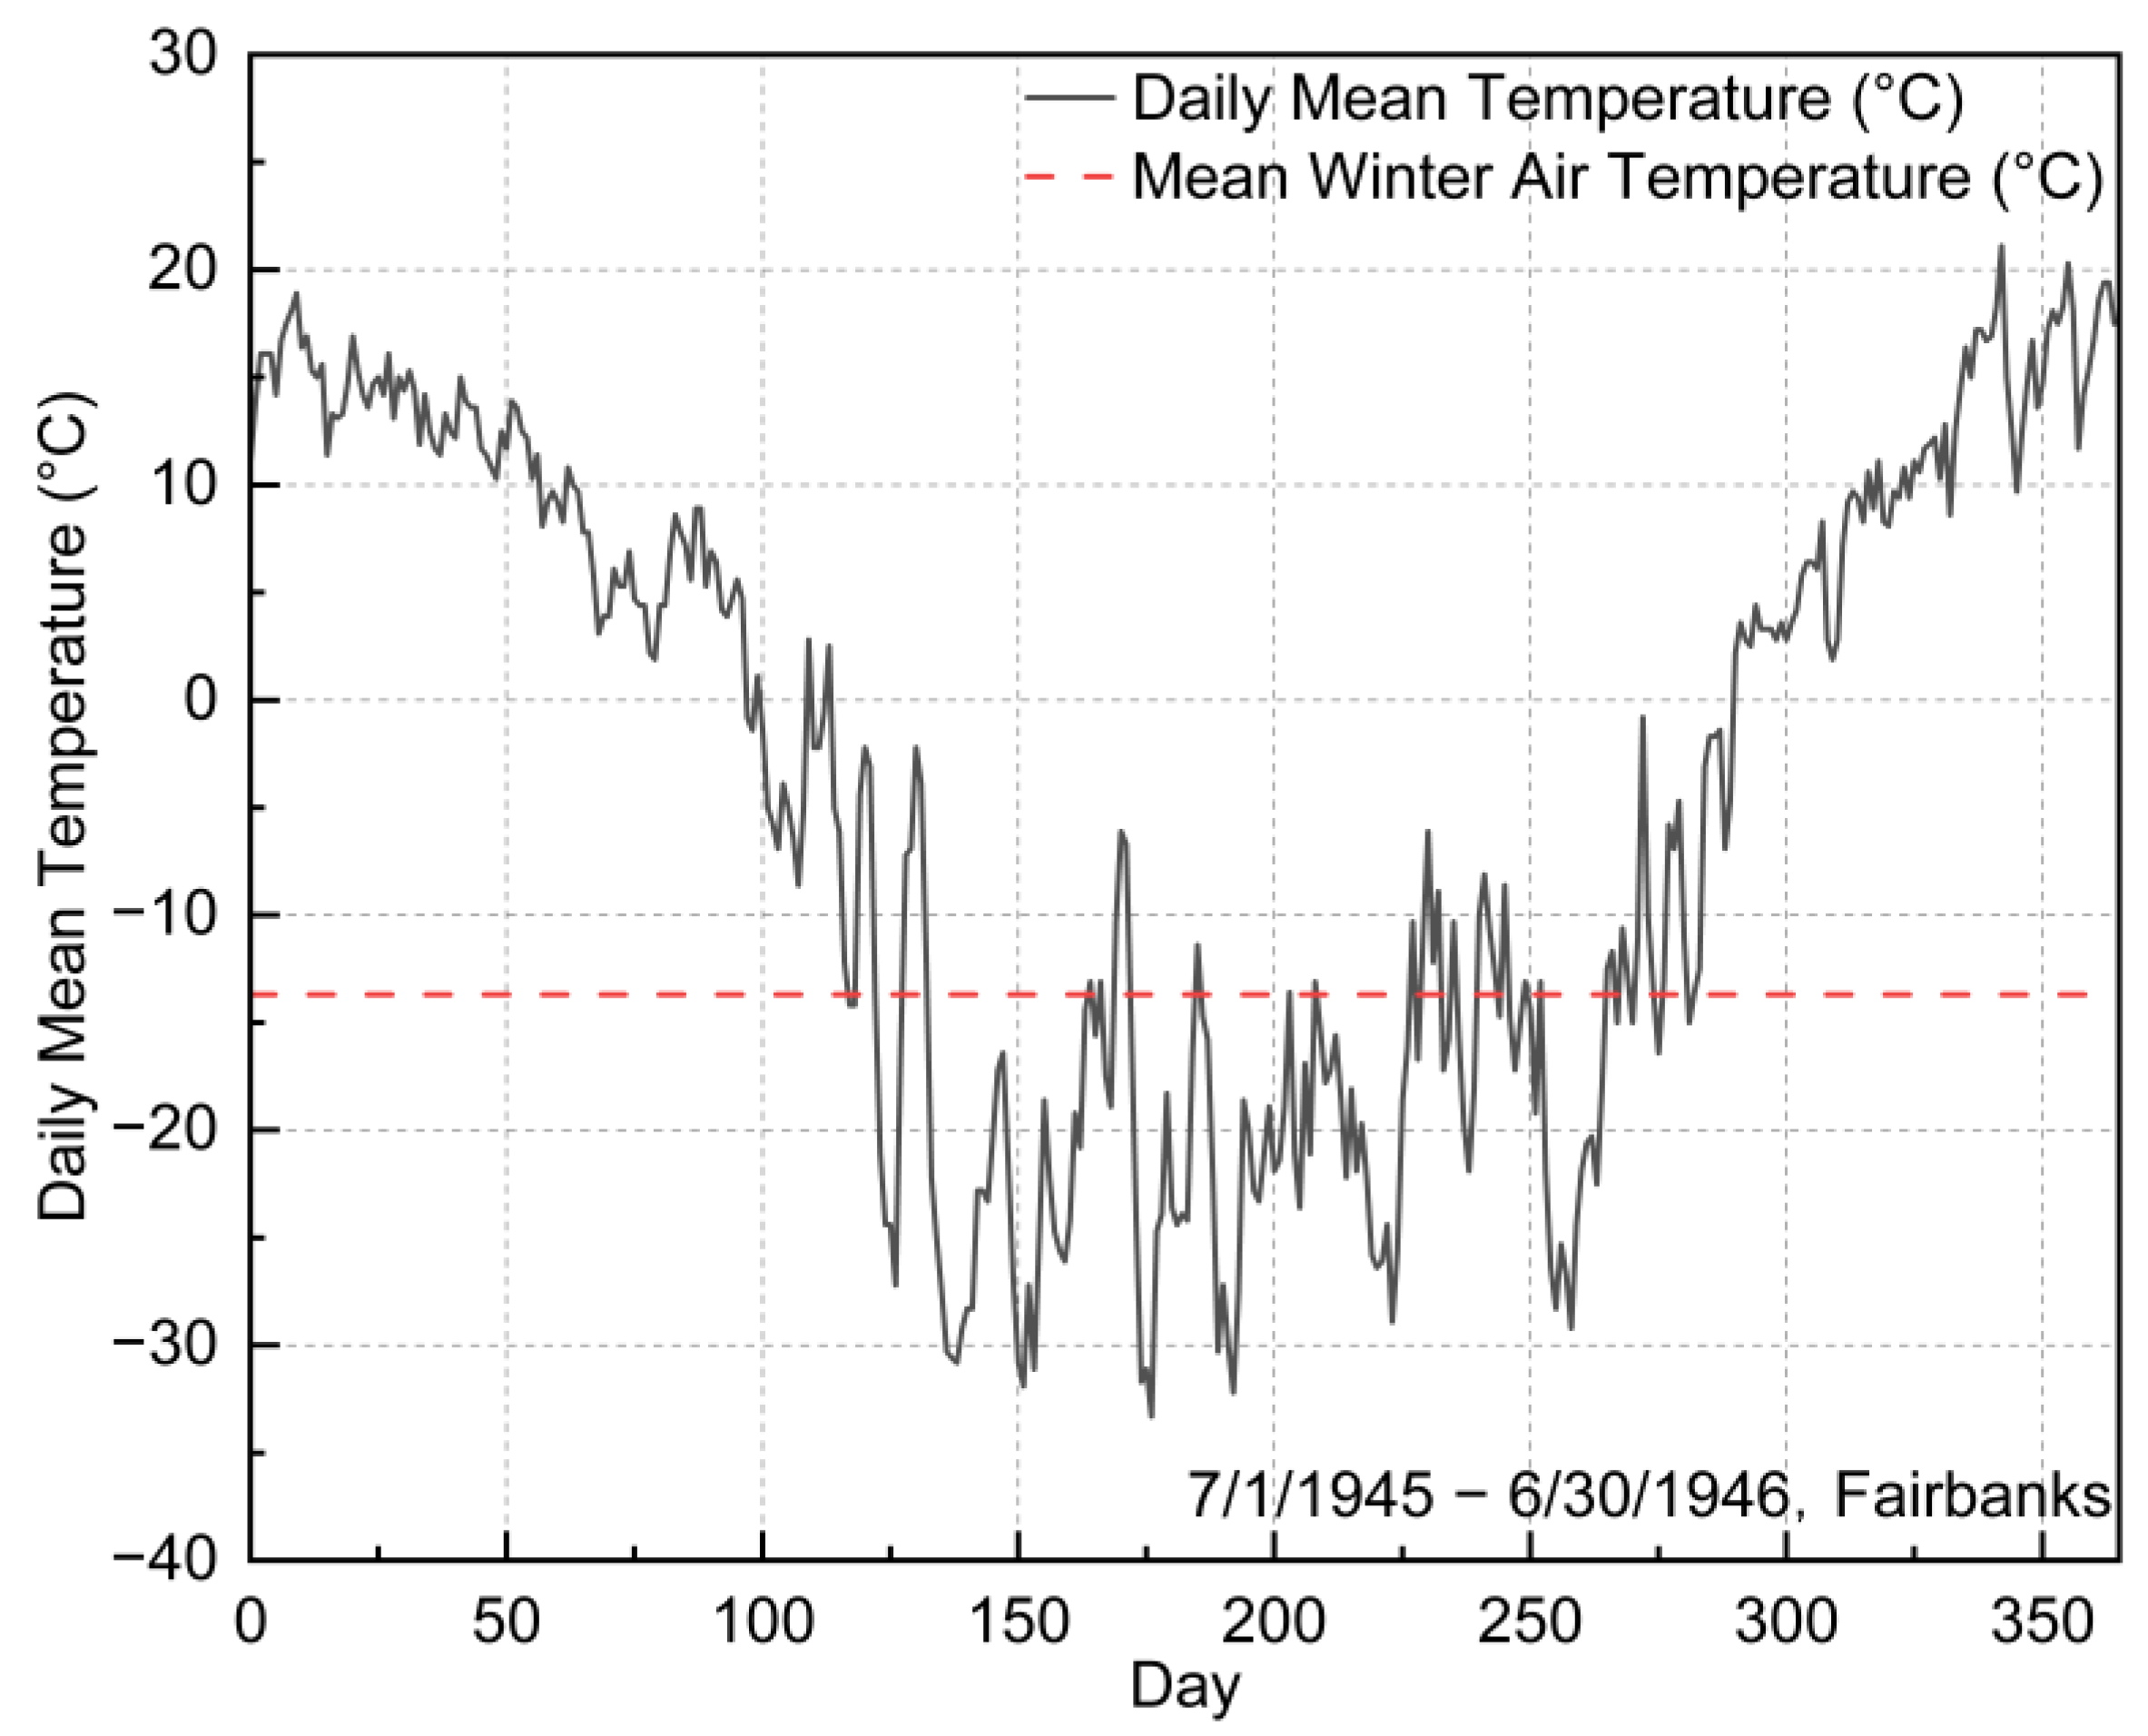
4.1. Definition of Winter Cold Snaps

Without an explicit definition, we propose the following definition for “winter cold snap”: a winter cold snap is defined as a period when the average daily temperature falls below the long-term average monthly temperature for the winter period. Taking Fairbanks from 1 July 1945 to 30 June 1946 as an example, Figure 7 illustrates the variation of daily mean temperature, with the red dashed line representing the historical mean winter monthly temperature of Fairbanks, which is −13.7 °C. Multiple cold snaps can be observed.

4.2. Frequency and Duration

The number of cold snaps in a year is defined as the cold snap frequency, and the number of days in a cold snap is termed the duration. The average duration of cold snaps in a year is defined as the ratio of the sum of duration over the frequency. Cold snap frequency and average duration are important parameters for evaluating the severity and intensity of winter cold snaps in a particular region.
Figure 8a shows the cold snap frequency of Bethel from 1925 to 2021. The data are scattered, and no clear trend can be observed. The highest frequency occurred in 2008, 24 times per year. The lowest frequency occurred in 1937 and 2016, seven times per year. Figure 9a displays the cold snap average duration of Bethel from 1925 to 2021, revealing a decreasing trend. The maximum value of the average duration occurred in 1937, with 15.7 days, and the minimum value occurred in 2015, with 3.8 days.
Figure 8b shows the cold snap frequency of Fairbanks from 1930 to 2021. The data appear to be very scattered, and no obvious trends can be observed. The maximum frequency occurred in 1984, 22 times per year, while the minimum frequency occurred in 1942, 6 times per year. Figure 9b shows the average duration of the cold snaps in Fairbanks from 1930 to 2021. As it can be seen from the figure, the maximum average duration occurred in 1942, with 19.7 days, while the minimum average duration occurred in 2000, with 4.1 days. A mild decreasing trend in the average duration can be observed.
Figure 8c shows the cold snap frequency of Nome from 1908 to 2021. The highest frequency occurred in 1966, 26 times per year, and the lowest frequency occurred in 2016 and 2019, 9 times yearly. Figure 9c depicts the cold snap average duration of Nome. Again, a downtrend can be observed. The maximum average duration appeared in 1932, with 12.6 days, and the minimum appeared in 1966, with 3.8 days.
Figure 8d shows the cold snap frequency of Utqiagvik from 1921 to 2021. Similarly to other sites, the data are scattered, and no obvious trend can be observed. The maximum frequency appeared in 2001, at 20 times per year. The minimum frequency appeared in 1982 and 2020, at four times per year. Figure 9d illustrates the cold snap average duration of Utqiagvik, revealing a mild downtrend. The maximum value of average duration appeared in 1982 at 45.8 days, and the minimum value appeared in 2017 at 5.7 days.

4.3. Average Cold Snap Intensity

The freezing index (FI) is a measure of the intensity of winter freezing conditions. It is often used to determine the depth of seasonal freezing and the thickness of river ice. In this study, the freezing index is computed for each cold snap to assess the intensity of cold snaps. The average intensity of cold snaps in a year is evaluated by finding the average freezing index (AFI) of each cold snap within a year through
A F I = F I / F R E Q
F I = T E M P M W A T
where F R E Q is frequency, T E M P is temperature, and M W A T is mean winter air temperature.
The AFI for Bethel from 1925 to 2021 is shown in Figure 10a. The highest average freezing index occurred in 1937, at 286 °C·Days. The lowest average freezing index occurred in 2015, with a value of 46.2 °C·Days, while the second lowest occurred in 2017, with a value of 51.7 °C·Days. There was a total of 3 years with an AFI exceeding 250 °C·Days: 286 °C·Days in 1937, 279.4 °C·Days in 1942, and 255.6 °C·Days in 2016. A decreasing trend can be seen in the AFI, with several record lows occurring in the last decade.
Figure 10b shows the AFI for Fairbanks from 1929 to 2021. The highest AFI was 537 °C·Days in 1942, and the lowest was 76.5 °C·Days in 2000. There was a total of 3 years with an AFI above 400 °C·Days: 537 in 1942, 444.6 °C·Days in 1964, and 437.7 °C·Days in 1965. There were three years with an AFI below 100 °C·Days: 96.2 °C·Days in 1976, 92.4 °C·Days in 1984, and 76.5 °C·Days in 2000. A downtrend can be seen in the AFI of Fairbanks. Figure 10c shows that the AFI for Nome ranges from 1908 to 2021. The highest AFI was 254.9 °C·Days in 2011, and the lowest was 60.4 °C·Days in 1966. Unlike other sites, no obvious downtrend exists for the AFI in Nome.
The AFI of Utqiagvik from 1921 to 2021 is depicted in Figure 10d. There is a total of 4 years where the AFI exceeds 800 °C·Days: 1930 with 836.2 °C·Days, 1954 with 879.6 °C·Days, and 1975 with 831.8 °C·Days. In the last 30 years, the AFI has shown a downtrend, with record lows occurring in 2017 at 111.8 °C·Days. There were 5 years with an AFI below 200 °C·Days, all within the last two decades, including 187.6 °C·Days in 2001, 196.8 °C·Days in 2010, 111.8 °C·Days in 2017, 182 °C·Days in 2018, and 195.1 °C·Days in 2019.

4.4. Extreme Winter Cold Snaps and Their Variation Trends

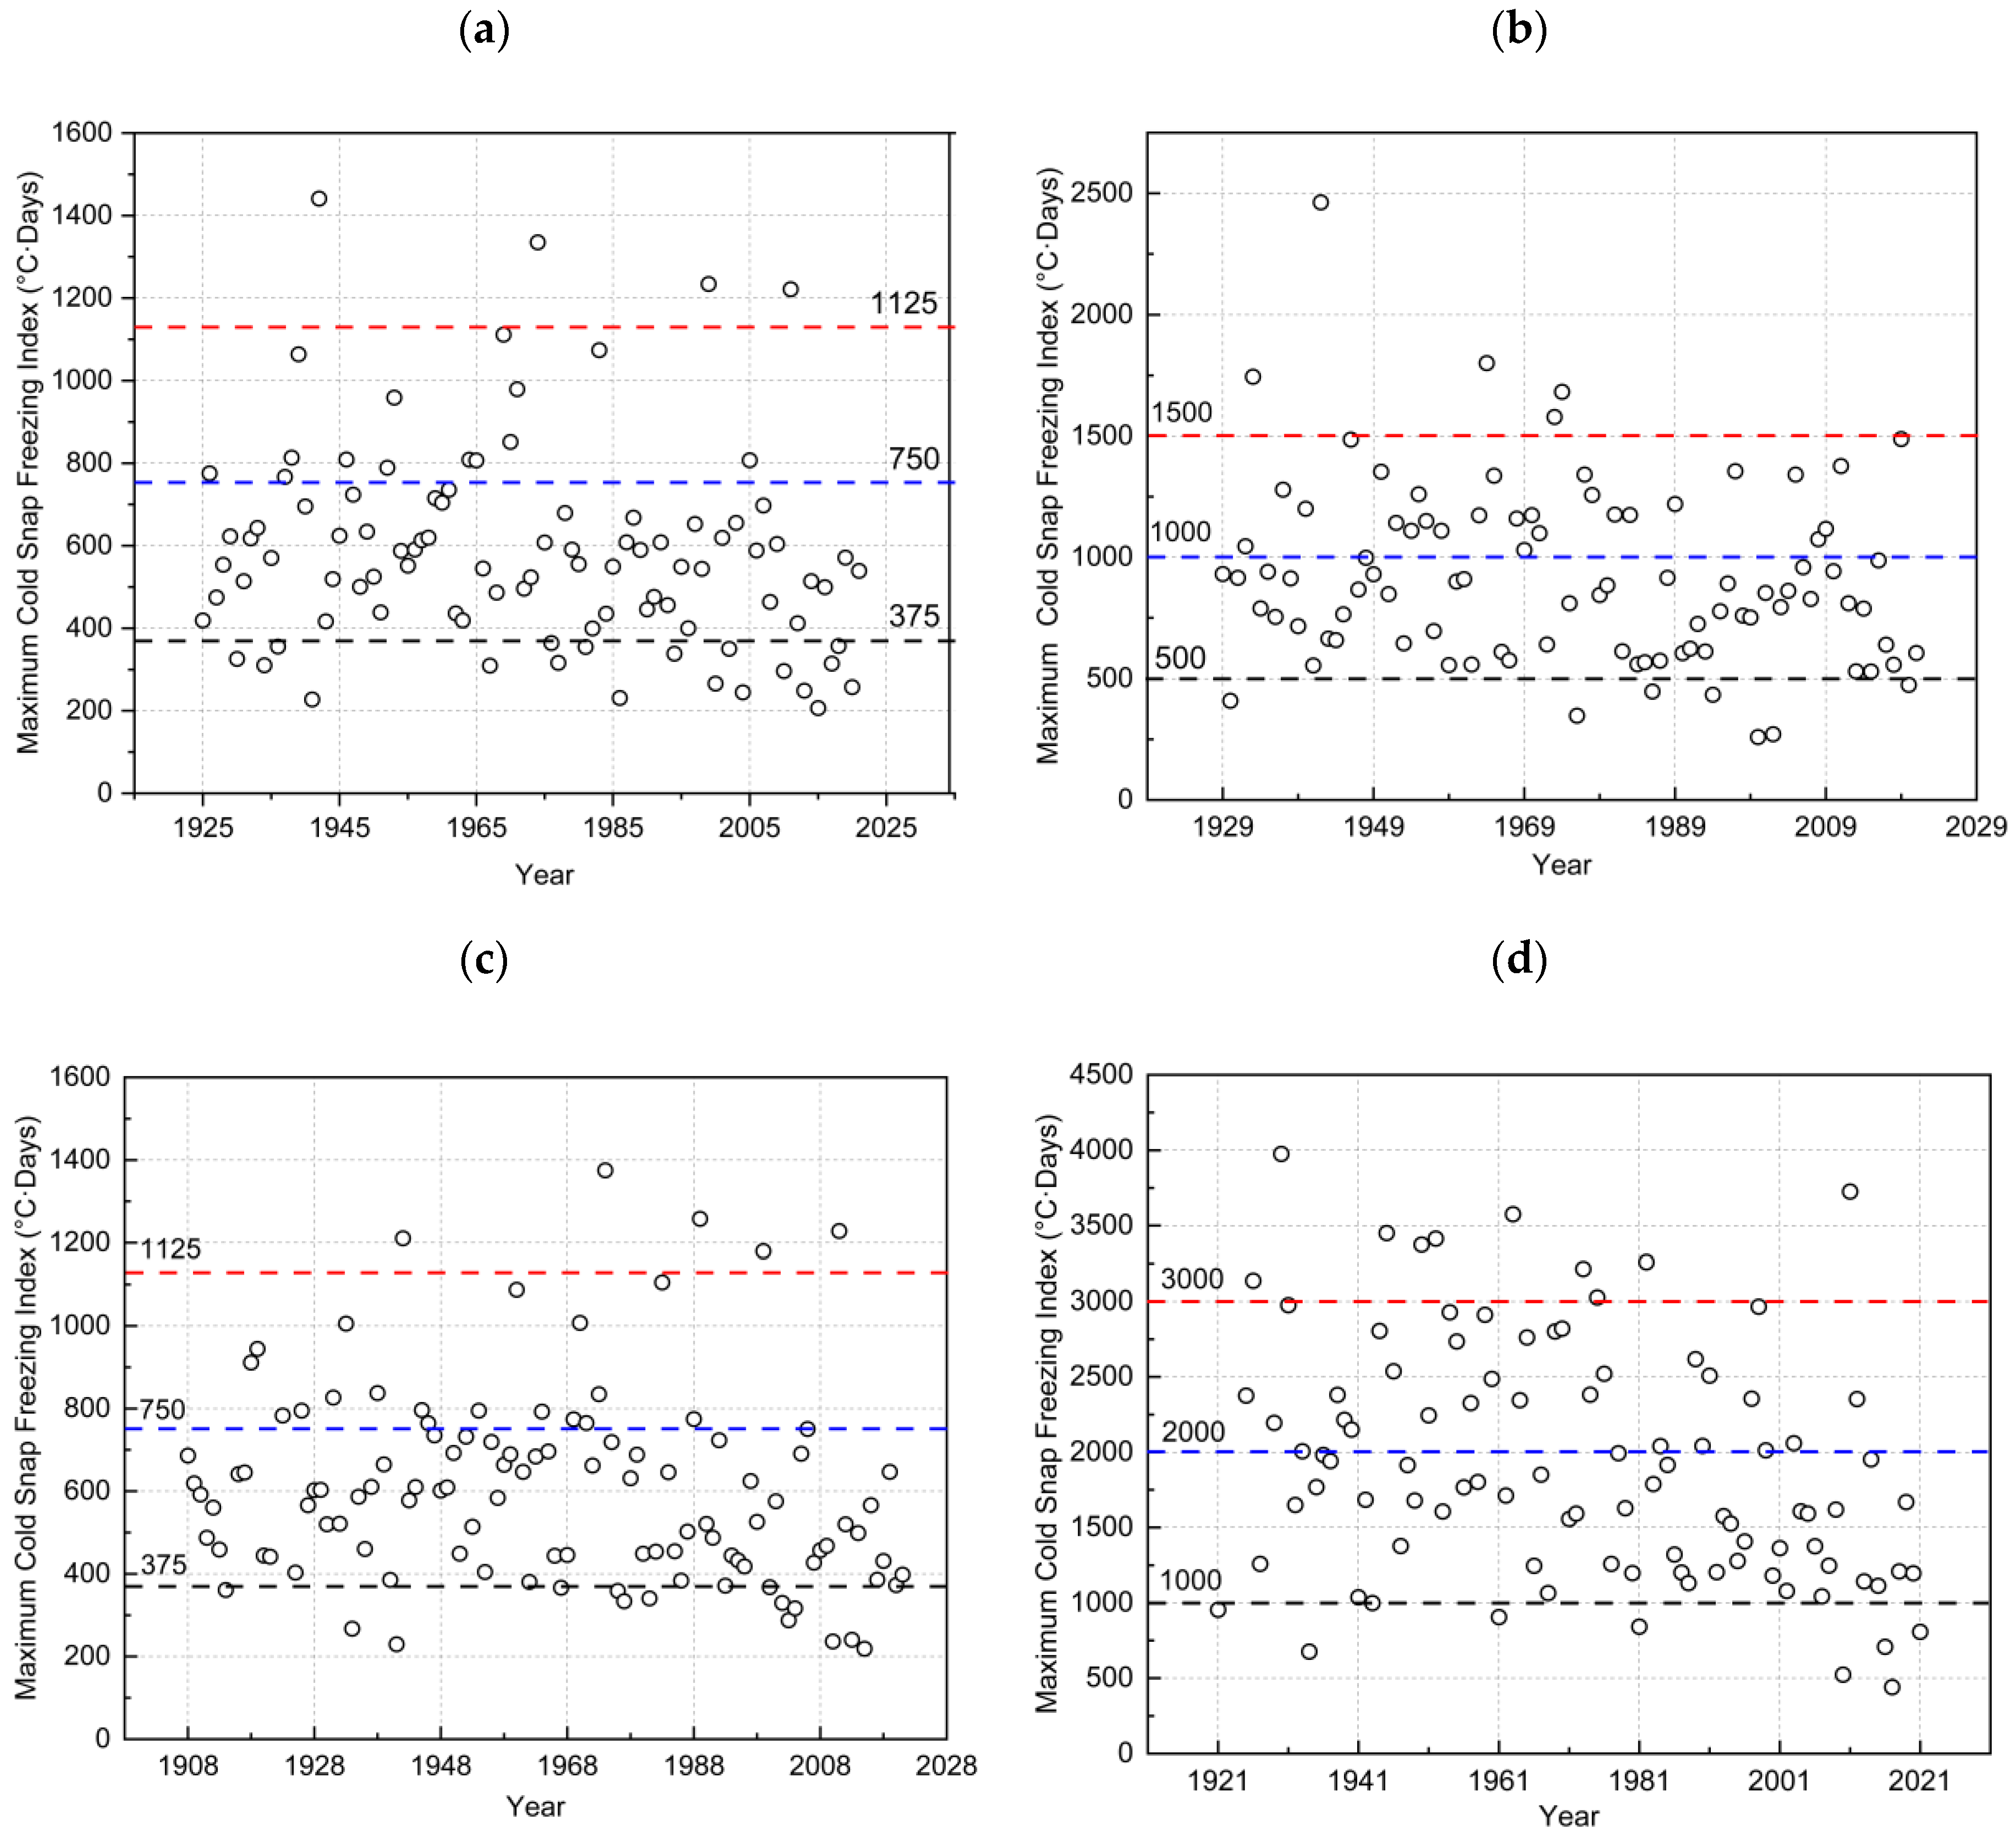
4.4.1. Maximum Winter Cold Snaps

As mentioned, thermosyphons are most efficient during cold snaps, especially during extreme cold snaps when the duration is long and the daily mean temperature is substantially lower than the mean winter temperature. This section analyzes the trends in extreme cold snaps over the study period.
The maximum cold snap FI of Bethel from 1925 to 2021 is depicted in Figure 11a, which reveals an overall decreasing trend. The highest value occurred in 1942, reaching 1441 °C·Days, while the lowest happened in 2015, with a value of 207 °C·Days. There were four years with a maximum cold snap FI above 1200 °C·Days, two of which occurred before 1975. In contrast, there were 19 years with a maximum cold snap FI below 375 °C·Days, with 14 occurring after 1975 and 10 occurring in the last three decades. This indicates a significant downward trend in the maximum cold snap FI of Bethel in recent decades.
The maximum cold snap FI of Fairbanks from 1929 to 2021 is shown in Figure 11b, which reveals an overall downtrend. The highest value occurred in 1942, reaching 2463 °C·Days, while the lowest appeared in 2000, with a value of merely 260 °C·Days. Notably, there were five years with a maximum cold snap FI above 1500 °C·Days, all occurring before 1975, with the latest in 1974. In contrast, there were seven years with a maximum cold snap FI below 500 °C·Days, six of which occurred after 1975 and four in the last 30 years. This indicates a significant downward trend in the maximum cold snap FI of Fairbanks in recent decades.
The maximum cold snap FI of Nome from 1908 to 2021 is illustrated in Figure 11c, and an overall downtrend can be observed. The highest value occurred in 1974, at 1375 °C·Days, while the lowest occurred in 2015, at 219 °C·Days. There were 5 years when the maximum cold snap FI was greater than 1125 °C·Days, with two occurrences before 1975 and three after 1975. There were 15 years when the maximum cold snap FI was less than 375 °C·Days, with 11 occurrences after 1975 and 8 occurrences in the last three decades. The three lowest values all occurred in the past decade, namely, 236 °C·Days in 2010, 241 °C·Days in 2013, and 219 °C·Days in 2015. This indicates that the maximum cold snap FI of Nome has been on a trend of hitting new lows in recent years.
Figure 11d illustrates the maximum cold snap FI of Utqiagvik from 1921 to 2021, and a clear downtrend can be observed, especially for the last several decades. The highest value occurred in 1930 at 3974.9 °C·Days, while the lowest was in 2017 at 441 °C·Days. There were 10 years where the maximum cold snap FI was greater than 3000 °C·Days, with eight occurrences before 1975 and only two after, i.e., 1982 and 2011. There were 9 years where the maximum cold snap FI dropped below 1000 °C·Days, with 5 occurrences after 1975 and 4 in the last decade, namely 523 °C·Days in 2010, 708 °C·Days in 2016, 441 °C·Days in 2017, and 807 °C·Days in 2021.

4.4.2. Variation Trends

The maximum cold snap FI of Bethel was divided into four categories to reveal the trend, including less than 375 °C·Days, between 375 °C·Days and 750 °C·Days, between 750 °C·Days and 1125 °C·Days, and between 1125 °C·Days and 1500 °C·Days. The proportion in each category was evaluated for the entire study period and the last few decades in two moving windows, i.e., 30 years and 20 years, and the results are illustrated in Figure 12a,b. The proportion of the maximum cold snap FI less than 375 °C·Days demonstrates an uptrend, increasing from 19.6% for the entire study period to 33.3% from 1992 to 2021. The proportion of the maximum cold snap FI between 375 °C·Days and 750 °C·Days and between 1125 °C·Days and 1500 °C·Days remains unchanged. However, the proportion of the maximum cold snap FI between 750 °C·Days and 1125 °C·Days decreases significantly, from 14.4% for the entire study period to just 3.3% from 1972 to 2001.
The maximum cold snap FI for Fairbanks was divided into four intervals: less than 500 °C·Days, between 500 °C·Days and 1000 °C·Days, between 1000 °C·Days and 1500 °C·Days, and greater than 1500 °C·Days. The proportion in each category was evaluated for the entire study period and the last few decades in two moving windows, i.e., 30 years and 20 years, and the results are listed in Figure 13a,b. It can be observed that the proportion of the maximum cold snap FI less than 500 °C·Days almost doubles over time, from a historical average proportion of 7.5% to 13.3% for the periods of 1972 to 2001, 1982 to 2011, and 1992 to 2021. The proportion of the maximum cold snap FI between 500 °C·Days and 1000 °C·Days has also shown an overall increasing trend, from a historical average proportion of 58.1% to 80% for the period of 1992 to 2021. To the contrary, the proportion of the maximum cold snap FI between 1000 °C·Days and 1500 °C·Days has shown an overall decreasing trend, from a historical average proportion of 29.0% to 20.0% for the period of 1992 to 2021. The proportion of the maximum cold snap FI greater than 1500 °C·Days has also dropped significantly from a historical average proportion of 5.4% to none for the period of 1992 to 2021. Similar observations can be made for the data with a 20-year moving window.
The maximum cold snap FI for Nome was divided into four intervals: less than 375 °C·Days, between 375 °C·Days and 750 °C·Days, between 750 °C·Days and 1125 °C·Days, and between 1125 °C·Days and 1500 °C·Days. The proportion in each category was evaluated for the entire study period and for the last few decades in two moving windows, i.e., 30 years and 20 years, and the results are listed in Figure 14a,b. The results indicate that the percentage of the maximum cold snap FI less than 375 °C·Days doubled, from 14.4% for the entire study period 30.0% for the period of 1992 to 2021. Apparently, the proportion of the maximum cold snap FI between 1125 °C·Days and 1500 °C·Days slightly increased from the historical average of 4.5% to 6.7% for the period of 2012 to 2021.
The maximum cold snap FI for Utqiagvik was divided into four intervals: less than 1000 °C·Days, between 1000 °C·Days and 2000 °C·Days, between 2000 °C·Days and 3000 °C·Days, and greater than 3000 °C·Days. The proportion in each category was evaluated for the entire study period and for the last few decades in two moving windows, i.e., 30 years and 20 years, and the results are illustrated in Figure 15a,b. While the proportions of the maximum cold snap FI less than 1000 °C·Days and between 1000 °C·Days and 2000 °C·Days increase, those for the latter two categories decrease. In particular, the percentage of the maximum cold snap FI above 4000 °C·Days decreases from 10.2% in the entire study period to 3.3% for the period of 1992 to 2021.

5. Discussion

This study analyzed the variation trends of winter cold snaps in Subarctic and Arctic Alaska using historical temperature data from four distinct locations: Bethel, Fairbanks, Nome, and Utqiagvik. The findings of this analysis provide valuable insights into the changing patterns of winter cold snaps in the region, which directly influence the effectiveness of thermosyphons used for foundation stabilization in permafrost areas.
The results are consistent with the broader Arctic warming pattern observed in a couple of dozen climate models, which collectively highlight a similar trend of temperature increase in the Arctic region [39]. However, the analysis of cold snap frequency and intensity revealed a general decline in the severity of cold snaps over the study period. Specifically, the frequency and intensity of cold snaps in Bethel and Nome have decreased, likely due to the moderating influence of the nearby ocean, which buffers the effects of extreme cold. Conversely, Fairbanks and Utqiagvik also show a decline in the intensity of cold snaps, with fewer occurrences of extreme cold events in recent decades. This supports the idea that even in more inland locations, the warming trend has reduced the frequency of intense cold snaps.
A key aspect of this study was the calculation of the freezing index for each cold snap event, providing a quantitative measure of cold snap intensity. The results revealed that the maximum freezing index has generally decreased across all study sites, indicating that extreme cold snaps have become less frequent and less severe in recent decades. This trend aligns with the broader regional warming trend. It suggests that the intensity of winter cold snaps is diminishing, which may reduce the efficiency of thermosyphons that rely on sustained cold temperatures for optimal performance [30,40]. Analysis of winter cooling trends in Subarctic and Arctic Alaska, taking into account factors like climate warming and natural fluctuations in climatic parameters, is crucial for optimal use of the thermosyphon.
In conclusion, the findings of this study underscore the importance of understanding the evolving patterns of winter cold snaps in Alaska and their implications for infrastructure in permafrost regions. Given the ongoing trend of warming, future research should focus on exploring alternative solutions for maintaining foundation stability in areas where thermosyphons may become less effective. These findings provide valuable insights for infrastructure planning and adaptive strategies in response to changing climatic conditions in cold regions.

6. Conclusions

Analyses of the variation trends of winter cold snaps in Subarctic and Arctic Alaska, considering factors like climate change and natural climate variability, are crucial for the optimal application of thermosyphons. This study employed historical temperature data from the NOAA NCIE database for four selected locations—Bethel, Fairbanks, Nome, and Utqiagvik—to examine the variation trends of winter cold snaps. Cold snaps for each site were defined based on their historical mean winter air temperature. The frequency and duration of cold snaps at each location were analyzed, and the freezing index for each event was calculated to enhance the understanding of the changing patterns of winter cold snaps. Specifically, the maximum cold snap freezing index for each year and the proportion of each interval were computed to identify trends in the maximum cold snap freezing index over recent decades. Based on the findings, the following conclusions were drawn:
  • The mean annual air temperatures in all five study sites demonstrate a long-term warming trend. In particular, there was abrupt warming after 1975, confirming the climate regime shift in the Pacific and Alaska.
  • The long-term average monthly temperature of all five study sites shows an upward trend, with a more significant increase in winter than in summer temperatures. The changes in mean monthly air temperature in winter are the largest for all five study sites, indicating more warming in winter than in summer.
  • The winter cold snap frequency among the five study sites remains mostly unchanged. However, the duration and average intensity show a downtrend trend.
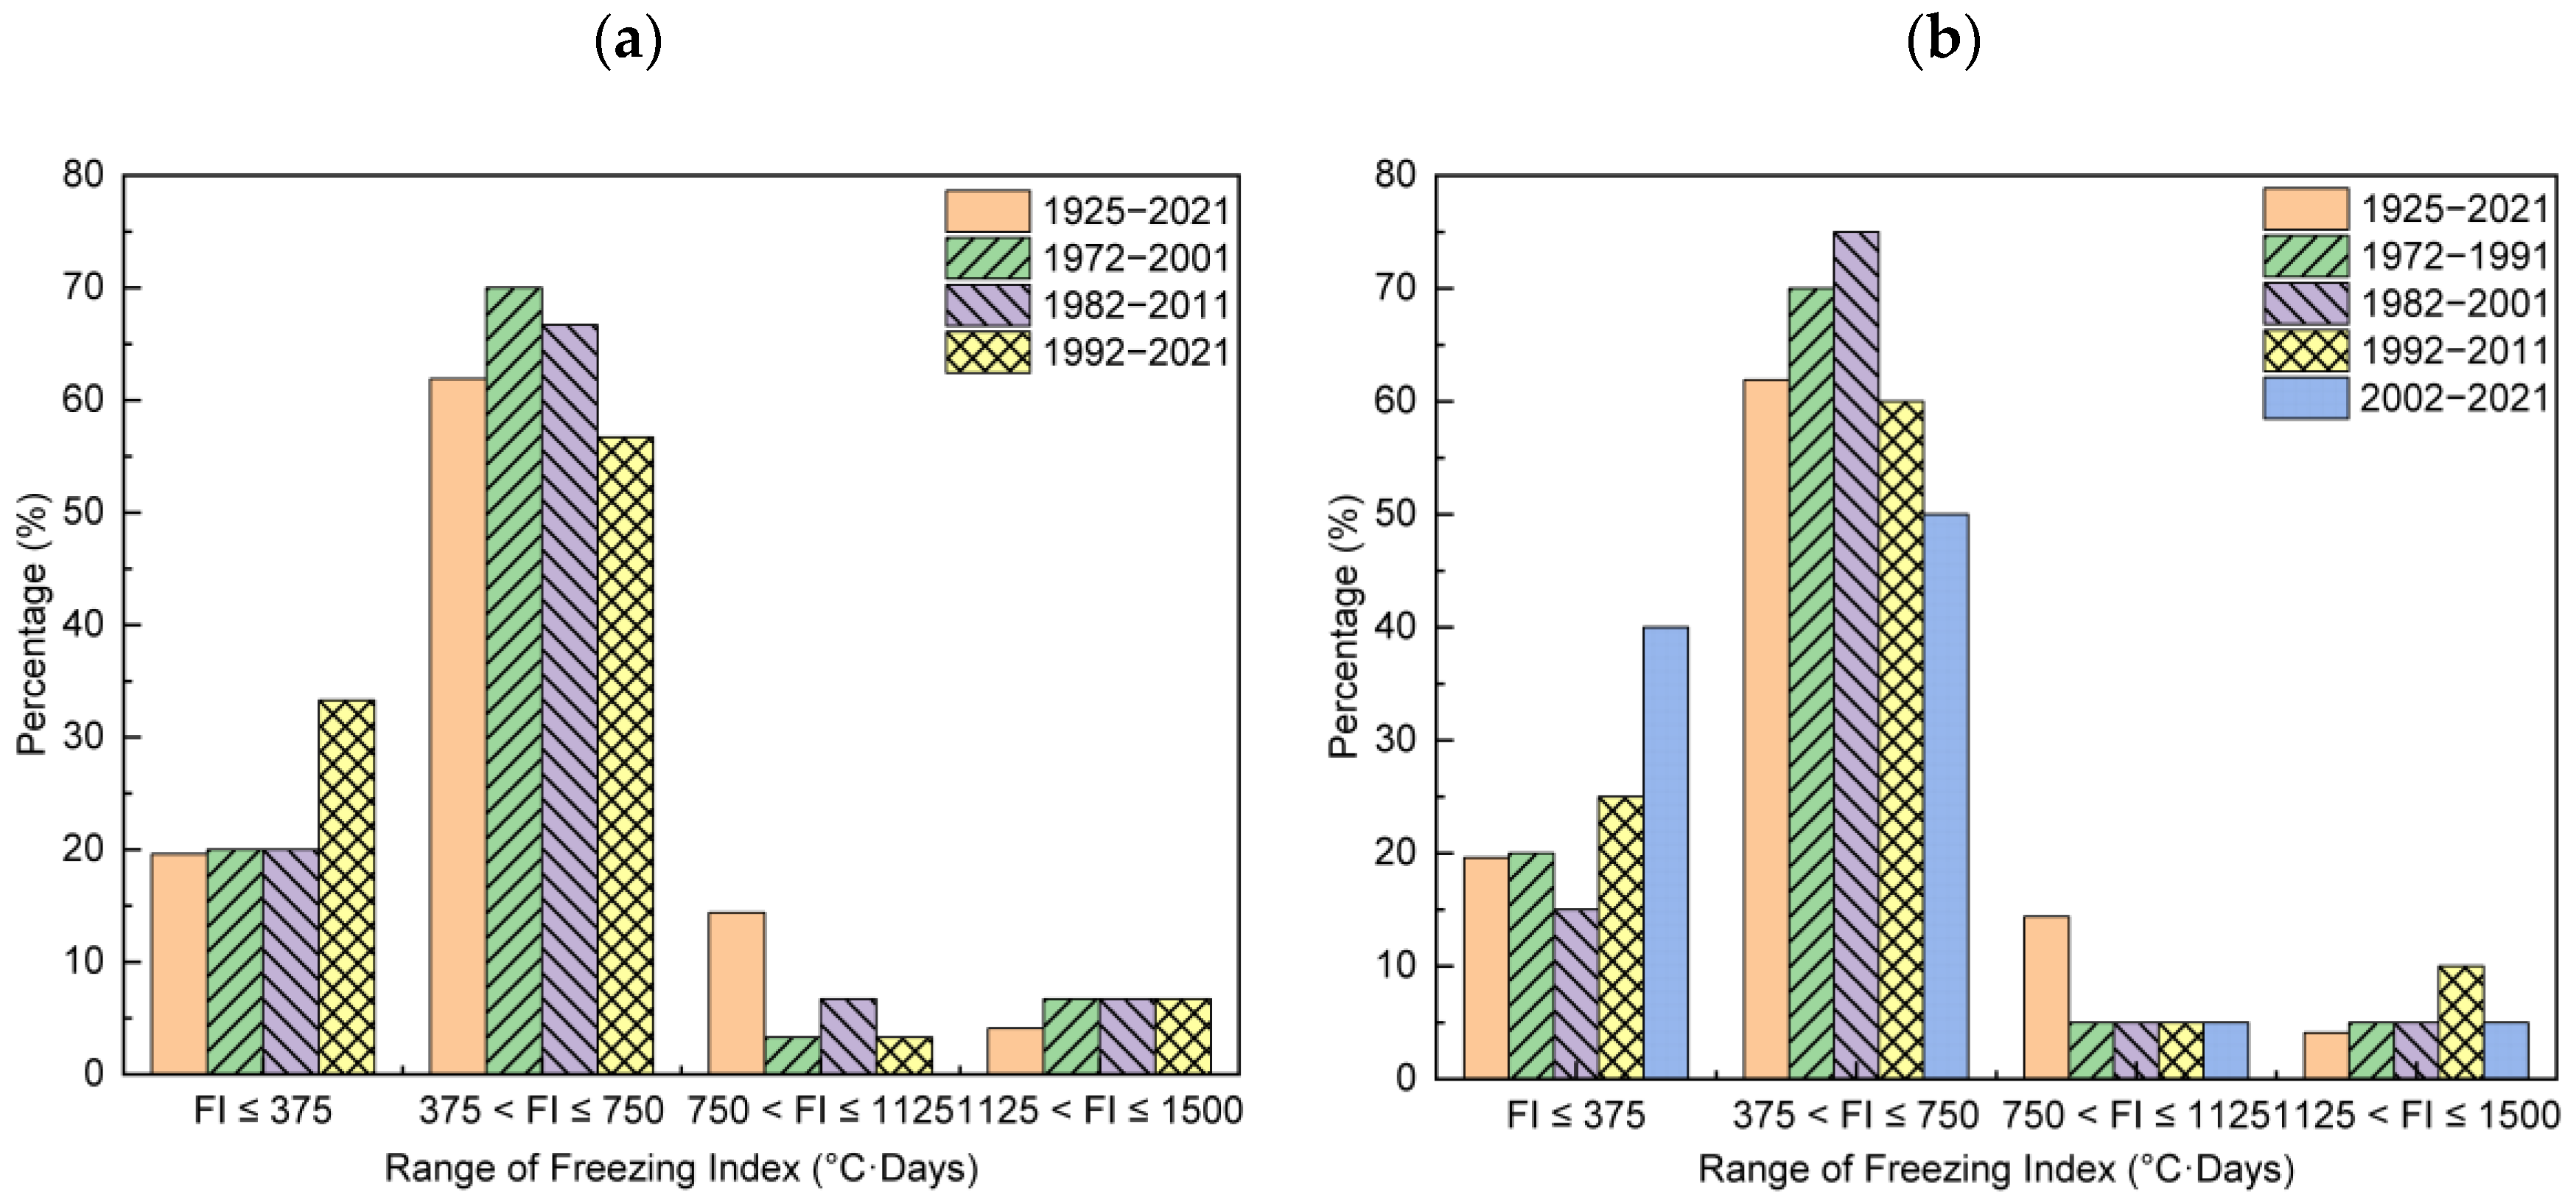
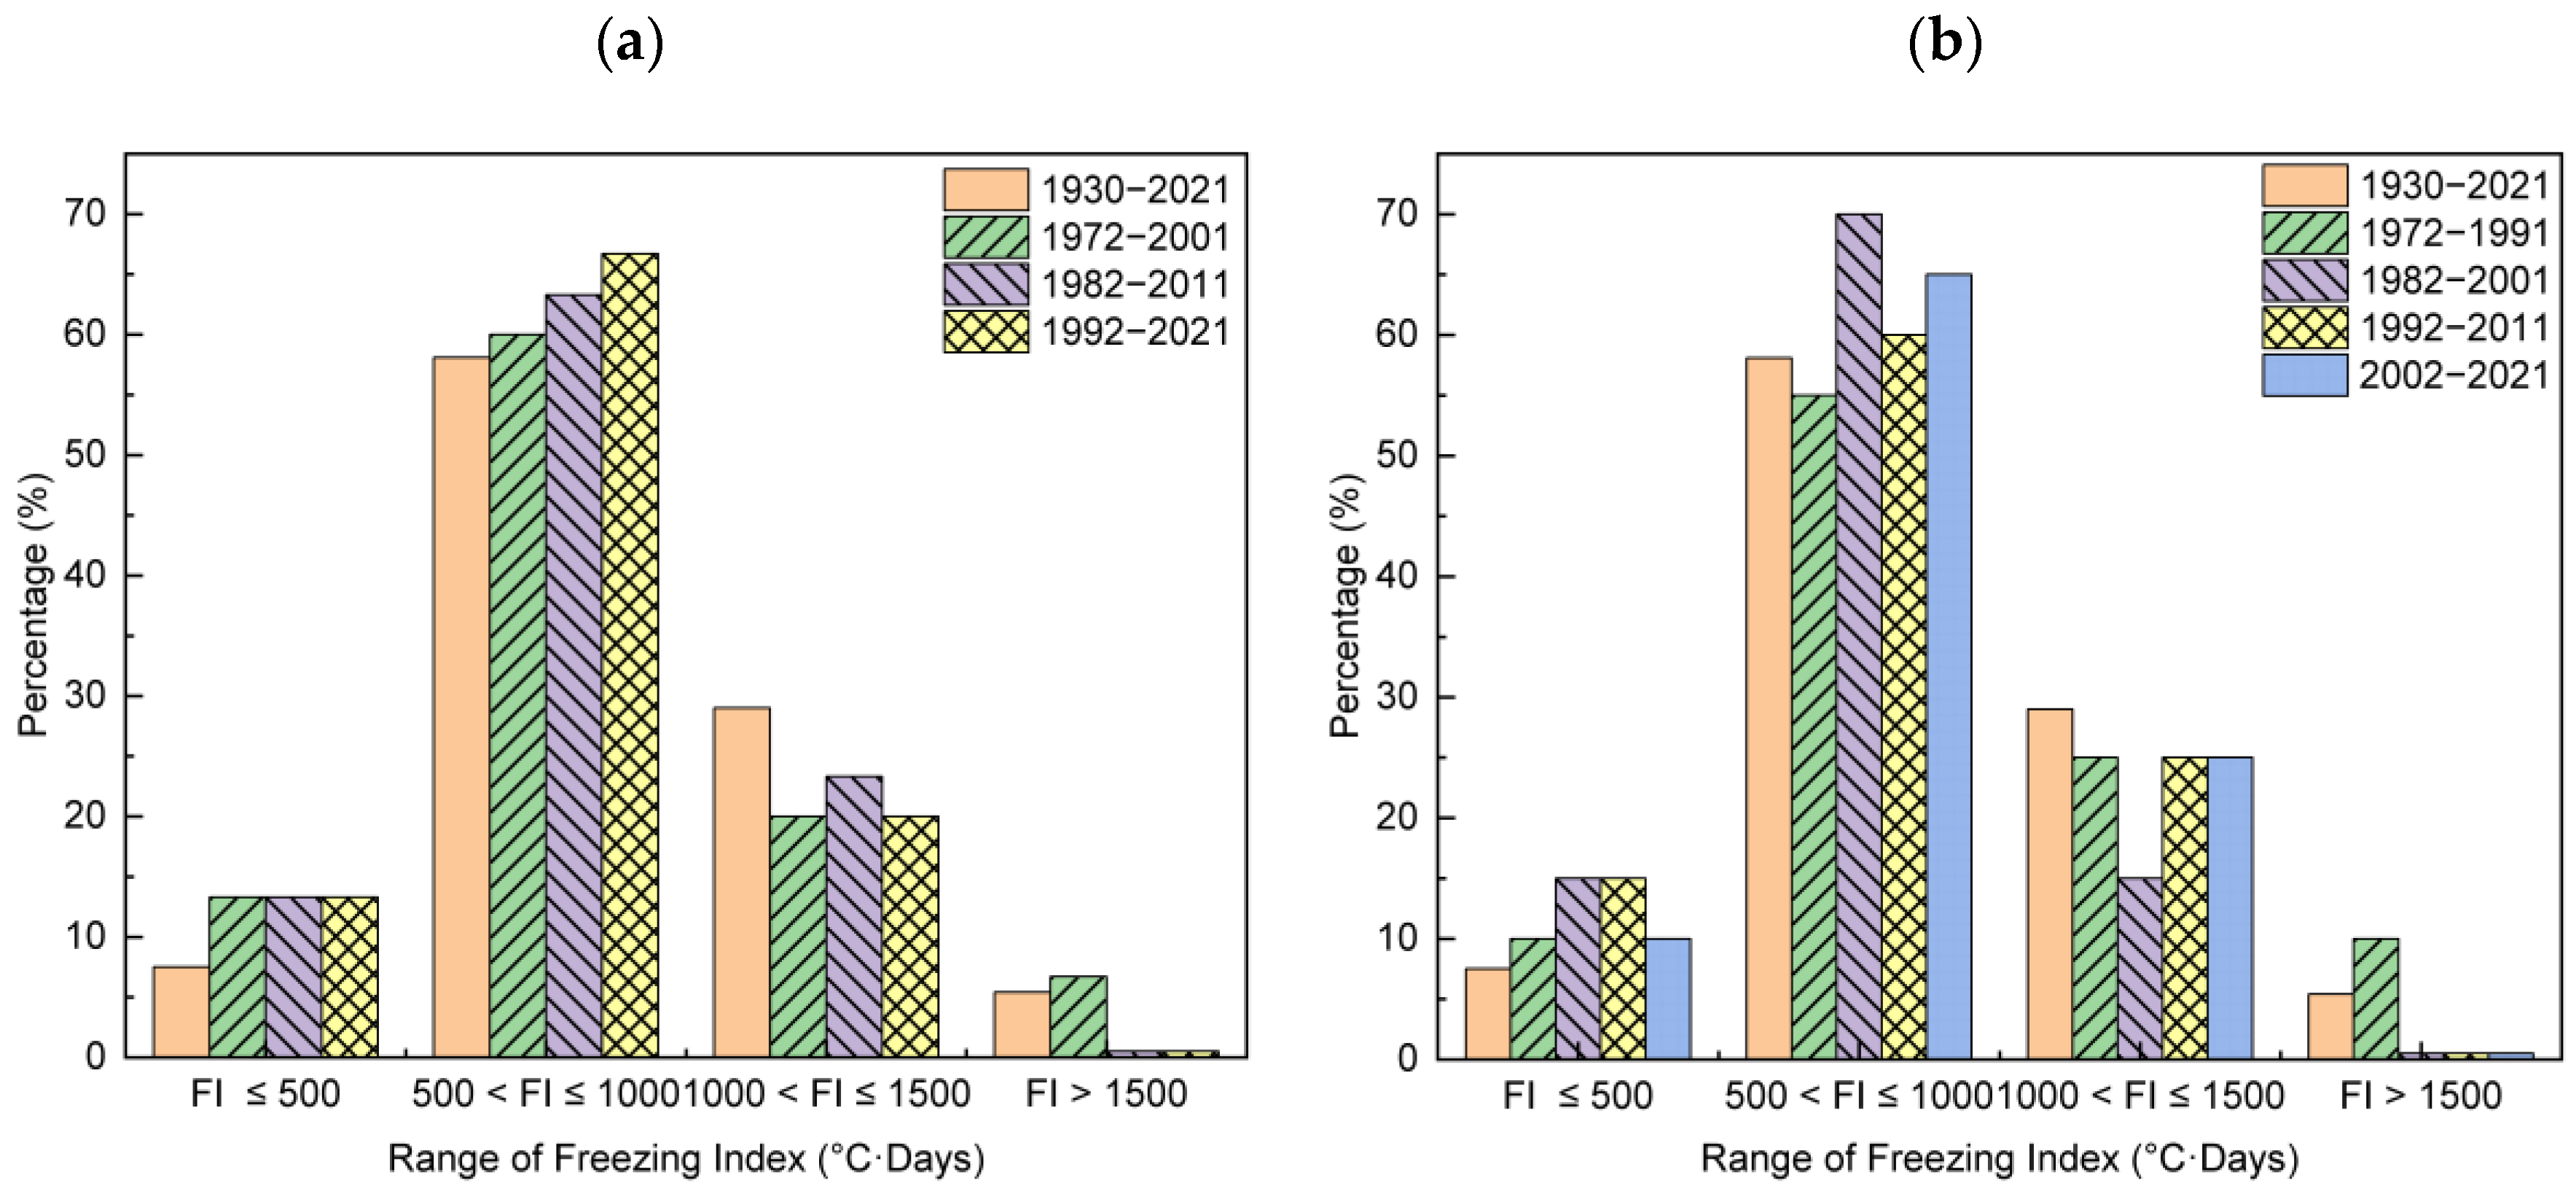
  • Compared to historical data, all five study sites show a more pronounced decline in the maximum cold snap intensity as measured by the freezing index over the past 30 years, with the maximum cold snap freezing index reaching new lows in the last decade.
  • For all five study sites, the proportions of the maximum cold snap freezing index in the highest category declined, whereas those in the lowest category rose.

Author Contributions

Conceptualization, X.C. and Z.Y.; methodology, X.C. and Z.Y.; validation, Y.Z. and K.Z.; formal analysis, X.C.; investigation, X.C. and K.Z.; writing—original draft preparation, X.C.; writing—review and editing, Z.Y. and K.Z.; visualization, Z.Y. and C.D.; funding acquisition, C.D. All authors have read and agreed to the published version of the manuscript.

Funding

This research was funded by the National Natural Science Foundation of China, the State Key Laboratory of Permafrost Engineering Open Fund Grant, and the Strategic Priority Research Program of the Chinese Academy of Sciences, and numbers are as follows: National Natural Science Foundation of China, No. 41202171, The State Key Laboratory of Permafrost Engineering Open Fund Grant, No. SKLFSE201310, and the Strategic Priority Research Program of the Chinese Academy of Sciences, No. XDA28100105.

Institutional Review Board Statement

Not applicable.

Informed Consent Statement

Not applicable.

Data Availability Statement

The data presented in this study are openly available.

Conflicts of Interest

The authors declare no conflicts of interest.

References

  1. Singh, M.K.; Singh, B.R. Observation and Temperature Changes: Warming of The Climate System and Future of Global Warming in 21st Century. SAMRIDDHI A J. Phys. Sci. Eng. Technol. 2014, 5, 137–142. [Google Scholar] [CrossRef]
  2. You, Q.; Cai, Z.; Pepin, N.; Chen, D.; Ahrens, B.; Jiang, Z.; Wu, F.; Kang, S.; Zhang, R.; Wu, T.; et al. Warming amplification over the Arctic Pole and Third Pole: Trends, mechanisms and consequences. Earth-Sci. Rev. 2021, 217, 103625. [Google Scholar] [CrossRef]
  3. Overland, J.E.; Hanna, E.; Hanssen-Bauer, I.; Kim, J.; Walsh, J.E.; Wang, M.; Thomas, R.L. Arctic Report Card: Tracking Recent Environmental Changes Relative to Historical Records. Retrieved from Arctic Program. Available online: https://www.arctic.noaa.gov/report-card (accessed on 8 December 2022).
  4. Hoegh-Guldberg, O.; Jacob, D.; Taylor, M.; Guillén Bolaños, T.; Bindi, M.; Brown, S.; Diedhiou, A.; Djalante, R.; Ebi, K.; Engelbrecht, F.; et al. The human imperative of stabilizing global climate change at 1.5 °C. Science 2019, 365, eaaw6974. [Google Scholar] [CrossRef] [PubMed]
  5. Intergovernmental Panel on Climate Change (IPCC). Summary for Policymakers. In Global Warming of 1.5 °C. An IPCC Special Report on the Impacts of Global Warming of 1.5 °C Above Pre-Industrial Levels and Related Global Greenhouse Gas Emission Pathways, in the Context of Strengthening the Global Response to the Threat of Climate Change; Sustainable Development, and Efforts to Eradicate Poverty 32; IPCC Secretariat: Geneva, Switzerland, 2018. [Google Scholar]
  6. Wang, K.; Zhang, T.; Zhang, X.; Clow, G.D.; Jafarov, E.E.; Overeem, I.; Romanovsky, V.; Peng, X.; Cao, B. Continuously amplified warming in the Alaskan Arctic: Implications for estimating global warming hiatus. Geophys. Res. Lett. 2017, 44, 9029–9038. [Google Scholar] [CrossRef]
  7. Stewart, B.C.; Kunkel, K.E.; Stevens, L.E.; Sun, L.; Walsh, J.E. Regional Climate Trends and Scenarios for the US National Climate Assessment: Part 7; Climate of Alaska: Fairbanks, AK, USA, 2013.
  8. Taylor, P.C.; Maslowski, W.; Perlwitz, J.; Wuebbles, D.J. Arctic changes and their effects on Alaska and the rest of the United States. In Climate Science Special Report: Fourth National Climate Assessment; U.S. Global Change Research Program: Washington, DC, USA, 2017; Volume I, pp. 303–332. Available online: https://digitalcommons.unl.edu/usdeptcommercepub/582 (accessed on 15 December 2022).
  9. Serreze, M.; Walsh, J.; Chapin, F.; Osterkamp, T.; Dyurgerov, M.; Romanovsky, V.; Barry, R. Observational evidence of recent change in the northern high-latitude environment. Clim. Change 2000, 46, 159–207. [Google Scholar] [CrossRef]
  10. Bone, C.; Alessa, L.; Kliskey, A.; Altaweel, M. Influence of statistical methods and reference dates on describing temperature change in Alaska. J. Geophys. Res. Atmos. 2010, 115, D19122. [Google Scholar] [CrossRef]
  11. Gil-Alana, L.A. Long memory, seasonality and time trends in the average monthly temperatures in Alaska. Theor. Appl. Climatol. 2012, 108, 385–396. [Google Scholar] [CrossRef]
  12. Bieniek, P.A.; Walsh, J.E.; Thoman, R.L.; Bhatt, U.S. Using climate divisions to analyze variations and trends in Alaska temperature and precipitation. J. Clim. 2014, 27, 2800–2818. [Google Scholar] [CrossRef]
  13. Larsen, P.; Goldsmith, S.; Smith, O.; Wilson, M.; Strzepek, K.; Chinowsky, P.; Saylor, B. Estimating future costs for Alaska public infrastructure at risk from climate change. Glob. Environ. Chang. 2008, 18, 442–457. [Google Scholar] [CrossRef]
  14. Thoman, R.; Walsh, J.E. Alaska’s Changing Environment: Documenting Alaska’s Physical and Biological Changes Through Observations; McFarland, H.R., Ed.; International Arctic Research Center, University of Alaska Fairbanks: Fairbanks, AK, USA, 2019. [Google Scholar]
  15. Hartmann, B.; Wendler, G. The Significance of the 1976 Pacific Climate Shift in the Climatology of Alaska. J. Clim. 2005, 18, 4824–4839. [Google Scholar] [CrossRef]
  16. Ummenhofer, C.C.; Meehl, G.A. Extreme weather and climate events with ecological relevance: A review. Philos. Trans. R. Soc. B Biol. Sci. 2017, 372, 20160135. [Google Scholar] [CrossRef] [PubMed]
  17. Burakowski, E.A.; Contosta, A.R.; Grogan, D.; Nelson, S.J.; Garlick, S.; Casson, N. Future of winter in Northeastern North America: Climate indicators portray warming and snow loss that will impact ecosystems and communities. Northeast. Nat. 2022, 28, 180–207. [Google Scholar] [CrossRef]
  18. Balasubramanian, A. Extreme Climatic (Weather) Events. Status Report; Centre for Advance Studies in Earth Science, University of Mysore: Mysore, Karnataka, 2018. [Google Scholar] [CrossRef]
  19. Stewart, R.E.; Bachand, D.; Dunkley, R.R.; Giles, A.C.; Lawson, B.; Legal, L.; Miller, S.; Murphy, B.; Parker, M.; Yau, M.K. Winter storms over Canada. Atmos.-Ocean 1995, 33, 223–247. [Google Scholar] [CrossRef]
  20. Sheridan, S.C.; Lee, C.C. Temporal trends in absolute and relative extreme temperature events across North America. J. Geophys. Res. Atmos. 2018, 123, 11898. [Google Scholar] [CrossRef]
  21. Lynch, A.H.; Brunner, R.D. Context and climate change: An integrated assessment for Barrow, Alaska. Clim. Chang. 2007, 82, 93–111. [Google Scholar] [CrossRef]
  22. Melvin, A.M.; Larsen, P.; Boehlert, B.; Neumann, J.E.; Chinowsky, P.; Espinet, X.; Martinich, J.; Baumann, M.; Rennels, L.; Bothner, A.; et al. Climate change damages to Alaska public infrastructure and the economics of proactive adaptation. Proc. Natl. Acad. Sci. USA 2017, 114, E122–E131. [Google Scholar] [CrossRef] [PubMed]
  23. Grebenets, V.; Streletskiy, D.; Shiklomanov, N. Geotechnical safety issues in the cities of Polar Regions. Geogr. Environ. Sustain. 2012, 5, 104–119. [Google Scholar] [CrossRef]
  24. Raynolds, M.K.; Walker, D.A.; Ambrosius, K.J.; Brown, J.; Everett, K.R.; Kanevskiy, M.; Kofinas, G.; Romanovsky, V.; Shur, Y.; Webber, P.J. Cumulative geoecological effects of 62 years of infrastructure and climate change in ice-rich permafrost landscapes, Prudhoe Bay Oilfield, Alaska. Glob. Chang. Biol. 2014, 20, 1211–1224. [Google Scholar] [CrossRef]
  25. Hjort, J.; Karjalainen, O.; Aalto, J.; Westermann, S.; Romanovsky, V.; Nelson, F.; Etzelmüller, N.; Luoto, M. Degrading permafrost puts Arctic infrastructure at risk by mid-century. Nat. Commun. 2018, 9, 5147. [Google Scholar] [CrossRef]
  26. Nelson, F. Climate Change, Permafrost, and Impacts on Civil Infrastructure; US Arctic Research Commission, Permafrost Task Force, U.S. Arctic Research Commission: Arlington, Vigina, 2003.
  27. Pal, A.; Joshi, Y.K.; Beitelmal, M.H.; Patel, C.D.; Wenger, T.M. Design and performance evaluation of a compact thermosyphon. IEEE Trans. Compon. Packag. Technol. 2002, 25, 601–607. [Google Scholar] [CrossRef]
  28. Athienitis, A.K.; Santamouris, M. Thermal Analysis and Design of Passive Solar Buildings; Routledge: Milton Park, UK, 2013. [Google Scholar]
  29. Yarmak, E., Jr.; Zottola, J.T. Thermosyphon design for a changing arctic. In Congress on Technical Advancement; American Society of Civil Engineering: Anchorage, AK, USA, 2017; pp. 151–160. Available online: https://ascelibrary.org/doi/abs/10.1061/9780784481011.015 (accessed on 5 January 2023).
  30. Yarmak, E., Jr.; Long, E.L. The performance of a flat-loop evaporator thermosyphon at Deadhorse, Alaska. In Proceedings of the 15th International Conference on Cold Regions Engineering, Quebec, QC, Canada, 19–22 August 2012. [Google Scholar]
  31. Yan, Z.; Zhang, M.; Lai, Y.; Pei, W.; Luo, T.; Yu, F.; Yang, S. Countermeasures combined with thermosyphons against the thermal instability of high-grade highways in permafrost regions. Int. J. Heat Mass Transf. 2020, 153, 119047. [Google Scholar] [CrossRef]
  32. Jardine, J.D.; Long, E.L.; Yarmak, E. Thermal analysis of forced-air and thermosyphon cooling systems for the Inuvik airport expansion: Discussion. Can. Geotech. J. 1992, 29, 998–1001. [Google Scholar] [CrossRef]
  33. Wagner, A.M. Review of Thermosyphon Applications Cold Regions; ERDC/CRREL TR-14-1; Cold Regions Research and Engineering Laboratory: Hanover, NH, USA, February 2014. [Google Scholar]
  34. Armstrong, A.; Dorney, C.; Flood, M.; Garich, E.; Krcma, K.; Meyer, M.; Jerry, R.; Eli, S. Alaska Climate Trend Vulnerability Study (No. FHWA-WFL/TD-16-001). United States. Federal Highway Administration. Western Federal Lands Highway Division. 2016. Available online: https://rosap.ntl.bts.gov/view/dot/67113/dot_67113_DS1.pdf (accessed on 15 December 2022).
  35. Kettle, N.P.; Walsh, J.E.; Heaney, L.; Thoman, R.L.; Redilla, K.; Carroll, L. Integrating archival analysis, observational data, and climate projections to assess extreme event impacts in Alaska. Clim. Chang. 2020, 163, 669–687. [Google Scholar] [CrossRef]
  36. National Centers for Environmental Information. Available online: https://www.ncei.noaa.gov/products/land-based-station/us-climate-normals (accessed on 8 December 2022).
  37. Goodman, S.N. Toward evidence-based medical statistics. 1: The P value fallacy. Ann. Intern. Med. 1999, 130, 995–1004. [Google Scholar] [CrossRef]
  38. Budikova, D. Impact of the Pacific Decadal Oscillation on relationships between temperature and the Arctic Oscillation in the USA in winter. Clim. Res. 2005, 29, 199–208. [Google Scholar] [CrossRef]
  39. Comiso, J.C. Warming trends in the Arctic from clear sky satellite observations. J. Clim. 2003, 16, 3498–3510. [Google Scholar] [CrossRef]
  40. Yang, Z.J.; Lee, K.C.; Liu, H. Permafrost thaw and ground settlement considering long-term climate impact in northern Alaska. J. Infrastruct. Preserv. Resil. 2021, 2, 8. [Google Scholar] [CrossRef]
Figure 1. Location of study sites.
Sustainability 17 02438 g001
Figure 2. Mean annual air temperature of the four study sites. (a) Bethel; (b) Fairbanks; (c) Nome and (d) Utqiagvik.
Sustainability 17 02438 g002
Figure 3. Long-term average air temperature of Bethel. (a) Mean monthly air temperature and (b) Difference from the mean monthly temperature.
Sustainability 17 02438 g003
Figure 4. Long-term average air temperature of Fairbanks. (a) Mean monthly air temperature and (b) Difference from the mean monthly temperature.
Sustainability 17 02438 g004
Figure 5. Long-term average air temperature of Nome. (a) Mean monthly air temperature and (b) Difference from the mean monthly temperature.
Sustainability 17 02438 g005
Figure 6. Long-term average air temperature of Utqiagvik. (a) Mean monthly air temperature and (b) Difference from the mean monthly temperature.
Sustainability 17 02438 g006
Figure 7. Daily mean air temperature from 1 July 1945 to 30 June 1946 for Fairbanks, AK.
Sustainability 17 02438 g007
Figure 8. Cold snap frequency of the four study sites. (a) Bethel; (b) Fairbanks; (c) Nome and (d) Utqiagvik.
Sustainability 17 02438 g008
Figure 9. Cold snap duration of the four study sites. (a) Bethel; (b) Fairbanks; (c) Nome and (d) Utqiagvik.
Sustainability 17 02438 g009
Figure 10. Average freezing index of the four study sites. (a) Bethel; (b) Fairbanks; (c) Nome and (d) Utqiagvik.
Sustainability 17 02438 g010
Figure 11. Maximum cold snap freezing index of the four study sites. (a) Bethel; (b) Fairbanks; (c) Nome and (d) Utqiagvik.
Sustainability 17 02438 g011
Figure 12. Illustration of proportions of the maximum cold snap freezing index in various periods with a moving window of 30 and 20 years for Bethel. (a) 30 years moving window and (b) 20 years moving window.
Sustainability 17 02438 g012
Figure 13. Illustration of proportions of the maximum cold snap freezing index in various periods with a moving window of 30 and 20 years for Fairbanks. (a) 30 years moving window and (b) 20 years moving window.
Sustainability 17 02438 g013
Figure 14. Illustration of proportions of the maximum cold snap freezing index in various periods with a moving window of 30 and 20 years for Nome. (a) 30 years moving window and (b) 20 years moving window.
Sustainability 17 02438 g014
Figure 15. Illustration of proportions of the maximum cold snap freezing index in various periods with a moving window of 30 and 20 years for Utqiagvik. (a) 30 years moving window and (b) 20 years moving window.
Sustainability 17 02438 g015
Disclaimer/Publisher’s Note: The statements, opinions and data contained in all publications are solely those of the individual author(s) and contributor(s) and not of MDPI and/or the editor(s). MDPI and/or the editor(s) disclaim responsibility for any injury to people or property resulting from any ideas, methods, instructions or products referred to in the content.

