Article

Anaerobic Digestion of Rice Straw as Profitable Climate Solution Reduces Paddy Field Greenhousegas Emissions and Produces Climate-Smart Fertilizer Under Carbon Trading Mechanisms

1
Shanghai Academy of Environmental Sciences, Shanghai 200233, China
2
Center for Environmental Policy, Imperial College London, London SW7 1NA, UK
3
Office of the Deputy Vice Chancellor, Research and Innovation, Strathmore University, Ole Sangale Rd, Madaraka Estate, Nairobi P.O. Box 59857-00200, Kenya
*
Authors to whom correspondence should be addressed.
Sustainability 2025, 17(6), 2439; https://doi.org/10.3390/su17062439
Submission received: 26 December 2024 / Revised: 28 February 2025 / Accepted: 4 March 2025 / Published: 11 March 2025
(This article belongs to the Section Sustainable Agriculture)

Abstract

:
Continuous incorporation of rice straw has caused significant CH4 emissions from the paddy field production system in East China. Anaerobic digestion (AD) of the rice straw has been considered as a promising approach that could not only mitigate the land-based CH4 emissions, but also generate low-carbon electricity and high-quality organic fertilizer. However, this approach, in many circumstances, is unable to be cost-competitive with other straw treatment processes or power sources. To understand the potential incentives that recently launched carbon trading schemes, the China Carbon Emission Trade Exchange (CCETE) and Chinese Certified Emission Reduction (CCER), could bring to the rice straw utilization value chain, we conducted a cradle-to-factory gate life cycle assessment and economic analysis of a small-scale AD system with rice straw as the main feedstock in East China. The results indicate that, depending on the choice of allocation method, the climate change impact of the bioenergy generated through the studied small-scale AD system is 0.21 to 0.28 kg CO2eq./kWh, and the digester fertilizer produced is 6.88 to 22.09 kg CO2eq./kg N. The economic analysis validates the financial sustainability of such small-scale AD projects with rice straw feedstock under carbon trading mechanisms. The climate mitigation potential could be achieved at the marginal reduction cost of 13.98 to −53.02 USD/t CO2eq. in different carbon price scenarios.

1. Introduction

The agricultural production system is an important source of anthropogenic greenhouse gas (GHG) emissions, especially CH4 and N2O [1,2]. As a primary CH4 source, paddy field rice production in eastern Asia emits 33 to 40 Tg CH4 annually, accounting for approximately 15–20% of global anthropogenic CH4 emissions [3].
As the world’s largest straw producer, China produces 400 × 106 Mg of rice straw annually [4]. For the benefits of air quality control, straw burning activities have been banned. Thus, straw retention in the paddy fields has become the prevalent straw treatment method in China [5]. Although it is suggested that straw in situ application benefits soil structure, increases soil organic matter contents and helps improve the general soil nutrients and soil health [6], the continuous direct incorporation of rice straw in paddy fields provides abundant substrates and exerts a priming effect on the soil organic matter to release additional substrates for CH4 production under anaerobic conditions during rice cultivation seasons, thus significantly accelerating the CH4 emissions from the Chinese agricultural land management system [7]. Research has investigated the effects of in situ rice straw management on GHG emissions, and the results showed that compared with other straw management options, including straw mulching, straw off-season application and straw-derived biochar application, the in situ application of fresh rice straw would increase land-based methane emissions by 40% to 80% [1,8,9,10]. Optimizing the straw application pattern [11] and application time [12] helps to sustainably maintain the soil fertility while reducing the CH4 emissions to a certain extent. As reflected in policy making, in 2023, China released its national methane emission control action plan and highlighted the importance of rice straw off-land management in methane reduction.
The small-scale anaerobic digestion (AD) of rice straw has been considered as a promising approach that could not only mitigate land-based CH4 emissions, but also provide locally sourced low-carbon electricity and high-quality organic fertilizer [13,14,15]. Various approaches have been developed to boost biogas production efficiency and maximize biogas yield [16]. For instance, Qian et al. [17] optimized the biogas productivity from a co-digestion system with rice straw and swine through alkaline-microwave pre-treatment. Researchers have been dedicated to quantifying the environmental impacts of agricultural waste-based AD systems through life cycle assessment (LCA) approaches. However, most of the research was carried out for systems in western countries [18,19,20]. At present, only Alengebawy et al.’s [21] research has evaluated the life cycle environmental impacts of an AD system in China that primarily uses rice straw as feedstock, and this research only encompasses the production scenarios of three products: biogas, briquetted fuel and syngas. A scenario where electricity serves as the final product has not been considered. Moreover, the carbon mitigation potential compared between the electricity generated from rice straw and that of the national grid has not been identified [21].
Although small-scale AD systems, due to their decentralized distribution, reduce logistics costs compared with large-scale AD plants [15], such an approach in many circumstances is still unable to be cost-competitive with other straw treatment options (such as direct soil incorporation or aerobic composting) and power provision strategies [15,22]. Several reasons have been identified for its low performance, among which the most significant are the relatively high initial investment in production facilities and the characterization of rice straw material [15,17]. The successes and failures of similar small-scale AD systems reported previously indicated that the key barrier for small-farm AD implementation is its relatively high capital outlays versus those of its large-farm counterparts [4,14]. Research has also disclosed that due to its chemical composition and cell structure, the biogas yields from rice straw-based AD are generally smaller compared with other feedstock types, such as corn stover [17]. Thus, achieving decent economic performance with rice straw-based small-scale AD would require improvement of the revenue stream, for example, through energy offsets or sales or through carbon credits.
Possible future commercialization opportunities have been indicated, as the price of CO2 should be considered as a crucial parameter in evaluating the possible economic benefits within the bioeconomy [23]. China launched its national Cap and Trade carbon market, the China Carbon Emission Trade Exchange (CCETE), in 2021 and implemented its national carbon offset mechanism, the Chinese Certified Emission Reduction (CCER) scheme, as a supplementary mechanism in 2024. Agricultural projects verified by the CCER market are believed to be an important practice for agriculture to participate in voluntary carbon markets and the bioeconomy [24]. With the carbon price rising up to 100 Chinese Yuan/t CO2eq. (approximate 14.01 USD/t CO2eq.) in 2024, it might bring extra economic incentives to support such climate mitigation management options as profitable low-carbon agricultural waste management strategies and help China achieve its 2060 NetZero ambition. However, uncertainties still remain about the actual carbon footprint of such small-scale rice straw-based AD systems using the Chinese Life Cycle Assessment database (CLCD) and the financial balance during system operation under future CCER scenarios [23].
Two hypotheses were tested in this study. Firstly, significant GHG mitigation potential can be generated by the production scenario of combined biogas–fertilizer production through the straw-based AD system (the rice straw-AD scenario, RS-AD), compared with the baseline scenario where the rice straw is managed with direct soil incorporation, with no bioenergy or organic fertilizer produced (the rice straw retention in field scenario, RS-RF). Secondly, if future potential carbon credits could be aroused from the RS-AD scenario through carbon trading mechanisms such as the CCER, substantial economic support will be provided for their wider commercialization. In this study, by choosing an AD system with the feedstock processing capacity of 2125 t of straw (dry matter) per year, we conducted a cradle-to-factory gate LCA to understand the GHG emission performance of such small-scale straw-based bioenergy production systems. In addition, a simultaneous economic analysis has also been performed to test its financial performance under carbon trading scenarios, taking the carbon prices into account to obtain robust estimations of the associated marginal carbon reduction costs (MRCs).

2. Materials and Methods

The studied AD plant is located in QingPu District, Shanghai (Figure 1), which is one of the main rice production areas in East China. The annual rice productivity in QingPu District was 68 kilotons/year in 2019. Following previous works, the feedstock transportation in this study was assumed as 50 km, as this is the cost-effective feedstock transportation distance for the bio-refinery plant [23,25]. A small amount of pig manure was also used to adjust the C/N ratio in the digester [17]. In the year 2020, the plant processed 2125 tons of rice straw (dry matter, moisture content of around 14%) and 142 tons (wet weight with a moisture content of 78%) of fresh manure in total. Its annual biogas yield was 442 015 m3 in 2020. Our case-study system can be considered as a typical small-scale AD system [19]. With a methane content around 55%, this studied AD plant generated 662,475 kWh of electricity and 1095 tons of standard organic fertilizer (with a nitrogen content above 4%) in that year.

2.1. LCA Methodology

2.1.1. General Specification

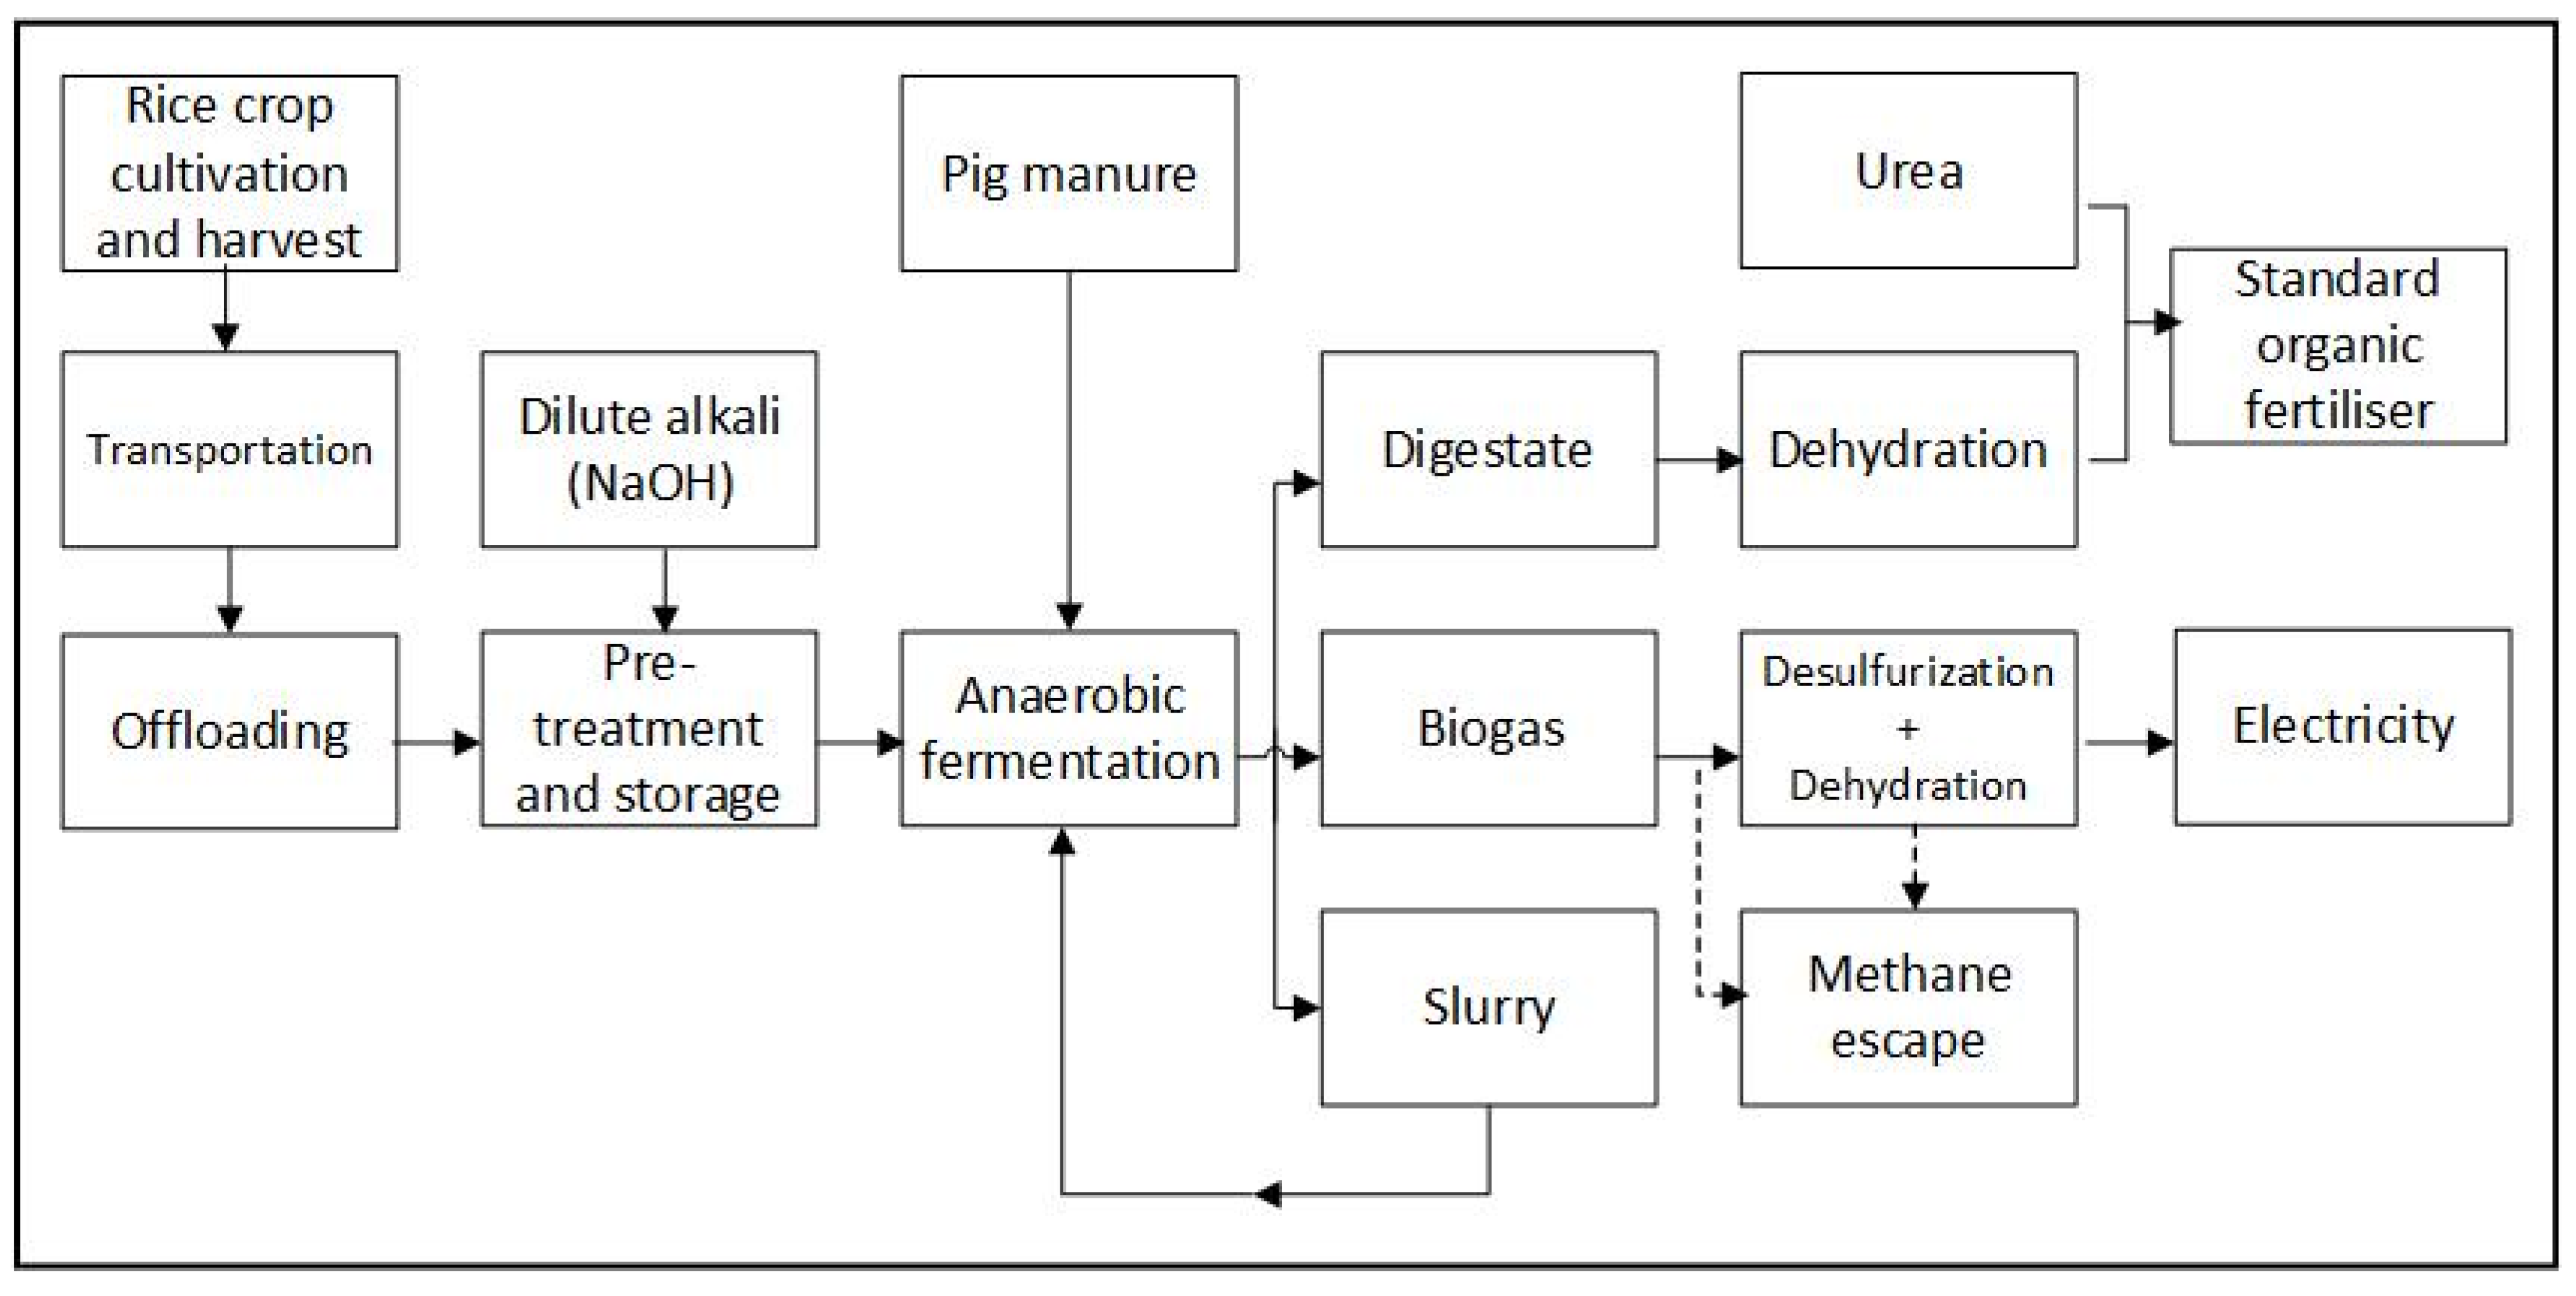
To achieve accurate estimates of the GHG reduction potential of the ‘straw-AD- electricity’ value chain, this study conducted a cradle-to-factory gate LCA with a functional unit of ‘production of 1 kWh electricity’ (Figure 2). As shown in Figure 2, it covers the emissions associated with rice straw production, straw harvest, transportation, offloading, pre-treatment, digester operation, dehydration of the digestate, desulfurization and dehydration of biogas, and production of electricity and standard organic fertilizer. Based on previous research [17], a small amount of swine manure (142 t in the year 2020) is added into the digestor to optimize the moisture content and feedstock C/ratio, which helps achieve a higher biogas yield. Life cycle inventory (LCI) analysis involves data collection and calculation procedures [26,27], aiming at producing a compilation of the inputs (resources) and the outputs (emissions) from the product over its life cycle in relation to the functional unit [28]. The LCI procedure was carried out using the CLCD (available from e-footprint software) and the Eco-invent database. Background data (Table 1) used for the LCI development associated with material and energy consumption/production were derived the site operation records. Characterization factors derived from the ReCiPe Midpoint (H) impact assessment methodology were used to generate life cycle impact assessment (LCIA) results from the LCI outputs. The examined indicators included climate change (CC), non-renewable energy use (NREU), water use (WU), acidification (AP), abiotic depletion potential (ADP), eutrophication (EP), ozone depletion (ODP), photochemical ozone formation (POFP), ionizing radiation (IRP), ecotoxicity (ET), human toxicity cancer effects (HT-cancer) and human toxicity non-cancer effects (HT-non-cancer).

2.1.2. Allocation Method

Rice straw and pig manure are both considered by-products of the rice and pork production systems, respectively. However, as straw has been widely used in several alternative end markets, such as bio-pellet and mushroom production, allocation methods were applied when attributing GHG emissions to rice grain and rice straw, following the Publicly Available Specification 2008:2050 (PAS2050) [29]. To clarify the impacts of different allocation methods on the LCA results, we adopted two methods, allocation based on economic value and allocation based on energy value, when attributing the impacts to electricity and the by-product, organic fertilizer. Based on the economic and energy content values listed in Table 2, the economic allocation factors adopted for the rice straw feedstock and electricity products were 11.11% and 34.43%, respectively, and these figures were comparable to the ratios reported by Timonen et al. [20]. The energy allocation factors adopted for rice straw and electricity were 48.12% and 13.46%.

2.2. Economic Analysis and Marginal Carbon Reduction Cost

In this study, two straw management scenarios were created, i.e., the rice straw-AD scenario (RS-AD) and the rice straw retention in field scenario (RS-RF). The latter was also considered as the baseline scenario when estimating the climate mitigation potential alongside the RS-AD production pathway. The marginal carbon reduction cost (MRC) was estimated by comparing the associated system level GHG emissions and economic performance between those two scenarios, following Ni et al. [23] (Equations (1)–(5)).
In the scenario of RS-AD, 2125 t/year (dry matter) of straw was collected during the harvest season and transported to the studied plant, producing 662,475 kWh of bio-electricity and 1095 tons of standard organic fertilizer through the studied AD system. GHG reduction could be achieved through the following pathways: (1) low-carbon electricity generation (compared with the current emission factor of the national grid) and (2) climate-smart organic fertilizer production (compared with the emission factors reported by Walling & Vaneeckhaute) [33]. Instead of being incorporated into the soil, straw ex situ utilization would also reduce the CH4 and N2O emissions in the paddy field system. Financial returns could be generated through the following revenue streams: (1) by injecting the produced electricity into the national grid at a fixed price of 0.105 USD/kWh (converted from 0.75 CNY/kWh); (2) by selling the produced standard organic fertilizer at the market price of 70.02 USD/t (converted from 500.00 CNY/t); (3) by government subsidies for ex situ use of the straw (42.01 USD/t, converted from 300.00 CNY/ton, dry matter); (4) in addition, in a hypothetical carbon trading scenario, the abated carbon emissions would bring extra financial incentives to the rice straw-based AD value chain. On the contrary, the RS-RF scenario represents a business-as-usual scenario, in which the 2125 tons of rice straw was left and decomposed on the paddy field, instead of being utilized for either energy or fertilizer purposes.
M R C = V C A D + F C A D R A D / Q C R
R A D = Q E L × S E L + Q F × S F + Q R S × G R S + Q C R × T C R
V C A D = C R S + C m a n u r e + C N a O H + C w a t e r + C d e s u l f u r i z e r + C d i s e l + C e l e c t r i c i t y + C u r e a
F C A D = C e q u i p m e n t + C e m p l o y e e + C r e n t a l
Q C R = E R F E A D = Q E L × E F R F E L E F A D E L + Q F × E F R F F E F A D F + A P F × E F R F P F E F A D P F )
where E = GHG emissions in t CO2eq./year; R = revenue in USD (converted from CNY); VC = variable cost in USD (converted from CNY); FC = fixed cost in USD (converted from CNY); Q = quantity in ton/year; S = selling price in USD (converted from CNY); G = government subsidies in USD (converted from CNY); T = trading price of carbon in USD/t CO2eq. (converted from CNY); EF = emission factor; subscript AD = RS-AD scenario; subscript RF = RS-RF scenario; subscript CR = carbon reduction; subscript EL = electricity generated; subscript F = fertilizer produced; subscript RS = rice straw consumed; and subscript PF = paddy field.
The exchange rate of RMB to US dollars was set as 7.14:1. The background data associated with the fixed and variable costs applied in this analysis are presented in Table 3. In order to understand the future trends of the MRCs under different carbon trading price scenarios, three levels of carbon trading prices were assumed in this study, i.e., 14 USD/t CO2eq. (converted from 100.00 CNY/t CO2eq., representing the current CCETE price), 28 USD/t CO2eq. (converted from 28.00 Euro/t CO2eq., representing the 10-year average value in the EU Emission Trading System (ETS)) and 68 USD/t CO2eq. (converted from 68.00 Euro/t CO2eq., representing the current EU ETS level).
The values for EFAD−EL and EFAD−F are derived from the LCA results in this work. Following previous publications [23,34], the set of LCA results generated based on the economic allocation method were used in this economic analysis. The values for the EFs of the electricity, fertilizer and paddy field in the RS-RF scenario, i.e., EFRF−EL, EFRF−F and EFRF−PF, as well as the EF for the paddy field without straw incorporation (EFAD−PF), are derived from previous publications [8,33,35]. Considering the extensive variability existing in the reported EFs of fertilizer production systems, the choice of referencing alternatives for the RS-RF scenario would lead to a non-negligible influence on the total estimated GHG reduction potential of the RS-AD (QCR). To avoid over-estimation, a conservative approach was adopted by selecting synthetic nitrogen fertilizers as the reference, as the EFs of urea or ammonium nitrite are much lower than those of the organic alternatives, such as compost [33].

3. Results and Discussion

3.1. LCA Results

A group of twelve indicators were examined in this LCA study, including CC, NREU, WU, AP, ADP, EP, ODP, POFP, IRP, ET, HT-cancer and HT-non-cancer. Considering their magnitudes and the relevance of these impact categories with the objective of this research, only the characterized figures for CC, NREU, WU, ADP and EP are presented in this section (Table 4). The impacts for the other indicator categories (i.e., ADP, ODP, POFP, IRP, ET, HT-cancer and HT-non cancer) are considered relatively minimal, and their characterized figures can be found in Table A1.
As can be seen from Table 4, the LCA results are sensitive to the applied allocation methods. The CC impacts of the bioenergy electricity generated from the studied AD system are 0.28 kg and 0.21 kgCO2eq./kWh for the economic and energy allocations, respectively (Table 4), significantly lower than the reported emission levels of China’s national grid (0.759 kgCO2eq./kWh) [35] and the bio-electricity produced from the AD of pig manure [36]. Bacenetti and his colleagues conducted a comprehensive and systematic literature review of the previously published LCA research on agricultural AD systems [37]. Global warming potential has been evaluated as the most important impact indicator in all of the reviewed LCA reports, although their figures varied significantly in terms of per kWh. Among the previous records, the highest value (0.55 kg CO2eq/kW h) was reported by Siegl et al. [38] for a small-scale AD plant (50–150 kW) with energy crop cereal silage in Austria, and the lowest value (−1.72 kg CO2eq/kW h) was derived from Boulamanti’s work [18]. Our results supported Bacenetti’s conclusion that with electricity produced in agricultural AD plants, even in small-scale ones (which are generally considered as a loss in efficiency compared with larger plants), a lower climate change impact can be achieved compared with fossil energy [18].
The carbon reduction potential achieved in this AD plant is attributed to the following reasons: 1. Allocation procedures have been conducted when quantifying the emission factor associated with the straw feedstock provision; 2. The straw collection and transportation distance was set as 50 km, strictly regulated based on the suggested cost-effective value environmentally and economically in previous studies [18,25]; 3. Synthetic nitrogen fertilizer substitution was assumed and the associated carbon credits were taken into account in this work, as such a procedure would generally achieve the environmental performance of the target system.
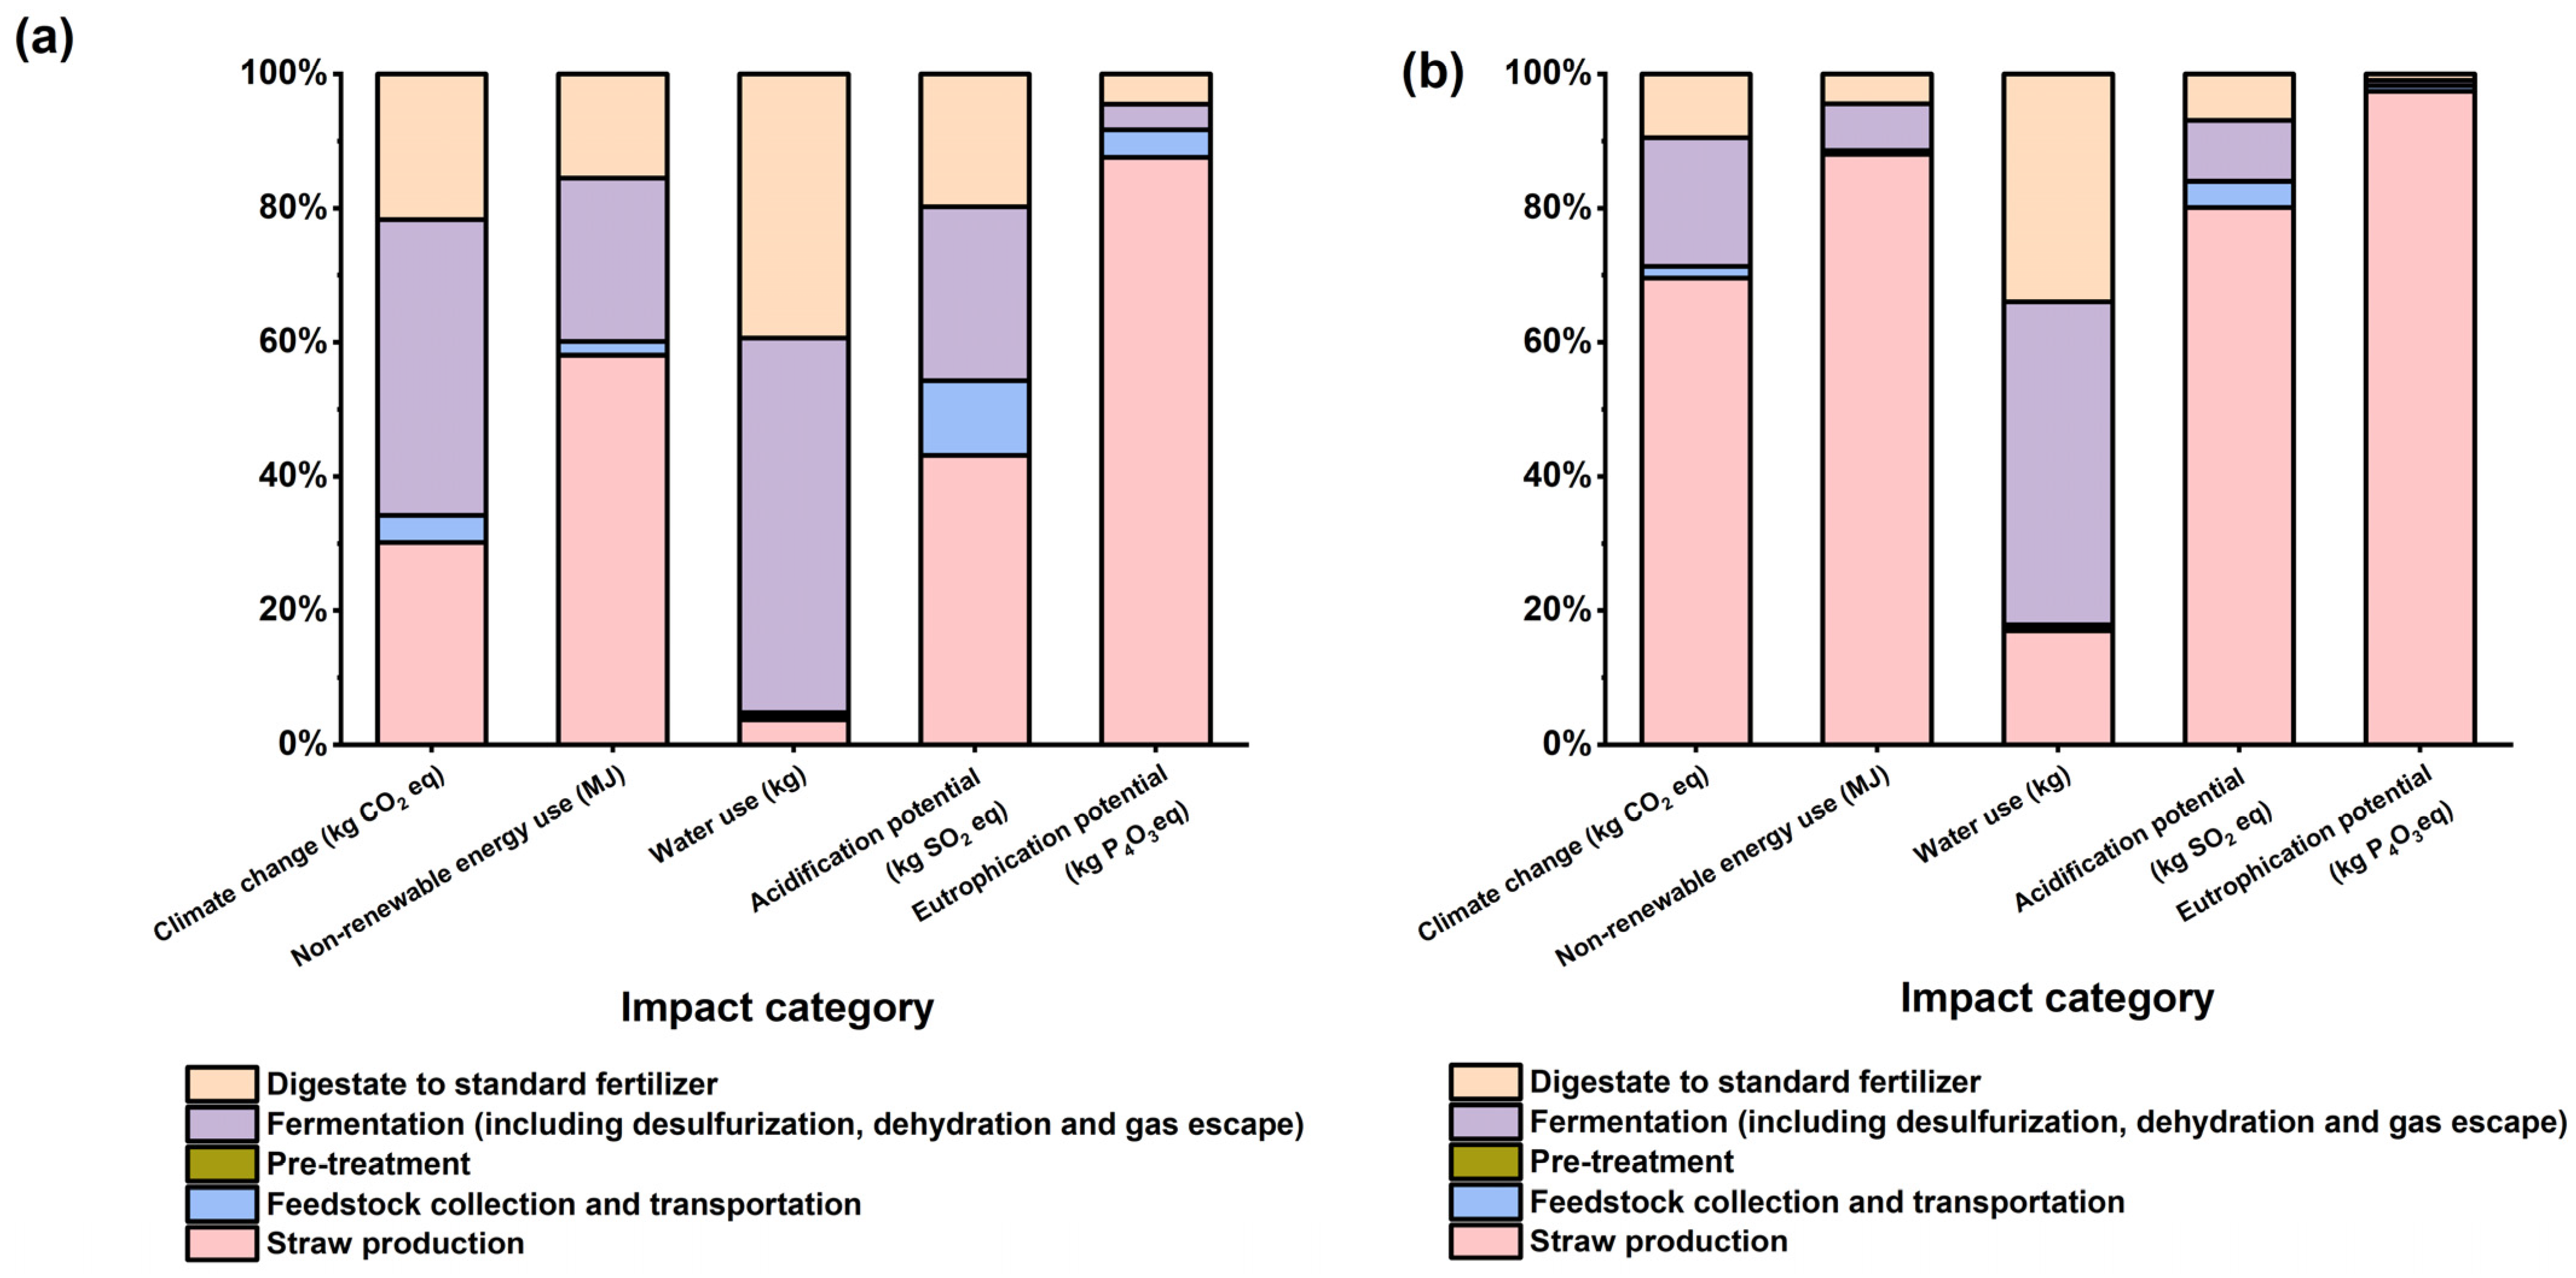
Figure 3 depicts the contribution ratios of each production stage to the total impact degrees of each indicator. With both economic and energy allocation applied to most of the examined impact categories, the straw production phase exhibited the highest contribution (from 30.16% to 97.39%), especially for CC, NREU, AP and UP, while for WU, the highest contribution (55.85% in economic allocation and 48.17% in energy allocation) resulted from the fermentation stage. By applying a mild pre-treatment option-dilute alkali, the impacts of this phase on the overall environmental performance were controlled to a minimum level (less than 1%) for all of the examined indicators.
The CC impacts of the standard organic fertilizer produced are 6.88 and 22.09 kg CO2eq./t of fertilizer for the economic allocation and energy allocation, respectively (Table 5). Although lots of effort has been dedicated to understanding the global warming potential of synthetic fertilizer production pathways [39,40], limited LCA has been published to quantify the GHG balances associated with digestate or organic fertilizer production [33]. Apart from the wide variation in the reported EFs, most of the relevant studies were conducted from the perspective of manure management [41,42]. Using ‘per tons of waste treated’ as their functional units, little information could be obtained to understand the actual climate mitigation potentials of bioenergy or digestate-based fertilizer production pathways. Through a comprehensive review of works on the Web of Science database, Walling & Vaneeckhaute summarized that the EFs for synthetic N production range from 1 to 10 kg CO2eq./kg of N depending on the type of fertilizer, while the EFs for the organic fertilizers were generally higher than those of the synthetic ones. For example, the EF of compost could go up to 850 kg CO2eq./kg of N (or 2300 kg CO2eq./t of waste) [33]. Our results provide a site and case-specific LCA quantification of a digestate-derived fertilizer production system. The CC impacts of our AD derived fertilizer are comparable to some types of synthetic alternatives and much lower than the other organic alternatives, such as compost, and thus can be considered as a type of climate-smart fertilizer [43].
Allocation is an important procedure when an LCA is conducted for a system with more than one output [44]. Other than the economic and energy allocation methods applied in this work, allocation can also be conducted following the Renewable Energy Directive (RED), which considers straw as a complete waste and suggests that no GHG emissions should be attributed to wheat straw up to the collection stage. The RED method might lower the estimation of the impacts associated with the feedstock production phase, and is not applied in this study. When attributing impacts to bioenergy and its by-products, previous LCA practices often allocated all emissions (or abatement potential) for energy only, without considering the phases of digestate production or application [20]. This would lead to an over-estimation of the climate impacts for bioenergy, and fails to consider digestate-related emissions (or credits) [20].

3.2. GHG Mitigation Potential Alongside Straw-AD Production Pathway

According to the LCA results presented in the previous section, the global warming potentials of the electricity and fertilizer products are 0.28 kg CO2eq./kWh and 6.88 kg CO2eq./kg N for the economic allocation and 0.21 kg CO2eq./kWh and 22.09 kg CO2eq./kg N for the energy allocation, respectively, in the RS-AD scenario. With an annual productivity of 662,475 kWh of electricity and 1095 tons of fertilizer (nitrogen content of 4%), the RS-AD scenario would achieve a carbon reduction of 310.88 (economic allocation) or 357.03 (energy allocation) kilotons CO2eq. per year from these two mitigation pathways, compared with the baseline scenario of RS-RF (the rice straw retention in field scenario). It is worth mentioning that, as synthetic nitrogenous fertilizer was selected as the referencing product to avoid the over-estimation of QCR, it is likely that the quantity of the total abated GHG emissions would further increase if compost was used in the reference system. Apart from the mitigation pathways of electricity production and fertilizer placement, the climate mitigation effect resulting from the ex situ utilization of rice straw on the paddy field has also been considered. Used instead of field incorporation, the ex situ utilization of rice straw could reduce the soil-based GHG emissions by 44.60%, from 16,950.00 kg CO2eq./ha to 9297.50 kg CO2eq./ha. Thus, the total climate mitigation potential is estimated to be 3.03 (economic allocation) or 2.43 (energy allocation) kilotons CO2eq. per year through the studied small-scale rice straw-based AD system operating under eastern Chinese conditions. Based on the Chinese statistical yearbook, China annually produces 200 million tons of rice straw as by-products of rice cultivation. If all of the rice straw was managed through similar straw-AD/fertilizer production systems, approximately 240.82 (economic allocation) or 193.12 (energy allocation) million tons CO2eq. of reduction could be achieved in the Chinese agriculture sector annually.

3.3. Marginal Carbon Reduction Cost

Despite the considerable GHG abatement potential of agricultural waste-based AD systems, it has been widely criticized that low financial performance is one of the biggest barriers for the further commercialization of small-scale AD systems. We analyzed the MRCs of the studied rice straw-AD/fertilizer value chain under different carbon trading price scenarios, based on Equations (1)–(5).
The economic analysis validates the financial sustainability of such small-scale AD projects with rice straw feedstock under carbon trading mechanisms. Based on the production cost calculated with Equations (3) and (4), with the quantity and unit price shown in Table 2, the total operation cost of the studied AD system is 293.76 kUSD/year. The annual revenues from the straw utilization subsidies, electricity injection to the grid and fertilizer selling are 105.04 kUSD/year, 69.59 kUSD/year and 76.68 kUSD/year, respectively.
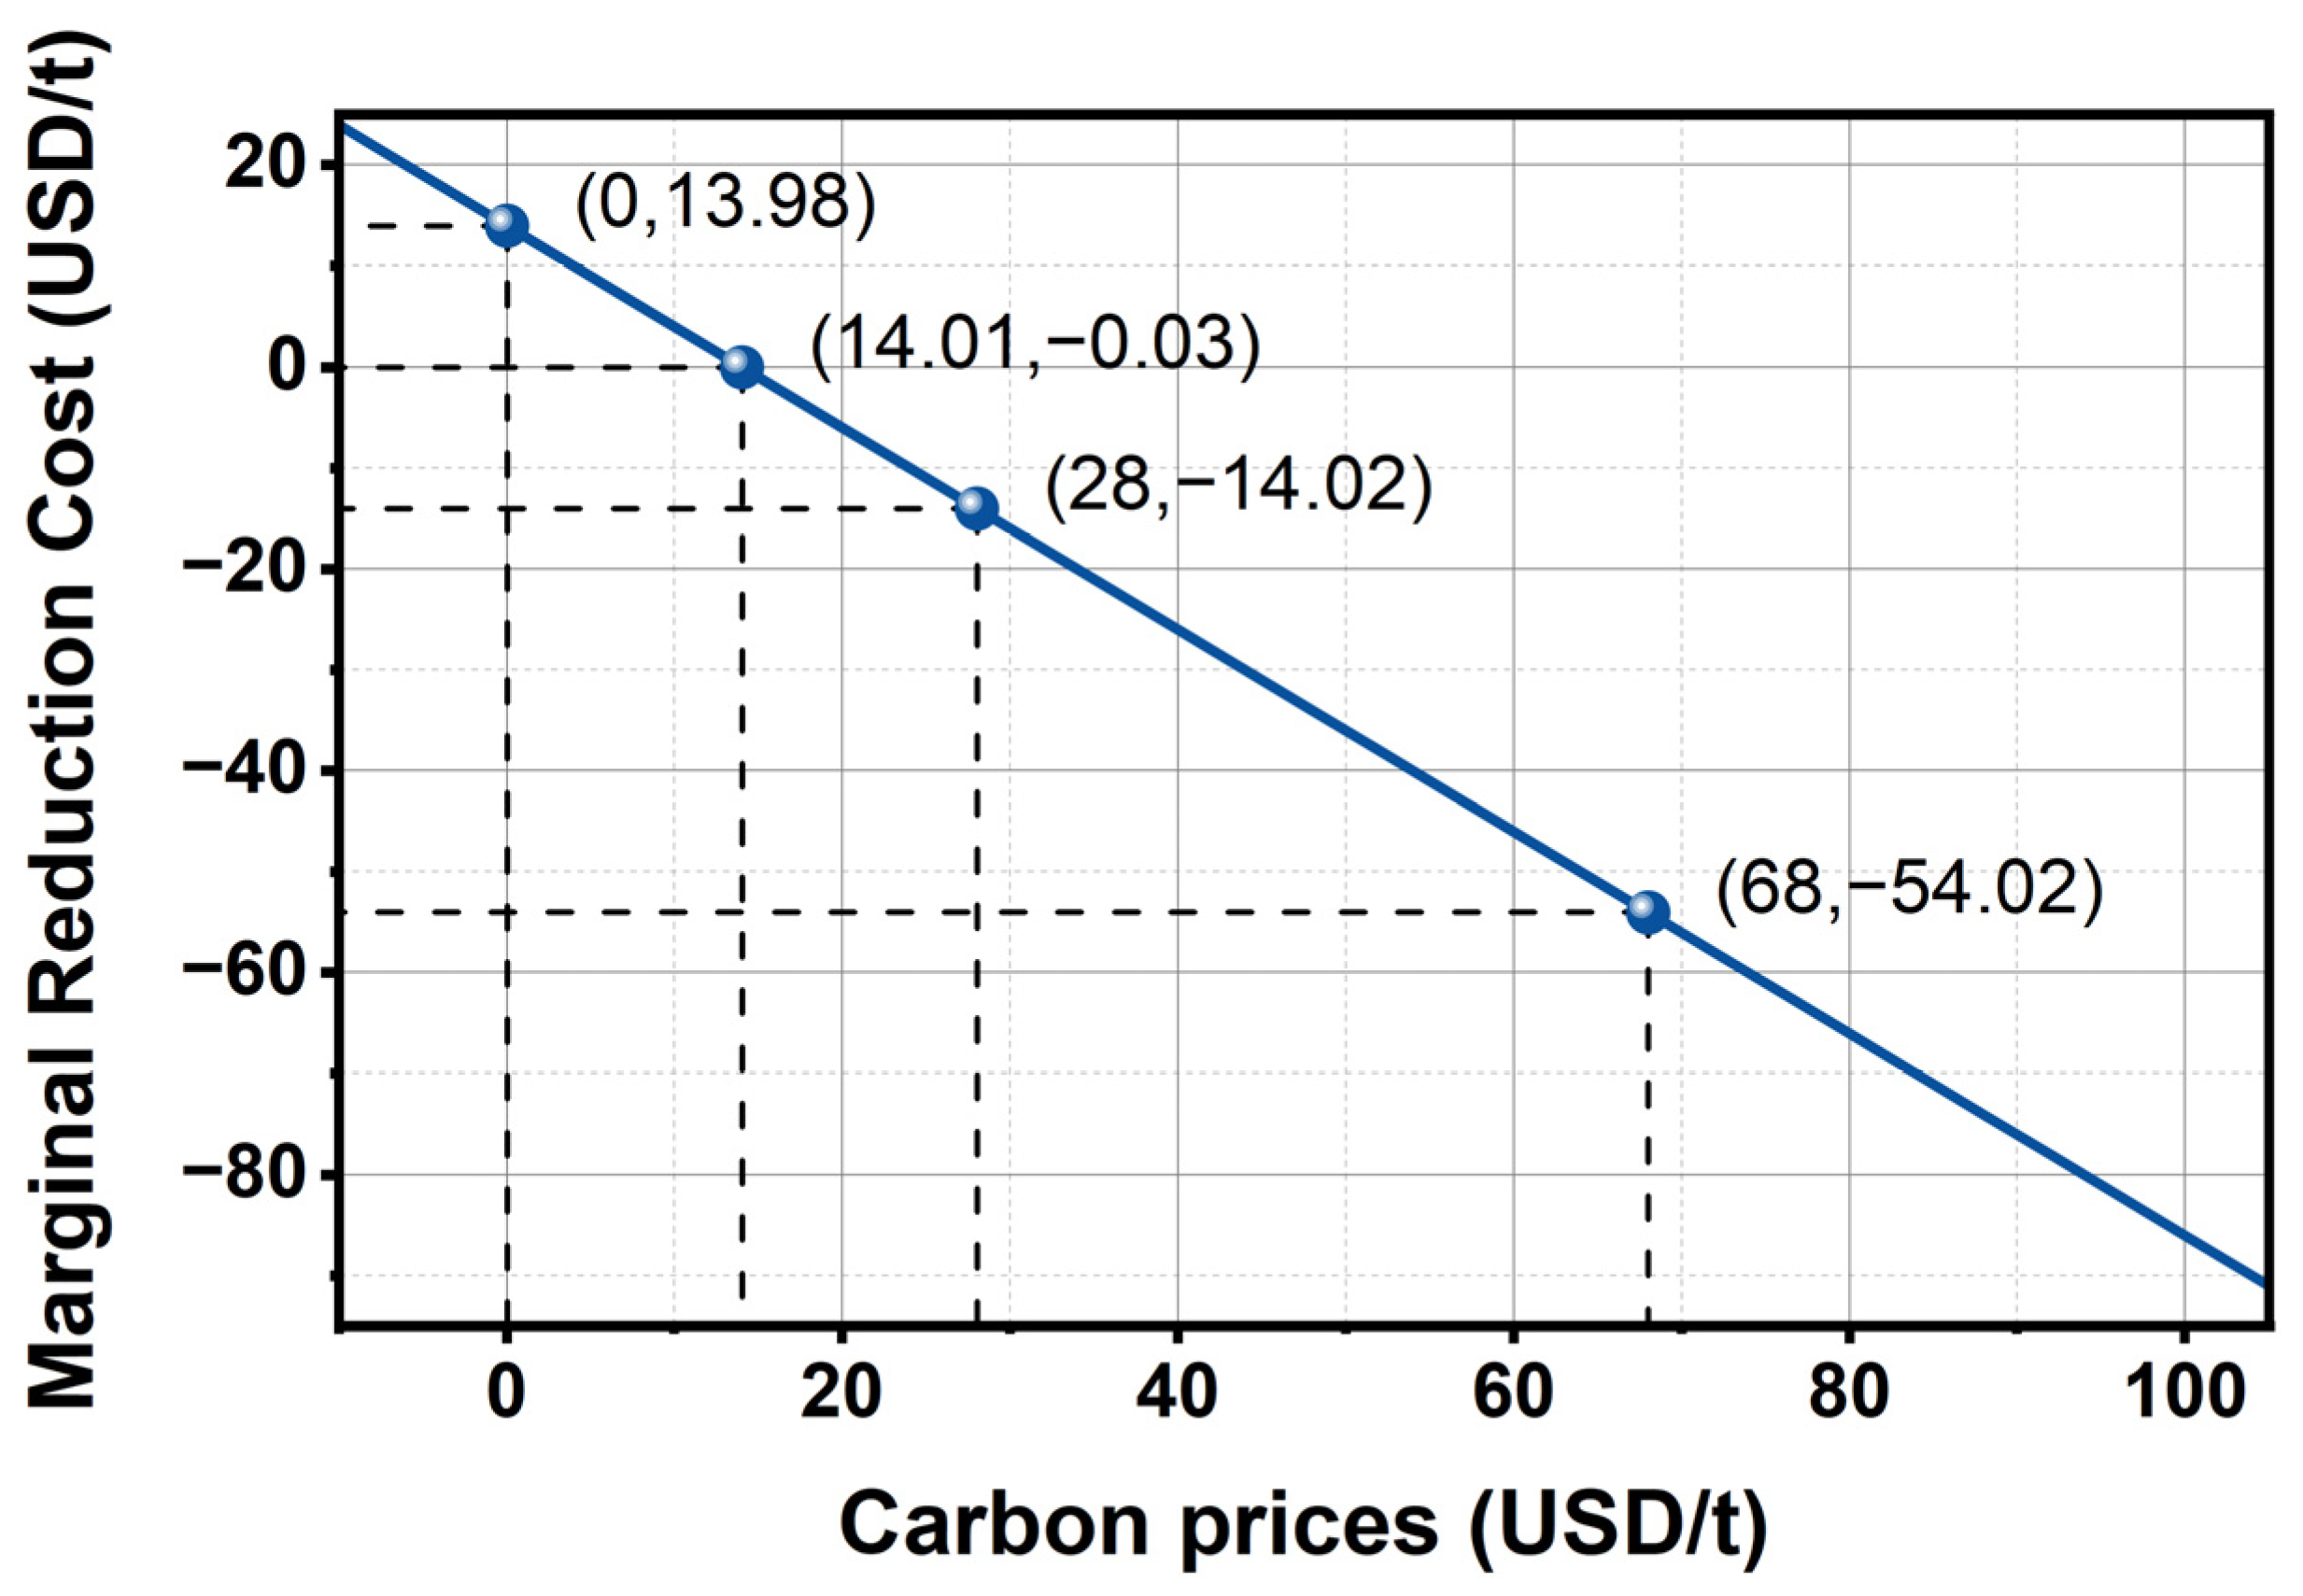
It is believed that agricultural projects verified by the CCER market would be an important practice for agriculture to participate in voluntary carbon markets. Even-though the reduction was not eligible for trading in carbon markets, the MRC in this project is 13.98 USD/t CO2eq., which still falls into the identified cost-effective natural-based climate solution categories [45]. Furthermore, if the estimated carbon reduction potential could be traded in the CCER under the current trading prices of 14 USD/t CO2eq., this project would bring both a GHG mitigation of 3036.79 t/year and economic benefits of 0.03 USD per ton of CO2 abated (Figure 4).
After being accused of doling out too many carbon emission allowances at the start of the CCETE, the current carbon prices in China are significantly lower than the EU ETS level. However, with the national ambition of achieving NetZero in 2060, learning from the historical lessons from Europe, it is highly likely that the CCETE price will increase gradually. Illustrated in Figure 4, for the studied AD value chain, the break-even value of the carbon price for such a system to turn around and begin to generate revenue is 13.98 USD/t CO2eq. Bench-marking with the 10-year EU historical average (28 USD/t CO2eq., converted from 28.00 euro/t CO2eq.) and the recently reported EU level (68 USD/t CO2eq., converted from 68 euro/t CO2eq.), this indicates that the MRC would decrease to −14.01 and −54.02 USD per ton of CO2eq. abated, and the whole system would turn into a profitable climate solution.

3.4. Economic Sensitivity Analysis

In this study, the data for the economic valuation were derived from the site operation. An economic sensitivity analysis was performed on the key economic variables, including the government subsidies for straw utilization, the equipment costs and the employee wages. All parameters varied between −10 and 10%. The results of the sensitivity analysis show that the MRC is most sensitive to changes in subsidies, with the change range being between−24.8% and 24.06%. It is relatively less sensitive to changes in rent, labor costs, and equipment costs. The change ranges are between −7.92% and 7.89%; −4.39% and 4.23%; and −9.92% and 9.89%, respectively.

4. Practical Implications and Future Search Perspectives

Apart from the defined potential climate mitigation potential, the development of rice straw-AD systems contributes significantly to achieving the national Sustainable Development Goals (SDGs) in China. Firstly, by converting the straw into biogas, the system reduces open-field burning, improving air quality (SDG 3: Good Health and Well-Being) and lowering greenhouse gas emissions and thereby supporting climate action (SDG 13: Climate Action). Secondly, the biogas serves as a clean energy source, replacing traditional fossil fuels and promoting the use of renewable energy (SDG 7: Affordable and Clean Energy) while reducing environmental pollution. Additionally, the residue from the anaerobic fermentation can be used as organic fertilizer, enhancing soil quality, reducing chemical fertilizer use, and advancing sustainable agriculture (SDG 2: Zero Hunger; SDG 15: Life on Land). The system also promotes the resource utilization of agricultural waste, driving the circular economy (SDG 12: Responsible Consumption and Production), and creates employment opportunities in rural areas, supporting economic growth (SDG 8: Decent Work and Economic Growth). In summary, rice straw anaerobic fermentation systems synergistically advance environmental, economic, and social dimensions, providing crucial support for China’s achievement of the Sustainable Development Goals.
Utilizing carbon trading mechanisms to promote low-carbon transitions in the agricultural production system is a topic of urgent discussion. Our results disclose the economic and environmental relationship between agricultural waste treatment and carbon emission reduction trading mechanisms. It supports the hypothesis that the carbon trading mechanisms of emission reduction obtained through sustainable agriculture management would play a vital role in China’s future carbon neutrality [46,47]. However, several obstacles have been identified which limit the deeper integration of agriculture-based emission reduction into voluntary carbon markets:
  • The high uncertainties associated with the measured or reported emission data from the agricultural sector. It is shown on the IPCC report that the uncertainty range for CO2 emissions from the land use, land use change and forestry (LULUCF) sector was ±69.70% (90% confidence level), while the corresponding figure for the fossil fuel industry was only ±7.89% [48]
  • The challenges in the establishment of a reliable and feasible monitoring, reporting and verification (MRV) system for agriculturally related emissions. The flexibility of agricultural activities increases the difficulty of establishing such technical standards or best practice guidelines. Agricultural emissions are a multi-variable function of regional and seasonal production inputs and climate conditions, and the impacts of different factors on the emissions may be non-linear [49]. It is financially difficult for project developers to accurately calculate and document the potential emission reductions aroused from their optimized management practices. The measurement and acquisition of project-specific emission data require strict scientific norms, and face high technical and cost constraints in practice [2].
Thus, it is suggested that further efforts be made specifically in the following areas: the development of technique and best practice guidelines to minimize the uncertainty levels of measured emission data, and the establishment of a feasible and financially affordable monitoring, reporting and verification system.

5. Conclusions

Conducting a cradle-to-factory gate LCA, this work identified significant climate mitigation potential alongside the rice straw-AD and fertilizer production pathways. Depending on the choice of allocation method, the climate change impacts of the bioenergy generated through the studied small-scale AD system are 0.21 to 0.28 kg CO2eq./kWh, 63.10% to 72.33% lower than the national grid level. The EF of the fertilizer produced is 6.88 to 22.09 kg CO2eq./kg N, comparable to synthetic N fertilizers and remarkably lower than other organic alternatives. The total climate mitigation potential is estimated to be 3.03 (economic allocation) and 2.43 (energy allocation) kilotons CO2eq. per year through the studied small-scale rice straw-based AD system operating under eastern Chinese conditions. The economic analysis suggests that under the current carbon market mechanisms, the marginal carbon reduction cost of such a climate mitigation strategy is 13.98 USD/t CO2eq. The predicted increases in future carbon prices will provide further opportunities for its profitable operation. This work demonstrates the viability of a small-scale AD system with rice straw feedstock as a cost-effective climate solution for paddy-field greenhouse gas emissions, and emphasizes the significance of valuing agricultural carbon emission reduction as an effective market mechanism.

Author Contributions

Conceptualization, Y.N., O.M. and X.Q.; software, M.Z.; writing—original draft preparation, Y.N.; writing—review and editing, X.Q.; visualization, M.Z.; funding acquisition, G.S. and O.M. All authors have read and agreed to the published version of the manuscript.

Funding

This research was funded by the Shanghai Agricultural Science and Technology Innovation Program (Grant No. K2023017). We also acknowledge the Imperial College London Open Access Fund for the OA funding support.

Institutional Review Board Statement

Not applicable.

Informed Consent Statement

Not applicable.

Data Availability Statement

The data presented in this study are available on request from the corresponding author.

Conflicts of Interest

The authors declare no conflicts of interest.

Appendix A

Table A1. Characterized LCIA results for electricity produced in the studied anaerobic digestion system (economic allocation).
CC (kg CO2 eq.)NREU (MJ)WU (kg)AP (kg SO2 eq.)ADP (kg Antimony eq.)EP (kg PO43−eq.)RI (kg PM2.5 eq.)ODP (kg CFC-11 eq)POFP (kg NMVOC eq.)IRP (kg U235 eq.)ET (CTUe)HT-Cancer (CTUh)HT-Non Cancer (CTUh)
Impacts of electricity generation (per kWh)2.80 × 10 −15.872.192.09 × 10−31.32 × 10−51.21 × 10−34.54 × 10−41.31 × 10−87.57 × 10−41.63 × 10−28.58 × 10−21.41 × 10−98.79 × 10⁻⁹
Table A2. Characterized LCIA results for electricity and fertilizer produced in the studied anaerobic digestion system (energy allocation).
CC (kg CO2 eq.)NREU (MJ)WU (kg)AP (kg SO2 eq.)ADP (kg Antimony eq.)EP (kg PO43−eq.)RI (kg PM2.5 eq.)ODP (kg CFC-11 eq)POFP (kg NMVOC eq.)IRP (kg U235 eq.)ET (CTUe)HT-Cancer (CTUh)HT-Non Cancer (CTUh)
Impacts of electricity generation (per kWh)2.10 × 10 −16.577.81 × 10−11.95 × 10−31.62 × 10−51.69 × 10−33.72 × 10−41.76 × 10−89.29 × 10−42.02 × 10−21.27 × 10−12.04 × 10−91.27 × 10

References

  1. Lee, H.-S.; Gwon, H.-S.; Lee, S.-I.; Park, H.-R.; Lee, J.-M.; Park, D.-G.; Lee, S.-R.; Eom, S.-H.; Oh, T.-K. Reducing Methane Emissions with Humic Acid–Iron Complex in Rice Cultivation: Impact on Greenhouse Gas Emissions and Rice Yield. Sustainability 2024, 16, 4059. [Google Scholar] [CrossRef]
  2. IPCC. IPCC 2019 Refinement to the 2006 IPCC Guidelines for National Greenhouse Gas Inventories; The Intergovernmental Panel on Climate Change: Geneva, Switzerland, 2019. [Google Scholar]
  3. Zhang, B.; Tian, H.; Ren, W.; Tao, B.; Lu, C.; Yang, J.; Banger, K.; Pan, S. Methane Emissions from Global Rice Fields: Magnitude, Spatiotemporal Patterns, and Environmental Controls. Glob. Biogeochem. Cycles 2016, 30, 1246–1263. [Google Scholar] [CrossRef]
  4. Croce, S.; Wei, Q.; D’Imporzano, G.; Dong, R.; Adani, F. Anaerobic Digestion of Straw and Corn Stover: The Effect of Biological Process Optimization and Pre-Treatment on Total Bio-Methane Yield and Energy Performance. Biotechnol. Adv. 2016, 34, 1289–1304. [Google Scholar] [CrossRef]
  5. Huang, L.; Zhu, Y.; Wang, Q.; Zhu, A.; Liu, Z.; Wang, Y.; Allen, D.T.; Li, L. Assessment of the Effects of Straw Burning Bans in China: Emissions, Air Quality, and Health Impacts. Sci. Total Environ. 2021, 789, 147935. [Google Scholar] [CrossRef]
  6. Turmel, M.-S.; Speratti, A.; Baudron, F.; Verhulst, N.; Govaerts, B. Crop Residue Management and Soil Health: A Systems Analysis. Agric. Syst. 2015, 134, 6–16. [Google Scholar] [CrossRef]
  7. Huang, T.; Wen, S.; Zhang, M.; Pan, Y.; Chen, X.; Pu, X.; Zhang, M.; Dang, P.; Meng, M.; Wang, W.; et al. Effect on Greenhouse Gas Emissions (CH4 and N2O) of Straw Mulching or Its Incorporation in Farmland Ecosystems in China. Sustain. Prod. Consum. 2024, 46, 223–232. [Google Scholar] [CrossRef]
  8. Wang, W.; Wu, X.; Chen, A.; Xie, X.; Wang, Y.; Yin, C. Mitigating Effects of Ex Situ Application of Rice Straw on CH4 and N2O Emissions from Paddy-Upland Coexisting System. Sci. Rep. 2016, 6, 37402. [Google Scholar] [CrossRef]
  9. Kumar Sakhiya, A.; Anand, A.; Aier, I.; Baghel, P.; Vijay, V.K.; Kaushal, P. Sustainable Utilization of Rice Straw to Mitigate Climate Change: A Bioenergy Approach. Mater. Today Proc. 2021, 46, 5366–5371. [Google Scholar] [CrossRef]
  10. Prawira, A.H.; Anugrah, R.; Bahri, S.; Firmansyah, F.H.; Roland, H.E. Utilization of Rice Straw Waste as a Source of Bioenergy: A Review. J. Clean Technol. 2024, 1, 9–18. [Google Scholar]
  11. Zhu, L.; Hu, N.; Yang, M.; Zhan, X.; Zhang, Z. Effects of Different Tillage and Straw Return on Soil Organic Carbon in a Rice-Wheat Rotation System. PLoS ONE 2014, 9, e88900. [Google Scholar] [CrossRef]
  12. Zhang, G.; Zhang, W.; Yu, H.; Ma, J.; Xu, H.; Yagi, K. Increase in CH4 Emission Due to Weeds Incorporation Prior to Rice Transplanting in a Rice-Wheat Rotation System. Atmos. Environ. 2015, 116, 83–91. [Google Scholar] [CrossRef]
  13. Lamnatou, C.; Nicolaï, R.; Chemisana, D.; Cristofari, C.; Cancellieri, D. Biogas Production by Means of an Anaerobic-Digestion Plant in France: LCA of Greenhouse-Gas Emissions and Other Environmental Indicators. Sci. Total Environ. 2019, 670, 1226–1239. [Google Scholar] [CrossRef]
  14. Traub, A.; Welsh, R.; Rogers, S.; Grimberg, S. Small Farms Using Anaerobic Digestion: A Viable Technology Education and Outreach Effort. Agroecol. Sustain. Food Syst. 2021, 45, 718–731. [Google Scholar] [CrossRef]
  15. Alengebawy, A.; Ran, Y.; Osman, A.I.; Jin, K.; Samer, M.; Ai, P. Anaerobic Digestion of Agricultural Waste for Biogas Production and Sustainable Bioenergy Recovery: A Review. Environ. Chem. Lett. 2024, 22, 2641–2668. [Google Scholar] [CrossRef]
  16. Atelge, M.R.; Krisa, D.; Kumar, G.; Eskicioglu, C.; Nguyen, D.D.; Chang, S.W.; Atabani, A.E.; Al-Muhtaseb, A.H.; Unalan, S. Biogas Production from Organic Waste: Recent Progress and Perspectives. Waste Biomass Valor. 2020, 11, 1019–1040. [Google Scholar] [CrossRef]
  17. Qian, X.; Shen, G.; Wang, Z.; Zhang, X.; Chen, X.; Tang, Z.; Lei, Z.; Zhang, Z. Enhancement of High Solid Anaerobic Co-Digestion of Swine Manure with Rice Straw Pretreated by Microwave and Alkaline. Bioresour. Technol. Rep. 2019, 7, 100208. [Google Scholar] [CrossRef]
  18. Boulamanti, A.K.; Donida Maglio, S.; Giuntoli, J.; Agostini, A. Influence of Different Practices on Biogas Sustainability. Biomass Bioenergy 2013, 53, 149–161. [Google Scholar] [CrossRef]
  19. O’Connor, S.; Ehimen, E.; Pillai, S.C.; Black, A.; Tormey, D.; Bartlett, J. Biogas Production from Small-Scale Anaerobic Digestion Plants on European Farms. Renew. Sustain. Energy Rev. 2021, 139, 110580. [Google Scholar] [CrossRef]
  20. Timonen, K.; Sinkko, T.; Luostarinen, S.; Tampio, E.; Joensuu, K. LCA of Anaerobic Digestion: Emission Allocation for Energy and Digestate. J. Clean. Prod. 2019, 235, 1567–1579. [Google Scholar] [CrossRef]
  21. Alengebawy, A.; Mohamed, B.A.; Ran, Y.; Yang, Y.; Pezzuolo, A.; Samer, M.; Ai, P. A Comparative Environmental Life Cycle Assessment of Rice Straw-Based Bioenergy Projects in China. Environ. Res. 2022, 212, 113404. [Google Scholar] [CrossRef]
  22. Bhatt, A.H.; Tao, L. Economic Perspectives of Biogas Production via Anaerobic Digestion. Bioengineering 2020, 7, 74. [Google Scholar] [CrossRef]
  23. Ni, Y.; Richter, G.M.; Mwabonje, O.N.; Qi, A.; Patel, M.K.; Woods, J. Novel Integrated Agricultural Land Management Approach Provides Sustainable Biomass Feedstocks for Bioplastics and Supports the UK’s ‘Net-Zero’ Target. Environ. Res. Lett. 2021, 16, 014023. [Google Scholar] [CrossRef]
  24. Ren, J.; Yu, P.; Xu, X. Straw Utilization in China—Status and Recommendations. Sustainability 2019, 11, 1762. [Google Scholar] [CrossRef]
  25. Ni, Y.; Mwabonje, O.N.; Richter, G.M.; Qi, A.; Yeung, K.; Patel, M.; Woods, J. Assessing Availability and Greenhouse Gas Emissions of Lignocellulosic Biomass Feedstock Supply—Case Study for a Catchment in England. Biofuels Bioprod. Bioref. 2019, 13, 568–581. [Google Scholar] [CrossRef]
  26. ISO 14044:2006; Environmental Management—Life Cycle Assessment—Requirements and Guidelines. ISO International Organization for Standardization: Geneva, Switzerland, 2006.
  27. ISO 14040:2006; Environmental Management—Life Cycle Assessment—Principles and Framework. ISO International Organization for Standardization: Geneva, Switzerland, 2006.
  28. Finnveden, G.; Hauschild, M.Z.; Ekvall, T.; Guinée, J.; Heijungs, R.; Hellweg, S.; Koehler, A.; Pennington, D.; Suh, S. Recent Developments in Life Cycle Assessment. J. Environ. Manag. 2009, 91, 1–21. [Google Scholar] [CrossRef]
  29. PAS 2050:2008; Specification for the Assessment of the Life Cycle Greenhouse Gas Emissions of Goods and Services. BSI British Standards Institution: London, UK, 2008.
  30. Zhang, Y.C.; Luo, M.; Fang, X.Y.; Zhang, F.Q.; Cao, M.H. Energy Value of Rice, Broken Rice, and Rice Bran for Broiler Chickens by the Regression Method. Poult. Sci. 2021, 100, 100972. [Google Scholar] [CrossRef]
  31. Gummert, M.; Hung, N.V.; Chivenge, P.; Douthwaite, B. (Eds.) Sustainable Rice Straw Management; Springer International Publishing: Cham, Switzerland, 2020; ISBN 978-3-030-32372-1. [Google Scholar]
  32. Kratzeisen, M.; Starcevic, N.; Martinov, M.; Maurer, C.; Müller, J. Applicability of Biogas Digestate as Solid Fuel. Fuel 2010, 89, 2544–2548. [Google Scholar] [CrossRef]
  33. Walling, E.; Vaneeckhaute, C. Greenhouse Gas Emissions from Inorganic and Organic Fertilizer Production and Use: A Review of Emission Factors and Their Variability. J. Environ. Manag. 2020, 276, 111211. [Google Scholar] [CrossRef]
  34. Zhang, L.; Li, S.; Hu, Y.; Nie, Q. Economic Optimization of a Bioenergy-Based Hybrid Renewable Energy System under Carbon Policies—From the Life-Cycle Perspective. Appl. Energy 2022, 310, 118599. [Google Scholar] [CrossRef]
  35. Ji, L.; Liang, S.; Qu, S.; Zhang, Y.; Xu, M.; Jia, X.; Jia, Y.; Niu, D.; Yuan, J.; Hou, Y.; et al. Greenhouse Gas Emission Factors of Purchased Electricity from Interconnected Grids. Appl. Energy 2016, 184, 751–758. [Google Scholar] [CrossRef]
  36. Wrzesińska-Jędrusiak, E.; Muradin, M.; Herkowiak, M.; Łaska-Zieja, B.; Myczko, A. Environmental Performance of the Innovative, Patented Mixing System in an Agricultural Biogas Plant Based on LCA Approach. J. Clean. Prod. 2022, 349, 131420. [Google Scholar] [CrossRef]
  37. Bacenetti, J.; Sala, C.; Fusi, A.; Fiala, M. Agricultural Anaerobic Digestion Plants: What LCA Studies Pointed out and What Can Be Done to Make Them More Environmentally Sustainable. Appl. Energy 2016, 179, 669–686. [Google Scholar] [CrossRef]
  38. Siegl, S.; Laaber, M.; Holubar, P. Green Electricity from Biomass, Part I: Environmental Impacts of Direct Life Cycle Emissions. Waste Biomass Valor. 2011, 2, 267–284. [Google Scholar] [CrossRef]
  39. Brentrup, F.; Küsters, J.; Lammel, J.; Barraclough, P.; Kuhlmann, H. Environmental Impact Assessment of Agricultural Production Systems Using the Life Cycle Assessment (LCA) Methodology II. The Application to N Fertilizer Use in Winter Wheat Production Systems. Eur. J. Agron. 2004, 20, 265–279. [Google Scholar] [CrossRef]
  40. Menegat, S.; Ledo, A.; Tirado, R. Greenhouse Gas Emissions from Global Production and Use of Nitrogen Synthetic Fertilisers in Agriculture. Sci. Rep. 2022, 12, 14490. [Google Scholar] [CrossRef]
  41. Duan, N.; Khoshnevisan, B.; Lin, C.; Liu, Z.; Liu, H. Life Cycle Assessment of Anaerobic Digestion of Pig Manure Coupled with Different Digestate Treatment Technologies. Environ. Int. 2020, 137, 105522. [Google Scholar] [CrossRef] [PubMed]
  42. Li, Y.; Manandhar, A.; Li, G.; Shah, A. Life Cycle Assessment of Integrated Solid State Anaerobic Digestion and Composting for On-Farm Organic Residues Treatment. Waste Manag. 2018, 76, 294–305. [Google Scholar] [CrossRef]
  43. Williams, A.G.; Audsley, E.; Sandars, D.L. Environmental Burdens of Producing Bread Wheat, Oilseed Rape and Potatoes in England and Wales Using Simulation and System Modelling. Int. J. Life Cycle Assess. 2010, 15, 855–868. [Google Scholar] [CrossRef]
  44. Whittaker, C.; McManus, M.C.; Hammond, G.P. Greenhouse Gas Reporting for Biofuels: A Comparison between the RED, RTFO and PAS2050 Methodologies. Energy Policy 2011, 39, 5950–5960. [Google Scholar] [CrossRef]
  45. Griscom, B.W.; Adams, J.; Ellis, P.W.; Houghton, R.A.; Lomax, G.; Miteva, D.A.; Schlesinger, W.H.; Shoch, D.; Siikamäki, J.V.; Smith, P.; et al. Natural Climate Solutions. Proc. Natl. Acad. Sci. USA 2017, 114, 11645–11650. [Google Scholar] [CrossRef]
  46. Luo, C.-J.; Chen, M.-P. Theoretical and Pathway Analysis of Utilizing Carbon Trading to Promote Agricultural Emission Reductions: International Experience and Its Implications for China. Adv. Clim. Change Res. 2023, 19, 761. [Google Scholar] [CrossRef]
  47. Li, G.; Hou, C.; Zhou, X. Carbon Neutrality, International Trade, and Agricultural Carbon Emission Performance in China. Front. Environ. Sci. 2022, 10, 931937. [Google Scholar] [CrossRef]
  48. IPCC. Climate Change 2022—Mitigation of Climate Change: Working Group III Contribution to the Sixth Assessment Report of the Intergovernmental Panel on Climate Change; Cambridge University Press: Cambridge, UK, 2023; ISBN 978-1-009-15792-6. [Google Scholar]
  49. Garnache, C.; Mérel, P.R.; Lee, J.; Six, J. The Social Costs of Second-Best Policies: Evidence from Agricultural GHG Mitigation. J. Environ. Econ. Manag. 2017, 82, 39–73. [Google Scholar] [CrossRef]
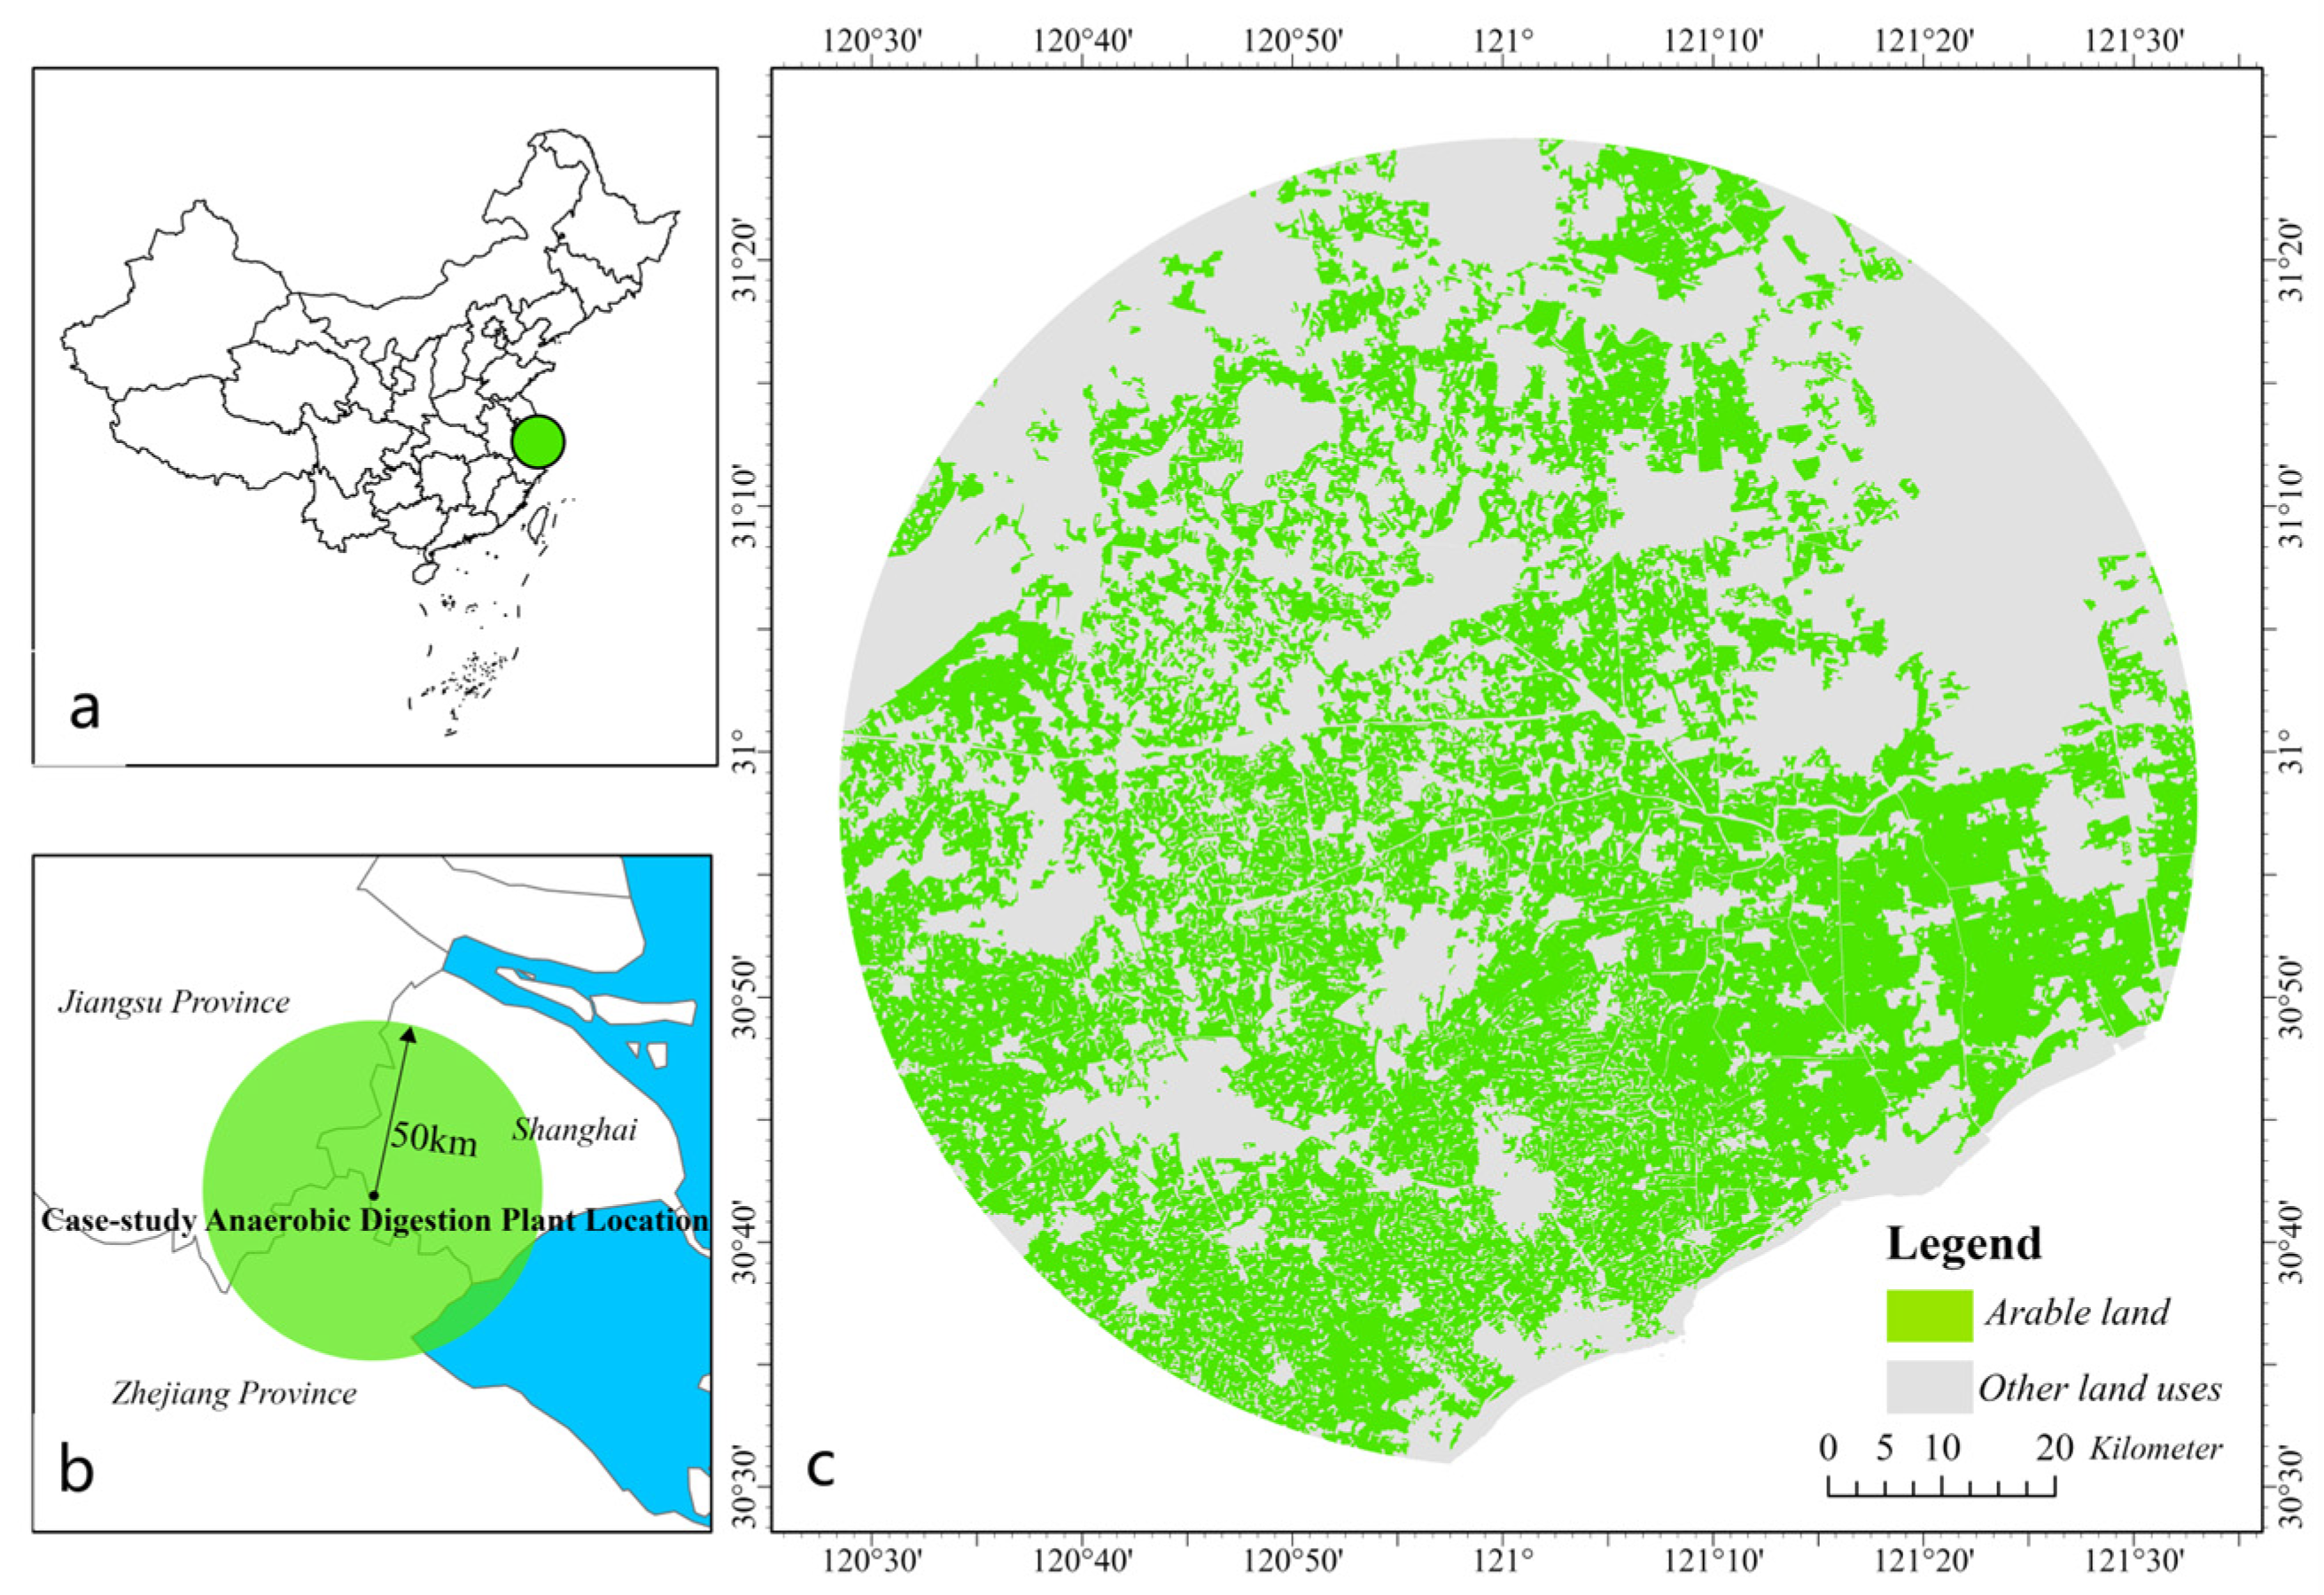
Figure 1. (a,b) The location of the studied anaerobic digestion (AD) plant. (c) The land use types within a 50 km radius of the case-study plant (the catchment area of feedstock provision).
Sustainability 17 02439 g001
Figure 2. System boundary of studied LCA.
Sustainability 17 02439 g002
Figure 3. Contribution ratios of each production stage to examined impact indicators—climate change (CC), non-renewable energy use (NREU), water use (WU), acidification potential (AP) and eutrophication potential (EP). (a) Economic allocation applied; (b) energy allocation applied.
Sustainability 17 02439 g003
Figure 4. Marginal reduction costs associated with studied rice straw-AD value chain, under different carbon trading price scenarios.
Sustainability 17 02439 g004
Table 1. Background data used for life cycle inventory development (functional unit: production of 1 kWh of electricity).
InputQuantityUnit
InputRice straw (dry matter)2125.00 t/year
Swine manure (moisture content 78%) 142.00 t/year
Feedstock transportation 50.00 km
NaOH3.65 kg/year
Water pre-treatment36.50 t/year
Water operation2187.00 t/year
Desulfurizer-FaO5.00 t/year
Diesel consumption—straw harvest and loading5.00 t/year
Diesel consumption—straw site offloading2.86 t/year
Electricity—AD199,405.00 kwh/year
Electricity—fertilizer production87,447.00 kwh/year
Urea9474.00 kg/year
Intermediate productBiogas442,015.00m3/year
Digestate3285.00t/year
OutputElectricity662,475kWh/year
Organic fertilizer1095.00t/year
Table 2. Economic value and energy content figures used for economic and energy allocation.
Input/Product ItemEconomic Value Data Source Energy Content Data Source
Rice 3000 CNY/tChinese National food and Strategic Reserves Administration15.31 MJ/kg[30]
Rice straw 375 CNY/tSurvey questionnaire 14.2 MJ/kg[31]
Digestate-based fertilizer500 CNY/tSurvey questionnaire 14 MJ/kg[32]
Bio-mass electricity0.75 CNY/kWhChinese National Development and Reform Commission1 kWh = 3.6 MJ
Table 3. Fixed and variable annual costs of anaerobic digestion plant operation applied in this study.
CategoryQuantityCost per Unit *Total Cost (103 USD/Year)
Variable cost (VCAD)Rice straw (CRS)2125.00 t/year (dry matter)52.52 USD/t (converted from 375 CNY/t)111.61
Manure (Cmanure)142.0 t/year (moisture content of 80%)23.11 USD/t (converted from 165 CNY/t)3.28
NaOH (CNaOH)3.65 kg/year5.04 USD/kg (converted from 36.00 CNY/kg)0.02
Water (Cwater)2226.5 m3/year0.56 USD/m3 (converted from 4.00 CNY/m3)1.23
Desulfurizer (Cdesulfurizer)5.00 t/year940.08 USD/t (converted from 6712.17 CNY/t)4.70
Diesel (Cdisel) (for straw harvest and on-site loading/offloading)7.86 t/year1251 USD/t (converted from 8932.14 CNY/t)6.26
Electricity consumed (Celectricity)286,852 kWh/year0.092 USD/kWh (converted from 0.60 CNY/kWh)24.10
Urea (Curea)9.47 t/year280.11 USD/t (converted from 2000.00 CNY/t)2.65
Fixed cost (FCAD)Equipment (Cequipment)Converted from 433,333.00 CNY/year (initial investment on equipment was 13.00 million CNY, assuming service time of 30 years)60.69
Employee (Cemployee)Converted from 300,000.00 CNY/year40.02
Venue rental (Crental)Converted from 240,000.00 CNY/year33.61
* The exchange rate of RMB to US dollars was set as 7.14:1.
Table 4. ReCiPe midpoint scores (characterization) per FU, i.e., production of 1 kWh of bio-electricity from straw-based AD for selected indicators—climate change (CC), non-renewable energy use (NREU), water use (WU), acidification potential (AP) and eutrophication potential (EP).
Impact CategoryCC (kg CO2 eq)NREU (MJ)WU (kg)AP (kg SO2 eq)EP (kg PO43−eq)
Economic allocation
Production stagesStraw production2.27 × 10−18.492.82 × 10−12.36 × 10−32.33 × 10−3
Feedstock collection and transportation3.01 × 10−22.90 × 10−12.51 × 10−26.09 × 10−41.09 × 10−4
Pre-treatment1.75 × 10−52.45 × 10−45.61 × 10−21.03 × 10−71.95 × 10−8
Fermentation (including desulfurization, dehydration and gas escape)3.31 × 10−13.564.231.42 × 10−31.02 × 10⁻⁴
Digestate to standard fertilizer1.63 × 10−12.282.981.08 × 10−31.20 × 10⁻⁴
Total7.51 × 10−11.46 × 107.585.47 × 10−32.66 × 10⁻³
Bio-electricity (impacts after alloaction)2.80 × 10−15.872.192.09 × 10−31.21 × 10⁻³
Digestate-based fertilizer (impacts after alloaction)4.72 × 10−18.745.393.38 × 10−31.45 × 10⁻³
Energy allocation
Production stagesStraw production1.204.49 × 101.491.25 × 10−21.23 × 10⁻²
Feedstock collection and transportation3.01 × 10−22.90 × 10−12.51 × 10−26.09 × 10−41.09 × 10−4
Pre-treatment1.75 × 10−52.45 × 10−45.61 × 10−21.03 × 10−71.95 × 10−8
Fermentation (including desulfurization, dehydration and gas escape)3.31 × 10−13.564.231.42 × 10−31.02 × 10⁻⁴
Digestate to standard fertilizer1.63 × 10−12.282.981.08 × 10−31.20 × 10⁻⁴
Total1.725.11 × 108.791.56 × 10−21.27 × 10⁻²
Bio-electricity (impacts after alloaction)2.10 × 10−16.577.81 × 10−11.95 × 10−31.69 × 10−3
Digestate-based fertilizer (impacts after alloaction)1.514.45 × 108.011.36 × 10−21.10 × 10⁻²
Table 5. Emission factors for electricity and fertilizer produced in this study and comparison with alternative products.
ProductEFUnitReference
AD system (this study)Standard organic fertilizer6.88 (economic allocation)
22.09 (energy
Allocation)
kg CO2eq./kg N
Electricity0.28 (economic allocation)
0.21 (energy
Allocation)
kgCO2eq./kwh
AlternativesUrea (China)5.5kg CO2eq./kg N[39]
Ammonium nitrite (China)10.3kg CO2eq./kg N[39]
Compost170–850kg CO2eq./kg N[33]
Electricity—national grid0.759kgCO2eq./kWh[35]
Electricity from AD of pig manure 1.09–1.26kgCO2eq./kWh[36]
Disclaimer/Publisher’s Note: The statements, opinions and data contained in all publications are solely those of the individual author(s) and contributor(s) and not of MDPI and/or the editor(s). MDPI and/or the editor(s) disclaim responsibility for any injury to people or property resulting from any ideas, methods, instructions or products referred to in the content.