Article

Tsunami Risk Mapping and Sustainable Mitigation Strategies for Megathrust Earthquake Scenario in Pacitan Coastal Areas, Indonesia

by
Jumadi Jumadi
1,*,
Kuswaji Dwi Priyono
1,
Choirul Amin
1,
Aditya Saputra
1,
Christopher Gomez
2,
Kuok-Choy Lam
3,
Arif Rohman
4,
Nilanchal Patel
5,
Farha Sattar
6,
Muhammad Nawaz
7 and
Khusnul Setia Wardani
8
1
Faculty of Geography, Universitas Muhamamdiyah Surakarta, Surakarta 57261, Indonesia
2
Faculty of Maritime Sciences, Kobe University, Kobe 658-0022, Japan
3
Geography Program, Faculty of Social Sciences and Humanities, Universiti Kebangsaan Malaysia, Bangi 43600, Selangor, Malaysia
4
Faculty of Infrastructure and Regional Technology, Institut Teknologi Sumatera (ITERA), Lampung Selatan, Lampung 35365, Indonesia
5
Department of Remote Sensing, Birla Institute of Technology Mesra, Mesra 835215, India
6
Faculty of Arts and Society, Charles Darwin University, Ellengowan Dr., Casuarina, NT 0810, Australia
7
Department of Geography, National University of Singapore, 1 Arts Link, #03-11 Block AS3, Singapore 117570, Singapore
8
Research Center for Hydrodynamics Technology, National Research and Innovation Agency (BRIN), Jl. Hidro Dinamika, Keputih, Kec. Sukolilo, Surabaya 60112, Indonesia
*
Author to whom correspondence should be addressed.
Sustainability 2025, 17(6), 2564; https://doi.org/10.3390/su17062564
Submission received: 30 January 2025 / Revised: 10 March 2025 / Accepted: 10 March 2025 / Published: 14 March 2025

Abstract

:
The Pacitan Regency is at risk of megathrust earthquakes and tsunamis due to the seismic gap along the southern region of Java Island, making risk-reduction efforts crucial. This research aims to analyse the tsunami risk associated with a potential megathrust earthquake scenario in Pacitan’s coastal areas and develop sustainable mitigation strategies. The research employs spatial analysis to evaluate the risk and subsequently formulate strategies for long-term mitigation. A weighted overlay method was utilised to integrate hazard (H) and vulnerability (V) datasets to produce a tsunami risk map (R). The hazard component was modelled using a tsunami propagation simulation based on the Shallow Water Equations in the Delft3D-Flow software, incorporating an earthquake scenario of Mw 8.8 and H-loss calculations in ArcGIS Pro 10.3. The vulnerability assessment was conducted by overlaying population density, land use, and building footprint from the Global Human Settlement Layer (GHSL) datasets. Finally, sustainable strategies were proposed to mitigate the tsunami risk effectively. The results show that Pacitan faces significant tsunami disaster risk, with tsunami waves at the coast reaching 16.6 m. Because the coast of Pacitan is densely populated, mitigation strategies are necessary, and in the present contribution, the authors developed holistic spatial planning, which prioritise the preservation and restoration of natural barriers, such as mangroves and coastal forests.

1. Introduction

Indonesia is an archipelago of Southeast Asia with picturesque coastlines but faces significant tsunami disaster risk (Figure 1d). The country is prone to tsunamis due to its location along the Pacific Ring of Fire, where seismic activities frequently occur. Research has shown that certain parts of Indonesia experience high seismic activity, leading to frequent tsunamis. The high-risk areas include Java Island (the most densely populated), southern Sumatra, and small islands off their coasts. This risk is caused by the interaction between the Indo-Australian and Eurasian plates, where the Indo-Australian plate is subducted beneath Eurasia, forming the Sunda subduction zone (Figure 1a) [1,2,3,4]. The convergence zone creates conditions that are conducive to significant increases in earthquake and tsunami occurrences. Pacitan Regency, which is located in the south of Java, represents one of the highest-risk areas [5,6].
The Pacitan Regency is in the western part of East Java and has direct exposure to the Indian Ocean. This area faces significant risks from megathrust activity that can generate large tsunamis [10]. These hazards are exacerbated by Pacitan’s geographical position and the presence of seismic gaps—segments along the subduction zone that lack recent significant seismic activity but possess the potential for major future earthquakes (Figure 1c). Moreover, the deficit zone in Central and East Java has the potential to generate an earthquake of magnitude Mw 8.8, given a return period of approximately 400 years [7].
Because of the disaster risk, there are already numerous studies related to tsunamis along South Java’s coast, including Pacitan [7,10]. For instance, tsunami hazard models have been developed by Jamilah et al. [11] and Kartikasari [12]. These works applied remote sensing and GIS analysis approaches that disregard the source and magnitude of the earthquake. Other studies have focused on different aspects, such as vulnerability and resilience [13], evacuation route modelling [14,15], and hazard identification [10]. Nevertheless, studies taking a comprehensive approach to tsunami risk, incorporating hazards based on tsunami simulation and vulnerability assessments, are still lacking.
Integrating tsunami risk analysis into disaster management strategies is crucial. Risk analyses are important for developing mitigation measures [16,17] and helping identify vulnerable infrastructures [18], such as schools, health facilities, and transportation networks, which need reinforcement against hazards to minimise losses during tsunami events. Therefore, this study aims to analyse the risk of a tsunami following a potential Mw 8.8 megathrust earthquake scenario in the coastal areas of Pacitan and formulate sustainable mitigation strategies.

2. Materials and Methods

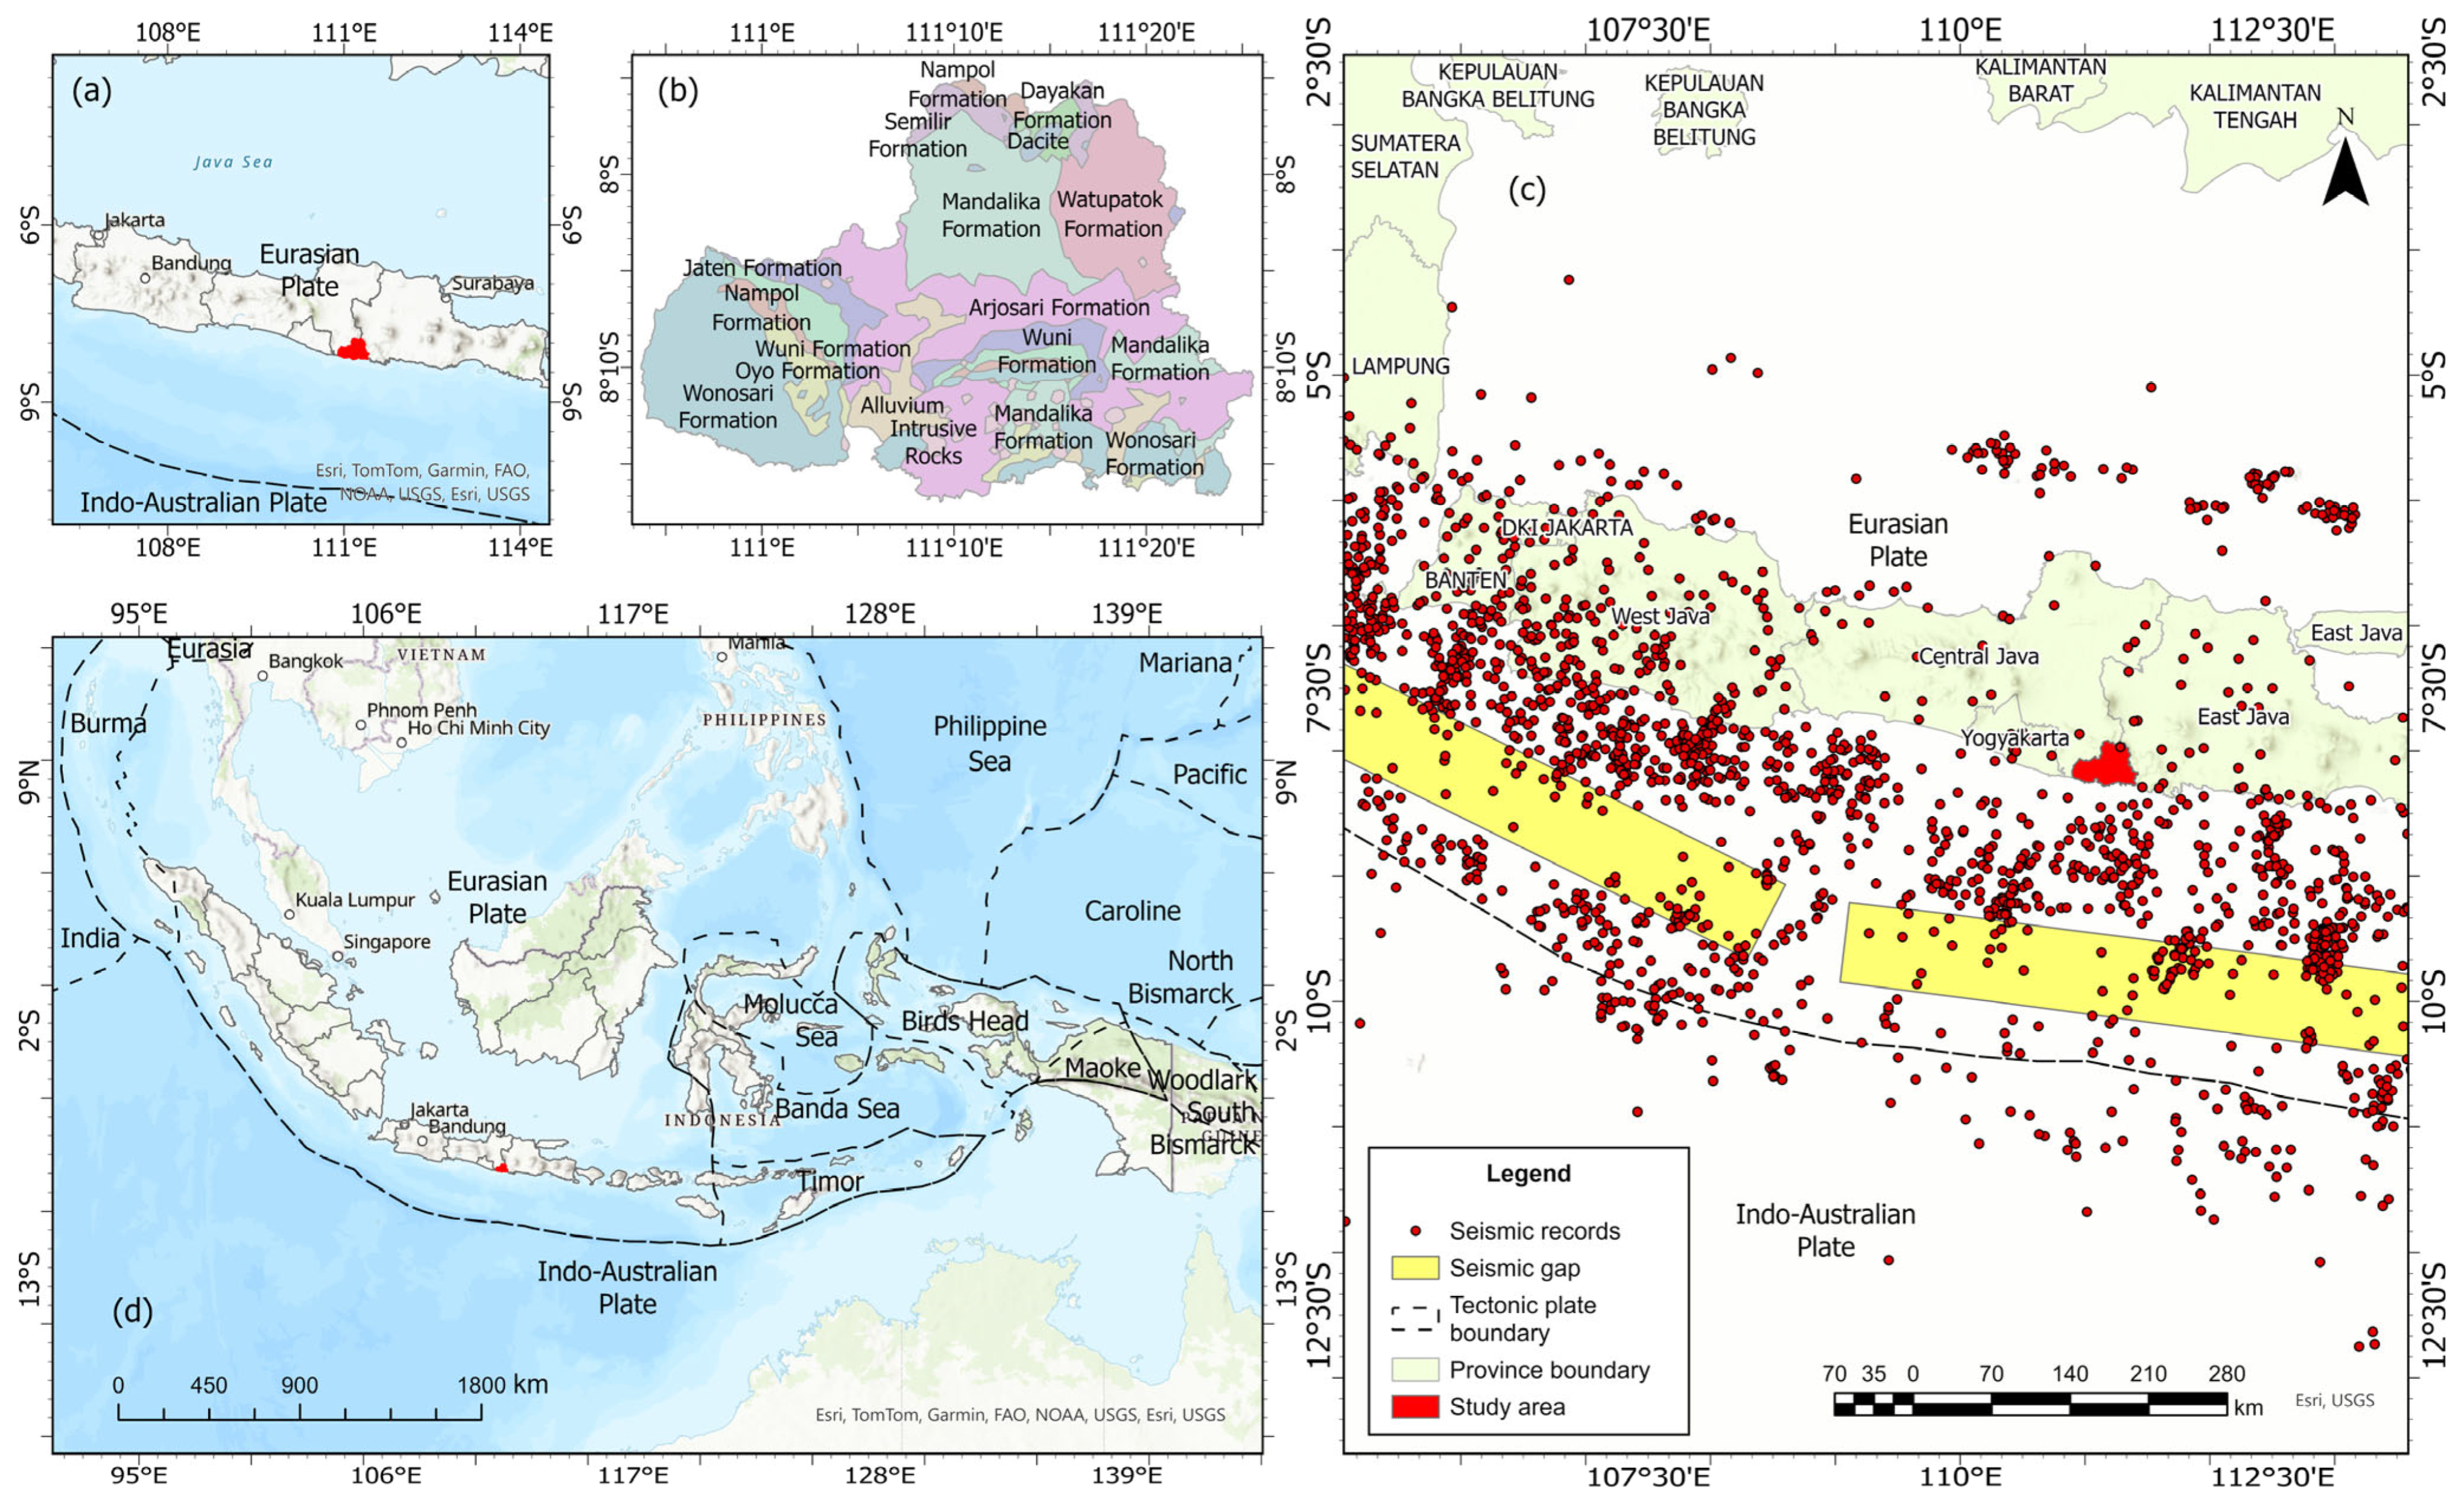
2.1. Study Area: Location and Geological Condition

The Pacitan Regency is situated in East Java, adjacent to the Indian Ocean to the south (Figure 1). The terrain comprises coastal plains and rugged terrain to the South. Within the Southern Mountains physiographic zone, Pacitan municipality occupies 633 hectares and exemplifies typical regional geomorphology, featuring volcanic, floodplain, and structural landforms. The area supports diverse vegetation and experiences distinct rainy and dry seasons, with annual precipitation averaging 2300 mm [19]. Land use in the Pacitan Coastal Area encompasses residential zones, forests, mixed gardens, agricultural lands, and urban districts [20].
This area is located in part of an active subduction zone between the Indo-Australian and Eurasian Plate. The region has complex geological characteristics with a dominance of volcanic and karst rocks, which contribute to the formation of hilly and mountainous morphology [21]. The main geological formations in Pacitan consist of eleven rock units, including the Wonosari, Oyo, Jaten, and Semilir Formations, which indicate a long geological history and diverse sedimentation processes (Figure 1b) [22]. The karst morphology developed in Pacitan results from millions of years of limestone dissolution, forming underground caves and unique hydrological systems [22]. Another significant geological structure is the Grendulu Fault, which runs across several sub-districts and plays a role in the local tectonic activity that causes earthquakes in the region [21].
Seismically, Pacitan has a long history of recorded earthquakes dating back to 1818, with an occurrence pattern of almost every 20 years [21]. Seismic activity in the region is strongly influenced by plate subduction interactions and active fault movements on land, particularly the Grindulu Fault, which has produced several significant earthquakes in recent decades [23]. Seismic data show that earthquake epicentres in Pacitan are generally associated with fault structures present in the region, emphasising the importance of geological mapping to identify earthquake-prone zones [24]. In addition, several studies have shown that the ground acceleration rate due to earthquakes in Pacitan is relatively high, especially in coastal areas with soft soil layers [7].
Pacitan is also included in one of the seismic gap zones in southern Java that has the potential to experience large earthquakes in the future [7]. This region has the possibility of megathrust earthquakes due to the accumulation of tectonic stress that has not been fully released for a long time [25]. Studies on the frequency–magnitude distribution and fractal dimension of seismic gaps in Indonesia show that the southern zone of Java, including Pacitan, has a high level of stress accumulation and has the potential to experience energy release in the form of large earthquakes [25]. A number of studies suggest that subduction off the southern coast of Java tends to produce large-magnitude earthquakes, such as the one in Pangandaran in 2006 that triggered a tsunami [26].

2.2. Data Collection

This research relies on a combination of simulations derived from secondary data from studies in the literature, official records, relevant entities in the Pacitan Regency, the Google Earth Engine Data Catalog, and the Copernicus GHSL website. The data include administrative maps of Pacific sub-districts, earthquake slip deficit data in Southeast Java, national bathymetric data obtained from the National Geospatial Information Agency of Indonesia (BIG) website, slope inclination maps, sentinel images, coastline boundaries, tsunami evacuation points, and demographic data. The National Bathymetric Data have a spatial resolution of 6 arc seconds (±180 m).

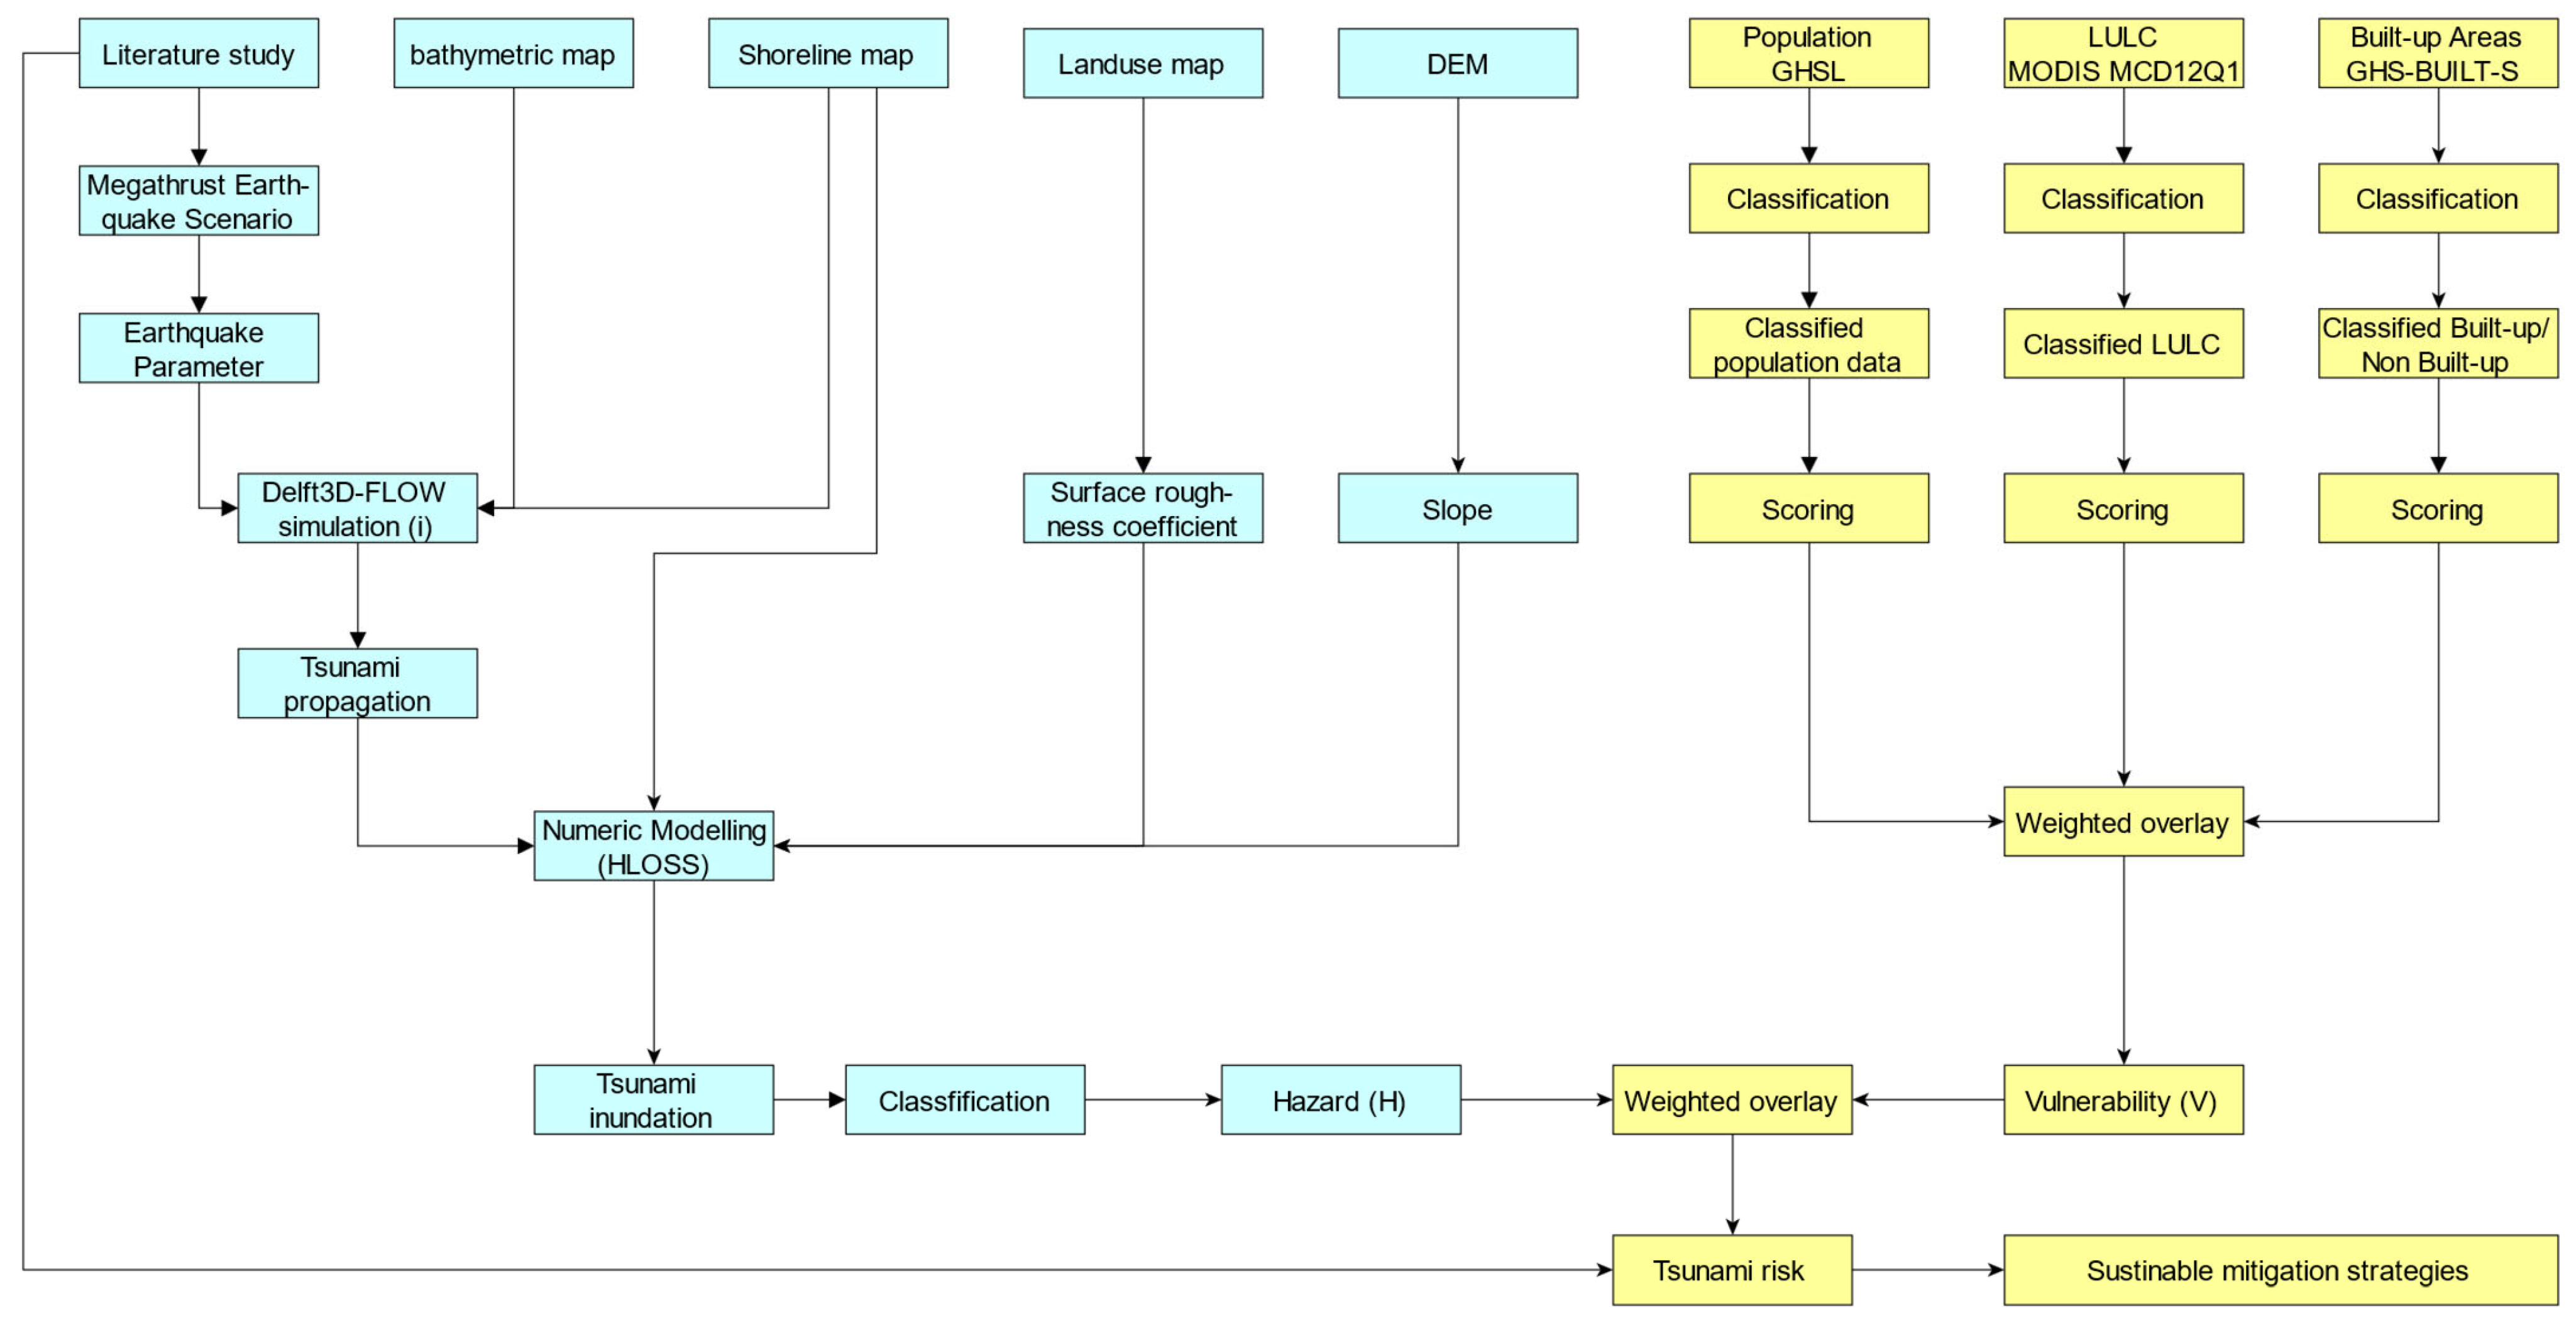
2.3. Research Framework

The initial phase of the research (Figure 2) focused on data preparation and gathering the necessary datasets and information for the study. A diverse array of data, including administrative maps, seismic data, and bathymetric information, was collected and underwent meticulous digitalisation. ArcGIS Pro 10.3 was employed to prepare datasets for subsequent investigations. This process ensured precise geographic referencing of the data while enabling seamless integration of different data types.
The second step was to run tsunami propagation and inundation modelling. Seismic and bathymetric data formed the basis for numerical simulations to predict tsunami wave propagation in the study area. The results of inundation modelling were then classified to produce the tsunami hazard model (see Section 2.4). The subsequent step was vulnerability analysis. We used a weighted overlay to analyse vulnerability by combining population density, land use, and building footprint datasets (see Section 2.5); finally, the risk analysis combined hazard and vulnerability (see Section 2.6).

2.4. Tsunami Hazard Modelling

Tsunami modelling in Delft3D 4 Suite 4.05.01 software uses the Shallow Water Equations, which simplify the Navier–Stokes equations applicable to incompressible fluids, where the water depth is significantly less than the tsunami wavelength [27,28]. In this scenario, vertical acceleration is disregarded as negligible, with the velocity of water particles mainly influenced by horizontal movement. The Delft3D software employs the continuity equation to regulate mass flow, assuring the absence of mass loss or gain during the simulation, alongside the momentum equation in the horizontal (x and y) directions. These equations are employed to construct a tsunami wave propagation model within the specified simulation domain.
We used an Mw 8.8 earthquake scenario for tsunami modelling in their previous research work [7]. Once the system had been fed with earthquake criteria, a formula stated by Okada [29] was employed to determine the effects of the earthquake on sea-bottom deformation. The Okada [29] method is employed—it utilises an elastic model over a half space to compute both dip–slip and strike–slip components vertically and horizontally from the fault parameters (Table 1).
We generate the tsunami inundation on the land based on the wave height produced by the tsunami propagation model. Berryman’s equation [30] for tsunami height loss (H-loss) (Equation (1)) was applied to estimate the inundation. Using this expression, we calculated a wave’s height reduction caused by distance from its original position over the inundated area. The horizontal distance travelled away from where the tsunami wave broke originally (shoreline) on a land plane. The H-loss accounts for the roughness coefficient of the area (S), wave height at the shoreline (H0) for the tsunami, and the slope (Figure 3).
H l o s s = 167   n 2 H 0 1 / 3 + 5 sin S

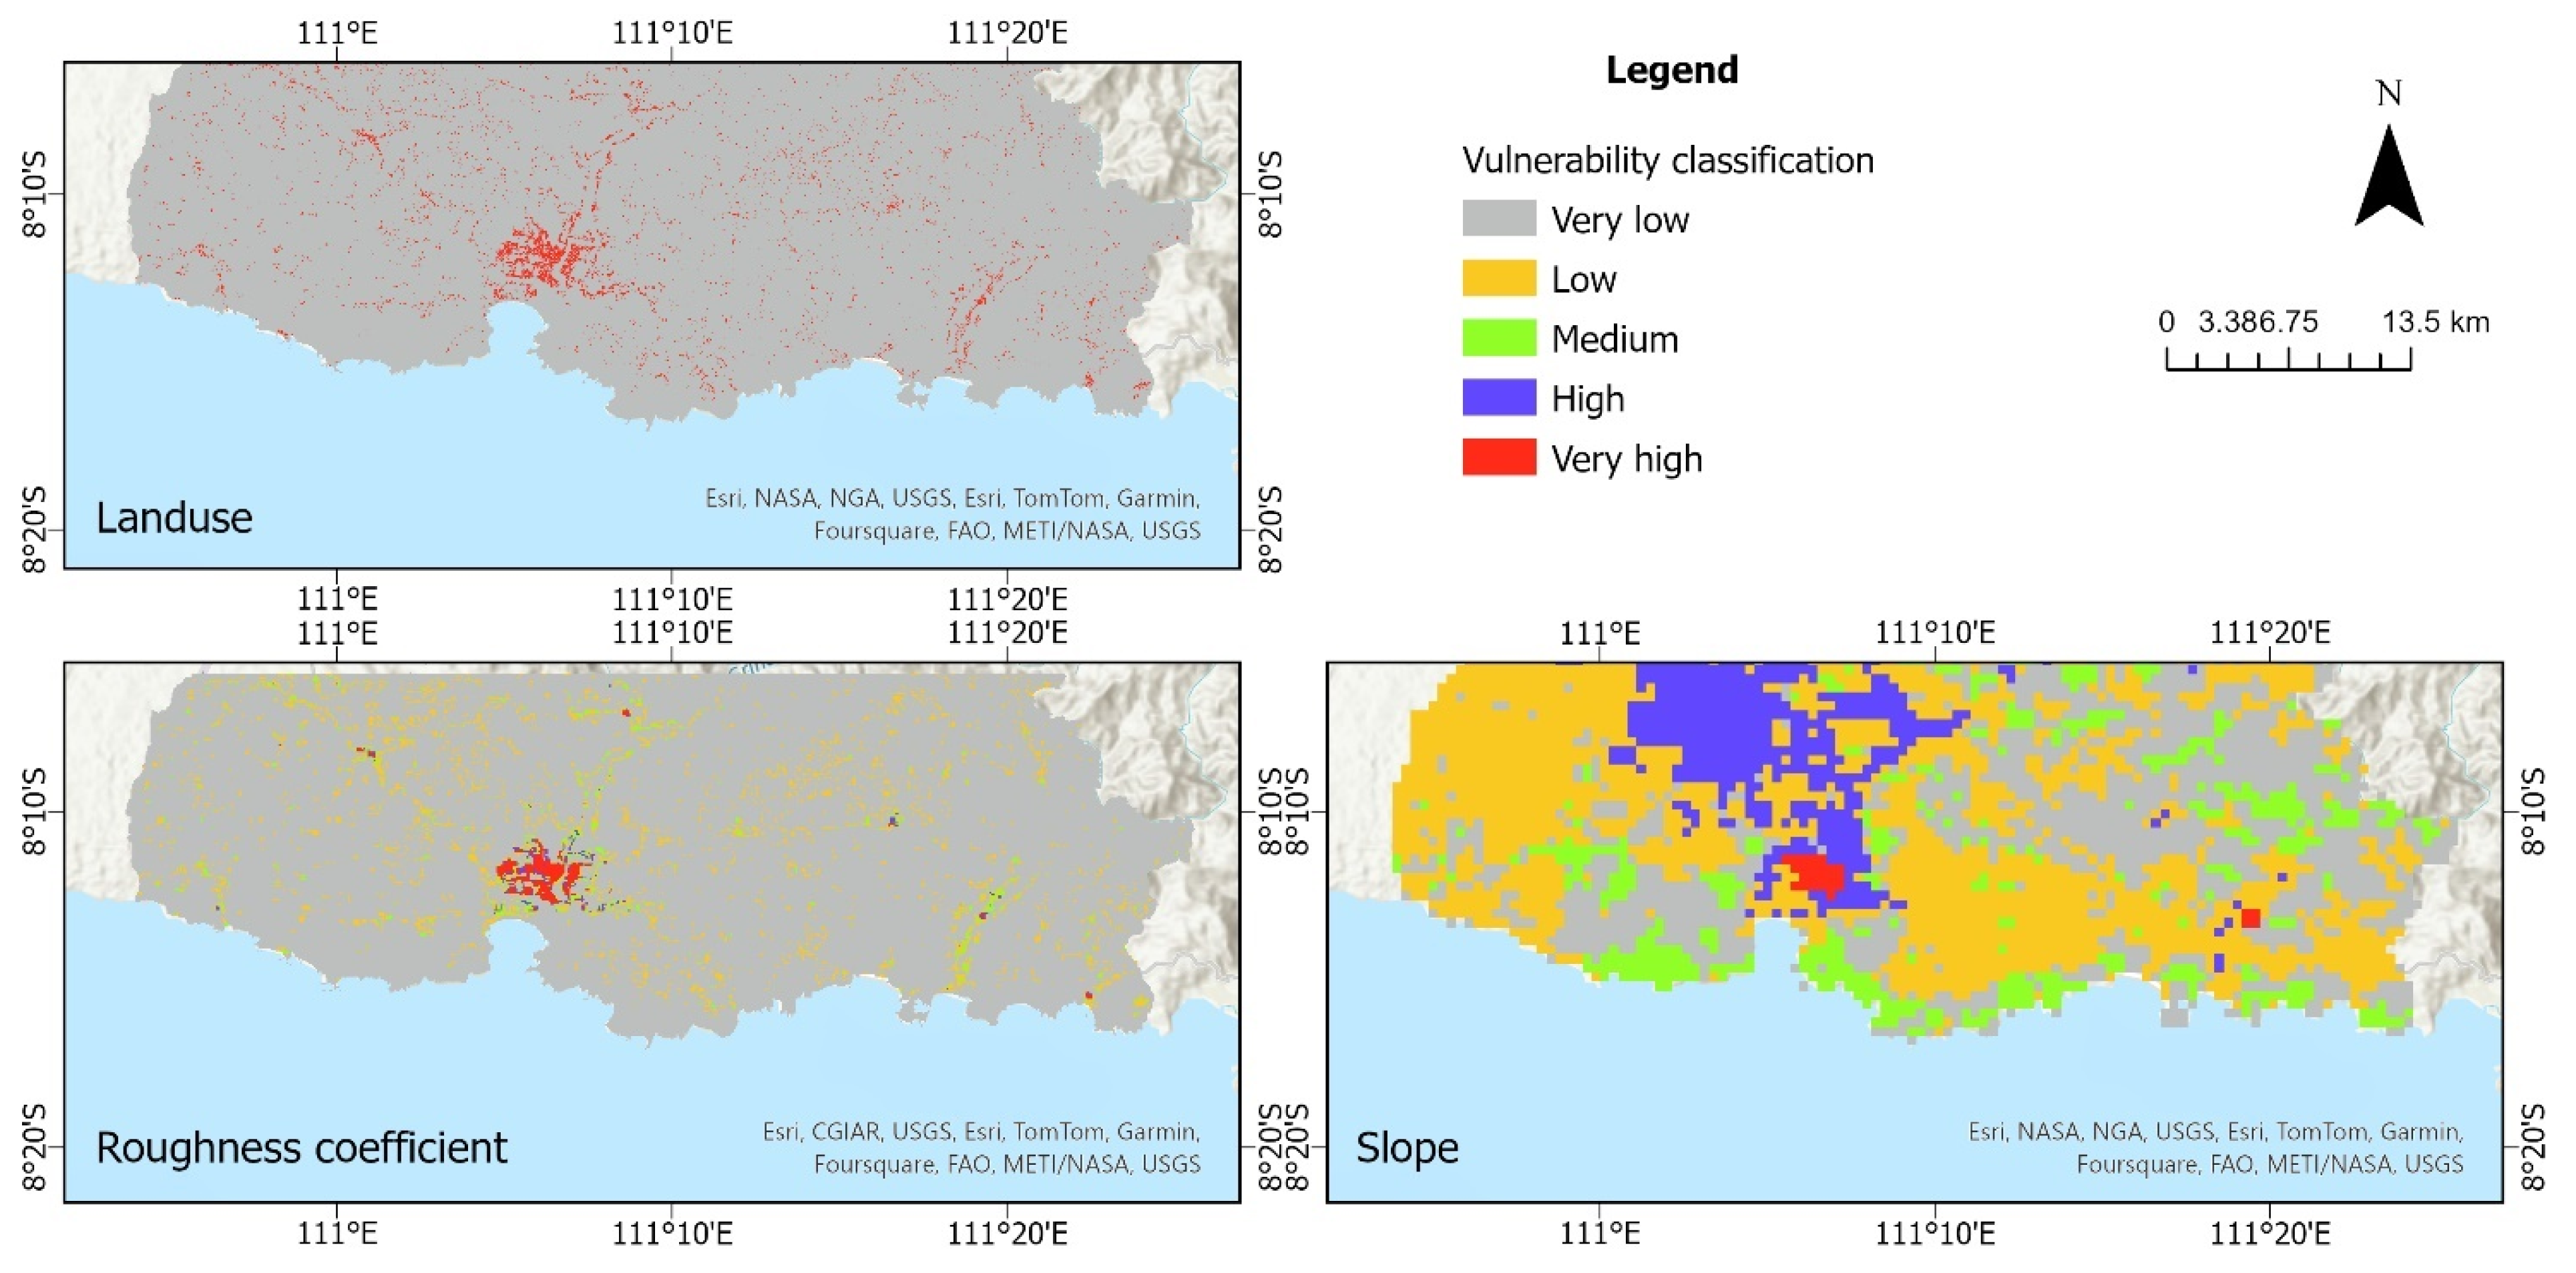
2.5. Vulnerability Analysis

The vulnerability analysis for estimating tsunami risk was conducted using three key datasets: population data, land use/land cover, and built-up areas. The population data were derived from the Global Human Settlement Layer (GHSL) that provides global population data for the period of 1975–2023, known as the Global Population Surfaces 1975–2023 (P2023A) dataset, which captures all necessary information of populations. The land use and land cover data were taken from the MCD12Q1.061 MODIS Land Cover Type Yearly Global 500 m dataset, determining a region’s vulnerability to certain potential threats. Eventually, the urbanised areas were appraised by the GHS-BUILT-S R2023A-GHS built-up surface grid, data that provide information on the distribution of the building footprint. All parameters (Figure 4) were combined using the weighted overlay, with the score and weight presented in Table 2.

2.6. Risk Analysis

The general risk function was used for assessing tsunami risk levels in the research area, which is a common approach in disaster risk management (Equation (2)) [31,32]. The risk is computed in this method by a cross-section of hazard and vulnerability. This approach stems from the studies [33,34] that consolidated these two variables. Here, the multiplication of hazard and vulnerability factors is used to define the risk.
R = H × V

3. Results

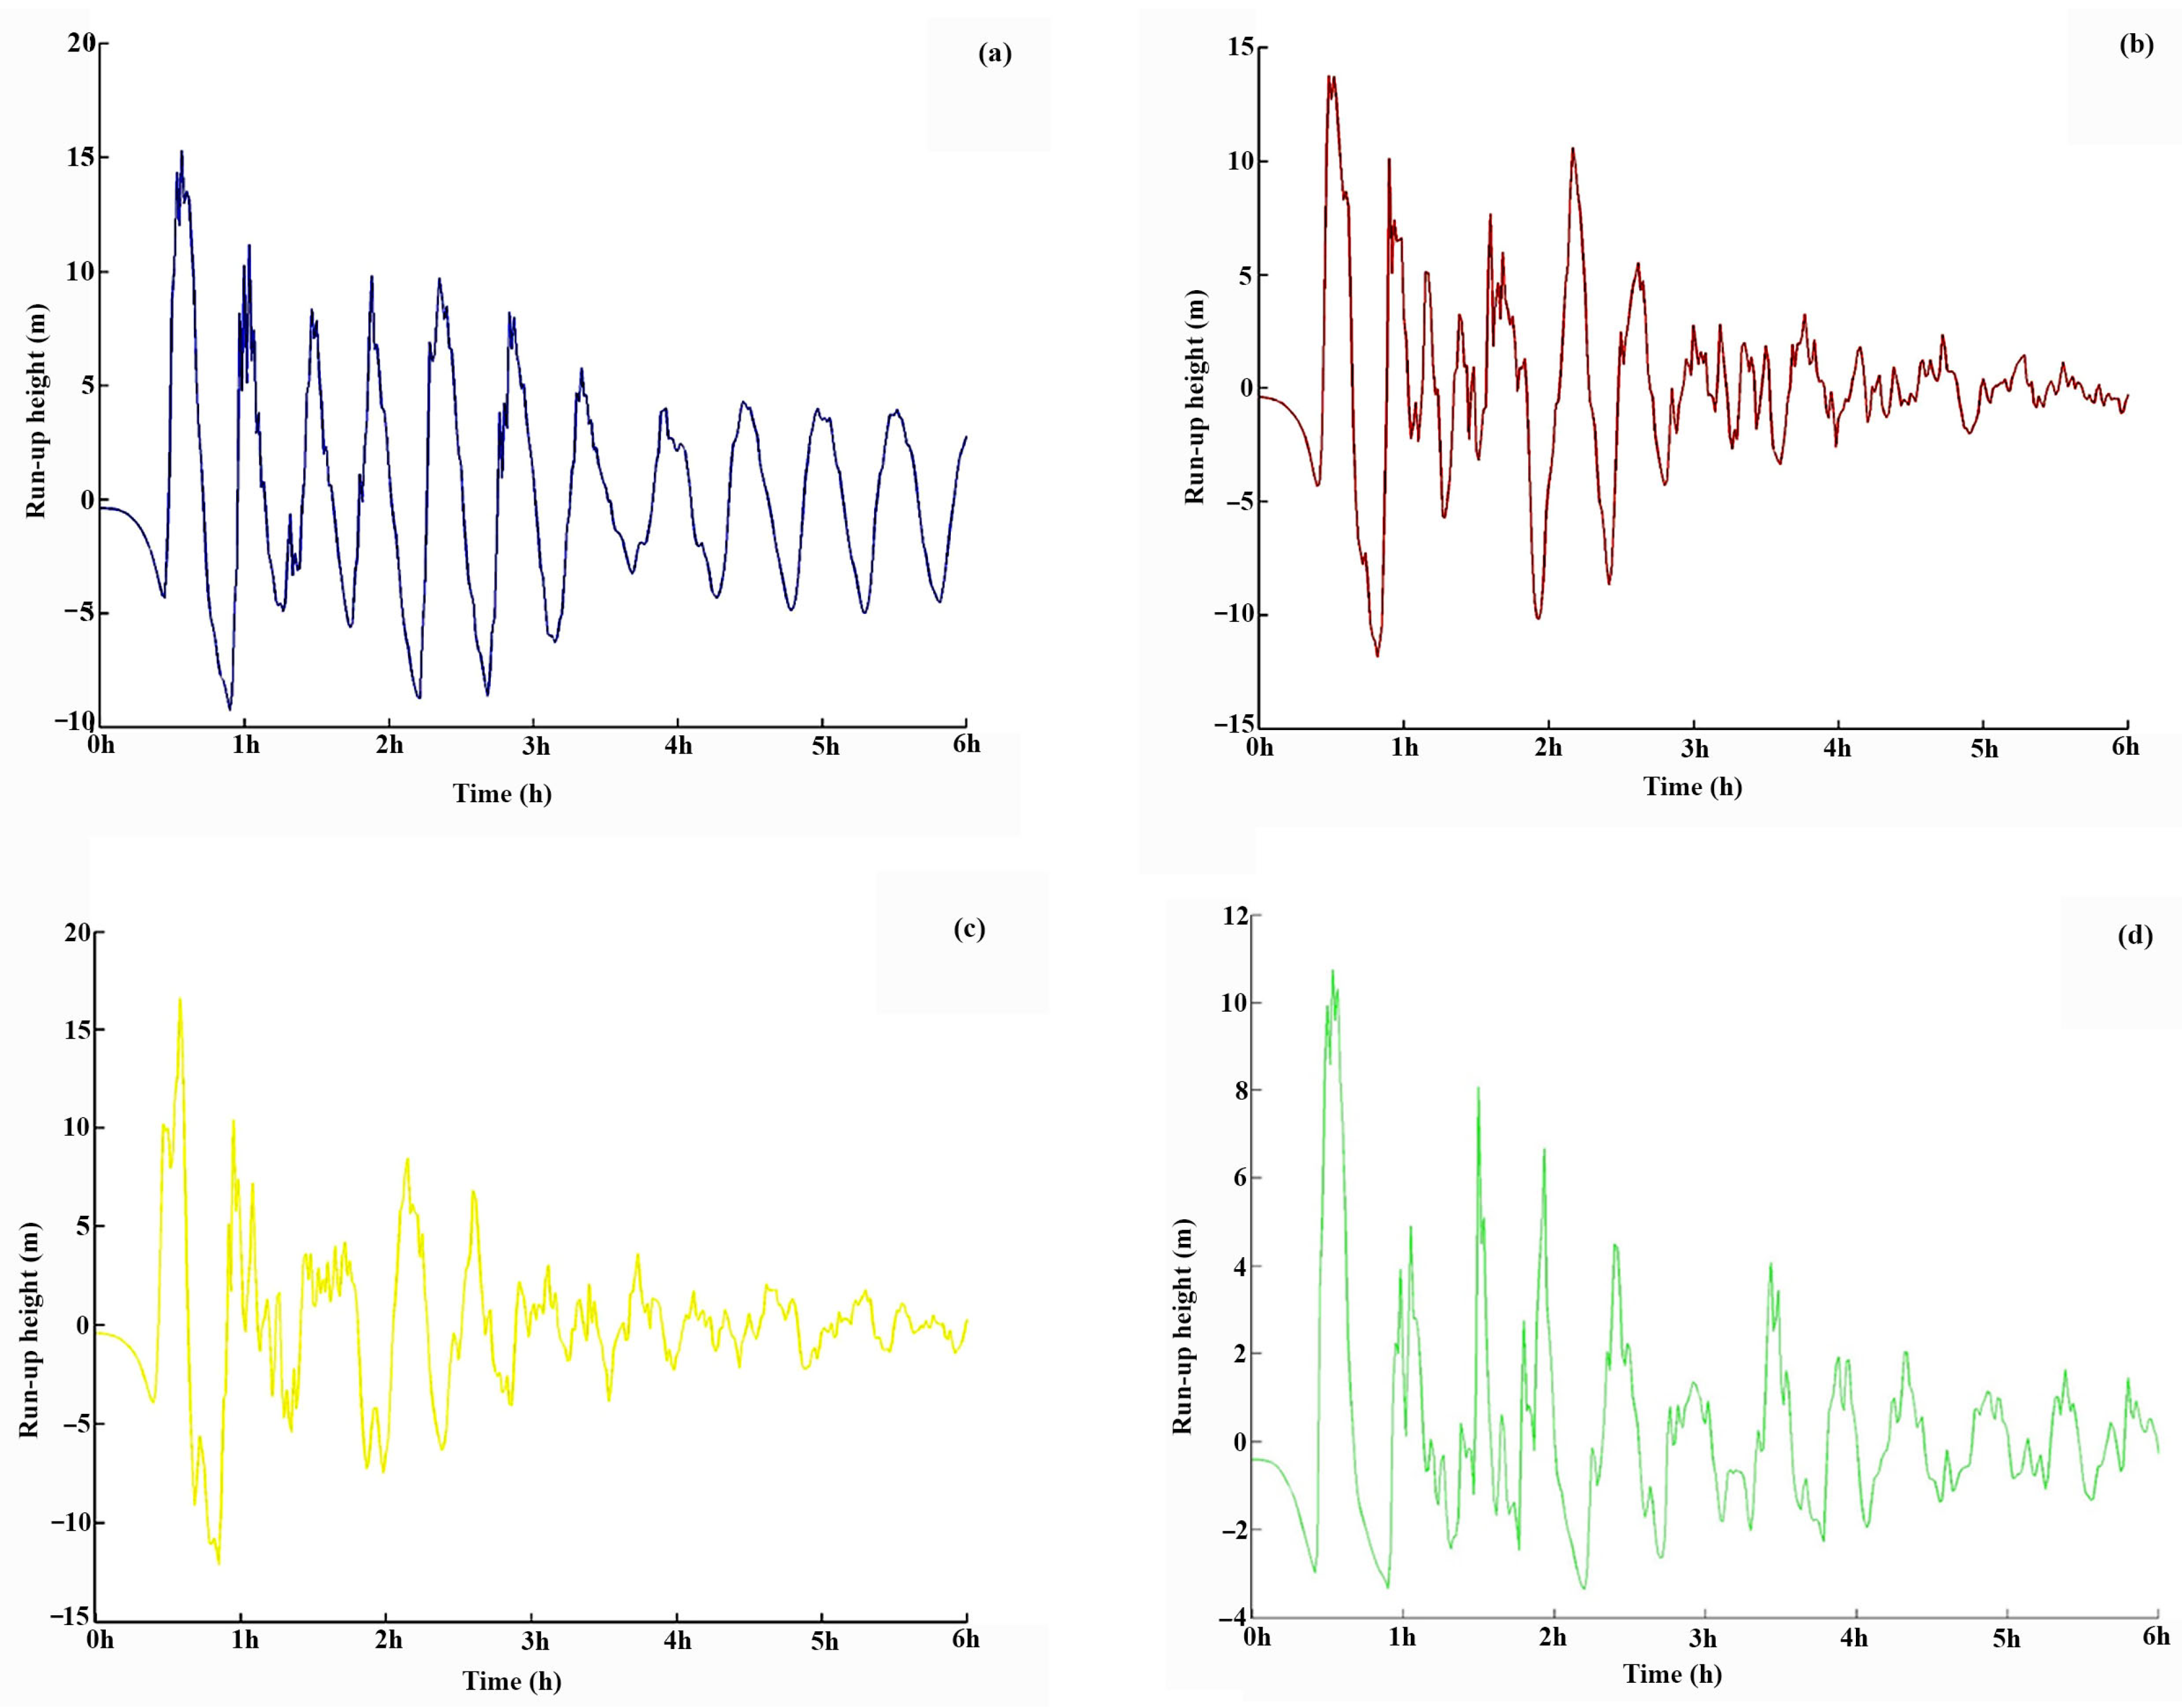
3.1. Tsunami Wave Propagation Model

The tsunami model incorporated the seismic source that generated the tsunami in the subduction zone up to the coastal areas, covering 98,718 km2 of land. To ensure adequate simulation, the runtime was fixed to 6 h with data storage intervals of 0.1 min. Four locations were picked as monitoring points for wave propagation: Station 1 on the shorefronts, Station 2 of Pacitan Bay, Station 3 at Soge Beach, and Station 4 at Watukarung Beach (Figure 5 and Figure 6). Station 2 monitored wave height before the waves entered the bay and assessed the impact of surrounding cliffs on tsunami wave propagation outside the bay. Station 3, located on the open coast of Soge Beach, served as a reference for comparing tsunami run-up heights both at bay and along open coastlines.
Tsunami propagation modelling has demonstrated that bathymetry, coastal terrain, and the coastline’s direction relative to the earthquake source significantly affect the wave heights and propagation patterns. Each examined location exhibits distinct wave propagation characteristics influenced by these factors. The topographic configuration, which tapers seaward and expands landward, significantly affects the mechanics of tsunami wave propagation. As waves traverse a constricted region, the energy of the waves becomes concentrated, resulting in an elevation of wave height and an amplification of the tsunami’s effects in that vicinity. The modelling results indicated that the initial wave amplitudes at various locations ranged from −2.97 to −4.31 m within the first 30 s post-earthquake, with the first wave attaining a maximum height between 10.75 and 16.6 m. Before the sixth wave, the tsunami height fluctuated between 8 and 10 m. This indicates that regions with topographic configurations conducive to wave energy concentration are at elevated danger of tsunamis.
In Pacitan Bay, the model’s point monitoring reports have indicated that the initial amplitude of tsunami waves was simulated to be −4.31 m at 0:27 min post-earthquake, with the first wave reaching a height of 15.3 m at 0:34 min. The second minimum amplitude wave attained −9.25 m at 0:54, while the second wave achieved a height of 11.18 m at 1:02. Before the sixth wave, the tsunami height attained 8 to 10 m. The bay’s indentation configuration focused wave energy, hence intensifying the tsunami’s impact in this region.
The simulation for Soge Beach has shown considerable amplitude variations attributable to bathymetric features and the shoreline configuration, which facilitated wave interference. The tsunami’s first amplitude was measured at −4.31 m at 0:24 min, while the first wave attained a height of 13.76 m at 0:29 min. The second negative amplitude was documented at −11.83 m at 0:49, succeeded by a wave measuring 10.13 m at 0:54. The sixth wave exhibited a negative amplitude of −10.18 m at 1:56, succeeded by a wave height of 10.60 m at 2:10.
Taman Beach recorded the maximum wave height in this research, with the initial wave measuring 16.6 m at 0:35. The primary source of this phenomenon is the configuration of the western shoreline, which inclines in a southwest–northeast direction, facilitating the amplification of waves emanating from Soge Beach. The second negative amplitude attained −12.11 m at 0:51, succeeded by a second wave measuring 10.41 m at 0:57. The beach’s orientation directly towards the earthquake source resulted in elevated tsunami wave amplitude at this site.
Wave heights at Watukarung Beach were noted to be inferior to those at comparable locations. The initial tsunami amplitude was measured at −2.97 m at 0:25, while the first wave attained a maximum height of 10.75 m at 0:32. The reduced bathymetry resulted in more uniform wave propagation without significant amplitude variations. The negative amplitude observed in the initial phase of the tsunami signifies that the region is susceptible to retrogressive waves following the primary wave, which might be detrimental if individuals have not evacuated in time.

3.2. Tsunami Inundation Model (Hazard)

The coastal regions of Pacitan Regency exhibit a significant tsunami hazard (Figure 7 and Figure 8). The modelling results indicate that regions can be classified based on the hazard level into the very low category (0–3 m), encompassing 11,698 km2, the low category (3–6 m) covers 10,995 km2, the medium category (6–9 m) spans 10,792 km2, the high category (9–12 m) includes 10,954 km2, and the very high category (>12 m) accounts for 10,716 km2. The distribution indicates that the majority of hazard zones encounter moderate to very high danger levels, suggesting a likelihood of considerable damage to infrastructure and settlements in the coastal districts of Pacitan.
The modelling results also indicate that Pacitan Bay encompasses the most extensive affected area relative to other places, with the majority classified under the high to very high hazard category. The primary determinant of the impacted area’s extent is the Grindulu River, which serves as a conduit for tsunami waves, facilitating inland inundation and extending the reach of flooding. Simultaneously, Soge Beach and Taman Beach exhibit considerable zones of influence, with the majority of their regions classified under the medium-to-high hazard category. The steep topography of these two beaches helps mitigate the propagation of tsunami waves; yet, they remain susceptible to considerable effects due to adjacent sloping regions. Watukarung Beach exhibits the least impacted area, predominantly classified within the low-to-medium danger category, attributable to the mountainous karst geology that inherently mitigates wave activity.
The modelling results indicate the prevalence of regions with moderate to very high hazard levels in the majority of the impacted areas, particularly in Pacitan Bay, which exhibits the highest risk due to hydrological and topographical influences. The Grindulu River serves as the primary conduit for tsunami wave propagation, markedly enlarging the impacted region. The mountainous topography of Soge Beach and Taman Beach serves as a natural mitigation element that restricts the spread of inundation, yet the area remains classified as high risk. Watukarung Beach, characterised by its steep karst slopes, exhibited the least significant impact. The results underscore the necessity of incorporating topographic and hydrological elements in tsunami mitigation planning, along with the imperative to enhance early warning systems and catastrophe risk reduction methods in high-risk regions like Pacitan Bay.

3.3. Vulnerability

The vulnerability analysis in the coastal Pacitan district indicates that most places have a very low level of vulnerability (Figure 9 and Figure 10). The extremely low vulnerability group encompasses 32.04 km2 of the overall area. Simultaneously, the low vulnerability group encompasses 18.86 km2.
The medium vulnerability category encompasses 1.76 km2, signifying an area that may endure more significant consequences than the low and extremely low categories. The high vulnerability category encompasses 1.67 km2, signifying that certain regions are in considerable danger in the case of a tsunami, concerning potential infrastructural destruction and threats to human safety. The very high vulnerable class encompasses 0.74 km2. Although it occupies a smaller area than the other categories, it possesses the most significant potential impact. Regions in this classification are typically situated in coastal zones with low elevation, adjacent to river routes that might expedite tsunami inundation, or possess a high population density.

3.4. Tsunami Risk

The results of the tsunami risk analysis indicate disparities in the risk distribution within the research area (Figure 11 and Figure 12). According to the risk categorisation, 21.52 km2 of the entire area is classified as low risk, and 4.84 km2 is designated as extremely low risk. This signifies that almost one-third of the region exhibits negligible tsunami danger, indicating comparatively lower susceptibility levels than other places. The medium-risk area encompasses 25.51 km2, showing a heightened threat to infrastructure and population. Furthermore, the high-risk zone encompasses 3.31 km2, which necessitates focused attention on mitigation and preparedness plans [35].
The varied distribution of risk levels highlights the necessity for a comprehensive zoning-based methodology to pinpoint the most susceptible regions and formulate suitable mitigation methods. Many high- and medium-risk zones are situated along the shoreline and near river systems, which can function as tsunami flow pathways to the inland regions. Consequently, precise tsunami risk mapping is vital for informing emergency preparedness, encompassing the identification of effective evacuation routes and the establishment of secure assembly locations for populations [36]. This research underscores the necessity of enhancing the tsunami early warning system (TEWS) to bolster public awareness and preparedness for possible disasters [37].

4. Discussion

Analysis reveals that the coastal regions of Pacitan predominantly face moderate to very high tsunami hazards, particularly in areas characterised by gentle topography and proximity to river channels. The spatial distribution of tsunami risk varies across the region, with low-risk areas predominating; however, zones categorised as medium and high-risk warrant particular attention and intervention. Implementation of sustainable mitigation strategies is imperative to minimise future tsunami-related risks in this region. These results demonstrate the importance of integrating disaster mitigation into regional planning and preparing sustainable mitigation strategies [38].
These findings have significant implications for disaster preparedness and community resilience. We could classify areas needing prioritisation as moderate to high-risk for enhanced risk reduction measures, such as public education, community drills, and resilient infrastructure. This is critical for mitigating the impacts of future tsunamis. This focus aligns with Ferreira et al. [39] and Chen [40], who highlight the importance of site-specific risk evaluations and evacuation route planning to protect lives. This study also underscores the need for further research to address gaps in physical vulnerability assessments and social resilience, as discussed in several studies [41,42,43]. Future efforts should aim to refine high-resolution models [44,45], incorporate social and economic dimensions of vulnerability [46,47,48], and integrate deterministic [49] and probabilistic [50] approaches to create a holistic understanding of tsunami risks.

4.1. Spatial Planning for Tsunami Prone Areas

Spatial planning and the integration of disaster resilience measures, particularly in high-risk areas, remain critical challenges for tsunami risk mitigation. Widodo et al. [51] highlighted deficiencies in Pacitan’s spatial plans, where settlements persist in high-risk zones due to insufficient integration of disaster mitigation elements. This issue aligns with broader findings by Leonard et al. [52] and Løvholt et al. [53], who emphasise the need to embed vulnerability and resilience metrics within spatial planning frameworks to address systemic risks and cascading hazards. Additionally, nature-based solutions, such as mangrove restoration, have been identified as effective soft mitigation measures to reduce tsunami impacts in vulnerable regions like South Denpasar [54].
Spatial planning must incorporate comprehensive strategies, including community participation [55], evacuation planning [14], and vertical evacuation structures [56,57], which research has identified as critical components of disaster mitigation in urban settlements [58]. Furthermore, integrating both hard and soft measures, such as seawalls and education programmes, into long-term planning enhances resilience and reduces vulnerabilities [59]. Addressing these challenges requires a multi-disciplinary approach prioritising safety, sustainability, and inclusivity in high-risk coastal areas.
Spatial planning in tsunami-prone regions currently exhibits notable deficiencies in integrating disaster mitigation strategies. Unregulated urban development in high-risk coastal zones increases vulnerability to tsunamis, as demonstrated by Banda Aceh’s post-2004 recovery, where spatial plans inadequately implemented effective mitigation measures [34]. Deficiencies are also apparent in Pacitan, Indonesia, where settlements remain in high-risk areas due to insufficient integration of resilience strategies within development policies [35]. The degradation of natural barriers, including mangroves [60] and coastal forests, has rendered numerous coastal areas vulnerable to tsunami impacts. This loss of ecological buffers increases the susceptibility of communities to wave energy [54,61]. Despite evidence supporting nature-based solutions, such as forestation, their integration into planning frameworks remains underutilised [61,62].
Holistic spatial planning emphasises the synergy of ecological, social, and infrastructural strategies to mitigate tsunami hazards effectively. This approach incorporates zoning regulations that prioritise preserving and restoring natural barriers like mangroves and coastal forests. [61,62,63]. Studies have demonstrated that mangroves and coastal forests significantly reduce tsunami wave energy, offering a cost-effective and sustainable defence mechanism compared to artificial barriers [61,64,65]. For example, post-tsunami research in Sri Lanka and Japan shows how dense coastal vegetation can dissipate wave energy and trap debris, reducing inland damage [64,65,66,67].

4.2. Sustainable Tsunami Mitigation Strategies

To achieve sustainable mitigation, it is critical to integrate tree planting and forestation into spatial and urban planning frameworks. Policies must enforce forest preservation and support restoration projects in coastal zones [62]. Community engagement is essential for the success of these initiatives, as demonstrated in Sri Lanka, where participatory approaches ensure the long-term sustainability of coastal vegetation projects [66,67]. Additionally, partnerships between governments, NGOs, and academic institutions can foster innovative solutions, such as hybrid defence systems combining natural and artificial measures [61].
Tree planting and forestation play a pivotal role in sustainable tsunami mitigation [68,69]. Mangroves and coastal forests not only act as natural buffers, reducing the velocity and energy of tsunami waves, but also provide co-benefits such as biodiversity conservation and erosion control [66,70,71,72]. Large-scale initiatives, such as Pakistan’s Billion Tree Tsunami program, demonstrate the potential of forestation to address environmental and disaster resilience goals simultaneously [68,69]. Based on the land cover analysis, tree planting, and forestry can be applied in the study area as a bio-shield against tsunami hazards.
Figure 13 illustrates potential zones for the establishment of protective bio-shield areas against tsunamis. The discovery that 74% of Pacitan’s coastal regions are appropriate for the planning of protective bio-shields highlights the considerable potential for nature-based strategies in tsunami mitigation. Incorporating bio-shields, such as mangroves and coastal forests, is essential for diminishing wave energy and mitigating tsunami effects. Research from the Middle East indicates that dense forests, such as date palm plantations, can decrease wave velocity and depth by as much as 40% in areas susceptible to tsunamis [73]. The 26% of non-potential areas highlight challenges, including deforestation, urbanisation, and land-use pressures that require attention through spatial planning and restoration initiatives [73,74]. Strategic reforestation and customised bio-shield designs can convert these areas into efficient protective zones while fostering sustainable development. Collaboration among policymakers, local communities, and environmental organisations will be essential in effectively utilising high-potential areas to mitigate tsunami risks.

5. Conclusions

This study employs a spatial-based function of hazard (H) and vulnerability (V) to analyse tsunami risk (R) in Pacitan Regency. A numerical model was used for tsunami hazard analysis, while remote sensing data and GIS analysis were used for vulnerability analysis. The modelling results indicate that the research region can be categorised by tsunami danger levels, with distinct areas in each classification; the very high category (>12 m) encompasses 10,716 km2, while the very low category (0–3 m) spans 11,698 km2. Regarding vulnerability, the majority of regions exhibit low to very low vulnerability levels, encompassing areas of 32.04 km2 and 18.86 km2, respectively, whilst regions classified as having very high vulnerability occupy about 0.74 km2. The risk study reveals that the majority of locations are classified as low and very low risk, with a total of 26.36 km2, suggesting a minimal level of threat overall. Nevertheless, 3.31 km2 is classified as high risk, necessitating focused efforts in disaster mitigation and tsunami preparedness planning. Sustainable mitigation strategies are needed to minimise future risks, and spatial planning and disaster resilience measures are crucial for addressing systemic risks.
This study contributes to global tsunami disaster risk-reduction efforts by identifying risk levels and proposing actionable solutions for sustainable mitigation. The method presented in this paper, which integrates tsunami simulation and GIS-based weighted overlay for the tsunami risk analysis, is applicable to other tsunami-prone areas worldwide.

Author Contributions

Conceptualisation, J.J.; methodology, J.J., K.D.P., C.A., A.S., C.G., K.-C.L., A.R., N.P., F.S., M.N. and K.S.W.; software, J.J.; writing—original draft preparation, J.J., K.D.P., C.A., A.S., C.G., K.-C.L., A.R., N.P., F.S., M.N. and K.S.W.; writing—review and editing, J.J, K.D.P., C.A., A.S., C.G., K.-C.L., A.R., N.P., F.S., M.N. and K.S.W.; visualisation, J.J.; funding acquisition, J.J. All authors have read and agreed to the published version of the manuscript.

Funding

This research was funded by the HIT Program of Universitas Muhammadiyah Surakarta, grant number 2024.

Institutional Review Board Statement

Not applicable.

Informed Consent Statement

Not applicable.

Data Availability Statement

The datasets are available upon request.

Acknowledgments

We gratefully acknowledge UMS for funding through the HIT program and Muhammad Badrul Huda for assisting with the data collection, analysis, and simulation process.

Conflicts of Interest

The authors declare no conflicts of interest.

References

  1. Febriani, F.; Ahadi, S.; Anggono, T.; Dewi, C.N.; Prasetio, A.D. Applying Wavelet Analysis to Assess the Ultra Low Frequency (ULF) Geomagnetic Anomalies Prior to the M6. 1 Banten Earthquake (2018). IOP Conf. Ser. Earth Environ. Sci. 2021, 789, 012064. [Google Scholar] [CrossRef]
  2. Sudaryatno, S.; Sumantyo, J.T.S.; Purwanto, T.H.; Akbar, M.F.A.; Gita, A.R.; Shalih, O. Analysis and Geovisualization of Tsunami Hazard and Evacuation Routes in the Opak-Progo Coastal Area. Forum Geogr. 2024, 38, 257–265. [Google Scholar] [CrossRef]
  3. Dewa, H.P.N.; Nirwansyah, A.W.; Dewi, R.S.; Demirdag, I. Vulnerability Analysis of School Buildings to Tsunami in the Cilacap Coastal Area. Forum Geogr. 2023, 37, 117–133. [Google Scholar] [CrossRef]
  4. Putri, A.M.; Saputra, A.; Wibowo, A.A. Study of Tsunami Source as Preparation for Tsunami Modeling in Sulawesi. IOP Conf. Ser. Earth Environ. Sci. 2024, 1314, 012126. [Google Scholar] [CrossRef]
  5. Abdillah, M.R.; Sarli, P.W.; Firmansyah, H.R.; Sakti, A.D.; Fajary, F.R.; Muharsyah, R.; Sudarman, G.G. Extreme Wind Variability and Wind Map Development in Western Java, Indonesia. Int. J. Disaster Risk Sci. 2022, 13, 465–480. [Google Scholar] [CrossRef]
  6. Dewanto, B.G.; Priadi, R.; Heliani, L.S.; Natul, A.S.; Yanis, M.; Suhendro, I.; Julius, A.M. The 2022 Mw 6.1 Pasaman Barat, Indonesia Earthquake, Confirmed the Existence of the Talamau Segment Fault Based on Teleseismic and Satellite Gravity Data. Quaternary 2022, 5, 45. [Google Scholar] [CrossRef]
  7. Widiyantoro, S.; Gunawan, E.; Muhari, A.; Rawlinson, N.; Mori, J.; Hanifa, N.R.; Susilo, S.; Supendi, P.; Shiddiqi, H.A.; Nugraha, A.D. Implications for Megathrust Earthquakes and Tsunamis from Seismic Gaps South of Java Indonesia. Sci. Rep. 2020, 10, 15274. [Google Scholar] [CrossRef]
  8. Search Earthquake Catalog. Available online: https://earthquake.usgs.gov/earthquakes/search/ (accessed on 3 March 2025).
  9. SIH3|Provinsi Jawa Timur. Available online: https://sih3.dpuair.jatimprov.go.id/main/sih3_detail/3428 (accessed on 4 March 2025).
  10. Wibowo, Y.A.; Subadi, T.; Wardhani, P.I.; Syahputri, D.M.; Hidayah, K.; Sholikah, S.N.H.; Ronggowulan, L. Geospatial Technology-Based Tsunami-Prone Areas Identification, Pacitan, Indonesia. AIP Conf. Proc. 2023, 2683, 030033. [Google Scholar]
  11. Jamilah, Z.; Widodo, A.; Ariyanti, N. Mapping Tsunami Hazard Levels in Pacitan Beach Using Remote Sensing Methods. J. Mar.-Earth Sci. Technol. 2021, 2, 1–4. [Google Scholar] [CrossRef]
  12. Kartikasari, D. Pemetaan Tingkat Bahaya Tsunami Secara Kuantitatif Menggunakan Sistem Informasi Geografis (SIG) Di Wilayah Teluk Teleng, Pacitan, Jawa Timur. Ph.D. Thesis, Institut Teknologi Sepuluh Nopember, Surabaya, Indonesia, 2023. [Google Scholar]
  13. Hidayah, Z.; Rohmah, N.N.; Wardhani, M.K. Coastal Vulnerability Study on Potential Impact of Tsunami and Community Resilience in Pacitan Bay East Java. Forum Geogr. 2022, 36, 66–79. [Google Scholar] [CrossRef]
  14. Jumadi, J.; Priyono, K.D.; Sasmi, A.T.; Saputra, A.; Gomez, C. Multi-Scenarios Tsunami Hazard And Evacuation Routes Using Seismic Data In Pacitan Bay, Indonesia. Int. J. Geomate 2024, 26, 46–53. [Google Scholar] [CrossRef]
  15. Usman, F.; Murakami, K.; Wicaksono, A.D.; Setiawan, E. Application of Agent-Based Model Simulation for Tsunami Evacuation in Pacitan, Indonesia. MATEC Web Conf. 2017, 97, 01064. [Google Scholar] [CrossRef]
  16. Lee, J.Y.; Keum, H.J.; Han, K.Y. Integrated Risk Analysis for Mitigation the Urban Flood Disaster. Proc. Korea Water Resour. Assoc. Conf. 2017, 50. [Google Scholar]
  17. Souisa, M.; Sapulete, S.M.; Siahaya, L.A. Earthquake Disaster Risk Analysis for Mitigation Efforts in Seram and Buru Islands, Maluku. J. Penelit. Pendidik. IPA 2023, 9, 5310–5316. [Google Scholar] [CrossRef]
  18. Vishnu, R.S.; Anilkumar, S.; Bimal, P. Disaster Risk Assessment and Analysis of Physical Infrastructure: A Comprehensive Review of Scientific Methods and Techniques. IDRiM J. 2024, 14, 241–272. [Google Scholar] [CrossRef]
  19. Umami, R.R.; Hendarto, R.M. Analisis Sektor Potensial Pengembangan Wilayah Guna Mendorong Pembangunan Daerah Di Kabupaten Pacitan. Ph.D. Thesis, UNDIP: Fakultas Ekonomika Dan Bisnis, Jawa Tengah, Indonesia, 2014. [Google Scholar]
  20. Huda, M.B.; Jumadi, S.S. Analisis Bahaya Tsunami Dan Penentuan Jalur Evakuasi Menggunakan Sistem Informasi Geografis Di Wilayah Pesisir (Studi Kasus: Kecamatan Pacitan Kabupaten Pacitan). Ph.D. Thesis, Universitas Muhammadiyah Surakarta, Jawa Tengah, Indonesia, 2023. [Google Scholar]
  21. Pradana, I.A.; Sungkono, M.S. Analisa Mikrotremor Menggunakan Metode Random Decrement Untuk Mikrozonasi Potensi Kerusakan Akibat Gempabumi Di Kabupaten Pacitan. Bachelor’s Thesis, Institus Teknologi Sepuluh Nopember, Surabaya, Indonesia, 2018. [Google Scholar]
  22. Muttaqy, F.; Nugraha, A.D.; Puspito, N.T.; Sahara, D.P.; Zulfakriza, Z.; Rohadi, S.; Supendi, P. Double-Difference Earthquake Relocation Using Waveform Cross-Correlation in Central and East Java, Indonesia. Geosci. Lett. 2023, 10, 5. [Google Scholar] [CrossRef]
  23. Parera, A.F.T.; Bunaga, I.; Yusuf, M. Pemodelan Tiga Dimensi Anomali Gravitasi Dan Identifikasi Sesar Lokal Dalam Penentuan Jenis Sesar Di Daerah Pacitan. Pros. Semin. Nas. Fis. (E-J.) SNF2015 2015, IV, 45–48. [Google Scholar]
  24. Muntafi, Y.; Nojima, N. Seismic Properties and Fractal Dimension of Subduction Zone in Java and Its Vicinity Using Data from 1906 to 2020. Int. J. Geomate 2021, 21, 71–83. [Google Scholar] [CrossRef]
  25. Yuliatmoko, R.S.; Perdana, Y.H.; Martha, A.A. Distribusi Frekuensi Gempabumi Dan Dimensi Fraktal Pada Seismik Gap Di Indonesia. J. Meteorol. Dan Geofis. 2021, 22, 55–56. [Google Scholar] [CrossRef]
  26. Smyth, H.; Hall, R.; Hamilton, J.; Kinny, P. East Java: Cenozoic Basins, Volcanoes and Ancient Basement. In Proceedings of the 30th Annual Convention of the Indonesian Petroleum Association, Jakarta, Indonesia, 30 August–1 September 2005. [Google Scholar]
  27. Fadlillah, L.N.; Widyastuti, M.; Marfai, M.A. Comparison of Tidal Model Using Mike21 and Delft3d-Flow in Part of Java Sea, Indonesia. IOP Conf. Ser. Earth Environ. Sci. 2020, 451, 012067. [Google Scholar] [CrossRef]
  28. Le Quéré, P.A.; Nistor, I.; Mohammadian, A. Numerical Modeling of Tsunami-Induced Scouring around a Square Column: Performance Assessment of FLOW-3D and Delft3D. J. Coast. Res. 2020, 36, 1278–1291. [Google Scholar] [CrossRef]
  29. Okada, Y. Surface Deformation Due to Shear and Tensile Faults in a Half-Space. Bull. Seismol. Soc. Am. 1985, 75, 1135–1154. [Google Scholar] [CrossRef]
  30. Berryman, K. Review of Tsunami Hazard and Risk in New Zealand, Report by the Institute of Geological and Nuclear Sciences; Institute of Geological & Nuclear Sciences: Lower Hutt, New Zealand, 2006. [Google Scholar]
  31. Sar, N.; Chatterjee, S.; Adhikari, M.D. Integrated Remote Sensing and GIS Based Spatial Modelling through Analytical Hierarchy Process (AHP) for Water Logging Hazard, Vulnerability and Risk Assessment in Keleghai River Basin, India. Model. Earth Syst. Environ. 2015, 1, 31. [Google Scholar] [CrossRef]
  32. UNISDR. Living with Risk: A Global Review of Disaster Reduction Initiatives; United Nations International Strategy for Disaster Reduction: Geneva, Switzerland, 2004. [Google Scholar]
  33. Samarasinghea, S.; Nandalalb, H.K.; Weliwitiyac, D.P.; Fowzed, J.S.M.; Hazarikad, M.K.; Samarakoond, L. Application of Remote Sensing and GIS for Flood Risk Analysis: A Case Study at Kalu-Ganga River, Sri Lanka. Int. Arch. Photogramm. Remote Sens. Spat. Inf. Sci. 2010, 38, 110–115. [Google Scholar]
  34. Jumadi, J.; Danardono, D.; Priyono, K.D.; Roziaty, E.; Masruroh, H.; Rohman, A.; Amin, C.; Hadibasyir, H.Z.; Fikriyah, V.N.; Nawaz, M. Utilizing Open Access Spatial Data for Flood Risk Mapping: A Case Study in the Upper Solo Watershed. Geoplanning 2024, 11, 189–204. [Google Scholar]
  35. Triantafyllou, I. New Observational Material About Seismic and Non-Seismic Tsunamis in Greece and Surrounding Areas From 1900 to 2023. Geohazards 2024, 5, 233–254. [Google Scholar] [CrossRef]
  36. Zhang, W.; Wu, J.; Yun, Y. Strategies for Increasing Tsunami Shelter Accessibility to Enhance Hazard Risk Adaptive Capacity in Coastal Port Cities: A Study of Nagoya City, Japan. Nat. Hazards Earth Syst. Sci. 2019, 19, 927–940. [Google Scholar] [CrossRef]
  37. Løvholt, F.; Kühn, D.; Bungum, H.; Harbitz, C.B.; Glimsdal, S. Historical Tsunamis and Present Tsunami Hazard in Eastern Indonesia and the Southern Philippines. J. Geophys. Res. Atmos. 2012, 117. [Google Scholar] [CrossRef]
  38. Nurohim, D.; Febrim, D.V. Spatial Planning Recommendations for Geoheritage Areas against the Danger of Krakatoa Tsunami on the Southwest Coast of Banten. IOP Conf. Ser. Earth Environ. Sci. 2024, 1424, 012005. [Google Scholar] [CrossRef]
  39. Ferreira, M.A.; Oliveira, C.S.; Francisco, R. Tsunami Risk Mitigation: The Role of Evacuation Routes, Preparedness and Urban Planning. Nat. Hazards 2024, 1–33. [Google Scholar] [CrossRef]
  40. Chen, Y. A New Methodology of Spatial Cross-Correlation Analysis. PLoS ONE 2015, 10, e0126158. [Google Scholar] [CrossRef] [PubMed]
  41. Shahin, M.S.A.; Villagra, P.; Mazzorana, B.; Rana, M.J.; Khan, I.; Altuwaijri, H.A.; Kafy, A.A. Assessing Tsunami Vulnerability Indicators to Enhance Coastal Resilience in Southern Chile. Nat. Hazards 2024, 1–55. [Google Scholar] [CrossRef]
  42. Nucifera, F.; Putro, S.T.; Afidah, S. Physical and Social Vulnerability in the Houshold Level Towards Tsunami in Sadeng Coastal Area, Gunungkidul. J. Geogr. 2021, 13, 59. [Google Scholar] [CrossRef]
  43. Saja, A.A.; Teo, M.; Goonetilleke, A.; Ziyath, A.M. Assessing Social Resilience in Disaster Management. Int. J. Disaster Risk Reduct. 2021, 52, 101957. [Google Scholar] [CrossRef]
  44. Amra, R.; Araki, S.; Geiß, C.; Davies, G. Error-Reduced Digital Elevation Models and High-Resolution Land Cover Roughness in Mapping Tsunami Exposure for Low Elevation Coastal Zones. Remote Sens. Appl. Soc. Environ. 2025, 37, 101438. [Google Scholar] [CrossRef]
  45. Wibowo, A.A.; Sari, D.N.; Priyono, K.D.; Maharani, D.E.W.I.; Safira, E. Tsunami Hazard Mapping Based On Coastal System Analysis Using Highresolution Unmanned Aerial Vehicle (Uav) Imagery (Case Study In Kukup Coastal Area, Gunungkidul Regency, Indonesia). Geogr. Tech. 2023, 18, 51–67. [Google Scholar]
  46. Thiri, M.A. Uprooted by Tsunami: A Social Vulnerability Framework on Long-Term Reconstruction after the Great East Japan Earthquake. Int. J. Disaster Risk Reduct. 2022, 69, 102725. [Google Scholar] [CrossRef]
  47. Mengal, A.; Goda, K.; Ashraf, M.; Murtaza, G. Social Vulnerability to Seismic-Tsunami Hazards in District Gwadar, Balochistan, Pakistan. Nat. Hazards 2021, 108, 1159–1181. [Google Scholar] [CrossRef]
  48. Tufekci-Enginar, D.; Suzen, M.L.; Yalciner, A.C. The Evaluation of Public Awareness and Community Preparedness Parameter in GIS-Based Spatial Tsunami Human Vulnerability Assessment (MeTHuVA). Nat. Hazards 2021, 105, 2639–2658. [Google Scholar] [CrossRef]
  49. Reis, C.; Baptista, M.A.; Lopes, M.; Oliveira, C.S.; Clain, S. Cascade Earthquake and Tsunami Hazard Assessment: A Deterministic Perspective for Engineering Purposes. Int. J. Disaster Risk Reduct. 2022, 75, 102952. [Google Scholar] [CrossRef]
  50. Selva, J.; Lorito, S.; Volpe, M.; Romano, F.; Tonini, R.; Perfetti, P.; Bernardi, F.; Taroni, M.; Scala, A.; Babeyko, A. Probabilistic Tsunami Forecasting for Early Warning. Nat. Commun. 2021, 12, 5677. [Google Scholar] [CrossRef] [PubMed]
  51. Widodo, A.; Aditama, F.Y.; Rochman, J.P.G.N.; Kartikasari, D.; Putra, N.M.; Pribadi, S. Preliminary Study of Tsunami Simulations on Megathrust Earthquake Scenarios in Pacitan Regency, East Java. IOP Conf. Ser. Earth Environ. Sci. 2024, 1307, 012004. [Google Scholar] [CrossRef]
  52. Leonard, L.J.; Rogers, G.C.; Mazzotti, S. Tsunami Hazard Assessment of Canada. Nat. Hazards 2014, 70, 237–274. [Google Scholar] [CrossRef]
  53. Løvholt, F.; Glimsdal, S.; Harbitz, C.B.; Horspool, N.; Smebye, H.; de Bono, A.; Nadim, F. Global Tsunami Hazard and Exposure Due to Large Co-Seismic Slip. Int. J. Disaster Risk Reduct. 2014, 10, 406–418. [Google Scholar] [CrossRef]
  54. Manan, A.; Sanjaya, H.; As-syakur, A.R. Landscape Planning for Tsunami Disasters Mitigation on Denpasar Coastal Zone. IOP Conf. Ser. Earth Environ. Sci. 2023, 1127, 012022. [Google Scholar] [CrossRef]
  55. Gultom, J.E.I.; Hasibuan, H.S.; Patria, M.P. Local Communities Participation in Mangrove Management for Tsunami Disaster Mitigation at Palu City Coastal. IOP Conf. Ser. Earth Environ. Sci. 2021, 940, 012084. [Google Scholar] [CrossRef]
  56. León, J.; Ogueda, A.; Gubler, A.; Catalán, P.; Correa, M.; Castañeda, J.; Beninati, G. Increasing Resilience to Catastrophic Near-Field Tsunamis: Systems for Capturing, Modelling, and Assessing Vertical Evacuation Practices. Nat. Hazards 2024, 120, 9135–9161. [Google Scholar] [CrossRef]
  57. Marfai, M.A.; Khakim, N.; Fatchurohman, H.; Salma, A.D. Planning Tsunami Vertical Evacuation Routes Using High-Resolution UAV Digital Elevation Model: Case Study in Drini Coastal Area, Java, Indonesia. Arab. J. Geosci. 2021, 14, 2028. [Google Scholar] [CrossRef]
  58. Soviana, W.; Achmad, A. Analysis of Tsunami Disaster Mitigation Priority on Urban Area Settlement. IOP Conf. Ser. Earth Environ. Sci. 2023, 1140, 012022. [Google Scholar] [CrossRef]
  59. Oetjen, J.; Sundar, V.; Venkatachalam, S.; Reicherter, K.; Engel, M.; Schüttrumpf, H.; Sannasiraj, S.A. A Comprehensive Review on Structural Tsunami Countermeasures. Nat. Hazards 2022, 113, 1419–1449. [Google Scholar] [CrossRef]
  60. Priyono, K.; Saifuddin, A.; Nugroho, F.; Jumadi, J. Identification of Mangrove Changes in the Mahakam Delta in 2007-2017 Using Alos/Palsar and Landsat. Int. J. Geomate 2022, 23, 77–84. [Google Scholar] [CrossRef]
  61. Benazir, B.; Triatmadja, R.; Syamsidik, S.; Nizam, N.; Warniyati, W. Vegetation-Based Approached for Tsunami Risk Reduction: Insights and Challenges. Prog. Disaster Sci. 2024, 23, 100352. [Google Scholar] [CrossRef]
  62. Widowati, D.A. Disaster Mitigation in Coastal Areas: Perspective of the Indonesian Spatial Planning Law. J. Media Huk. 2022, 29, 79–93. [Google Scholar] [CrossRef]
  63. Ahammed, K.K.B.; Karang, I.W.G.A.; Nuarsa, I.W.; Indrawan, I.G.S.; Hendrawan, I.G.; Dewi, N.M.N.B.S.; Pandey, A.C. Mapping of the Spatio-Spectral Dynamics of Mangrove Chlorophyll Concentrations via Sentinel-2 Satellite Imagery. Forum Geogr. 2024, 38, 244–256. [Google Scholar] [CrossRef]
  64. Tanaka, N. Vegetation Bioshields for Tsunami Mitigation: Review of Effectiveness, Limitations, Construction, and Sustainable Management. Landsc. Ecol. Eng. 2009, 5, 71–79. [Google Scholar] [CrossRef]
  65. Tanaka, N.; Jinadasa, K.B.S.N.; Mowjood, M.I.M.; Fasly, M.S.M. Coastal Vegetation Planting Projects for Tsunami Disaster Mitigation: Effectiveness Evaluation of New Establishments. Landsc. Ecol. Eng. 2011, 7, 127–135. [Google Scholar] [CrossRef]
  66. Sabri, I.L.M.; Sabrina, M.H.F.; Sakkeera, I.; Faisal, I.L.M.; Thahyeena, A.N.F. Influence of Mangrove Forests in Mitigating the Tsunami Risk in Coastal Areas of Sri Lanka. In Tsunami Science in Sri Lanka; University of Western Australia: Crawley, Australia, 2024; p. 46. [Google Scholar]
  67. Perera, U.T.G.; De Zoysa, C.; Abeysinghe, A.a.S.E.; Haigh, R.; Amaratunga, D.; Dissanayake, R. A Study of Urban Planning in Tsunami-Prone Areas of Sri Lanka. Architecture 2022, 2, 562–592. [Google Scholar] [CrossRef]
  68. Ashraf, U. Participation and Exclusion in Mega Tree-Planting Projects: A Case Study of the Ten Billion Tree Tsunami. Programme, Pakistan. Available online: https://opendocs.ids.ac.uk/articles/report/Participation_and_Exclusion_in_Mega_Tree-planting_Projects_A_Case_Study_of_the_Ten_Billion_Tree_Tsunami_Programme_Pakistan/26430589?file=48079915 (accessed on 17 January 2025).
  69. Haq, F.; Mark, B.G.; Shum, C.K.; Zeballos-Castellon, G.; Rahman, G. Effectiveness of Billion Trees Tsunami Afforestation Projects in Restoration of Forests in Pakistan. Environ. Dev. Sustain. 2024, 1–16. [Google Scholar] [CrossRef]
  70. Firdaus, K.; Matin, A.M.A.; Nurisman, N.; Magdalena, I. Numerical Study for Sunda Strait Tsunami Wave Propagation and Its Mitigation by Mangroves in Lampung, Indonesia. Results Eng. 2022, 16, 100605. [Google Scholar] [CrossRef]
  71. Chen, C.; Peng, C.; Yan, H.; Wei, M.; Wang, T. Experimental Study on the Mitigation Effect of Mangroves during Tsunami Wave Propagation. Acta Oceanol. Sin. 2023, 42, 124–137. [Google Scholar] [CrossRef]
  72. Chen, C.; Peng, C.; Nandasena, N.A.K.; Yan, H. Experimental Investigation on Tsunami Impact Reduction on a Building by a Mangrove Forest. Estuar. Coast. Shelf Sci. 2024, 301, 108756. [Google Scholar]
  73. Nandasena, N.A.K.; Chen, C.; Hasan, D.; Alsereidi, M.; Almansoori, F.; Gabir, F. Experimental Investigation into the Usage of Date Palm Forests to Mitigate Tsunamis in the Middle East. Landsc. Ecol. Eng. 2024, 20, 397–413. [Google Scholar] [CrossRef]
  74. Dobhal, S.; Kumar, R.; Bhardwaj, A.K.; Chavan, S.B.; Uthappa, A.R.; Kumar, M.; Singh, A.; Jinger, D.; Rawat, P.; Handa, A.K.; et al. Global Assessment of Production Benefits and Risk Reduction in Agroforestry during Extreme Weather Events under Climate Change Scenarios. Front. For. Glob. Change 2024, 7, 1379741. [Google Scholar] [CrossRef]
Figure 1. Study area, geology, and the existence of seismic gap (sources: [7,8,9]). (a) The study area is located on Java Island, highlighting the boundary between the Eurasian Plate and the Indo-Australian Plate in the southern part of the island, (b) the detail of geological formation in the study area, (c) the study area is situated within the country’s setting, emphasising the interaction between tectonic plates, (d) the study area and the seismic gap location.
Sustainability 17 02564 g001
Figure 2. Research framework.
Sustainability 17 02564 g002
Figure 3. Tsunami inundation model parameters.
Sustainability 17 02564 g003
Figure 4. Tsunami vulnerability parameters.
Sustainability 17 02564 g004
Figure 5. Tsunami height monitoring in four stations. (a) Pacitan Bay, (b) Soge beach, (c) Taman beach, (d) Watukarung beach.
Sustainability 17 02564 g005
Figure 6. Tsunami propagation model.
Sustainability 17 02564 g006
Figure 7. Tsunami hazard distribution.
Sustainability 17 02564 g007
Figure 8. Tsunami hazard map.
Sustainability 17 02564 g008
Figure 9. Vulnerability distribution.
Sustainability 17 02564 g009
Figure 10. Tsunami vulnerability map.
Sustainability 17 02564 g010
Figure 11. Tsunami risk distribution.
Sustainability 17 02564 g011
Figure 12. Tsunami risk map.
Sustainability 17 02564 g012
Figure 13. Potential areas for tsunami protection.
Sustainability 17 02564 g013
Table 1. Fault Parameters of Tsunami Propagation Simulation.
NoParameterValue
1Magnitude Mw 8.8
2Latitude−10.293911°
3Longitude111.110538°
4Depth30 km
5Width130 km
6Length250 km
7Strike (°)278
8Dip (°)16
9Slip/Rake (°)90
10Dislocation/Slip (m)15
Table 2. Vulnerability criteria.
NoFactorClassificationDegree of VulnerabilityScoreWeight (%)
1Population0–12Very Low150
13–37Low2
38–75Moderate3
76–127High4
128–290Very High5
2Type of land coverWaterbody, wetlandsVery Low125
Barren lands, savannas, shrublands, grasslandLow2
Forest and similar vegetation typeModerate3
Croplands and similar cover typeHigh4
Urban and Built-up LandsVery high5
3Built-up surfaceNon-built-up surfaceVery low125
Built-up surfaceVery high5
Disclaimer/Publisher’s Note: The statements, opinions and data contained in all publications are solely those of the individual author(s) and contributor(s) and not of MDPI and/or the editor(s). MDPI and/or the editor(s) disclaim responsibility for any injury to people or property resulting from any ideas, methods, instructions or products referred to in the content.

