Article

The Impact of Digital Transformation on the Export Technology Complexity of Manufacturing Enterprises: Based on Empirical Evidence from China

School of Economics and Business Administration, Heilongjiang University, Harbin 150080, China
*
Author to whom correspondence should be addressed.
Sustainability 2025, 17(6), 2596; https://doi.org/10.3390/su17062596
Submission received: 16 February 2025 / Revised: 11 March 2025 / Accepted: 14 March 2025 / Published: 15 March 2025
(This article belongs to the Section Economic and Business Aspects of Sustainability)

Abstract

:
In the context of increasing external competition uncertainty and the growing maturity of digital information technology applications, digital transformation has become the crucial pathway for manufacturing enterprises to respond to market changes, enhance comprehensive competitiveness, and achieve sustainable development. In order to promote the effective implementation of the digital transformation strategy of manufacturing enterprises and enhance their export technological complexity, this paper, based on data from Chinese manufacturing listed companies and customs trade data, uses a multiple fixed effects model to explore the impact of digital transformation on the technological complexity of manufacturing exports. The results show that digital transformation significantly improves the export technological complexity of manufacturing enterprises, with innovation capability and production efficiency as the mediators. Further analysis of the research results reveals that supply chain integration and dynamic capabilities amplify these effects, exhibiting significant heterogeneity in terms of firm ownership, technological intensity, industry competition, geographic region, and stages of digital transformation. The research conclusions of this paper are of great significance for manufacturing enterprises to enhance their competitiveness in international markets and achieve sustainable development through digital transformation. However, its dependence on single-country data and fixed-period analysis limits its universality and applicability. These insights highlight the necessity of future research on the global applicability and long-term sustainability of digital transformation strategies in the manufacturing industry.

1. Introduction

As a major global manufacturing hub, China is home to over 6 million manufacturing enterprises. In 2023, industrial manufactured goods represented 95.1% of the country’s total exports. China has undeniably established itself as a major manufacturing nation. However, its manufacturing exports face two significant challenges in terms of international competitiveness. First, labor-intensive industries have experienced a gradual decline in their competitive advantage due to the ongoing rise in labor costs. Second, technology-intensive industries remain highly reliant on the importation of core technologies [1]. In the context of profound changes in global economic relations, the sustainable development of Chinese manufacturing enterprises faces significant challenges, and their export trade urgently needs to shift from being large to strong. In recent years, the rapid development of the digital economy has provided a significant opportunity to strengthen the export trade competitiveness of manufacturing enterprises. The “14th Five-Year Plan for National Economic and Social Development of the People’s Republic of China (2021–2025)” clearly proposes digital transformation as a key driver for economic development and growth; it explicitly points out that digital transformation is a critical driver of economic development and that industrial digital transformation should be vigorously promoted. The extent of digital transformation reveals the ability and extent to which enterprises leverage digital technologies to improve efficiency and innovate value creation models in order to adapt to market changes and achieve sustainable development. In the context of Industry 4.0, 3D printing technology has revolutionized design and manufacturing processes in industries such as aerospace, automotive, and biomedical through its flexibility in the use of geometric shapes and materials [2]. Additionally, the development of digital product passports (DPPs) enables the tracking of sustainability information and, when integrated with comprehensive data management systems for production environments, effectively addresses the sustainability demands of the nonwoven fabric industry [3]. The digital transformation of manufacturing is driven by the application of next-generation information technologies to promote the upgrading and transformation of manufacturing enterprises, which helps companies gain sustainable competitive advantages [4]. Typically, export technological complexity serves as an indicator for assessing the quality of export trade [5]. Therefore, improving export technological complexity can significantly enhance export competitiveness. This leads to the question: can digital transformation improve the technological complexity of exports in manufacturing enterprises? What mechanisms facilitate this improvement? This paper attempts to answer these questions, aiding Chinese manufacturing enterprises in improving their international trade competitiveness and achieving sustainable development.

2. Literature Review

2.1. Research on the Connotation of Digital Transformation

Digital transformation currently lacks a unified definition. Vial (2019) defines digital transformation as a process that leverages next-generation digital technologies, including artificial intelligence, blockchain, big data, and cloud computing, to optimize business operations, enhance efficiency, and reshape value creation models [6]. This process encompasses both technological and strategic dimensions. To adapt to a rapidly evolving digital landscape, companies must reshape their vision, strategy, organizational structure, processes, capabilities, and culture [7]. From a technological perspective, digital transformation entails utilizing digital technologies to shift traditional businesses from a product-oriented to a service-oriented business model [8]. According to the Development Research Center of the State Council, “digital transformation refers to the application of next-generation information technologies to establish a closed loop for data collection, transmission, storage, processing, and feedback, breaking down data silos across different levels and industries, improving overall industry efficiency, and constructing a new digital economy system”. The scope of digitalization is broad, covering areas such as blockchain technology, Internet of Things systems, cloud computing platforms, artificial intelligence, and, more broadly, information technology [9]. The integration of digital tools plays a pivotal role in advancing sustainable development, as their application not only enhances management practices but also creates a ripple effect of complementary benefits. This dynamic interplay fosters a mutually reinforcing relationship, driving progress in both areas [10]. From a strategic perspective, digital transformation often begins with changes to existing business and operating models, which subsequently leads to a broader transformation in enterprise collaboration methods. If implemented correctly, it can ultimately trigger a deeper cultural transformation within the organization [11].

2.2. Research on the Factors Influencing Export Technological Complexity

In recent years, numerous studies have examined the factors influencing export technological complexity. From the perspective of the country, increasing foreign direct investment, promoting technology spillovers from processing trade, and increasing infrastructure investment all help to enhance export technological complexity [12,13,14]. From the industry level, factors such as foreign knowledge spillovers and technology transfer, environmental regulations, the enhancement of the service-oriented level, integration into global value chains, and industrial agglomeration can improve industry export technological complexity [15,16,17,18,19,20]. As scholars have deepened their understanding of micro-level databases, research on export technological complexity has gradually shifted to the micro level. From both the enterprise and industry levels, import trade liberalization has promoted an increase in enterprise export technological complexity [21]. The exodus of foreign investment tends to put a damper on a company’s export performance [22], whereas rolling out green innovation initiatives can give a boost to the technological sophistication of exports [23].

2.3. Research on the Impact Pathways of Digital Transformation on Firms’ Export Technological Complexity

Promoting innovation in science and technology, improving total factor productivity, and diversifying export markets collectively enhance the stability of firm exports [24]. Digital transformation can improve human capital, alleviate financing constraints, and reduce costs to enhance export technological complexity [25]. It can also facilitate export technological upgrading through mechanisms such as promoting knowledge spillovers, accelerating the marketization process, and diversifying demand [26]. Furthermore, digital transformation enables firms to break through the growth bottleneck of export volumes. When digital activities, such as digital connectivity intensity and the provision of digital skilled talent, reach a certain threshold, digital transformation will demonstrate a positive driving effect [27] With the continuous improvement of regional digital infrastructure, the positive effects of digital transformation on export product quality will also increase accordingly. Digital transformation is increasingly becoming the focal point for firms. To integrate digital technologies, companies must allocate new resources and manage them effectively through specific functions, making necessary investments and transforming internal operations accordingly [28].

2.4. Research Gap

In conclusion, there is no universally accepted definition of digital transformation, and research on the factors influencing export technological complexity has mainly focused on the macro level, with relatively limited studies at the micro level. In studies on the impact pathways of digital transformation on export technological complexity, most scholars concentrate on areas such as technological innovation, human capital, knowledge spillovers, and export markets, leaving certain gaps in the research. Against this backdrop, this study seeks to explore the mechanisms by which digital transformation drives the technological sophistication of exports in manufacturing enterprises, while shedding light on the pivotal role of moderating factors.
In contrast to prior research, this paper’s key contributions are as follows: (1) With respect to research perspective, this paper utilizes data from Chinese manufacturing enterprises and employs a methodology that integrates combining industry export technological complexity with total factor productivity for calculation [5,29]. (2) Regarding the influencing mechanism, this paper innovatively incorporates the moderating effects of dynamic capabilities and supply chain integration, providing new insights into the mechanisms driving export technological complexity. (3) In terms of content expansion, this paper conducts an in-depth analysis of the variations arising from different firm characteristics, industry characteristics, regional factors, and stages of digital transformation in the process of enhancing export technological complexity through digital transformation, thus addressing the limitations of previous studies on heterogeneity analysis.

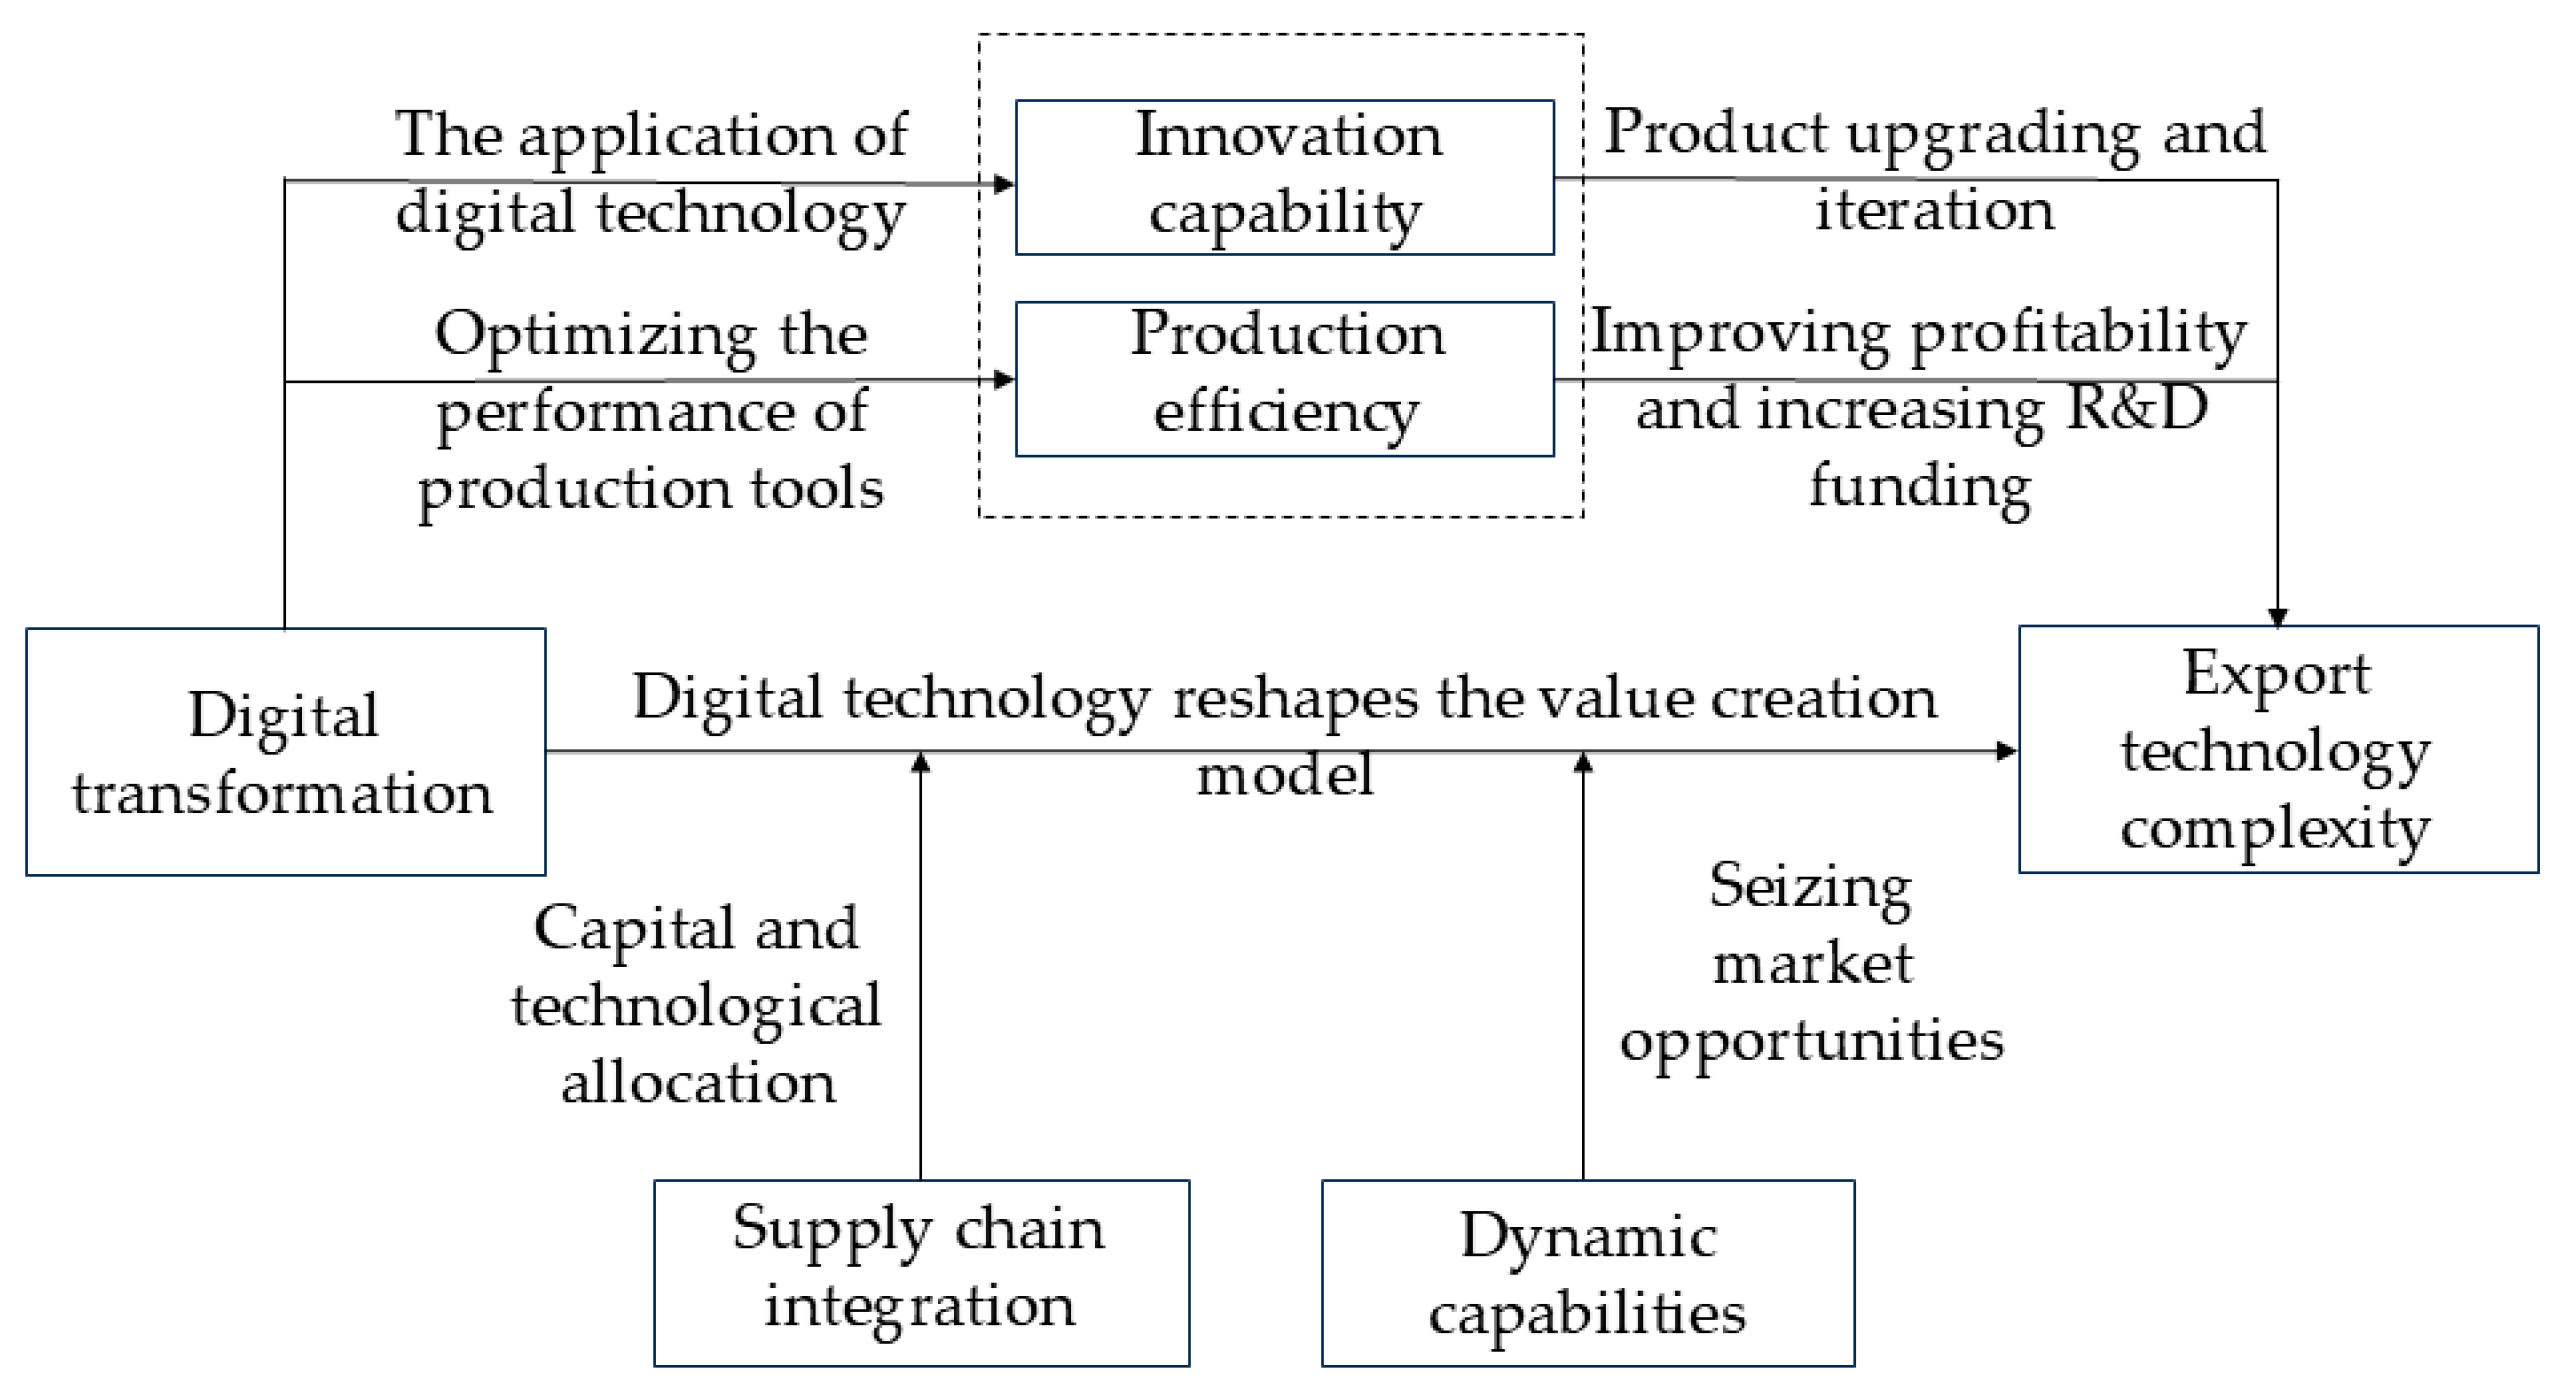
3. Theoretical Analysis and Research Hypotheses

3.1. Direct Mechanism Analysis

Export technological complexity reflects the technological content of a country’s or region’s exported products and its position in the international division of labor [5]. Existing research indicates that factors such as technological innovation, improvements in firm production efficiency, enhanced institutional quality, and increased investment in research and development (R&D) all contribute to an increase in export technological complexity [30,31,32]. Digital transformation, on the other hand, involves the process through which firms leverage digital technologies to reshape value creation models, optimize business processes, and enhance efficiency [33]. In this process, firms optimize internal equipment and processes, establish shared databases for the entire product lifecycle, process the data and generate useful information, and simulate production processes, thereby achieving digital management and improving production efficiency [34]. For traditional firms, digital transformation involves the deep integration of digital technologies into key stages such as production, manufacturing, sales logistics, and product innovation. Its integration with traditional industries not only stimulates technological innovation within firms but also reshapes their innovation models and systems, thereby significantly enhancing total factor productivity [35]. The digital transformation plays a crucial role in boosting production efficiency and enhancing innovation capabilities, positioning it as a key driving force for increasing the export technological complexity of Chinese manufacturing firms. Building on this, this paper puts forward the following hypothesis:
Hypothesis 1 (H1).
Digital transformation can promote the improvement of firms’ export technological complexity.

3.2. Indirect Mechanism Analysis

3.2.1. The Mediating Effect of Innovation Capability

Digital transformation enhances a firm’s export technological complexity by stimulating its innovation capability. Schumpeter categorized innovation into five distinct types: product innovation, technological innovation, market innovation, resource allocation innovation, and organizational innovation. In this paper, the enhancement of innovation capability mainly refers to the improvement of product innovation capability. This innovation relies not only on technological innovation but also on innovations in business models. Through innovation, enterprises can develop new products or services to meet new consumer demands. The improvement in product technological content and quality upgrades relies on product innovation, and the process of upgrading products is essentially a reflection of the continuous progress of technological innovation [36]. From the perspective of the firm’s internal operations, the digital transformation of enterprises helps promote innovation, improve internal control quality, optimize governance structures, and provides strong support for the sustainable development of enterprises [37]. The digital transformation of traditional enterprises has given rise to the “digital technology + industry” model. This model breaks down departmental barriers and promotes the release and circulation of innovation resources and capabilities that were originally confined to internal processes. From an external perspective, digital transformation enables enterprises to accelerate knowledge sharing and value co-creation with external stakeholders, accurately capture market demand, formulate appropriate R&D and innovation strategies, enhance technological innovation capabilities, and drive economic value creation, thereby increasing corporate value. By unlocking internal innovation potential and precisely responding to external market needs, enterprises achieve deep integration of new and existing businesses across multiple dimensions, including resources, technology, products, and customers. This not only promotes the transformation and upgrading of enterprises but also triggers a significant “multiplier effect”, greatly accelerating the explosive growth of innovation capabilities [38]. Through the widespread application of digital technologies, traditional manufacturing firms have successfully transformed into intelligent manufacturing enterprises, thereby enhancing their technological innovation strength [39]. As the internet becomes more widely accessible, the business environment is increasingly characterized by uncertainty and complexity. In this context, cross-system digital transformation strategies have become key approaches for firms to deepen customer insights, optimize management decisions, and drive continuous innovation and evolution of business models. Through digital technologies, firms can gain a more comprehensive understanding of customer needs, effectively reduce management decision-making biases caused by information asymmetry, and continuously adapt their business models to market changes, leading to innovation and upgrades. Building on this, this paper proposes the following hypothesis:
Hypothesis 2 (H2).
Digital transformation can promote the improvement of export technological complexity by enhancing a firm’s innovation capability.

3.2.2. The Mediating Effect of Production Efficiency

Digital transformation enhances export technological complexity by improving a firm’s production efficiency. The increase in manufacturing productivity is driven by the rapid development of internet technologies, which, in turn, depend on the enhancement of manufacturing technological capabilities. In the digital economy era, many enterprises seek high performance and high efficiency through digital transformation, while reducing costs, thereby driving their sustainable development [40]. Firms with higher productivity typically possess stronger profitability, enabling them to bear high research and development costs and the fixed costs associated with export markets, thereby fostering the enhancement of export technological complexity [41]. The improvement of production efficiency relies on the upgrading of production tools and the enhancement of workforce quality. The widespread adoption of digital technologies has greatly optimized the performance of production tools, leading production equipment into a new era of intelligence. Smart hardware efficiently collects data through its extensive connectivity features, while the software layer intelligently analyzes and makes decisions based on pre-programmed instructions. This process effectively shortens machine maintenance cycles, reduces downtime caused by failures, optimizes production process transitions, and lowers operational costs, thereby improving production efficiency [42]. For example, Siemens’ digital factory uses industrial IoT and artificial intelligence technologies to implement intelligent production equipment monitoring and predictive maintenance in its global factories to improve production efficiency. Moreover, digital technologies enable firms to comprehensively collect and analyze information across all stages, from research and development design to finished product sales, enhancing information flow efficiency across the industrial chain, and enable fine-grained management of the entire product lifecycle. This transformation not only reduces production costs and management expenses but also promotes the optimal allocation of supply chain resources, laying the foundation for the enhancement of export technological complexity [43]. Based on this, this paper proposes the following hypothesis:
Hypothesis 3 (H3).
Digital transformation can promote the improvement of export technological complexity by enhancing a firm’s production efficiency.

3.3. Moderating Mechanism Analysis

3.3.1. The Moderating Effect of Supply Chain Integration

Supply chain integration refers to strategic collaboration between a firm and its supply chain partners to jointly manage both internal and external business processes. The goal is to achieve the efficient flow of products, services, decisions, information, and capital at the lowest cost and fastest speed, thereby maximizing value for customers [44]. Digital transformation is not merely an adjustment of technological equipment but a deep-seated industrial revolution. In the early stages of transformation, firms need significant capital investment, and the transformation process is long and costly. Many firms struggle to meet the high demand for talent, funding, and technology during this period. Moreover, digital transformation is accompanied by high trial-and-error costs and risks, which weaken the internal motivation for transformation [45]. Supply chain integration supports the digital transformation of enterprises by optimizing resource allocation. It can efficiently allocate R&D funds and human resources for R&D, thereby enhancing operational efficiency and facilitating the advancement of product export technological complexity [46]. On one hand, the supply chain connects producers, raw material suppliers, logistics service providers, financial intermediaries, distributors, and end consumers into a whole. By optimizing the management of capital flow within the supply chain network, the efficiency and effectiveness of capital flow are enhanced. In this process, all participants collaborate to ensure the efficient flow of funds, thereby meeting the financial needs of digital transformation [47]. On the other hand, by integrating supply chain management systems, enterprises can eliminate information silos between different departments, avoiding redundant work across departments. For example, the procurement, sales, and production departments can share key data through the same platform, reducing communication errors and manual coordination, thus effectively reducing human resource consumption. Therefore, supply chain integration is pivotal in driving digital transformation and enhancing export technological complexity. Based on this, this paper proposes the following hypothesis:
Hypothesis 4 (H4).
Supply chain integration plays a positive moderating role in the mechanism through which digital transformation affects a firm’s export technological complexity.

3.3.2. The Moderating Effect of Dynamic Capabilities

Teece and Pisano (1997) define dynamic capabilities as enterprises’ ability to integrate, develop, and reconfigure internal and external resources to adapt to evolving environments, primarily including opportunity sensing, resource integration, and organizational growth capabilities [48]. The theory of dynamic capabilities emphasizes that firms need to strategically build, adjust, and optimize their resource base in order to flexibly respond to rapidly evolving technological and market environments [48]. Through resource reconfiguration and continuous knowledge updates, firms can seize the opportunities created by market demand and technological changes, thereby gaining a competitive advantage [49]. Digital transformation is a progressive process, particularly for traditional manufacturing enterprises, and is fraught with uncertainty. It not only requires firms to have a long-term strategic vision but also to carefully evaluate return on investment, as not all investments immediately translate into significant economic benefits [50]. In this process, high levels of dynamic capability are crucial, representing the firm’s comprehensive capacity for resource allocation, innovation, and environmental adaptation. Rapid fluctuations in market demand and accelerated technological advancements significantly shorten product and technology lifecycles, making opportunity windows more fleeting and valuable. Dynamic capabilities help firms keenly perceive shifts in customer needs and technological progress, enabling more efficient identification and forecasting of new market trends and technological development paths, thus achieving sustainable development for enterprises [51]. Therefore, in a rapidly changing market environment, dynamic capabilities provide strong support for enterprises undergoing digital transformation. Consequently, this paper proposes the following hypothesis:
Hypothesis 5 (H5).
Dynamic capabilities play a positive moderating role in the mechanism through which digital transformation influences the export technological complexity of firms.
Based on the above analysis, it can be concluded that digital transformation directly drives the increase in manufacturing export technological complexity. At the same time, through the application of digital technologies and optimizing the performance of production tools, the innovation capabilities and production efficiency of enterprises are enhanced, leading to product upgrades and improved profitability. More R&D funds are invested in product innovation, which in turn increases the technological complexity of product exports. In this process, supply chain integration supports the digital transformation of enterprises by coordinating the relationships of various stakeholders and enhancing information flow between departments, thereby optimizing the allocation of funds and technologies. Furthermore, dynamic capabilities are an indispensable part of this process. Enterprises with stronger dynamic capabilities are better able to seize market opportunities, thus avoiding blindly following transformation trends. Therefore, this paper establishes the following mechanism model (See Figure 1):

4. Research Method and Data

4.1. Model Setup

4.1.1. Direct Effects Model

To examine the impact of digital transformation on the export technological complexity of manufacturing enterprises, this paper adopts a multiple fixed effects model for analysis. The model is specified as follows:
E s i e t = α 0 + α 1 D i g i t a l e t + α 2 C o n t r o l s e t + F i r m e + Y e a r t + I n d u s t r y i + P r o v i n c e c + ɛ e t i c
In this model, the subscripts e, t, i, and c correspond to firm, year, industry, and province, respectively. The dependent variable E s i e t represents the export technological complexity of firm i in year t. α is the constant term; the core explanatory variable D i g i t a l e t represents the extent of digital transformation of firm i in year t. C o n t r o l s e t represents a set of control variables. F i r m e , Y e a r t , I n d u s t r y i , and P r o v i n c e c denote the fixed effects for firm, year, industry, and province, respectively. ɛ e t i c is the error term.

4.1.2. Indirect Effects Model

Based on the previous analysis, digital transformation primarily enhances firms’ export technological complexity by improving innovation capability and production efficiency. Therefore, this paper needs to test the mediating effects of innovation capability and production efficiency. Building on Equation (1), the following mediating effect model is specified:
I n n o v e t = β 0 + β 1 D i g i t a l e t + β 2 C o n t r o l s e t + F i r m e + Y e a r t + I n d u s t r y i + P r o v i n c e c + ɛ e t i c
E s i e t = γ 0 + γ 1 D i g i t a l e t + γ 2 I n n o v e t + γ 3 C o n t r o l s e t + F i r m e + Y e a r t + I n d u s t r y i + P r o v i n c e c + ɛ e t i c
T F P e t = δ 0 + δ 1 D i g i t a l e t + δ 2 C o n t r o l s e t + F i r m e + Y e a r t + I n d u s t r y i + P r o v i n c e c + ɛ e t i c
E s i e t = θ 0 + θ 1 D i g i t a l e t + θ 2 T F P e t + θ 3 C o n t r o l s e t + F i r m e + Y e a r t + I n d u s t r y i + P r o v i n c e c + ɛ e t i c
where I n n o v i t and T F P i t represent innovation capability and production efficiency, respectively. Equation (2) is employed to examine the impact of digital transformation on the mediating variable innovation capability. Equation (3) tests the mediating effect of innovation capability in the process through which digital transformation influences firms’ export technological complexity. Equation (4) examines how digital transformation influences the mediating variable production efficiency, while Equation (5) tests the mediating effect of production efficiency in the process through which digital transformation affects firms’ export technological complexity.

4.1.3. Moderating Effects Model

Based on the previous analysis, supply chain integration and dynamic capabilities serve as positive moderating factors in the process through which digital transformation enhances export technological complexity. To test this hypothesis, the following model is developed:
E s i e t = φ 0 + φ 1 D i g i t a l e t + φ 2 S C I e t + φ 3 D i g i t a l e t S C I e t + φ 4 C o n t r o l s e t + F i r m e + Y e a r t + I n d u s t r y i + P r o v i n c e c + ɛ e t i c
E s i e t = ω 0 + ω 1 D i g i t a l e t + ω 2 D C e t + ω 3 D i g i t a l e t D C e t + ω 4 C o n t r o l s e t + F i r m e + Y e a r t + I n d u s t r y i + P r o v i n c e c + ɛ e t i c
where S C I e t represents the moderating variable of supply chain integration, and D i g i t a l e t S C I e t represents the interaction term between digital transformation and supply chain integration. D C e t represents the moderating variable of firm dynamic capabilities, and D i g i t a l e t D C e t represents the interaction term of digital transformation and dynamic capabilities. Other variables are consistent with those in Equation (1). Equation (6) is employed to test the moderating effect of supply chain integration, and Equation (7) tests the moderating effect of dynamic capabilities. To avoid multicollinearity, the interaction terms are centered in this study.

4.2. Variable Measurement and Description

4.2.1. Dependent Variable: Export Technological Complexity (Esi)

Export technological complexity is an important indicator for measuring the technological content of a country’s or region’s export products and its position in the international division of labor. This indicator is based on the research methodology of Hausmann et al. (2007) and evaluates complexity by analyzing the technological content of export products and the knowledge intensity in the production process [5].
The level of export technological complexity reflects the technological difficulty and knowledge intensity involved in the production process of export products. Products with higher technological content typically require more advanced production technologies and more complex design and R&D processes, thus their export technological complexity is also higher. For example, the export technological complexity of high-end manufacturing products (such as aerospace equipment, precision instruments, etc.) is much higher than that of traditional labor-intensive products (such as textiles, toys, etc.). In addition, export technological complexity also reflects the position of enterprises in the international division of labor. If a country or region is able to export products with high technological complexity, it typically indicates that it holds a high-end position in the international division of labor and is able to capture higher added value and profits.
From the perspective of export trade quality, the improvement of export technological complexity has significant expected impacts. First, products with high technological complexity typically have higher added value, which can bring greater economic benefits to enterprises and countries. Second, the improvement in technological complexity helps enhance the competitiveness of enterprises in international markets, enabling them to better cope with competitive pressures from other countries. Finally, the improvement in export technological complexity can also facilitate industrial upgrading, driving the economic structure toward higher-end and intelligent development, thereby improving the overall economic quality and sustainable development capacity of a country or region.
In this paper, we further refine the enterprise export technological complexity indicator by combining industry export technological complexity with total factor productivity. This approach provides a more accurate reflection of the technological content of export products and the enterprise’s position in the international division of labor. The introduction of this indicator provides a crucial analytical foundation for investigating the impact of digital transformation on the export technological complexity of manufacturing enterprises.
The export technological complexity of the firm is the dependent variable in this study. First, following the method proposed by Hausmann et al. (2007), the export technological complexity at the industry level is measured using the following formula [5]:
E s i i = Σ c x c i / X c Σ x c i / X c p c g d p c
where E s i i represents the export technological complexity of industry i, x c i represents the export value of industry i in region c, and X c is the total export value of region c. p c g d p c indicates the region-weighted GDP per capita of the exporting area. Since approximately 90% of China’s exports are concentrated in the nine coastal provinces, using the national GDP per capita to measure export technological complexity may underestimate the actual economic development level reflected by the export complexity in these provinces. Therefore, following the approach of Xu (2010), this study replaces the national GDP per capita with the region-weighted GDP per capita to make adjustments [52].
Additionally, this indicator overlooks product quality differences, especially considering that China’s exports primarily consist of primary goods, and processing trade may result in high-tech complexity products mixed with low-quality goods. Xu (2010) proposed a unit value index for “quality” adjustment of export technological complexity [52]. However, some scholars argue that issues like factor price distortion in China mean that price differences reflect cost differences rather than quality differences. Therefore, this study employs the total factor productivity (TFP) of enterprises to adjust the model and derive the enterprise export technological complexity index [29]:
E s i e = t f p e t f p i E s i i
where E s i e represents the export technological complexity of enterprise e, t f p e denotes the total factor productivity (TFP) of enterprise e, and t f p i refers to the TFP of industry i. The TFP is calculated using the LP (Levinsohn and Petrin) method. For convenience in subsequent data analysis, the export technological complexity indicator is scaled down by a factor of 1010.

4.2.2. Independent Variable: Digital Transformation (Digital)

The digital transformation is treated as the independent variable in this study. Firstly, we used a Python 3.11.5 web crawler to collect annual reports from A-share listed manufacturing companies in the Shanghai and Shenzhen stock markets from 2010 to 2022 and converted them into text format. Then, we conducted word segmentation and frequency analysis on the sample to identify high-frequency terms that are closely associated with digital transformation. Next, we supplemented this with keywords from the existing literature and constructed a digital transformation dictionary, which covers digital transformation terms in four aspects: digital technology applications, internet business models, smart manufacturing, and modern information systems. In the end, we analyzed how often these keywords appeared in the annual reports of all publicly traded manufacturing companies and utilized the entropy method to create a digital transformation feature index [53].

4.2.3. Mediating Variables

This paper selects two mediating variables, namely, innovation capability and production efficiency. The specific measurement methods are as follows: (1) Innovation Capability (Innov): it measures the total number of patent applications plus one to take the logarithm [54]; (2) Production efficiency (TFP): to distinguish from the total factor productivity used in the earlier part of the text to measure the export technological complexity of enterprises, this paper adopts the total factor productivity of the enterprise measured by the OP method [55].

4.2.4. Moderating Variables

The moderating variables considered in this study are supply chain integration and dynamic capabilities. (1) Supply chain integration (SCI): The degree of supply chain integration is measured by the average of the sum of the ratio of the purchase amount from the top five suppliers to the total annual purchase amount and the ratio of the sales amount to the top five customers to the total annual sales amount [56]. (2) Dynamic capabilities (DCs): Dynamic capabilities are categorized as opportunity sensing, resource integration, and organizational growth capabilities [48]. Based on this framework, this study measures opportunity sensing capability using the number of patent applications and the ratio of R&D expenditure to operating revenue; resource integration capability is assessed using the ratio of intangible assets; and organizational growth capability is evaluated using the total asset growth rate and net profit growth rate. Ultimately, the standardized average of these five indicators is used to determine the firm’s dynamic capabilities index [57].

4.2.5. Control Variables

This study selects the following control variables [58,59]: (1) Government Subsidies (Lnsub): government subsidies plus one, then take the logarithm for measurement; (2) Firm Age (Age): the difference between the current year and the year of the company was established; (3) Firm Size (Size): the number of employees; (4) Operating Profit Margin (Profit): the ratio of operating profit to sales revenue; (5) Financing Constraints (Fincon): the ratio of interest to fixed assets; (6) Capital Intensity (Lnklr): logarithm of the ratio of fixed assets to the ratio of the number of employees and one; (7) Firm Ownership Type (Soe): firms are classified as state-owned enterprises or non-state-owned enterprises according to ownership. (See Table 1).

4.3. Data Sources and Descriptive Statistics

This study utilizes data from Chinese manufacturing companies listed on the Shanghai and Shenzhen A-shares from 2010 to 2022 as the research sample. The selection of 2010 to 2022 as the research period is primarily driven by the following two considerations: First, the year 2010 serves as a pivotal starting point for the rapid growth of China’s digital economy. With the “12th Five-Year Plan for National Economic and Social Development of the People’s Republic of China (2011–2015)” explicitly proposing the strategic goal of deep integration of informatization and industrialization, digital technologies such as cloud computing and the Internet of Things were gradually promoted in manufacturing, laying the foundation for subsequent digital transformation, and 2022 is the most recent year for which data are available, reflecting the latest dynamics of digital transformation. Second, although the term “digital transformation” was formally introduced in 2012 [6], its core meaning (such as the application of digital technologies and the restructuring of business processes) had already appeared before 2010 through enterprise informatization construction and ERP system deployment [8]. Choosing 2010–2022 allows for capturing both the early technological accumulation phase of digital transformation (such as 2010–2015) and its mature development phase (such as the full implementation of the “Internet+” strategy after 2016). This time span helps to fully analyze the dynamic impact mechanism of digital transformation on export technological complexity.
The financial data of manufacturing enterprises in this study is sourced from the China Stock Market and Accounting Research Database. Export data are sourced from the China Customs Database. The manufacturing industry is reclassified and matched with the HS6 code [60]. Finally, the industry is classified into 23 subcategories of the manufacturing industry, and product export data are matched to the industry level (Table S1). The data processing method is as follows: (1) excluding ST, ST*, and PT category samples. These companies usually face significant operational volatility, and their exclusion reduces estimation bias caused by large fluctuations in operating conditions; (2) excluding samples with serious data missing; (3) the selected sample data were subjected to a two-sided 1% winsorization to reduce the impact of outliers [61].
Table 2 presents the descriptive statistical results of the main variables. The mean of the export technological complexity of manufacturing enterprises is 0.301, with a standard deviation of 0.387, a minimum value of 0.0008, and a maximum value of 2.098, which indicates that there are significant differences in the export technological complexity of manufacturing enterprises. The minimum value of digital transformation is 0, and the maximum value is 0.0539, suggesting that the digital transformation level of most enterprises is relatively low.

5. Results

5.1. Direct Effect Test

Table 3 displays the outcomes of digital transformation’s direct impact on export technological complexity in enterprises. Column (1) presents regression outcomes excluding the control variables and fixed effects. The digital transformation coefficient is positive and statistically significant at the 1% level, which provides preliminary evidence supporting the validity of Hypothesis 1. Column (2) includes the control variables, and Columns (3) and (4) progressively control for provincial and industry fixed effects based on Column (2). The regression results from Columns (2) to (4) show that after accounting for additional variables and fixed effects, the core explanatory variable’s coefficient stays positive, with its significance level unchanged. Column (4) shows that every 1-unit increase in the degree of digital transformation of manufacturing firms leads to a 5.127-unit increase in export technological complexity, further supporting Hypothesis 1.
The regression results incorporating control variables indicate that government subsidies have not had a significant impact on the improvement of export technological complexity. This may be because subsidies reduce production costs, leading to low-price competition in the market, which encourages firms to develop a low-profit model dependent on subsidies, thereby lacking the endogenous drive to improve export technological complexity. The age of the firm has a significant positive impact on export technological complexity. More mature firms are more likely to access cutting-edge technological resources and have stronger technological innovation capabilities, thus their export technological complexity is higher. Firm size also positively influences the export technological complexity. Larger firms, benefiting from economies of scale, can invest more in R&D activities, thereby enhancing their export technological complexity. Firms with stronger profitability also have higher export technological complexity. More profitable firms have more abundant capital, which can be used to upgrade production equipment, improve production efficiency, and promote technological innovation, thus increasing the technological complexity of their export products. The lower the financing constraints of a firm, the lower its export technological complexity. This may be due to the capital misallocation phenomenon in China; although financing constraints have eased, they still do not benefit the firms that truly need funding. Especially in China, 98% of small and medium-sized enterprises still face the dilemma of high financing thresholds and high costs [62].

5.2. Endogeneity Test

The aforementioned research may be subject to omitted variable bias, reverse causality, and other endogeneity issues. While digital transformation in enterprises is likely to promote an increase in export technological complexity, firms with higher export technological complexity may also have a stronger incentive to advance the process of digital transformation. To address these potential endogeneity concerns, this study employs instrumental variables and introduces exogenous shocks for testing.

5.2.1. Instrumental Variables Method

In this study, the explanatory variable is lagged by one period and employed as an instrumental variable. The lagged digital transformation level significantly influences the firm’s current attention to digital transformation, but theoretically, it does not have a direct impact on the firm’s future export technology complexity. This satisfies the exogeneity requirement for instrumental variables. Moreover, this research incorporates an additional instrumental variable, specifically the national internet penetration rate data with a one-year lag, alongside the interaction term derived from the regional count of fixed-line telephones in 1984 [63]. To verify the validity of the instrumental variable, we conducted an overidentification test. The Kleibergen–Paap rk LM statistic rejects the null hypothesis of non-identifiability at the 1% significance level, indicating that there is a significant correlation between the instrumental variable and the endogenous variable, and the model is identifiable. Furthermore, we use the Cragg–Donald Wald F-statistic to test the strength of the instrumental variable, and the statistic values are 1.6 × 10⁴ and 24.664, both of which exceed the critical value of 16.38 at the 10% significance level for the Stock–Yogo weak instrument identification test. Consequently, it rejects the null hypothesis of the weak identification of instrumental variables, indicating that the correlation between the instrumental variables and the endogenous variables is sufficiently strong.
Columns (1) and (2) of Table 4 display the two-stage least squares regression results using the instrumental variable IV1, while Columns (3) and (4) present the results for instrumental variable IV2. In the first-stage regression, we tested the correlation between the two instrumental variables and the endogenous explanatory variable (digital transformation level). The results show that the coefficients of the instrumental variables are significantly positive at the 1% level, indicating a strong correlation between the chosen instrumental variable and the endogenous variable, satisfying the relevance condition for instrumental variables. In the second-stage regression, we used the predicted values of the endogenous variable obtained from the first-stage regression for further analysis. The results show that the estimated coefficients of digital transformation are significantly positive, indicating that after controlling for endogeneity, the baseline regression results remain robust. The results of the instrumental variable method indicate that even after controlling for endogeneity issues, the positive impact of digital transformation on export technological complexity remains significant. This result further supports the conclusion of our direct effects test.

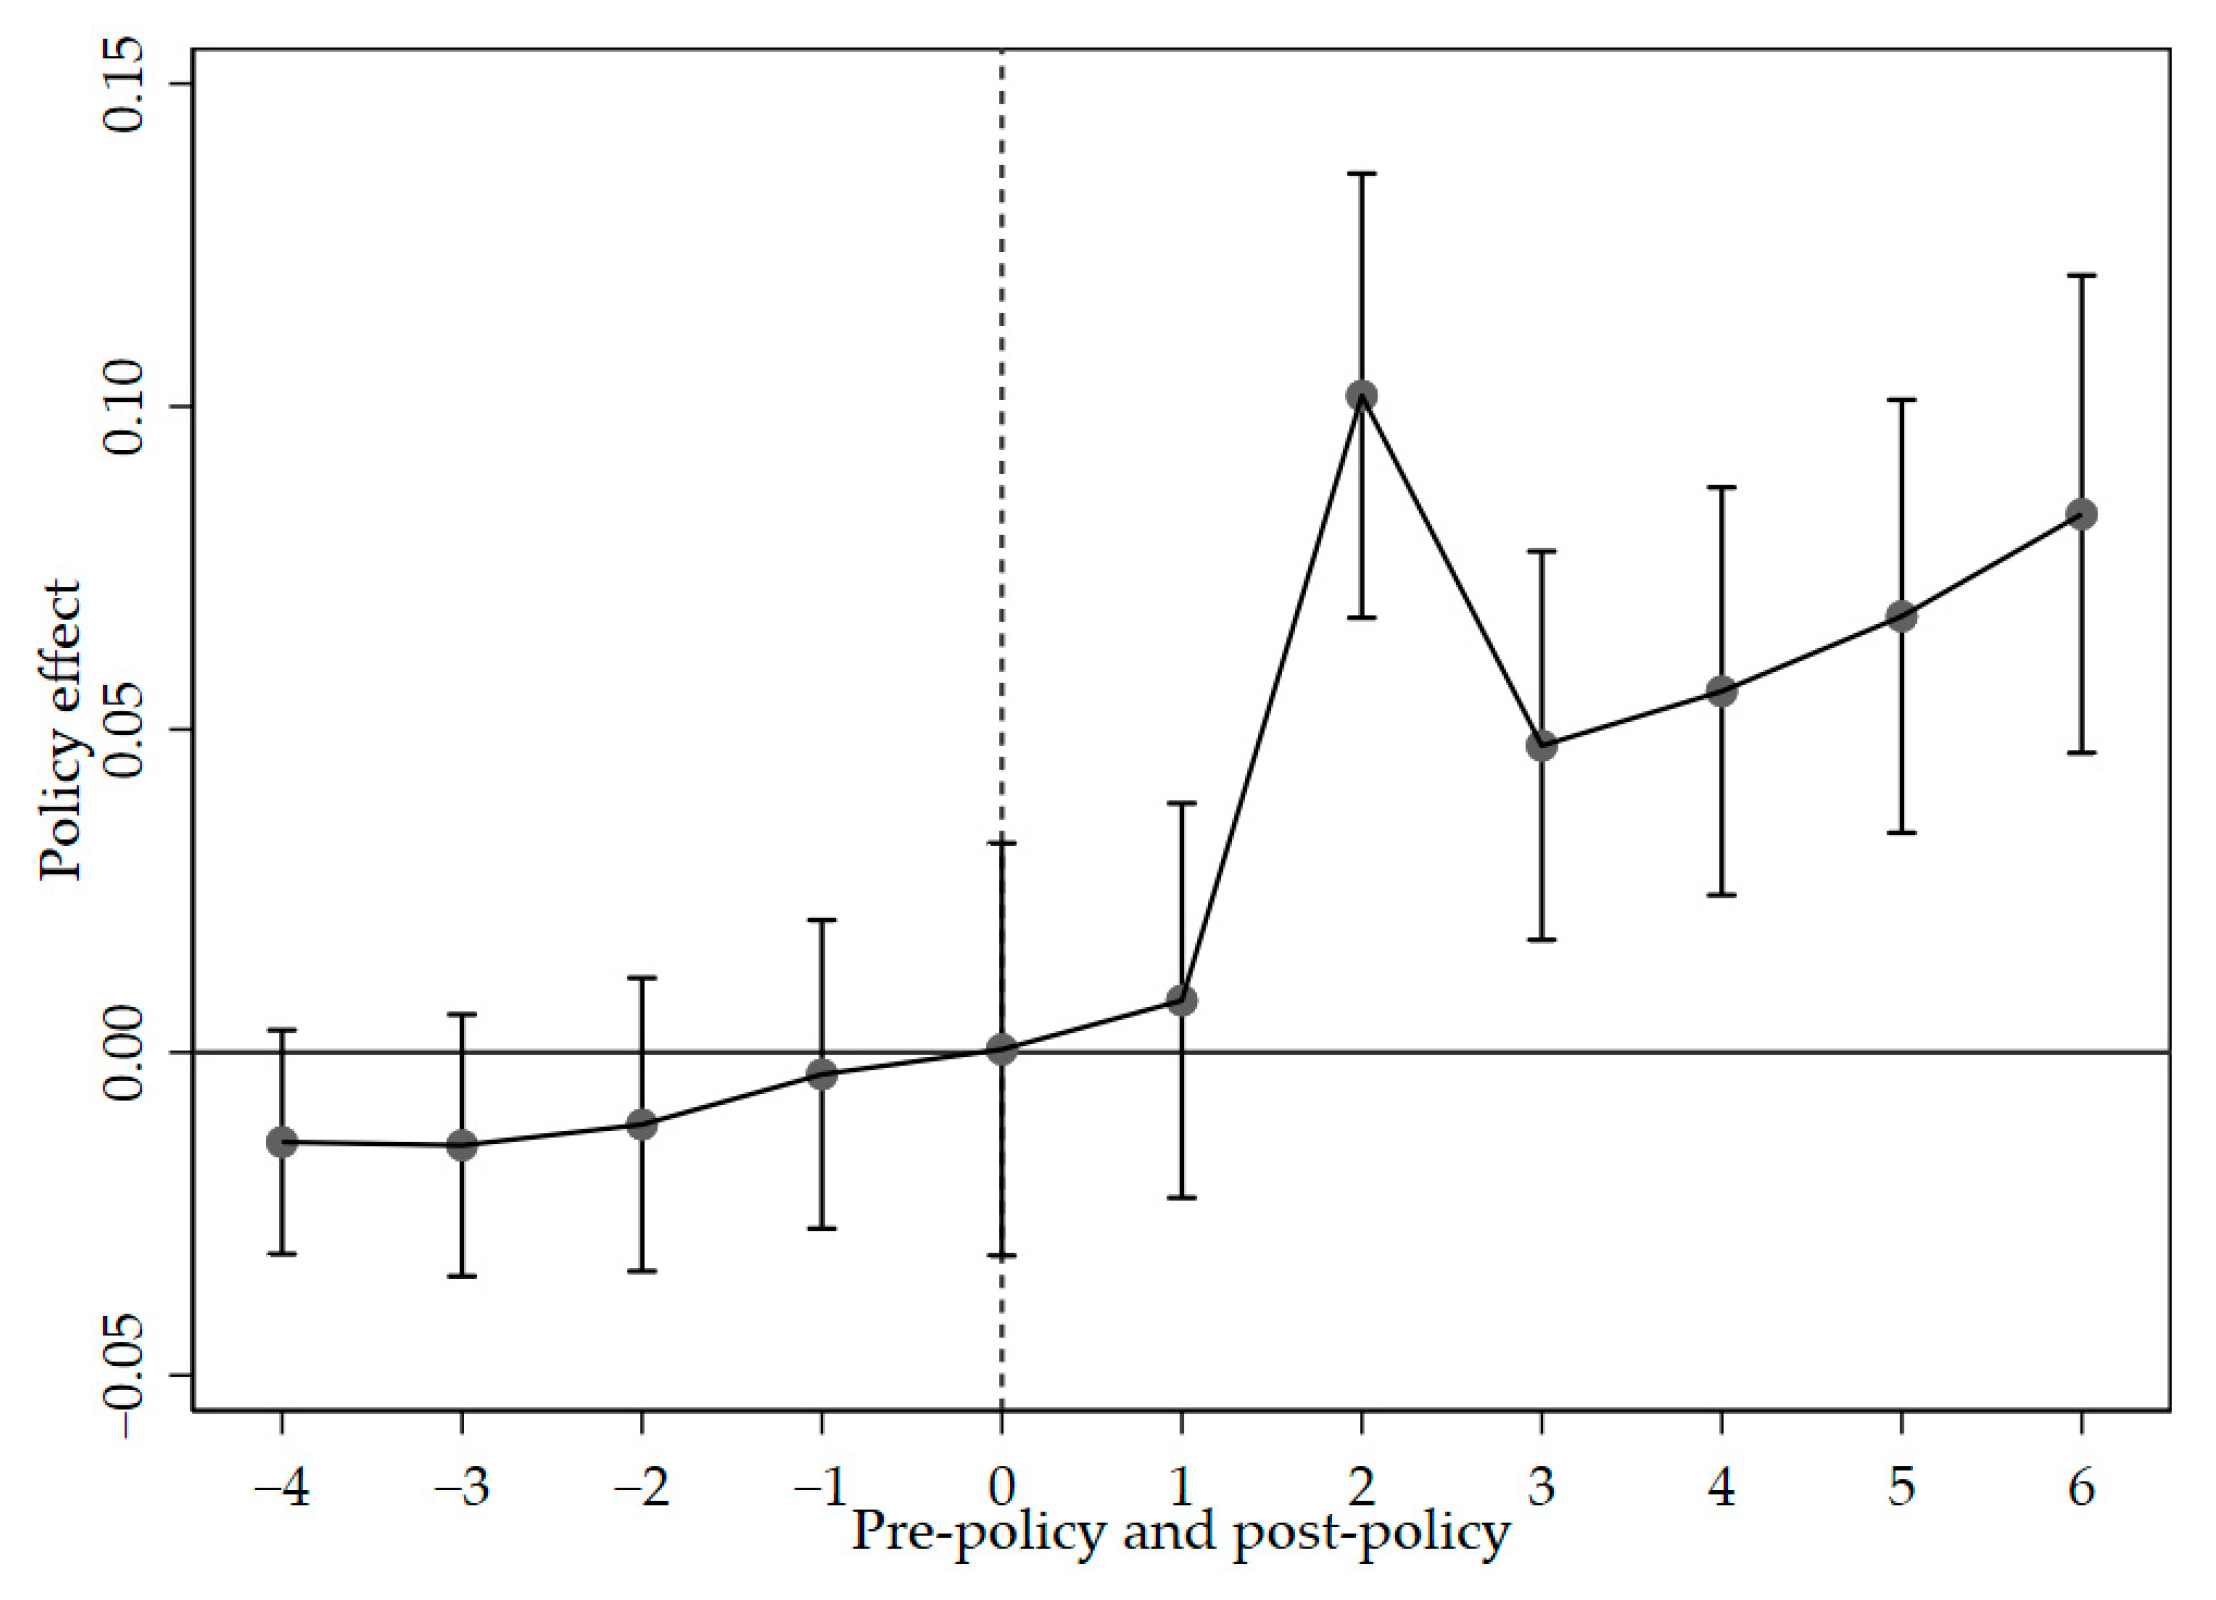
5.2.2. Exogenous Shock Testing Method

In August 2013, the State Council issued the “Notice on Printing and Distributing the ‘Broadband China’ Strategy and Implementation Plan”. Following this, the Ministry of Industry and Information Technology and the National Development and Reform Commission selected 120 cities (or city clusters) in three phases between 2014 and 2016 to serve as demonstration areas for the “Broadband China” initiative. These regions were required to actively expand the scale of broadband users, accelerate the upgrading of broadband networks, and extend network coverage to better meet the demands of economic and social development. Enterprise digital transformation relies on the support of information technology and data resources in the region where the enterprise is located. The development of the “Broadband China” pilot cities provides the necessary underlying resources for enterprise digital transformation. The widespread adoption of broadband networks enhances information flow and knowledge sharing, reduces the barriers to information access, and accelerates the process of digital transformation in enterprises. This policy positively influenced the digitalization of local enterprises [64]. This research approaches the policy as a quasi-natural experiment, employing a gradual difference-in-differences model for empirical testing. The specific model setup is as follows:
E s i e t = ϑ 0 + ϑ 1 D i d e t + ϑ 2 C o n t r o l s e t + F i r m e + Y e a r t + I n d u s t r y i + P r o v i n c e c + ɛ e t i c
Among them, D i d e t is a dummy variable that indicates whether the city where the enterprise e is registered in year t is designated as a “Broadband China” demonstration area. If the enterprise’s registered city is selected as a demonstration area in a given year, the variable is set to 1 for that year and all following years. For years before the selection, the variable is assigned a value of 0. For enterprises whose registered city was never selected as a demonstration area, the variable is 0 in all years. Other variables are consistent with those in Equation (1). Column (5) of Table 4 displays the exogenous shock test regression outcomes. The coefficients for digital transformation are significantly positive at the 1% level, confirming the baseline regression result that digital transformation promotes the improvement of export technological complexity. Column (6) of Table 4 indicates that after considering the lagged effects of policy impact, the regression results remain robust.
The key premise of the gradual difference-in-differences model is the parallel trends assumption, which states that before the policy implementation, the trends in the digital transformation of enterprises in demonstration cities and non-demonstration cities are assumed to be parallel. Due to limited data for the four years prior to and the six years following policy implementation, this study aggregates the data from the four years before policy implementation into period 4 and the data from the six years after into period 6. The results of the parallel trends test shown in Figure 2 indicate that the coefficient estimates for each period before the implementation of the “Broadband China” policy are not significant. This indicates that prior to the policy implementation, there were no significant differences in the digital transformation levels of enterprises between demonstration and non-demonstration cities, and the study sample passes the parallel trends test. This result further validates the positive impact of digital transformation on export technological complexity, confirming that the effect is not influenced by unobserved factors.
In summary, this paper effectively alleviates potential endogeneity issues through the instrumental variable method and exogenous shock test method. The results from the instrumental variable method show that even after controlling for reverse causality and omitted variables, the positive impact of digital transformation on export technological complexity remains significant. The exogenous shock test method further validates this conclusion through a quasi-natural experiment, indicating that policy-driven digital transformation can also substantially increase the export technological complexity of enterprises. The combination of these two methods strengthens the robustness of the research results and ensures the reliability of the conclusions presented in this paper.

5.3. Robustness Test

This study performs robustness checks by replacing the core explanatory variable, adjusting the sample period, and addressing sample selection issues. The results are presented in Table 5.
Column (1) shows the results after replacing the core explanatory variable. Drawing on the work of Wu, F. et al. (2021), this study uses Python web crawling to collect annual reports of listed companies, extract textual content, perform word frequency counting based on characteristic terms, and take the logarithm of the summed word frequencies to calculate an alternative measure of digital transformation for enterprises [65]. Compared to the baseline regression results, the estimated coefficient after replacing the core explanatory variable remains significant at the 1% level, indicating that digital transformation has a significant positive effect on the improvement of enterprise export technological complexity, and the regression outcomes are robust.
Column (2) displays the regression outcomes post-sample period adjustment. In 2015, the Chinese government first proposed the “Internet +” strategy. Since then, China’s digital economy has developed rapidly, and this initiative became a key turning point. Subsequently, numerous internet enterprises emerged, and the widespread adoption of mobile internet and smartphones further accelerated the digital economy’s growth. Emerging fields such as e-commerce, mobile payments, and the sharing economy also rose rapidly. Therefore, the level of digital economy development before 2015 was relatively low, and the extent of digital transformation among sample enterprises may differ significantly between the pre-2015 and post-2015 periods. To avoid interference from this factor in the baseline regression, this study excluded the pre-2015 samples and re-estimated the baseline model. The regression results show that the core variable’s coefficient is significantly positive, aligning with the baseline findings.
Column (3) presents the regression results after excluding foreign-invested enterprises. Foreign-invested enterprises typically have a higher quality of labor, and the improvement in labor quality leads to an increase in the variety and quality of intermediate goods, resulting in the production of higher-tech products. Therefore, their export technological complexity is relatively high, and it is less affected by their degree of digital transformation. In view of this, this study excluded foreign-invested enterprises from the sample based on the enterprise characteristics of the listed companies. The findings from the regression analysis reveal that the coefficient for digital transformation is markedly positive, indicating that after accounting for sample selection, the main conclusions of this study still hold.

5.4. Mechanism Test

5.4.1. Indirect Effect Test

  • The mediating effect of innovation capability
Theoretical analysis suggests that digital transformation boosts firms’ innovation capability, which in turn increases their export technological complexity. This mechanism relies on the “digital technology + industry” model. This model integrates innovation resources, stimulates internal innovation momentum, and fosters the integration of new and old business operations. Additionally, the widespread adoption of digital technologies facilitates product innovation and quality improvement, further strengthening firms’ technological innovation capability. To investigate whether the mediating effect of innovation capability exists, this paper estimates models (1)–(3), with the results shown in Table 6. Column (1) indicates that digital transformation plays a significant role in promoting the enhancement of firms’ export technological complexity. Columns (2) and (3) show that the improvement of firms’ innovation capability significantly promotes export technological complexity. Therefore, digital transformation can drive the increase in export technological complexity by enhancing firms’ innovation capability, thus validating Hypothesis 2. From the total, direct, and indirect effects, innovation capability plays a partial mediating role. The total effect of digital transformation on export technological complexity is 5.127, the direct effect is 4.89, and the indirect effect caused by innovation capability is 0.205, accounting for 4% of the total effect.
2.
The mediating effect of production efficiency
Theoretical analysis suggests that digital transformation can enhance the export technological complexity by improving firms’ production efficiency. This mechanism benefits from the widespread application of digital technologies, which greatly optimize the performance of production tools, enabling the transformation of traditional production equipment toward smarter, more automated systems. At the same time, digital technologies significantly improve production efficiency by reducing operational costs and enhancing the efficiency of information flow along the upstream and downstream of the industrial chain. To examine whether the mediating effect of production efficiency capability exists, this paper estimates models (1), (4), and (5), with the outcomes shown in Table 6. Column (4) indicates that digital transformation substantially drives the improvement of the enhancement of firms’ export technological complexity. Columns (5) and (6) show that improving production efficiency significantly promotes export technological complexity. Therefore, digital transformation can drive the increase in export technological complexity by enhancing production efficiency, thus validating Hypothesis 3. Based on the total, direct, and indirect effects, production efficiency partially mediates the relationship. The total effect of digital transformation on export technological complexity is 5.127, the direct effect is 4.685, and the indirect effect caused by production efficiency is 0.441, accounting for 8.6% of the total effect.

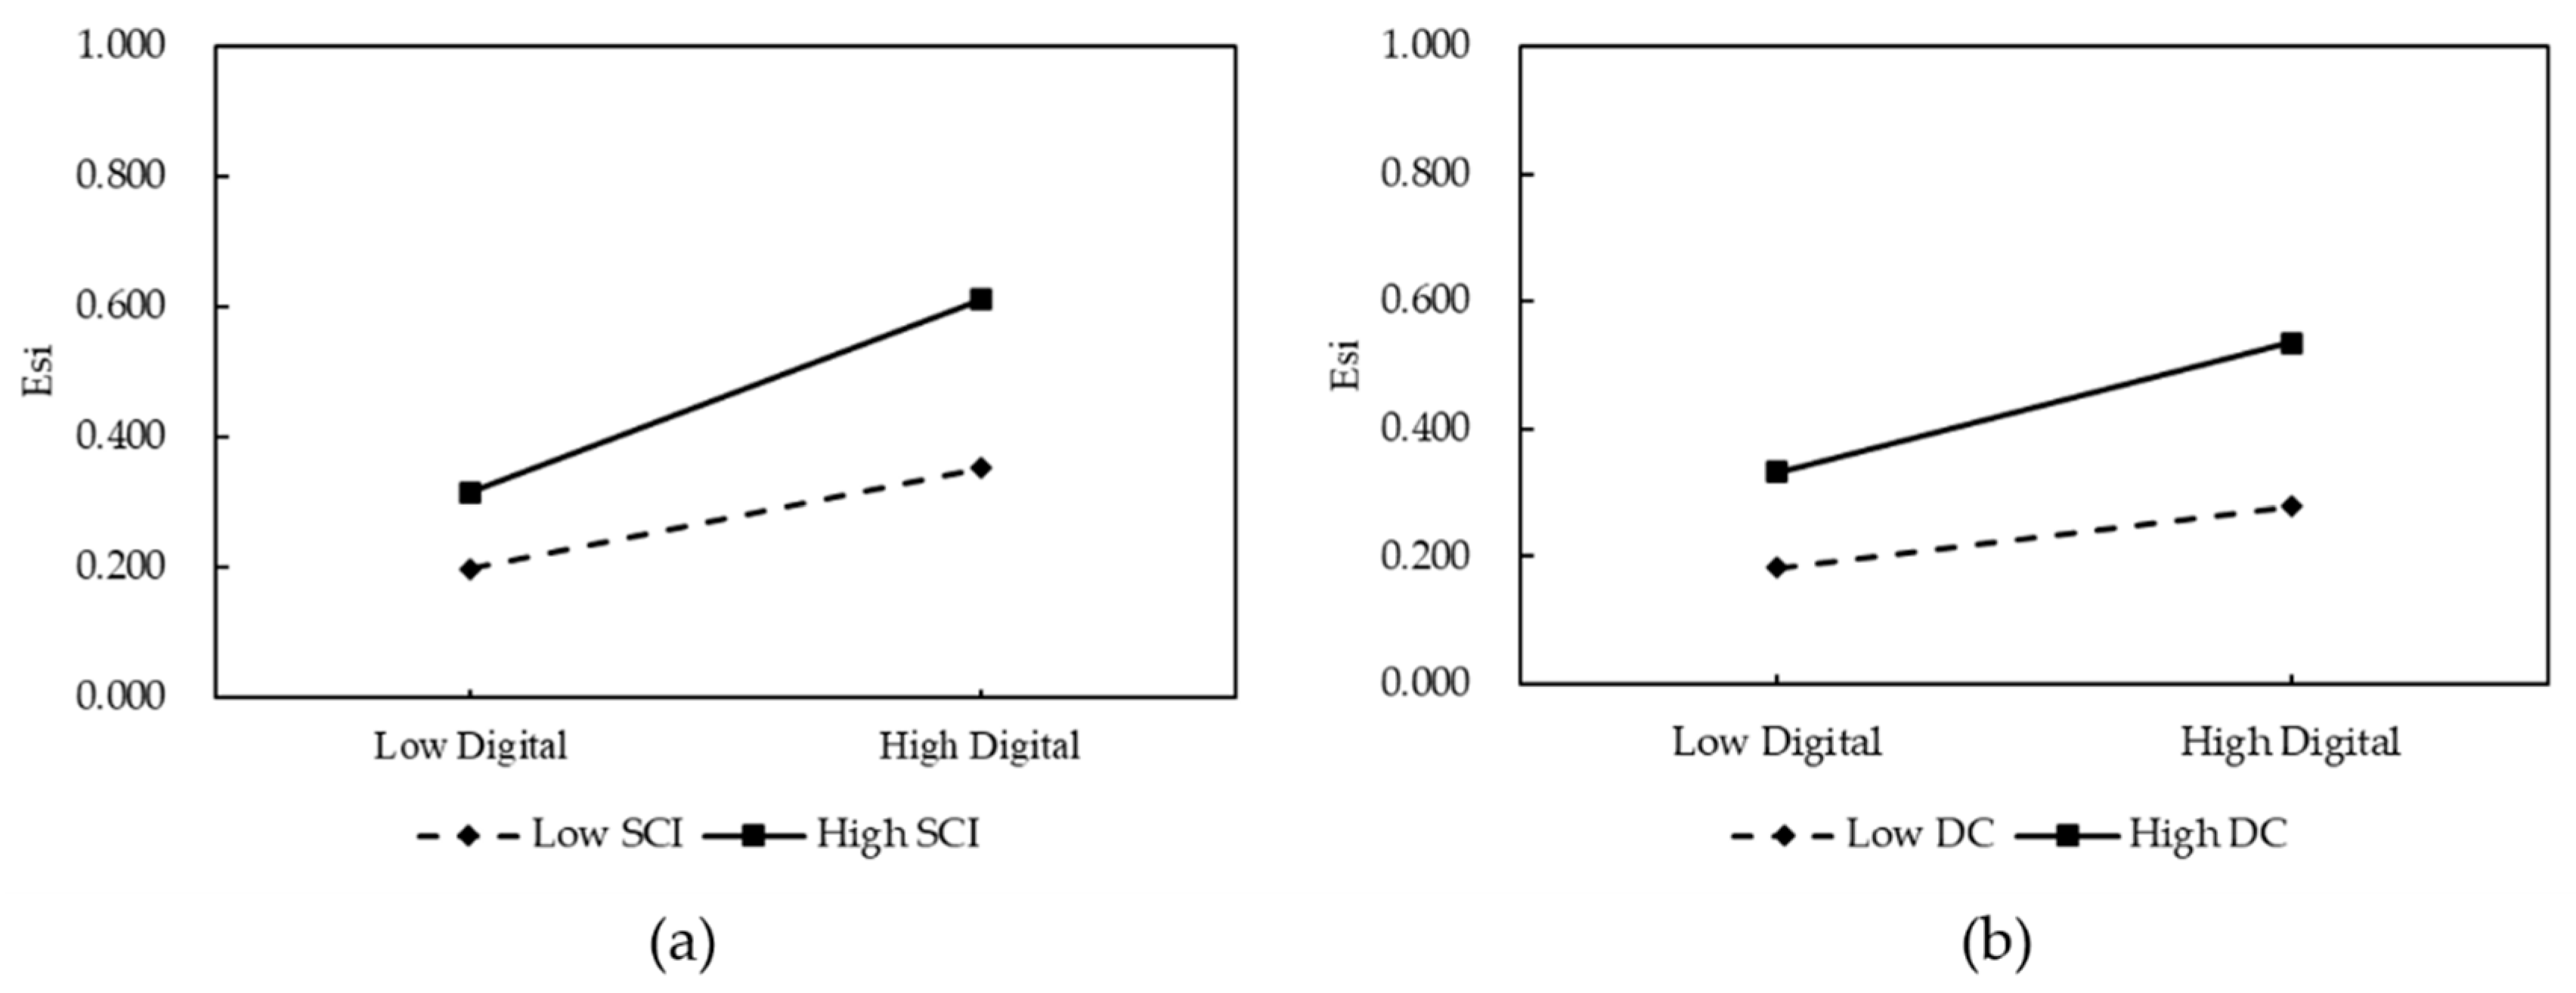
5.4.2. Moderating Effect Test

  • The moderating effect of supply chain integration
As mentioned earlier, supply chain integration plays a positive moderating role in the mechanism through which digital transformation affects the export technological complexity of manufacturing enterprises. Digital transformation requires significant investments in capital, technology, and talent, and it involves long transformation periods and high risks, leading to insufficient endogenous motivation for transformation in some enterprises. However, supply chain integration can optimize the efficient allocation of R&D funds and technological innovation resources in the innovation process, improving operational efficiency, reducing supply chain cycle time, and cutting costs, which aids enterprises in implementing digital transformation for product quality enhancement. The moderating effect of supply chain integration is tested in the results shown in Column (1) of Table 7. The results indicate that the interaction term between digital transformation and supply chain integration has a coefficient of 0.184, which is significant at the 1% level. This suggests that the higher the degree of supply chain integration, the greater the impact of digital transformation on the enhancement of export technological complexity, thus validating Hypothesis 4. It is clear that increasing the degree of supply chain integration helps enhance the impact of digital transformation on export technological complexity. Therefore, while undergoing digital transformation, enterprises should also focus on collaborative operations and information sharing with upstream and downstream supply chain partners to maximize the technological complexity of export products.
2.
The moderating effect of dynamic capabilities
Theoretical analysis indicates that dynamic capabilities positively moderate the mechanism through which digital transformation influences the technological complexity of exports in manufacturing enterprises. Traditional manufacturing enterprises face uncertainty between cost inputs and expected output benefits during digital transformation, and the rapid changes in market demand further exacerbate this issue. Dynamic capabilities can effectively identify or forecast new trends in market demand and technological development, seize the opportunity windows brought by market demand and technological changes, and help enterprises effectively cope with the uncertainties in the digital transformation process, thereby achieving the enhancement of export technological complexity. The regression results of the dynamic capability moderating effect are displayed in Column (2) of Table 7. The results show the interaction coefficient for digital transformation and dynamic capabilities is 4.721 and is significant at the 1% level, indicating that the stronger the dynamic capabilities of a company, the greater the effect of digital transformation on improving the technological complexity of the company’s exports, thus validating Hypothesis 5. Therefore, strengthening enterprises’ dynamic capabilities helps digital transformation drive the improvement of export technological complexity. Hence, companies should enhance their dynamic capabilities, identify and seize market opportunities, and fully leverage the potential of digital transformation. To more intuitively demonstrate the moderating effects of supply chain integration and dynamic capabilities, this study uses the simple slope method for verification. Specifically, the approach is to add and subtract one standard deviation from the mean of the moderating variable and from the mean of the core explanatory variable to form four combinations. These combinations are then substituted into the regression equation with unstandardized coefficients, and the corresponding four endpoint values are calculated to generate the moderation effect graphs (as shown in Figure 3). Figure 3a presents the moderating effect diagram of supply chain integration, indicating that compared to manufacturing enterprises with lower supply chain integration, enterprises with higher supply chain integration exhibit a more pronounced effect of digital transformation on promoting export technological complexity. Figure 3b presents the moderating effect diagram of dynamic capabilities. It can be seen that compared to firms with weaker dynamic capabilities, firms with stronger dynamic capabilities show a more significant effect of digital transformation on enhancing export technological complexity. This indicates that both supply chain integration and dynamic capabilities effectively amplify the impact of digital transformation on the enhancing of export technological complexity.

5.5. Heterogeneity Analysis

5.5.1. Firm Heterogeneity

The nature of a company largely determines the government preferential policies it enjoys, the ease with which it can obtain resources, and the differences in resource endowments. This means that the impact of digital transformation on the complexity of export technology may differ among companies of different types. Based on company ownership, this paper divides the manufacturing firm sample into state-owned enterprises and non-state-owned enterprises, and performs regression analysis separately for each group, as illustrated in Table 8. It can be seen that the estimated coefficients for digital transformation are all significantly positive at the 1% level, indicating that digital transformation in both types of enterprises contribute to the enhancement of export technological complexity. However, the estimated coefficient for digital transformation in state-owned enterprises is significantly higher than that for non-state-owned enterprises, suggesting that the impact of digital transformation on export technological complexity is stronger in state-owned enterprises. The reasons for this may be that, on the one hand, digital transformation usually requires substantial financial support, and state-owned enterprises, with their strong capital base and financing convenience, have an increased likelihood of securing government fiscal support and credit from financial institutions. Therefore, state-owned enterprises face relatively smaller financing constraints. On the other hand, state-owned enterprises typically have a strong industrial base, well-established production line layout, and mature production technologies. This not only helps stabilize production and product supply but also allows state-owned enterprises to fully leverage their resource aggregation and integration advantages during the digital transformation process, thus promoting the improvement of export technological complexity by enhancing production efficiency.

5.5.2. Industry Heterogeneity

  • The impact of industry factor intensity
Different industry factor intensities imply different factor configurations, industrial chain models, innovation and R&D capabilities, and mode outcome transformation, resulting in varying effects of digital transformation on the complexity of export technology. This paper categorizes the 23 manufacturing industries into three categories: labor-intensive, technology-intensive, and capital-intensive [66]. The regression results are displayed in Table 9, Columns (1) through (3). The findings indicate that the sample regression coefficients for labor-intensive and capital-intensive industries did not pass the significance test, whereas digital transformation in technology-intensive enterprises significantly promoted the improvement of export technology complexity. This may be due to that technology-intensive enterprises focus on technological innovation as their core competitive advantage, possess inherent digital advantages, and are able to fully leverage digital technologies to develop product and process innovations, thereby achieving intelligent and automated production, which promotes the enhancement of export technology complexity. Labor-intensive enterprises rely mainly on low-end labor for production, have low demand for high-end technology, and the proportion of labor costs in their operating costs is large, so their digital transformation has no significant impact on the complexity of export technology. Capital-intensive enterprises rely more on capital input than on technological innovation, and the impact of digital transformation on capital investment structure is limited, so the promoting effect is not obvious.
2.
The impact of industry competition intensity
The level of competition in the industry where a firm operates reflects the differences in its market environment. In more competitive industries, firms are more likely to find transaction partners along the supply chain, and their upstream and downstream partners exert relatively weaker constraints on the firm. This helps shorten supply chain cycles, reduce costs, and optimize the allocation of technological innovation resources, thereby improving product quality. Therefore, it can be expected that, compared to firms in low-competition industries, digital transformation will have a more significant impact on enhancing the export technology complexity of firms in high-competition industries. This paper employs the Herfindahl–Hirschman Index (HHI) to assess the level of industry competition. The index reflects industry concentration by calculating the sum of the squares of the market shares of all firms in a given market:
H H I = Σ i N ( X i X ) 2
where N represents the number of firms within a specific sub-industry, X i is the size of firm i, and X is the total size of the sub-industry. This paper uses operating revenue as a measure of firm size for calculation and divides industries into high-competition and low-competition industries based on the sample median. The smaller the HHI value, the greater the level of industry competition. Columns (4) and (5) of Table 9 present the regression results for firms in high-competition and low-competition industries, respectively. The results show that the estimated coefficient for digital transformation in high-competition industry firms is larger than that for low-competition industry firms, indicating that the impact of digital transformation on export technology complexity is stronger for firms in high-competition industries than for those in low-competition industries.

5.5.3. Regional Heterogeneity

Differences in regional resource endowments, policies, and labor conditions affect the production and operations of manufacturing enterprises. Based on the provinces in which firms are located, this study divides the sample into four subgroups—eastern, western, central, and northeastern regions—and conducts separate regressions. Table 10 presents the regression outcomes. Columns (1) and (3), respectively, show the regression outcomes of digital transformation on export technological complexity for enterprises in the eastern and western regions, both of which are significantly positive at the 1% level. Columns (2) and (4) present the regression results for enterprises in the central and northeastern regions, showing that the estimated coefficients of digital transformation in these regions are not statistically significant. The underlying reason is that compared to the central and northeastern regions, the eastern region enjoys a higher level of economic development, more advanced infrastructure, higher technological capabilities, and greater access to high-quality external resources and technological support. These factors facilitate the effective integration of technological resources in the digital transformation process, thereby enhancing export technological complexity. Meanwhile, the western region benefits from abundant resource endowments and targeted policy support, which help stimulate digital transformation initiatives and contribute to the improvement of export technological complexity. In contrast, the central and northeastern regions exhibit lower levels of economic development than the eastern region and receive less policy support compared to the western region, leading to a less pronounced effect on export technological complexity.

5.5.4. Digital Transformation Stage Heterogeneity

The differences in digital transformation stages lead to variations in firms’ capabilities in applying digital technologies, resource investment, and innovation capacity. This study classifies the sample into two stages based on the degree of digital transformation: the early stage, characterized by a lower level of digital transformation, and the later stage, where the degree of digital transformation is higher. As shown in Table 11, the impact of early-stage digital transformation on export technological complexity is not significant, whereas later-stage digital transformation has a significantly positive effect at the 1% level. This result may be attributed to the substantial capital investment required in the early stage of digital transformation, coupled with firms’ relatively weak capacity to absorb and apply new technologies. Additionally, during the early phase of transformation, firms must restructure and optimize business processes to meet digitalization requirements. This process may lead to business disruptions and efficiency declines, thereby affecting firms’ investments and outcomes in technological research and product innovation. Consequently, the impact on export technological complexity is not significant. As digital transformation progresses, firms gradually achieve intelligent upgrades in their production systems, significantly enhancing production efficiency and resource coordination capabilities. By this stage, firms typically establish comprehensive innovation systems, enabling sustained investment in research and development through digital technologies. They can deeply integrate digital technology with core business operations, achieving full-scale technological integration and optimization. Therefore, in the later stage of digital transformation, the enhancement of firms’ export technological complexity becomes more pronounced.

6. Conclusions, Recommendations, and Research Limitations

6.1. Conclusions

This paper uses data from Chinese manufacturing listed companies between 2010 and 2022, along with customs trade data, to investigate the impact and mechanisms of digital transformation on the export technology complexity of manufacturing enterprises. The main research conclusions are as follows:
(1)
Digital transformation enhances the export technology complexity of manufacturing enterprises. Specifically, for each 1-unit increase in the degree of digital transformation, the export technology complexity of enterprises will increase by 5.127 units. After considering a series of potential endogeneity issues, such as reverse causality, omitted variables, sample selection bias, and measurement errors, this conclusion remains robust. It may still be affected by model specification biases and measurement errors of variables, potentially leading to some degree of result bias.
(2)
Digital transformation indirectly boosts the export technology complexity in manufacturing enterprises by enhancing innovation capability and production efficiency. Additionally, improvements in supply chain integration and dynamic capabilities strengthen the positive impact of digital transformation on export technological complexity.
(3)
The heterogeneous effects of firm nature and industry characteristics are significant. The impact of digital transformation on export technology complexity is significantly stronger for state-owned enterprises than for non-state-owned enterprises. Under the promotion of digital transformation, technology-intensive enterprises experience a more significant improvement in export technology complexity compared to labor-intensive and capital-intensive enterprises. The export technology complexity improvement achieved through digital transformation is significantly greater for firms in high-competition industries than for those in low-competition industries. The effect of digital transformation on enhancing the export technological complexity of enterprises in the eastern region is significantly stronger than in other regions. Moreover, the impact of digital transformation on export technological complexity in the later stage is significantly greater than in the early stage.
This study, based on data from China, also holds relevance for different international regions. For developing countries, it provides a reference path for industrial upgrading, helping them enhance export competitiveness through digitalization despite limited resources and technological conditions. This can facilitate their transition from low-value-added processing to high-value-added manufacturing. For developed countries, the increase in the technological complexity of export products among Chinese manufacturing firms, driven by digital transformation, may intensify competition in high-end manufacturing. At the same time, it also creates new opportunities for cooperation in areas such as smart manufacturing and the industrial internet.

6.2. Recommendations

(1)
Digital transformation is a vital means of improving the export technological complexity of manufacturing enterprises. The government should increase investment in the construction of new digital infrastructure, optimize the policy system related to digitalization, and provide financial support to assist enterprises in their digital transformation, for example, by implementing tax reduction policies to lower the costs of digital transformation for enterprises or providing targeted subsidies in areas such as software, cloud services, and data collection and transmission equipment to support firms’ digital transformation. Innovation capability and production efficiency are key pathways through which firms enhance the technological complexity of their exports via digital transformation. Enterprises should focus on the deep integration of digital technologies with traditional business, applying them in areas such as business model design, production process optimization, service innovation, operational model improvement, and decision-making support. By optimizing production processes and efficiently allocating resources, enterprises can achieve innovation breakthroughs, improve production efficiency, enhance the added value of export products, and thereby maintain a sustainable competitive advantage, for example, embedding sensors in production equipment to enable real-time monitoring and data analysis, optimizing production efficiency and equipment utilization, and introducing intelligent warehousing and logistics management systems to achieve automated storage and smart distribution, among others.
(2)
Strengthening supply chain management and leveraging the moderating role of dynamic capabilities. During the digital transformation process, firms should enhance the management capabilities of their supply chain systems by utilizing digital platforms to enable data sharing between upstream and downstream companies, thus improving inter-firm collaboration and information sharing. At the same time, firms should use digital tools to optimize supplier selection and evaluation, ensuring the stability and reliability of the supply chain. By harnessing the strength of supply chain stakeholders, firms can enhance value accumulation, fully utilize complementary resources, and optimize the allocation of innovation resources, thereby expanding their resource base. Additionally, enterprises should rely on dynamic capabilities to identify and seize market opportunities, creating a digital innovation ecosystem where multiple resources are interconnected. By optimizing organizational structure and culture, cultivating high-quality talent, and fostering proactive awareness and judgment, enterprises can gradually implement digital strategies, develop transformation strategies that match their level of development, activate innovation potential, and avoid blindly following the trend of digital transformation. Therefore, enterprise managers should build a sound resource allocation and supply chain system, improve dynamic capabilities, and effectively guide the digital transformation of the enterprise, enhance its competitive advantage, and inject continuous momentum for the enterprise’s sustainable development.
(3)
The government should adopt an “enterprise-specific approach” to support the digital transformation of enterprises. Enterprises in different industries have diverse needs and development directions. When encouraging digital transformation, the government should respect the inherent advantages of enterprises and assist them in exploring development paths suited to their characteristics. For example, state-owned enterprises should fully leverage their role as the main force in the new infrastructure sector by increasing investment in and the construction of foundational facilities such as 5G, industrial internet, and artificial intelligence. Additionally, they should utilize their strategic position in traditional industries to promote the digital transformation of these sectors, driving more enterprises to participate in digital transformation through demonstration projects. For non-state-owned enterprises, particularly small and medium-sized enterprises (SMEs), local governments should provide interest subsidies for digital transformation projects to address the funding shortfalls faced during the transformation process, thereby facilitating a smooth transition.

6.3. Research Limitations and Directions for Future Research

(1)
In terms of measuring export technological complexity, the method employed in this study, based on Hausman (2007) [5], does not fully account for the differential impact of digital transformation on the export technological complexity of enterprises across different trade models (e.g., processing trade versus general trade). Due to the limitations in data availability and research methodology, it is currently challenging to obtain sufficient data to conduct a comprehensive and in-depth analysis of the impact of digital transformation on the export technological complexity of enterprises with different trade models. Moreover, this analysis requires more complex and refined models, as well as deeper empirical research, which may necessitate additional time and resources. Therefore, we have decided to further explore this issue in future research, specifically addressing different trade methods individually.
(2)
This study is limited to data from a single country and a fixed period of analysis. Although the research conclusions have some reference value for the digital transformation development paths of manufacturing industries in different international regions, the data used for the study are from China, and the research methods are based on China’s national context. Therefore, the findings of this study have certain limitations. Additionally, this study is limited to data from a single country and fixed-period analysis. Future research could further expand the scope, especially in terms of the discussion on global applicability and long-term effects. The research could be extended to other countries or regions to explore the effects of digital transformation under different economic systems.
(3)
In terms of impact mechanisms, this study only explores four aspects: technological innovation, production efficiency, supply chain integration, with the indirect effects of innovation capability and production efficiency being relatively small. This is because many other important factors, such as costs, management systems, and corporate culture, were not included in this study. Future research could attempt a more comprehensive analysis from multiple dimensions.

Supplementary Materials

The following supporting information can be downloaded at: https://www.mdpi.com/article/10.3390/su17062596/s1, Table S1: The grouping and correspondence between the Customs Industry Classification and the National Economic Industry Classification.

Author Contributions

Conceptualization, J.W.; methodology, Q.H.; software, Q.H.; writing—original draft preparation, J.W. and Q.H.; writing—review and editing, J.W.; funding acquisition, J.W. All authors have read and agreed to the published version of the manuscript.

Funding

This research was funded by the Heilongjiang Province Postdoctoral Funding Project (LBH-Z23128), the Philosophy and Social Science Research Planning Project of Heilongjiang Province (22GJB127), and the Philosophy and Social Sciences Planning Project of Heilongjiang Province (22JYB238).

Institutional Review Board Statement

Not applicable.

Informed Consent Statement

Not applicable.

Data Availability Statement

The data presented in this study are available upon request from the corresponding author (2230200@s.hlju.edu.cn).

Acknowledgments

The authors greatly appreciate the comments of reviewers on this paper.

Conflicts of Interest

The authors declare no conflicts of interest.

References

  1. Hu, M.; Tao, C.; Zhou, H. The Influence of Industrial Structure Upgrade on Coupling and Coordinated Development—Empirical Analysis from Chinese Pharmaceutical Manufacturing and Pharmaceutical Service Industries. Front. Public Health 2021, 9, 722006. [Google Scholar] [CrossRef] [PubMed]
  2. Bănică, C.F.; Sover, A.; Anghel, D.C. Printing the Future Layer by Layer: A Comprehensive Exploration of Additive Manufacturing in the Era of Industry 4.0. Appl. Sci. 2024, 14, 9919. [Google Scholar] [CrossRef]
  3. Pohlmeyer, F.; Möbitz, C.; Gries, T.A. Sovereign and Interoperable Data Ecosystem for an Eco-Efficient Nonwovens Industry. Sustainability 2024, 16, 10735. [Google Scholar] [CrossRef]
  4. Xue, F.; Zhao, X.; Tan, Y. Digital transformation of manufacturing enterprises: An empirical study on the relationships between digital transformation, boundary spanning, and sustainable competitive advantage. Discrete Dyn. Nat. Soc. 2022, 2022, 4104314. [Google Scholar] [CrossRef]
  5. Hausmann, R.; Hwang, J.; Rodrik, D. What you Export Matters. J. Econ. Growth. 2007, 12, 1–25. [Google Scholar] [CrossRef]
  6. Vial, G. Understanding Digital Transformation: A Review and a Research Agenda. J. Strateg. Inf. Syst. 2019, 28, 118–144. [Google Scholar] [CrossRef]
  7. Gurbaxani, V.; Dunkle, D. Gearing up for Successful Digital Transformation. MIS Q. Exec. 2019, 18, 209–220. [Google Scholar] [CrossRef]
  8. Berman, S.J. Digital Transformation: Opportunities to Create New Business Models. Strategy Leadersh. 2012, 40, 16–24. [Google Scholar] [CrossRef]
  9. Knudsen, D.R. Elusive Boundaries, Power Relations, and Knowledge Production: A Systematic Review of the Literature on Digitalization in Accounting. Int. J. Account. Inf. Syst. 2020, 36, 100441. [Google Scholar] [CrossRef]
  10. Han, X.F.; Dong, M.F.; Li, B.X. Dynamic spillover effect of OFDI reverse green innovation in China: Based on interactive regulation of digital finance and traditional finance. Collect. Essays Financ. Econ. 2023, 39, 36. [Google Scholar]
  11. Warner, K.S.R.; Wäger, M. Building Dynamic Capabilities for Digital Transformation: An ongoing Process of Strategic Renewal. Long Range Plan. 2019, 52, 326–349. [Google Scholar] [CrossRef]
  12. Eck, K.; Huber, S. Product Sophistication and Spillovers from Foreign Direct Investment. Can. J. Econ. 2016, 49, 1658–1684. [Google Scholar] [CrossRef]
  13. Zhuo, C.F.; Deng, F. Infrastructure Investments and Construction of Manufacturing Trade Power—Dual Perspectives of Export Scale and Export Technological Complexity. J. Int. Trade 2018, 104–119. [Google Scholar] [CrossRef]
  14. Xu, B.; Lu, J. Foreign Direct Investment, Processing Trade, and the Sophistication of China’s Exports. China Econ. Rev. 2009, 20, 425–439. [Google Scholar] [CrossRef]
  15. Ma, Y.; Rauf, A. Indigenous Innovation, Foreign Technology Transfer and the Export Performance of China’s Manufacturing Industries. Singap. Econ. Rev. 2020, 65, 1349–1366. [Google Scholar] [CrossRef]
  16. Liu, J.; Xie, J. Environmental Regulation, Technological Innovation, and Export Competitiveness: An Empirical Study Based on China’s Manufacturing Industry. Int. J. Environ. Res. Public Health 2020, 17, 1427. [Google Scholar] [CrossRef]
  17. Anwar, S.; Sun, S. Foreign Direct Investment and Export Quality Upgrading in China’s Manufacturing Sector. Int. Rev. Econ. Financ. 2018, 54, 289–298. [Google Scholar] [CrossRef]
  18. Fang, M.; Yang, R. Research on Effects of Input Servitization on Export Technological Complexity of Manufacturing Industry of China. Des. Autom. Embed. Syst. 2018, 22, 279–291. [Google Scholar] [CrossRef]
  19. Gao, X.; Lu, C.; Mao, J. Effects of Urban Producer Service Industry Agglomeration on Export Technological Complexity of Manufacturing in China. Entropy 2020, 22, 1108. [Google Scholar] [CrossRef]
  20. Pan, K.; He, F.; Liu, R. Does High-tech Industry Agglomeration Promote its Export Product Upgrading? Based on the Perspective of Innovation and Openness. Sustainability 2022, 14, 8148. [Google Scholar] [CrossRef]
  21. Sheng, B.; Mao, Q.L. Does Import Trade Liberalization Affect Chinese Manufacturing Export Technological Sophistication. J. World Econ. 2017, 40, 52–75. [Google Scholar]
  22. Xiong, R.; Zhang, H.; Zhang, C.; Mu, G.; Wei, P. The Impact of Foreign Divestment on Chinese Firms’ Export Quality. Singap. Econ. Rev. 2024, 1–28. [Google Scholar] [CrossRef]
  23. Chai, J.W. The Impact of Green Innovation on Export Quality. Appl. Econ. Lett. 2023, 30, 1279–1286. [Google Scholar] [CrossRef]
  24. Zhang, C.; Qiu, P.; Zhang, L.; Hong, X.; Wang, D. The Impact of Digital Transformation on Enterprises’ Export Stability: Evidence from Listed Companies in China. Int. Rev. Financ. Anal. 2024, 96, 103582. [Google Scholar] [CrossRef]
  25. Zhang, Q.; Duan, Y. How Digitalization Shapes Export Product Quality: Evidence from China. Sustainability 2023, 15, 6376. [Google Scholar] [CrossRef]
  26. Liang, S.; Tan, Q. Can the Digital Economy Accelerates China’s Export Technology Upgrading? Based on the Perspective of Export Technology Complexity. Technol. Forecast. Soc. 2024, 199, 123052. [Google Scholar] [CrossRef]
  27. Luu, T.D. Digital Transformation and Export Performance: A Process Mechanism of Firm Digital Capabilities. Bus. Process Manag. J. 2023, 29, 1436–1465. [Google Scholar] [CrossRef]
  28. Azu, N.P.; Nwauko, P.A. Evaluating the Effect of Digital Transformation on Improvement of Service Trade in West Africa. Foreign Trade Rev. 2021, 56, 430–453. [Google Scholar] [CrossRef]
  29. Yu, J.J.; Yu, D.S. Government Subsidies, Industrial Competition and Enterprises’ Export Technology Complexity. J. Financ. Econ. 2018, 44, 112–124. [Google Scholar]
  30. Hu, J.; Xue, H.; Yu, Z. Study on the Effect of R&D Investment on Technical Progress of Manufacture in China. J. Knowl. Econ. 2024, 15, 9899. [Google Scholar]
  31. Atif, R.M.; Saqib, N.; Mahmood, H. Heterogeneity, Sunk Cost, and Export Performance: A Firm Level Study of Pakistan’s Textile Sector. Heliyon 2023, 9, e17548. [Google Scholar] [CrossRef] [PubMed]
  32. Wu, F.; Yan, X. Institutional Quality and Sustainable Development of Industries’ Exports: Evidence from China. Sustainability 2018, 10, 4173. [Google Scholar] [CrossRef]
  33. Zhao, X.; Chen, Q.A.; Yuan, X.; Yu, Y.; Zhang, H. Study on the Impact of Digital Transformation on the Innovation Potential based on Evidence from Chinese Listed Companies. Sci. Rep. 2024, 14, 6183. [Google Scholar] [CrossRef]
  34. Miao, Z.; Zhao, G. Impacts of Digital Information Management Systems on Green Transformation of Manufacturing Enterprises. Int. J. Environ. Res. Public Health 2023, 20, 1840. [Google Scholar] [CrossRef] [PubMed]
  35. Han, J.; Sun, R.; Zeeshan, M.; Rehman, A.; Ullah, I. The Impact of Digital Transformation on Green Total Factor Productivity of Heavily Polluting Enterprises. Front. Psychol. 2023, 14, 1265391. [Google Scholar] [CrossRef]
  36. Si, Y.; Liu, W.; Cao, X. The Effects of External Knowledge Source Heterogeneity on Enterprise Process and Product Innovation Performance. PLoS ONE 2020, 15, e0234649. [Google Scholar] [CrossRef] [PubMed]
  37. Carroll, N.; Hassan, N.R.; Junglas, I.; Hess, T.; Morgan, L. Transform or be transformed: The importance of research on managing and sustaining digital transformations. Eur. J. Inf. Syst. 2023, 32, 347–353. [Google Scholar] [CrossRef]
  38. Feng, Z.; Cheng, S.; Qu, G.; Cui, Y.; Ye, J. Research on Theoretical Mechanism and Promotion Path of Digital Economy Driving China’s Green Development under “Double Carbon” Background. Int. J. Environ. Res. Public Health 2022, 20, 437. [Google Scholar] [CrossRef]
  39. Zhao, C.; Liu, Z.; Yan, X. Does the Digital Economy Increase Green TFP in Cities? Int. J. Environ. Res. Public Health 2023, 20, 1442. [Google Scholar] [CrossRef]
  40. He, F.; Liu, H.X. Evaluating the performance enhancement effect of digital transformation in real enterprises from the perspective of digital economy. Reform 2019, 302, 13–148. [Google Scholar]
  41. Hu, Y.; Sun, S.; Jiang, M.; Dai, Y. Research on the Promoting Effect of Servitization on Export Technological Sophistication of Manufacturing Enterprises. PLoS ONE 2021, 16, e0255891. [Google Scholar] [CrossRef] [PubMed]
  42. Wu, K.; Liu, S.; Zhu, M.; Qu, Y. The Impact of Digital Transformation on Resource Mismatch of Chinese Listed Companies. Sci. Rep. 2024, 14, 9011. [Google Scholar]
  43. Li, Y.; Fei, G.Z. Network Embeddedness, Digital Transformation, and Enterprise Performance—The Moderating Effect of Top Managerial Cognition. Front. Psychol. 2023, 14, 1098974. [Google Scholar] [CrossRef] [PubMed]
  44. Flynn, B.B.; Huo, B.; Zhao, X. The Impact of Supply Chain Integration on Performance: A Contingency and Configuration Approach. J. Oper. Manag. 2010, 28, 58–71. [Google Scholar] [CrossRef]
  45. Zhao, Z. Digital Transformation and Enterprise Risk-Taking. Financ. Res. Lett. 2024, 62, 105139. [Google Scholar] [CrossRef]
  46. Wang, S.Y.; Xiao, X.Y. Research on the Relationship between Supply Chain Integration and Enterprise Technological Innovation Performance Based on Technology. Sci. Technol. Manag. Res. 2018, 38, 122–127. [Google Scholar]
  47. Li, X.; Yan, J.; Cheng, J.; Li, J. Supply-Chain Finance and Investment Efficiency: The Perspective of Sustainable Development. Sustainability 2023, 15, 7857. [Google Scholar] [CrossRef]
  48. Teece, D.J.; Pisano, G.; Shuen, A. Dynamic Capabilities and Strategic Management. Strateg. Manag. J. 1997, 18, 509–533. [Google Scholar] [CrossRef]
  49. Wang, X.; Zheng, C.; Mutuc, E.B.; Su, N.; Hu, T.; Zhou, H.; Wei, S. How does Organizational Unlearning Influence Product Innovation Performance? Moderating Effect of Environmental Dynamism. Front. Psychol. 2022, 13, 840775. [Google Scholar] [CrossRef]
  50. Wu, J.; Qu, X.; Sheng, L.; Chu, W. Uncovering the Dynamics of Enterprises Digital Transformation Research: A Comparative Review on Literature before and after the COVID-19 Pandemic. Heliyon 2024, 10, e26986. [Google Scholar] [CrossRef]
  51. Liu, L.; An, S.; Liu, X. Enterprise Digital Transformation and Customer Concentration: An Examination based on Dynamic Capability Theory. Front. Psychol. 2022, 13, 987268. [Google Scholar] [CrossRef] [PubMed]
  52. Xu, B. The Sophistication of Exports: Is China Special? China Econ. Rev. 2010, 21, 482–493. [Google Scholar] [CrossRef]
  53. Zhao, C.Y.; Wang, W.C.; Li, X.S. How does Digital Transformation Affect the Total Factor Productivity of Enterprises? Financ. Trade Econ. 2021, 42, 114–129. [Google Scholar]
  54. Li, C.T.; Yan, X.W.; Song, M.; Yang, W. Fintech and Corporate Innovation—Evidence from Chinese NEEQ-Listed Companies. China Ind. Econ. 2020, 1, 81–98. [Google Scholar]
  55. Olley, G.S.; Pakes, A. The Dynamics of Productivity in the Telecommunications Equipment Industry. Econometrica 1996, 64, 1263. [Google Scholar] [CrossRef]
  56. Li, Q.; Liu, L.G.; Shao, J.B. The Effects of Digital Transformation and Supply Chain Integration on Firm Performance: The Moderating Role of Entrepreneurship. Bus. Manag. J. 2021, 43, 5–23. [Google Scholar]
  57. Song, Z.; Yu, K.X. Capital Structure, Dynamic Capabilities, and Firm Performance—A Study Based on Data from Listed Resource-Based Companies in the Western Region. Inq. Econ. Issues 2017, 57–63. [Google Scholar]
  58. Mao, Q.L.; Fang, S.H. Innovation-Driven and the Export Technological Complexity of Chinese Manufacturing Enterprises. Forum World Econ. Politics 2018, 1–24. Available online: https://kns.cnki.net/kcms2/article/abstract?v=u3gpgSR0TKeS1ne5G-2NyoM6KO5TJnGLLFPVbSXuWxqaXozkGj4VV0OYK0Seba7mRkwJuQN9xuRBLAOcPHwnA1lJL9ovMLwhoqWyAFXTXpVxLmtnYfyRClcGskueVFszX2TI2INB_12Kks88qDMCVBOWhzRds1_4_GCzWxvCQmbKsbSRQ4QWea0Uybn95ClB&uniplatform=NZKPT&language=CHS (accessed on 12 March 2025).
  59. Li, J.Q.; Miao, E.S. Intellectual Property Protection and Enterprise’s Export Technological Sophistication under the Background of Incomplete Contract. China Ind. Econ. 2018, 369, 115–133. [Google Scholar]
  60. Chen, Y. The Effect of China’s PFTZ on Export Technology Upgrade—From the Perspective of Export Technology Complexity. Bachelor’s Thesis, Shandong University, Jinan, China, 2023. [Google Scholar]
  61. Tan, X.; Liu, G.; Cheng, S. How does ESG Performance Affect Green Transformation of Resource-based Enterprises: Evidence from Chinese Listed Enterprises. Resour. Policy 2024, 89, 104559. [Google Scholar] [CrossRef]
  62. Gu, S.Z.; Han, L.Y.; Zhuang, Q.Q. Strategic Thinking of Establishing a Healthy Legal Ecological Environment for Business Enterprises—Based on the Perspective of the New Edition of “Law of the People’s Republic of China on Promotion of Small and Medium-sized Enterprises”. Econ. Rev. J. 2018, 5, 30–34. [Google Scholar]
  63. Huang, Q.H.; Yu, Y.Z.; Zhang, S.L. Internet Development and Productivity Growth in Manufacturing Industry: Internal Mechanism and China Experiences. China Ind. Econ 2019, 5–23. [Google Scholar] [CrossRef]
  64. Zhao, T.; Zhang, Z.; Liang, S.K. Digital Economy, Entrepreneurship, and High-Quality Economic Development: Empirical Evidence from Urban China. J. Manag. World 2020, 36, 65–76. [Google Scholar]
  65. Wu, F.; Hu, H.Z.; Lin, H.Y.; Ren, X.Y. Digital Transformation of Enterprises and Capital Market Performance: Empirical Evidence from Stock Liquidity. J. Manag. World 2021, 37, 130–144+10. [Google Scholar]
  66. Yang, L.G.; Xie, R.; He, Z.C.; Han, F.; Sun, Y.L. Research on the Impact of Rising Labor Cost on Manufacturing Structure Upgrading—An Empirical Analysis Based on the Data of Sub-sectors of Chinese Manufacturing. China Soft Sci. 2014, 12, 136–147. [Google Scholar]
Figure 1. The model of the impact mechanism of digital transformation on export technological complexity.
Sustainability 17 02596 g001
Figure 2. Parallel trends test.
Sustainability 17 02596 g002
Figure 3. (a) The moderating effect diagram of supply chain integration. (b) The moderating effect diagram of dynamic capabilities.
Sustainability 17 02596 g003
Table 1. Descriptive statistics of variables.
Variable TypeVariable NameSymbol CodeVariable DefinitionSoure
Dependent VariableEnterprise Export Technological ComplexityEsiIndustry export technological complexity and total factor productivity, then scaled down by a factor of 1010China Customs Database
Independent VariableDigital TransformationDigitalObtained through text mining to extract keywords related to digital transformation, with the frequency of these keywords calculated using the entropy methodAnnual Reports of Listed Companies in China
Mediating VariablesInnovation CapabilityInnovThe total number of patent applications plus one, then take the logarithmChinese Research Data Services
Production EfficiencyTFPTotal factor productivity measured by the OP methodChina Stock Market and Accounting Research Database (CSMAR)
Moderating VariablesSupply chain IntegrationSCIThe average of the sum of the ratio of the purchase amount from the top five suppliers to the total annual purchase amount and the ratio of the sales amount to the top five customers to the total annual sales amountChina Stock Market and Accounting Research Database
Dynamic CapabilityDCThe standardized mean of the opportunity perception, resource integration, and organizational growth indicators
Control VariablesGovernment SubsidiesLnsubGovernment subsidies plus one, then take the logarithm for measurementChina Stock Market and Accounting Research Database
Firm AgeAgeThe difference between the current year and the year of the company’s establishment
Firm SizeSizeThe number of employees
Operating Profit MarginProfitThe ratio of operating profit to sales revenue
Financing ConstraintsFinconThe ratio of interest to fixed assets
Capital IntensityLnklrThe ratio of fixed assets to the number of employees plus one, then take the logarithm
Firm OwnershipSoeState-owned enterprises are assigned a value of 1, otherwise 0
Table 2. Descriptive statistics of key variables.
VariableNMeanStd.Min.Max.
Esi15,1000.3010.3870.00082.098
Digital15,1000.00270.00440.00010.0539
Lnsub15,10015.432.1666.70720.46
Size15,100460476406357800
Lnklr15,10012.560.8699.85415.03
Age15,10016.505.819164
Profit15,1000.07230.153−1.6380.531
Fincon15,1000.04760.0634−0.01540.804
Table 3. Direct effects test.
Variable(1)(2)(3)(4)
Digital7.056 ***6.517 ***6.678 ***5.127 ***
(6.505)(6.053)(6.237)(6.562)
Lnsub 0.0000.0000.001
(0.129)(0.349)(0.631)
Age 0.021 ***0.021 ***0.022 ***
(17.931)(17.957)(21.582)
Size 0.000 **0.000 **0.000 ***
(2.577)(2.538)(2.923)
Profit 0.032 **0.032 **0.044 ***
(2.321)(2.331)(3.864)
Fincon 0.227 ***0.224 ***0.165 ***
(2.776)(2.733)(3.182)
Lnklr 0.0200.0160.030*
(0.886)(0.701)(1.760)
Soe −0.000−0.0010.006
(−0.076)(−0.094)(1.128)
Constant0.171 ***−0.098−0.254 **−0.519 ***
(30.162)(−1.265)(−2.525)(−7.723)
Prov effectNoNoYesYes
Industry effectNoNoNoYes
Observation15135151351513515135
R-squared0.2540.2610.2640.408
Note: *** significance at 1%; ** significance at 5%.
Table 4. Endogeneity test.
Variable(1)(2)(3)(4)(3)(4)
Instrumental VariablesExogenous Shock Test
Digital 3.912 *** 21.101 **
(5.306) (2.123)
IV10.865 ***
(52.56)
IV2 3.28 × 10⁻⁷ ***
(2.96)
Did 0.040 ***
(5.320)
L. Did 0.057 ***
(6.371)
ControlsYesYesYesYesYesYes
Prov effectYesYesYesYesYesYes
Industry effectYesYesYesYesYesYes
Kleibergen–Paap rk LM statistic151.296 ***151.296 ***8.856 ***8.856 ***
Cragg–Donald Wald F statistic1.6 × 1041.6 × 10424.66424.664
Kleibergen–Paap rk Wald F statistic2762.6192762.6198.7598.759
Observation11,87011,87015,13515,13515,13515,135
R-squared0.8770.8770.8390.8390.4040.408
Note: *** Significance at 1%; ** Significance at 5%.
Table 5. Robustness test.
Variable(1)(2)(3)
Digital_wf0.014 ***
(6.746)
Digital 1.447 **4.866 ***
(2.304)(6.283)
Lnsub0.0010.0010.000
(0.634)(1.241)(0.321)
Age0.022 ***0.030 ***0.022 ***
(21.585)(26.271)(21.202)
Size0.000 ***0.0000.000 ***
(2.984)(1.149)(2.902)
Profit0.048 ***0.067 ***0.043 ***
(4.245)(5.769)(3.669)
Fincon0.186 ***0.0130.165 ***
(3.512)(0.251)(3.172)
Lnklr0.0060.0030.004
(1.140)(0.547)(0.786)
Soe0.029 *−0.0050.029 *
(1.717)(−0.400)(1.667)
Constant−0.534 ***−0.643 ***−0.506 ***
(−7.909)(−5.174)(−7.302)
Prov effectYesYesYes
Industry effectYesYesYes
Observation15,135843714,561
R-squared0.4050.2980.412
Note: *** significance at 1%; ** significance at 5%; * significance at 10%.
Table 6. Mediating effect test.
VariableInnovTFP
(1)(2)(3)(4)(5)(6)
EsiInnovEsiEsiTFPEsi
Digital5.127 ***1022.591 ***4.890 ***5.127 ***6.391 ***4.685 ***
(6.562)(3.417)(6.283)(6.562)(4.601)(5.994)
Innov 0.0002 **
(5.050)
TFP 0.069 ***
(8.713)
Lnsub0.0010.2500.0010.0010.009 ***0.000
(0.631)(0.492)(0.583)(0.631)(3.131)(0.053)
Age0.022 ***2.373 ***0.022 ***0.022 ***0.057 ***0.018 ***
(21.582)(5.358)(21.050)(21.582)(23.985)(16.798)
Size0.000 ***0.007 ***0.000 *0.000 ***0.000 ***0.000 **
(2.923)(8.614)(1.734)(2.923)(3.326)(2.481)
Profit0.044 ***22.473 ***0.038 ***0.044 ***0.844 ***−0.015
(3.864)(4.732)(3.394)(3.864)(18.590)(−1.176)
Fincon0.165 ***16.4430.161 ***0.165 ***2.026 ***0.025
(3.182)(0.833)(3.169)(3.182)(14.086)(0.504)
Lnklr0.030 *3.948 *0.0050.030 *0.190 ***−0.007
(1.760)(1.908)(0.972)(1.760)(12.350)(−1.575)
Soe0.006−4.8060.031 *0.0060.0550.026
(1.128)(−0.912)(1.879)(1.128)(1.633)(1.598)
Constant−0.519 ***−93.543 ***−0.497 ***−0.519 ***3.610 ***−0.769 ***
(−7.723)(−3.022)(−7.556)(−7.723)(14.520)(−9.870)
Prov effectYesYesYesYesYesYes
Industry effectYesYesYesYesYesYes
Observation15,13515,13515,13515,13515,13515,135
R-squared0.4080.2940.4130.4080.4660.421
Note: *** significance at 1%; ** significance at 5%; * significance at 10%.
Table 7. Moderating effect test.
Variable(1)(2)
SCIDC
Digital4.597 ***4.721 ***
(5.631)(5.909)
SCI0.000
(0.307)
Digital*SCI0.184 ***
(3.884)
DC 0.000 *
(1.865)
Digital*DC 0.009 *
(1.721)
Lnsub0.0010.000
(0.612)(0.225)
Age0.025 ***0.024 ***
(16.694)(20.949)
Size0.000 ***0.000 ***
(2.709)(2.733)
Profit0.057 ***0.043 ***
(4.850)(3.570)
Fincon0.137 **0.159 ***
(2.442)(2.987)
Lnklr0.0000.003
(0.071)(0.508)
Soe0.0240.031 *
(1.365)(1.734)
Constant−0.593 ***−0.530 ***
(−7.235)(−7.125)
Prov effectYesYes
Industry effectYesYes
Observation11,81613,741
R-squared0.3770.408
Note: *** significance at 1%; ** significance at 5%; * significance at 10%.
Table 8. Firm heterogeneity analysis.
Variable(1)(2)
State-OwnedNon-State-Owned
Digital7.951 ***4.299 ***
(4.827)(4.832)
Lnsub−0.0020.002
(−0.964)(1.554)
Age0.020 ***0.024 ***
(11.474)(17.674)
Size0.0000.000 **
(1.646)(2.560)
Profit0.048 **0.040 ***
(2.063)(3.112)
Fincon0.1250.165 ***
(0.994)(3.030)
Lnklr0.0040.003
(0.428)(0.497)
Constant−0.390 ***−0.243 ***
(−2.863)(−4.145)
Prov effectYesYes
Industry effectYesYes
Observation464410,491
R-squared0.3930.403
Note: *** significance at 1%; ** significance at 5%.
Table 9. Industry heterogeneity analysis.
Variable(1)(2)(3)(4)(5)
Labor-IntensiveTechnology-IntensiveCapital-IntensiveHigh-CompetitionLow-Competition
Digital−0.1256.857 ***0.4116.432 ***2.826 ***
(−0.527)(7.263)(0.753)(5.590)(4.408)
Lnsub0.000−0.0010.0010.004 **0.001
(0.908)(−0.328)(1.453)(2.417)(0.937)
Age0.007 ***0.032 ***0.017 ***0.023 ***0.013 ***
(18.820)(15.724)(19.719)(18.645)(15.681)
Size−0.0000.0000.000 *0.000 ***0.000
(−0.351)(0.857)(1.936)(4.138)(0.171)
Profit0.026 ***0.084 ***0.033 ***0.055 ***0.045 ***
(4.662)(4.793)(3.031)(3.108)(3.686)
Fincon0.0010.159 **0.0270.219 ***−0.027
(0.039)(2.035)(0.607)(2.844)(−0.684)
Lnklr−0.001−0.0010.0050.0050.004
(−0.800)(−0.134)(1.361)(0.747)(0.742)
Soe−0.0000.0230.023 ***0.0260.012
(−0.075)(0.819)(2.806)(0.992)(1.063)
Constant−0.027−0.030−0.223 ***−0.549 ***−0.262 ***
(−1.466)(−0.275)(−4.757)(−4.744)(−3.718)
Prov effectYesYesYesYesYes
Industry effectYesYesYesYesYes
Observation27037540489275397596
R-squared0.6690.4460.4730.3980.436
Note: *** significance at 1%; ** significance at 5%; * significance at 10%.
Table 10. Regional heterogeneity.
Variable(1)(2)(3)(4)
EasternCentralWesternNortheastern
Digital3.667 ***1.5223.736 ***1.501
(6.830)(1.481)(2.622)(0.760)
Lnsub0.808−0.1400.073−2.110
(0.640)(−0.058)(0.020)(−0.910)
Age22.447 ***21.416 ***18.856 ***9.202 ***
(16.572)(9.395)(6.299)(4.787)
Size0.005 ***0.003−0.002 *−0.007 **
(2.709)(1.353)(−1.959)(−2.402)
Profit52.648 ***6.45228.1283.377
(3.157)(0.256)(1.404)(0.157)
Fincon160.552 **187.527−20.9367.660
(2.500)(1.372)(−0.250)(0.132)
Lnklr33.89917.00513.33827.908
(1.398)(0.497)(0.797)(1.322)
Soe10.614 *−10.449−6.1032.783
(1.649)(−0.923)(−0.640)(0.303)
Constant−536.310 ***−235.434 *−147.08755.091
(−5.850)(−1.832)(−1.244)(0.465)
Prov effectYesYesYesYes
Industry effectYesYesYesYes
Observation998824102119618
R-squared0.4360.4180.4120.463
Note: *** significance at 1%; ** significance at 5%; * significance at 10%.
Table 11. Digital transformation stage heterogeneity.
Variable(1)(2)
Early StageLater Stage
Digital3.9903.504 ***
(0.588)(4.520)
Lnsub0.003 **−0.001
(2.388)(−0.885)
Age0.019 ***0.033 ***
(12.776)(17.962)
Size0.0000.000
(1.012)(1.610)
Profit0.030 **0.080 ***
(2.368)(4.410)
Fincon0.0060.144 **
(0.110)(2.064)
Lnklr0.005−0.003
(0.952)(−0.340)
Constant0.0060.042
(0.391)(1.595)
Soe−0.412 ***−0.519 ***
(−5.510)(−4.695)
Prov effectYesYes
Industry effectYesYes
Observation75667569
R-squared0.3610.434
Note: *** significance at 1%; ** significance at 5%.
Disclaimer/Publisher’s Note: The statements, opinions and data contained in all publications are solely those of the individual author(s) and contributor(s) and not of MDPI and/or the editor(s). MDPI and/or the editor(s) disclaim responsibility for any injury to people or property resulting from any ideas, methods, instructions or products referred to in the content.

