Article

Effect of High-Strength Wastewater on Formation Process and Characteristics of Hydrophyte Periphytic Biofilms

1
Key Laboratory of Agro-Ecological Processes in Subtropical Regions, Institute of Subtropical Agriculture, Chinese Academy of Sciences, Changsha 410125, China
2
Changsha Research Station for Agricultural & Environmental Monitoring, Institute of Subtropical Agriculture, Chinese Academy of Sciences, Changsha 410125, China
3
University of Chinese Academy of Sciences, Beijing 100049, China
*
Author to whom correspondence should be addressed.
Sustainability 2025, 17(6), 2654; https://doi.org/10.3390/su17062654
Submission received: 4 February 2025 / Revised: 15 March 2025 / Accepted: 17 March 2025 / Published: 17 March 2025

Abstract

:
At present, studies on hydrophyte periphytic biofilm have mainly focused on natural water bodies or low-strength wastewater due to the inability of most plants to grow in high-strength wastewater. Therefore, the formation process and characteristics of plant periphytic biofilm growing in high-strength wastewater are still unclear. Based on the microcosm experiment, the formation process and characteristics of two kinds of plants (Myriophyllum elatinoides (Me) and Pontederia cordata (Pc)) periphytic biofilms were investigated with changes in water quality. The periphytic biofilm weight (BW) of Me and Pc reached equilibrium at 21 days, while the BW of Me was higher than that of Pc under high-load conditions (total nitrogen (TN) concentration ≥ 104.0 mg/L). When the TN concentration was 201.7 mg/L, the highest BW of Me was 0.99 mg/cm2. In addition, the structural complexity of hydrophyte periphytic biofilm was higher under TN concentrations ≥ 70.9 mg/L than that under TN concentrations ≤ 56.9 mg/L. N concentration and environmental factors could affect periphytic BW and biofilm Chlorophyll a (Chla.). Through linear regression fitting, it was found that periphytic BW and biofilm Chla. were positively correlated with the concentrations of NH4+-N and TN in water, while they were negatively correlated with the concentration of NO3-N. Random Forest results showed that NO3-N concentration had an important effect on hydrophyte periphytic BW. The results of this study provided a new understanding of the formation process and characteristics of aquatic plant periphytic biofilm under high-strength conditions and a prospect for sustainable development in the treatment of high-strength wastewater.

1. Introduction

High-strength wastewater with a high concentration of pollutants such as ammonia nitrogen (NH4+-N), total nitrogen (TN), and chemical oxygen demand (COD) comes from industrial wastewater, swine wastewater, and domestic wastewater [1,2,3]. At present, the main treatment methods for high-strength wastewater include physical methods, chemical methods, biological methods, and ecological methods. Constructed wetlands (CWs) are ecological methods used to treat high-strength wastewater because of their ecological friendliness, low energy consumption, and strong adaptability [4]. In contrast, traditional activated sludge processes often require multiple stages to achieve similar results and have limited efficiency in removing pollutants [5]. Moreover, CWs rely on natural processes, reducing energy consumption by 15–25% compared to conventional methods [6].
The removal of nitrogen (N) in CWs mainly included ammonia volatilization, nitrification, denitrification, plant uptake, and sediment adsorption [7]. The role of plants was very important. Plants directly absorbed nutrients such as N and phosphorus (P) in wastewater to meet their own growth and development needs [8,9,10]. In recent years, hydrophyte periphytic biofilms have been found to play an important role for N removal [11]. Periphytic biofilms were composed of a variety of microorganisms (bacteria, algae, fungi, protozoa, etc.) attached to a carrier and encapsulated in a matrix of extracellular polymers (EPS) [12,13,14]. Bacteria attached to the surface of media and other microbial communities through EPS and bacterial-secreted viscous substances, forming complex and stable filamentous or reticular structures [15]. In CWs, plants provided attachment points for the settlement of microbial communities and regulated activities of microorganisms by releasing oxygen and organic compounds [11]. A number of recent studies showed that periphytic biofilm was considered to be a hot area of N removal in CWs [15,16]. N removal pathway in periphytic biofilm included biological adsorption, biological assimilation, and microbial processes [15,16]. Meanwhile, the growth process of periphytic biofilm affected the removal efficiency of N. Studies have found that the growth of biofilm is restricted by environmental factors, such as water velocity, suspended solids, temperature, light, pH, and nutrient concentration [13,17,18,19]. Periphytic biofilm weight (BW), thickness, and density would increase when nutrient availability was enhanced in the lake [20,21]. Moreover, periphytic BW had a strong positive correlation with N removal [21,22]. However, most studies on periphytic biofilms have been carried out in low-strength wastewater. In high-strength wastewater, most plants could not tolerate high NH4+-N concentrations. Plants’ periphytic biofilms formed in high-strength wastewater, and their characteristics remain unclear.
We hypothesized that specific hydrophytes capable of tolerating high NH4+-N concentrations would promote the formation of periphytic biofilms with distinct structural and functional properties, thereby enhancing N removal efficiency in high-strength wastewater systems. To test this hypothesis, two kinds of plants with high NH4+-N tolerance were cultured in high-strength wastewater. The purpose of this study was to (1) analyze characteristics of water quality changes during the formation of plant periphytic biofilm, (2) explore the biofilm formation process and structural changes, and (3) clarify the relationship among periphytic BW, structure, and N concentration.

2. Materials and Methods

2.1. Experimental Setup

The Me (about 30 cm height) and the Pc (about 90 cm height) were collected from the Changsha Research Station for Agricultural and Environmental Monitoring, Institute of Subtropical Agriculture, Chinese Academy of Sciences. The submerged parts of the plant were washed with tap water and distilled water to wipe off the natural epiphytic biofilm. Then, they were placed in a clean bucket for use. Swine wastewater was obtained from a Dahua farm in Jinjing Town, Changsha County. The black plastic buckets had a capacity of 10 L (upper diameter: 260 mm, lower diameter: 220 mm).
Five treatments were set up in the experiment. Each treatment consisted of three replicates. The experimental treatments are shown in Table 1. Among them, the total amount of wastewater in each treatment group was 6 L. In each treatment group, the planting density of Me and Pc was 0.03 kg/m2 and 6 plants/barrel. The testing period was from May to June 2024. The duration of the operation period was 28 days.

2.2. Determination of Wastewater Concentration

Water samples were collected at 0, 1, 2, 3, 7, 14, 21, and 28 days (d). NH4+-N and NO3-N were filtered through a 0.45 μm pore size membrane before determination. TN concentration was digested by alkaline potassium persulfate and determined using the AA3 flow analyzer. The pH, Eh, DO, and water temperature (WT) values of the water samples were measured in situ with a Sanxin SX825 portable pH/oxygen analyzer (Shanghai Sanxin Co., Ltd., Shanghai, China).

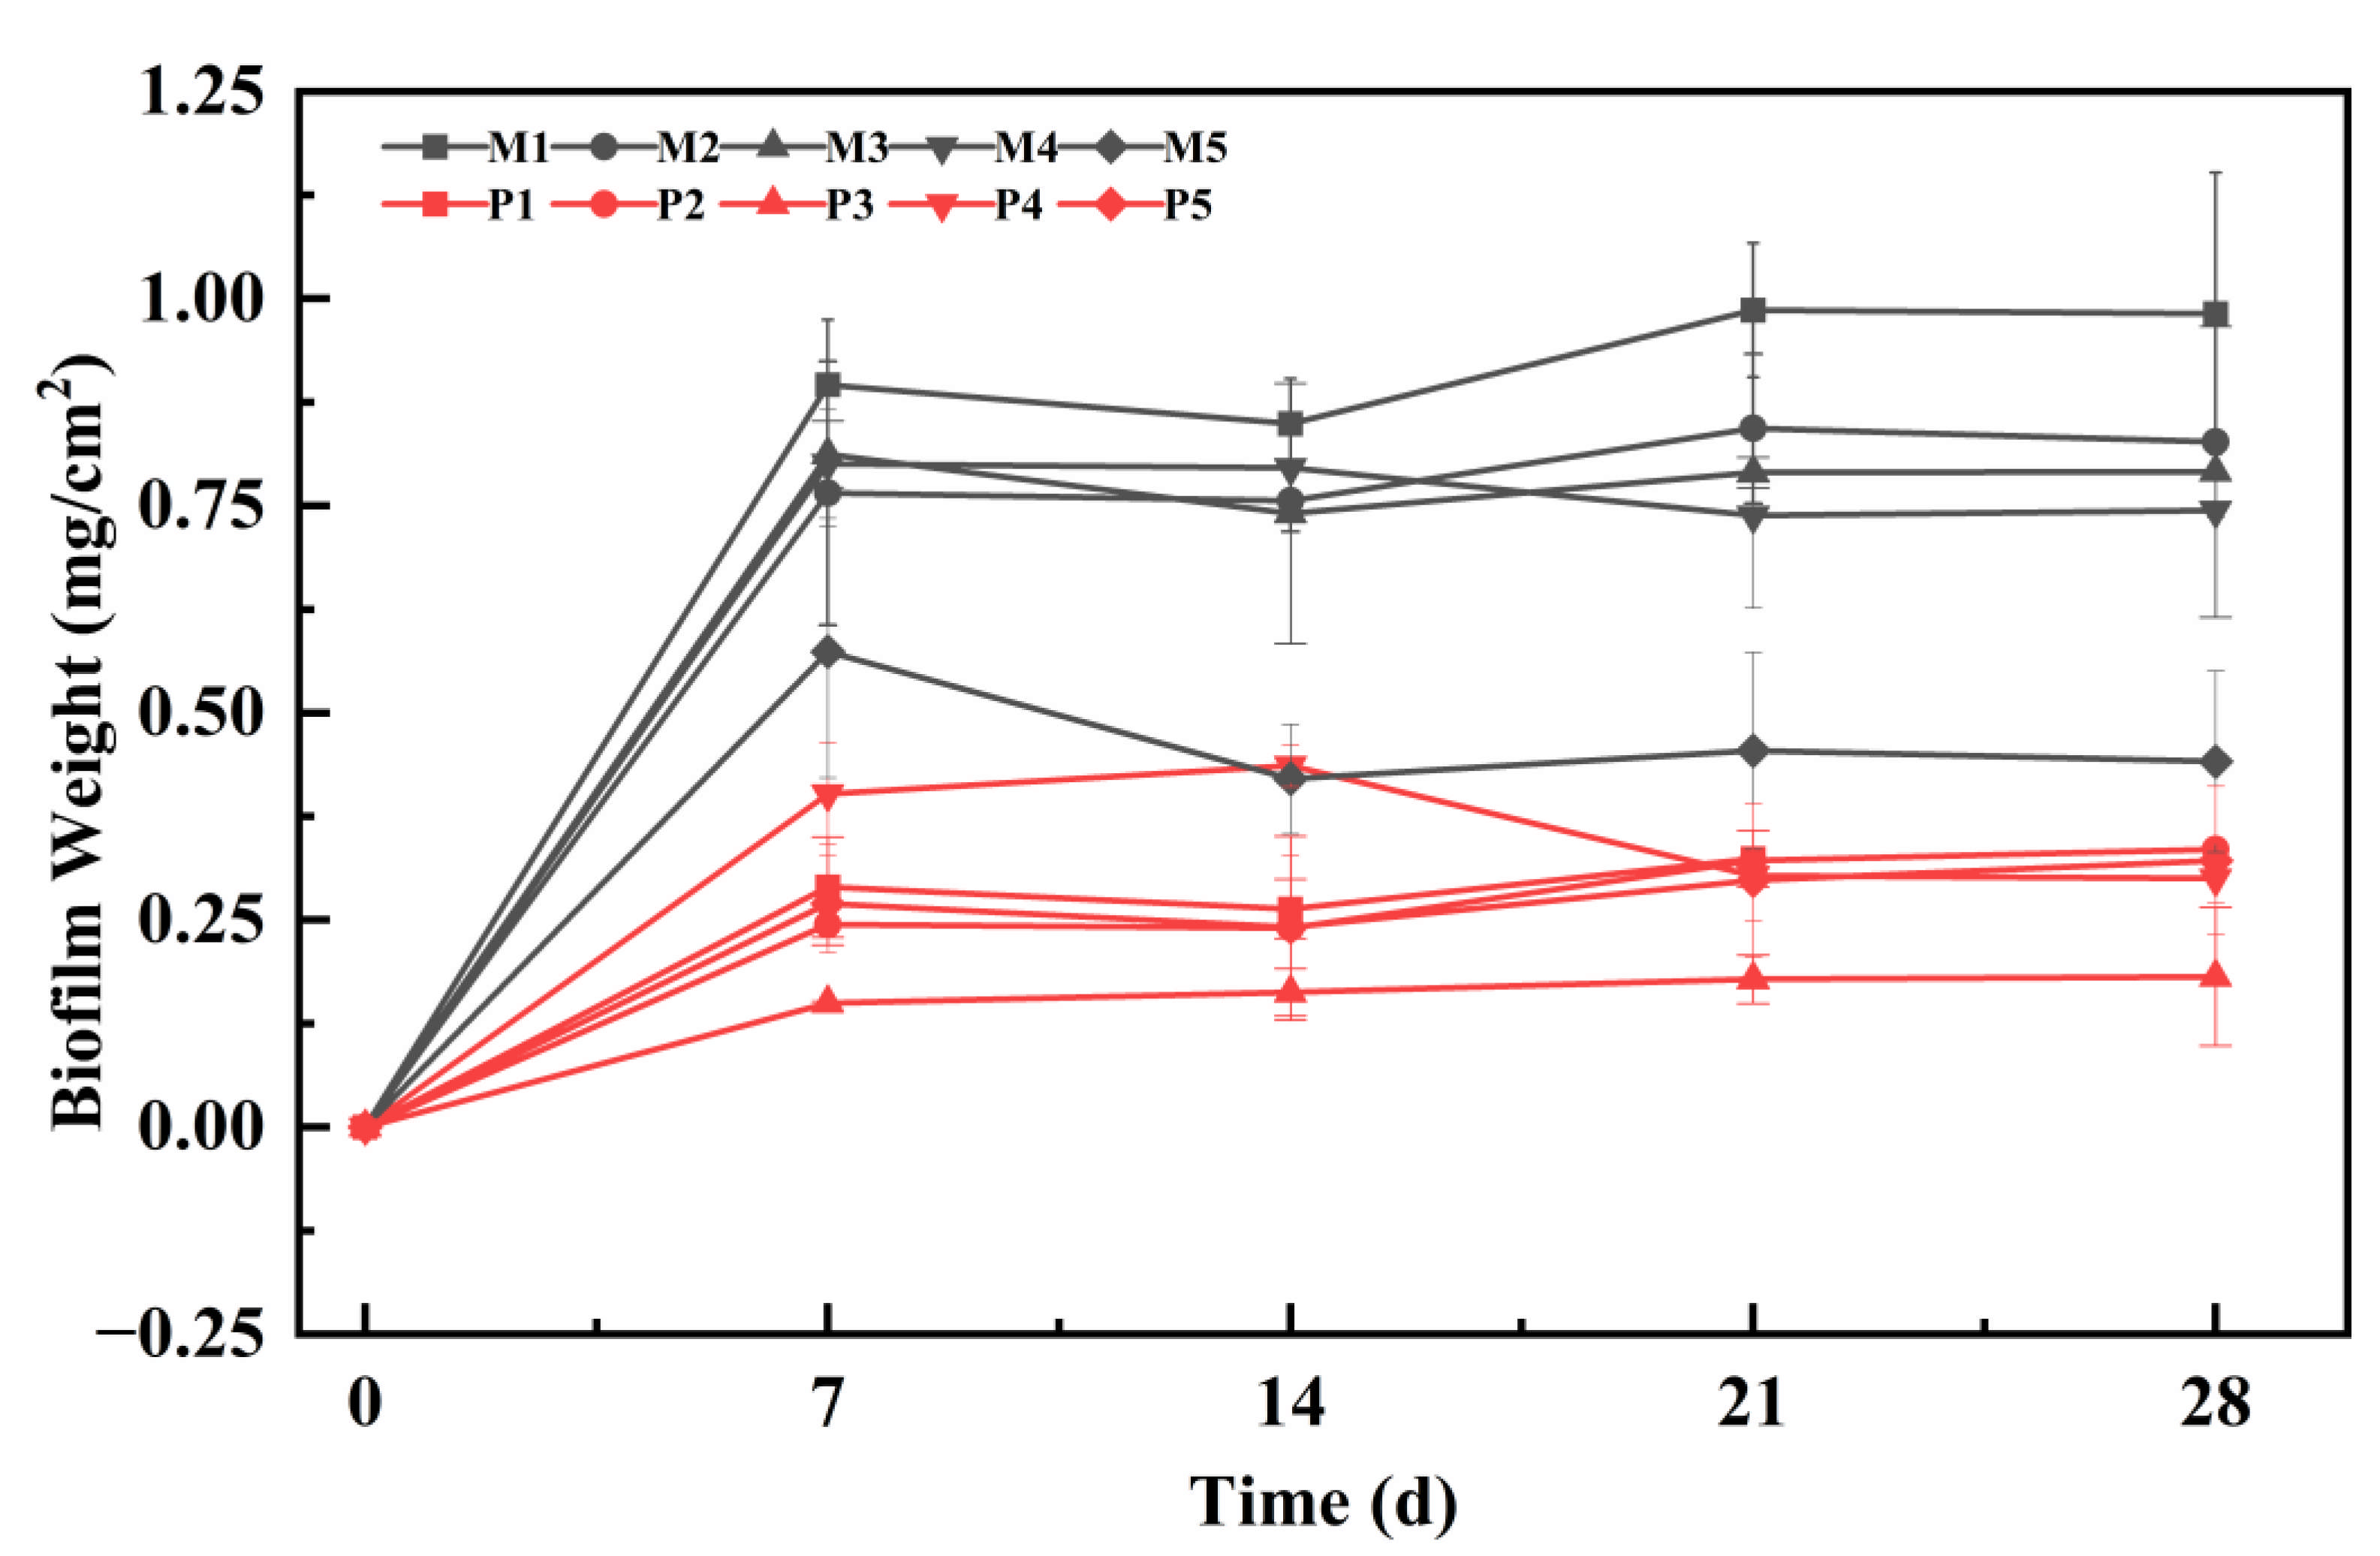
2.3. Weight of Periphytic Biofilm

Biofilm samples were collected at 7, 14, 21, and 28 days. Forty mL of alcohol was added to the centrifuge tube, sonicated for 10 min, then shaken at 180 rpm for 1 h, and sonicated again for 10 min. Then, the roots and leaves of aquatic plants were discarded, and eluate was pumped through a suction and filtration device. This allowed the eluted epiphytic biofilm to be trapped on a 0.22 μm filter membrane, which had been pre-dried and weighed. The filter membrane was placed in an aluminum box and dried to a constant weight at 105 °C. Then, the filter membrane was weighed, which provided the weight of the epiphytic biofilm.

2.4. Chlorophyll a (Chla.) of Periphytic Biofilm

The determination of biofilm Chla could represent the content of algae in biofilm structure [22]. Biofilm was obtained as previously described through sonication and a filtration device. The filter membrane was frozen overnight and then quickly extracted with 8 mL of hot ethanol in a hot water bath for 2 min. After ultrasonic crushing for 15 min, the extract was left in the dark for 6 h. After centrifugation at 5000 rpm and 4 °C for 5 min, 3.5 mL of the supernatant was taken and placed in a cuvette. The absorbance values at 665 nm and 750 nm were measured using a UV-visible spectrophotometer UV2600 (Shimadzu, Kyoto, Japan).

2.5. Scanning Electron Microscope (SEM) and Confocal Laser Scanning Microscopy (CLSM)

The treated plant slices for SEM were immersed in 100% tert–butanol solution and sent to the electron microscope chamber for scanning. Scanning was performed with a field emission scanning electron microscope, SU8010 (Hitachi, Tokyo, Japan).
Plant slices used for CLSM were washed 2–3 times with 0.01 M PBS and quickly placed in 2.5% pentylene glycol for 2 h to fix the biofilm. The samples were placed in a lens box and taken to the laboratory for analysis with a confocal laser microscope LSM880 (Carl Zeiss AG, Jena, Germany).

2.6. Fourier Transform Infrared Spectroscopy Scanning

A total of 40 mL distilled water was added to the centrifuge tube, sonicated for 10 min, then shaken at 180 rpm for 1 h, and sonicated again for 10 min. The hydrophyte periphytic biofilm eluate was freeze-dried for Fourier transform infrared to determine characteristics of extracellular polymers (EPS). FTIR test conditions were as follows: the test range was 400~4000 cm−1, the distinguishability was 4 cm−1, and the number of scanning times was 32.

2.7. Random Forest Prediction

In this study, the percentage of increase in mean square error (%IncMSE) method was used to evaluate the importance of N concentration and other environmental factors on the BW of hydrophytes. The basic idea of the method was to randomly arrange or delete features, then compare the differences in model performance, and calculate the %IncMSE value of each feature, which reflected the relative importance of features in the model. A larger %IncMSE value indicated a greater impact of the feature on the model the and a higher importance of the feature.
Three parameters—mean absolute error (MAE), root mean square error (RMSE), and coefficient of determination (R2)—were used to evaluate model prediction results. The calculation formula for each parameter is as follows [23]:
Mean absolute error (MAE),
M A E = i = 1 n | y i ŷ i | n
yi was the input data, and ŷi was the predicted value.
Root mean square error (RMSE),
R M S E = y i ŷ i 2 n
yi was the true value, and ŷi was the predicted value.
Coefficient of determination (R2),
R 2 = 1 i = 1 n ŷ l y i 2 i = 1 n y i y i 2
yi was the input data, ŷl was the predicted value, and yi was the average of input value.

2.8. Statistic Analysis

R (v4.4.1), Origin (v2025), and Excel (2019) were used to draw figures and tables. All statistical analyses were performed using SPSS software (v25.0). The means of three replicates were presented for all data. The normal distribution of variables was checked through a one-sample Kolmogorov–Smirnov test. The correlation test was evaluated through the Pearson correlation test. All significance tests were conducted at the 0.05 level (p < 0.05).

3. Results

3.1. Water Quality Changes

The characteristics of temporal changes in N concentration in water are shown in Figure 1.
In this study, Me had greater N removal efficiencies in M1, M2, and M3 than Pc in P1, P2, and P3. The N removal efficiencies in M1, M2, and M3 were 75.0%, 70.7%, and 74.4%, respectively. However, Pc had greater N removal efficiencies in P4 and P5 than Me in M4 and M5. The N removal efficiencies were 86.4% and 84.7% in P4 and P5, respectively. The concentrations of NH4+-N and TN in Me and Pc fluctuated slightly for 3 days but showed a downward trend.
Before the third day, NO3-N concentration showed a downward trend followed by an upward trend, which was related to a strong nitrification reaction in the early stage of the experiment that produced a large amount of NO3-N. Studies have shown that wastewater flows into CWs in the early stage, and the nitrification reaction is strong, resulting in a large amount of NO3-N accumulation [24,25]. After 7 d, the NO3-N concentration decreased. It was possible that the nitrification reaction had weakened. Part of the NO3-N was absorbed by the plants [23,26,27], and part of the NO3-N was removed by denitrification [28].
Changes in environmental factors are shown in Figure 2 during the experiment. The pH value ranged from 7.13 to 8.23. The change in pH value was a gradual decline. Eh ranged from −91.67 mV to −20.33 mV. DO ranged from 0.04 to 2.30 mg/L. The DO and Eh values gradually increased. In the study, DO was at a low level. A study showed that wastewater with a high N concentration would result in a lower DO value [29].

3.2. Formation Process and Structural Changes in Hydrophyte Periphytic Biofilms

The characteristics of temporal changes in the weight of Me and Pc periphytic biofilms are shown in Figure 3 at different wastewater concentrations.
For both Me and Pc, periphytic BW of plants in different wastewater treatments increased and then leveled off on 21 d. However, it decreased slightly in some treatment groups (M4, M5, P4, P5) and also leveled off on 21 d. In this study, Me periphytic BW was the highest in M1, reaching 0.99 mg/cm2, while Pc periphytic BW was highest in P4, reaching 0.44 mg/cm2. On the whole, periphytic BW in Me was higher than that in Pc at each time. For Me, periphytic BW in M1 was the highest, followed by M2, indicating that Me periphytic biofilms were better formed in high N concentration wastewater (104.0 mg/L ≤ TN concentration ≤ 201.7 mg/L). For Pc, periphytic BW in P4 was the highest, followed by P5, suggesting that Pc periphytic biofilms were better formed in low N concentration wastewater (46.1 mg/L ≤ TN concentration ≤ 56.9 mg/L).
The temporal changes in Chla. in hydrophyte periphytic biofilms are shown in Table 2 across different wastewater treatments. The biofilm Chla. of Me was much higher than that of Pc in each treatment at 14 and 28 d. When wastewater concentration was at its highest, the biofilm Chla. of Me was also the highest, reaching 398.0 μg/L. However, the biofilm Chla. of Pc was 0 in P1, P2, P3, and P4. The reason might be that the death of the Pc surface roots caused the crushing of plant cells during the experimental period.
Figure S1 illustrates SEM of hydrophyte periphytic biofilms in different treatments. Me periphytic biofilm complexity in each treatment was higher than that of Pc on 14 d by SEM. The periphytic biofilm surface of Me was mainly composed of bacilli (red circle) and even minerals (blue circle) in M1. A large number of bacilli aggregates were wrapped and connected into sheets by EPS. Bacteria (green circle) and fungi (yellow circle) were the main microorganisms in the Pc periphytic biofilm. Microbial aggregates were mostly formed on the plant surface depressions and around fungal hyphae. In particular, there were minerals on the surface of Me, while there were a large number of fungi on the surface of Pc. Moreover, the distribution of microorganisms attached to the biofilm surface was observed. It was found that a large number of microorganisms gathered in the uneven parts of the rhizome. In general, microbial complexity and coverage of periphytic biofilm on the surface of Pc were lower than those on Me under high-strength wastewater.
CLSM analysis of periphytic biofilms for Me and Pc under different treatment conditions is illustrated in Figure 4. Through confocal laser imaging, the surface of microbes colonizing plant roots is shown, which then produced EPS. EPS wrapped microorganisms together, then formed aggregates, and finally formed periphytic biofilms. By comparing the structure of periphytic biofilms of Me and Pc, it was found that while the periphytic biofilm of Pc was still in the microbial colonization stage, microorganisms on the surface of Me secreted a large number of proteins (red) and polysaccharides (blue), which wrapped and connected microorganisms together. The complexity of hydrophyte periphytic biofilms in the high-strength swine wastewater was higher than that in the low-strength swine wastewater. In addition, the thickness of hydrophyte periphytic biofilms was also related to the type of hydrophyte and the concentration of wastewater. Biofilm thickness was not consistent among the treatments (Figure 4). The periphytic biofilm thickness of Me in M1–M5 was greater than that of Pc in P1-P5. In M1, the highest periphytic biofilm thickness reached 8.8 μm at 28 d. In P1, the highest Pc periphytic biofilm thickness reached 5.0 μm at 14 d. Therefore, periphytic biofilm thickness was higher at high N concentrations than at low N concentrations.
Figure 5 shows the FTIR spectra of hydrophyte periphytic biofilms at different times in different treatments. Periphytic biofilms in the different treatments had a wide absorption peak at 3200~3400 cm−1, which was mainly due to the stretching vibration of hydroxyl (OH) in the biofilm. The absorption peaks at 2840~2930 cm−1 were antisymmetric stretching vibration and symmetric stretching vibrations of -CH2 on saturated carbon chain. In the vicinity of 1650 cm−1 and 1430 cm−1, the absorption peaks corresponded to stretching vibrations of carbonyl (C=O) and amino (-NH2) groups in the amide, suggesting the presence of proteins on the biofilm. In addition, two characteristic stretching peaks existed in each treatment, indicating that there were a large number of carboxyl functional groups on the biofilm. The absorption peak near 1029 cm−1 was the stretching vibration, which was caused by the C-O group. This functional group was related to polysaccharide derivatives, suggesting the presence of polysaccharides on the biofilm.

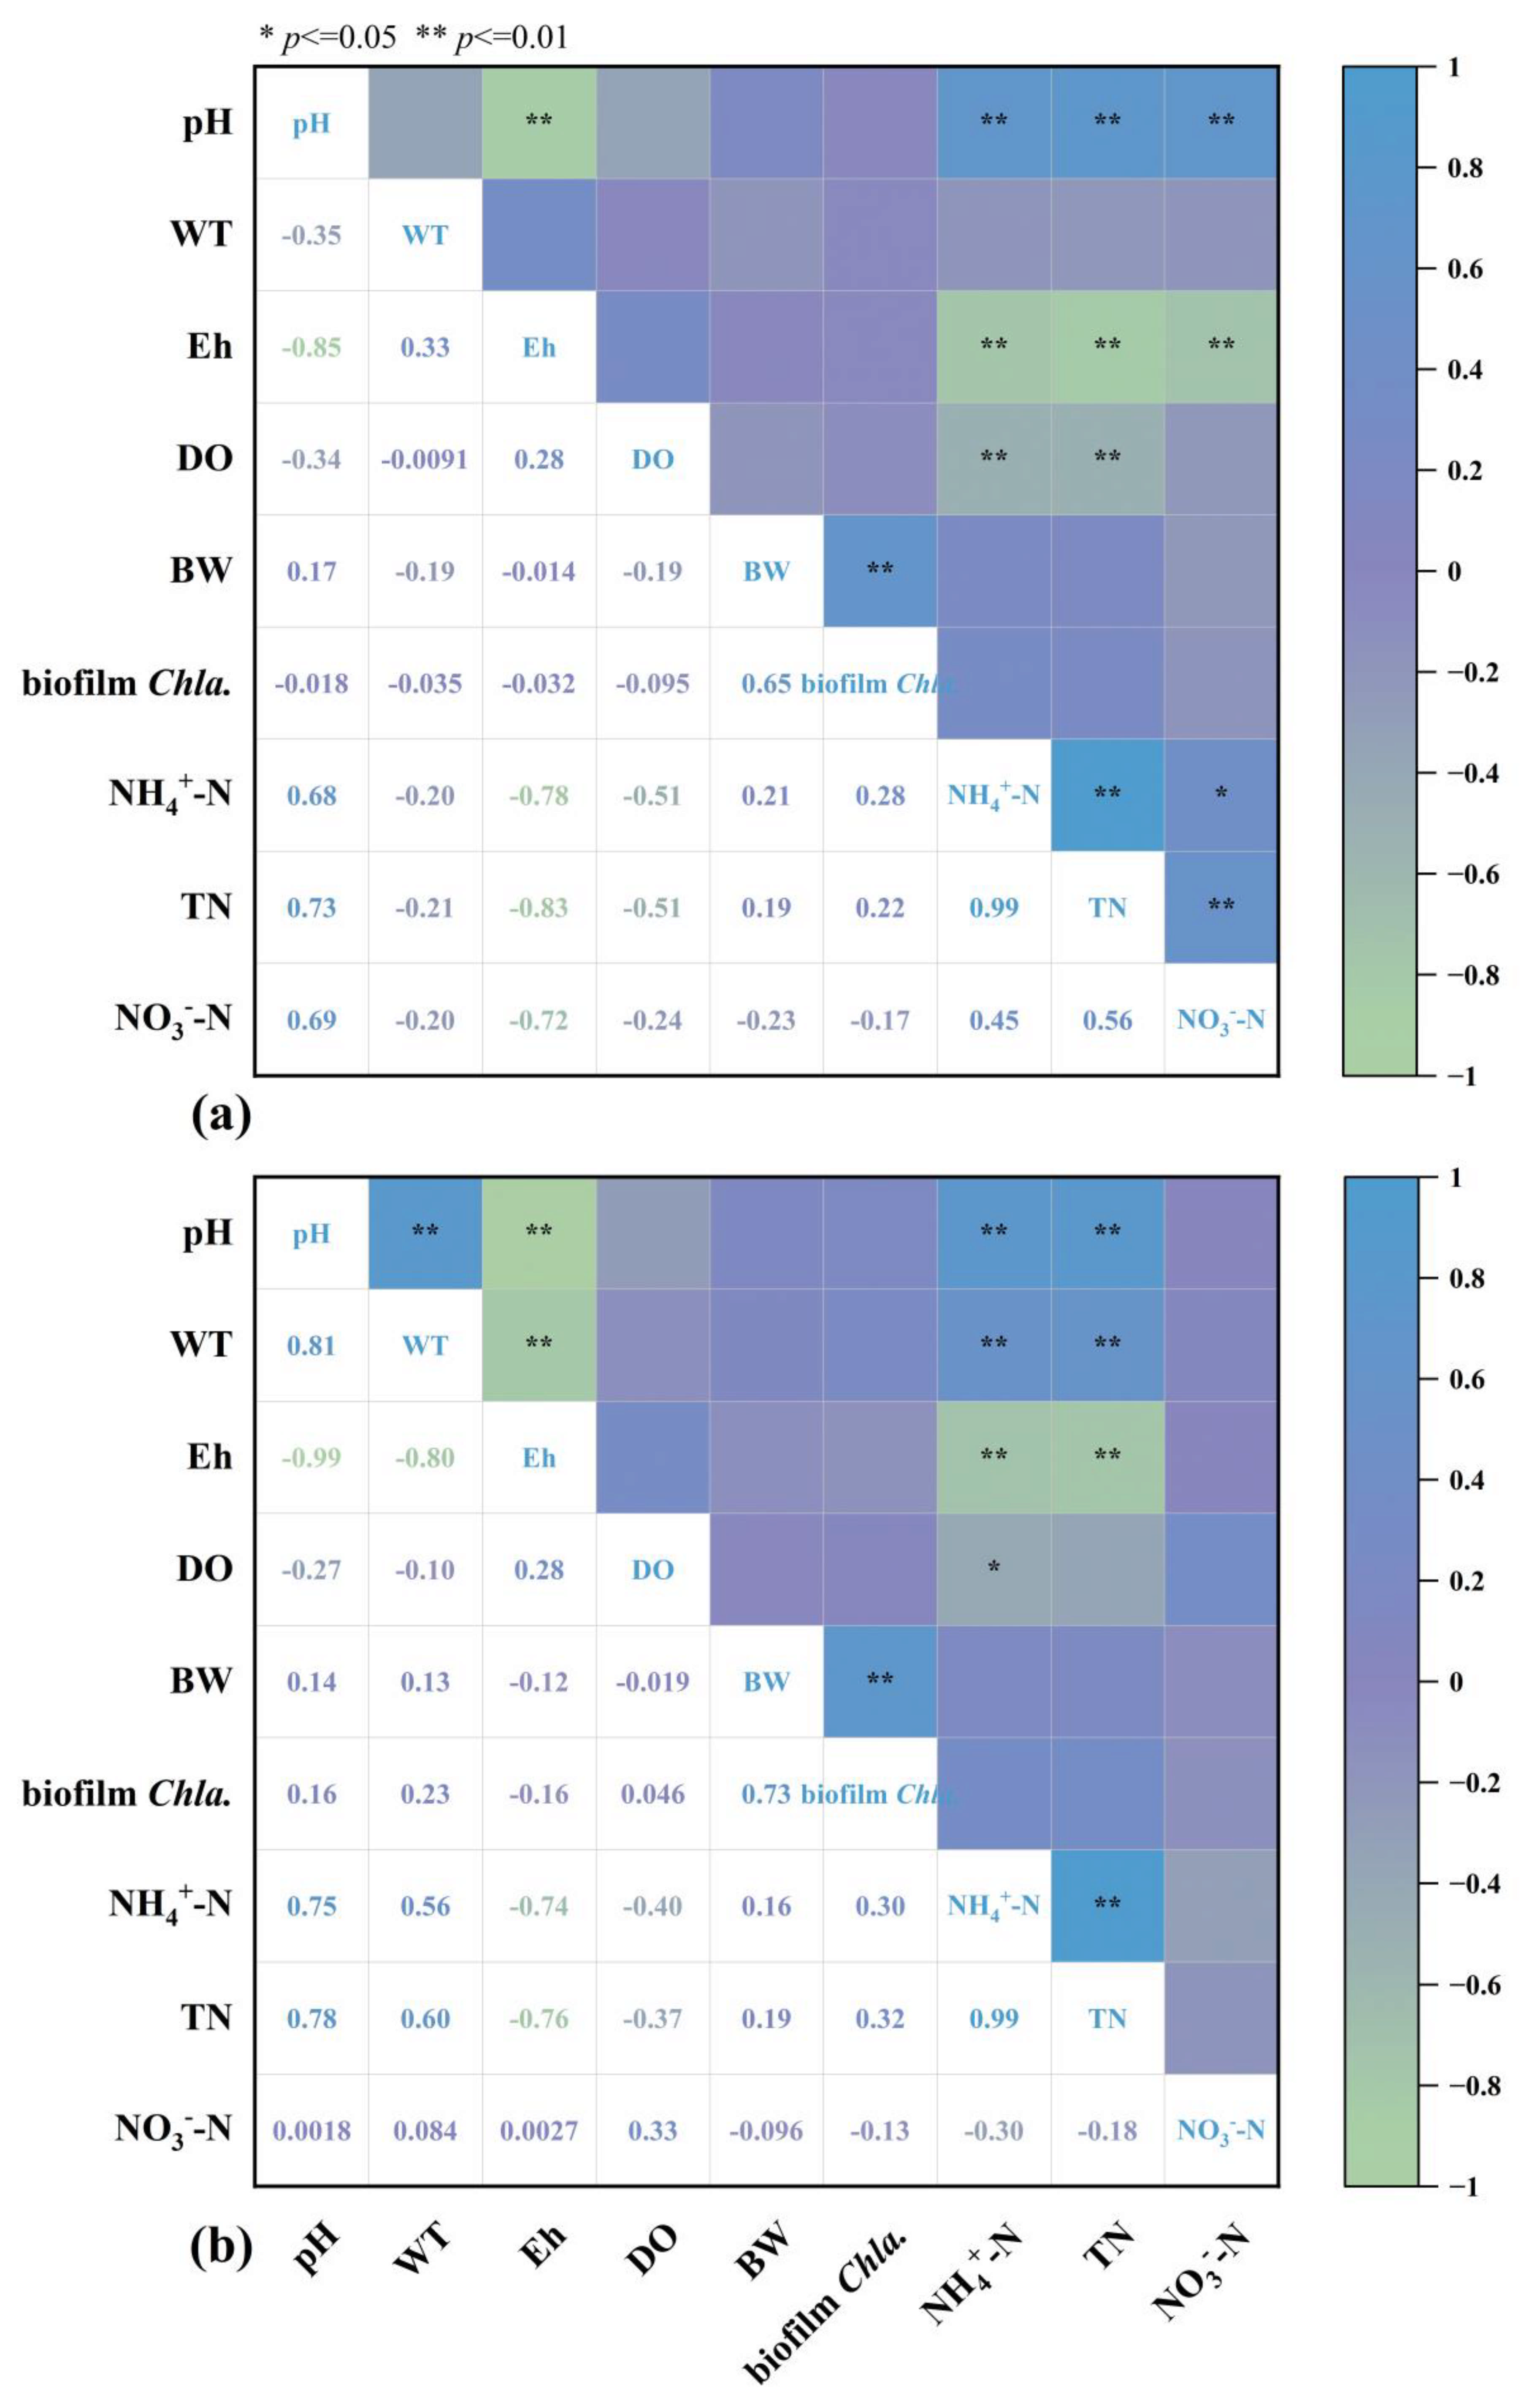
3.3. Relationship Between Environmental Factors and Hydrophyte Periphytic Biofilms

On 14 d, hydrophyte periphytic BW (Me and Pc) were positively correlated with Chla. (Me and Pc) content (p < 0.01) (Figure 6). The data demonstrated that as BW increased, the Chla. content of hydrophyte periphytic biofilm also increased. A similar trend was observed on 28 d. In this study, we found BW and Chla. content of the hydrophyte periphytic biofilm were positively correlated with pH, WT, Eh, DO, TN, and NH4+-N.
Linear correlation analysis of hydrophyte periphytic BW, Chla. content, and N concentration in the water is displayed in Figure S2.
During the experimental period, hydrophyte periphytic BW was positively correlated with concentrations of NH4+-N and TN. It indicated that the amount of hydrophyte periphytic biofilm increased with N concentration. However, there was a negative correlation between BW and concentration of NO3-N. With the increase of NO3-N concentration, BW decreased. These data showed that higher NO3-N concentrations could influence the formation of biofilm. The results of Chla were consistent with BW. There was a negative correlation between the concentration of NO3-N and the content of Chla.

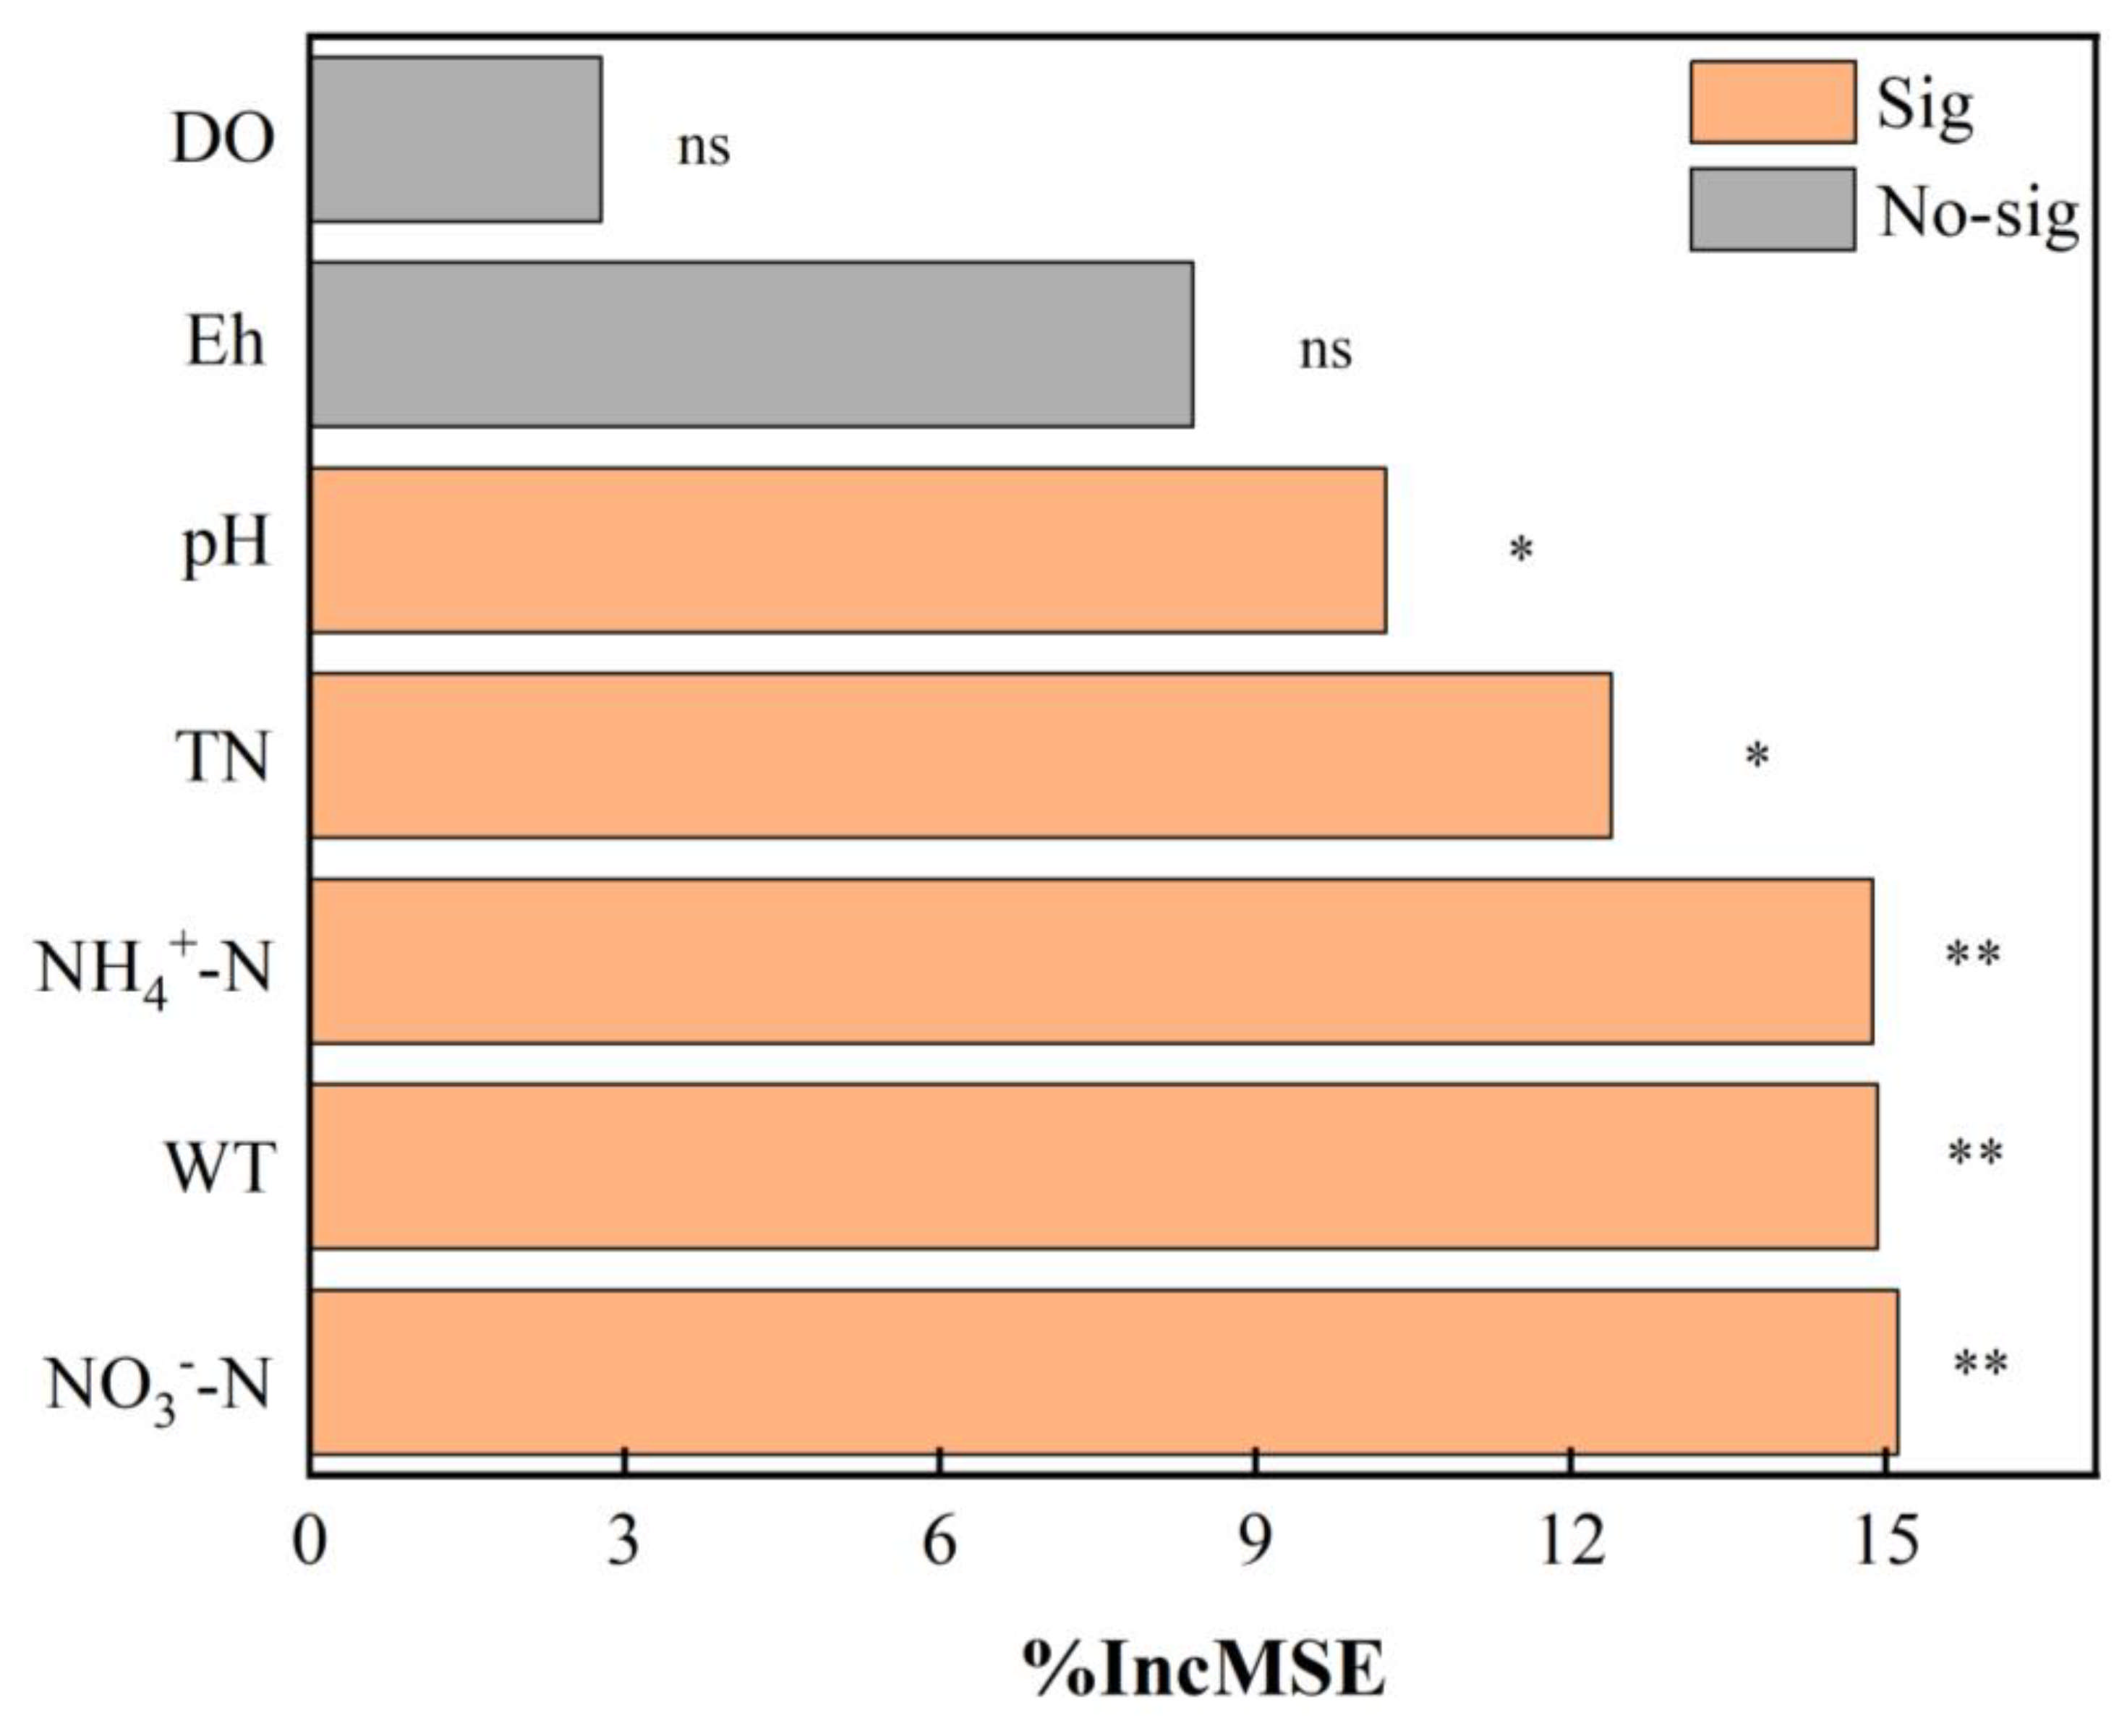
3.4. Forecast of Formation Process of Hydrophyte Periphytic Biofilms

The results of the RF model are demonstrated in Table S1. For the prediction of BW, the R2 of the RF model showed that the model could explain 63.71% of the variation in BW, with an MAE of 0.13 mg/cm2 and a RMSE of 0.17 mg/cm2, indicating that the model had high predictive accuracy and small error. The R2 was 63.71%, greater than 50%, indicating that the model was valid. There was a linear distribution of training and testing (Figure S3). It showed that data were focused on the linear regression line of training. Thus, the precision and accuracy of the RF model were good. The effect of relevant explanatory variables on BW was NO3-N (15.11%) > WT (14.92%) > NH4+-N (14.88%) > TN (12.39%) > pH (10.24%) > Eh (8.40%) > DO (2.77%) (Figure 7). Hydrophyte periphytic BW could respond sensitively to changes in microhabitat conditions in a water environment. In this study, the importance ratio of NO3-N in water was the most important ratio to BW, suggesting that NO3-N concentration was the most important indicator for biofilm formation.

4. Discussions

4.1. Hydrophyte Periphytic Biofilm Formation and Structure

The Me and Pc had a good effect on the removal of NH4+-N and TN in high-strength wastewater, which was consistent with the previous research results [30,31,32]. In CW systems, hydrophytes satisfied their growth and development needs by directly absorbing N, P, and other nutrients from wastewater [8]. The results showed higher N removal efficiencies of Me in M1, M2, and M3 compared to Pc in P1, P2, and P3, while Pc demonstrated superior N removal efficiencies in P4 and P5 over Me in M4 and M5. The possible reason was that the difference in N removal of Me and Pc under different N concentrations was mainly related to plant physiological characteristics, metabolic pathways, root structure, and microbial synergies.
In this study, there was a positive correlation between pH and concentration of NH4+-N and TN. The research reported that the pH in water with high NH4+-N was higher [33,34]. The low concentration of DO was probably due to the high input of the N load. Under the condition of low DO, the reducing substances dominated, so Eh in the system was low [35]. The concentration of DO increased during the experimental period. Hydrophytes could produce oxygen, resulting in increasing DO.
Biofilms were spatially structured microbial communities with complex symbiotic interaction networks [36]. These biofilms not only had important ecological functions but also played a key role in water purification and nutrient cycling [37,38]. While biofilm formation typically required 20–30 days in low-strength wastewater [39,40], our study observed accelerated biofilm development (15–20 days) under high NH4+-N conditions, likely due to enhanced microbial activity driven by nutrient availability. In the process of biofilm formation, microorganisms secreted EPS to enhance their adhesion to carrier [12,14]. EPS was mainly composed of polysaccharides, proteins, and nucleic acids, which not only provided physical support but also interacted with the carrier surface through hydrogen and ionic bonds to enhance the stability of the biofilm [41].
Through CLSM and FTIR, we discovered the existence of polysaccharides, proteins, and nucleic acids in the hydrophyte periphytic biofilm. Hydroxyl group, carbonyl group, amino group, and carboxyl group on biofilm improved the ability of N removal. The hydroxyl group had good hydrophilicity and formed hydrogen bonds with N compounds in water, thus improving solubility and bioavailability of N [42,43]. The hydroxyl group also adsorbed and bonded NO3-N in water because of hydrogen bonding, ion interaction, and microbial action [44]. The presence of the carbonyl group could promote the utilization of N by microorganisms and improve N removal efficiency [44,45]. The amino group could form hydrogen bonds or covalent bonds with NH4+-N to promote N fixation and conversion [42]. Therefore, the presence of carbonyl and amino groups contributed to the growth of microorganisms in biofilms and enhanced the removal ability of N. Most polysaccharides and derivatives contained carboxyl functional groups, which had good hydrophilicity and electronegativity. They could form ionic bonds with cations such as NH4+-N to adsorb and bind NH4+-N in water [46,47].
The content of hydrophyte periphytic biofilm Chla. could reflect abundance and activity of photosynthetic organisms [48,49]. In this study, we found that biofilm Chla. was higher at high N concentration than at low N concentration, demonstrating that abundance and activity of photosynthetic organisms were higher in high-load wastewater. A study also found that hydrophyte periphytic biofilm Chla. was higher under high-strength conditions [48]. This phenomenon showed that biofilm Chla. was affected by N concentration.

4.2. Relation Between Biofilm Formation and Water Environmental Factors

Various studies have shown that hydrophyte periphytic biofilm formation was affected by environmental factors such as pH, Eh, WT, DO, and nutritional levels [17,18]. In this study, we found that both BW and Chla. content were positively correlated with several environmental factors, including pH, WT, TN, and NH4+-N concentrations. Higher pH levels supported biofilm growth by creating a more suitable environment for microbial and algal activity, which are key components of periphytic biofilms [41,47,50]. The concentration of N in the water had a certain relationship with BW and the content of Chla. Studies have shown that the addition of N increased the biomass of biofilm [51]. Geng et al. [18] analyzed submerged macrophyte epiphytic biofilms in the industrial area of Hangzhou and found that the structure of biofilms was significantly affected by the concentration of TN. Higher N concentrations provided essential nutrients for microbial and algal growth, directly supporting biofilm biomass and photosynthetic pigment production [47,52]. The results of this study showed that BW and Chla. Were positively correlated with concentrations of NH4+-N and TN, but negatively correlated with NO3-N. It was speculated that higher NO3-N concentrations could have a toxic effect on hydrophytes and thus indirectly affect the formation of periphytic biofilms [53,54]. Studies reported that at low nitrate concentration, plants might not be able to effectively absorb and use NO3-N, resulting in limited Chla. synthesis [55,56].
Through the RF model, the concentration of NO3-N was the key factor influencing hydrophyte periphytic biofilm. Due to the formation of hydrophytes, periphytic biofilms were affected by N supply and NO3-N concentration. In this study, NO3-N concentration was at a low level, which was a limiting factor of biofilm formation. Mu et al. [19] also found that temperature played a decisive role in the Myriophyllum spicatum-biofilm system. This was similar to the results of this study, which found that WT influenced the hydrophyte periphytic biofilm.

4.3. Techno-Economic Assessment

Based on previous experimental results, Me and Pc as hydrophytes with high NH4+-N tolerance were used in CWs to treat swine wastewater [57,58]. On one hand, the construction cost of CWs was more than one-third less than that of conventional treatment of swine wastewater. On the other hand, these two kinds of plants had high N absorption capacity, which improved N removal efficiency in CWs [59,60]. Compared with other plants, under the condition of ensuring the same N removal efficiency, CWs area and construction cost could be reduced. These two kinds of plant CWs had a wide application prospect in the treatment of high-strength wastewater.

5. Conclusions

This study investigated the growth of hydrophyte periphytic biofilm under different loading conditions over 28 d. The BW was leveled off on 21 d. Different load conditions and environmental factors (pH, Eh, WT, DO) in water affected the BW and Chla. content of hydrophyte biofilm. By observing the periphytic biofilm structure, microbial complexity and coverage of biofilm varied among different hydrophytes at varying N concentrations. In high N concentration, the thickness and microbial complexity of the hydrophyte periphytic biofilm formed were greater than those in low N concentration. It was found that the concentration of NO3-N in water had the greatest influence on the BW by RF in this study. This study had a clear establishment of the formation process of hydrophyte periphytic biofilm and provided effective information for research of hydrophyte periphytic biofilm under high-load conditions.

Supplementary Materials

The following supporting information can be downloaded at: https://www.mdpi.com/article/10.3390/su17062654/s1, Figure S1: SEM photographs of hydrophyte periphytic biofilms under different wastewater concentration; Figure S2: Correlations analysis of BW, biofilm Chla. and N concentration; Figure S3: Scatter of observed and predicted BW; Table S1: Model performance of random forest model for BW.

Author Contributions

X.L.: conceptualization, methodology, resources, writing—review and editing. Y.L.: conceptualization, methodology, resources. J.W.: writing—review and editing. M.Z.: formal analysis, investigation. L.C.: data curation, formal analysis, investigation, writing—original draft. All authors have read and agreed to the published version of the manuscript.

Funding

This work was funded by the National Natural Science Foundation of China (42077215, 42177110).

Institutional Review Board Statement

Not applicable.

Informed Consent Statement

Not applicable.

Data Availability Statement

The original contributions presented in this study are included in the article. Further inquiries can be directed at the corresponding author.

Acknowledgments

We thank the Public Service Technology Center, the Institute of Subtropical Agriculture, and the Chinese Academy of Sciences for providing the experimental platform.

Conflicts of Interest

The authors declare no competing financial interest.

References

  1. Hu, Y.A.; Cheng, H.F.; Tao, S. Environmental and human health challenges of industrial livestock and poultry farming in China and their mitigation. Environ. Int. 2017, 107, 111–130. [Google Scholar] [CrossRef] [PubMed]
  2. Xie, Y.D.; Zhang, Q.H.; Dzakpasu, M.; Zheng, Y.C.; Tian, Y.; Jin, P.K.; Yang, S.J.; Wang, X.C. Towards the formulation of rural sewage discharge standards in China. Sci. Total Environ. 2021, 759, 143533. [Google Scholar] [CrossRef] [PubMed]
  3. Xu, Y.; Li, H.Y.; Li, Y.; Zheng, X.Q.; Zhang, C.X.; Chen, P.Z.; Li, Q.; Tan, L. Systematically assess the advancing and limiting factors of using the multi-soil-layering system for treating rural sewage in China: From the economic, social, and environmental perspectives. J. Environ. Manag. 2022, 312, 114912. [Google Scholar] [CrossRef] [PubMed]
  4. Alexandros, S.I.; Akratos, C.S. Removal of pathogenic bacteria in constructed wetlands: Mechanisms and efficiency. Phytoremediat. Manag. Environ. Contam. 2016, 4, 327–346. [Google Scholar]
  5. Kadlec, R.H.; Wallace, S. Treatment Wetlands; CRC Press: Boca Raton, FL, USA, 2008. [Google Scholar]
  6. Zhang, D.; Gersberg, R.M.; Keat, T.S. Constructed wetlands in China. Ecol. Eng. 2009, 35, 1367–1378. [Google Scholar] [CrossRef]
  7. Li, X.; Li, Y.Y.; Li, Y.; Wu, J.S. The phytoremediation of water with high concentrations of nitrogen and phosphorus contamination by three selected wetland plants. J. Water Process Eng. 2021, 40, 101828. [Google Scholar] [CrossRef]
  8. Bustamante, M.A.O.; Mier, M.V.; Estrada, J.A.E.; Domíguez, C.D. Nitrogen and potassium variation on contaminant removal for a vertical subsurface flow lab scale constructed wetland. Bioresour. Technol. 2011, 102, 7745–7754. [Google Scholar] [CrossRef]
  9. Wang, P.; Wang, Z.-K.; Sun, X.-C.; Mu, X.-H.; Chen, H.; Chen, F.-J.; Yuan, L.-X.; Mi, G.-H. Interaction effect of nitrogen form and planting density on plant growth and nutrient uptake in maize seedlings. J. Integr. Agric. 2019, 18, 1120–1129. [Google Scholar] [CrossRef]
  10. Wang, X.-L.; Shan, Y.-H.; Wang, S.-H.; Du, Y.; Feng, K. Physiological Responses of Two Wheat Cultivars to Nitrogen Starvation. Agric. Sci. China 2011, 10, 1577–1585. [Google Scholar] [CrossRef]
  11. Huang, Z.R.; Liu, F.; Luo, P.; Zhang, S.N.; Li, H.F.; Liu, J.; Wu, J.S. Pilot-scale constructed wetlands for swine wastewater treatment: Microbial community analysis in bacterioplankton and epiphyton and options for resource recovery. J. Water Process Eng. 2020, 37, 101466. [Google Scholar] [CrossRef]
  12. Geng, N.; Wu, Y.C.; Zhang, M.; Tsang, D.C.W.; Rinklebe, J.; Xia, Y.F.; Lu, D.B.; Zhu, L.F.; Palansooriya, K.N.; Kim, K.H.; et al. Bioaccumulation of potentially toxic elements by submerged plants and biofilms: A critical review. Environ. Int. 2019, 131, 105015. [Google Scholar] [CrossRef] [PubMed]
  13. Liu, Y.S.; Gong, L.X.; Mu, X.Y.; Zhang, Z.Q.; Zhou, T.T.; Zhang, S.H. Characterization and co-occurrence of microbial community in epiphytic biofilms and surface sediments of wetlands with submersed macrophytes. Sci. Total Environ. 2020, 715, 136950. [Google Scholar] [CrossRef] [PubMed]
  14. Zhao, Z.H.; Qin, Z.R.; Xia, L.L.; Zhang, D.; Mela, S.M.; Li, Y. The responding and ecological contribution of biofilm-leaves of submerged macrophytes on phenanthrene dissipation in sediments. Environ. Pollut. 2019, 246, 357–365. [Google Scholar] [CrossRef] [PubMed]
  15. Zhang, S.H.; Pang, S.; Wang, P.F.; Wang, C.; Guo, C.; Addo, F.G.; Li, Y. Responses of bacterial community structure and denitrifying bacteria in biofilm to submerged macrophytes and nitrate. Sci. Rep. 2016, 6, 36178. [Google Scholar] [CrossRef]
  16. Mu, X.Y.; Zhang, S.H.; Han, B.; Hua, Z.L.; Fu, D.W.; Li, P. Impacts of water flow on epiphytic microbes and nutrients removal in constructed wetlands dominated by Vallisneria natans with decreasing temperature. Bioresour. Technol. 2020, 318, 124058. [Google Scholar] [CrossRef]
  17. Chen, H.Z.; Zhang, S.H.; Lv, X.; Guo, S.Z.; Ma, Y.; Han, B.; Hu, X.R. Interactions between suspended sediments and submerged macrophytes-epiphytic biofilms under water flow in shallow lakes. Water Res. 2022, 222, 118911. [Google Scholar] [CrossRef]
  18. Geng, N.; Xia, Y.F.; Lu, D.B.; Bai, Y.; Zhao, Y.F.; Wang, H.; Ren, L.X.; Xu, C.D.; Hua, E.T.; Sun, G.J.; et al. The bacterial community structure in epiphytic biofilm on submerged macrophyte Potamogetom crispus L. and its contribution to heavy metal accumulation in an urban industrial area in Hangzhou. J. Hazard. Mater. 2022, 430, 128455. [Google Scholar] [CrossRef]
  19. Mu, X.Y.; Zhang, S.H.; Lv, X.; Ma, Y.; Zhang, Z.Q.; Han, B. Water flow and temperature drove epiphytic microbial community shift: Insight into nutrient removal in constructed wetlands from microbial assemblage and co-occurrence patterns. Bioresour. Technol. 2021, 332, 125134. [Google Scholar] [CrossRef]
  20. Fermino, F.S.; de Campos Bicudo, D.; Bicudo, C. Seasonal influence of nitrogen and phosphorus enrichment on the floristic composition of the algal periphytic community in a shallow tropical, mesotrophic reservoir (São Paulo, Brazil). Oecol. Aust. 2011, 15, 476–493. [Google Scholar] [CrossRef]
  21. Lu, H.; Feng, Y.; Wang, J.; Wu, Y.; Shao, H.; Yang, L. Responses of periphyton morphology, structure, and function to extreme nutrient loading. Environ. Pollut. 2016, 214, 878–884. [Google Scholar] [CrossRef]
  22. Pizarro, H.; Vinocur, A.; Tell, G. Periphyton on artificial substrata from three lakes of different trophic status at Hope Bay (Antarctica). Polar Biol. 2002, 25, 169–179. [Google Scholar] [CrossRef]
  23. Wang, Y.-Y.; Cheng, Y.-H.; Chen, K.-E.; Tsay, Y.-F. Nitrate Transport, Signaling, and Use Efficiency. Annu. Rev. Plant Biol. 2018, 69, 85–122. [Google Scholar] [CrossRef] [PubMed]
  24. Liu, Y.X.; Sheng, Y.S.; Xu, X.P.; Ma, J.C.; Ding, W.C.; He, P.; Ma, J.W. Quantifying synergistic effects of artificial and environmental variables on potato nutrient use efficiency in China. J. Clean. Prod. 2023, 432, 139739. [Google Scholar] [CrossRef]
  25. Wu, J.; Zhang, J.; Jia, W.; Xie, H.; Gu, R.R.; Li, C.; Gao, B. Impact of COD/N ratio on nitrous oxide emission from microcosm wetlands and their performance in removing nitrogen from wastewater. Bioresour. Technol. 2009, 100, 2910–2917. [Google Scholar] [CrossRef]
  26. Hu, B.; Teng, Y.; Zhai, Y.; Zuo, R.; Li, J.; Chen, H. Riverbank filtration in China: A review and perspective. J. Hydrol. 2016, 541, 914–927. [Google Scholar] [CrossRef]
  27. Krapp, A.; David, L.C.; Chardin, C.; Girin, T.; Marmagne, A.; Leprince, A.-S.; Chaillou, S.; Ferrario-Méry, S.; Meyer, C.; Daniel-Vedele, F. Nitrate transport and signalling in Arabidopsis. J. Exp. Bot. 2014, 65, 789–798. [Google Scholar] [CrossRef]
  28. Song, T.; Zhang, X.; Li, J.; Wu, X.; Feng, H.; Dong, W. A review of research progress of heterotrophic nitrification and aerobic denitrification microorganisms (HNADMs). Sci. Total Environ. 2021, 801, 149319. [Google Scholar] [CrossRef]
  29. Jiao, Y.C.; Yuan, Q.; Wang, W.B.; Yan, L.L.; Mu, X.Y.; Li, H.X.; Zhang, S.H. Vallisnerian natans tolerance and response of microbial community in wetlands to excess nutrients loading. Ecol. Indic. 2021, 131, 108179. [Google Scholar] [CrossRef]
  30. Li, J.H.; Yang, X.Y.; Wang, Z.F.; Shan, Y.; Zheng, Z. Comparison of four aquatic plant treatment systems for nutrient removal from eutrophied water. Bioresour. Technol. 2015, 179, 1–7. [Google Scholar] [CrossRef]
  31. Li, Q.; Gu, P.; Ji, X.Y.; Li, H.M.; Zhang, J.B.; Zheng, Z. Response of submerged macrophytes and periphyton biofilm to water flow in eutrophic environment: Plant structural, physicochemical and microbial properties. Ecotoxicol. Environ. Saf. 2020, 189, 109990. [Google Scholar] [CrossRef]
  32. Li, X.; Xia, M.H.; Liu, L.M.; Li, Y.Y.; Wu, J.S. Response of bacterial and micro-eukaryotic communities to spatio-temporal fluctuations of wastewater in full scale constructed wetlands. Bioresour. Technol. 2024, 399, 136235. [Google Scholar] [CrossRef] [PubMed]
  33. He, Y.; Tao, W.; Wang, Z.; Shayya, W. Effects of pH and seasonal temperature variation on simultaneous partial nitrification and anammox in free-water surface wetlands. J. Environ. Manag. 2012, 110, 103–109. [Google Scholar] [CrossRef] [PubMed]
  34. Jiménez, E.; Giménez, J.; Seco, A.; Ferrer, J.; Serralta, J. Effect of pH, substrate and free nitrous acid concentrations on ammonium oxidation rate. Bioresour. Technol. 2012, 124, 478–484. [Google Scholar] [CrossRef]
  35. Burgin, A.J.; Hamilton, S.K. Have we overemphasized the role of denitrification in aquatic ecosystems? A review of nitrate removal pathways. Front. Ecol. Environ. 2007, 5, 89–96. [Google Scholar] [CrossRef]
  36. Fuhrman, J.A. Microbial community structure and its functional implications. Nature 2009, 459, 193–199. [Google Scholar] [CrossRef]
  37. Levi, P.S.; Starnawski, P.; Poulsen, B.; Baattrup-Pedersen, A.; Schramm, A.; Riis, T. Microbial community diversity and composition varies with habitat characteristics and biofilm function in macrophyte-rich streams. Oikos 2017, 126, 398–409. [Google Scholar] [CrossRef]
  38. Lindell, A.; Tuckfield, R.; McArthur, J. Differences in the effect of coal pile runoff (low pH, high metal concentrations) versus natural Carolina bay water (low pH, low metal concentrations) on plant condition and associated bacterial epiphytes of Salvinia minima. Bull. Environ. Contam. Toxicol. 2016, 96, 602–607. [Google Scholar] [CrossRef]
  39. Kralj, K.; Plenkovic-Moraj, A.; Gligora, M.; Primc-Habdija, B.; Sipos, L. Structure of periphytic community on artificial substrata: Influence of depth, slide orientation and colonization time in karstic Lake Visovacko, Croatia. Hydrobiologia 2006, 560, 249–258. [Google Scholar] [CrossRef]
  40. Lane, C.M.; Taffs, K.H.; Corfield, J.L. A comparison of diatom community structure on natural and artificial substrata. Hydrobiologia 2003, 493, 65–79. [Google Scholar] [CrossRef]
  41. Mahto, K.U.; Vandana; Priyadarshanee, M.; Samantaray, D.P.; Das, S. Bacterial biofilm and extracellular polymeric substances in the treatment of environmental pollutants: Beyond the protective role in survivability. J. Clean. Prod. 2022, 379, 134759. [Google Scholar] [CrossRef]
  42. Zhao, P.T.; Chen, H.F.; Ge, S.F.; Yoshikawa, K. Effect of the hydrothermal pretreatment for the reduction of NO emission from sewage sludge combustion. Appl. Energy 2013, 111, 199–205. [Google Scholar] [CrossRef]
  43. Ekimova, M.; Quevedo, W.; Szyc, Ł.; Iannuzzi, M.; Wernet, P.; Odelius, M.; Nibbering, E.T. Aqueous solvation of ammonia and ammonium: Probing hydrogen bond motifs with FT-IR and soft X-ray spectroscopy. J. Am. Chem. Soc. 2017, 139, 12773–12783. [Google Scholar] [CrossRef] [PubMed]
  44. Van der Zee, F.R.; Cervantes, F.J. Impact and application of electron shuttles on the redox (bio)transformation of contaminants: A review. Biotechnol. Adv. 2009, 27, 256–277. [Google Scholar] [CrossRef] [PubMed]
  45. Liu, S.R.; Jung, M.Y.; Zhang, S.S.; Wagner, M.; Daims, H.; Wanek, W. Nitrogen Kinetic Isotope Effects of Nitrification by the Complete Ammonia Oxidizer Nitrospira inopinata. mSphere 2021, 6, e00634-21. [Google Scholar] [CrossRef] [PubMed]
  46. Allen, M.S.; Welch, K.T.; Prebyl, B.S.; Baker, D.C.; Meyers, A.J.; Sayler, G.S. Analysis and glycosyl composition of the exopolysaccharide isolated from the floc-forming wastewater bacterium Thauera sp. MZ1T. Environ. Microbiol. 2004, 6, 780–790. [Google Scholar] [CrossRef]
  47. Sheng, G.P.; Yu, H.Q.; Li, X.Y. Extracellular polymeric substances (EPS) of microbial aggregates in biological wastewater treatment systems: A review. Biotechnol. Adv. 2010, 28, 882–894. [Google Scholar] [CrossRef]
  48. Chen, C.; Yin, D.Q.; Yu, B.; Zhu, H.K. Effect of epiphytic algae on photosynthetic function of Potamogeton crispus. J. Freshw. Ecol. 2007, 22, 411–420. [Google Scholar] [CrossRef]
  49. Raeder, U.; Ruzicka, J.; Goos, C. Characterization of the light attenuation by periphyton in lakes of different trophic state. Limnologica 2010, 40, 40–46. [Google Scholar] [CrossRef]
  50. Flemming, H.-C.; van Hullebusch, E.D.; Little, B.J.; Neu, T.R.; Nielsen, P.H.; Seviour, T.; Stoodley, P.; Wingender, J.; Wuertz, S. Microbial extracellular polymeric substances in the environment, technology and medicine. Nat. Rev. Microbiol. 2025, 23, 87–105. [Google Scholar] [CrossRef]
  51. Yan, L. Nitrogen loading affects microbes, nitrifiers and denitrifiers attached to submerged macrophyte in constructed wetlands. Sci. Total Environ. 2018, 622, 121. [Google Scholar] [CrossRef]
  52. Liao, L.; Wang, J.; Dijkstra, F.A.; Lei, S.; Zhang, L.; Wang, X.; Liu, G.; Zhang, C. Nitrogen enrichment stimulates rhizosphere multi-element cycling genes via mediating plant biomass and root exudates. Soil Biol. Biochem. 2024, 190, 109306. [Google Scholar] [CrossRef]
  53. He, R.; Liu, Y.; Song, C.; Feng, G.; Song, J. Osmotic regulation beyond nitrate nutrients in plant resistance to stress: A review. Plant Growth Regul. 2024, 103, 1–8. [Google Scholar] [CrossRef]
  54. Li, S.-X.; Wang, Z.-H.; Stewart, B. Responses of crop plants to ammonium and nitrate N. Adv. Agron. 2013, 118, 205–397. [Google Scholar]
  55. Lawlor, D.W.; Boyle, F.A.; Keys, A.J.; Kendall, A.C.; Young, A.T. Nitrate nutrition and temperature effects on wheat—A synthesis of plant-growth and nitrogen uptake in relation to metabolic and physiological processes. J. Exp. Bot. 1988, 39, 329–343. [Google Scholar] [CrossRef]
  56. Lawlor, D.W.; Kontturi, M.; Young, A.T. Photosynthesis by Flag Leaves of Wheat in Relation to Protein, Ribulose Bisphosphate Carboxylase Activity and Nitrogen Supply. J. Exp. Bot. 1989, 40, 43–52. [Google Scholar] [CrossRef]
  57. Li, X.; Li, Y.; Wu, J. Different in root exudates and rhizosphere microorganisms effect on nitrogen removal between three emergent aquatic plants in surface flow constructed wetlands. Chemosphere 2023, 337, 139422. [Google Scholar] [CrossRef]
  58. Sun, H.; Liu, F.; Xu, S.; Wu, S.; Zhuang, G.; Deng, Y.; Wu, J.; Zhuang, X. Myriophyllum aquaticum constructed wetland effectively removes nitrogen in swine wastewater. Front. Microbiol. 2017, 8, 1932. [Google Scholar] [CrossRef]
  59. Li, X.; Li, Y.Y.; Lv, D.Q.; Li, Y.; Wu, J.S. Nitrogen and phosphorus removal performance and bacterial communities in a multi-stage surface flow constructed wetland treating rural domestic sewage. Sci. Total Environ. 2020, 709, 136235. [Google Scholar] [CrossRef]
  60. Li, X.; Zhang, M.M.; Liu, F.; Chen, L.; Li, Y.Y.; Li, Y.; Xiao, R.L.; Wu, J.S. Seasonality distribution of the abundance and activity of nitrification and denitrification microorganisms in sediments of surface flow constructed wetlands planted with Myriophyllum elatinoides during swine wastewater treatment. Bioresour. Technol. 2018, 248, 89–97. [Google Scholar] [CrossRef]
Figure 1. Concentration of NH4+-N, NO3-N, TN in Myriophyllum elatinoides and Pontederia cordata water (a) Me, (b) Pc. Note: M1 and P1, cultured with the original wastewater (TN average concentration was 201.7 mg/L). M2 and P2 cultured with the original wastewater and tap water were mixed in a 1:1 ratio (TN average concentration was 104.0 mg/L). M3 and P3, cultured with the original wastewater, were mixed with tap water in a 1:2 ratio (TN average concentration was 70.9 mg/L). M4 and P4, cultured with the original wastewater, were mixed with tap water in a 1:3 ratio (TN average concentration was 56.9 mg/L). M5 and P5, cultured with the original wastewater and tap water, were mixed in a 1:4 ratio (TN average concentration was 46.1 mg/L) to culture Me (M5) and Pc (P5).
Sustainability 17 02654 g001
Figure 2. Characteristics of physical and chemical indexes in Myriophyllum elationoides and Pontederia cordata water (a) Me, (b) Pc. Note: M1 and P1 were cultured with the original wastewater (TN average concentration was 201.7 mg/L). M2 and P2, cultured with the original wastewater and tap water, were mixed in a 1:1 ratio (TN average concentration was 104.0 mg/L). M3 and P3, cultured with the original wastewater, were mixed with tap water in a 1:2 ratio (TN average concentration was 70.9 mg/L). M4 and P4, cultured with the original wastewater, were mixed with tap water in a 1:3 ratio (TN average concentration was 56.9 mg/L). M5 and P5, cultured with the original wastewater and tap water, were mixed in a 1:4 ratio (TN average concentration was 46.1 mg/L) to culture Me (M5) and Pc (P5).
Sustainability 17 02654 g002aSustainability 17 02654 g002b
Figure 3. Weight of hydrophyte periphytic biofilms under different wastewater concentrations.
Sustainability 17 02654 g003
Figure 4. CLSM photographs of hydrophyte periphytic biofilms under different wastewater concentrations (a) the 14th day, (b) the 28th day. proteins (red), polysaccharides (blue), microorganisms (green).
Sustainability 17 02654 g004
Figure 5. FTIR spectra for different hydrophyte periphytic biofilms at different times. (b) the 14th day of Me, (b) the 14th day of Pc, (c) the 28th day of Me, (d) the 28th day of Pc.
Sustainability 17 02654 g005
Figure 6. Correlations between environmental factors, BW, and biofilm Chla. (a) the 14th day, (b) the 28th day.
Sustainability 17 02654 g006
Figure 7. Relative importance of explanatory variable for the B. ns: no significant, * p < 0.05, ** p < 0.01.
Sustainability 17 02654 g007
Table 1. Experimental treatments.
TreatmentRatio of Original Wastewater and Tap WaterTN Average Concentration (mg/L)
M1only original water201.7
P1only original water201.7
M21:1104.0
P21:1104.0
M31:270.9
P31:270.9
M41:356.9
P41:356.9
M51:446.1
P51:446.1
Table 2. Time changes in the content of Chla. of hydrophyte periphytic biofilms.
TreatmentM1M2M3M4M5P1P2P3P4P5
Time (d)1428142814281428142814281428142814281428
Chla. content (μg/L)398.0 ± 2.396.7 ± 5.4174.8 ± 2.6213.9 ± 6.293.0 ± 4.1152.5 ± 6.948.4 ± 1.039.1 ± 4.683.7 ± 7.7130.2 ± 6.80-00000026.0 ± 3.30
Disclaimer/Publisher’s Note: The statements, opinions and data contained in all publications are solely those of the individual author(s) and contributor(s) and not of MDPI and/or the editor(s). MDPI and/or the editor(s) disclaim responsibility for any injury to people or property resulting from any ideas, methods, instructions or products referred to in the content.

