Article

Screening and Identification of SOB and Its Effect on the Reduction in H2S in Dairy Farms

1
Agro-Environmental Protection Institute, Ministry of Agriculture and Rural Affairs, Tianjin 300191, China
2
School of Resources and Environment, Northeast Agricultural University, Harbin 150036, China
3
Beijing Capital Air Environmental Science & Technology Co., Ltd., Beijing 100176, China
*
Authors to whom correspondence should be addressed.
These authors contributed equally to this work.
Sustainability 2025, 17(8), 3551; https://doi.org/10.3390/su17083551
Submission received: 10 March 2025 / Revised: 9 April 2025 / Accepted: 11 April 2025 / Published: 15 April 2025

Abstract

:
The problem of the foul odor caused by H2S in livestock farms has become a major complaints. In this study, optimal sulfur-oxidizing bacteria (SOB) strains were screened from dairy farm wastewater and the adjacent soil for odor treatment. The strains and physiological functions were determined by identification and genome comparison, and the optimal operating conditions were determined by experiments under different conditions. The identification results showed that the strain that had the highest homology with Halomonas mongoliensis was Halomonas sp. AEB2. The comparative genomic results showed that the average nucleotide identity and DNA–DNA hybridization value were 95.8% and 68.6%, respectively. The optimization results were as follows: sodium succinate-carbon (10 g/L) and ammonium chloride-nitrogen (0.07 g/L). The optimal operating conditions were as follows: seeding rate 4%, temperature 30 °C, stirring speed 90 rpm, and pH 8. The oxidation products of AEB2 were mainly elemental sulfur and tetrathionate, and the metabolic pathway of AEB2 was constructed accordingly. This study suggests a feasible path to reduce H2S emissions from dairy farms, and it provides theoretical support for the restoration of livestock environment and sustainability.

1. Introduction

China is a major country for livestock breeding. According to statistics, China’s annual pig, cattle, sheep production are 527.04 million head, 45.65 million head, and 31.41 million head, respectively, which ranks first in the world [1]. However, such large-scale livestock farming has caused a series of environmental problems. Odor gas is one of the main pollution problems. The odor gases of livestock farm mainly come from animal respiration, fecal urine, waste water, and feces treatment facilities [2,3]. The composition of odor gases in livestock farm is complex, including ammonia, indoles and phenols, sulfur-containing gases, volatile fatty acids, etc. [4]. Among these, hydrogen sulfide (H2S) has attracted wide attention because of its low odor threshold (0.5–2 ppb) and large emissions [5]. A study found that H2S was the main odorous gas emitted in the process of livestock waste storage, accounting for more than 65% [6]. If not controlled, it will cause great harm to humans and the environment. Therefore, the removal of H2S in livestock farm is one of the key factors in the control of odor pollution.
At present, the removal technologies of H2S gas in livestock farm mainly include the physical method, chemical method, biological method, etc. [7,8]. Among them, the biological method has gradually become the main method to control odor gas because of its low cost, no secondary pollution, and simple equipment [9]. This method mainly uses sulfur-oxidizing bacteria (SOB) to oxidize H2S. At present, most of the research focuses on the removal of odor by autotrophic bacteria. For example, photoautotrophic SOB, green sulfur bacteria, and purple sulfur bacteria are common SOB in the environment [10,11]. There have also been studies that reported other SOB [12,13,14]. However, autotrophic bacteria generally grow slowly and have weak sulfur oxidation performance, so their practical application is limited. Heterotrophic SOB is gradually favored by scholars because they have the characteristics of a fast growth rate, strong oxidation ability, and strong anti-interference [15]. Many researchers have attempted to isolate heterotrophic SOB from the environment. Sun et al. [16] isolated Paracoccus sp. and Pseudomonas sp. from a sewage treatment plant, and they all have a good deodorizing effect. Chen et al. [17] isolated and applied Cohnella thermotolerans, which decreased 35.4% of the H2S odor emission from composting. Based on the analysis of the existing literature, it can be seen that most SOBs have been screened from surface water, municipal sewage, and other environmental media. However, for livestock farm wastewater, the concentration of pollutants, such as nitrogen, phosphorus, and organic matter, is very high, and the organic substrate is complex. The chemical oxygen demand (COD) of livestock wastewater is usually reported as 10 times or even more than 100 times higher than domestic wastewater [18], and even livestock wastewater is usually alkaline. Therefore, it is difficult for the selected SOB to adapt to the characteristics of livestock breeding wastewater, which leads to the failure of odor removal. Up to now, almost no research has focused on the screening and identification of SOB in livestock breeding wastewater; however, finally, research is now being conducted on the removal of H2S from actual livestock breeding wastewater.
For livestock breeding sewage, the following screening strategies should be adopted in order to obtain SOB with strong applicability: (1) Focusing on strains with strong adaptability—the SOB from livestock breeding sewage itself can be better applied to livestock breeding sewage. (2) Focusing on strains with high growth rate—only strains with a high growth rate can quickly seize ecological niches and play a key role in removal. (3) Focusing on practical applications—actual sewage should be used for SOB screening condition and the effect verification. Therefore, this study used dairy farm sewage samples to try to isolate and screen SOB with strong oxidizing ability and adaptability. At the same time, the molecular identification, genome sequencing, and characteristics of the selected SOB were studied. Moreover, the bacteria were applied to the actual sewage to verify the effect and optimize the conditions. Finally, the product changes and predictions of functional metabolic pathways in the process of H2S oxidation by SOB were also clarified. The results can provide support for the development of odor removal technology in the livestock industry.

2. Materials and Methods

2.1. Materials

Farm samples used for screening SOB were collected from oxidizing ponds, anaerobic ponds, and from the surrounding soil of a large dairy farm in Tianjin. The enrichment medium was sodium succinate (pH = 9.5) [19], including 10 g/L of C4H4Na2O4, 0.5 g/L of KH2PO4, 0.2 g/L of MgCl2, 0.6 g/L of NH4Cl, 3 g/L of NaHCO3, 5 g/L of NaCl, and 0.8 g/L of Na2S·H2O. The separation medium was sodium succinate AGAR. The main compositions were the same as the enrichment medium, and the AGAR was added at a ratio of 20 g/L. The method of adding Na2S to the medium was as follows: an appropriate amount of Na2S·9H2O was dissolved in a small amount of sterile water; the solution was absorbed with a sterile syringe and filtered with a 0.22 μm sterile microporous filter membrane to remove the bacteria; and then the solution was slowly added to the medium after high-pressure steam sterilization and cooling to 50 °C. The expanded culture medium was a nutrient broth medium with a pH of 7.2.

2.2. Experimental Methods

2.2.1. Screening Method of Strain

Testing of the S2− oxidation capacity of the strain was achieved as follows: the activated bacterial solution was adjusted to an OD600 value of 1.0 with sterile water, and it was then inoculated into the enriched medium (containing sodium sulfide) at 5%. The culture, in a shaker, was treated at 30 °C for 150 r/min and at a pH for 120 h. The control was not added to a bacterial solution. Each treatment group had 3 replicates. At 0, 4, 8, 12, 18, 24, 48, 72, 96, and 120 h of culture, the S2− in the reaction solution was measured by sampling it from the triangle flask.
The emission reduction effect of the strains was induced in actual wastewater. The basic physical and chemical properties of the actual dairy farm wastewater were as follows: pH 6.8, dry matter content 3.8%, TN 1193.8 mg/L, and TP 156.05 mg/L. The H2S and NH3 test devices were in a sealable glass container with a volume of 2.5 L. Then, 800 mL of wastewater was added to the device, followed by inoculating the bacterial solution at 1% and stirring well. Two 50 mL beakers were placed in the device, and 20 mL of boric acid solution and zinc–ammonium salt solution were added to absorb NH3 and H2S, with 3 repeats per treatment group. The device was cultured in a constant temperature incubator at 30 °C for 3 d, and the content of NH3 and H2S in the absorption solution was determined.

2.2.2. Strain Identification

Strains were inoculated on a solid plate of nutrient broth and cultured at 30 °C in a constant temperature incubator for 48 h. After that, the AEB2 strain was observed by scanning electron microscope (Hitachi (Tokyo, Japan), 3400N) with reference to the method of [20]. AEB2 strain physiological and biochemical identification was conducted on an automatic determination of the microbial analysis system (Biolog, Hayward, CA, USA). Universal primers (27F/1492R) designed by Sangon Biotech (Shanghai, China) were adopted to amplify the 16S rRNA gene of the isolated strains through the polymerase chain reaction. A BLAST 2.13.0 tool was used to compare the nucleotide sequence similarity of the sequencing products with other related sequences. The sequence similarity was indicated in a phylogenetic tree by the neighbor-joining method in MEGA 7.0 software.

2.2.3. Genome Analysis of Halomonas sp. AEB2

The sequence of the all-cause groups was determined by the Illumina Miseq platform. Glimmer, GeneMarkS-2017, and Prodigal v2.6.3 software were all used to predict the coding region sequence (CDS) of the AEB2 genome, and the obtained CDS sequences were compared with major databases (EggNOG, NR, Swiss-Prot, Pfam, GO, and KEGG) for functional annotation of the coding genes. Genomic features were analyzed with the Rapid Annotations using Subsystems Technology (RAST) website, and the genomic cycle was mapped using Circos software.

2.2.4. Carbon and Nitrogen Sources and Dosage Optimization of the AEB2 Strain

The carbon source type was optimized by replacing sodium succinate in a basic medium with sodium citrate, glucose, glycerin, sodium acetate, and xylose, respectively. The amount of the carbon source was consistent with the total carbon content. The dosage of each carbon source was divided into 10 g/L of C4H4Na2O4, 12.1 g/L of C6H5Na3O7, 7.5 g/L of C6H12O6, 7.67 g/L of C3H8O3, 10.25 g/L of CH3COONa, and 7.5 g/L of C5H10O5, respectively. The bacterial solution was inoculated into the above medium at a 4% inoculum amount and cultured at 30 °C and 150 r/min for 72 h. The OD600 value was measured every 12 h to characterize the growth amount of the strain. The optimal amount of different carbon sources was tested by setting the amount of carbon sources in the medium to 20%, 50%, 100%, 150%, and 200% of the original amount. The OD600 value was measured every 12 h to characterize the growth amount of the strain.
The optimized nitrogen source types were 0.6 g/L of NH4Cl, 0.429 g/L of NH4NO3, 0.336 g/L of CO(NH2)2, 1.256 g/L of C18H16O5, 0.953 g/L of KNO3, and 0.774 g/L of NaNO2, respectively. The bacterial solution was inoculated into the above medium at a 4% inoculum amount and cultured at 30 °C and 150 r/min for 72 h. The OD600 value was measured every 12 h to characterize the growth amount of the strain. The amount of nitrogen source in the medium was successively changed to 20%, 50%, 100%, 150%, and 200% of the original amount. The OD600 value was measured every 12 h to characterize the growth amount of the strain.

2.2.5. Effect of Different Environmental Conditions on the S2− Removal Rate and OD Value

The factors affecting the oxidation capacity of AEB2 included the inoculation rate, temperature, stirring speed, initial pH value, and initial S2− concentration. Inoculation rates were set at 1%, 2%, 4%, 6%, and 10%. The temperature was set at 15, 20, 25, 30, 35, and 40 °C. The stirring speed was set to 0, 30, 60, 90, 120, 150, 180, and 210 r/min. The initial pH values were set to 6, 7, 8, 9, and 10. Initial S2− concentrations were set at 100, 200, 500, and 1000 mg/L. The samples collected after 2 h of reaction were used to calculate the removal rate and AEB2 growth, except for samples of a different time that were taken for different S2− concentrations. Using one phase an exponential decay (OPED, Formula (1)) and plateau followed by one phase decay (PFOPD, Formula (2)) [17], two kinds of model analysis of different dynamic properties of S2− load conditions were conducted:
y = (y0 − Plateau) × exp(−kx + Plateau),
y = Plateau + (y0 − Plateau) × exp[−k(x − x0)].
In the above formulas, y is the S2− concentration at time x, mg/L; y0 is the value of y when x is equal to zero, mg/L; Plateau is the S2− concentration at the final time, mg/L; and k is the rate constant, h−1.

2.2.6. S2− Product Analysis

The newly prepared bacterial solution was inoculated with a sodium succinate medium containing 200 mg/L of S2− at a 4% inoculum rate, and the initial pH of the medium was adjusted to 8.2 with a HCl solution filtered by a 0.22 μm sterilized microporous filter membrane. The concentrations of S2−, S0, SO32−, S2O32−, and SO42− in the reaction system of 2, 4, 6, 8, 12, 16, 20, 24, 32, 40, and 48 h were determined after the culture at 32.5 °C and 210 r/min for 72 h.

2.3. Determination Methods

The concentration of S2− was determined by flow injection–methylene blue spectrophotometry (Beijing Jitian (Beijing, China), FIA6000). The concentrations of SO32−, S2O32−, and SO42− were determined by ion chromatography (Hashing, ICS-900, Thermo, Waltham, MA, USA). Elemental S was determined by liquid chromatography (1260, Agilent 1260, Santa Clara, CA, USA). The emissions of NH3 and H2S were determined by the boric acid absorption Kjeldahl method and zinc-ammonium salt absorption colorimetry, respectively.

2.4. Statistical Methods for Data Analysis

Microsoft Excel 2007 was used for data processing, SPSS 26.0 software was used for variance analysis (significance difference level was set to 0.05), and Origin 2018 software was used for mapping and dynamic fitting.

3. Results and Discussion

3.1. Strain Screening

Four effective SOB strains were obtained through enrichment and isolation, which were named AEB1, AEB2, AEB3, and AEB6. The removal effects of each strain on sulfur ions (S2−) in water are shown in Figure 1a. Sulfide ions showed a continuous decreasing trend with time. The sulfide concentrations of AEB2- and AEB6-treated groups were lower than that of the control group. At the same time, the sulfide concentration decreased rapidly (AEB2 time < 5.0 min). This means that these two strains have the effect of removing S2−. However, the decreasing trend of sulfide concentration under the AEB1 and AEB3 treatments was similar to that of the control group. These results indicate that AEB1 and AEB3 have no effect on sulfide removal.
In order to be closer to the reality, secondary screening was carried out according to the gas discharge of AEB2 and AEB6 in the actual dairy farm sewage, the results of which are shown in Figure 1b. The results show that the H2S emission was 32.94 μg in the AEB2 treatment group and 62.31 μg in the control group after 3 d inoculation at a 1% inoculation amount. The H2S emission decreased by 47.10% compared with that in the no-bacteria treatment group, and the difference reached a significant level (p < 0.05). The ammonia emission had no significant difference. However, the H2S emission in the AEB6 treatment group was 71.2 μg, which was 12.6% higher than that in the control group. However, ammonia emission was reduced by 66.8%. The above results show that AEB2 has a good emission reduction effect on the hydrogen sulfide gas from dairy farm wastewater. Therefore, the AEB2 strain was used as the test strain in the subsequent experiments.

3.2. AEB2 Strain Identification

3.2.1. Morphological Identification of AEB2 Strain

The colony shape and an electron microscope photograph of the AEB2 strain are shown in Figure 2a,b. It can be seen that the bacterial colony of the AEB2 strain was a yellow-white round shape with a raised center, intact edge, and a smooth and wet surface. The results of the scanning electron microscopy showed that the strain had a short rod shape that was about 1.5 μm in length and 8 μm in width. The Gram staining results of the AEB2 strain are shown in Figure 2c, which shows that the AEB2 strain was Gram-negative and that its body was rod-shaped.

3.2.2. Physiological and Biochemical Identification of the AEB2 Strain

The biolog GIII identification results of the AEB2 strain are detailed in Table 1. It can be seen that a total of 51 positions in the biolog GIII eco-plate were positive. This indicates that the strain had a wide range of utilization of nutrients. The AEB2 strain can utilize a variety of carbohydrate substances, such as glucose and meliobiose. It also could use a variety of amino acids, such as alanine and serine, and could tolerate high salinity. These characteristics are conducive to its application in a practical environment.

3.3. The Genome and Comparative Genome Studies of Halomonas Sp. AEB2

3.3.1. Genetic Identification of AEB2 Strain

Figure 2d,e show the phylogenentic and phylogenomic trees of the AEB2 strain. The sequence similarity of the 16S rRNA showed that the AEB2 strain was most closely related to Halomonas mongoliensis Z-7009T (98.9% similarity). To verify the 16S rRNA gen-based taxonomic position, the phylogenomic tree for AEB2 with several reference genome sequences was constructed. The phylogenomic tree also showed that the AEB2 strain was most closely related to Halomonas mongoliensis Z-7009T, and the similarity was 95.5%.

3.3.2. Genomic Characteristics

The genome and plasmid Circos circles of the AEB2 strain are shown in Figure 3. The size of the genome sequence was 3,640,645 bp and the G + C content was 67.46%. The predicted coding genes were about 3352, and the tRNA sequences were 62, including a total of 20 types of tRNA types. There were 12 rRNA sequences, as well as 4 16S rRNA, 23S rRNA, and 5S rRNA sequences, respectively. There were 88 tandem repeats, 8 genomic islands, 3 prophages and 14 CRISPR-Cas sequences. The genome sequence of H. mongoliensis Z-7009T was 3,622,367 bp in size, with 67.58% of G + C content. There were 3299 predicted genes and 67 tRNA sequences, including 21 types of tRNA. There were also 12 rRNA sequences and 4 for each of the 16S rRNA, 23S rRNA, and 5S rRNA sequences. There were 105 tandem repeats, 8 genomic islands, and 0 prophage and 17 CRISPR-Cas sequences.

3.3.3. Comparative Genomic Results

After sequence comparison using the TrueBac™ ID system, 14 type strains with the highest homology to AEB2 were obtained, including Halomonas mongoliensis Z-7009, Halomonas alkalicola 56-L4-10aEnT (GCA_003182195-1), Halomonas shengliensis CGMCC 1.6444T (GCA_000475415.1), etc. The average nucleotide consistency and DNA–DNA hybridization values of AEB2 and the above strains are shown in Table 1. The results showed that the ANI and dDDH values of AEB2 and Halomonas mongoliensis were the highest, which were 95.83% and 63.3%, respectively. The ANI and dDDH values of the other strains were all less than 90% and 60%. The ANI (average nucleotide identity) and DDH (DNA–DNA hybridization) are bacterial taxonomic indicators that are commonly used to measure the similarity and kinship between bacteria. According to current bacterial taxonomic standards, if ANI values are greater than 95–96% and DDH values are greater than 70%, two bacterial strains can be considered to belong to the same species. Although the ANI value of AEB2 and Halomonas mongoliensis was over 95%, the dDDH value was less than 70%, so it could not be completely confirmed whether the two strains belonged to the same species. We still need to evaluate the other aspects, and we can consider identifying it as a new species of bacteria. Studies have also reported a few other Halomonas species from environmental samples with some other functions [21].

3.4. Conditions Optimization and Application of AEB2

3.4.1. Carbon and Nitrogen Source Optimizations of AEB2

Figure 4 shows the growth status of AEB2 under different carbon (a and b) and nitrogen (c and d) sources. AEB2 was cultured with sodium succinate, sodium citrate, glucose, glycerol, sodium acetate, and xylose as the only carbon sources (Figure 4a). The results showed that the biomass and growth rate of the strain were the highest when sodium succinate was used as the carbon source. The AEB2 growth was better at 10 mg/L of sodium succinate (Figure 4b). Then, the growth of AEB2 was not significantly improved by increasing the concentration of sodium succinate. AEB2 was cultured with nitrite, nitrate, peptone, ammonium chloride, urea, and ammonium nitrate as the sole nitrogen sources (Figure 4c). AEB2 showed good growth performance under most inorganic nitrogen sources. However, AEB2 showed the worst growth performance in the presence of organic nitrogen peptone. Therefore, the widely used and inexpensive ammonium chloride was selected as the nitrogen source of AEB2 in this study. The increase in ammonium chloride dosage had little effect on the growth performance of AEB2, and the selected medium concentration (0.07 g/L) could be maintained (Figure 4d).

3.4.2. Operation Factors Optimization of AEB2

Figure 5a–d shows the changes in the S2− removal concentration and growth performance of AEB2 under different inoculation ratios, temperature, rotational speed, and pH. The results of the vaccination rate in Figure 5a show that the S2− concentration gradually increased with increases in the inoculation amount. The concentration of S2− decreased rapidly when the dose was 1–4%. At a 4% inoculation rate, the S2− concentration rapidly decreased to 2.1 mg/L within 2 h (the removal rate reached 98.2%). As the vaccination rate continued to increase, the rate of decrease in S2− concentration slowed down. It can be seen that the optimal inoculation amount of AEB2 can be selected by 4%. The results of the temperature, as shown in Figure 5b, show that the S2− concentration first decreased and then increased with increases in temperature. When the temperature was 30 °C, the lowest S2− concentration was 1.5 mg/L (98.5% removal rate). Therefore, 30 °C is the best temperature for AEB2. However, in the range of 20–40 °C, the S2− removal effect was good, which indicates that the AEB2 strain had wide temperature adaptability. The results of the stirring speed in Figure 5c show that 90 r/min basically met the demand of the AEB2-oxidized S2−. When the stirring speed continued to increase, the oxidation effect was not significantly improved. The results of the pH, as shown in Figure 5d, show that the S2− concentration decreased first and then increased with the initial pH increase. When the initial pH was 6, the S2− removal effect was poor. When the initial pH value was 7, the S2− removal effect increased significantly. When the pH was 8, the lowest S2− concentration was 1.3 mg/L (removal rate 98.7%). The good effect of AEB2 on S2− can be achieved in the pH range of 7–10.

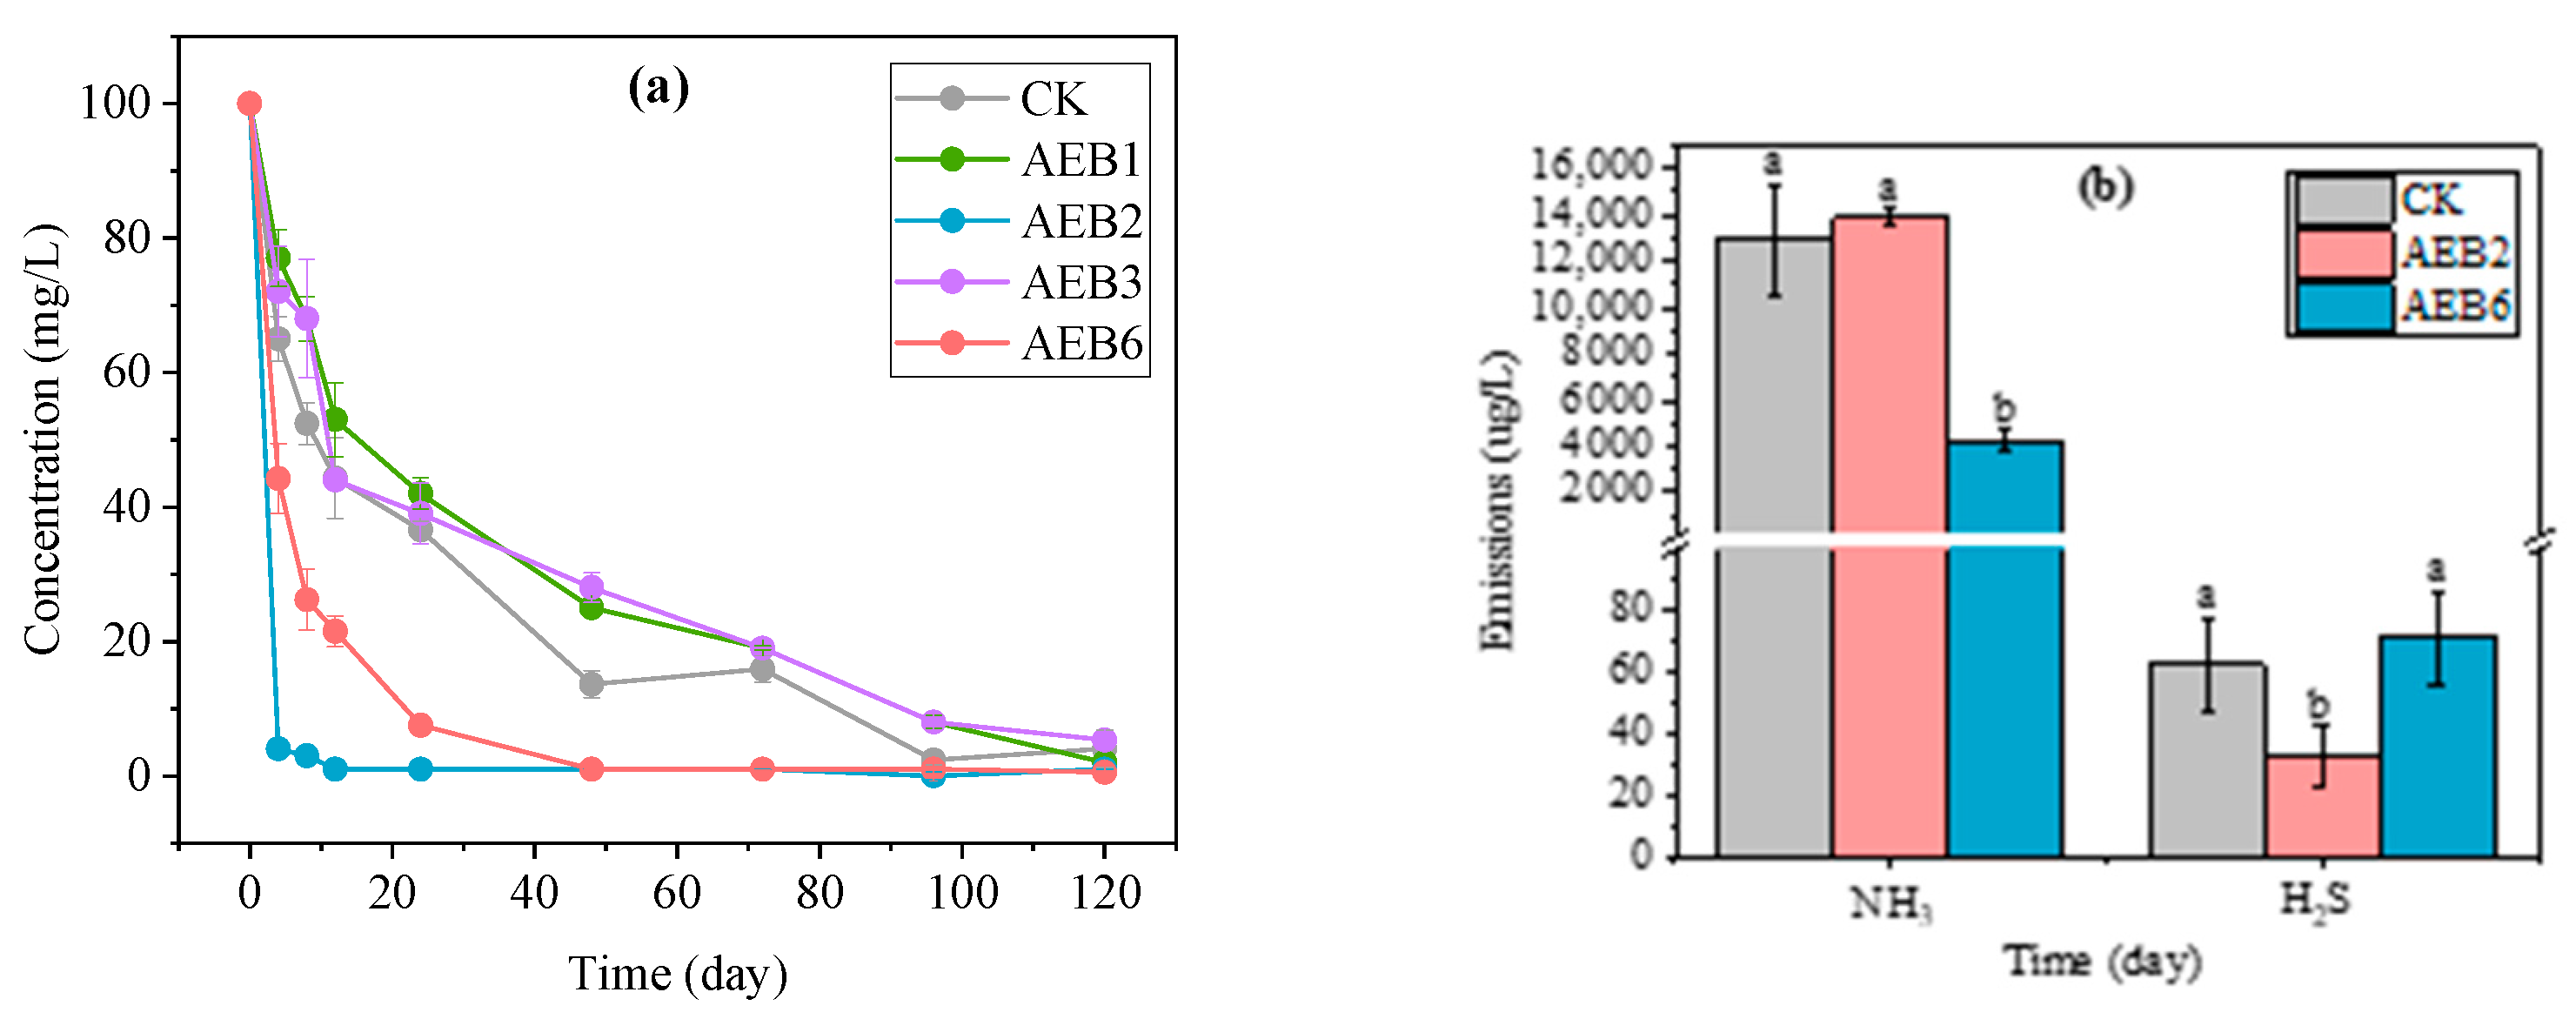
3.4.3. Application of AEB2

Figure 5e–h shows the removal effect of AEB2 on different concentrations of S2−. With an increase in the initial S2− concentration, the time required by the AEB2 strain gradually increased. At concentrations of 100 mg/L, 200 mg/L, 500 mg/L, and 1000 mg/L, the time to complete the removal of S2− was about 2 h, 4 h, 7 h, and 13 h. At reaction hours, the removal rate of S2− reached 99.9%, 100.0%, 99.9%, and 99.9%, respectively. In addition, we used a single-phase decay model [15] (Formula (1)) to dynamically fit the removal effects at 100 mg/L, 200 mg/L, and 500 mg/L concentrations, and we then used a single-phase decay model (PFOPD/Formula (2)) to dynamically fit the removal effects at 1000 mg/L S2− concentrations. The K values fitted by the model represented the degradation efficiency at different concentrations, which were 1.362, 0.8264, 0.3796, and 0.1936, respectively. It can be seen that the degradation efficiency of AEB2 gradually decreased with the increase in S2− concentration. This may be caused by the growth inhibition of the strain with a high concentration of S2−.

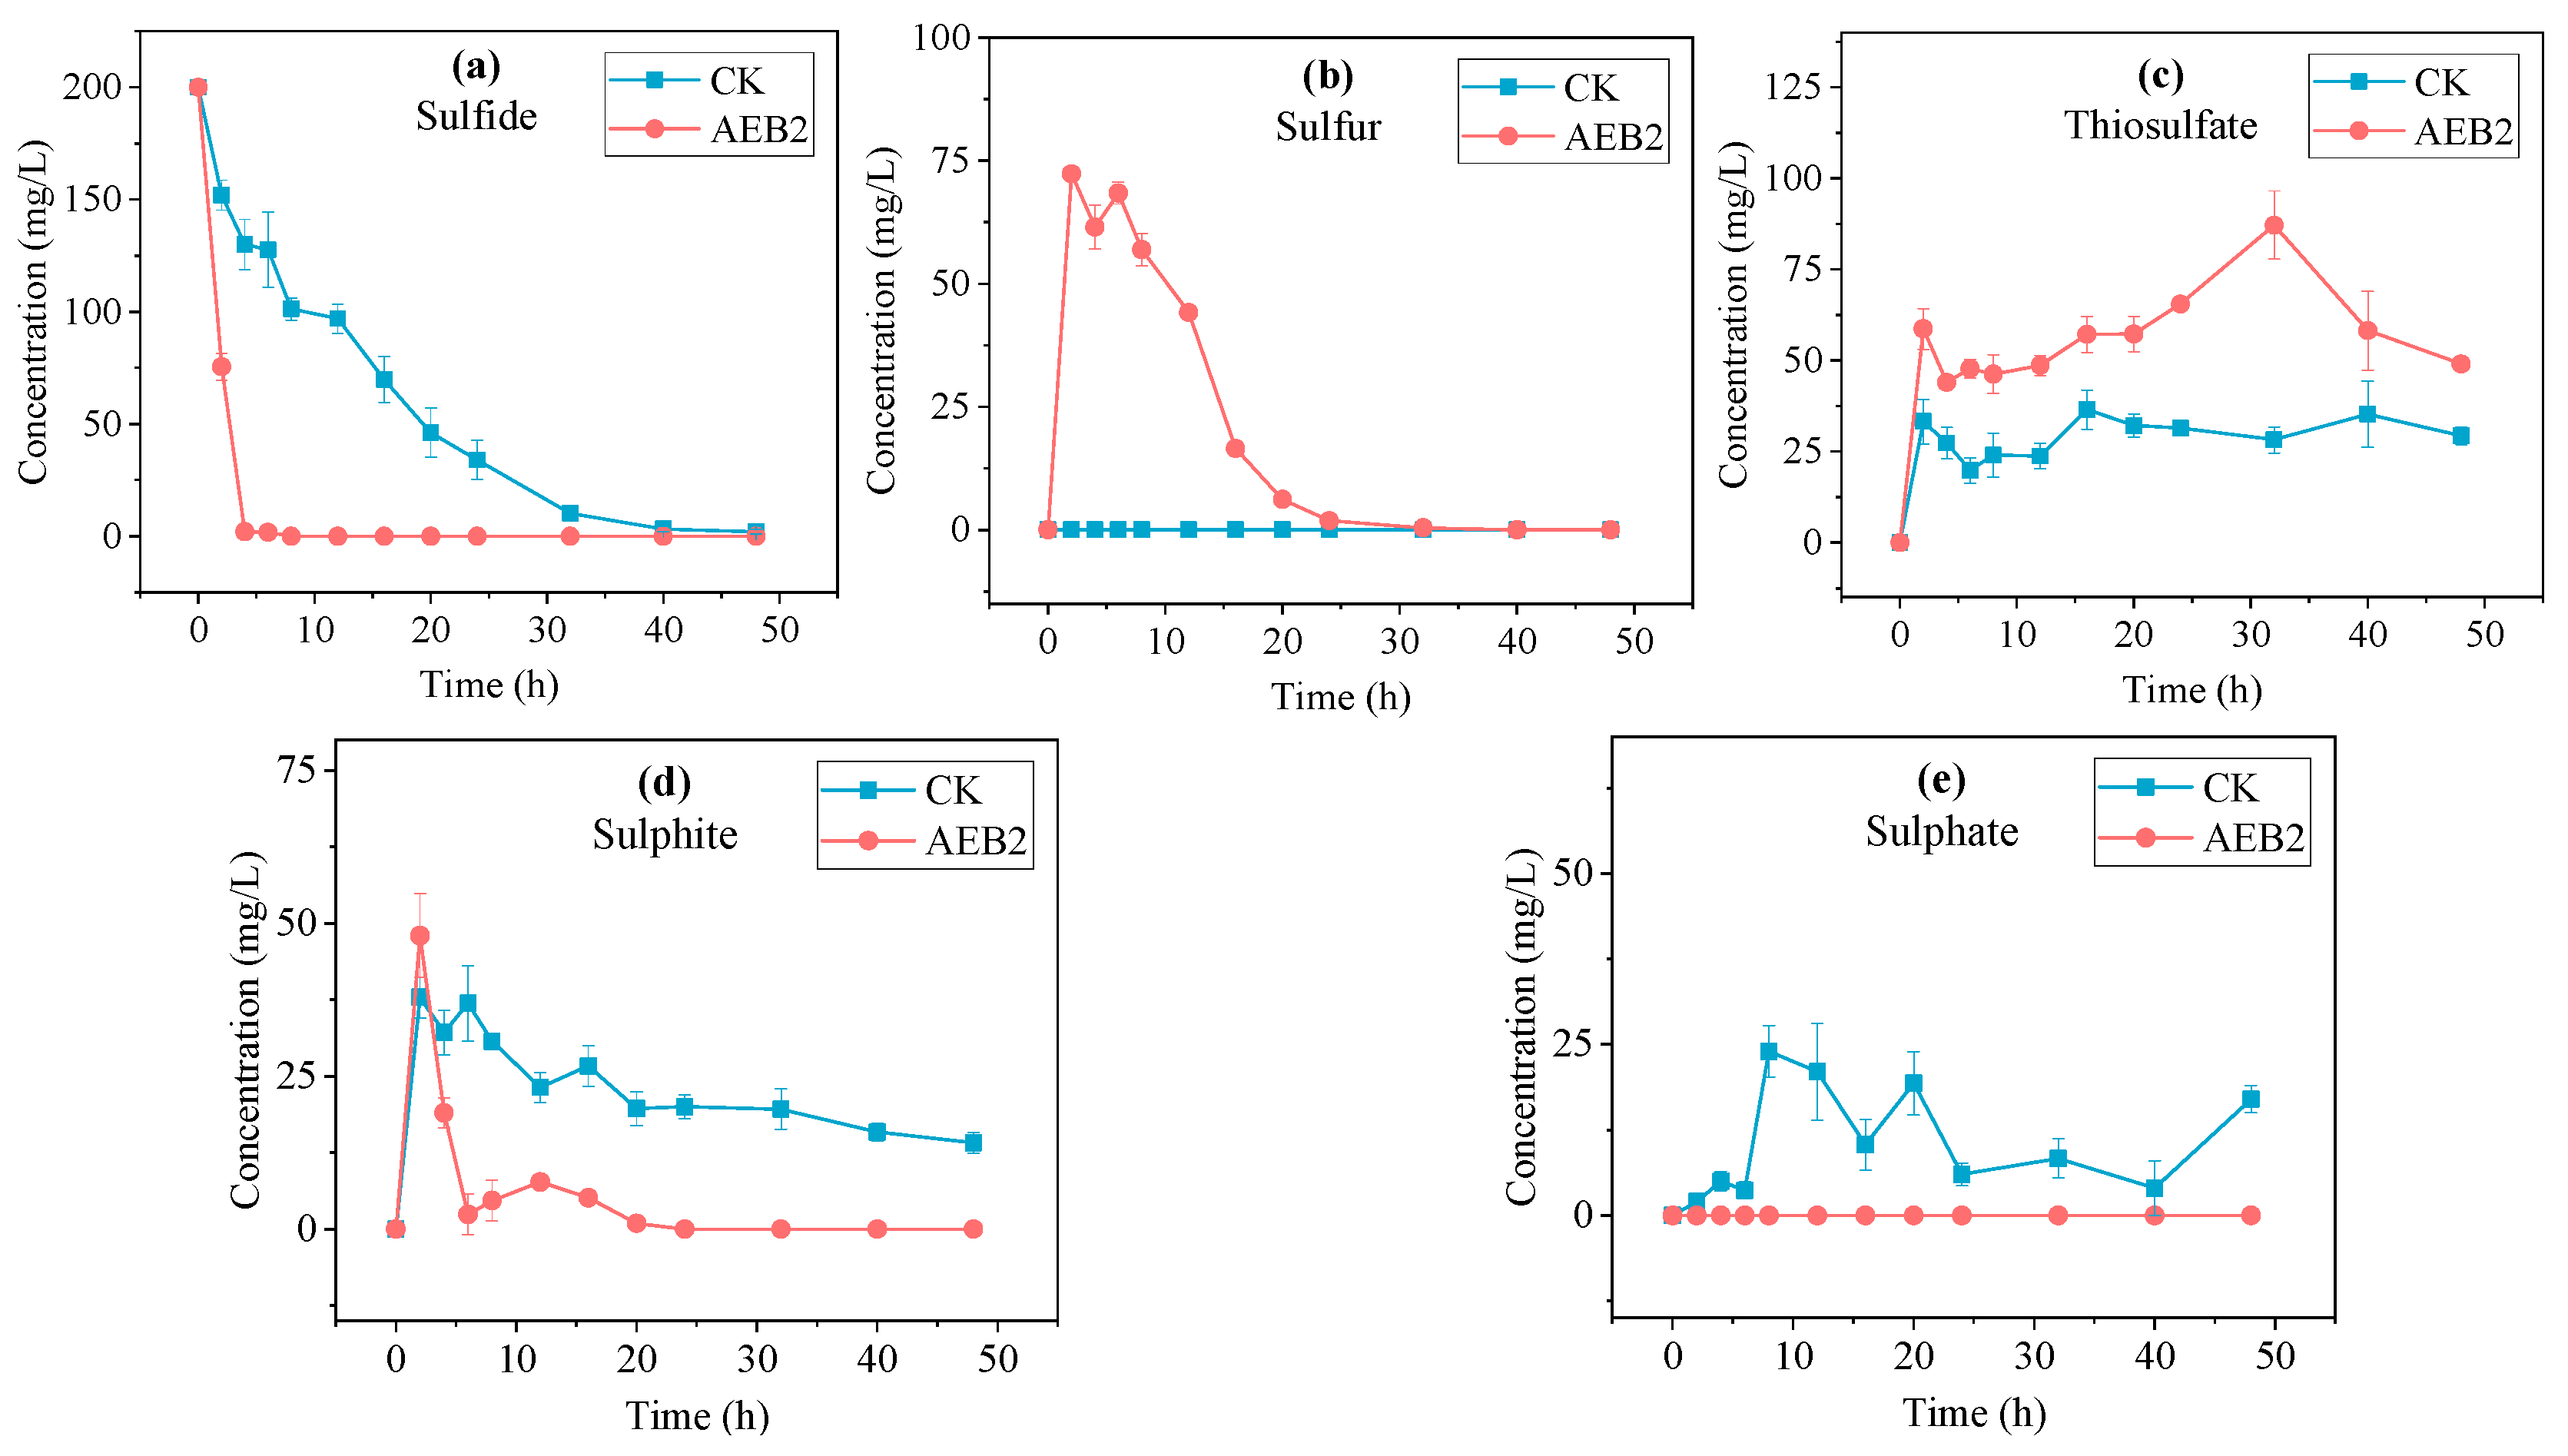
3.5. Products Analysis

The oxidation effect of the AEB2 strain on S2− and its oxidation products are shown in Figure 6. Figure 6a shows the change trend of the S2− concentration. It can be seen that the S2− concentration in the control decreased slowly and dropped to zero at about 48 h. However, the S2− concentration in the AEB2 group rapidly decreased to zero within 4 h. Figure 6b shows the variation trend of the sulfur element. It can be seen that the sulfur production in the control group was zero during the whole reaction. However, in the AEB2 group, it showed a rapid rise at first and then a slow decline. The highest concentration was 72.3 mg/L at 2 h, where the concentration dropped below 60 mg/L at 8 h and then gradually dropped to zero (about 32 h). Figure 6c shows the variation trend of the thiosulfate yield. The thiosulfate change trend in the AEB2 group was similar to that of the control but higher than that in the control. Figure 6d shows the variation trend of the sulfite yield. In contrast to thiosulfate, the sulfite yield was significantly lower than that in the control. Figure 6e shows the variation trend of the sulfate yield. The sulfate yield was clearly nearly zero during the whole stage, while it was produced in the control. According to the results, the following reactions might occur during AEB2 treatment.
2 HS + 2 O2 → S2O32− + H2O,
5x HS + 2x O2 → S5x2− + 3x OH + x H2O,
S52− + 5.5 O2 + 8 OH → 5 SO32− + 4 H2O,
HS + 1 2   O 2     S 0   +   OH
S0 + HSO3 → S2O32− + 2H+,
4 S0 + 4 OH → S2O32− + 2 HS + H2O.
Compared to the control, AEB2 had a strong oxidation effect on S2−. At the beginning, S2− might be oxidized through abiotic processes, such as those shown in Equations (3)–(5) [22,23]. AEB2 could oxidize S2− to sulfur as Equation (6) [24]. Elemental sulfur reacted with sulfite to form thiosulfate, such as those shown in Equations (7) and (8) [25]. This may be why sulfite concentrations in the AEB2 group rose sharply and then fell to zero. At the same time, the yield of the sulfate in the AEB2 group was very low, which indicated that thiosulfate might be transformed into tetrathionate or other polysulfite products under the biological oxidation of AEB2. Burschel et al. [26] also showed that Halomonas mongoliensis could utilize sulfide as an electron donor under heterotrophic conditions, which is of particular interest. In addition, strain AIR-2 being oxidized sulfide only with nitrate and strain Z-7009 being oxidized only with N2O could also be of interest.

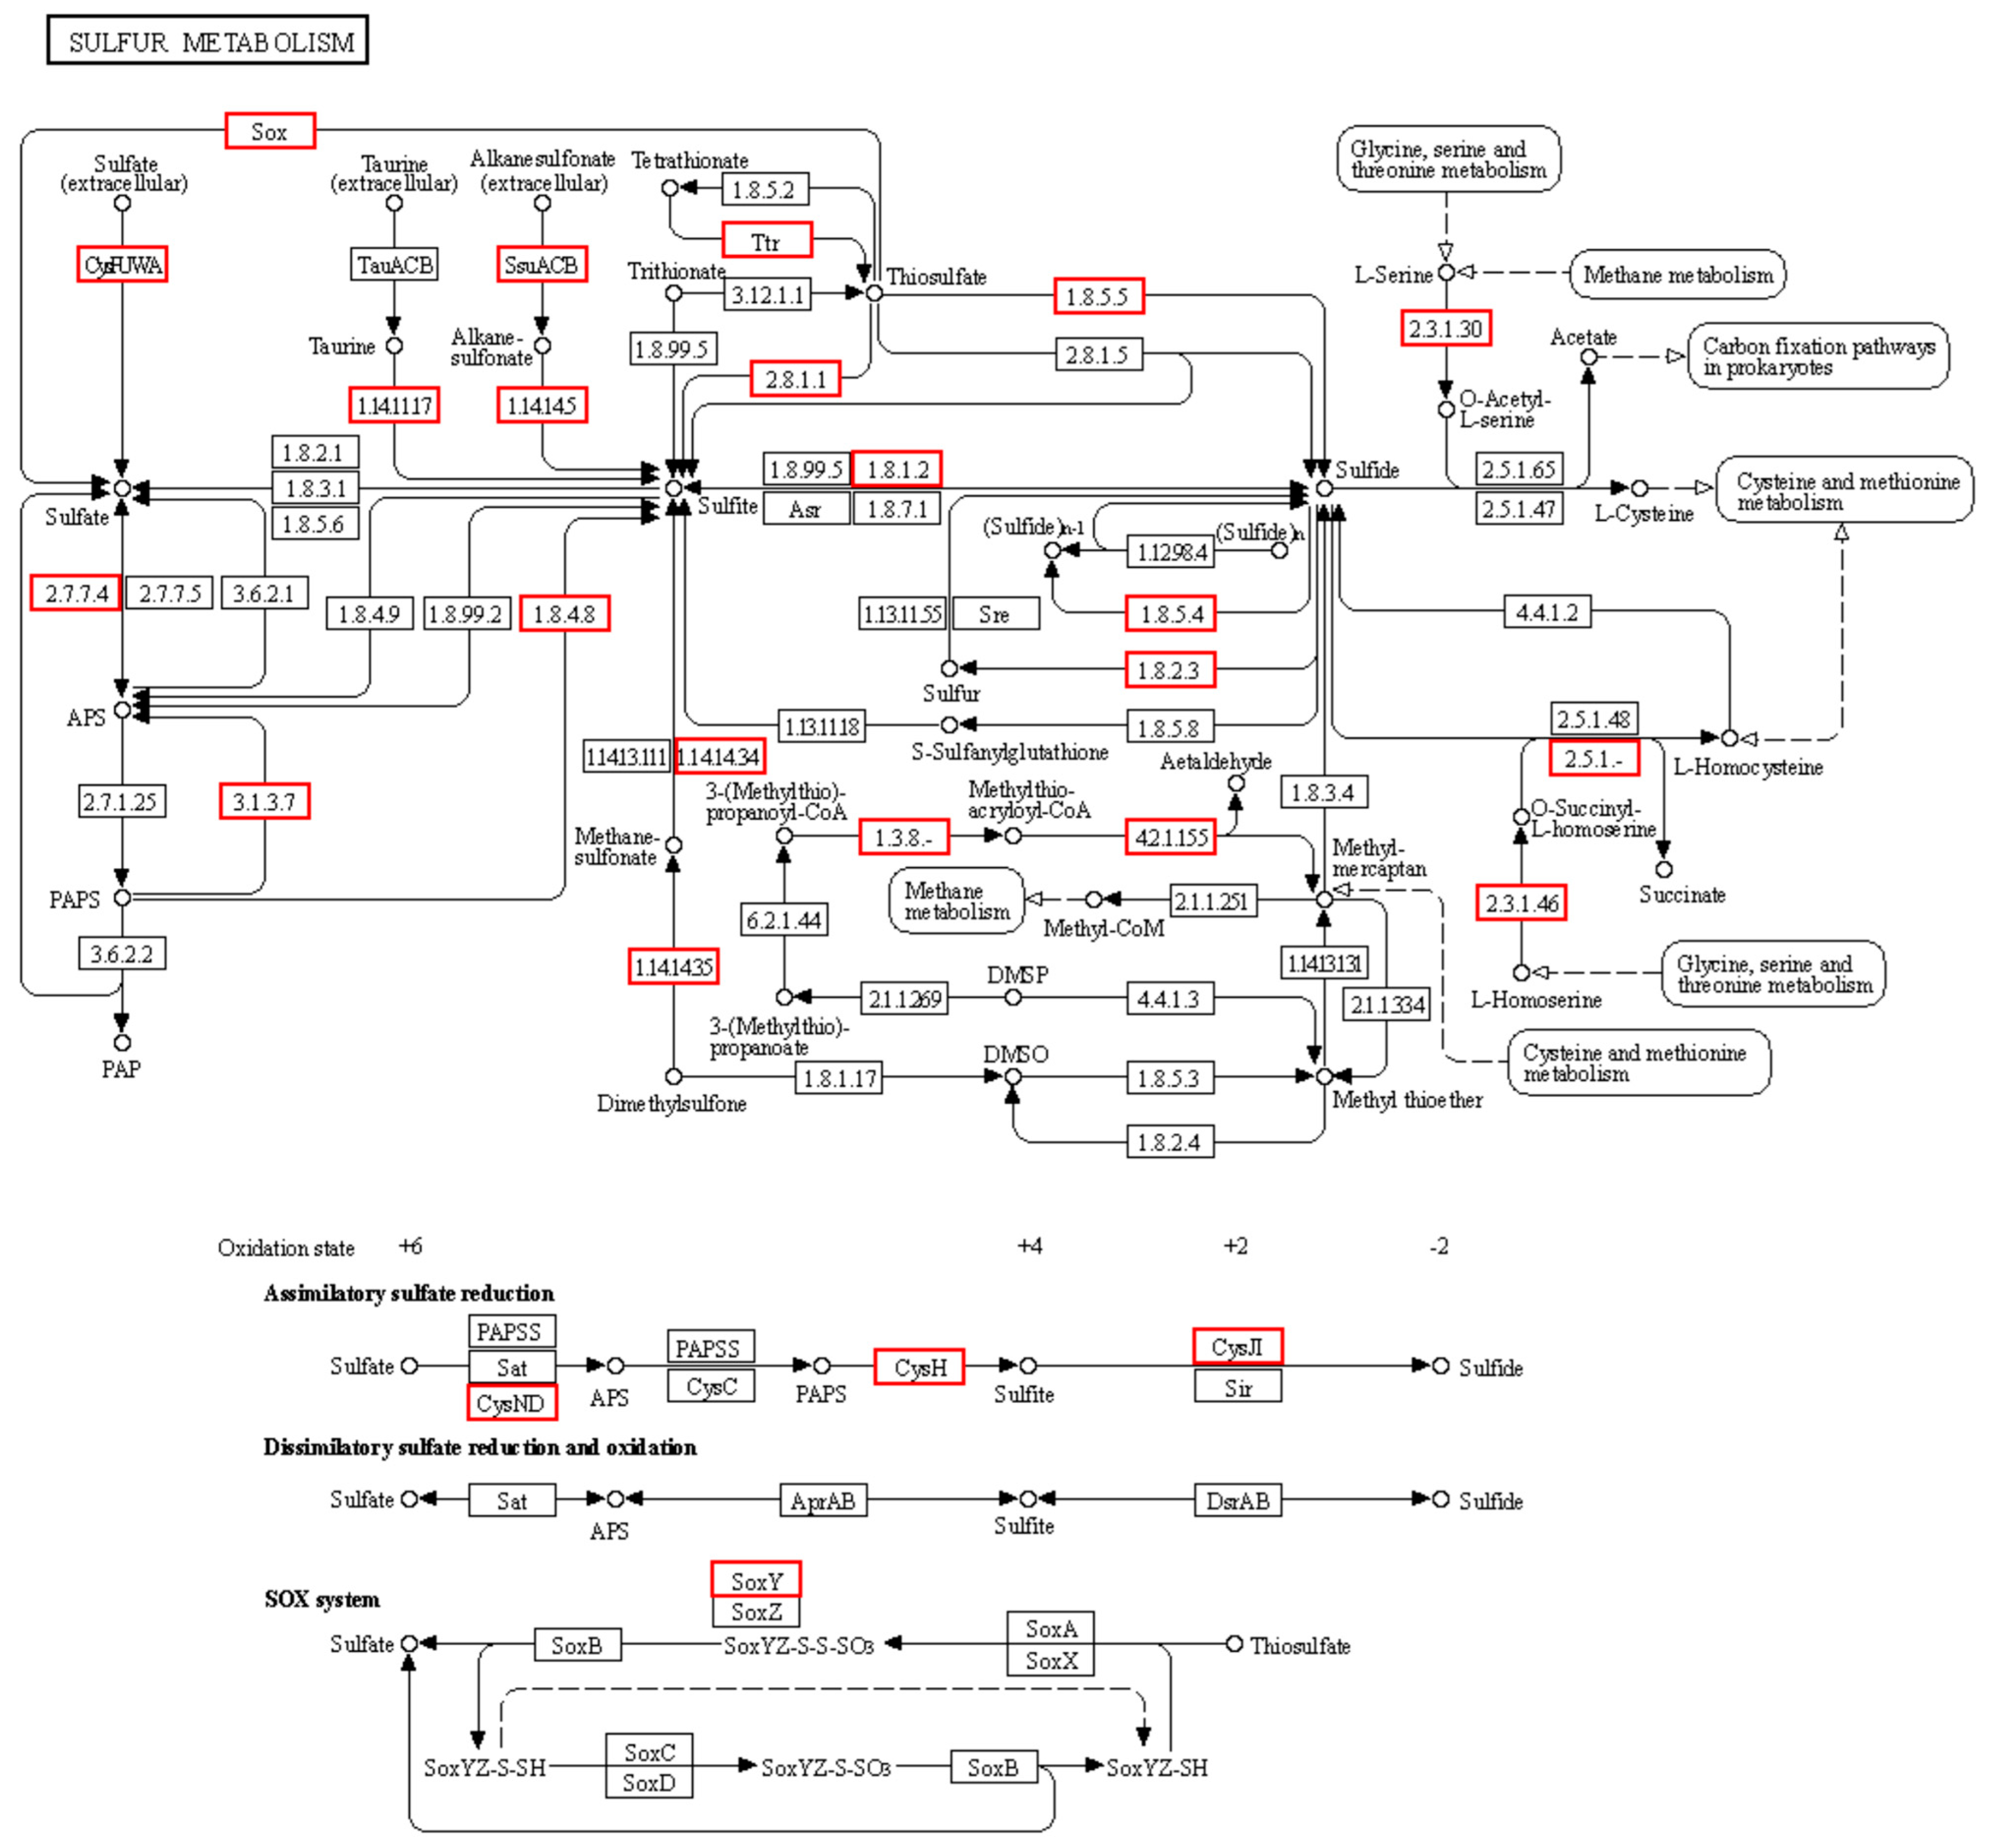
3.6. Degradation Pathway Analysis

It can be seen from Table 2 and Figure 7 that there was an assimilative sulfate reduction pathway in the AEB2 strain. However, this path lacked the recovery path from APS to PAPS, which indicated that the strain could not assimilate and reduce sulfate but that it could reduce sulfite to sulfide. However, there are two important sulfur oxidation function genes, fccAB and sqr, in AEB2 that could catalyze the oxidation reaction with sulfide as the substrate to generate elemental sulfur. The functional genes for further oxidation of elemental sulfur, such as dsrAB and sor, were lacking in the genome, so the oxidation products of the strain may be the main products of elemental sulfur. This was consistent with the conclusion of the production of elemental sulfur during our screening test.
Sulfide:quinone oxidoreductase (SQR) encoded by Sqr gene is a membrane protein in which sulfide can be oxidized into elemental sulfur and electrons can be transferred to quinone through cogroup FAD to reduce quinone to hydroquinone. It is widely found in many organisms, including bacteria, archaea, fungi, and plants. It is involved in many biological processes, such as hydrogen sulfide oxidation in bacteria and electron transfer after photosynthesis in photosynthetic bacteria. In fact, there are many types of SQR in bacteria. According to its structure and catalytic mechanism, it can be divided into six subtypes [27]. Marcia et al. [28] sorted out six kinds of SQR in his study. Of the six types of SQR, the most widespread is the type I SQR. They are a class of highly conserved proteins that are widely present in a variety of bacteria. In contrast, type II SQR is found only in certain bacteria. As for type III SQR, it is mainly found in certain archaea. In addition, there are other types of SQR, such as types IV, V, and VI, which are found in certain fungi, plants, and bacteria, respectively. Different types of SQR have different catalytic mechanisms and structural characteristics. For example, type I SQR usually has an electron transport system consisting of FAD and NAD(P)H, and it is capable of oxidizing sulfide to elemental sulfur and transferring electrons to quinones. Type III SQR has an electron transport system consisting of multiple iron–sulfur clusters that catalyze the oxidation of sulfides under a wider range of conditions. At the same time, it was proved that type I SQR had stronger sulfide affinity.
Flavocytochrome c is an important iron-thionein involved in the electron transfer process of bacteria, and it is an important part of sulfur oxidation metabolism. It is usually a soluble periplasmic enzyme consisting of a larger sulfide-binding flavin protein subunit (FccB) and a smaller cytochrome c (FccA) subunit. The FccB subunit is mainly responsible for the oxidation reaction of sulfide, while the FccA subunit is responsible for the electron transport process. The FccA subunit is usually a soluble protein. It contains an iron chelating center and a CXXCH with four amino acid residues. These residues are able to bind to iron–sulfur clusters and participate in electron transport processes. The FccB subunit is a large protein containing multiple iron–sulfur clusters. It forms a stable complex with the FccA subunit and participates in the metabolic process of sulfur oxidation. The main function of flavocytochrome c is to participate in the sulfur oxidation metabolism of bacteria. In the process, it is able to capture electrons from the sulfide and transfer them to the next electron acceptor, eventually transferring them to the respiratory chain to produce energy. Flavocytochrome c can also participate in the oxidation process of sulfide as a sulfur oxidase and it can oxidize sulfide to sulfate. In addition, flavocytochrome c can also play an important role in the metabolic process of some bacteria. For example, it is involved in bacterial REDOX reaction, alcohol fermentation, nitric acid reduction, and other metabolic pathways.
Based on the whole genome sequence and the analysis of sulfide oxidation products, the sulfur oxidation pathway of AEB2 was mainly incomplete oxidation dominated by the SQR-FccAB pathway. The end products were elemental sulfur (S0) and thiosulfate (S2O32−), without further oxidation to sulfate (due to a lack of dsrAB and sor genes). The following are the step-by-step reaction equations:
(1)
Sulfide oxidation to elemental sulfur (S0).
The SQR enzyme catalyzes the rapid oxidation of sulfide to elemental sulfur (S0) by membrane binding reaction (Equation (9)). The resulting elemental sulfur can be deposited in the periplasmic space inside the cell or outside the cell. At the same time, electrons are transferred to the respiratory chain, driving the transmembrane proton gradient to generate ATP.
H 2 S + Q   S Q R   S 0 + QH 2 .
  • Q: ubiquinone (electron acceptor);
  • QH2: reduced panquinone (enters the electron transport chain to produce ATP).
(2)
Sulfide is oxidized to thiosulfate (S2O32−).
The FccAB complex enzyme in the peritroplasmic space further binds sulfur to S0 (S2O32−) through the synergic action of the flavin cogroup (FAD) and cytochrome c (Equation (10)). However, the deletion of dsrAB and sor genes in the genome leads to further oxidation of elemental sulfur and thiosulfate to sulfate.
3   H S + S 0 + 2   c y t   c o x F C C A B S 2 O 3 2 + 2   c y t   c r e d + H + .
cyt cox/cyt cred: oxidation/reduction in cytochrome c (electron transfer to terminal oxidase).
Ignoring the details of electron transfer, the total oxidation reaction of the AEB2 halomonas strain to sulfide can be expressed as follows:
3HS + 3H+ + 3O2 → S0 + S2O32− + 3H2O.
O2: Oxygen, an electron acceptor, receives electrons by cytochrome c oxidase.

4. Conclusions

In order to reduce the emission of H2S from livestock farms, the strains were screened from dairy farm wastewater. The nutrient composition and operating parameters were optimized, and the oxidation intermediates were analyzed. The possible metabolic pathways were revealed by whole genome sequencing. The results showed that the strain had a high H2S removal rate of 47.1% in dairy farm wastewater. The strain had a wide range of pH and temperature applications. The oxidation products of S2− were mainly elemental sulfur and sodium thiosulfate. The screened halomonas AEB2 showed a good sulfur oxidation effect, and it also had a good application prospect in reducing the odor gas of hydrogen sulfide in livestock wastewater. The detailed sulfur metabolism mechanism of the strain and its stability and cost in the actual environment need further study.

Author Contributions

Writing—original draft preparation, Y.C. and S.Y.; original draft revision, S.Z. and J.L.; data processing, X.X.; experimental and software operation, K.P.; experimental method, K.Z.; financial support and project execution, K.Z., S.Z. and J.L. All authors have read and agreed to the published version of the manuscript.

Funding

This research was funded by the National Key Research and Development Program of China (2023YFD1702000); the Yunnan Science and Technology Department project, China (202402AE090032); and the Innovation Project of Chinese Academy of Agricultural Sciences.

Data Availability Statement

The raw data supporting the conclusions of this article will be made available by the authors on request.

Conflicts of Interest

Author Shuhao Yu was employed by the company Beijing Capital Air Environmental Science & Technology Co., Ltd. The remaining authors declare that the research was conducted in the absence of any commercial or financial relationships that could be construed as a potential conflict of interest.

References

  1. Chen, J.; Gao, X.; Zhang, Y.; Penttinen, P.; Wang, Q.; Ling, J.; Lan, T.; Ou, D.; Li, Y. Analysis on Coupling Coordination Degree for Cropland and Livestock from 2000 to 2020 in China. Agriculture 2020, 13, 1304. [Google Scholar] [CrossRef]
  2. He, D.; Deng, X.; Wang, X.; Zhang, F. Livestock greenhouse gas emission and mitigation potential in China. J. Environ. Manage. 2023, 348, 119494. [Google Scholar] [CrossRef] [PubMed]
  3. Kim, D.W.; Jo, S.H.; Son, J.; Yu, S.; Kim, T.H.; Lee, M.; Kim, T.H. Removal of livestock odor gas ammonia, hydrogen sulfide, methanethiol by electron beam in a continuous flow system. J. Environ. Chem. Eng. 2024, 12, 113970. [Google Scholar] [CrossRef]
  4. Wang, W.; Deng, X.; Wang, Y. Changes in non-CO2 greenhouse gas emissions from livestock production, meat consumption and trade in China. Sustain. Prod. Consump. 2023, 42, 281–291. [Google Scholar] [CrossRef]
  5. Wang, Y.C.; Han, M.F.; Jia, T.P.; Hu, X.R.; Zhu, H.Q.; Tong, Z.; Lin, Y.T.; Wang, C.; Liu, D.Z.; Peng, Y.Z.; et al. Emissions, measurement, and control of odor in livestock farms: A review. Sci. Total Environ. 2021, 776, 145735. [Google Scholar] [CrossRef]
  6. Trabue, S.L.; Kerr, B.J.; Scoggin, K.D. Swine diets impact manure characteristics and gas emissions: Part I sulfur level. Sci. Total Environ. 2019, 687, 800–807. [Google Scholar] [CrossRef]
  7. Le-Minh, N.; Sivret, E.C.; Shammay, A.; Stuetz, R.M. Factors affecting the adsorption of gaseous environmental odors by activated carbon: A critical review. Crit. Rev. Environ. Sci. Tec. 2018, 48, 341–375. [Google Scholar] [CrossRef]
  8. Hammouda, S.B.; Adhoum, N.; Monser, L. Chemical oxidation of a malodorous compound, indole, using iron entrapped in calcium alginate beads. J. Hazard Mater. 2016, 301, 350–361. [Google Scholar] [CrossRef]
  9. Zhou, S.; Li, Y.; Liao, X.; Wang, W.; Mao, C.; Mi, J.; Wu, Y.; Wang, Y. A low-cost deodorizing spray net device for the removal of ammonia emissions in livestock houses. J. Clean Prod. 2021, 318, 128516. [Google Scholar] [CrossRef]
  10. Grimm, F.; Franz, B.; Dahl, C. Regulation of Dissimilatory Sulfur Oxidation in the Purple Sulfur Bacterium Allochromatium Vinosum. Front. Microbiol. 2011, 2, 51. [Google Scholar] [CrossRef]
  11. Sakurai, H.; Ogawa, T.; Shiga, M.; Inoue, K. Inorganic sulfur oxidizing system in green sulfur bacteria. Photosynth. Res. 2010, 104, 163–176. [Google Scholar] [CrossRef] [PubMed]
  12. Vikromvarasiri, N.; Pisutpaisal, N. Hydrogen sulfide removal in biotrickling filter system by Halothiobacillus neapolitanus. Int. J. Hydrog. Energy 2016, 41, 15682–15687. [Google Scholar] [CrossRef]
  13. Ashun, E.; Toor, U.A.; Kim, H.S.; Kim, K.R.; Park, S.J.; Hong, S.; Oh, S.E. A direct contact bioassay using sulfur-oxidizing bacteria (SOB) for toxicity assessment of contaminated field soils. Chemosphere 2022, 286, 131599. [Google Scholar] [CrossRef] [PubMed]
  14. Zhang, Z.; Zhang, C.; Yang, Y.; Zhang, Z.; Tang, Y.; Su, P.; Lin, Z. A review of sulfate-reducing bacteria: Metabolism, influencing factors and application in wastewater treatment. J. Clean. Prod. 2022, 376, 134109. [Google Scholar] [CrossRef]
  15. Xin, Y.; Liu, H.; Cui, F.; Liu, H.; Xun, L. Recombinant Escherichia coli with sulfide: Quinone oxidoreductase and persulfide dioxygenase rapidly oxidises sulfide to sulfite and thiosulfate via a new pathway. Environ. Microbiol. 2016, 18, 5123–5136. [Google Scholar] [CrossRef]
  16. Sun, Z.; Pang, B.; Xi, J.; Hu, H.Y. Screening and characterization of mixotrophic sulfide oxidizing bacteria for odorous surface water bioremediation. Bioresour. Technol. 2019, 290, 121721. [Google Scholar] [CrossRef]
  17. Chen, L.; Li, W.; Zhao, Y.; Zhou, Y.; Zhang, S.; Meng, L. Isolation and application of a mixotrophic sulfide-oxidizing Cohnella thermotolerans LYH-2 strain to sewage sludge composting for hydrogen sulfide odor control. Bioresour. Technol. 2022, 345, 126557. [Google Scholar] [CrossRef] [PubMed]
  18. Shams, D.F.; Singhal, N.; Elefsiniotis, P. Effect of feed characteristics and operational conditions on treatment of dairy farm wastewater in a coupled anoxic-upflow and aerobic system. Biochem. Eng. J. 2018, 133, 186–195. [Google Scholar] [CrossRef]
  19. Shang, J.; Xu, L.; Yang, R.; Zhao, Y.; Tang, S.K.; Sun, J.Q. Halomonas alkalisoli sp. nov., a novel haloalkalophilic species from saline-alkaline soil, and reclassification of Halomonas daqingensis Wu et al. 2008 as a later heterotypic synonym of Halomonas desiderata Berendes et al. 1996. Syst. Appl. Microbiol. 2022, 45, 126351. [Google Scholar] [CrossRef]
  20. Ma, R.; Lai, Y.X.; Li, L.; Tan, H.L.; Wang, J.L.; Li, Y.; Tang, T.T.; Qin, L. Bacterial inhibition potential of 3D rapid-prototyped magnesium-based porous composite scaffolds-an in vitro efficacy study. Sci. Rep. 2015, 5, 14. [Google Scholar] [CrossRef]
  21. Boltyanskaya, Y.V.; Kevbrin, V.V.; Lysenko, A.M.; Kolganova, T.V.; Tourova, T.P.; Osipov, G.A.; Zhilina, T.N. Halomonas mongoliensis sp. nov. and Halomonas kenyensis sp. nov., new haloalkaliphilic denitrifiers capable of N 2 O reduction, isolated from soda lakes. Microbiology 2007, 76, 739–747. [Google Scholar] [CrossRef]
  22. de Graaff, M.; Klok, J.B.; Bijmans, M.F.; Muyzer, G.; Janssen, A.J. Application of a 2-step process for the biological treatment of sulfidic spent caustics. Water Res. 2012, 46, 723–730. [Google Scholar] [CrossRef] [PubMed]
  23. Pokorna, D.; Zabranska, J. Sulfur-oxidizing bacteria in environmental technology. Biotechnol. Adv. 2015, 33, 1246–1259. [Google Scholar] [CrossRef] [PubMed]
  24. Tang, K.; Baskaran, V.; Nemati, M. Bacteria of the sulphur cycle: An overview of microbiology, biokinetics and their role in petroleum and mining industries. Biochem. Eng. J. 2009, 44, 73–94. [Google Scholar] [CrossRef]
  25. Van den Bosch, P.L.; Sorokin, D.Y.; Buisman, C.J.; Janssen, A.J. The effect of pH on thiosulfate formation in a biotechnological process for the removal of hydrogen sulfide from gas streams. Environ. Sci. Technol. 2008, 42, 2637–2642. [Google Scholar] [CrossRef]
  26. Burschel, S.; Kreuzer, D.D.; Nuber, F.; Stiller, M.; Hofmann, M.; Zupok, A.; Siemiatkowska, B.; Gorka, M.; Leimkühler, S.; Friedrich, T. Iron-sulfur cluster carrier proteins involved in the assembly of Escherichia coli NADH: Ubiquinone oxidoreductase (complex I). Mol. Microbiol. 2019, 111, 31–45. [Google Scholar] [CrossRef]
  27. Xia, Y.; Lü, C.; Hou, N.; Xin, Y.; Liu, J.; Liu, H.; Xun, L. Sulfide production and oxidation by heterotrophic bacteria under aerobic conditions. ISME J. 2017, 11, 2754–2766. [Google Scholar] [CrossRef]
  28. Marcia, M.; Ermler, U.; Peng, G.; Michel, H. A new structure-based classification of sulfide: Quinone oxidoreductases. Proteins 2010, 78, 1073–1083. [Google Scholar] [CrossRef]
Figure 1. The sulfur oxidation effect of the screened strains ((a) comparison of the primary screened strains, and (b) the compound screening effect of AEB2 and AEB6). If there are the same letters in the same figure, it means that the difference between the two groups of data is not significant (p > 0.05).
Sustainability 17 03551 g001
Figure 2. The identification of the AEB2 strain ((a) a colony shape diagram of AEB2; (b) an electron microscope photograph; (c) the Gram staining results of AEB2; (d) the 16s rDNA sequence tree; and (e) the rpoD gene sequence tree).
Sustainability 17 03551 g002
Figure 3. Circos map of AEB2 ((a) genome and (b) plasmid, where the circle represents, from the outside to the inside, the genomic markers, positive chain CDS, negative chain CDS, tRNA and rRNA, GC content, and GC-Skew values).
Sustainability 17 03551 g003
Figure 4. Medium optimization for AEB2 ((a) carbon source type; (b) carbon source amount; (c) nitrogen source type; and (d) nitrogen source amount).
Sustainability 17 03551 g004
Figure 5. The operation condition optimization and application effects of AEB2 ((a) inoculum rate; (b) temperature; (c) stirring rate; (d) pH; (e) under 100 mg S2−/L; (f) under 200 mg S2−/L; (g) under 500 mg S2−/L; and (h) under 1000 mg S2−/L). If there are the same letters in the same figure, it means that the difference between the two groups of data is not significant (p > 0.05).
Sustainability 17 03551 g005
Figure 6. Changes in the oxidation products of AEB2 with time ((a) sulfide; (b) sulfur; (c) thiosulfate; (d) sulfite; and (e) sulfate).
Sustainability 17 03551 g006
Figure 7. Metabolic pathway of the sulfur compounds.
Sustainability 17 03551 g007
Table 1. Genomic comparison between the AEB2 strain and typical strains of the closely phylogenetic Halomonas genus.
StrainsAccession NumberG + C (mol%)ANI (%)dDDH (Formula 1%)
Halomonas sp. AEB2-67.4695.863.3
H. mongoliensis Z-7009TUn-uploaded data67.5895.863.3
H. alkalicola 56-L4-10aEnTGCA_003182195.167.689.6352.6
H. shengliensis CGMCC 1.6444TGCA_000475415.168.687.2242.3
H. campaniensis 5AGTGCA_014193375.167.7388.3349.1
H. ventosae CECT 5797TGCA_004363555.167.486.2636.3
H. denitrificans DSM 18045TGCA_003056305.168.786.1735.3
H. nitroreducens 11STGCA_003966155.167.585.5628.5
H. pacifica NBRC 102220TGCA_007989625.167.285.9429.4
H. gudaonensis CGMCC 1.6133TGCA_900100195.164.985.5227.1
H. heilongjiangensis 9-2TGCA_003202165.166.186.2630.7
H. halophila NBRC 102604TGCA_007989465.168.185.5028.1
H. daqiaonensis CGMCC 1.9150TGCA_900109725.163.1585.3529.2
H. daqingensis CGMCC 1.6443TGCA_900108215.164.885.6926.9
H. smyrnensis AAD6TGCA_000265245.267.986.2228.4
Table 2. The functional genes of sulfur oxidation.
KO IDKO NameKO Description
Gene2638fccAFlavocytochrome cytochrome sulfide dehydrogenase (big subunit)
Gene2639fccBFlavocytochrome cytochrome sulfide dehydrogenase (small subunit)
Gene2641SoxYSulfur oxidizing protein
Gene2687sqrSulfide quinone oxidoreductase
Disclaimer/Publisher’s Note: The statements, opinions and data contained in all publications are solely those of the individual author(s) and contributor(s) and not of MDPI and/or the editor(s). MDPI and/or the editor(s) disclaim responsibility for any injury to people or property resulting from any ideas, methods, instructions or products referred to in the content.

