
Assessing the Impacts of New Quality Productivity on Sustainable Agriculture: Structural Mechanisms and Optimization Strategies—Empirical Evidence from China


Abstract
1. Introduction
2. Literature Review
- Grounded in the basic connotations of new quality productivity from a historical materialist perspective, this paper categorizes agricultural new quality productivity from three angles—new quality laborers, new quality production inputs, and new quality labor inputs—thereby further refining its theoretical framework.
- To gain deeper insights into the multifaceted mechanisms through which new quality productivity influences agricultural development, this study constructs a PLS-SEM system that reveals the relationships among new quality laborers, new quality production inputs, and new quality labor inputs, as well as their sufficiency conditions and overall structural impact on sustainable agricultural development.
- Leveraging the characteristic of factor loadings within the structural equation model (SEM), this study integrates TOPSIS to conduct a locational analysis of agricultural functional regions, thus providing systematic empirical support for agricultural policymaking.
- By introducing the advanced cIPMA model, this paper supplements the conventional analysis of each indicator’s importance and performance in agricultural development with a necessity analysis. This addition clarifies optimization directions and priorities, effectively enhancing the specificity and efficacy of agricultural policy formulation.
3. Theoretical Analysis and Hypotheses
3.1. Impact of New Quality Agricultural Labor Inputs (NQLI) on Sustainable Agricultural Development and Agricultural Output
3.2. Impact of New Quality Agricultural Production Inputs (NQPI) on Sustainable Agricultural Development and Agricultural Output
3.3. Impact of New Quality Agricultural Laborers (NQL) on Sustainable Agriculture
3.4. Impact of Sustainable Agricultural Development on Agricultural Output
3.5. Proposed Hypotheses Overview
4. Data and Research Method
4.1. Data Source and Processing
4.2. Partial Least Squares Structural Equation Modeling (PLS-SEM)
4.3. Outer Loadings TOPSIS (OL-TOPSIS)
4.4. Combined Importance–Performance Map Analysis (cIPMA)
5. Results and Discussion
5.1. Construct Reliability and Validity
5.1.1. Reliability Indicators Testing Analysis
5.1.2. Validity Indicators Testing Analysis
5.2. Structural Mechanisms of NQP in Sustainable Agricultural Development
5.2.1. Direct Effect Results Analysis
5.2.2. Indirect Effect Results Analysis
5.3. Analysis of NQP in Agricultural Functional Zones
5.3.1. OL-TOPSIS Based on the Classification of Agricultural Functional Zones
5.3.2. OL-TOPSIS Result Analysis
5.4. Necessary Conditions for NQP to Promote Sustainable Agricultural Development
5.4.1. NCA Result Presentation
5.4.2. cIPMA Result Analysis
6. Conclusions and Policy Recommendations
6.1. Conclusions
- (1)
- Empirical analysis shows that agricultural NQP significantly promotes sustainable agricultural development and output growth through multidimensional synergistic effects. Specifically, in terms of New Quality Agricultural Labor Inputs, agricultural technology has a significant positive impact on agricultural output, further confirming that technological innovation is one of the key drivers of agricultural economic growth. Agricultural ecology, due to its gradual and systematic mechanism, mainly influences agricultural sustainability through indirect paths like technological upgrades, resource optimization, and institutional innovations, thus having a relatively weaker positive impact on sustainable agricultural development. In terms of New Quality Agricultural Production Inputs, tangible production inputs serve as the foundational guarantee for agricultural development and have a direct positive effect on agricultural output. Intangible production inputs, through the innovation and application of elements such as knowledge, technology, and data, optimize resource allocation, enhance production efficiency, and reduce environmental burdens, thereby significantly promoting agricultural sustainability. New Quality Agricultural Laborers (NQL) not only directly contribute to sustainable agricultural development and output growth but also enhance their indirect impact through the mediating effects of intangible materials and agricultural ecology, fully demonstrating that high-quality laborers are the core driving force behind agricultural transformation and upgrading. The above conclusions reveal the logical relationship and synergy between various factors within new quality productivity and provide a theoretical basis and practical inspiration for policy optimization and sustainable agricultural development in developing countries such as China, as well as in developed countries.
- (2)
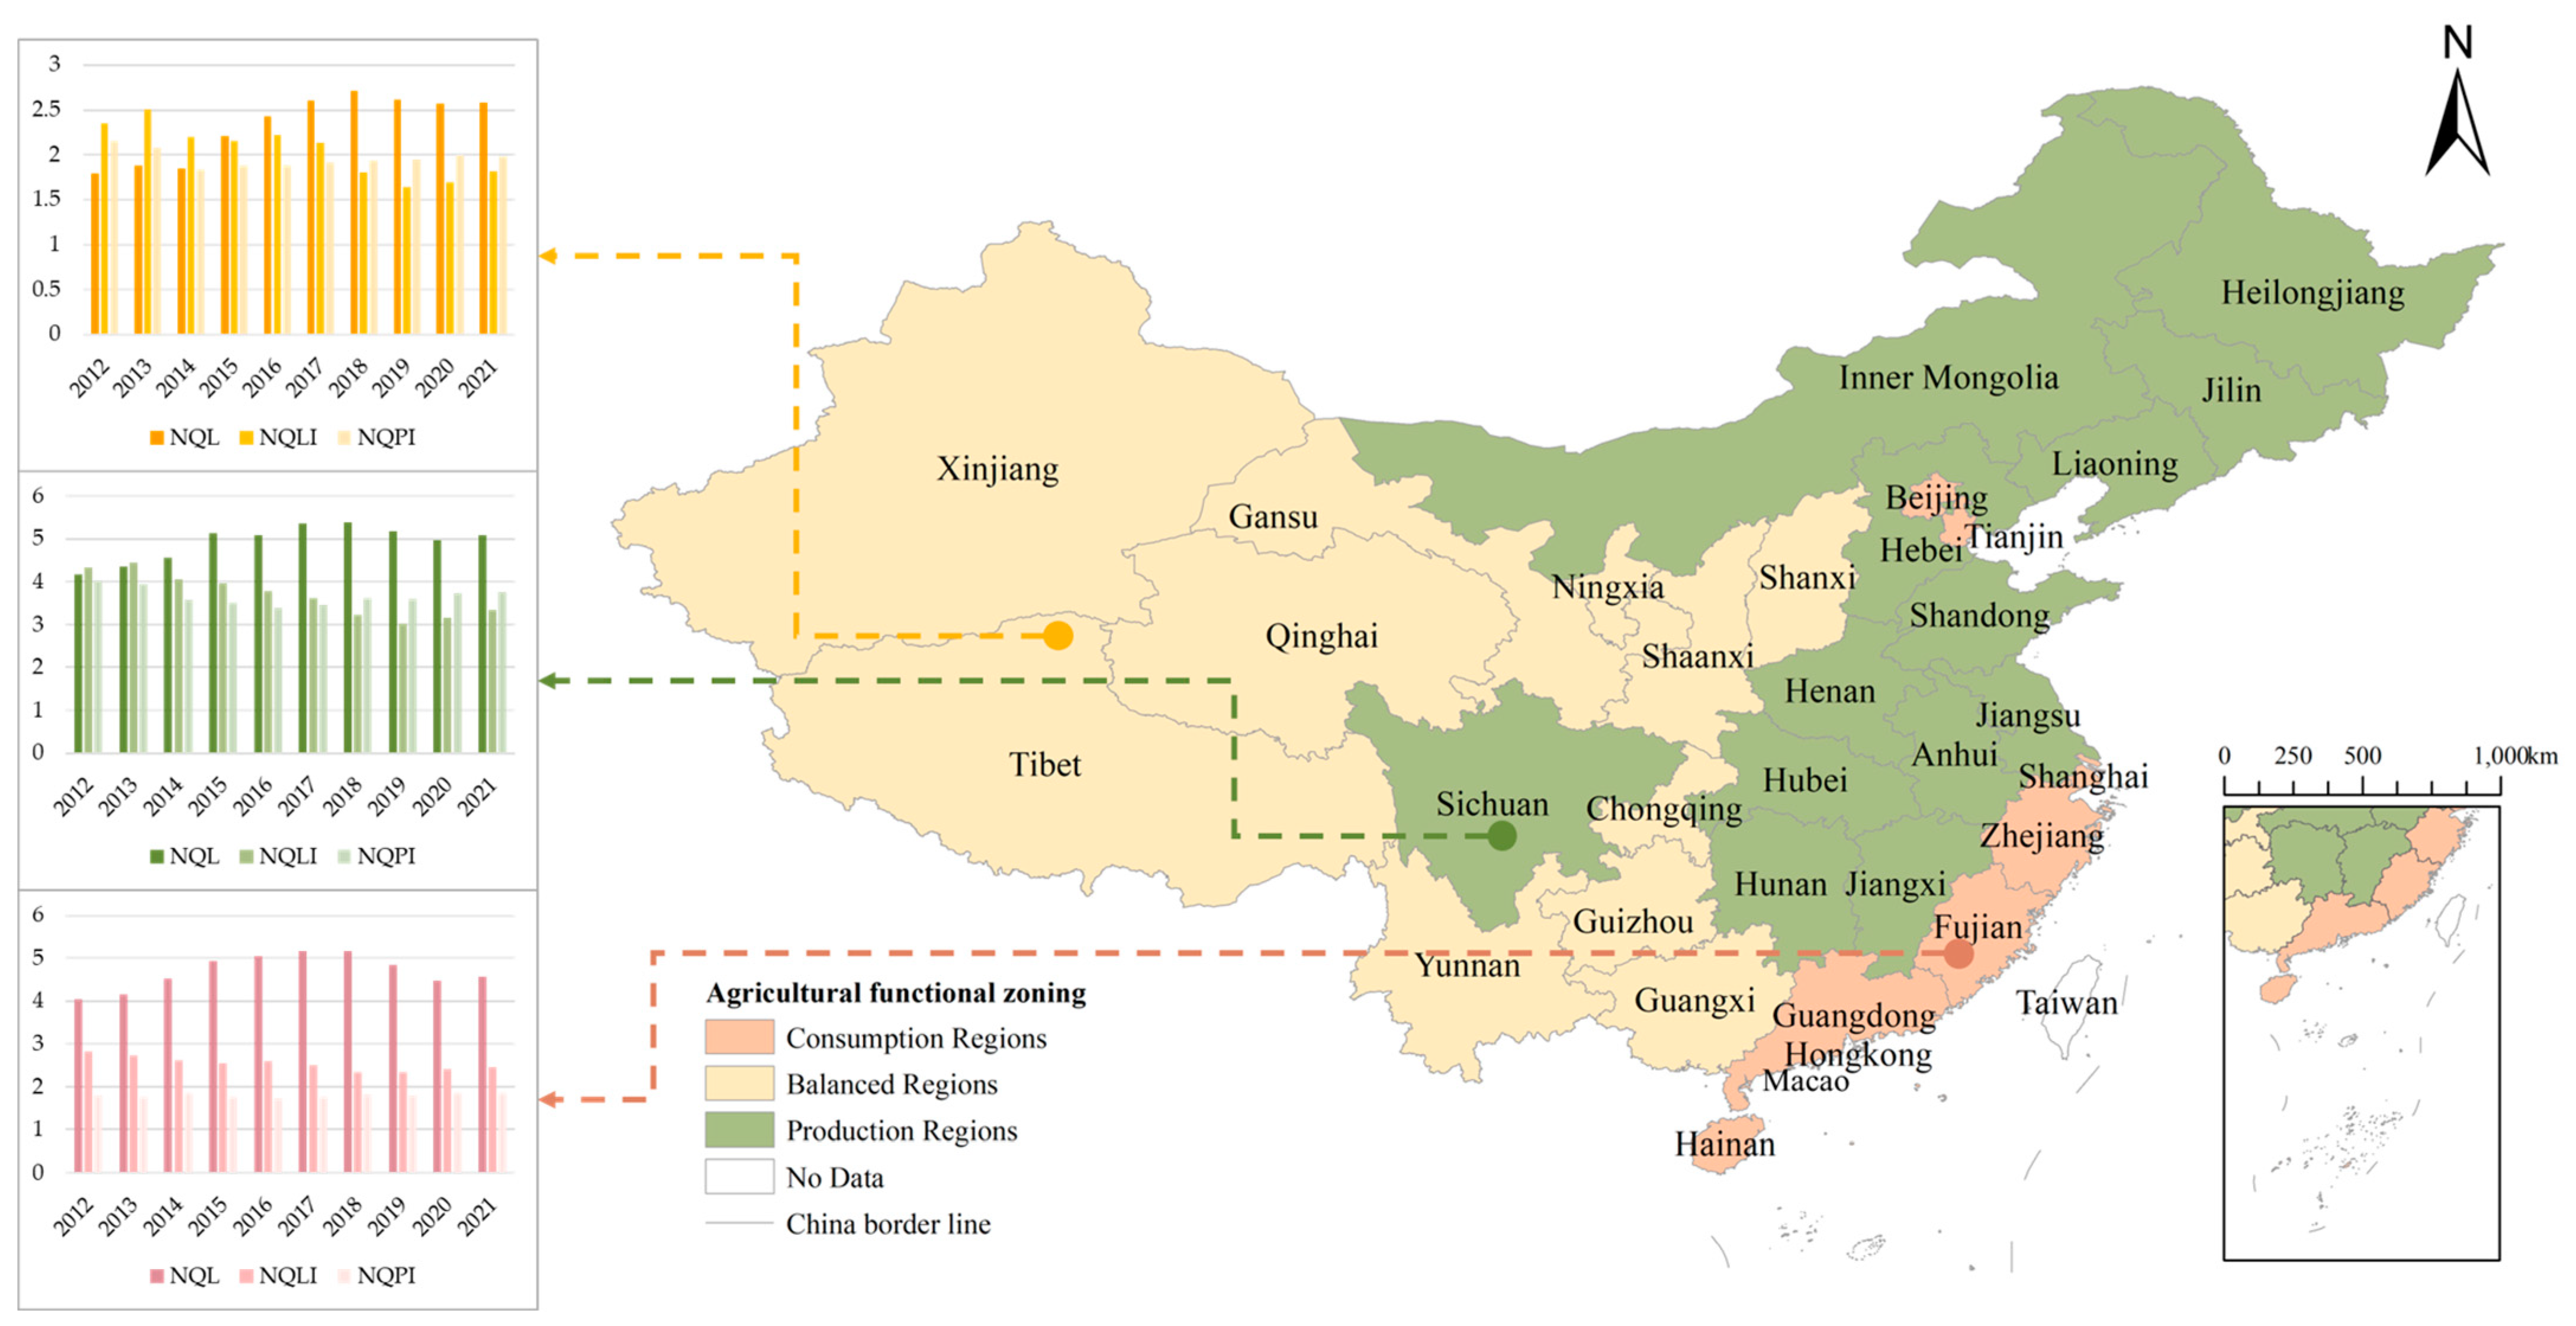
- Based on agricultural functional zoning, the OL-TOPSIS model is used to quantify the regional comprehensive NQP level, visualizing the differences in New Quality Agricultural Productivity among regions. Through systematic analysis, this study proves that each functional zone has a relatively stable and continuous development trend, reflecting the coordinated development of different regions across various dimensions. In the consumption areas, the high quality of agricultural laborers has driven high-end agricultural production and technology application. However, their strong dependence on external supplies of production materials and labor inputs has restricted the improvement of local agricultural inputs. In the balanced zones, the quality of agricultural laborers has gradually improved, but the investment in labor inputs and the configuration of production materials remain unstable. Infrastructure construction and education and training need to be further strengthened to optimize the allocation and investment of production factors. As the main agricultural production area, the production zone supports large-scale production with a sufficient number of agricultural laborers but still faces significant room for improvement in modernization development and resource optimization efficiency due to weak management of agricultural labor inputs and insufficient investment in production materials. The results of this study can assist policymakers in implementing differentiated strategies according to the characteristics of each agricultural functional zone, thereby effectively promoting the transformation and upgrading of Chinese agriculture and regional coordinated development. At the same time, the idea of coordinated development of functional zoning proposed in this study provides a new theoretical perspective and practical reference for other countries facing limited agricultural resources and uneven regional development.
- (3)
- This study innovatively utilizes cIPMA to combine importance, performance, and necessity, based on desired sustainable agricultural development (SUS), to accurately identify and assess the key roles and areas for improvement of various factors in sustainable agricultural development. The results show that New Quality Agricultural Laborers (NQL) are an important driver of agricultural system transformation, significantly enhancing the synergy between ecological effectiveness (ECO) and intangible resources (IM). However, their development in balanced zones is limited by insufficient educational investment, indicating the need to intensify comprehensive human capital training and support. New Quality Agricultural Labor Inputs (NQLI) play an important role in the synergy between technology (TEC) and ecology (ECO), but uneven investment in the production zone further emphasizes the necessity of coupling technology and ecological governance. Meanwhile, New Quality Agricultural Production Inputs, which do not meet the necessary conditions, need to be prioritized for action. This confirms that relying solely on the input of production factors is insufficient to directly promote sustainability, and comprehensive optimization of resource allocation and governance structures must be achieved on the basis of balancing ecological, social, and economic factors.
6.2. Policy Recommendations
Author Contributions
Funding
Institutional Review Board Statement
Informed Consent Statement
Data Availability Statement
Conflicts of Interest
Abbreviations
| NQL | New Quality Agricultural Laborers |
| NQLI | New Quality Agricultural Labor Inputs |
| TEC | Agricultural technology |
| ECO | Agricultural ecology |
| NQPI | New Quality Agricultural Production Inputs |
| TM | Tangible materials |
| IM | Intangible materials |
| SUS | Sustainable agricultural development |
| AgrO | Agricultural Output Value Standards |
| NQP | New Quality Productivity |
| PLS-SEM | Partial Least Squares Structural Equation Modeling |
| OL-TOPSIS | Outer Loadings TOPSIS |
| cIPMA | Combined Importance–Performance Map Analysis |
Appendix A
Appendix B

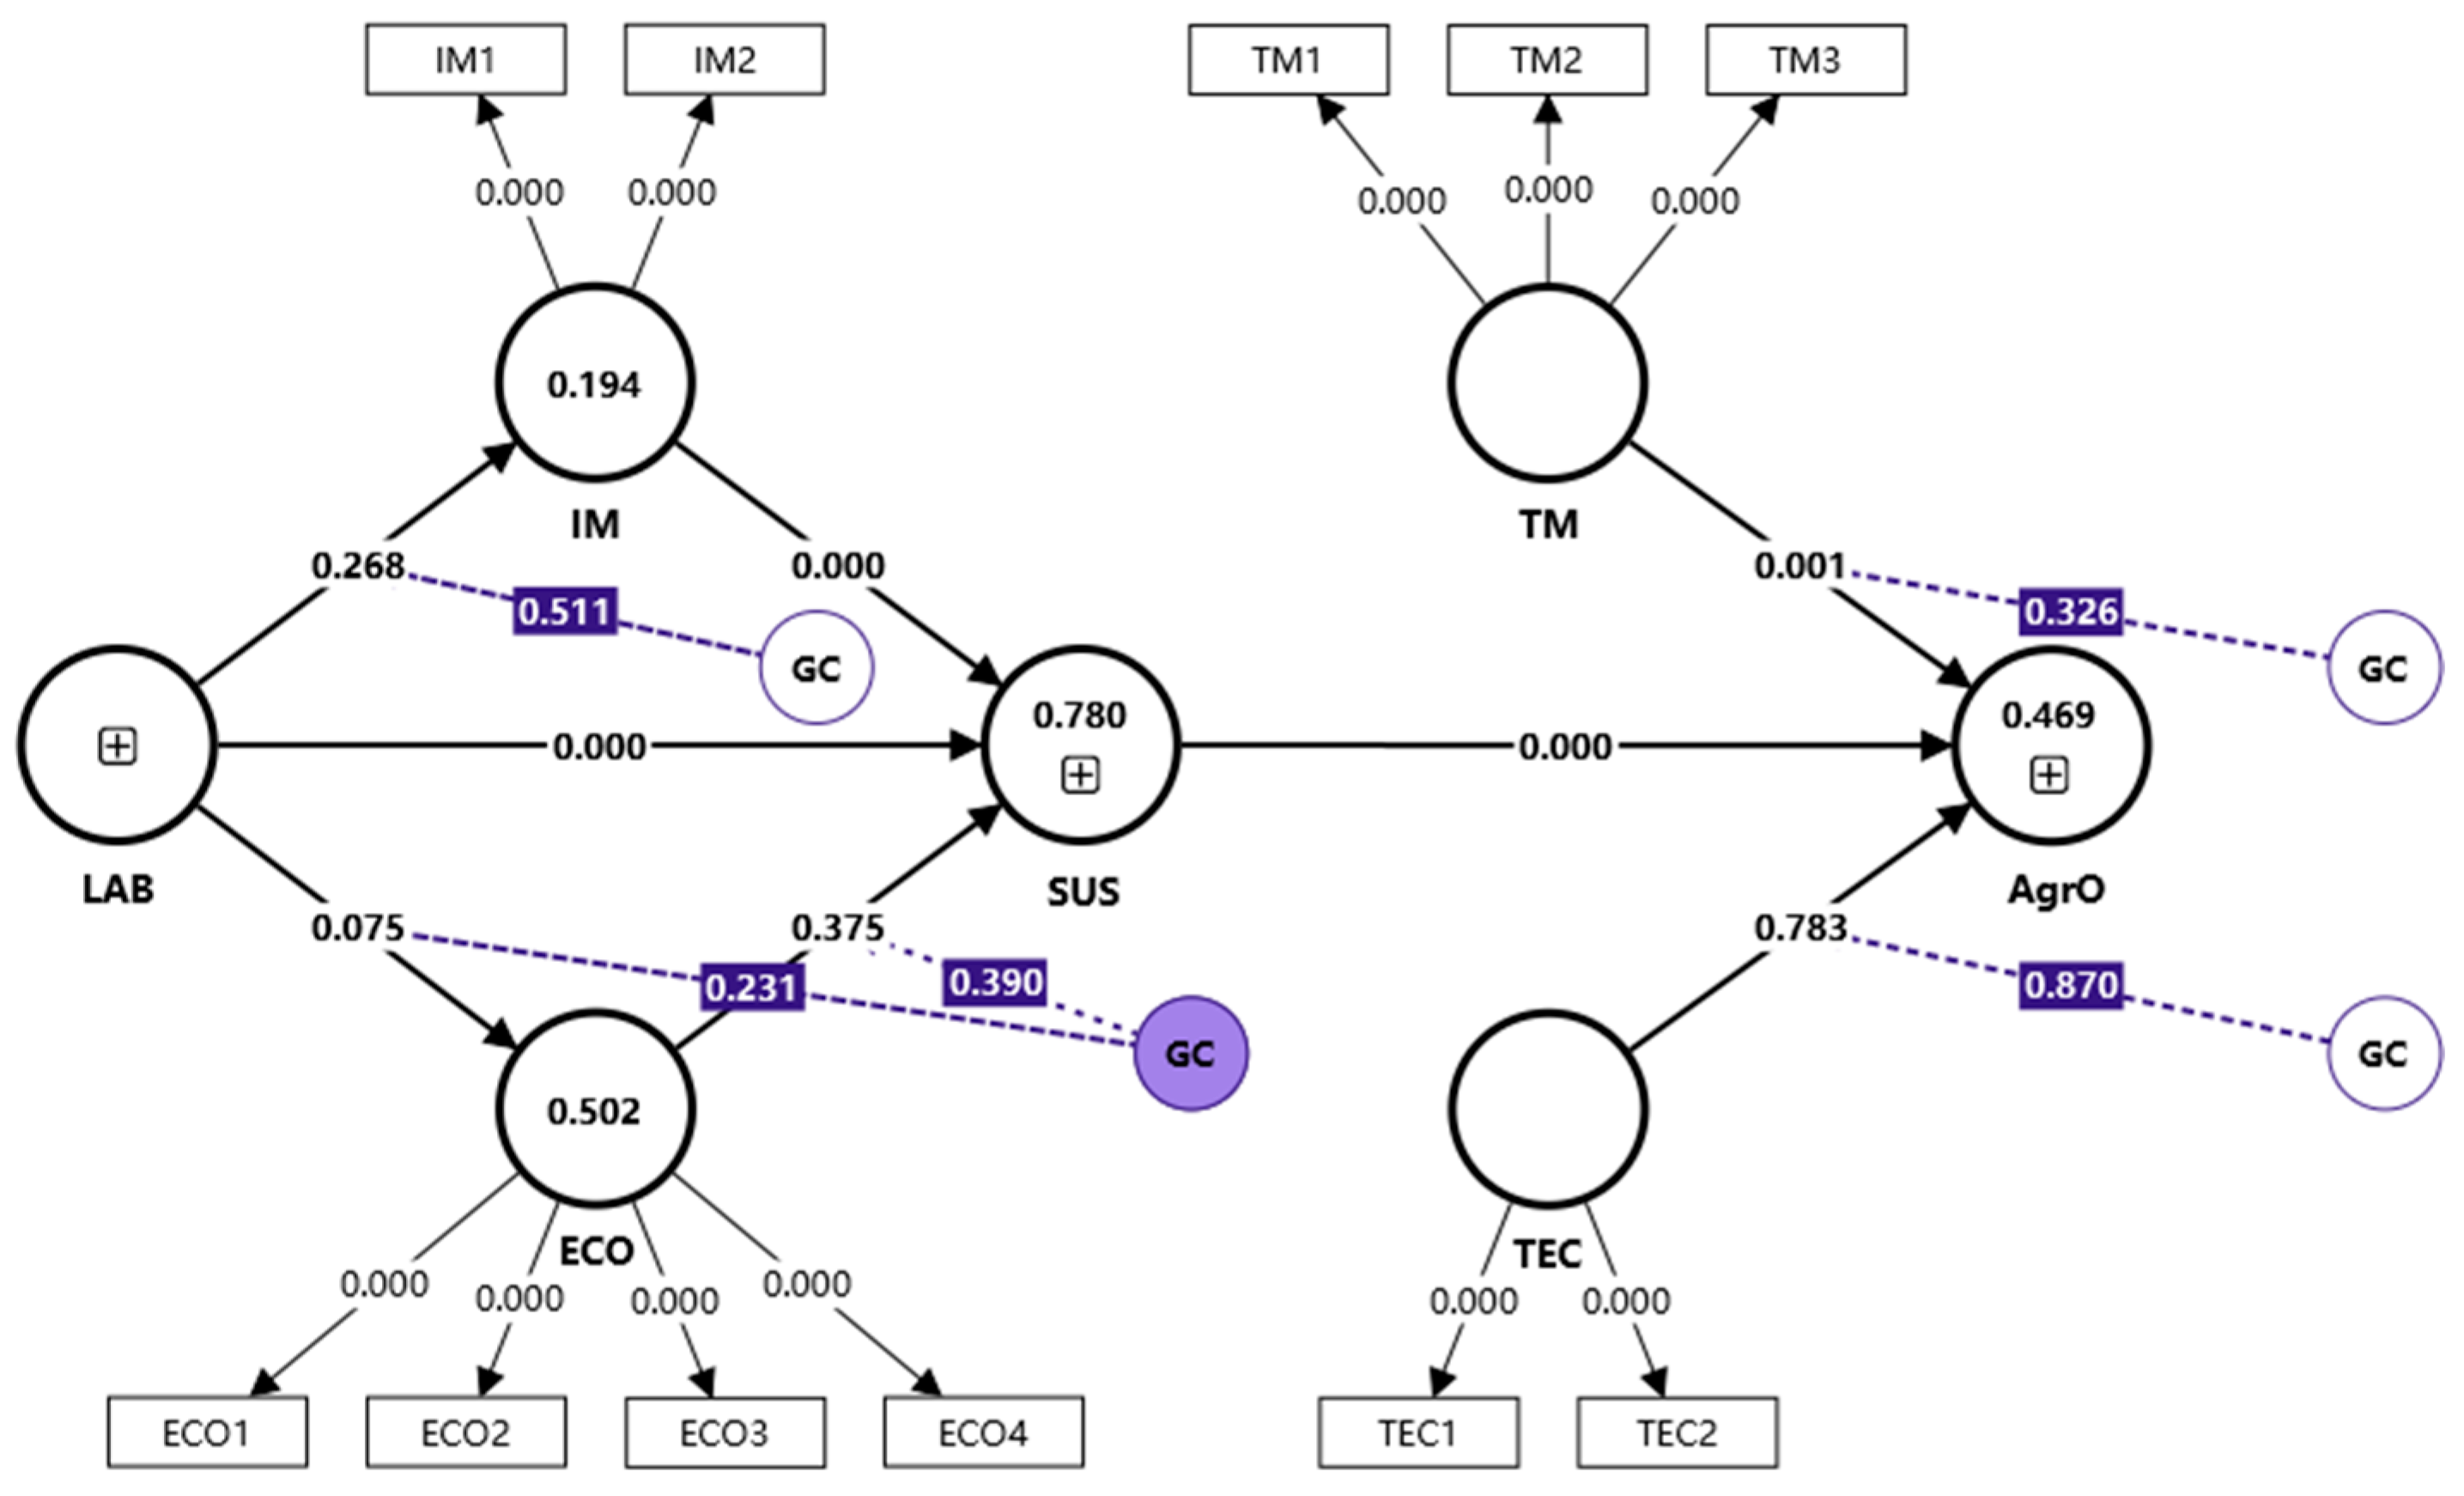
| B | (M) | (STDEV) | T Statistics | p Values | |
|---|---|---|---|---|---|
| GC(LAB) → CO | −1.439 | −0.482 | 1.202 | 1.198 | 0.231 |
| GC(ECO) → SUS | 0.019 | 0.019 | 0.022 | 0.860 | 0.390 |
| GC(TEC) → AgrO | 0.014 | 0.026 | 0.083 | 0.164 | 0.870 |
| GC(TM) → AgrO | −0.197 | −0.162 | 0.201 | 0.982 | 0.326 |
| GC(LAB) → IM | −0.642 | −0.346 | 0.976 | 0.658 | 0.511 |
References
- Food and Agriculture Organization of the United Nations (FAO). The State of Food and Agriculture 2021: Making Agrifood Systems More Resilient to Shocks and Stresses; FAO: Rome, Italy, 2021; Available online: https://openknowledge.fao.org/server/api/core/bitstreams/1e61f82a-618c-467a-a37f-545580094a1d/content (accessed on 10 January 2025).
- United Nations (UN). Transforming Our World: The 2030 Agenda for Sustainable Development; UN: New York, NY, USA, 2015; Available online: https://docs.un.org/en/A/RES/70/1 (accessed on 10 January 2025).
- Chartzoulakis, K.; Bertaki, M. Sustainable water management in agriculture under climate change. Agric. Agric. Sci. Procedia 2015, 4, 88–98. [Google Scholar] [CrossRef]
- Singh, A.; Mehrotra, R.; Rajput, V.D.; Dmitriev, P.; Singh, A.K.; Kumar, P.; Tomar, R.S.; Singh, O.; Singh, A.K. Geoinformatics, artificial intelligence, sensor technology, big data: Emerging modern tools for sustainable agriculture. In Sustainable Agriculture Systems and Technologies; Wiley: Hoboken, NJ, USA, 2022; pp. 295–313. [Google Scholar]
- Pham, L.V.; Smith, C. Drivers of agricultural sustainability in developing countries: A review. Environ. Syst. Decis. 2014, 34, 326–341. [Google Scholar] [CrossRef]
- Bathaei, A.; Štreimikienė, D. Renewable energy and sustainable agriculture: Review of indicators. Sustainability 2023, 15, 14307. [Google Scholar] [CrossRef]
- Fuglie, K. R&D capital, R&D spillovers, and productivity growth in world agriculture. Appl. Econ. Perspect. Policy 2018, 40, 421–444. [Google Scholar]
- Chen, M.; Zhou, Y.; Huang, X.; Ye, C. The integration of new-type urbanization and rural revitalization strategies in China: Origin, reality and future trends. Land 2021, 10, 207. [Google Scholar] [CrossRef]
- Yu, F.; Huang, X. Thinking on the path of high-quality agricultural development in the new era. J. China Exec. Leadersh. Acad. Jinggangshan 2019, 12, 128–135. (In Chinese) [Google Scholar]
- Luo, B.; Geng, P. New quality agricultural productivity: Theoretical context, basic core and improvement path. Agric. Econ. Issues 2024, 4, 13–26. (In Chinese) [Google Scholar]
- Gao, F. The logic, multi-dimensional connotation and contemporary significance of “new quality productivity”. Political Econ. Rev. 2023, 14, 127–145. (In Chinese) [Google Scholar]
- Zhou, W.; Xu, L. On the new quality of productivity: Connotation, characteristics and key points. Reform 2023, 10, 1–13. (In Chinese) [Google Scholar]
- Niu, Z. Digital economy empowers agricultural modernization: Mechanism of action, practical challenges and promotion path. Smart Agric. Guide 2025, 5, 103–106. (In Chinese) [Google Scholar] [CrossRef]
- Raman, S. Agricultural Sustainability: Principles, Processes, and Prospects; CRC Press: Boca Raton, FL, USA, 2024. [Google Scholar]
- Pu, Q.; Xiang, W. The connotation, characteristics, internal logic and realization methods of new quality productivity—A new driving force for promoting Chinese modernization. J. Xinjiang Norm. Univ. Philos. Soc. Sci. Ed. 2024, 45, 77–85. (In Chinese) [Google Scholar] [CrossRef]
- Zhu, D.; Ye, L. China’s new agricultural productivity: Level measurement and dynamic evolution. Stat. Decis. -Mak. 2024, 40, 24–30. (In Chinese) [Google Scholar] [CrossRef]
- Li, Z.; Wang, J.; Wang, W. New quality productivity empowers high-quality agricultural development: An empirical analysis based on spatial spillover effect and threshold effect. Jiangsu Agric. Sci. 2024, 52, 1–12. (In Chinese). Available online: http://www.jsnykx.cn/oa/DArticle.aspx?type=view&id=202424036 (accessed on 10 January 2025).
- Li, Z.; Wang, H. Digital new quality productivity and high-quality development of the real economy: Theoretical analysis and empirical test. Stat. Decis. -Mak. 2024, 40, 12–16. (In Chinese) [Google Scholar] [CrossRef]
- Hu, X.; Yang, Y.; Li, Y. Can VAT Reform Drive the Upgrading of the Service Industry? Test from the Realization Path of New Quality Productivity. Financ. Forum. 2025, pp. 1–13. (In Chinese). Available online: https://www.chndoi.org/Resolution/Handler?doi=10.13762/j.cnki.cjlc.20241226.001 (accessed on 10 January 2025).
- Malthus, T. An Essay on the Principle of Population//British Politics and the Environment in the Long Nineteenth Century; Routledge: London, UK, 2023; pp. 77–84. [Google Scholar]
- Harwood, R.R. A History of Sustainable Agriculture//Sustainable Agricultural Systems; CRC Press: Boca Raton, FL, USA, 2020; pp. 3–19. [Google Scholar]
- Gumbau-Albert, M.; Maudos, J. The importance of intangible assets in regional economic growth: A growth accounting approach. Ann. Reg. Sci. 2022, 69, 361–390. [Google Scholar] [CrossRef]
- Khan, N.; Ray, R.L.; Sargani, G.R.; Ihtisham, M.; Khayyam, M.; Ismail, S. Current progress and future prospects of agriculture technology: Gateway to sustainable agriculture. Sustainability 2021, 13, 4883. [Google Scholar] [CrossRef]
- Waleed, M.; Um, T.-W.; Kamal, T.; Khan, A.; Iqbal, A. Determining the precise work area of agriculture machinery using internet of things and artificial intelligence. Appl. Sci. 2020, 10, 3365. [Google Scholar] [CrossRef]
- Wan, S.; Zhao, K.; Lu, Z.; Li, J.; Lu, T.; Wang, H. A modularized ioT monitoring system with edge-computing for aquaponics. Sensors 2022, 22, 9260. [Google Scholar] [CrossRef]
- Froiz-Míguez, I.; Lopez-Iturri, P.; Fraga-Lamas, P.; Celaya-Echarri, M.; Blanco-Novoa, Ó.; Azpilicueta, L.; Falcone, F.; Fernández-Caramés, T.M. Design, implementation, and empirical validation of an IoT smart irrigation system for fog computing applications based on Lora and Lorawan sensor nodes. Sensors 2020, 20, 6865. [Google Scholar] [CrossRef]
- Inoue, Y. Satellite-and drone-based remote sensing of crops and soils for smart farming–a review. Soil Sci. Plant Nutr. 2020, 66, 798–810. [Google Scholar] [CrossRef]
- Merz, M.; Pedro, D.; Skliros, V.; Bergenhem, C.; Himanka, M.; Houge, T.; Matos-Carvalho, J.P.; Lundkvist, H.; Cürüklü, B.; Hamrén, R.; et al. Autonomous UAS-based agriculture applications: General overview and relevant European case studies. Drones 2022, 6, 128. [Google Scholar] [CrossRef]
- Wang, R.F.; Su, W.H. The application of deep learning in the whole potato production Chain: A Comprehensive review. Agriculture 2024, 14, 1225. [Google Scholar] [CrossRef]
- Khaki, S.; Wang, L.; Archontoulis, S.V. A CNN-RNN framework for crop yield prediction. Front. Plant Sci. 2020, 10, 1750. [Google Scholar] [CrossRef]
- Mazzia, V.; Khaliq, A.; Chiaberge, M. Improvement in land cover and crop classification based on temporal features learning from Sentinel-2 data using recurrent-convolutional neural network (R-CNN). Appl. Sci. 2019, 10, 238. [Google Scholar] [CrossRef]
- Nejad, S.M.M.; Abbasi-Moghadam, D.; Sharifi, A.; Farmonov, N.; Amankulova, K.; Laszlz, M. Multispectral crop yield prediction using 3D-convolutional neural networks and attention convolutional LSTM approaches. IEEE J. Sel. Top. Appl. Earth Obs. Remote Sens. 2022, 1, 254–266. [Google Scholar] [CrossRef]
- Yang, F.; Zhang, D.; Zhang, Y.; Zhang, Y.; Han, Y.; Zhang, Q.; Zhang, Q.; Zhang, C.; Liu, Z.; Wang, K. Prediction of corn variety yield with attribute-missing data via graph neural network. Comput. Electron. Agric. 2023, 211, 108046. [Google Scholar] [CrossRef]
- Shukla, J.S.; Pandya, R.J. Deep learning-oriented c-GAN models for vegetative drought prediction on peninsular India. IEEE J. Sel. Top. Appl. Earth Obs. Remote Sens. 2023, 17, 282–297. [Google Scholar] [CrossRef]
- Kulkarni, P.; Wyawahare, M.; Karwande, A.; Kolhe, T.; Kamble, S.; Joshi, A. Agricultural Field Analysis Using Satellite Hyperspectral Data and Autoencoder//International Conference on Recent Trends in Image Processing and Pattern Recognition; Springer International Publishing: Cham, Switzerland, 2021; pp. 363–375. [Google Scholar]
- Bedi, P.; Gole, P. Plant disease detection using hybrid model based on convolutional autoencoder and convolutional neural network. Artif. Intell. Agric. 2021, 5, 90–101. [Google Scholar] [CrossRef]
- Das, S.; Ray, M.K.; Panday, D.; Mishra, P.K. Role of biotechnology in creating sustainable agriculture. PLOS Sustain. Transform. 2023, 2, e0000069. [Google Scholar] [CrossRef]
- Kim, H.S.; Kwak, S.S. Crop biotechnology for sustainable agriculture in the face of climate crisis. Plant Biotechnol. Rep. 2020, 14, 139–141. [Google Scholar] [CrossRef]
- Pe’Er, G.; Bonn, A.; Bruelheide, H.; Dieker, P.; Eisenhauer, N.; Feindt, P.H.; Hagedorn, G.; Hansjürgens, B.; Herzon, I.; Lomba, Â.; et al. Action needed for the EU Common Agricultural Policy to address sustainability challenges. People Nat. 2020, 2, 305–316. [Google Scholar] [CrossRef]
- Mazzucato, M. Mission-oriented innovation policies: Challenges and opportunities. Ind. Corp. Change 2018, 27, 803–815. [Google Scholar] [CrossRef]
- Czyżewski, B.; Matuszczak, A.; Grzelak, A.; Guth, M.; Majchrzak, A. Environmental sustainable value in agriculture revisited: How does Common Agricultural Policy contribute to eco-efficiency? Sustain. Sci. 2021, 16, 137–152. [Google Scholar] [CrossRef]
- Shreck, A.; Getz, C.; Feenstra, G. Social sustainability, farm labor, and organic agriculture: Findings from an exploratory analysis. Agric. Hum. Values 2006, 23, 439–449. [Google Scholar] [CrossRef]
- Prause, L. Digital agriculture and labor: A few challenges for social sustainability. Sustainability 2021, 13, 5980. [Google Scholar] [CrossRef]
- Raji, E.; Ijomah, T.I.; Eyieyien, O.G. Improving agricultural practices and productivity through extension services and innovative training programs. Int. J. Appl. Res. Soc. Sci. 2024, 6, 1297–1309. [Google Scholar] [CrossRef]
- Sánchez-Bravo, P.; Chambers, E.V.; Noguera-Artiaga, L.; Sendra, E.; Chambers, E., IV; Carbonell-Barrachina, Á.A. Consumer understanding of sustainability concept in agricultural products. Food Qual. Prefer. 2021, 89, 104136. [Google Scholar] [CrossRef]
- Wojciechowska-Solis, J.; Barska, A. Exploring the preferences of consumers’ organic products in aspects of sustainable consumption: The case of the Polish consumer. Agriculture 2021, 11, 138. [Google Scholar] [CrossRef]
- Smith, A. An Inquiry into the Nature and Causes of the Wealth of Nations. In Readings in Economic Sociology; Wiley: Hoboken, NJ, USA, 2002; pp. 6–17. [Google Scholar]
- Ricardo, D. From the Principles of Political Economy and Taxation//Readings in the Economics of the Division of Labor: The Classical Tradition; World Scientific: Singapore, 2005; pp. 127–130. [Google Scholar] [CrossRef]
- Solow, R.M. A contribution to the theory of economic growth. Q. J. Econ. 1956, 70, 65–94. [Google Scholar] [CrossRef]
- Arrow, K.J. The economic implications of learning by doing. Rev. Econ. Stud. 1962, 29, 155–173. [Google Scholar] [CrossRef]
- Romer, P.M. Endogenous technological change. J. Political Econ. 1990, 98 Pt 2, S71–S102. [Google Scholar] [CrossRef]
- Lucas, R.E., Jr. On the mechanics of economic development. J. Monet. Econ. 1988, 22, 3–42. [Google Scholar] [CrossRef]
- Brynjolfsson, E.; Rock, D.; Syverson, C. The productivity J-curve: How intangibles complement general purpose technologies. Am. Econ. J. Macroecon. 2021, 13, 333–372. [Google Scholar] [CrossRef]
- Haskel, J.; Westlake, S. Capitalism without capital: The rise of the intangible economy. Economics 2020, 44, 147–152. [Google Scholar]
- Mondejar, M.E.; Avtar, R.; Diaz, H.L.B.; Dubey, R.K.; Esteban, J.; Gómez-Morales, A.; Hallam, B.; Mbungu, N.T.; Okolo, C.C.; Prasad, K.A.; et al. Digitalization to achieve sustainable development goals: Steps towards a Smart Green Plane. Sci. Total Environ. 2021, 794, 148539. [Google Scholar] [CrossRef]
- Stern, N. The economics of climate change. Am. Econ. Rev. 2008, 98, 1–37. [Google Scholar] [CrossRef]
- Steffen, W.; Richardson, K.; Rockström, J.; Cornell, S.E.; Fetzer, I.; Bennett, E.M.; Biggs, R.; Carpenter, S.R.; De Vries, W.; De Wit, C.A.; et al. Planetary boundaries: Guiding human development on a changing planet. Science 2015, 347, 1259855. [Google Scholar] [CrossRef]
- Carlsson, B.; Acs, Z.J.; Audretsch, D.B.; Braunerhjelm, P. Knowledge creation, entrepreneurship, and economic growth: A historical review. Ind. Corp. Change 2009, 18, 1193–1229. [Google Scholar] [CrossRef]
- Švarc, J.; Dabić, M. Evolution of the knowledge economy: A historical perspective with an application to the case of Europe. J. Knowl. Econ. 2017, 8, 159–176. [Google Scholar] [CrossRef]
- Xu, Z.; Zheng, L.; Cheng, M. The inherent logic and practical concept of new quality productivity to empower high-quality development. Contemp. Econ. Res. 2023, 339, 51–58. (In Chinese) [Google Scholar]
- Tang, J. New Quality Productivity and China’s Strategic Shift Towards Sustainable and Innovation-Driven Economic Development. J. Interdiscip. Insights 2024, 2, 36–45. [Google Scholar]
- Xie, F.; Jiang, N.; Kuang, X. Towards an accurate understanding of ‘new quality productive forces’. Econ. Political Stud. 2024, 1–15. [Google Scholar] [CrossRef]
- Yue, S.; Bajuri, N.H.; Khatib, S.F.; Lee, Y. New quality productivity and environmental innovation: The hostile moderating roles of managerial empowerment and board centralization. J. Environ. Manag. 2024, 370, 122423. [Google Scholar] [CrossRef]
- Shao, C.; Dong, H.; Gao, Y. New Quality Productivity and Industrial Structure in China: The Moderating Effect of Environmental Regulation. Sustainability 2024, 16, 6796. [Google Scholar] [CrossRef]
- Xu, T.; Yang, G.; Chen, T. The role of green finance and digital inclusive finance in promoting economic sustainable development: A perspective from new quality productivity. J. Environ. Manag. 2024, 370, 122892. [Google Scholar] [CrossRef]
- Wang, J.; Qiao, L.; Zhu, G.; Di, K.; Zhang, X. Research on the driving factors and impact mechanisms of green new quality productive forces in high-tech retail enterprises under China’s Dual Carbon Goals. J. Retail. Consum. Serv. 2025, 82, 104092. [Google Scholar] [CrossRef]
- Lin, L.; Gu, T.; Shi, Y. The influence of new quality productive forces on high-quality agricultural development in China: Mechanisms and empirical testing. Agriculture 2024, 14, 1022. [Google Scholar] [CrossRef]
- Huang, Q.; Guo, W.; Wang, Y. A Study of the Impact of New Quality Productive Forces on Agricultural Modernization: Empirical Evidence from China. Agriculture 2024, 14, 1935. [Google Scholar] [CrossRef]
- Li, Y.; Wei, C.; Liu, D. Research on the impact of new agricultural productivity on the high-quality development of my country’s agriculture—Based on the analysis of the mediating effect of agricultural production technology efficiency and the regulatory effect of agricultural insurance. Southwest Financ. 2024, 517, 1–13. (In Chinese) [Google Scholar]
- Hair, J.F., Jr.; Hult, G.T.M.; Ringle, C.M.; Sarstedt, M.; Danks, N.P.; Ray, S. Partial Least Squares Structural Equation Modeling (PLS-SEM) Using R: A Workbook; Springer Nature: Berlin/Heidelberg, Germany, 2021. [Google Scholar]
- Lan, Y.; Hu, M.; Xie, X. Diverse professional experiences and high-quality development of family farms: Based on the mediating effect of dynamic capabilities. Agric. Mod. Res. 2024, 45, 649–660. (In Chinese) [Google Scholar] [CrossRef]
- Xu, X.; Yang, W.; Wu, B. Multiple paths for rural digital economy to enhance agricultural total factor productivity: A configuration analysis based on county-level data in Zhejiang Province. Chin. Rural Econ. 2024, 84–103. (In Chinese) [Google Scholar] [CrossRef]
- Gao, X.; Yang, Z.; Sun, Z. An empirical study on inclusive innovation performance based on PLS-SEM model. Sci. Technol. Prog. Countermeas. 2019, 36, 26–32. (In Chinese) [Google Scholar]
- Zhang, H.; Hou, X.; Jin, Y. The impact of fallow policy on farmers’ behavior in protecting cultivated land quality. Resour. Sci. 2023, 45, 2196–2209. (In Chinese) [Google Scholar]
- Guo, S.; Xu, Y.; Huang, J. Evaluation of agricultural green development level based on entropy weight TOPSIS model: A case study of Henan Province. J. Zhejiang Univ. (Agric. Life Sci.) 2024, 50, 221–230. (In Chinese) [Google Scholar]
- Xu, X.; Hou, L.; Lin, H. Regionalization of China’s agricultural sustainable development based on comparative advantage. Acta Geogr. Sin. 2002, 4, 451–458. (In Chinese) [Google Scholar]
- Leite de Almeida, A.C.; Dale, A.; Hay, R.; Everingham, Y.; Lockie, S. Environmental, social and governance (ESG) in agriculture: Trends and gaps on research. Australas. J. Environ. Manag. 2024, 1–30. [Google Scholar] [CrossRef]
- Huang, H.; Zhang, Z. Statistical measurement of new quality productivity and regional difference analysis. Stat. Decis. Mak. 2025, 41, 28–33. (In Chinese) [Google Scholar]
- Ma, X.; Zhang, S.; Guo, L.; Yang, J. The Influence of Traditional Ethnic Villages on Forest Structure Based on PLS-SEM: A Case Study of Miao Inhabited Area. Forests 2023, 14, 2011. [Google Scholar] [CrossRef]
- Nas, T.F. Cost-Benefit Analysis: Theory and Application; Lexington Books: Lanham, MD, USA, 2016; Available online: https://rowman.com/ISBN/9781498522526/Cost-Benefit-Analysis-Theory-and-Application-2nd-Edition (accessed on 10 January 2025).
- Wang, S.; Yu, S.; Hu, J. Research on the influencing factors of financial support policies for small and micro enterprises in Hunan Province from the perspective of policy process: A comprehensive exploration based on grounded theory, AHP and DEMATEL methods. Enterp. Reform Manag. 2009, 24, 123–125. (In Chinese) [Google Scholar] [CrossRef]
- Zhang, W.; Xi, Z. Application of Delphi method in screening of indexes for measuring soil pollution value evaluation. Environ. Sci. Pollut. Res. 2021, 28, 6561–6571. [Google Scholar] [CrossRef]
- Huang, M.; Chen, J. Analysis of key influencing factors of public health emergency risk perception in urban-rural fringe areas based on ISM and AHP. Saf. Environ. Eng. 2024, 31, 47–53+64. (In Chinese) [Google Scholar] [CrossRef]
- Teeluckdharry, N.B.; Teeroovengadum, V.; Seebaluck, A.K. A roadmap for the application of PLS-SEM and IPMA for effective service quality improvements. TQM J. 2024, 36, 1300–1345. [Google Scholar] [CrossRef]
- Hauff, S.; Richter, N.F.; Sarstedt, M.; Ringle, C.M. Importance and performance in PLS-SEM and NCA: Introducing the combined importance-performance map analysis (cIPMA). J. Retail. Consum. Serv. 2024, 78, 103723. [Google Scholar] [CrossRef]
- Huang, Q.; Sheng, F. New Quality Productivity System: Element Characteristics, Structural Load and Functional Orientation. Reform. 2024, pp. 15–24. (In Chinese). Available online: https://www.scirp.org/reference/referencespapers?referenceid=3835990 (accessed on 14 January 2025).
- Ab Hamid, M.R.; Sami, W.; Sidek, M.H.M. Discriminant Validity Assessment: Use of Fornell & Larcker Criterion Versus HTMT Criterion//Journal of Physics: Conference Series; IOP Publishing: Beijing, China, 2017; Volume 890, p. 012163. [Google Scholar]
- Hair, J.F., Jr.; Hult, G.T.M.; Ringle, C.; Sarstedt, M. A Primer on Partial Least Squares Structural Equation Modeling (PLS-SEM); Sage Publishing: Thousand Oaks, CA, USA, 2016. [Google Scholar]
- Hair, J.F.; Risher, J.J.; Sarstedt, M.; Ringle, C.M. When to use and how to report the results of PLS-SEM. Eur. Bus. Rev. 2019, 31, 2–24. [Google Scholar] [CrossRef]
- Marx, K. Capital: Critique of Political Economy; Princeton University Press: Princeton, NJ, USA, 2024; Volume 1. [Google Scholar]
- O’brien, R.; Williams, M. Global Political Economy: Evolution and Dynamics; Bloomsbury Publishing: London, UK, 2024. [Google Scholar]
- Zhang, L.; Pu, Q. The connotation characteristics, theoretical innovation and value connotation of new quality productivity. J. Chongqing Univ. Soc. Sci. Ed. 2023, 29, 137–148. (In Chinese) [Google Scholar]
- Zhang, H.; Wang, Z. New agricultural productivity: Theoretical connotation, practical foundation and improvement paths. J. Nanjing Agric. Univ. Soc. Sci. Ed. 2024, 24, 28–38. (In Chinese) [Google Scholar]
- Chengjun, S.; Renhua, S.; Zuliang, S.; Yinghao, X.; Jiuchen, W.; Zhiyu, X.; Shangbin, G. Construction process and development trend of ecological agriculture in China. Acta Ecol. Sin. 2022, 42, 624–632. [Google Scholar] [CrossRef]
- Alston, J.M.; Pardey, P.G. Agriculture in the global economy. J. Econ. Perspect. 2014, 28, 121–146. [Google Scholar] [CrossRef]
- Emerick, K.; De Janvry, A.; Sadoulet, E.; Dar, M.H. Technological innovations, downside risk, and the modernization of agriculture. Am. Econ. Rev. 2016, 106, 1537–1561. [Google Scholar] [CrossRef]
- Sethi, L.; Behera, B.; Sethi, N. Do green finance, green technology innovation, and institutional quality help achieve environmental sustainability? Evidence from the developing economies. Sustain. Dev. 2024, 32, 2709–2723. [Google Scholar] [CrossRef]
- Radcliffe, C.; Raman, A.; Parissi, C. Entwining Indigenous Knowledge and Science Knowledge for Sustainable Agricultural Extension: Exploring the Strengths and Challenges. J. Agric. Educ. Ext. 2021, 27, 133–151. [Google Scholar] [CrossRef]
- Yao, Y.; Chen, W.; Li, X. Research on the relationship between environmentally friendly agricultural technology innovation and agricultural economic growth. China Popul. Resour. Environ. 2014, 24, 122–130. (In Chinese) [Google Scholar]
- Salam, A. Internet of Things in Agricultural Innovation and Security//Internet of Things for Sustainable Community Development: Wireless Communications, Sensing, and Systems; Springer International Publishing: Cham, Switzerland, 2024; pp. 71–112. [Google Scholar]
- Zou, B.; Mishra, A.K. Modernizing smallholder agriculture and achieving food security: An exploration in machinery services and labor reallocation in China. Appl. Econ. Perspect. Policy 2024, 46, 1662–1691. [Google Scholar] [CrossRef]
- Chen, W.; Wang, Q.; Li, Q.; Wang, Y.; Zheng, W. Exploring the impact of rural labor transfer on the production and ecological sustainability of crop planting structure in China. Environ. Sci. Pollut. Res. 2023, 30, 22668–22685. [Google Scholar] [CrossRef]
- Padhiary, M.; Kumar, R. Assessing the Environmental Impacts of Agriculture, Industrial Operations, and Mining on Agro-Ecosystems//Smart Internet of Things for Environment and Healthcare; Springer Nature: Cham, Switzerland, 2024; pp. 107–126. [Google Scholar]
- Pachiappan, K.; Anitha, K.; Pitchai, R.; Sangeetha, S.; Satyanarayana, T.V.V.; Boopathi, S. Intelligent Machines, IoT, and AI in Revolutionizing Agriculture for Water Processing//Handbook of Research on AI and ML for Intelligent Machines and Systems; IGI Global: Hershey, PA, USA, 2024; pp. 374–399. [Google Scholar]
- Henseler, J.; Ringle, C.M.; Sinkovics, R.R. The Use of Partial Least Squares Path Modeling in International Marketing//New Challenges to International Marketing; Emerald Group Publishing Limited: Bradford, UK, 2009; pp. 277–319. [Google Scholar]
- Nerlove, M. Essays in Panel Data Econometrics; Cambridge University Press: Cambridge, UK, 2005. [Google Scholar]
- Kline, R.B. Principles and Practice of Structural Equation Modeling; Guilford Publications: New York, NY, USA, 2023. [Google Scholar]
- Angrist, J.D.; Pischke, J.S. Mostly Harmless Econometrics: An Empiricist’s Companion; Princeton University Press: Princeton, NJ, USA, 2009. [Google Scholar]
- Henseler, J.; Ringle, C.M.; Sarstedt, M. A new criterion for assessing discriminant validity in variance-based structural equation modeling. J. Acad. Mark. Sci. 2015, 43, 115–135. [Google Scholar] [CrossRef]
- Hair, J.F.; Sarstedt, M.; Ringle, C.M.; Mena, J.A. An assessment of the use of partial least squares structural equation modeling in marketing research. J. Acad. Mark. Sci. 2012, 40, 414–433. [Google Scholar] [CrossRef]
- Leguina, A. A primer on partial least squares structural equation modeling (PLS-SEM). Int. J. Res. Method Educ. 2015, 38, 220–221. [Google Scholar] [CrossRef]
- Hair, J.F.; Sarstedt, M.; Ringle, C.M. Ringle. Rethinking some of the rethinking of partial least squares. Eur. J. Mark. 2019, 53, 566–584. [Google Scholar] [CrossRef]
- Huete-Alcocer, N.; López-Ruiz, V.-R.; Alfaro-Navarro, J.L.; Nevado-Peña, D. European citizens’ happiness: Key factors and the mediating effect of quality of life, a PLS approach. Mathematics 2022, 10, 367. [Google Scholar] [CrossRef]
- Simon, H.A. Administrative Behavior; Simon and Schuster: New York, NY, USA, 2013. [Google Scholar]
- Hwang, C.L.; Yoon, K.; Hwang, C.L.; Yoon, K. Methods for multiple attribute decision making. Multiple attribute decision making: Methods and applications a state-of-the-art survey. In Multiple Attribute Decision Making; Springer: Berlin/Heidelberg, Germany, 1981; pp. 58–191. [Google Scholar]
- Tzeng, G.H.; Huang, J.J. Multiple Attribute Decision Making: Methods and Applications; CRC Press: Boca Raton, FL, USA, 2011. [Google Scholar]
- Behzadian, M.; Otaghsara, S.K.; Yazdani, M.; Ignatius, J. A state-of the-art survey of TOPSIS applications. Expert Syst. Appl. 2012, 39, 13051–13069. [Google Scholar] [CrossRef]
- Ren, G.P.; Liu, L.M.; Sun, J.; Yuan, C.; Zhuo, D. Multifunction orientation of rural landscape in metropolitan suburbs based on GRA and TOPSIS models. Geogr. Res. 2018, 37, 263–280. (In Chinese) [Google Scholar]
- Zhang, Y. Cultivated Land Safety Evaluation and Obstacle Factor Diagnosis Based on DPSIR-TOPSIS Model. J. Yunnan Agric. Univ. Soc. Sci. 2022, 16, 117–125. (In Chinese) [Google Scholar]
- Song, H.; Lu, B.; Ye, C.; Li, J.; Zhu, Z.; Zheng, L. Fraud vulnerability quantitative assessment of Wuchang rice industrial chain in China based on AHP-EWM and ANN methods. Food Res. Int. 2021, 140, 109805. [Google Scholar] [CrossRef]
- de FSM Russo, R.; Camanho, R. Criteria in AHP: A systematic review of literature. Procedia Comput. Sci. 2015, 55, 1123–1132. [Google Scholar] [CrossRef]
- Alinezhad, A.; Khalili, J. CRITIC Method. In New Methods and Applications in Multiple Attribute Decision Making (MADM); Springer: Cham, Switzerland, 2019; pp. 199–203. [Google Scholar]
- Yan, M.; Zhao, J.; Yan, M. Patterns, Processes, and Differentiation Mechanisms of China’s Transition from Old to New Economic Drivers. J. Geogr. Sci. 2024, 34, 1697–1718. [Google Scholar] [CrossRef]
- Bai, J.; Liu, J.; Chen, W. Analysis of influencing factors of forest ecological security based on structural equation model. Acta Ecol. Sin. 2019, 39, 2842–2850. (In Chinese) [Google Scholar]
- Zhu, Y.; Tian, D.; Yan, F. Effectiveness of entropy weight method in decision-making. Math. Probl. Eng. 2020, 2020, 3564835. [Google Scholar] [CrossRef]
- Harker, P.T.; Vargas, L.G. The theory of ratio scale estimation: Saaty’s analytic hierarchy process. Manag. Sci. 1987, 33, 1383–1403. [Google Scholar] [CrossRef]
- Bellman, R.E.; Zadeh, L.A. Decision-Making in a Fuzzy Environment. Manag. Sci. 1970, 17, B-141–B-164. [Google Scholar] [CrossRef]
- Triantaphyllou, E.; Triantaphyllou, E. Multi-Criteria Decision Making Methods; Springer: New York, NY, USA, 2000. [Google Scholar]
- Dul, J. Necessary Condition Analysis (NCA) Logic and Methodology of “Necessary But Not Sufficient” Causality. Organ. Res. Methods 2016, 19, 10–52. [Google Scholar] [CrossRef]
- Martilla, J.A.; James, J.C. Importance-performance analysis. J. Mark. 1977, 41, 77–79. [Google Scholar] [CrossRef]
- Slack, N. The Importance-Performance Matrix as a Determinant of Improvement Priority. Int. J. Oper. Prod. Manag. 1994, 14, 59–75. [Google Scholar] [CrossRef]
- Kristensen, K.; Martensen, A.; Gronholdt, L. Customer satisfaction measurement at post Denmark: Results of application of the European customer satisfaction index Methodology. Total Qual. Manag. 2000, 11, 1007–1015. [Google Scholar] [CrossRef]
- Wold, R.J.; Hinze, W.J. (Eds.) Geology and Tectonics of the Lake Superior Basin; Geological Society of America: Boulder, CO, USA, 1982. [Google Scholar] [CrossRef]
- Lohmöller, J.B. Latent Variable Path Modeling with Partial Least Squares; Springer Science & Business Media: Berlin/Heidelberg, Germany, 2013. [Google Scholar]
- Dul, J.; Hauff, S.; Bouncken, R.B. Necessary condition analysis (NCA): Review of research topics and guidelines for good practice. Rev. Manag. Sci. 2023, 17, 683–714. [Google Scholar] [CrossRef]
- Dul, J. Conducting Necessary Condition Analysis for Business and Management Students; Sage, London, England. 2019. Available online: https://www.torrossa.com/en/resources/an/5017872# (accessed on 10 January 2025).
- Hair, L.S.; Symmans, F.; Powers, J.M.; Carmel, P. Immunohistochemistry and proliferative activity in Lhermitte-Duclos disease. Acta Neuropathol. 1992, 84, 570–573. [Google Scholar] [CrossRef]
- Fornell, C.; Larcker, D.F. Evaluating Structural Equation Models with Unobservable Variables and Measurement Error. J. Mark. Res. 1981, 18, 39–50. [Google Scholar] [CrossRef]
- O’brien, R.M. A Caution Regarding Rules of Thumb for Variance Inflation Factors. Qual Quant 2007, 41, 673–690. [Google Scholar] [CrossRef]
- Bagozzi, R.; Yi, Y. On the Evaluation of Structural Equation Models. J. Acad. Mark. Sci. 1988, 16, 74–94. [Google Scholar] [CrossRef]
- Benitez, J.; Henseler, J.; Castillo, A.; Schuberth, F. How to perform and report an impactful analysis using partial least squares: Guidelines for confirmatory and explanatory IS research. Inf. Manag. 2020, 57, 103168. [Google Scholar] [CrossRef]
- Sofwan, M.; Habibi, A.; Attar, R.W.; Alqahtani, T.M.; Alahmari, S.A.; Alhazmi, A.H. Factors Affecting Teachers’ Behavior of Innovative Teaching with Technology: Structural Equation Modelling. Sustainability 2024, 16, 8496. [Google Scholar] [CrossRef]
- Liu, Y.; Zhang, Z.; Wang, J. Regional differentiation of agriculture in China and modern agricultural zoning scheme. Acta Geogr. Sin. 2018, 73, 203–218. (In Chinese) [Google Scholar]
- Zhou, Y.; Guo, Y.; Liu, Y. Regional types and regional development paths of rural areas in China. Geogr. Res. 2019, 38, 467–481. (In Chinese) [Google Scholar]
- Fang, Y.; Liu, B.; Liu, J. Regional types and optimization strategies of agricultural multifunctionality: A case study of Jilin Province. Prog. Geogr. 2019, 38, 1349–1360. (In Chinese) [Google Scholar] [CrossRef]


| Variable Name (Code) | Description | Source |
|---|---|---|
| New Quality Agricultural Laborers | ||
| Internet penetration rate (LAB1) | Number of Internet users in a region/regional population | China Statistical Yearbook |
| Education (LAB2) | Average years of education for rural labor force | |
| Labor Productivity (LAB3) | Total output value of agriculture, forestry, animal husbandry, and fishery/number of employees in the primary industry | |
| New Quality Agricultural Labor Inputs | ||
| Agricultural mechanization level (TEC1) | Total power of rural mechanization | China Rural Statistical Yearbook |
| Production environment testing level (TEC2) | Number of environmental and agricultural meteorological observation stations | China Statistical Yearbook |
| Proportion of leisure agriculture demonstration counties (ECO1) | Total number of counties/regions with demonstration of leisure agriculture | |
| Agricultural film usage per unit area (ECO2) | Total power of rural mechanization agricultural plastic film usage (tons)/total sown area of crops (thousand hectares) | China Rural Statistical Yearbook |
| Land productivity (ECO3) | Total agricultural output value/crop sowing area | |
| Rural land transfer rate (ECO4) | The proportion of household contracted land transfer in agricultural land | |
| New Quality Agricultural Production Inputs | ||
| Proportion of agricultural fiscal investment (TM1) | Fiscal expenditure on agriculture, forestry and water resources/fiscal expenditure | China Statistical Yearbook |
| Tangible Agricultural Equipment Resources (TM2) | Number of large and medium-sized agricultural tractors | |
| Electrification level (TM3) | Added value of agriculture, forestry, animal husbandry and fishery/total rural electricity consumption | |
| Number of agricultural technology patents (IM1) | Direct data | CNKI Patent Database |
| Digital Base (IM2) | Number of Taobao Villages | Alibaba Research Institute Report |
| Sustainable Agriculture development | ||
| Agricultural R&D Investment Intensity (SUS1) | Agricultural Research and Development (R&D) funding | China Statistical Yearbook |
| Rural Optical Fiber Deployment Scale (SUS2) | Total length of rural optical fiber lines | |
| Per Capita Rural Consumption Level (SUS3) | Per capita rural household consumption expenditure | China Rural Statistical Yearbook |
| Digital Infrastructure Distribution (SUS4) | Direct data | China Statistical Yearbook |
| Green Investment Level (SUS5) | Environmental pollution control investment/GDP | |
| Agricultural Output Value Standards | ||
| Agricultural Output Value Standards (AgrO) | Total agricultural output value/total rural population | China Statistical Yearbook |
| Terms | Descriptions |
|---|---|
| PLS-SEM Model Section | |
| Outer Loadings | Outer loadings reflect the degree of correlation between observed variables and latent variables and are important indicators for measuring the explanatory power of observed variables within the latent structure. |
| Variance Inflation Factor (VIF) | Variance Inflation Factor (VIF) is a measurement indicator; the larger the VIF value, the more severe the collinearity problem. |
| Cronbach’s Alpha | The closer Cronbach’s Alpha is to 1, the higher the reliability, the lower the measurement error, and the better the stability. |
| Composite Reliability (CR) | CR in PLS-SEM assesses the internal consistency of the measurement model, indicating the reliability of the indicators reflecting the latent variable. CR values are typically expected to be above 0.7. |
| Average Variance Extracted (AVE) | Convergent validity is usually judged through the Average Variance Extracted (AVE) value, which measures the shared variance among the measurement variables within a latent variable. |
| Heterotrait–Monotrait ratio (HTMT) | HTMT is determined by comparing the correlations between different latent variables with the correlations among indicators within the same latent variable. |
| R2 (coefficient of determination) | The R2 (R-square) of the observed model is one of the key indicators for measuring the goodness of fit of the model. |
| Variance Accounted For (VAF) | VAF measures the mediation effect size, showing the proportion of the total effect of the independent variable on the dependent variable, as explained by the mediator. A higher VAF indicates a stronger mediation effect. |
| cIPMA Model section | |
| Conditional Efficiency Free Disposable Hull model (CE-FDH) | A model that incorporates conditional variables to assess efficiency while accounting for external factors. |
| Conditional Robust Free Disposable Hull (CR-FDH) | An extension of CE-FDH that improves robustness against data noise and uncertainty. |
| Bottleneck table | A tool to identify bottlenecks in production and optimize efficiency. |
| Code | Outer Loadings | VIF | Cronbach’s Alpha | CR | AVE |
|---|---|---|---|---|---|
| LAB1 | 0.909 | 2.354 | 0.789 | 0.877 | 0.706 |
| LAB2 | 0.707 | 1.350 | |||
| LAB3 | 0.889 | 2.184 | |||
| TEC1 | 0.675 | 1.242 | 0.613 | 0.811 | 0.689 |
| TEC2 | 0.960 | 1.242 | |||
| ECO1 | 0.854 | 2.180 | 0.823 | 0.881 | 0.650 |
| ECO2 | 0.752 | 1.832 | |||
| ECO3 | 0.833 | 1.952 | |||
| ECO4 | 0.783 | 2.005 | |||
| TM1 | 0.834 | 1.771 | 0.679 | 0.823 | 0.608 |
| TM2 | 0.737 | 1.187 | |||
| TM3 | 0.766 | 1.580 | |||
| IM1 | 0.931 | 1.885 | 0.813 | 0.914 | 0.842 |
| IM2 | 0.904 | 1.885 | |||
| SUS1 | 0.876 | 2.500 | 0.818 | 0.873 | 0.582 |
| SUS2 | 0.702 | 1.865 | |||
| SUS3 | 0.864 | 2.535 | |||
| SUS4 | 0.710 | 2.277 | |||
| SUS5 | 0.631 | 1.445 |
| AgrO | ECO | IM | LAB | SUS | TEC | |
|---|---|---|---|---|---|---|
| AgrO | ||||||
| ECO | 0.163 | |||||
| IM | 0.109 | 0.319 | ||||
| LAB | 0.357 | 0.851 | 0.516 | |||
| SUS | 0.207 | 0.680 | 0.872 | 0.895 | ||
| TEC | 0.421 | 0.341 | 0.518 | 0.305 | 0.498 | |
| TM | 0.624 | 0.527 | 0.428 | 0.526 | 0.740 | 0.494 |
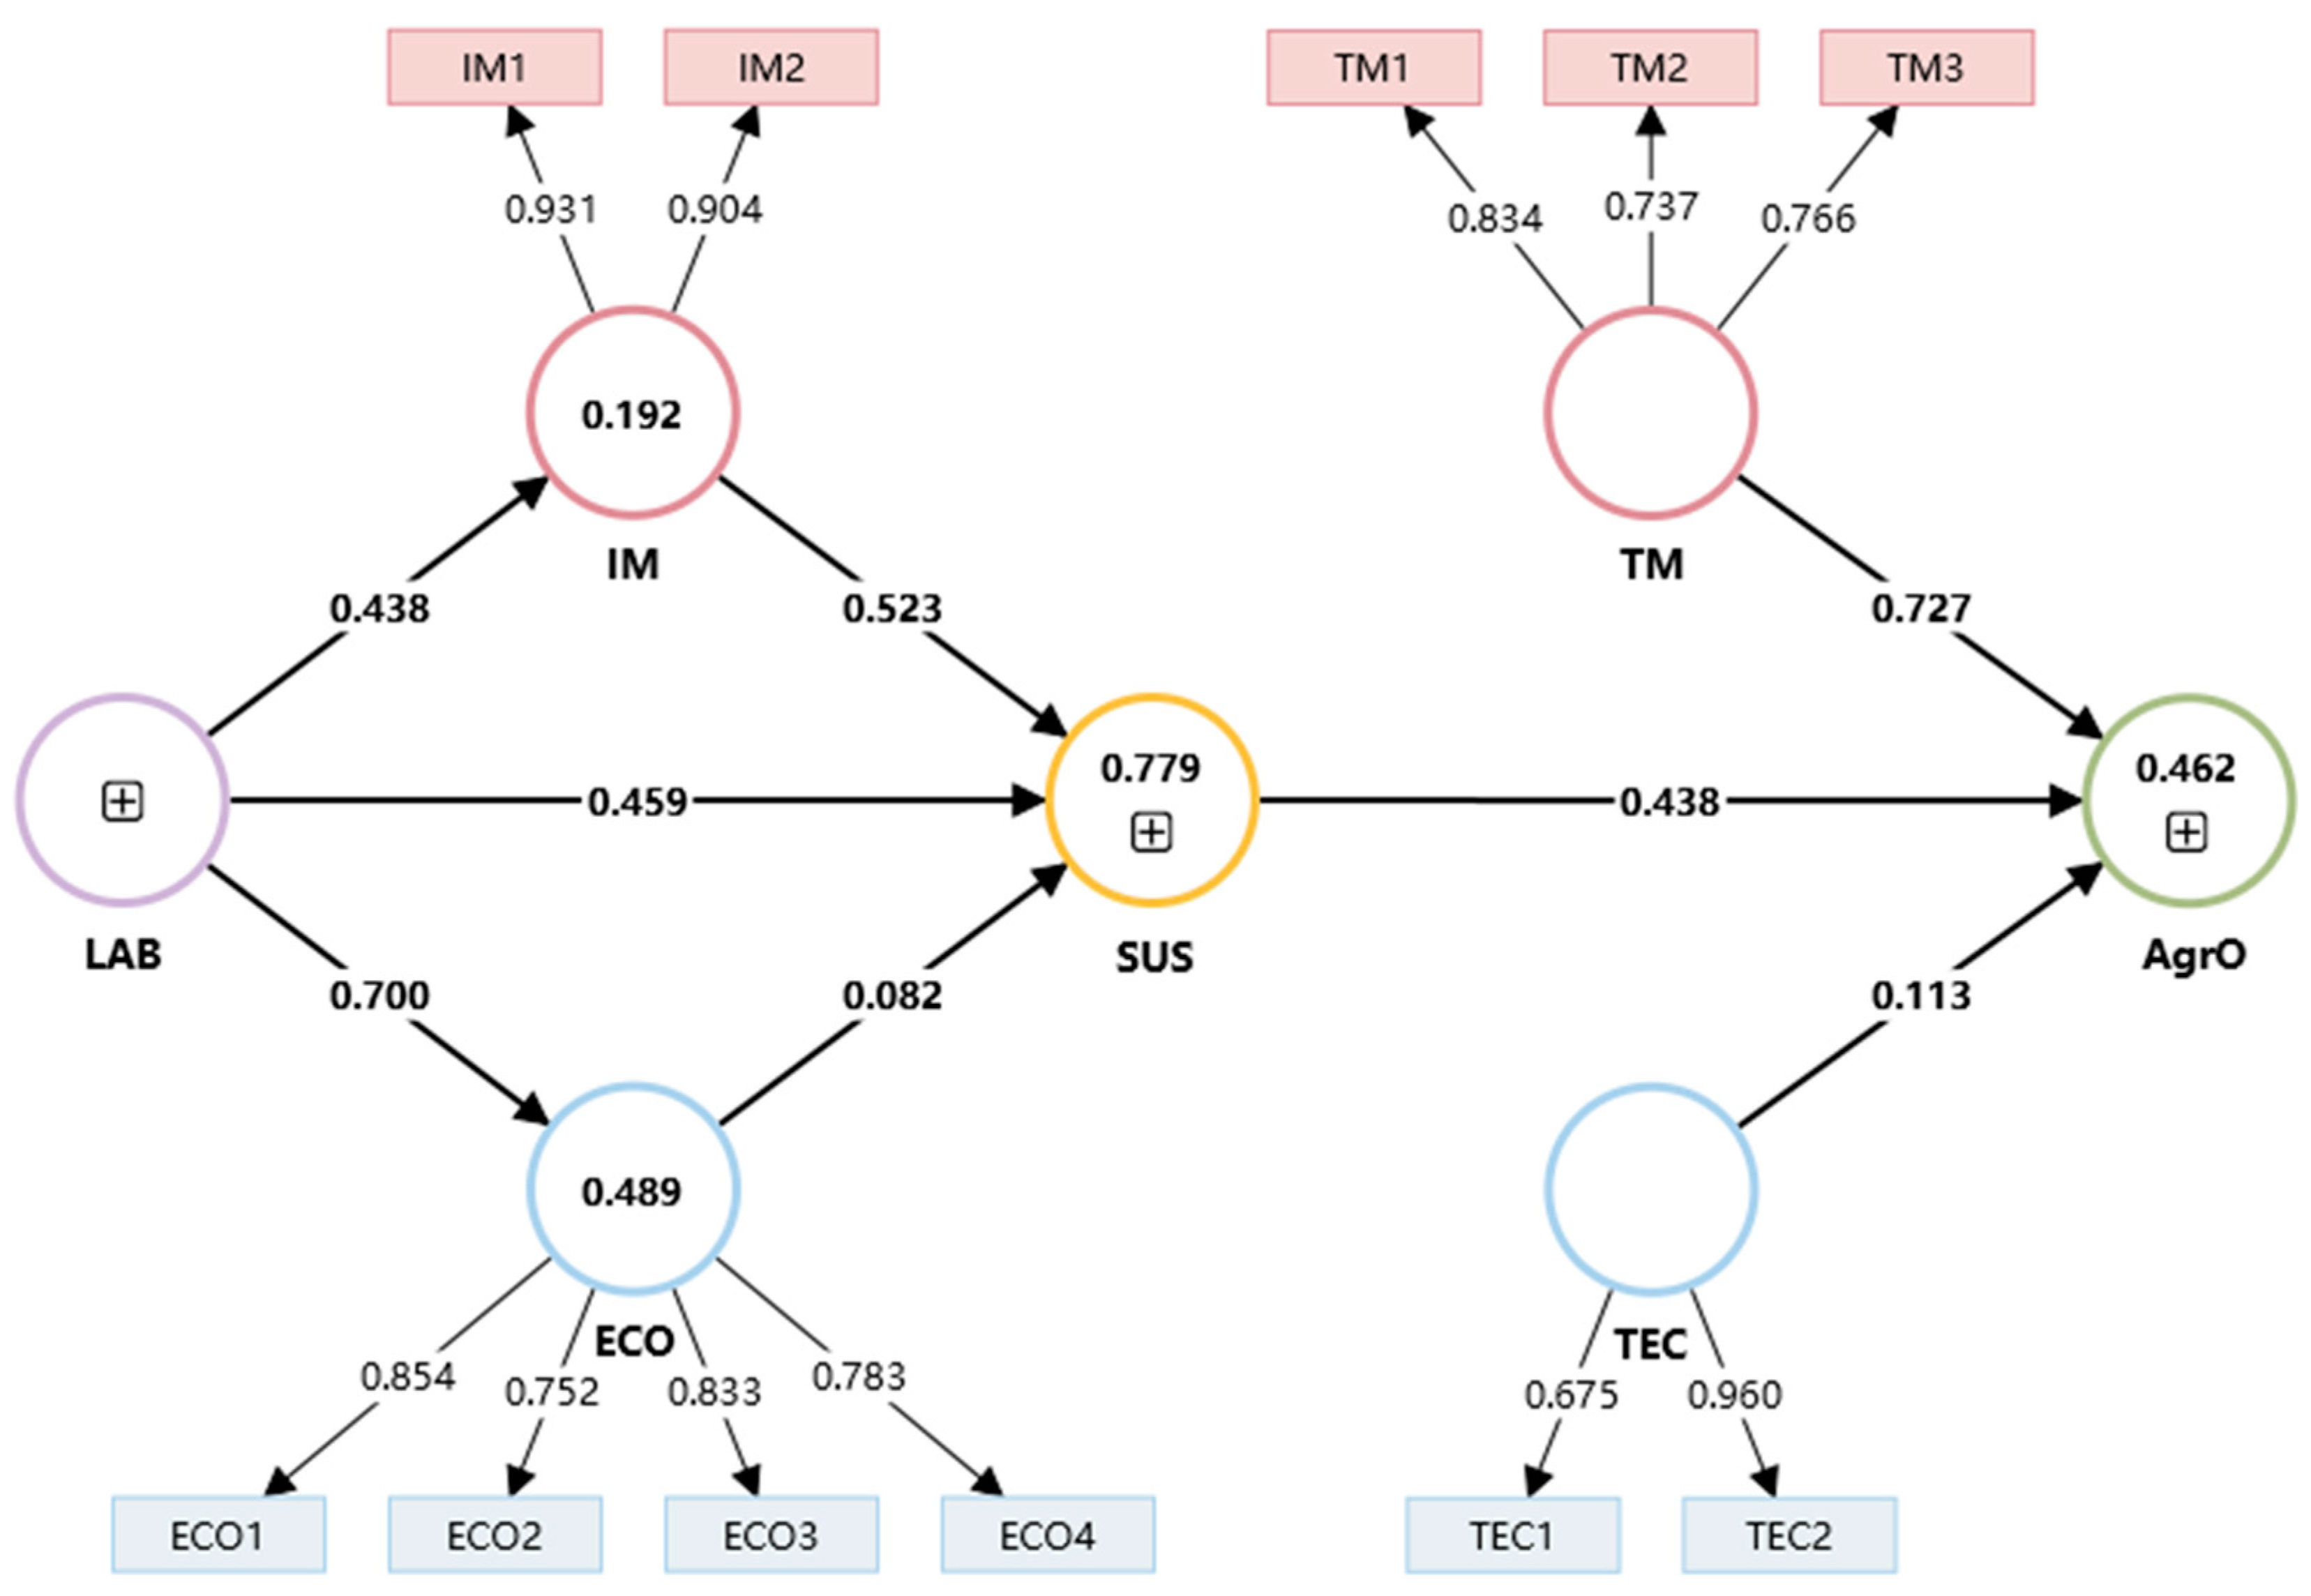
| Latent Variables | R-Squared | R-Squared Adjusted |
|---|---|---|
| Agricultural Ecology (ECO) | 0.489 | 0.488 |
| Agricultural Output Value Standards (AgrO) | 0.462 | 0.456 |
| Intangible Materials (IM) | 0.192 | 0.189 |
| Sustainable Agricultural Development (SUS) | 0.779 | 0.777 |
| Hypothesis | Path | Path Coefficients | T-Value | p-Value | Confidence Level | Hypothetical Results |
|---|---|---|---|---|---|---|
| H1a | Agricultural Ecology → SUS | 0.082 * | 2.488 | 0.013 | 98.70% | Supported |
| H1b | Agricultural Technology → AgrO | 0.113 ** | 2.818 | 0.005 | 99.50% | Supported |
| H2a | Intangible Materials → SUS | 0.523 *** | 14.268 | 0.000 | 99.99% | Supported |
| H2b | Tangible Materials → AgrO | 0.727 *** | 15.952 | 0.000 | 99.99% | Supported |
| H3a | New Quality Agricultural Laborers → SUS | 0.459 *** | 11.205 | 0.000 | 99.99% | Supported |
| H3b | New Quality Agricultural Laborers → ECO | 0.700 *** | 35.015 | 0.000 | 99.99% | Supported |
| H3c | New Quality Agricultural Laborers → IM | 0.438 *** | 10.306 | 0.000 | 99.99% | Supported |
| H4a | Sustainable Agricultural Development → AgrO | 0.438 *** | 9.650 | 0.000 | 99.99% | Supported |
| Independent Variable | Mediating Variable | Dependent Variable | Direct Effect | Indirect Effect | Total Effect | VAF |
|---|---|---|---|---|---|---|
| LAB | ECO | SUS | 0.459 ** | 0.057 | 0.516 ** | 11.12% |
| LAB | IM | SUS | 0.459 ** | 0.229 ** | 0.688 ** | 33.28% |
| Indicators | Regions | 2012 | 2013 | 2014 | 2015 | 2016 | 2017 | 2018 | 2019 | 2020 | 2021 |
|---|---|---|---|---|---|---|---|---|---|---|---|
| Production Regions | 4.1806 | 4.3655 | 4.5664 | 5.1263 | 5.0789 | 5.3743 | 5.3845 | 5.1828 | 4.9689 | 5.0885 | |
| NQL | Balanced Regions | 1.7963 | 1.8842 | 1.8474 | 2.2149 | 2.4304 | 2.6068 | 2.7123 | 2.6112 | 2.5719 | 2.5777 |
| Consumption Regions | 4.0543 | 4.1584 | 4.5211 | 4.9415 | 5.0530 | 5.1726 | 5.1677 | 4.8460 | 4.4801 | 4.5821 | |
| Production Regions | 4.3326 | 4.4456 | 4.0664 | 3.9715 | 3.7710 | 3.6087 | 3.2181 | 3.0285 | 3.1512 | 3.3388 | |
| NQLI | Balanced Regions | 2.3490 | 2.5018 | 2.1976 | 2.1574 | 2.2223 | 2.1304 | 1.8105 | 1.6387 | 1.6970 | 1.8118 |
| Consumption Regions | 2.8284 | 2.7262 | 2.6199 | 2.5442 | 2.6028 | 2.5014 | 2.3463 | 2.3447 | 2.4126 | 2.4492 | |
| Production Regions | 4.0199 | 3.9462 | 3.5825 | 3.4975 | 3.3805 | 3.4542 | 3.6299 | 3.6038 | 3.7436 | 3.7508 | |
| NQPI | Balanced Regions | 2.1530 | 2.0789 | 1.8400 | 1.8797 | 1.8765 | 1.9180 | 1.9395 | 1.9424 | 1.9912 | 1.9791 |
| Consumption Regions | 1.8011 | 1.7637 | 1.8719 | 1.7594 | 1.7264 | 1.7717 | 1.8103 | 1.7990 | 1.8593 | 1.8637 |
| Regions | Provinces |
|---|---|
| Consumption regions | Beijing, Tianjin, Shanghai, Zhejiang, Fujian, Guangdong, and Hainan |
| Balanced regions | Shanxi, Guangxi, Chongqing, Guizhou, Yunnan, Tibet, Shaanxi, Gansu, Qinghai, Ningxia, and Xinjiang |
| Production regions | Hebei, Inner Mongolia, Liaoning, Jilin, Heilongjiang, Jiangsu, Anhui, Jiangxi, Shandong, Henan, Hunan, Hubei, and Sichuan |
| SUS | NQL | NQLI | NQPI | |
|---|---|---|---|---|
| 0% | 0.000 | NN | NN | NN |
| 5% | 5.000 | NN | 2.1980 | NN |
| 10% | 10.000 | NN | 2.1980 | NN |
| 15% | 15.000 | NN | 15.409 | NN |
| 20% | 20.000 | 12.819 | 15.409 | NN |
| 25% | 25.000 | 12.819 | 15.409 | NN |
| 30% | 30.000 | 12.819 | 15.409 | NN |
| 35% | 35.000 | 26.307 | 16.101 | 17.446 |
| 40% | 40.000 | 26.307 | 17.764 | 17.446 |
| 45% | 45.000 | 26.307 | 17.764 | 17.446 |
| 50% | 50.000 | 43.666 | 38.104 | 23.460 |
| 55% | 55.000 | 43.666 | 38.104 | 23.460 |
| 60% | 60.000 | 60.441 | 38.104 | 34.043 |
| 65% | 65.000 | 60.441 | 38.104 | 34.043 |
| 70% | 70.000 | 60.441 | 38.104 | 34.043 |
| 75% | 75.000 | 60.441 | 38.104 | 34.043 |
| 80% | 80.000 | 69.782 | 69.395 | 34.043 |
| 85% | 85.000 | 69.782 | 69.395 | 34.043 |
| 90% | 90.000 | 69.782 | 69.395 | 34.043 |
| 95% | 95.000 | 69.782 | 69.395 | 34.043 |
| 100% | 100.000 | 69.782 | 69.395 | 34.043 |
| Antecedent Construct | Importance | Performance | Percentage of Cases That Do Not Meet the Necessity Condition 1 | Necessity Effect Size d (p Value) |
|---|---|---|---|---|
| NQL | 0.523 | 19.502 | 76.667 | 0.378(0.016 **) |
| NQLI | 0.746 | 44.153 | 83.333 | 0.329(0.014 **) |
| NQPI | 0.082 | 34.56 | 56.667 | 0.191(0.143) |
Disclaimer/Publisher’s Note: The statements, opinions and data contained in all publications are solely those of the individual author(s) and contributor(s) and not of MDPI and/or the editor(s). MDPI and/or the editor(s) disclaim responsibility for any injury to people or property resulting from any ideas, methods, instructions or products referred to in the content. |
© 2025 by the authors. Licensee MDPI, Basel, Switzerland. This article is an open access article distributed under the terms and conditions of the Creative Commons Attribution (CC BY) license (https://creativecommons.org/licenses/by/4.0/).
Share and Cite
Qin, Z.; Wang, J.; Wang, Y.; Liu, L.; Zhou, J.; Fu, X. Assessing the Impacts of New Quality Productivity on Sustainable Agriculture: Structural Mechanisms and Optimization Strategies—Empirical Evidence from China. Sustainability 2025, 17, 2662. https://doi.org/10.3390/su17062662
Qin Z, Wang J, Wang Y, Liu L, Zhou J, Fu X. Assessing the Impacts of New Quality Productivity on Sustainable Agriculture: Structural Mechanisms and Optimization Strategies—Empirical Evidence from China. Sustainability. 2025; 17(6):2662. https://doi.org/10.3390/su17062662
Chicago/Turabian StyleQin, Ziyu, Jia Wang, Yunhan Wang, Lihao Liu, Junye Zhou, and Xinyu Fu. 2025. "Assessing the Impacts of New Quality Productivity on Sustainable Agriculture: Structural Mechanisms and Optimization Strategies—Empirical Evidence from China" Sustainability 17, no. 6: 2662. https://doi.org/10.3390/su17062662
APA StyleQin, Z., Wang, J., Wang, Y., Liu, L., Zhou, J., & Fu, X. (2025). Assessing the Impacts of New Quality Productivity on Sustainable Agriculture: Structural Mechanisms and Optimization Strategies—Empirical Evidence from China. Sustainability, 17(6), 2662. https://doi.org/10.3390/su17062662