Article

Climate Change Drives the Adaptive Distribution of Arundinella setosa in China

1
Research Center for Engineering Ecology and Nonlinear Science, North China Electric Power University, Beijing 102206, China
2
Theoretical Ecology and Engineering Ecology Research Group, School of Life Sciences, Shandong University, Qingdao 250100, China
3
Department of Biology, Vrije Universiteit Brussel, Pleinlaan 2, 1050 Brussels, Belgium
*
Author to whom correspondence should be addressed.
Sustainability 2025, 17(6), 2664; https://doi.org/10.3390/su17062664
Submission received: 10 February 2025 / Revised: 3 March 2025 / Accepted: 14 March 2025 / Published: 17 March 2025
(This article belongs to the Section Sustainability, Biodiversity and Conservation)

Abstract

:
Arundinella setosa Trin. is a widely distributed species in tropical and subtropical regions, and global climate change has an important impact on its adaptive distribution pattern. In this paper, we predicted the distribution of A. setosa in four climate scenarios (SSP1-2.6, SSP2-4.5, SSP3-7.0 and SSP5-8.5) based on the adaptive distribution of the species and the optimized MaxEnt model under the current and future conditions. The results showed that the center of gravity of the adaptive distribution of A. setosa is located in Shaoyang City, Hunan Province, and the adaptive distribution is mainly located south of the Yangtze River, with the high, medium and low adaptive distribution areas accounting for 1%, 1.67% and 4.47% of the total land area of the country, respectively; the highly adaptive distribution of A. setosa is located in Yunnan Province and Jiangxi Province. Precipitation is the most significant factor affecting its distribution, followed by temperature, including Precipitation of Driest Quarter, Isothermality, Precipitation Seasonality, Min Temperature of Coldest Month, etc. In the future scenario, the center of gravity of the adaptive distribution for A. setosa shows a significant tendency to migrate northward. The total area of the adaptive distribution showed an overall expansion; however, the area of the adaptive distribution slightly contracted in the SSP5-8.5 (2050s), SSP1-2.6 (2070s) and SSP3-7.0 (2090s) scenarios. This study provides theoretical guidance and data support for ecosystem restoration and biodiversity conservation.

1. Introduction

Climate change has had a profound impact on the distribution patterns of plant species [1,2] and is a major cause of the decline and loss of plant species populations [3]. Increased temperatures may lead to the migration of certain vegetation species to higher altitudes and latitudes [4,5,6]; changes in precipitation patterns may alter plant physiological processes, affecting the growth, development, reproduction, stability and geographical distribution of plants [7,8,9]; extreme climatic events, such as frequent droughts, may significantly reduce the area covered by vegetation, affecting its survival and ecological function [10,11], and may also promote the spread of certain invasive species [12,13,14], posing a threat to native plant species [10]. Tropical vegetation is of particularly great concern because of its climate sensitivity [15].
A. setosa is mainly distributed in the southern region of China and is an important tropical and subtropical species. It has good pasture value and also plays an important role in wind and sand control, as well as soil and water conservation. Supriya et al., in their study in northeastern India, found that A. setosa occupies an important constituent of aboveground biomass, especially the largest biomass among the herbaceous plants [16]. Umair et al., on the other hand, explored the response of A. setosa to increased precipitation in the ecosystems of southwestern China and found that its leaf metabolite content increased significantly under high-precipitation conditions, with potassium playing a key role [17]. Currently, research on A. setosa mainly focuses on the response mechanism or species stability under the influence of a single environmental variable, leaf nutrient elements, etc., and research on its adaptive distribution in combination with a variety of environmental variables is still relatively scarce, which has become an important problem to be solved [18].
In recent years, Species Distribution Models (SDMs) have become important tools for studying species distribution patterns by combining known species data and corresponding environmental variables to simulate the geographical distribution of species and climate change responses based on certain algorithms [19,20]. Among them, the application of the MaxEnt model in ecological research has demonstrated its unique advantages in handling complex environmental variables and small quantities of species distribution data [21], and it has been widely used for its efficient and accurate prediction ability, with numerous scholars having already used the MaxEnt model to predict the adaptive distribution of vegetation under climate change [22,23]. Most previous studies have run the MaxEnt model with default parameters, leading to overfitting and sampling bias, and this error can be greatly reduced by optimizing the model parameters through the R package ENMeval, which matches and analyzes data with environmental variables and species distributions and retains valid distribution data in similar ecological niches [24].
Based on the spatial distribution data of the species and environmental variables such as climate, soil, and topography, this paper integrates the migration of the center of mass as well as the shrinkage and expansion of the adaptive distribution of A. setosa under different future scenarios through the MaxEnt model. The objectives of this study are to (1) analyze the main environmental variables affecting the distribution of A. setosa, (2) investigate the changes in the adaptive distribution of A. setosa suitability in different climatic scenarios and (3) clarify the migration trend of A. setosa adaptive distribution driven by global climate change. The results of this study will provide important scientific support for ecosystem restoration and resource management within the range of the plant’s habitat.

2. Materials and Methods

2.1. Data Screening and Processing

A. setosa is a perennial herbaceous plant belonging to the family Poaceae, subfamily Panicoideae, and tribe Arundinelleae, classified within the PACMAD clade of grasses. The plant typically grows to a height of 30–100 cm, with erect or basally inclined stems and linear leaves measuring 10–30 cm in length, featuring rough margins. This species is a C4 photosynthetic plant, which exhibits high photosynthetic efficiency under high-temperature and high-light conditions, making it well adapted to such environments. It demonstrates strong drought tolerance and resilience to poor soils. A. setosa is widely distributed across tropical and subtropical regions in Asia, commonly found in open habitats such as grasslands, slopes and roadsides, and prefers well-drained sandy or loamy soils. The distribution data for A. setosa were mainly obtained from the Vegetation Atlas of China 1:1,000,000, published by the Science Press in 2001 (http://www.resdc.cn, accessed on 5 May 2024). In order to prevent overfitting caused by dense sample distribution, ArcGIS SDM Toolbox software was used to eliminate the points with spatial autocorrelation [24], and at the same time, only one valid point was retained in each 5 km grid to ensure modeling accuracy. Finally, 307 sample points were retained (Figure 1), and the latitude and longitude coordinates were extracted from these samples and saved in CSV format for the model to be run.
Thirty-six environmental variables were used in this paper, including climate variables, elevation variables, and soil variables. Climate variables (19 bioclimatic variables) and elevation variables (Elevation) were downloaded from the WorldClim Database (WorldClim, https://www.worldclim.org, accessed on 5 May 2024), both with a spatial resolution of 5 km × 5 km. The 16 soil variables were downloaded from the Harmonized World soil Database (HWSD V1.2, https://www.fao.org, accessed on 5 May 2024), with a spatial resolution of 1 km × 1 km. The future climate variables were derived from the sixth Coupled Model Intercomparison Project (CMIP6) of the Beijing Climate Center System Model (BCC-CSM) and four shared socio-economic pathways (SSP1-2.6, SSP2-4.5, SSP3-7.0 and SSP5-8.5); the BCC-CSM selected for future climate factors was found to be superior to the others, and the BCC-CSM is often used exclusively by Chinese researchers to assess the distribution of vegetation, with the SSP126 and SSP585 reflecting the most optimistic and the most pessimistic scenarios of future GHG emissions, respectively [25]. Three periods were analyzed under these future scenario models: 2041–2060, 2061–2080 and 2081–2100.
All environmental variables were mask-extracted, cropped, resampled and projected by using ArcGIS 10.8 software, and the spatial resolution was uniformly adjusted to 5 km for subsequent research analysis. Due to a combination of factors in the Chinese regions, including the resilience of local ecosystems, the diversity of soil types and the mitigating effects of human interventions such as soil conservation practices and afforestation programs, we assumed that the topographic and soil variables remained constant, as climate change scenarios are not expected to have a significant impact on these factors [26].

2.2. Identification of Driving Variables

In order to avoid the inclusion of unimportant variables in the model, we take the lead in screening the contribution of variables. Meanwhile, multicollinearity among variables can lead to the overfitting of the Species Distribution Model and affect model accuracy. In this paper, we used correlation analysis to remove covariance among environmental variables in order to avoid the problem of multicollinearity among environmental variables. Firstly, 36 environmental variables and species distribution data were included in the MaxEnt model for the first time and run, and the environmental variables with contribution rate less than 0.5% were removed; the remaining environmental variables were analyzed by Pearson correlation analysis by using the “ENMTools” package in R [27]. The correlation coefficients between the two environmental variables were analyzed by correlation analysis if the absolute correlation coefficient between the two variables was less than 0.5%. If the environmental variables had a correlation coefficient with an absolute value greater than 0.85, then the environmental variables with a smaller contribution were excluded. Nine environmental factors were identified for modeling (Table 1).

2.3. Optimization of Application of MaxEnt Model

Feature combination (FC) and Regularization Multiplier (RM) are two key parameters of MaxEnt, where FC has five options, namely, Linear (L), Quadratic (Q), Product (P), Threshold (T) and Hinge (H), and the default parameters of MaxEnt 3.4.4 version software are RM = 1 and FC = LQHPT [28]. In this paper, we use the optimized MaxEnt model; set the RM between 0.5 and 4, increasing by 0.5 each time; and select the feature combinations of L, LQ, H, LQH, LQHP and LQHPT, so that combined with the 9 values of the RM, a total of 54 parameter combinations are obtained, and the 54 parameter combinations are input into ENMeval for comprehensive detection [29]. The complexity and degree of fit of the model were tested according to deltaAICc (Akaike information criterion, corrected), where the model with the smallest deltaAICc value (deltaAICc = 0) was taken as the optimal model. The above process is optimized by using the ENMeval language package in R.
We imported the species distribution data and 9 environmental factors into the optimal MaxEnt model (FC = LQH and RM = 1), selected the options of “Create response curves” and “Do jackknife”, set the replication run type to Bootstrap, and selected 75% of the species distribution data for the validation subset, with the other 25% for the test subset. The maximum number of iterations was set to 1000 and was repeated 10 times, and response curves were plotted to analyze the range of environmental variables. The prediction accuracy of the MaxEnt model was judged by the area under the curve (AUC) of the subjects’ work characteristics (ROC), which was categorized into the following five categories according to the natural discontinuity classification method: AUC < 0.6 (unqualified), 0.6 ≤ AUC < 0.7 (poor), 0.7 ≤ AUC < 0.8 (fair), 0.8 ≤ AUC < 0.9 (good) and AUC ≥ 0.9 (accurate). When the AUC is less than 0.75 [30], the model is generally considered unstable [31].

2.4. Classification of Adaptive Distribution and Calculation of Centroid Migration

The ASC file output from MaxEnt was imported into ArcGIS and converted into grid data. On this basis, the reclassification function of ArcGIS was utilized to classify different areas according to the suitability index, and the grid calculation tool was used to calculate the corresponding areas. In this study, the suitable areas were categorized into four classes based on the suitability index p: highly adaptive distribution (p ≥ 0.6), moderately adaptive distribution (0.4 ≤ p < 0.6), lowly adaptive distribution (0.2 ≤ p < 0.4) and unadaptive distribution (p < 0.2) [32].
The geometric center of gravity of the adaptive distribution is the distribution center of the adaptive distribution, and the location of the distribution center represents the overall spatial location of its adaptive distribution [33]. Under the assumption of migratory ability and ignoring natural factors such as interspecific interactions [32], we calculated the centers of mass of the adaptive distribution in different climatic scenarios in different eras by using the partitioning geometric statistics tool in ArcGIS and generated a vector file with the direction and size of changes in the centers of mass of the adaptive distribution in the neighboring periods, in order to express the trends of the centers of mass’s migration and their distance [34].

3. Results

3.1. Adaptive Distribution and Driving Factors

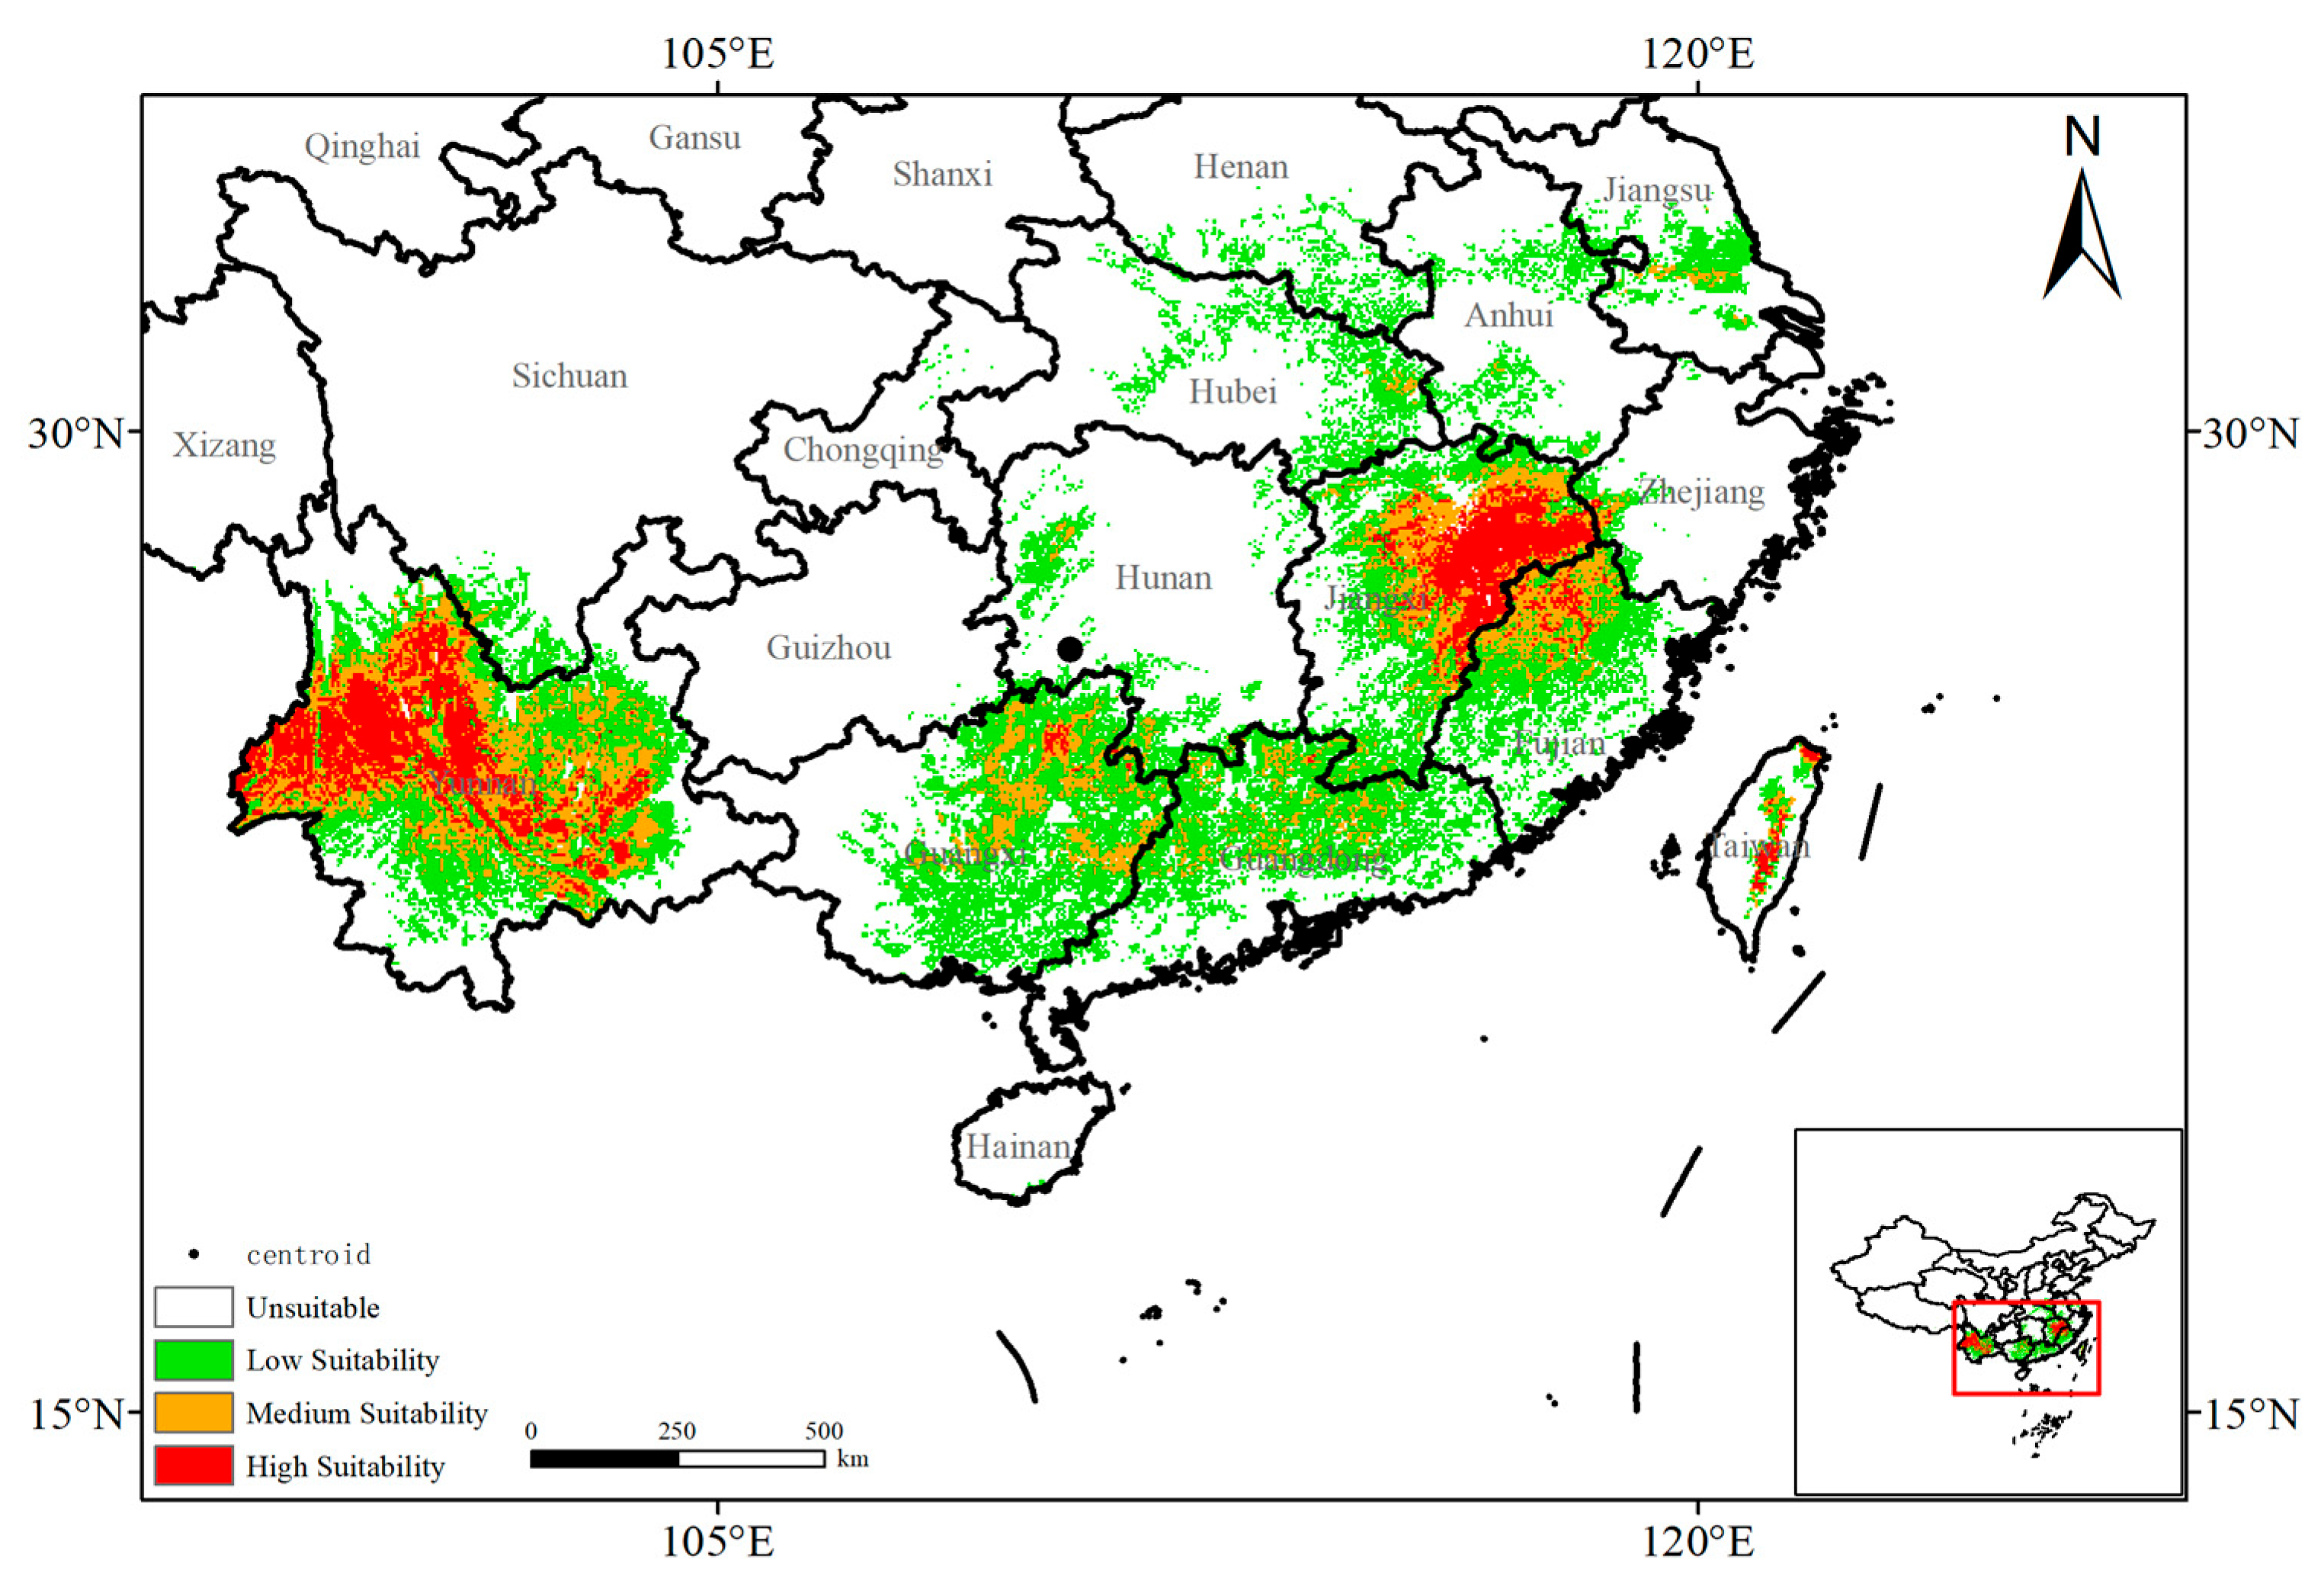
Currently, the adaptive distribution of A. setosa is mainly distributed in the southwest and central–southern regions of China, and at present, the center of adaptive distribution is located in Shaoyang City, Hunan Province, with the area of adaptive distribution accounting for 7.14% of the total national land area (Figure 2). Highly adaptive distribution regions are mainly concentrated in the central and western parts of Yunnan Province and the eastern part of Jiangxi Province, located on both sides of Wuyi Mountain and in the northern part of the Mourning Mountains, with the area of highly adaptive distribution accounting for 13.97% of the total area of the adaptive distribution; moderately adaptive distribution regions are mainly concentrated in the eastern part of China’s Yunnan Province and the northern part of Fujian Province, with small areas in Guangxi and Guangdong Provinces, and accounting for 23.36% of the adaptive distribution’s total area. The low-fitness zone is mainly distributed in the southern coastal provinces and cities, as well as Hunan, Hubei, Henan and Anhui provinces and cities, with the lowly adaptive distribution accounting for 62.67% of the total area of the adaptive distribution (Figure 2).
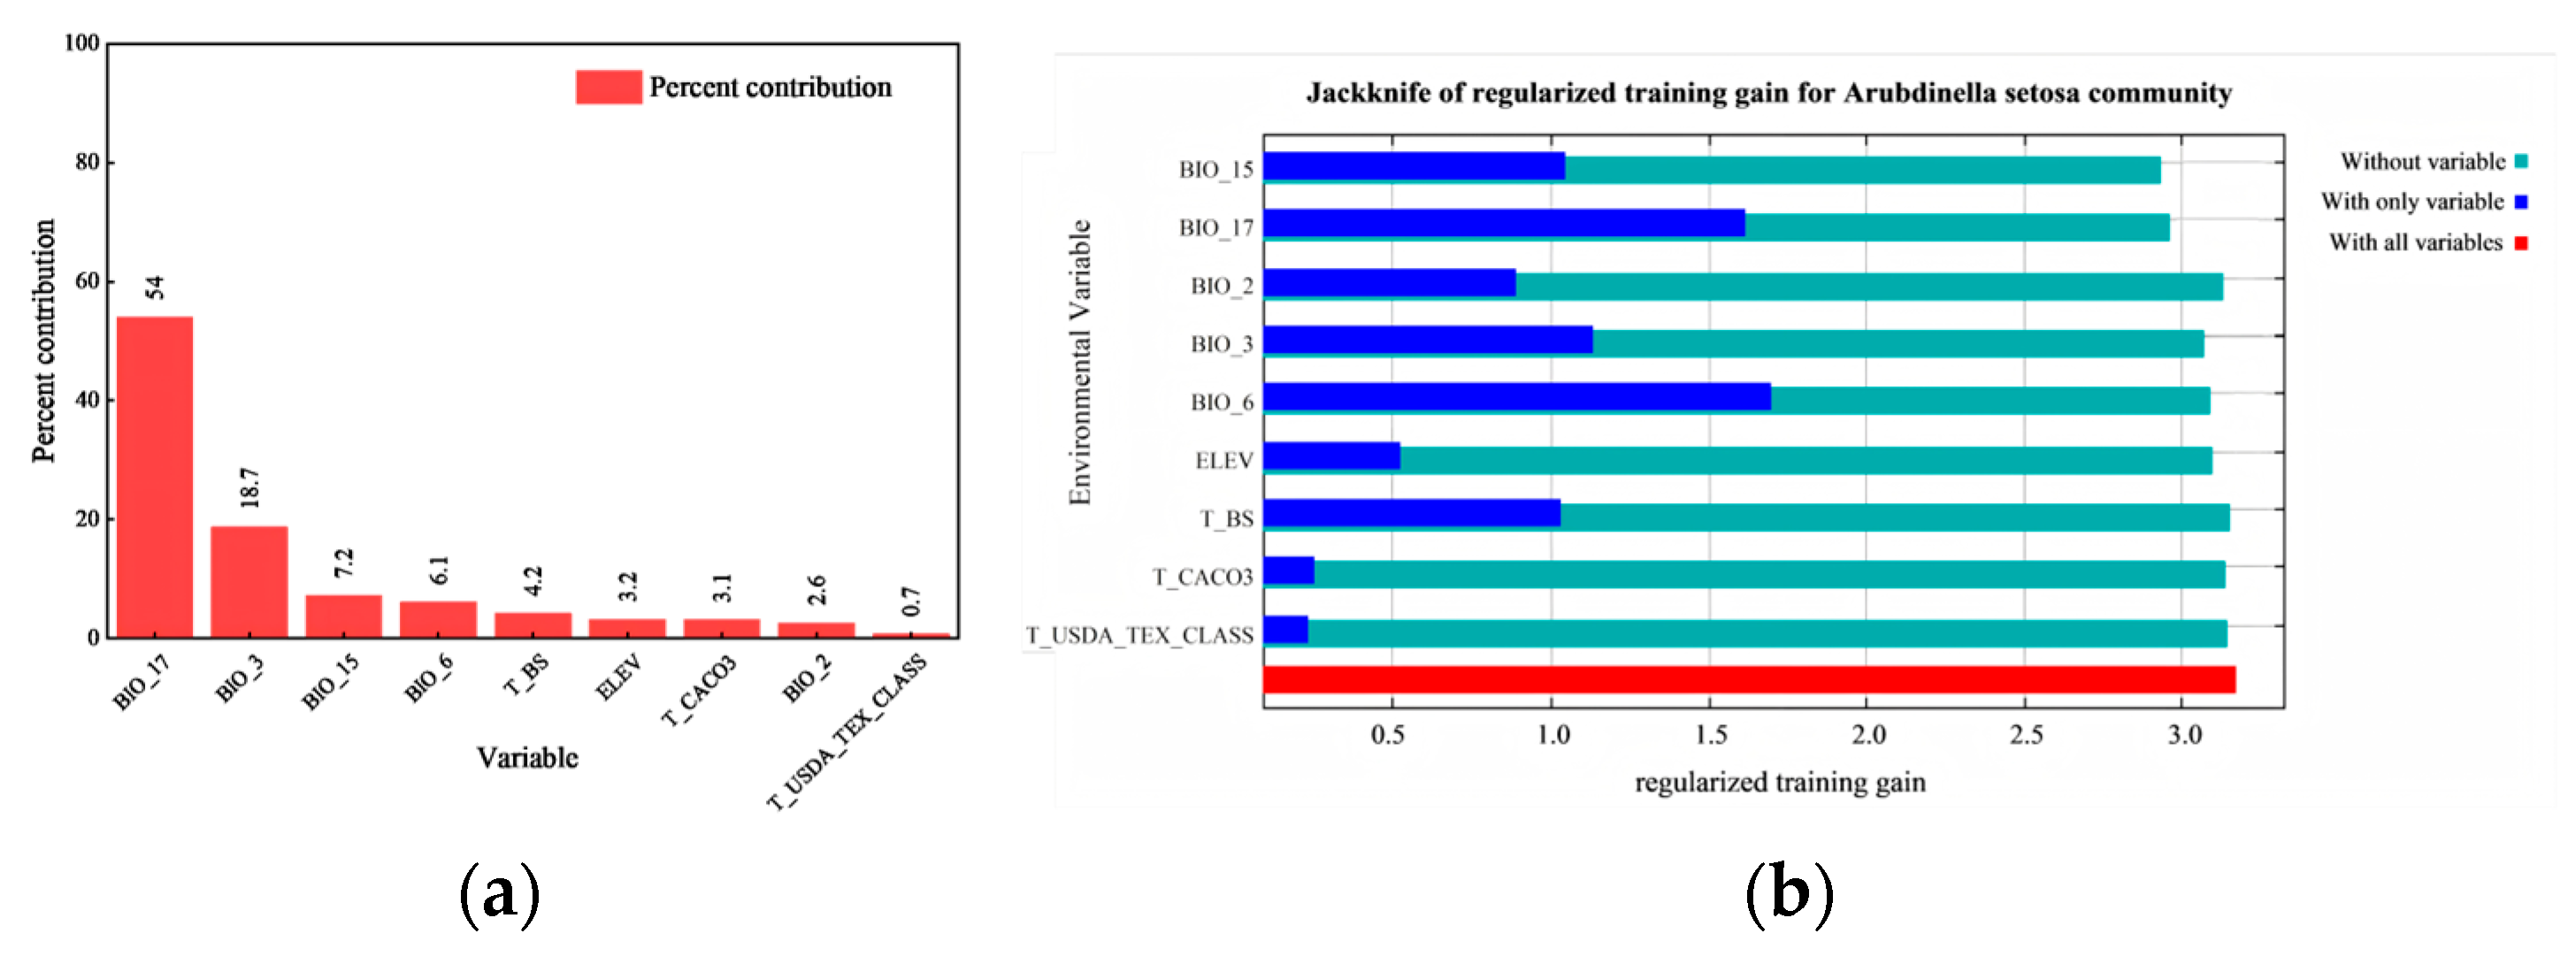
Climate was the main driver influencing the distribution of A. setosa, with the contributions of Precipitation of Driest Quarter (BIO17) at 54.0%, Isothermality (BIO3) at 18.7%, Precipitation Seasonality (BIO15) at 7.2%, Min Temperature of Coldest Month (BIO6) at 6.1% and Mean Temperature Diurnal Range (BIO2) at 2.6% and the cumulative contribution of the five climate factors at 88.6% (Figure 3). The cumulative contribution of precipitation-related factors among the five climate factors was 61.2%, which was much higher than that of temperature-related factors (27.4%), which demonstrates that the response of A. setosa was more sensitive to precipitation than to temperature. The jackknife test for a single environmental variable showed that Min Temperature of Coldest Month (BIO6) ranked the highest in terms of regularization training gain, followed by Precipitation of Driest Quarter (BIO17), Isothermality (BIO3) and Precipitation Seasonality (BIO15). The combined jackknife test and contribution rate analysis showed that Precipitation of Driest Quarter (BIO17), Isothermality (BIO3), seasonal Precipitation Seasonality (BIO15) and Min Temperature of Coldest Month (BIO6) were the main environmental factors affecting the distribution of A. setosa (Figure 3). Soil and topography were less influential, with a total contribution of 8.0% from the soil factor and 3.2% from the topography factor.
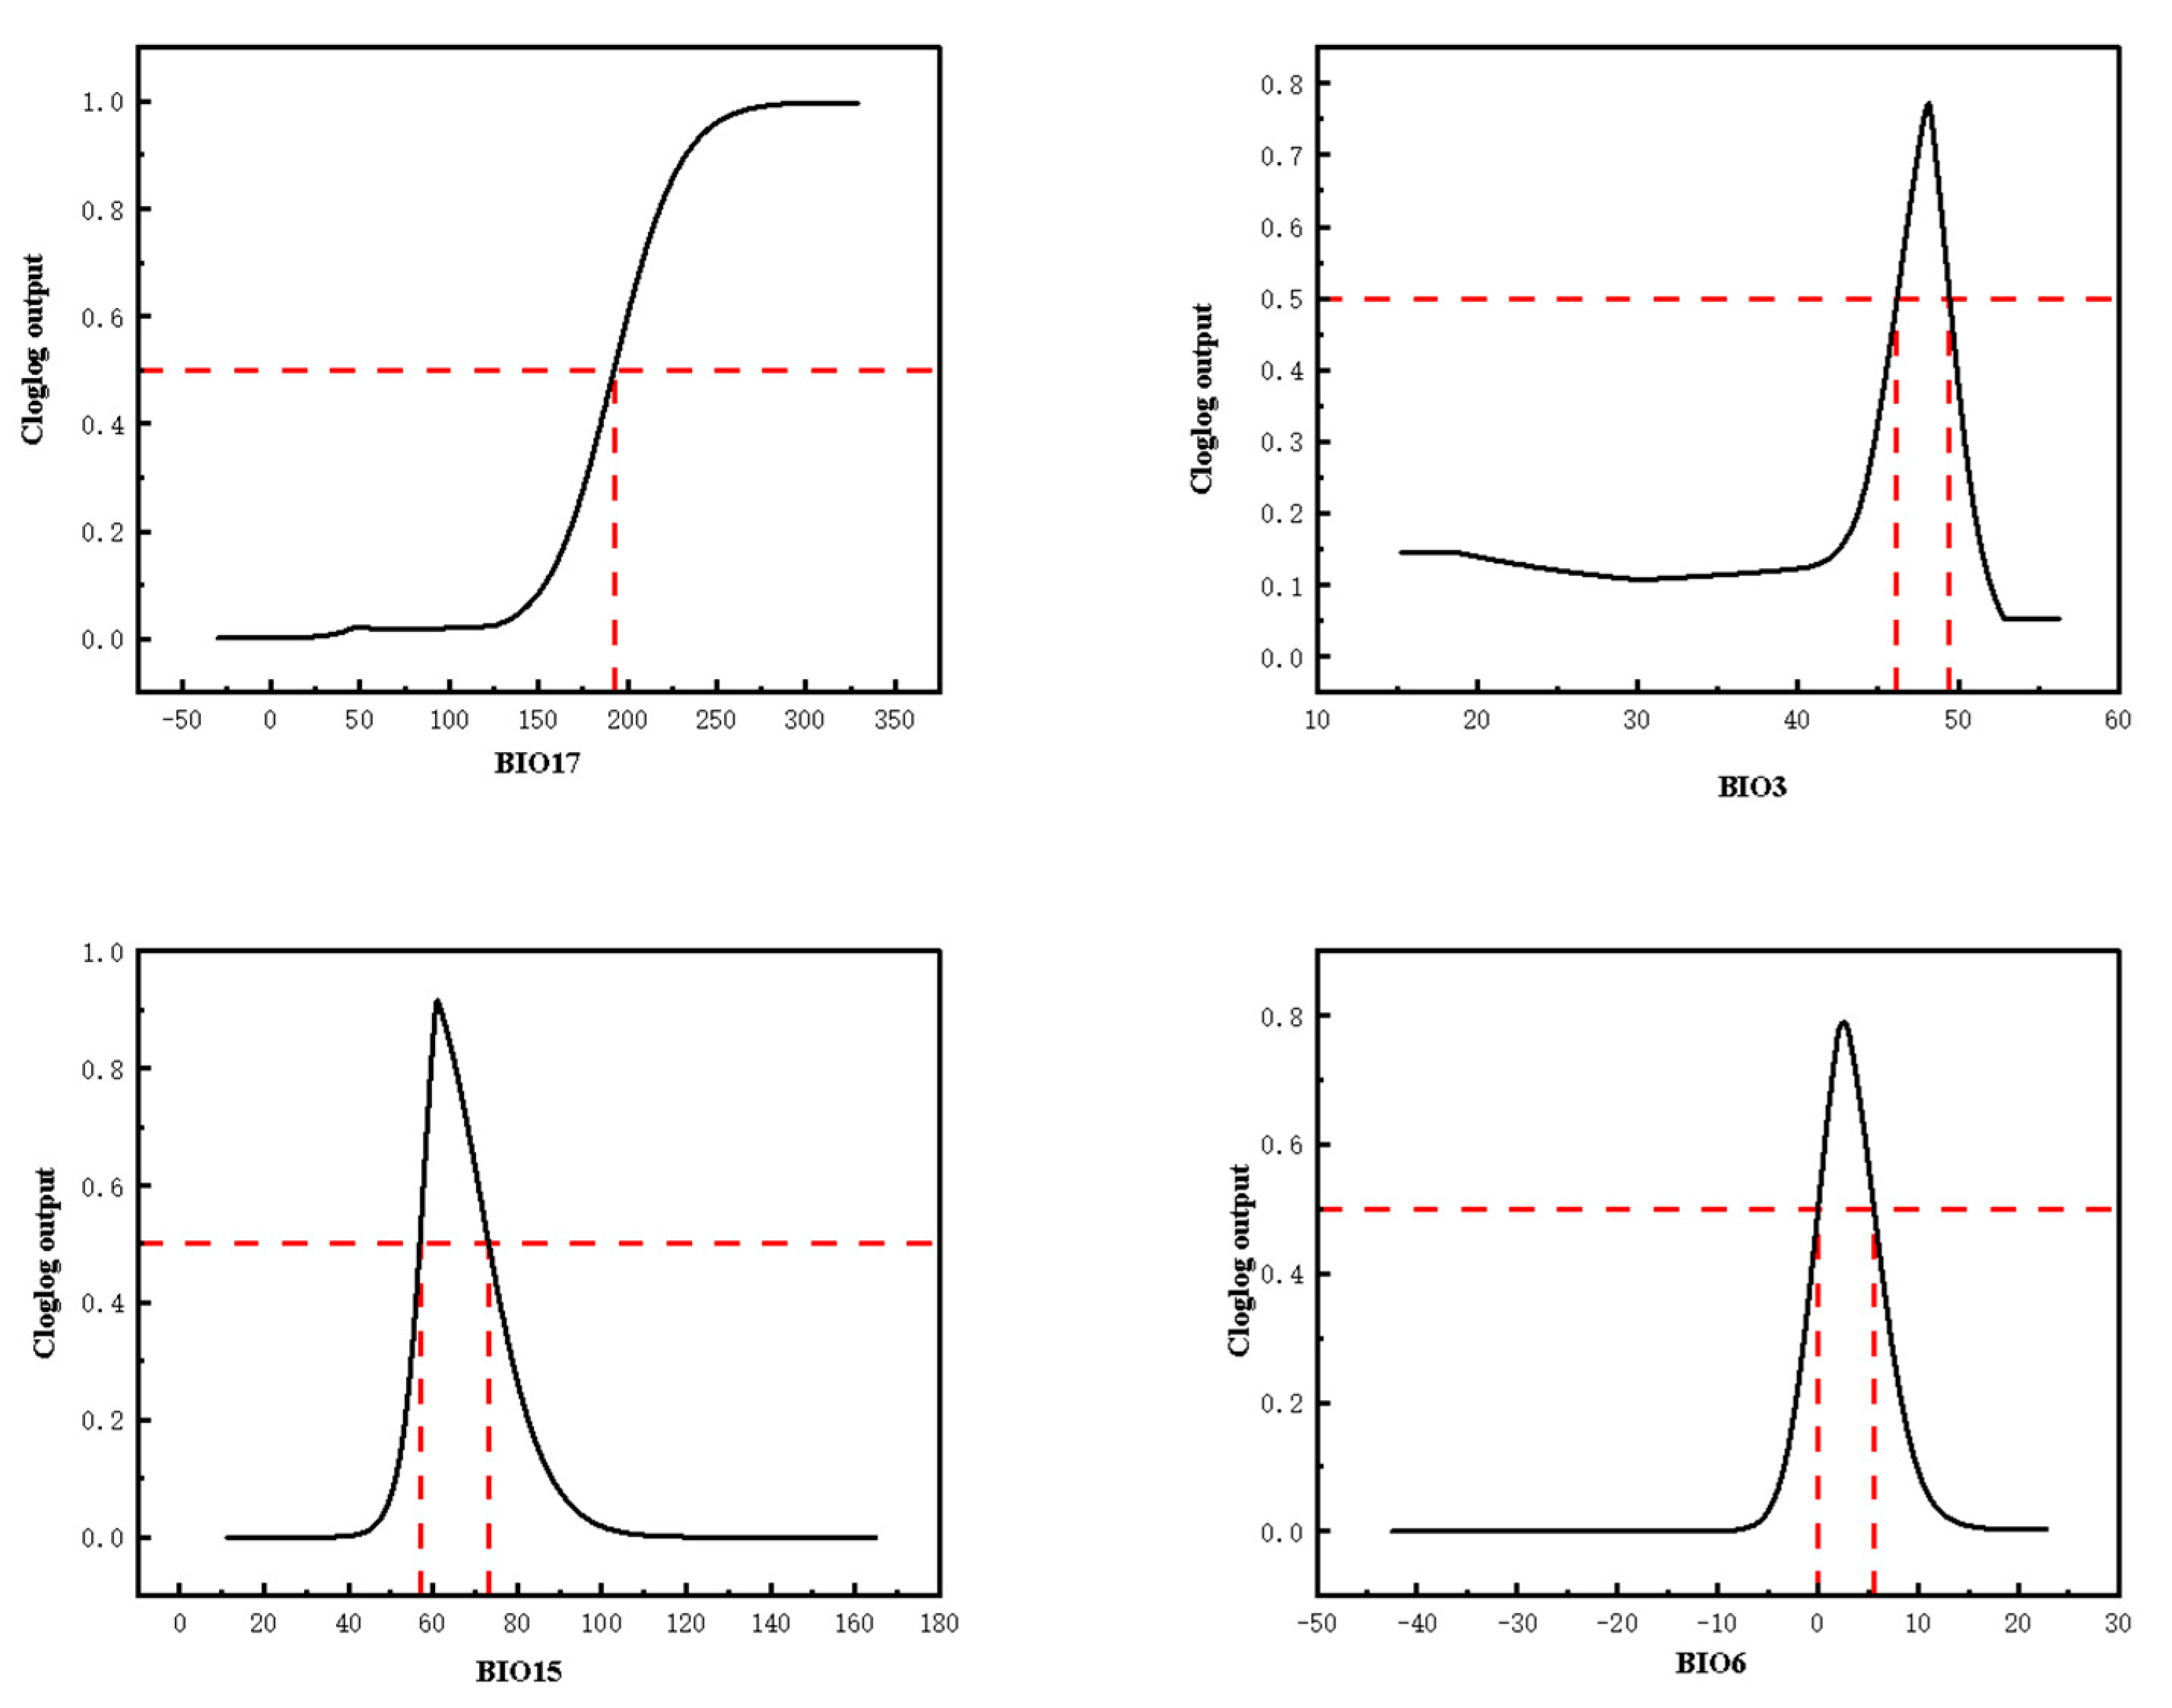
Universally, when the probability value of an environmental variable reaches 0.5 or above, it indicates that the environmental conditions are suitable for the growth of A. setosa. Within a certain range, Precipitation of Driest Quarter (BIO17) was positively correlated with the probability adaptive distribution of A. setosa, and the probability of occurrence tended to increase with the value of the variable. The stronger the positive correlation in the early stage, the more rapid the growth rate was, and it then slowed down slightly in the later stage. In contrast, Isothermality (BIO3), Precipitation Seasonality (BIO15) and Min Temperature of Coldest Month (BIO6) were positively correlated in the early stage, but after exceeding a certain limit, the probability declined rapidly with the increase in the values of the variables and finally converged to 0. The predicted thresholds of the dominant environmental variables of the adaptive distribution for A. setosa were Precipitation of Driest Quarter (BIO17) ≥ 192.78.5 mm, Isothermality (BIO3) ≤ 48.16, Precipitation Seasonality (BIO15) from 56.76 to 75.17 mm and Min Temperature of Coldest Month (BIO6) from −0.02 to 5.58 °C (Figure 4). Precipitation and temperature were the main factors limiting the distribution of A. setosa, as the probability of growth increased with the increase in precipitation, and it was suitable for growth within a certain temperature range, but the species could not tolerate extreme temperatures.

3.2. Shrinkage and Expansion of Adaptive Distribution and Centroid Migration

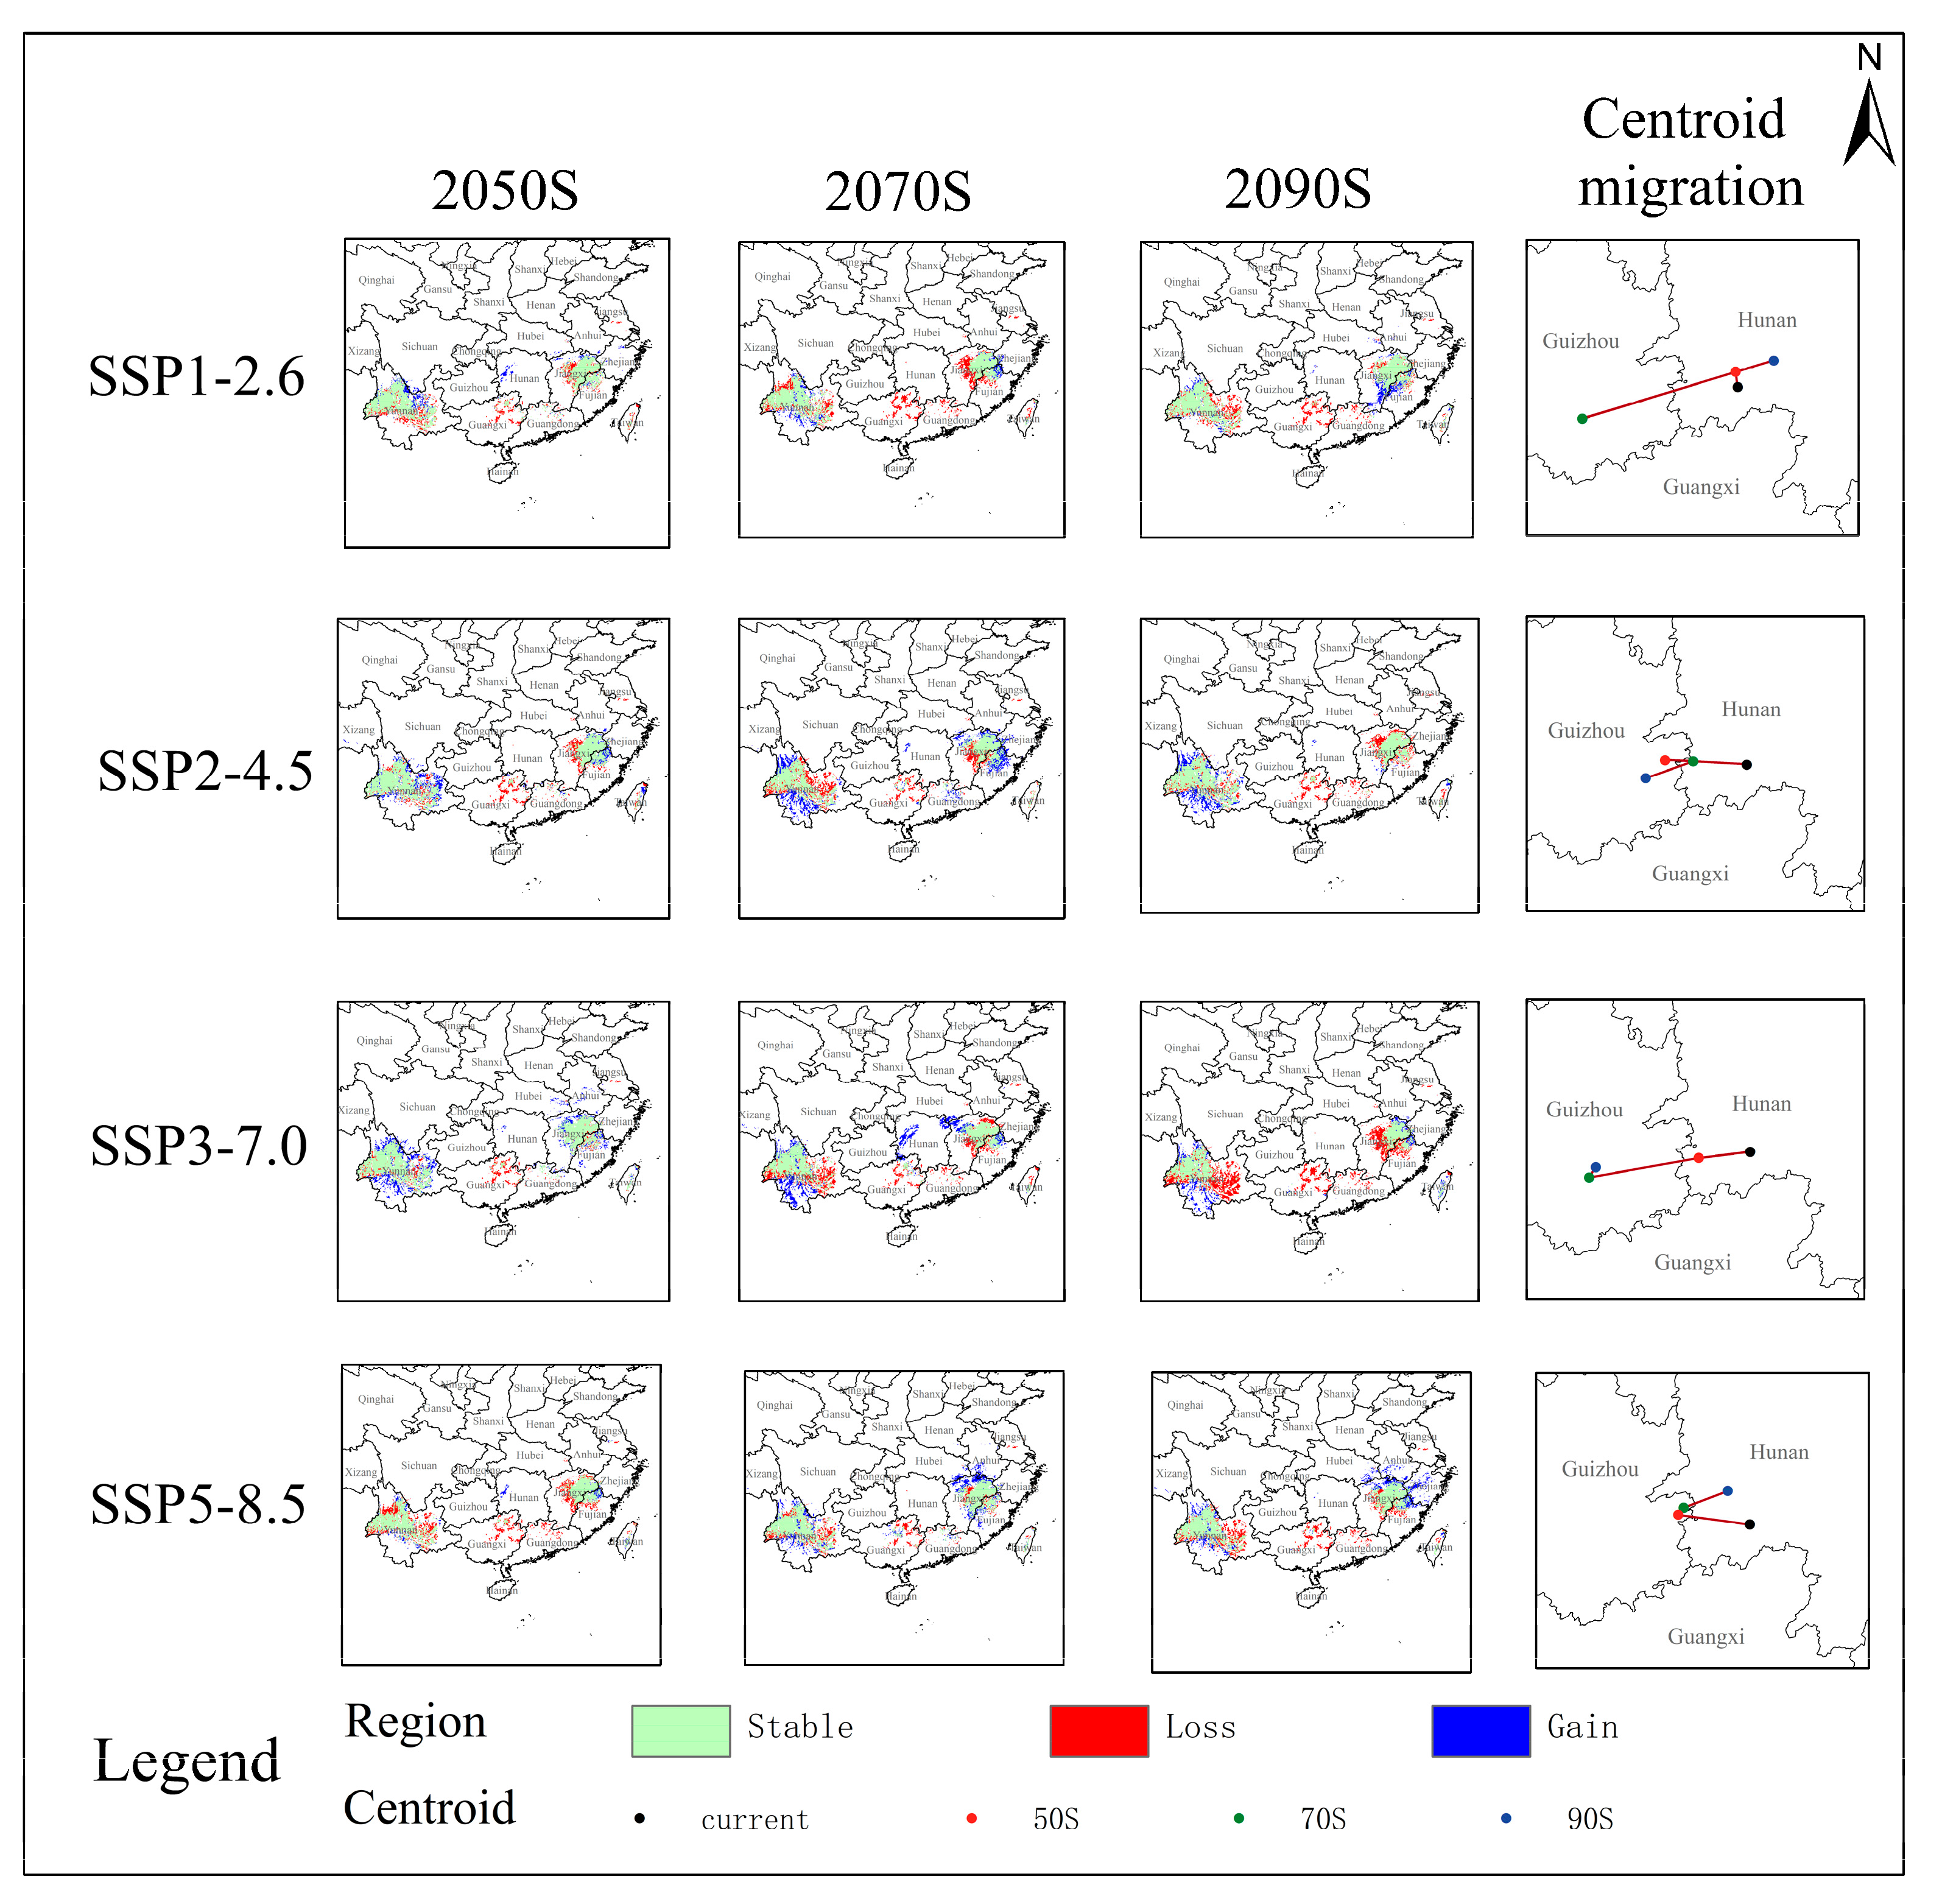
In the SSP1-2.6, SSP2-4.5, SSP3-7.0 and SSP5-8.5 scenarios, the location and area of adaptive distribution zones changed to varying degrees in the 2050s, 2070s and 2090s (Figure 5). There were significant increases in the areas of highly adaptive distribution, moderately adaptive distribution and lowly adaptive distribution zones, as well as a decrease in the area of unadaptive distribution. For each scenario, the percentage change increased over time. Over the same time period, in the 2050s, the predicted percentage change in the area of suitability for A. setosa first increases and then decreases with the increase in radiative forcing. In the 2070s, the percentage change in areas of highly adaptive distribution and moderately adaptive distribution first increased substantially and then decreased with the increase in radiative forcing, while the percentage change in areas of low suitability in the SSP3-7.0 scenario was slightly greater than the change in the SSP1-2.6 scenario. The maximum area of highly adaptive distribution was found in the SSP2-4.5 scenario, followed by SSP5-8.5, SSP3-7.0 and SSP1-2.6. Among them, the SSP2-4.5 scenario had the maximum area of adaptive distribution in the 2070s, which was increased by 141.76% compared with the current situation. The increase in the area of adaptive distribution was mainly due to the increase in the area of medium adaptive distribution, as well as the area of high adaptive distribution, in Guangxi area, the border of Yunnan Province and the junction of the Jiangxi and Fujian Provinces zones (Figure 6). In the four future scenarios, the total unsuitable area for A. setosa showed a decreasing trend over time, with most of it being converted to moderately adaptive distribution (Figure 6). Of these, the 2090 SSP3-7.0 scenario shows the largest decrease in total area of lowly adaptive distribution, with a 12.45% decrease from current climate conditions. In addition to the areas transformed into moderately adaptive distribution mentioned above, most of the rest were transformed into highly adaptive distribution areas, which are located in the border zone between Guangxi Province and Guangdong Province.
Currently, the center of mass of the adaptive distribution of A. setosa is located in Shaoyang City, Hunan Province, and the center of the adaptive distribution as a whole shifts significantly to the northwest in the future climate scenarios, with the centers of mass of all climate scenarios being located in Hunan and Guizhou Provinces (Figure 6). In low-forcing climate scenario SSP1-2.6, the center of mass migrates by 27.087 km to the northwest from 2041 to 2060; by 254.653 km to the southwest to Danzhai County, Qiandongnan Miao and Dong Autonomous Prefecture, Guizhou Province; and by 317.343 km to the northeast from 2081 to 2100 in the future climate scenario (Figure 6). From 2081 to 2100, the center of mass migrates by 317.346 km northeastward to Longhui County, Shaoyang City, Hunan Province. In high-forcing scenario SSP5-8.5, the center of mass of the adaptive distribution between 2041 and 2060 migrates by 110.649 km to the northwest to Tianzhu County, Qiandongnan Miao and Dong Autonomous Prefecture, Guizhou Province; between 2061 and 2080, it migrates by 14.250 km to the northeast; and between 2081 and 2100, the center of mass migrates to the northeast to Dangzhai County, Qiandongnan Miao and Dong Autonomous Prefecture. From 2061 to 2080, the center of mass migrates by 14.250 km to the northeast; from 2081 to 2100, the center of mass migrates by 73.333 km to Hongjiang City and Huaihua City, Hunan Province. Over time, the centers of the A. setosa distribution migrate northward, and under the same climatic conditions, the centroid migration distance of each predicted potentially adaptive distribution decreases with the increase in radiative forcing.
In the four different future climate scenarios, BIO17 and BIO3 were the two most important drivers influencing the distribution of A. setosa. In order to visualize the differences in the contributions of the drivers in the different climate scenarios, the two highest drivers were removed. BIO15, BIO6 and T_BS contributed more in the SSP3-7.0 scenario than in the other scenarios; ELEV had the highest contribution among several variables in the SSP585 scenario; and BIO2 had the highest contribution in the SSP2-4.5 scenario. For all four future scenarios, BIO17, BIO3 and BIO15 contributed the most to the distribution of A. setosa, as they were always above 50.8%, 15.6% and 7.0%, respectively, which is consistent with the order of influence of the drivers under the current climatic conditions, and the differences in the contribution rates of the other drivers among the scenarios were not very large. The trend of changes in SSP126 and SSP245 were similar, and SSP3-7.0 and SSP5-8.5 also had similar trends (Figure 7), suggesting that the degree of influence of the drivers on A. setosa is based on changes in radiation intensity.

4. Discussion

The MaxEnt model has been more widely used internationally [35]. Most previous studies have run the MaxEnt model with default parameters, which leads to overfitting and sampling bias [24,36]; however, the sample processing and parameter settings have a great impact on the model predictions [37,38,39,40], and the overfitting of the MaxEnt model can drastically reduce the predictive ability of the model [41,42]. Therefore, to improve this study, we optimized the sample processing and parameter settings based on the original MaxEnt model. For sample processing, we utilized the environmental ecological niche model analysis software application ArcGIS SDM Toolbox [25], which has the notable advantage of being able to correlate species distribution data with environmental data for matching analysis [43]. As for the parameter settings, we chose the ENMeval package to optimize the MaxEnt model, which matches and analyzes species distribution data with environmental variables [24,44]. After automated analysis with the R program, all participating models were statistically significant, with the smallest DeltaAICc value (equal to 0) for the model with FC = LQH and RM = 1, indicating the best movement of the model from the known distribution area to the predicted area [45,46,47]. Kim et al. applied the ENMeval package to optimize the model for predicting the habitat distribution of the subgenus Macrocarpus [48], with the optimized parameters of FC = LQH and RM = 1.5. Khan et al. found that the MaxEnt model parameters optimized by the ENMeval package with FC = LQHPT and RM = 2 were optimal for investigating the impact of climate change on the habitat suitability of Pinus sylvestris [49], a species that is important to the economy of South Asia. Zhao used MaxEnt model parameters optimized by the ENMeval package to predict the distribution pattern of balsam fir and found that when RM = 0.5 and FC = LQ, both DIFF and OR10 were smaller and the MaxEnt model had better fit and complexity [50]. In summary, the parameters of the MaxEnt model optimized by the ENMeval package varied for different species, although from the above study, it can be seen that the optimized RM values were all greater than or equal to 1 and FC included LQ. The optimized AUC values in this study were all above 0.991, and the model fit was better, which also corroborates the above study.
The distribution pattern of plant species is governed by environmental factors, among which climatic factors are widely recognized as the main factors influencing plant distribution. Climate change can promote or inhibit the growth and development of plants, thus affecting their spatial distribution [51]. In addition to climate factors, soil factors play a supporting role in the vegetation growth process. In our study, the total contribution of climate was as high as 88.6% and that of soil factors was 8.0%. Climate plays a significant role in limiting the adaptive distribution of A. setosa. The influence of climate on vegetation growth mainly includes temperature, precipitation and radiation, which affect the physiological activities and ecological suitability of plants, thus influencing the distribution and coverage of vegetation and triggering the succession and transfer of vegetation [52]. Soil texture, in turn, is often closely related to water storage capacity, and many chemical components and minerals in the soil are soluble in water in order to be absorbed, which indirectly affects the physiological and biochemical processes of vegetation, such as photosynthesis and transpiration [53,54].
Temperature and precipitation are often the main factors influencing the distribution of tropical vegetation according to multiple studies [20,55,56,57]. In our study, we found that the total contribution of precipitation factors affecting the distribution of A. setosa was 61.2% and the total contribution of temperature factors was 27.4%. In a recent study on the effects of temperature and precipitation on the distribution of the tropical genus Ginger [53], it was found that the effect of precipitation was much greater than that of temperature. This may be due to the fact that precipitation affects carbon fixation in plants in sunny and warm climates like the tropics and subtropics [58], which in turn affects a series of physiological activities during the seed germination, growth and development of plant species [59,60]. The results of this study indicate that Precipitation of Driest Quarter is the most important environmental factor that affects the distribution of Spiny Manzanita. Drought stress initially leads to leaf wilting and, if prolonged, to growth retardation and even plant death [61,62,63]. Isothermality and Min Temperature of Coldest Month are important temperature variables that affect its distribution. Inappropriate temperatures can disrupt the processes of photosynthesis, respiration and transpiration, which can adversely affect plants [64,65]. Growth was inhibited when Min Temperature of Coldest Month was above 5.58 °C or below −0.02 °C. The response of dormancy and germination to temperature is closely related to the ecological distribution of the species [66,67]. China is rich in hydrothermal resources, and its climate is characterized by humid and rainy conditions, seasonal high temperatures, high radiation angles and long summer sunshine [68]. In this study, the response ranges of A. setosa to annual precipitation and temperature were ≥830.5 mm and ≤32.95 °C, respectively. The suitable environmental factors affecting the growth of A. setosa were within these ranges, but northern China is dominated by temperate continental and temperate monsoon climates, with low annual precipitation and cold and dry winters, which are unadaptive for A. setosa; thus, the suitability of many areas in the north is low.
The continued acceleration of global warming and the increased frequency of extreme weather events are leading to changes in suitable habitats and northward migration of various vegetation types [69]. The adaptation of species distributions to climate change often lags behind due to physiological constraints inherent in their distribution [70]. Although some species may be able to cope with climate change through phenotypic effects or natural selection [71], their ability to adapt to new environmental conditions is limited [72]. This requires focusing on the dynamics of species’ distribution areas—expansion and shrinkage. In this study, by using the BCC-CSM climate system model, based on four different climate scenarios, we found that the main adaptive distribution of A. setosa was expanding overall and slightly contracting in the SSP5-8.5 (2050s), SSP1-2.6 (2070s) and SSP3-7.0 (2090s) epochs. The future distribution pattern varied in the adaptive distribution in different periods, but the general trend was consistent, showing the expansion of highly and moderately adaptive distribution. The distribution centers of mass largely moved eastward in all periods of SSP2-4.5 and SSP3-7.0, whereas the remaining scenarios showed a northward migration of the centers of mass, and the migration trend was consistent with previous studies [73]. It is worthwhile to investigate that in the 2050s, in the low-emission scenario, the area of adaptive distribution is expected to expand compared with the current scenario, which suggests a positive moderating effect of temperature changes induced by elevated CO2 concentration within a certain threshold. We hypothesize that appropriate increases in CO2 concentrations may promote plant developmental processes through increased biomass and improved photosynthetic and water-use efficiency and further promote plant resilience [74,75,76]. The growth of A. setosa will become favorable in the future and is expected to be fairly stable in the highly and moderately adaptive distribution areas. The expansion of the habitat of A. setosa could have a number of positive ecological impacts in the context of climate change. Firstly, its well-developed root system can effectively fix soil and reduce erosion, especially on sloping or degraded land while improving soil structure by increasing soil organic matter. Secondly, as a C4 plant [77], A. setosa has high photosynthetic efficiency under high-temperature and strong-light conditions, which can significantly improve the carbon fixation capacity of the ecosystem, enhance the function of carbon sinks and contribute to the mitigation of climate change. In addition, its drought tolerance and barrenness tolerance make it an ideal pioneer species for the restoration of degraded ecosystems, which can create favorable conditions for the settlement and ecological succession of subsequent plants and promote the natural recovery of ecosystems [17]. These characteristics make it ecologically important to soil conservation, carbon fixation and ecological restoration.
This study predicts the adaptive distribution for A. setosa in current and future climate scenarios. Through the results, it is proposed that cultivation could be appropriately scaled up in poorer habitats in the future. This will allow not only for planned closure to increase bioproduction but also for future climate-driven development to take full advantage of the excellent thermal and hydrological conditions that are suitable for the growth of A. setosa, which will lead to the rapid restoration of thickets or forests, which have a high water-holding capacity and a high bioproductivity, thus preserving soil and water and maintaining the ecological balance. After the environment is improved, the development of timber forests or economic forests can be continued in a planned manner. These results can be considered as a baseline for further development, with data to support the development of a long-term management and cultivation program for the species.
Despite the insights provided by this study, several limitations should be acknowledged. First, our model assumes that topographic and soil variables remain constant in future climate scenarios, which may not fully reflect real-world dynamics. Changes in land use, erosion or soil degradation could alter these variables over time, potentially affecting the distribution of A. setosa. Second, the resolution of environmental data used in the analysis may not capture fine-scale habitat heterogeneity, particularly in regions with complex terrain or localized microclimates. Third, the model does not account for potential biotic interactions, such as competition or facilitation, which could influence the species’ distribution under changing environmental conditions. Finally, while we used a robust set of climate projections, uncertainties inherent in climate models may affect the accuracy of our predictions. Future studies could address these limitations by incorporating dynamic soil and topographic variables, higher-resolution environmental data, and biotic interactions to improve the reliability of species distribution forecasts.

5. Conclusions

A. setosa is a drought-tolerant grass that dominates dry mesic grasslands, and global changes have important impacts on its distribution. In this study, we used the optimized MaxEnt model, ArcGIS 10.8.1 software, and species distribution data to comprehensively analyze the migration of the habitat and center of gravity of A. setosa under the global climate-driven changes, taking into account various environmental factors. The results showed that (1) the center of gravity of the adaptive distribution of A. setosa is located in Shaoyang City, Hunan Province, and the adaptive distribution is mainly distributed south of the Yangtze River, with the highly, moderately and lowly adaptive distribution areas accounting for 1%, 1.67% and 4.47% of the total land area of the country, respectively; the high adaptive distribution zones of A. setosa are in Yunnan Province and Jiangxi Province. (2) Climate is the main factor that affects the distribution of A. setosa, and the effect of precipitation is greater than that of temperature. Precipitation of Driest Quarter (BIO17) and Isothermality (BIO3) are the two most critical factors affecting the current and future distribution of A. setosa, and the soil plays a certain auxiliary role in regulation. (3) Driven by global climate change, the centers of mass of adaptive distribution in all climate scenarios were located in Hunan and Guizhou Provinces, and their area generally showed an upward trend, with the expansion rate of adaptive distribution ranging from 16.01% to 41.76%; the centers of mass of all classes of adaptive distribution were predicted to move northward on the whole. The results of this study can provide scientific guidance and data support for future ecosystem restoration and resource management.

Author Contributions

Conceptualization, H.Z.; methodology, H.Z.; software, M.Z.; validation, H.Z. and S.Z.; formal analysis, M.Z.; investigation, M.Z.; resources, H.Z.; data curation, M.Z.; writing—original draft preparation, H.Z. and M.Z.; writing—review and editing, H.Z., M.Z., S.Z., Z.W. and Z.L.; visualization, M.Z.; supervision, H.Z.; project administration, H.Z. and Z.L.; funding acquisition, H.Z. All authors have read and agreed to the published version of the manuscript.

Funding

This research study was funded by the National Water Pollution Control and Treatment Science and Technology Major Project (2017ZX07101) and the Discipline Construction Program of Huayong Zhang, Distinguished Professor of Shandong University, School of Life Sciences (61200082363001).

Institutional Review Board Statement

Not applicable.

Informed Consent Statement

Not applicable.

Data Availability Statement

All links to input data are reported in the manuscript, and all output data are available upon request to the authors.

Conflicts of Interest

The authors declare no conflicts of interest.

References

  1. Bellard, C.; Bertelsmeier, C.; Leadley, P.; Thuiller, W.; Courchamp, F. Impacts of climate change on the future of BIOdiversity. Ecol. Lett. 2012, 15, 365–377. [Google Scholar] [CrossRef] [PubMed]
  2. Lawler, J.J.; Shafer, S.L.; White, D.; Kareiva, P.; Maurer, E.P.; Blaustein, A.R.; Bartlein, P.J. Projected climate-induced faunal change in the Western Hemisphere. Ecology 2009, 90, 588–597. [Google Scholar] [CrossRef]
  3. Fan, Z.F.; Zhou, B.J.; Ma, C.L.; Gao, C.; Han, D.N.; Chai, Y. Impacts of climate change on species distribution patterns of Polyspora sweet in China. Ecol. Evol. 2022, 12, e9516. [Google Scholar] [CrossRef]
  4. Vintsek, L.; Klichowska, E.; Nowak, A.; Nobis, M. Insight into the phylogeny and responses of species from the genus Sergia (Campanulaceae) to the climate changes predicted for the Mountains of Central Asia (a world biodiversity hotspot). BMC Plant Biol. 2024, 24, 228. [Google Scholar] [CrossRef]
  5. Vintsek, L.; Klichowska, E.; Nowak, A.; Nobis, M. Genetic differentiation, demographic history and distribution models of high alpine endemic vicariants outline the response of species to predicted climate changes in a Central Asian biodiversity hotspot. Ecol. Indic. 2022, 144, 109419. [Google Scholar] [CrossRef]
  6. Gottfried, M.; Pauli, H.; Futschik, A.; Akhalkatsi, M.; Barančok, P.; Benito Alonso, J.L.; Coldea, G.; Dick, J.; Erschbamer, B.; Fernández Calzado, M.A.R.; et al. Continent-wide response of mountain vegetation to climate change. Nat. Clim. Change 2012, 2, 111–115. [Google Scholar] [CrossRef]
  7. Weiskopf, S.R.; Rubenstein, M.A.; Crozier, L.G.; Gaichas, S.; Griffis, R.; Halofsky, J.E.; Hyde, K.J.W.; Morelli, T.L.; Morisette, J.T.; Muñoz, R.C.; et al. Climate change effects on biodiversity, ecosystems, ecosystem services, and natural resource management in the United States. Sci. Total Environ. 2020, 733, 137782. [Google Scholar] [CrossRef]
  8. Pecl, G.T.; Araújo, M.B.; Bell, J.D.; Blanchard, J.; Bonebrake, T.C.; Chen, I.C.; Clark, T.D.; Colwell, R.K.; Danielsen, F.; Evengård, B.; et al. Biodiversity redistribution under climate change: Impacts on ecosystems and human well-being. Science 2017, 355, eaai9214. [Google Scholar] [CrossRef]
  9. Han, Z.; Song, W.; Deng, X.; Xu, X. Grassland ecosystem responses to climate change and human activities within the Three-River Headwaters region of China. China. Sci. Rep. 2018, 8, 9079. [Google Scholar] [CrossRef]
  10. Chen, I.C.; Hill, J.K.; Ohlemüller, R.; Roy, D.B.; Thomas, C.D. Rapid Range Shifts of Species Associated with High Levels of Climate Warming. Science 2011, 333, 1024–1026. [Google Scholar] [CrossRef]
  11. Petermann, J.S.; Buzhdygan, O.Y. Grassland biodiversity. Curr. Biol. 2021, 31, R1195–R1201. [Google Scholar] [CrossRef]
  12. Su, R.; Yu, T.; Dayananda, B.; Bu, R.; Su, J.; Fan, Q. Impact of climate change on primary production of Inner Mongolian grasslands. Glob. Ecol. Conserv. 2020, 22, e00928. [Google Scholar] [CrossRef]
  13. Li, Z.-G.; Gong, M. Mechanical Stimulation-Induced Cross-Adaptation in Plants: An Overview. J. Plant Biol. 2011, 54, 358–364. [Google Scholar] [CrossRef]
  14. Raza, A.; Razzaq, A.; Mehmood, S.S.; Zou, X.; Zhang, X.; Lv, Y.; Xu, J. Impact of Climate Change on Crops Adaptation and Strategies to Tackle Its Outcome: A Review. Plants 2019, 8, 34. [Google Scholar] [CrossRef]
  15. Feldman, A.F.; Short Gianotti, D.J.; Dong, J.; Trigo, I.F.; Salvucci, G.D.; Entekhabi, D. Tropical surface temperature response to vegetation cover changes and the role of drylands. Glob. Change Biol. 2022, 29, 110–125. [Google Scholar] [CrossRef]
  16. Jayakumar, S.; Kim, S.-S.; Heo, J. Floristic inventory and diversity assessment—A critical review. Proc. Int. Acad. Ecol. Environ. Sci. 2011, 1, 151–168. [Google Scholar]
  17. Umair, M.; Sun, N.; Du, H.; Chen, K.; Tao, H.; Yuan, J.; Abbasi, A.M.; Liu, C. Differential stoichiometric responses of shrubs and grasses to increased precipitation in a degraded karst ecosystem in Southwestern China. Sci. Total Environ. 2020, 700, 134421. [Google Scholar] [CrossRef]
  18. Kong, J. Community Characteristics and Utilization of Arundinella setosa Trin Grassland in Subtropical Red Soil Hilly Areas. Northwest Bot. Res. 1981. [Google Scholar]
  19. Mano, G.B.; Lopes, A.; Piedade, M.T.F. Will climate change favor exotic grasses over native ecosystem engineer species in the Amazon Basin? Ecol. Inform. 2023, 75, 102102. [Google Scholar] [CrossRef]
  20. Guisan, A.; Thuiller, W. Predicting species distribution: Offering more than simple habitat models. Ecol. Lett. 2005, 8, 993–1009. [Google Scholar] [CrossRef]
  21. Elith, J.; Phillips, S.J.; Hastie, T.; Dudík, M.; Chee, Y.E.; Yates, C.J. A statistical explanation of MaxEnt for ecologists. Divers. Distrib. 2011, 17, 43–57. [Google Scholar] [CrossRef]
  22. Phillips, S.J.; Anderson, R.P.; Schapire, R.E. Maximum entropy modeling of species geographic distributions. Ecol. Model. 2006, 190, 231–259. [Google Scholar] [CrossRef]
  23. Bradley, B.A. Assessing ecosystem threats from global and regional change: Hierarchical modeling of risk to sagebrush ecosystems from climate change, land use and invasive species in Nevada, USA. Ecography 2010, 33, 198–208. [Google Scholar] [CrossRef]
  24. Warren, D.L.; Wright, A.N.; Seifert, S.N.; Shaffer, H.B.; Franklin, J. Incorporating model complexity and spatial sampling bias into ecological niche models of climate change risks faced by 90 California vertebrate species of concern. Divers. Distrib. 2013, 20, 334–343. [Google Scholar] [CrossRef]
  25. He, Y.; Ma, J.; Chen, G. Potential geographical distribution and its multi-factor analysis of Pinus massoniana in China based on the maxent model. Ecol. Indic. 2023, 154, 110790. [Google Scholar] [CrossRef]
  26. Yang, Y.; He, J.; Liu, Y.; Zeng, J.; Zeng, L.; He, R.; Guiang, M.M.; Li, Y.; Wu, H. Assessment of Chinese suitable habitats of Zanthoxylum nitidum in different climatic conditions by Maxent model, HPLC, and chemometric methods. Ind. Crops Prod. 2023, 196, 116515. [Google Scholar] [CrossRef]
  27. Warren, D.L.; Glor, R.E.; Turelli, M. ENMTools: A toolbox for comparative studies of environmental niche models. Ecography 2010, 33, 607–611. [Google Scholar] [CrossRef]
  28. Wang, Y.; Xie, L.; Zhou, X.; Chen, R.; Zhao, G.; Zhang, F. Prediction of the potentially suitable areas of Leonurus japonicus in China based on future climate change using the optimized MaxEnt model. Ecol. Evol. 2023, 13, e10597. [Google Scholar] [CrossRef]
  29. Kass, J.M.; Muscarella, R.; Galante, P.J.; Bohl, C.L.; Pinilla-Buitrago, G.E.; Boria, R.A.; Soley-Guardia, M.; Anderson, R.P. ENMeval 2.0: Redesigned for customizable and reproducible modeling of species’ niches and distributions. R. P. ENMeval 2.0: Redesigned for customizable and reproducible modeling of species’ niches and distributions. Methods Ecol. Evol. 2021, 12, 1602–1608. [Google Scholar] [CrossRef]
  30. Yang, J.; Huang, Y.; Jiang, X.; Chen, H.; Liu, M.; Wang, R. Potential geographical distribution of the edangred plant Isoetes under human activities using MaxEnt and GARP. Glob. Ecol. Conserv. 2022, 38, e02186. [Google Scholar] [CrossRef]
  31. Zhao, Z.; Xiao, N.; Shen, M.; Li, J. Comparison between optimized MaxEnt and random forest modeling in predicting potential distribution: A case study with Quasipaa boulengeri in China. Sci. Total Environ. 2022, 842, 156867. [Google Scholar] [CrossRef] [PubMed]
  32. Brown, J.L.; Anderson, B. SDM toolbox: A python-based GIS toolkit for landscape genetic, biogeographic and species distribution model analyses. Methods Ecol. Evol. 2014, 5, 694–700. [Google Scholar] [CrossRef]
  33. Xian, X.; Zhao, H.; Wang, R.; Huang, H.; Chen, B.; Zhang, G.; Liua, W.; Wan, F. Climate change has increased the global threats posed by three ragweeds (Ambrosia L.) in the Anthropocene. Sci. Total Environ. 2023, 859, 160252. [Google Scholar] [CrossRef] [PubMed]
  34. Li, J.; Chang, H.; Liu, T.; Zhang, C. The potential geographical distribution of Haloxylon across Central Asia under climate change in the 21st century. Agric. For. Meteorol. 2019, 275, 243–254. [Google Scholar] [CrossRef]
  35. Li, Y.; Yang, Y.; Gu, D.; Cheng, Y.; Lv, X.; Huang, Y.; Ye, P.; Zhang, X.; Zhang, J.; Jian, W.; et al. Investigation of the impact of diverse climate conditions on the cultivation suitability of Cinnamomum cassia using the MaxEnt model, HPLC and chemometric methods in China. Sci. Rep. 2024, 14, 25686. [Google Scholar] [CrossRef]
  36. Kramer-Schadt, S.; Niedballa, J.; Pilgrim, J.D.; Schröder, B.; Lindenborn, J.; Reinfelder, V.; Stillfried, M.; Heckmann, I.; Scharf, A.K.; Augeri, D.M.; et al. The importance of correcting for sampling bias in MaxEnt species distribution models. Divers. Distrib. 2013, 19, 1366–1379. [Google Scholar] [CrossRef]
  37. Wei, B.; Wang, R.; Hou, K.; Wang, X.; Wu, W. Predicting the current and future cultivation regions of Carthamus tinctorius L. using MaxEnt model under climate change in China. Glob. Ecol. Conserv. 2018, 16, e00477. [Google Scholar] [CrossRef]
  38. Xu, D.; Zhuo, Z.; Wang, R.; Ye, M.; Pu, B. Modeling the distribution of Zanthoxylum armatum in China with MaxEnt modeling. Glob. Ecol. Conserv. 2019, 19, e00691. [Google Scholar] [CrossRef]
  39. Yan, H.; Feng, L.; Zhao, Y.; Feng, L.; Wu, D.; Zhu, C. Prediction of the spatial distribution of Alternanthera philoxeroides in China based on ArcGIS and MaxEnt. Glob. Ecol. Conserv. 2020, 21, e00856. [Google Scholar] [CrossRef]
  40. Cobos, M.E.; Peterson, A.T.; Barve, N.; Osorio-Olvera, L. kuenm: An R package for detailed development of ecological niche models using Maxent. PeerJ 2019, 7, e6281. [Google Scholar] [CrossRef]
  41. Merow, C.; Smith, M.J.; Silander, J.A. A practical guide to MaxEnt for modeling species’ distributions: What it does, and why inputs and settings matter. Ecography 2013, 36, 1058–1069. [Google Scholar] [CrossRef]
  42. Phillips, S.J.; Dudík, M. Modeling of species distributions with Maxent: New extensions and a comprehensive evaluation. Ecography 2008, 31, 161–175. [Google Scholar] [CrossRef]
  43. Jia, X.; Wang, C.; Jin, H.; Zhao, Y.; Liu, L.; Chen, Q.; Li, B.; Xiao, Y.; Yin, H. Assessing the suitable distribution area of Pinus koraiensis based on an optimized MaxEnt model. Chin. J. Ecol. 2019, 38, 2570–2576. [Google Scholar]
  44. Anderson, R.P.; Gonzalez, I., Jr. Species-specific tuning increases robustness to sampling bias in models of species distributions: An implementation with Maxent. Ecol. Model. 2011, 222, 2796–2811. [Google Scholar] [CrossRef]
  45. Warren, D.L.; Seifert, S.N. Ecological niche modeling in Maxent: The importance of model complexity and the performance of model selection criteria. Ecol. Appl. 2011, 21, 335–342. [Google Scholar] [CrossRef]
  46. Elith, J.; Leathwick, J.R. Species distribution models: Ecological explanation and prediction across space and time. Annu. Rev. Ecol. Evol. Syst. 2009, 40, 677–697. [Google Scholar] [CrossRef]
  47. Roberts, D.L.; Syfert, M.M.; Smith, M.J.; Coomes, D.A. The Effects of Sampling Bias and Model Complexity on the Predictive Performance of MaxEnt Species Distribution Models. PLoS ONE 2013, 8, e55158. [Google Scholar]
  48. Kim, C.; Kim, W.; Song, W.; Cho, J.; Choi, J. Prediction of Native Seed Habitat Distribution According to SSP Scenario and Seed Transfer Zones: A Focus on Acer pictum subsp. mono and Quercus acuta. Forests 2023, 14, 87. [Google Scholar] [CrossRef]
  49. Khan, A.M.; Li, Q.; Saqib, Z.; Khan, N.; Habib, T.; Khalid, N.; Majeed, M.; Tariq, A. MaxEnt Modelling and Impact of Climate Change on Habitat Suitability Variations of Economically Important Chilgoza Pine (Pinus gerardiana Wall.) in South Asia. Forests 2022, 13, 715. [Google Scholar] [CrossRef]
  50. Zhao, Y.; Deng, X.; Xiang, W.; Chen, L.; Ouyang, S. Predicting potential suitable habitats of Chinese fir under current and future climatic scenarios based on Maxent model. Ecol. Inform. 2021, 64, 101393. [Google Scholar] [CrossRef]
  51. Wu, Z.; Dijkstra, P.; Koch, G.W.; PeÑUelas, J.; Hungate, B.A. Responses of terrestrial ecosystems to temperature and precipitation change: A meta -analysis of experimental manipulation. Glob. Change Biol. 2011, 17, 927–942. [Google Scholar] [CrossRef]
  52. Luo, J.; Ma, Y.; Liu, Y.; Zhu, D.; Guo, X. Predicting Polygonum capitatum distribution in China across climate scenarios using MaxEnt modeling. Sci. Rep. 2024, 14, 20020. [Google Scholar] [CrossRef] [PubMed]
  53. Huang, Z.; Xie, L.; Wang, H.; Zhong, J.; Li, Y.; Liu, J.; Ou, Z.; Liang, X.; Li, Y.; Huang, H.; et al. Geographic distribution and impacts of climate change on the suitable habitats of Zingiber species in China. Ind. Crops Prod. 2019, 138, 111429. [Google Scholar] [CrossRef]
  54. Deb, J.C.; Phinn, S.; Butt, N.; McAlpine, C.A. Climatic-Induced Shifts in the Distribution of Teak (Tectona grandis) in Tropical Asia: Implications for Forest Management and Planning. Environ. Manag. 2017, 60, 422–435. [Google Scholar] [CrossRef]
  55. Lu, Q.; Zhao, D.; Wu, S. Simulated responses of permafrost distribution to climate change on the Qinghai–Tibet Plateau. Sci. Rep. 2017, 7, 3845. [Google Scholar] [CrossRef]
  56. Jiang, Z.; Song, J.; Li, L.; Chen, W.; Wang, Z.; Wang, J. Extreme climate events in China: IPCC-AR4 model evaluation and projection. Clim. Change 2011, 110, 385–401. [Google Scholar] [CrossRef]
  57. Mackey, B.G.; Watson, J.E.M.; Hope, G.; Gilmore, S. Climate change, biodiversity conservation, and the role of protected areas: An Australian perspective. Biodiversity 2008, 9, 11–18. [Google Scholar] [CrossRef]
  58. Wang, Z.; Wu, X.; Liu, X.; Zhang, M.; Xie, C.; Chen, L. Phylogeographic Structure and Population Dynamics of Baoxing Osmanthus (Osmanthus serrulatus), an Endemic Species from the Southwest Sichuan Basin, China. Plants 2024, 13, 1653. [Google Scholar] [CrossRef]
  59. Punyasena, S.W.; Eshel, G.; McElwain, J.C. The influence of climate on the spatial patterning of Neotropical plant families. J. Biogeogr. 2007, 35, 117–130. [Google Scholar] [CrossRef]
  60. Bradie, J.; Leung, B. A quantitative synthesis of the importance of variables used in MaxEnt species distribution models. J. Biogeogr. 2016, 44, 1344–1361. [Google Scholar] [CrossRef]
  61. Guo, Q.; Li, X.; Niu, L.; Jameson, P.E.; Zhou, W. Transcription-associated metabolomic adjustments in maize occur during combined drought and cold stress. Plant Physiol. 2021, 186, 677–695. [Google Scholar] [CrossRef] [PubMed]
  62. Moustafa-Farag, M.; Mahmoud, A.; Arnao, M.B.; Sheteiwy, M.S.; Dafea, M.; Soltan, M.; Elkelish, A.; Hasanuzzaman, M.; Ai, S. Melatonin-Induced Water Stress Tolerance in Plants: Recent Advances. Antioxidants 2020, 9, 809. [Google Scholar] [CrossRef] [PubMed]
  63. Schweiger, R.; Maidel, A.M.; Renziehausen, T.; Schmidt-Schippers, R.; Müller, C. Effects of drought, subsequent waterlogging and redrying on growth, physiology and metabolism of wheat. Physiol. Plant. 2023, 175, e13874. [Google Scholar] [CrossRef] [PubMed]
  64. Mathur, S.; Agrawal, D.; Jajoo, A. Photosynthesis: Response to high temperature stress. J. Photochem. Photobiol. B Biol. 2014, 137, 116–126. [Google Scholar] [CrossRef]
  65. Gusain, S.; Joshi, S.; Joshi, R. Sensing, signalling, and regulatory mechanism of cold-stress tolerance in plants. Plant Physiol. Biochem. 2023, 197, 1076460. [Google Scholar] [CrossRef]
  66. Magaña Ugarte, R.; Hurtado Martínez, M.; Díaz-Santiago, E.; Pugnaire, F.I. Microbial controls on seed germination. Soil Biol. Biochem. 2024, 199, 109576. [Google Scholar] [CrossRef]
  67. Arana, M.V.; Gonzalez-Polo, M.; Martinez-Meier, A.; Gallo, L.A.; Benech-Arnold, R.L.; Sánchez, R.A.; Batlla, D. Seed dormancy responses to temperature relate to Nothofagus species distribution and determine temporal patterns of germination across altitudes in Patagonia. New Phytol. 2015, 209, 507–520. [Google Scholar] [CrossRef]
  68. Zhang, J.; Chen, L.; Sun, Y.; Xu, L.; Zhao, X.; Li, Q.; Zhang, D. Geothermal resource distribution and prospects for development and utilization in China. Nat. Gas Ind. B 2024, 11, 6–18. [Google Scholar] [CrossRef]
  69. Gao, X.; Lin, F.; Li, M.; Mei, Y.; Li, Y.; Bai, Y.; He, X.; Zheng, Y. Prediction of the potential distribution of a raspberry (Rubus idaeus) in China based on the MaxEnt model. Sci. Rep. 2024, 14, 24438. [Google Scholar] [CrossRef]
  70. Lenoir, J.; Svenning, J.C. Climate-related range shifts—A global multidimensional synthesis and new research directions. Ecography 2014, 38, 15–28. [Google Scholar] [CrossRef]
  71. Valladares, F.; Matesanz, S.; Guilhaumon, F.; Araújo, M.B.; Balaguer, L.; Benito-Garzón, M.; Cornwell, W.; Gianoli, E.; van Kleunen, M.; Naya, D.E.; et al. The effects of phenotypic plasticity and local adaptation on forecasts of species range shifts under climate change. Ecol. Lett. 2014, 17, 1351–1364. [Google Scholar] [CrossRef] [PubMed]
  72. Araújo, M.B.; Ferri-Yáñez, F.; Bozinovic, F.; Marquet, P.A.; Valladares, F.; Chown, S.L.; Sax, D. Heat freezes niche evolution. Ecol. Lett. 2013, 16, 1206–1219. [Google Scholar] [CrossRef] [PubMed]
  73. Prevéy, J.S.; Parker, L.E.; Harrington, C.A.; Lamb, C.T.; Proctor, M.F. Climate change shifts in habitat suitability and phenology of huckleberry (Vaccinium membranaceum). Agric. For. Meteorol. 2020, 280, 107803. [Google Scholar] [CrossRef]
  74. Allen, L.H.; Kakani, V.G.; Vu, J.C.V.; Boote, K.J. Elevated CO2 increases water use efficiency by sustaining photosynthesis of water-limited maize and sorghum. J. Plant Physiol. 2011, 168, 1909–1918. [Google Scholar] [CrossRef]
  75. Bernacchi, C.J.; Kimball, B.A.; Quarles, D.R.; Long, S.P.; Ort, D.R. Decreases in Stomatal Conductance of Soybean under Open-Air Elevation of [CO2] Are Closely Coupled with Decreases in Ecosystem Evapotranspiration. Plant Physiol. 2007, 143, 134–144. [Google Scholar] [CrossRef]
  76. Li, J.; Zhou, J.-M.; Duan, Z.-Q.; Du, C.-W.; Wang, H.-Y. Effect of CO2 Enrichment on the Growth and Nutrient Uptake of Tomato Seedlings. Pedosphere 2007, 17, 343–351. [Google Scholar] [CrossRef]
  77. Christin, P.A.; Osborne, C.P. The evolutionary ecology of C4 plants. New Phytol. 2014, 204, 765–781. [Google Scholar] [CrossRef]
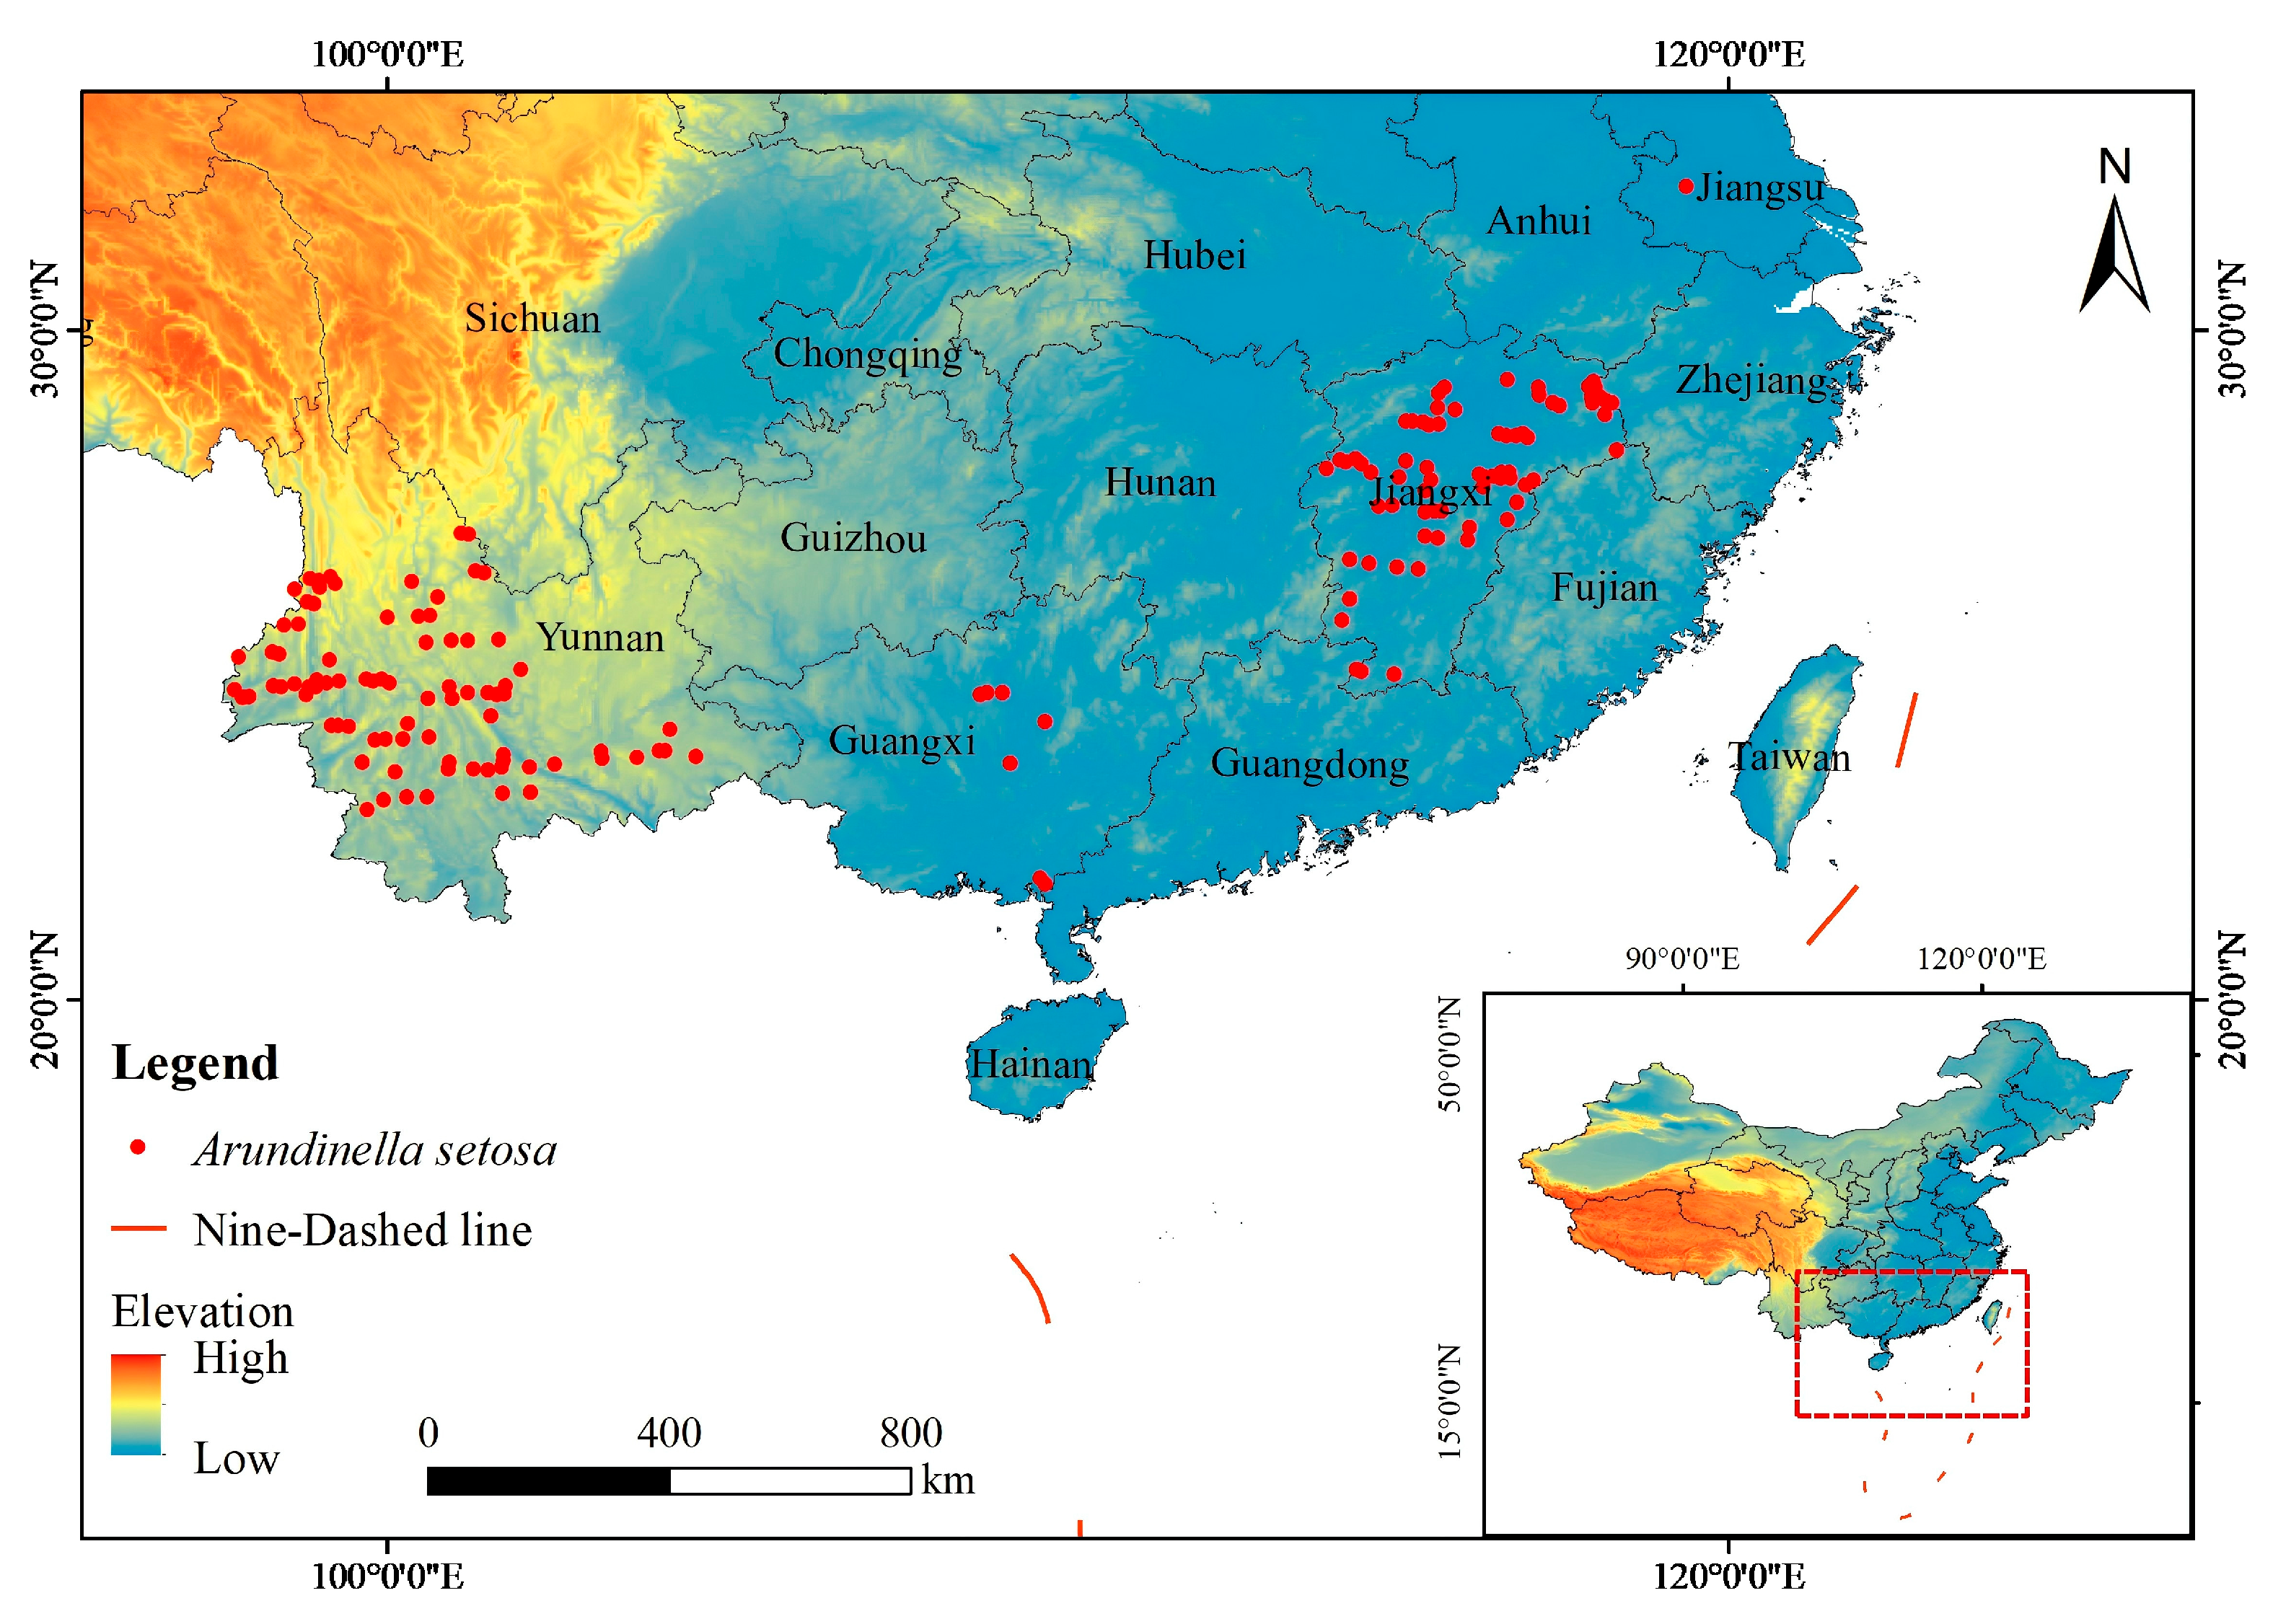
Figure 1. Distribution of occurrence points of A. setosa in China.
Sustainability 17 02664 g001
Figure 2. Adaptive distribution and current centroid of A. setosa under current climate conditions based on the MaxEnt model.
Sustainability 17 02664 g002
Figure 3. (a) Percentage contribution of environmental factors; (b) jackknife test for a single environmental variable.
Sustainability 17 02664 g003
Figure 4. Response curves of the main environmental factors.
Sustainability 17 02664 g004
Figure 5. Histogram of taxonomic changes in the aptitude zone of A. setosa in different periods.
Sustainability 17 02664 g005
Figure 6. Change in distribution area and migration of centroid in the adaptive distribution of A. setosa.
Sustainability 17 02664 g006
Figure 7. (a) Comparison chart of climate factor contribution rates; (b) comparison of contribution rates after removing the two environmental factors with the highest contribution rates.
Sustainability 17 02664 g007
Table 1. Initial environmental variables.
VariableDescription
BiO2 (°C)Mean Temperature Diurnal Range
BiO3 (%)Isothermality
BiO6 (°C)Min Temperature of Coldest Month
BiO15 (mm)Precipitation Seasonality
BiO17 (mm)Precipitation of Driest Quarter
T_USDA_TEX_CLASSTopsoil USDA Texture Classification
T_BS (%)Topsoil Base Saturation
T_CACO3 (%)Topsoil Calcium Carbonate
ELEV (m)Elevation
Disclaimer/Publisher’s Note: The statements, opinions and data contained in all publications are solely those of the individual author(s) and contributor(s) and not of MDPI and/or the editor(s). MDPI and/or the editor(s) disclaim responsibility for any injury to people or property resulting from any ideas, methods, instructions or products referred to in the content.