Article

Sustainable Comfort Design in Underground Shopping Malls: A User-Centric Analysis of Spatial Features

1
Research Center for Underground Space, Army Engineering University of PLA, Nanjing 210007, China
2
College of Civil Engineering and Architecture, Huanghuai University, Zhumadian 463000, China
*
Author to whom correspondence should be addressed.
Sustainability 2025, 17(6), 2717; https://doi.org/10.3390/su17062717
Submission received: 19 February 2025 / Revised: 15 March 2025 / Accepted: 17 March 2025 / Published: 19 March 2025
(This article belongs to the Section Sustainable Urban and Rural Development)

Abstract

:
The expansion of urban underground spaces has broadened the range of urban activities by accommodating functions such as transportation, retail, and entertainment. Underground shopping malls (USMs) have been widely developed as a sustainable strategy to expand urban space capacity, alleviate surface congestion, and optimize land-use efficiency. However, the development and utilization of USMs often neglect user-centered evaluations, risking mismatches between design outcomes and long-term sustainability goals such as energy efficiency, user retention, and spatial adaptability. Therefore, this study analyzes 12 typical USMs in Nanjing, China, based on environmental psychology principles, employing mixed-methods research that combines objective measurements of spatial elements with subjective user perception surveys to establish a regression model investigating correlations between USM spatial–physical environments and user comfort perception. The results show that users generally have a positive impression of the current underground environment, but there are significant differences in their subjective perceptions of the different attributes of the USMs. The USMs present a trend of humanization, human culture, and landscape in terms of spatial characteristics. These improvements are critical for fostering long-term sustainable use by minimizing vacancy rates and retrofitting needs. The findings reveal that the human-centric comfort level of the USMs is largely determined by multi-dimensional architecture-space features, as well as personal and social activity level features. Building on these insights, we propose actionable strategies to advance sustainable USM design, prioritizing adaptive reuse, energy-efficient layouts, and culturally resonant esthetics. This work clarifies the direction of USM design optimization and improvement from the perspective of users’ subjective perception and provides a theoretical foundation for aligning underground development with global sustainability frameworks like the UN SDGs.

1. Introduction

With the continuous growth of urban populations and the increasing scarcity of land, urban underground space (UUS) has emerged as a strategic resource for sustainable urban development [1,2]. UUS offers several advantages, including proximity to city centers, minimal impact on urban landscapes, and design flexibility unimpeded by topography or existing infrastructure [3]. Additionally, UUS directly addresses critical sustainability environmental challenges such as noise, air pollution, and the lack of green spaces. Critically, the utilization of UUS not only extends the spatial footprint of cities [4] but also facilitates the diversification and integration of urban functions [5], thereby significantly enhancing the overall quality of urban life [6]. The scope of UUS is expanding, incorporating various facets of urban living [7,8,9] as residents increasingly rely on these spaces for convenient transportation, diverse commercial and cultural activities, and relief from urban congestion and environmental stress.
Underground shopping malls (USMs) serve as convenient destinations for shopping and leisure, enhancing consumer experiences and revitalizing urban commerce [10]. They are among the most active forms of UUS, accommodating shoppers, commuters, and employees. As Gu et al. [11] observed, the significant volume of users and dynamic pedestrian flows in USMs foster constant interaction between individuals and their surroundings. Compared to other underground facilities, such as transportation hubs, USM users engage more frequently and intricately with their environment, leading to heightened user perception and increasingly refined design requirements. A pleasant, comfortable environment can improve public acceptance and foster loyalty to USMs, as noted by Vilnai-Yavetz et al. [12].
However, in the past, users’ overall impression of the underground environment was generally negative [13]. This may be the outcome of the inherent isolation of underground spaces from the surface environment, particularly with regard to natural lighting and ventilation, and necessitates attention to cultural and psychological considerations [14]. As a result, visitors to UUS may experience feelings of depression, unfamiliarity, or alienation [15,16,17]. Thus, the creation of high-quality, human-centered underground environments that address the physical and psychological needs of users is essential [18]. Scholars in architecture and urban design have emphasized the importance of encouraging urban residents to embrace underground spaces [19,20], advocating for innovative strategies to improve the spatial quality of these environments. This includes designing safe, distinctive, and engaging underground spaces that promote comfort and well-being [21]. The completed underground project has made significant progress and efforts, but users’ impressions still need to be investigated.
The underground space environment includes the physical environment, such as sound, light, heat, humidity, and air cleanliness inside the underground space, as well as the psychological environment, which includes the sense of security and comfort affected by the internal space form, scale, material texture, and color. Wang et al. [22] suggested that users’ demand for comfort should be satisfied by controlling the internal environment and applying humanized design. Numerous studies have focused on improving the comfort of USMs in terms of the physical environment, such as air quality [23], vertical evacuation strategies [24], soundscapes [25], lighting environment [26,27,28], and heating [27,28,29], as well as relevant methods for their analysis and evaluation. Psychological aspects encompass all elements related to the user’s experience of a space [19]. Han et al. [30] suggested that services, the underground environment, and public facilities should be prioritized when designing USMs to ensure user satisfaction with their experience. Similarly, other researchers have determined that the spatial characteristics of a USM influence individuals’ perceptions and behaviors [31], as do personal characteristics [32]. Notable spatial characteristics include forms such as shape, size, and proportion [21,33]; configuration aspects such as connectivity and accessibility within the facility [34,35,36] and its connection to the outside world [37]; and interior design patterns comprising color, texture, skylights, artificial lighting, visual information systems, artistic elements, etc. [19,21,38,39].
While this previous research has provided insights into the underground space environment, notable limitations remain in this body of work. First, most of the earlier studies on the impression of underground space focused on qualitative analysis. Carmody and Sterling [40] discussed design strategies to alleviate the negative psychological and physiological effects of underground space, and Lee et al. [13,14] discussed various social and psychological aspects of underground space. Some scholars have explored the evaluation of underground space from the user’s perspective [22,41], but the research is less involved in the field of psychology. Second, while previous studies have provided detailed analyses of specific aspects of the underground environment, such as lighting [42], acoustics [33], and wayfinding [43,44,45,46], they have not conducted comprehensive evaluations of these aspects together. Lastly, previous research has not connected the objective characteristics of underground spaces with the subjective experiences of their users and has not considered strategic improvements to increase comfort from the user’s perspective. To address these gaps, this study accordingly sought to answer three key questions: (1) What is user perception in the USMs? (2) What is the relationship between USM users’ subjective perception and its spatial objective characteristics? (3) What is the direction of USM design optimization improvement?
This study uses classic urban design and psychological theories to explore approaches for creating more comfortable, human-centered, and high-quality environments in USMs. The semantic differential (SD) method, combined with social science techniques, was deployed to conduct a quantitative comprehensive analysis, investigating how spatial characteristics influence user perceptions of their environment. This approach provides a balanced understanding of the relationship between spatial characteristics and user perceptions in USMs. The results identified problems with existing USMs and can support decision makers and designers in enhancing existing USMs or developing new, more comfortable USMs.

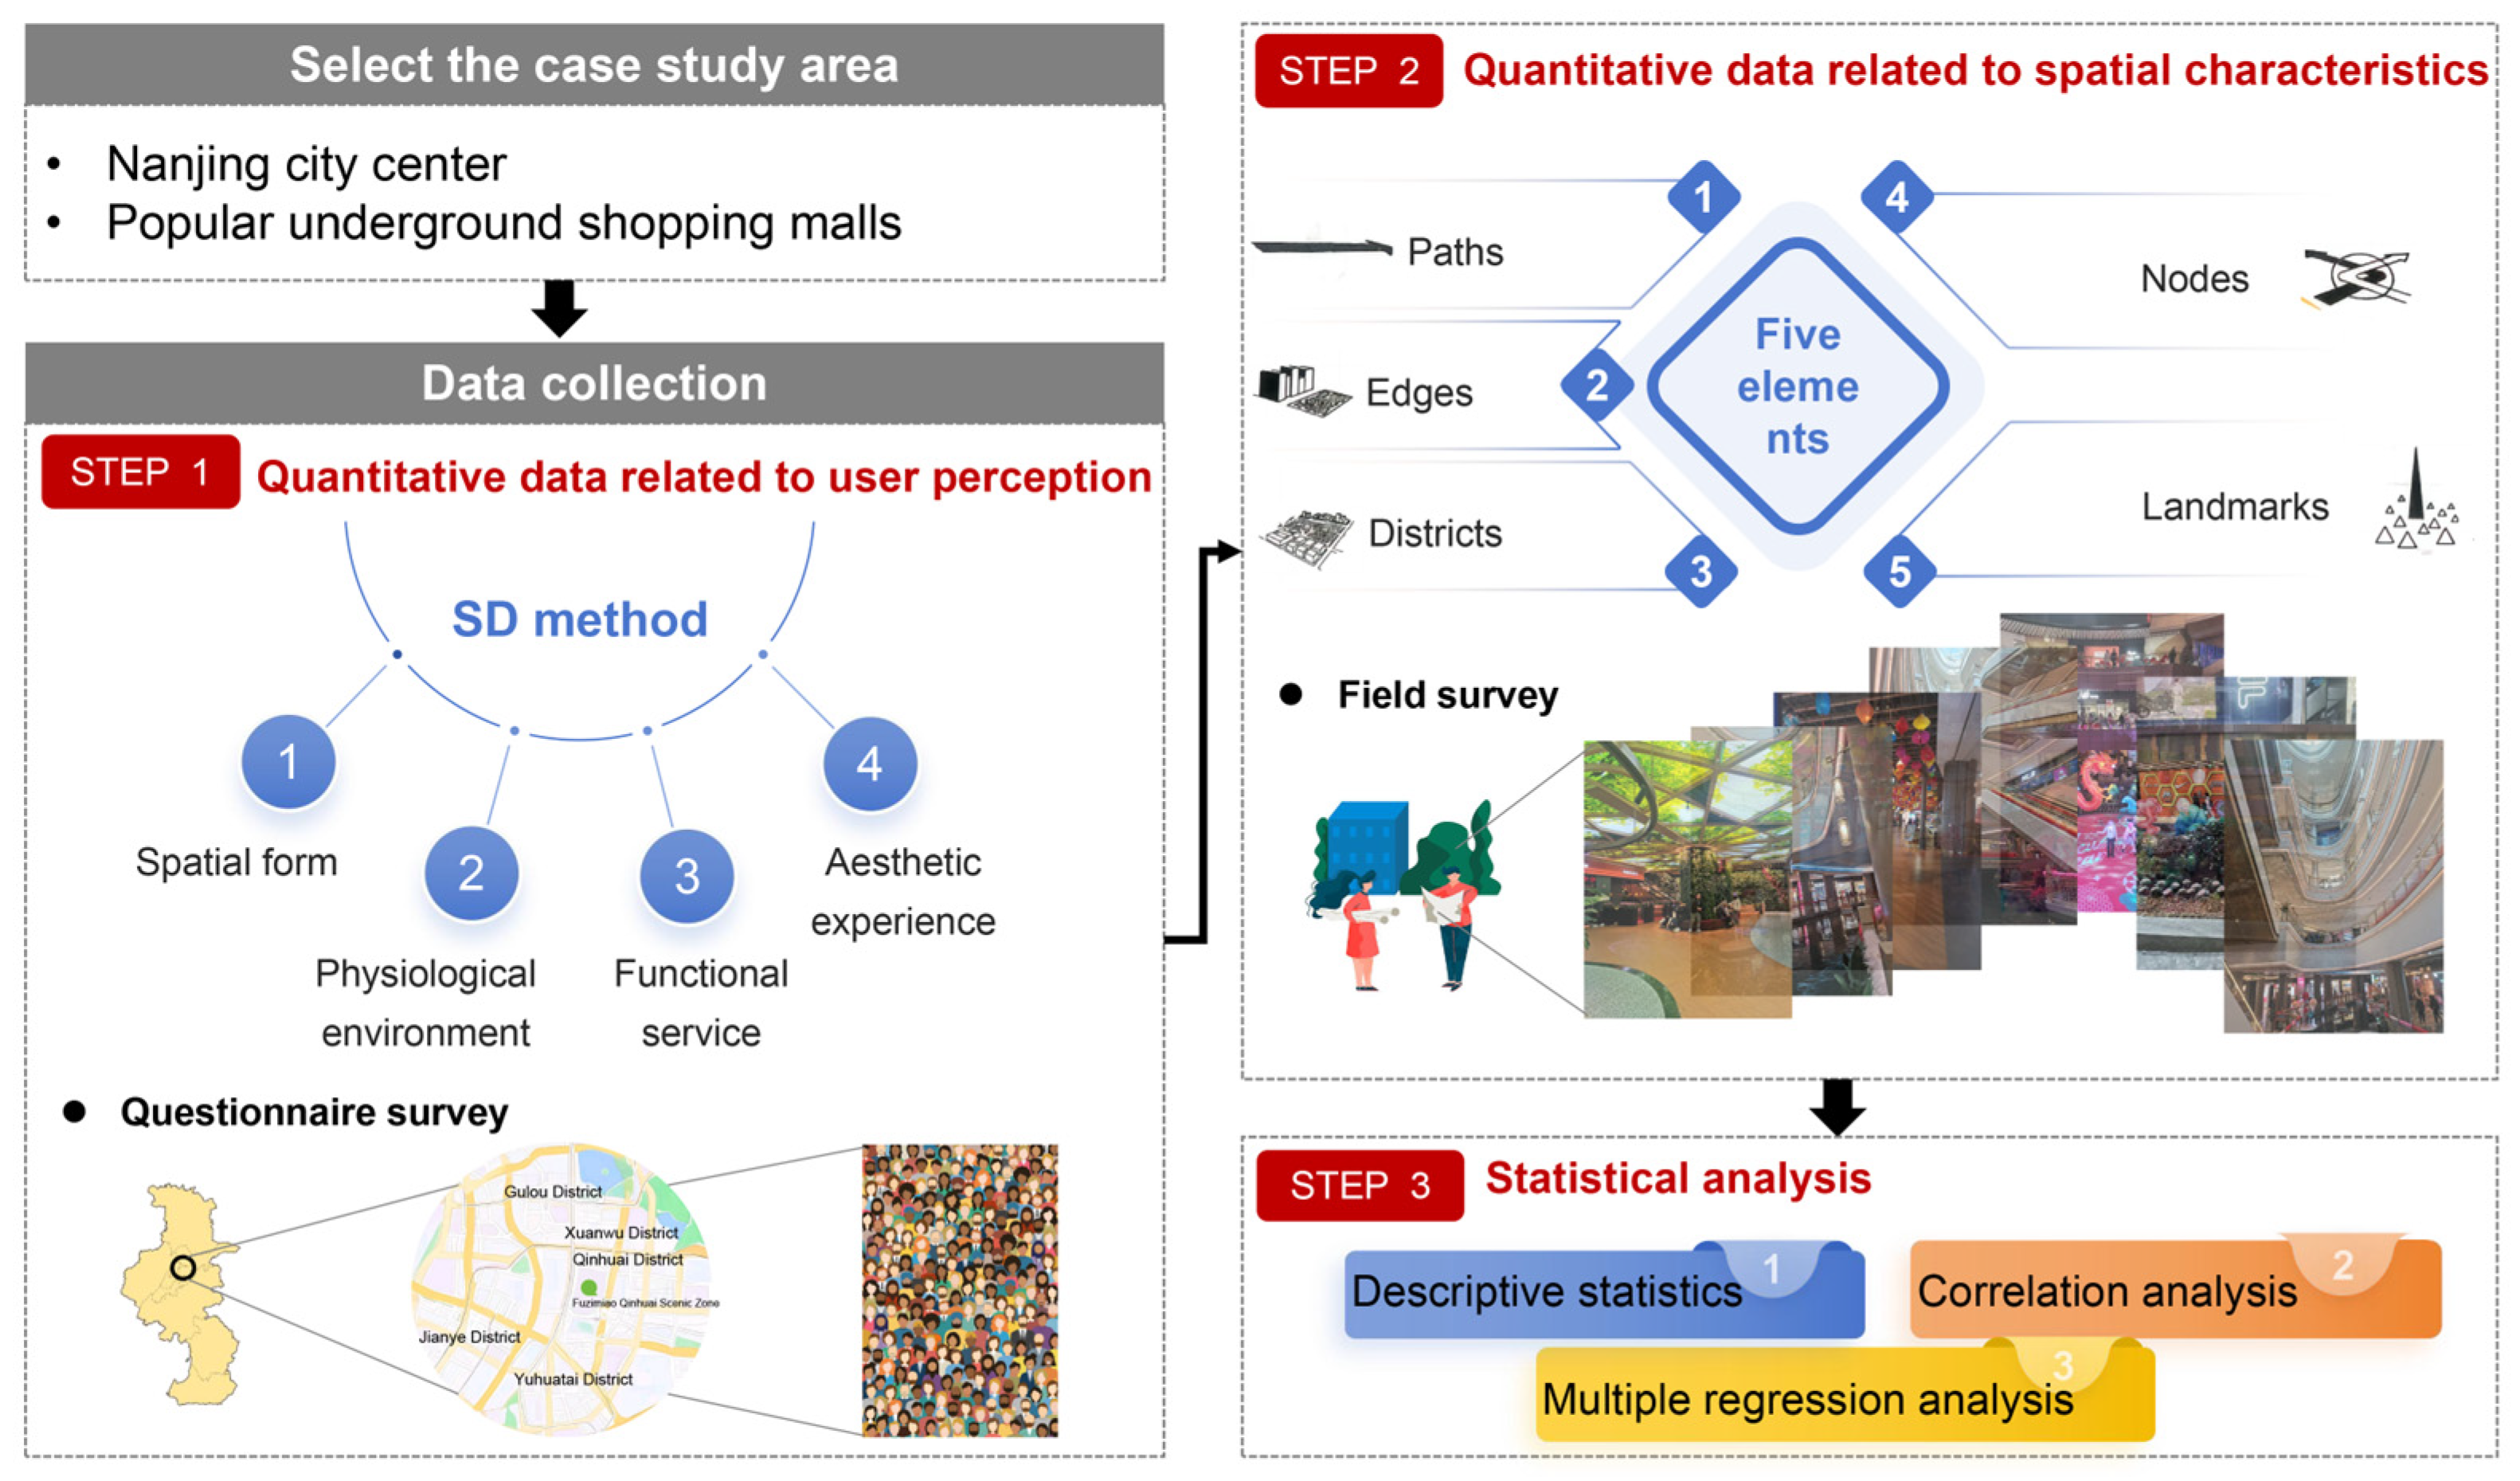
2. Materials and Methods

This study conducted a case study of USMs in Nanjing, one of China’s leading cities in UUS development [47], with numerous USMs located in its central urban districts. We used Python 3.9.9 to scrape data from major consumer review websites in China to identify 15 popular USMs in five central urban districts of Nanjing. After removing malls with insufficient underground space, we considered various factors such as types, features, functions, popularity, and feasibility, ultimately selecting 12 popular USMs as the research samples [41]: Deji Plaza (DJ), Xinbai (XB), Central Emporium (CE), Fashion Laidi (LD), Wanxiang Tiandi (WXTD), Jianye Wuyue Plaza (JYWY), Aqua City (AC), Huacai Tiandi (HCTD), Hongyue City (HYC), Yuhua Living Room (YH), Gu Lou Wuyue Plaza (GLWY), and Zhujiang Road Golden Eagle (GE) (Figure 1). The word cloud map shown in Figure 2 is based on the frequency of each related word on the consumer review website. These USMs differ in terms of geographical location, scale, year of construction, and design style.
We utilized quantitative methods to collect and analyze the data, following the three primary steps outlined in this section and illustrated in Figure 3.

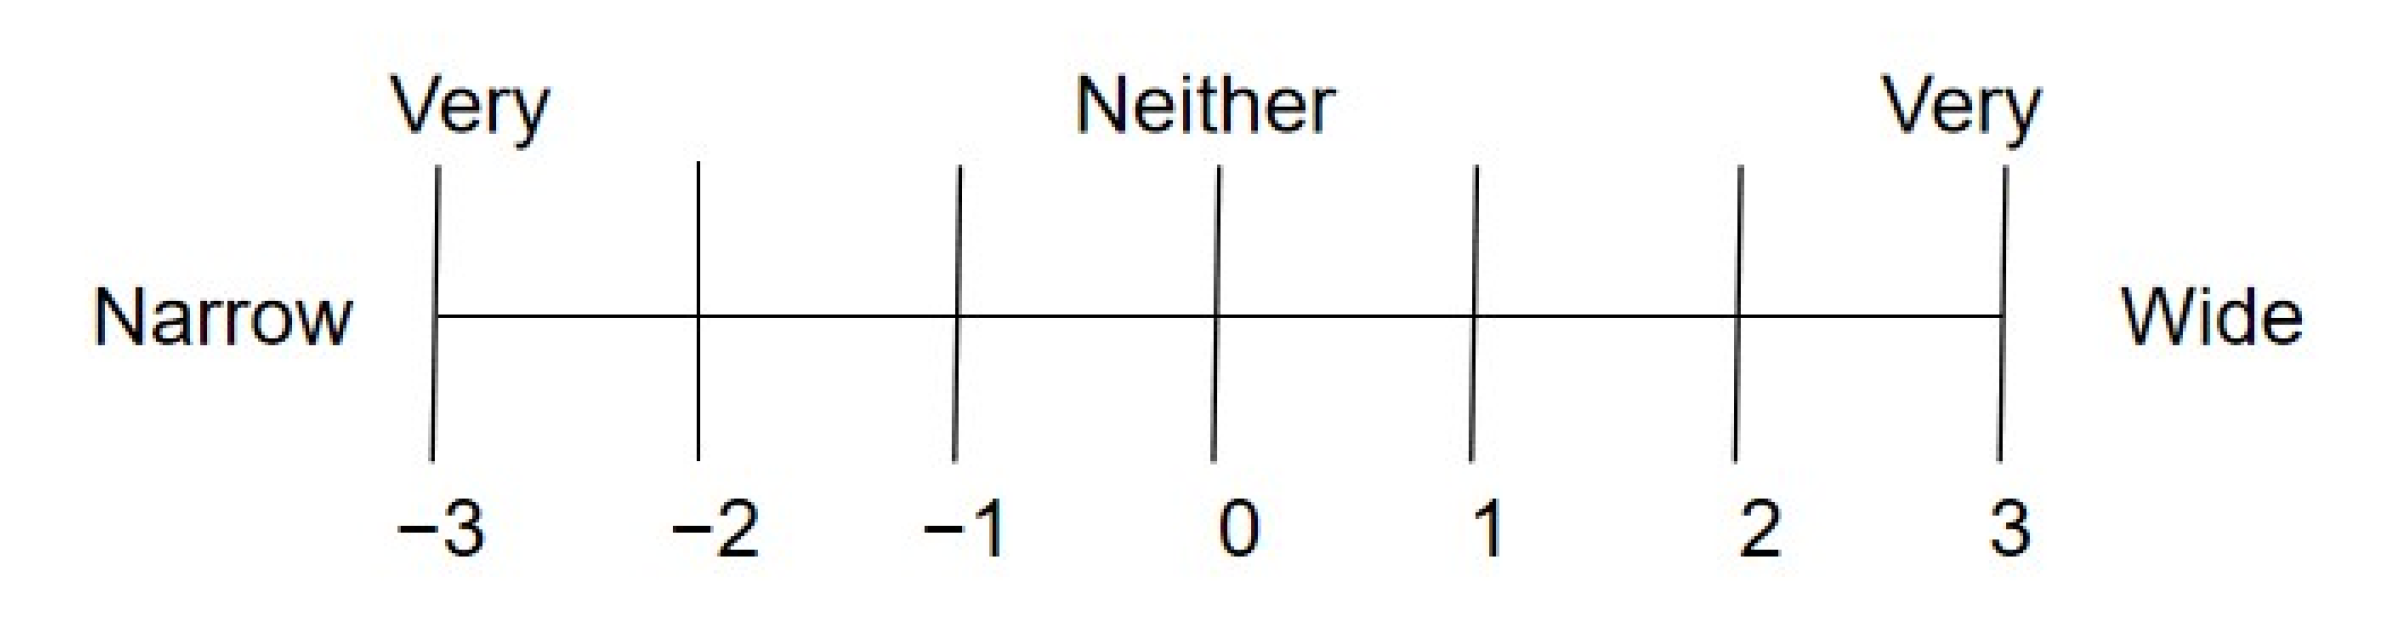
2.1. Step 1: Collection of Quantitative Data Related to User Perception

In the first step, we created a user perception database for each selected USM utilizing the SD method [48], a psychological measurement method proposed by Osgood [49] and designed to evaluate semantic scales through psychological experiments [50]. This method has been extensively employed to obtain user perception data across various spatial environments and inform spatial design accordingly [51,52]. However, there is heterogeneity inherent in the SD method, including scale selection variability, cultural and contextual bias [53], and response style variability. The emphasis of the SD method is on considering existing environmental information to determine the factor axis and setting the representative scale of the factor axis. Firstly, according to the psychological interview framework proposed by Durmisevic and Sarıyıldız [19,54] as well as the criteria for evaluating underground space quality [55], four categories of data were established: spatial form, physiological environment, functional service, and aesthetic experience. Secondly, 19 perceptually significant attributes were chosen as factor axes selected based on a systematic review of prior SD studies in the perception of urban spaces and word data on the consumer review website to ensure conceptual alignment. Subsequently, 19 pairs of adjectives with clearly opposite meanings were selected to serve as representative scales for these axes (Table 1). We validated these pairs through a pilot study (N = 30) in collaboration with regional experts to confirm clarity and relevance. Finally, the evaluation scale for each factor axis was divided into seven levels ranging from −3 (strongly negative) to +3 (strongly positive), with 0 representing a neutral midpoint to meet the statistical requirements (Figure 4). This approach aligns with standardized SD scoring protocols, where mean scores >1.0 reflect statistically significant positive perceptions. We conducted exploratory factor analysis (EFA) to identify and remove cross-loaded or low-variance items, ensuring unidimensionality of scales. Cronbach’s alpha values (α > 0.85) indicated high internal consistency.
A pilot study was conducted prior to the primary investigation to assess the reliability and validity of the research method. This preliminary study was carried out across seven USMs and yielded 47 valid questionnaires (n = 47). Response reliability was evaluated using the internal consistency method, resulting in a high-reliability score with a Cronbach’s alpha of 0.935. A validity test was also performed to analyze the test resolution process, identifying any omissions, errors, or questionnaire elements that respondents found unclear or confusing. Based on these findings, minor revisions were made to the questionnaire content.
Following this, user experience data were collected through a targeted questionnaire survey of randomly selected individuals visiting the 12 identified USMs between 19 and 29 January 2024, from 09:00 to 22:00, spanning all days of the week (Monday to Sunday). Slovin’s formula [56] was used to determine the minimum number of respondents (n) to render this study statistically valid:
n = N 1 + N e 2
The total effective population size (N) in this study was 18,500 (data extracted from the China Shopping Center Annual Report). The sample error (e) was 0.05. Accordingly, the resulting sample size (n) was 392 respondents. This survey sampled 492 respondents, with 461 valid questionnaires obtained (n = 461). Prior to starting this study, we obtained all necessary ethical approval from the institutional review board.

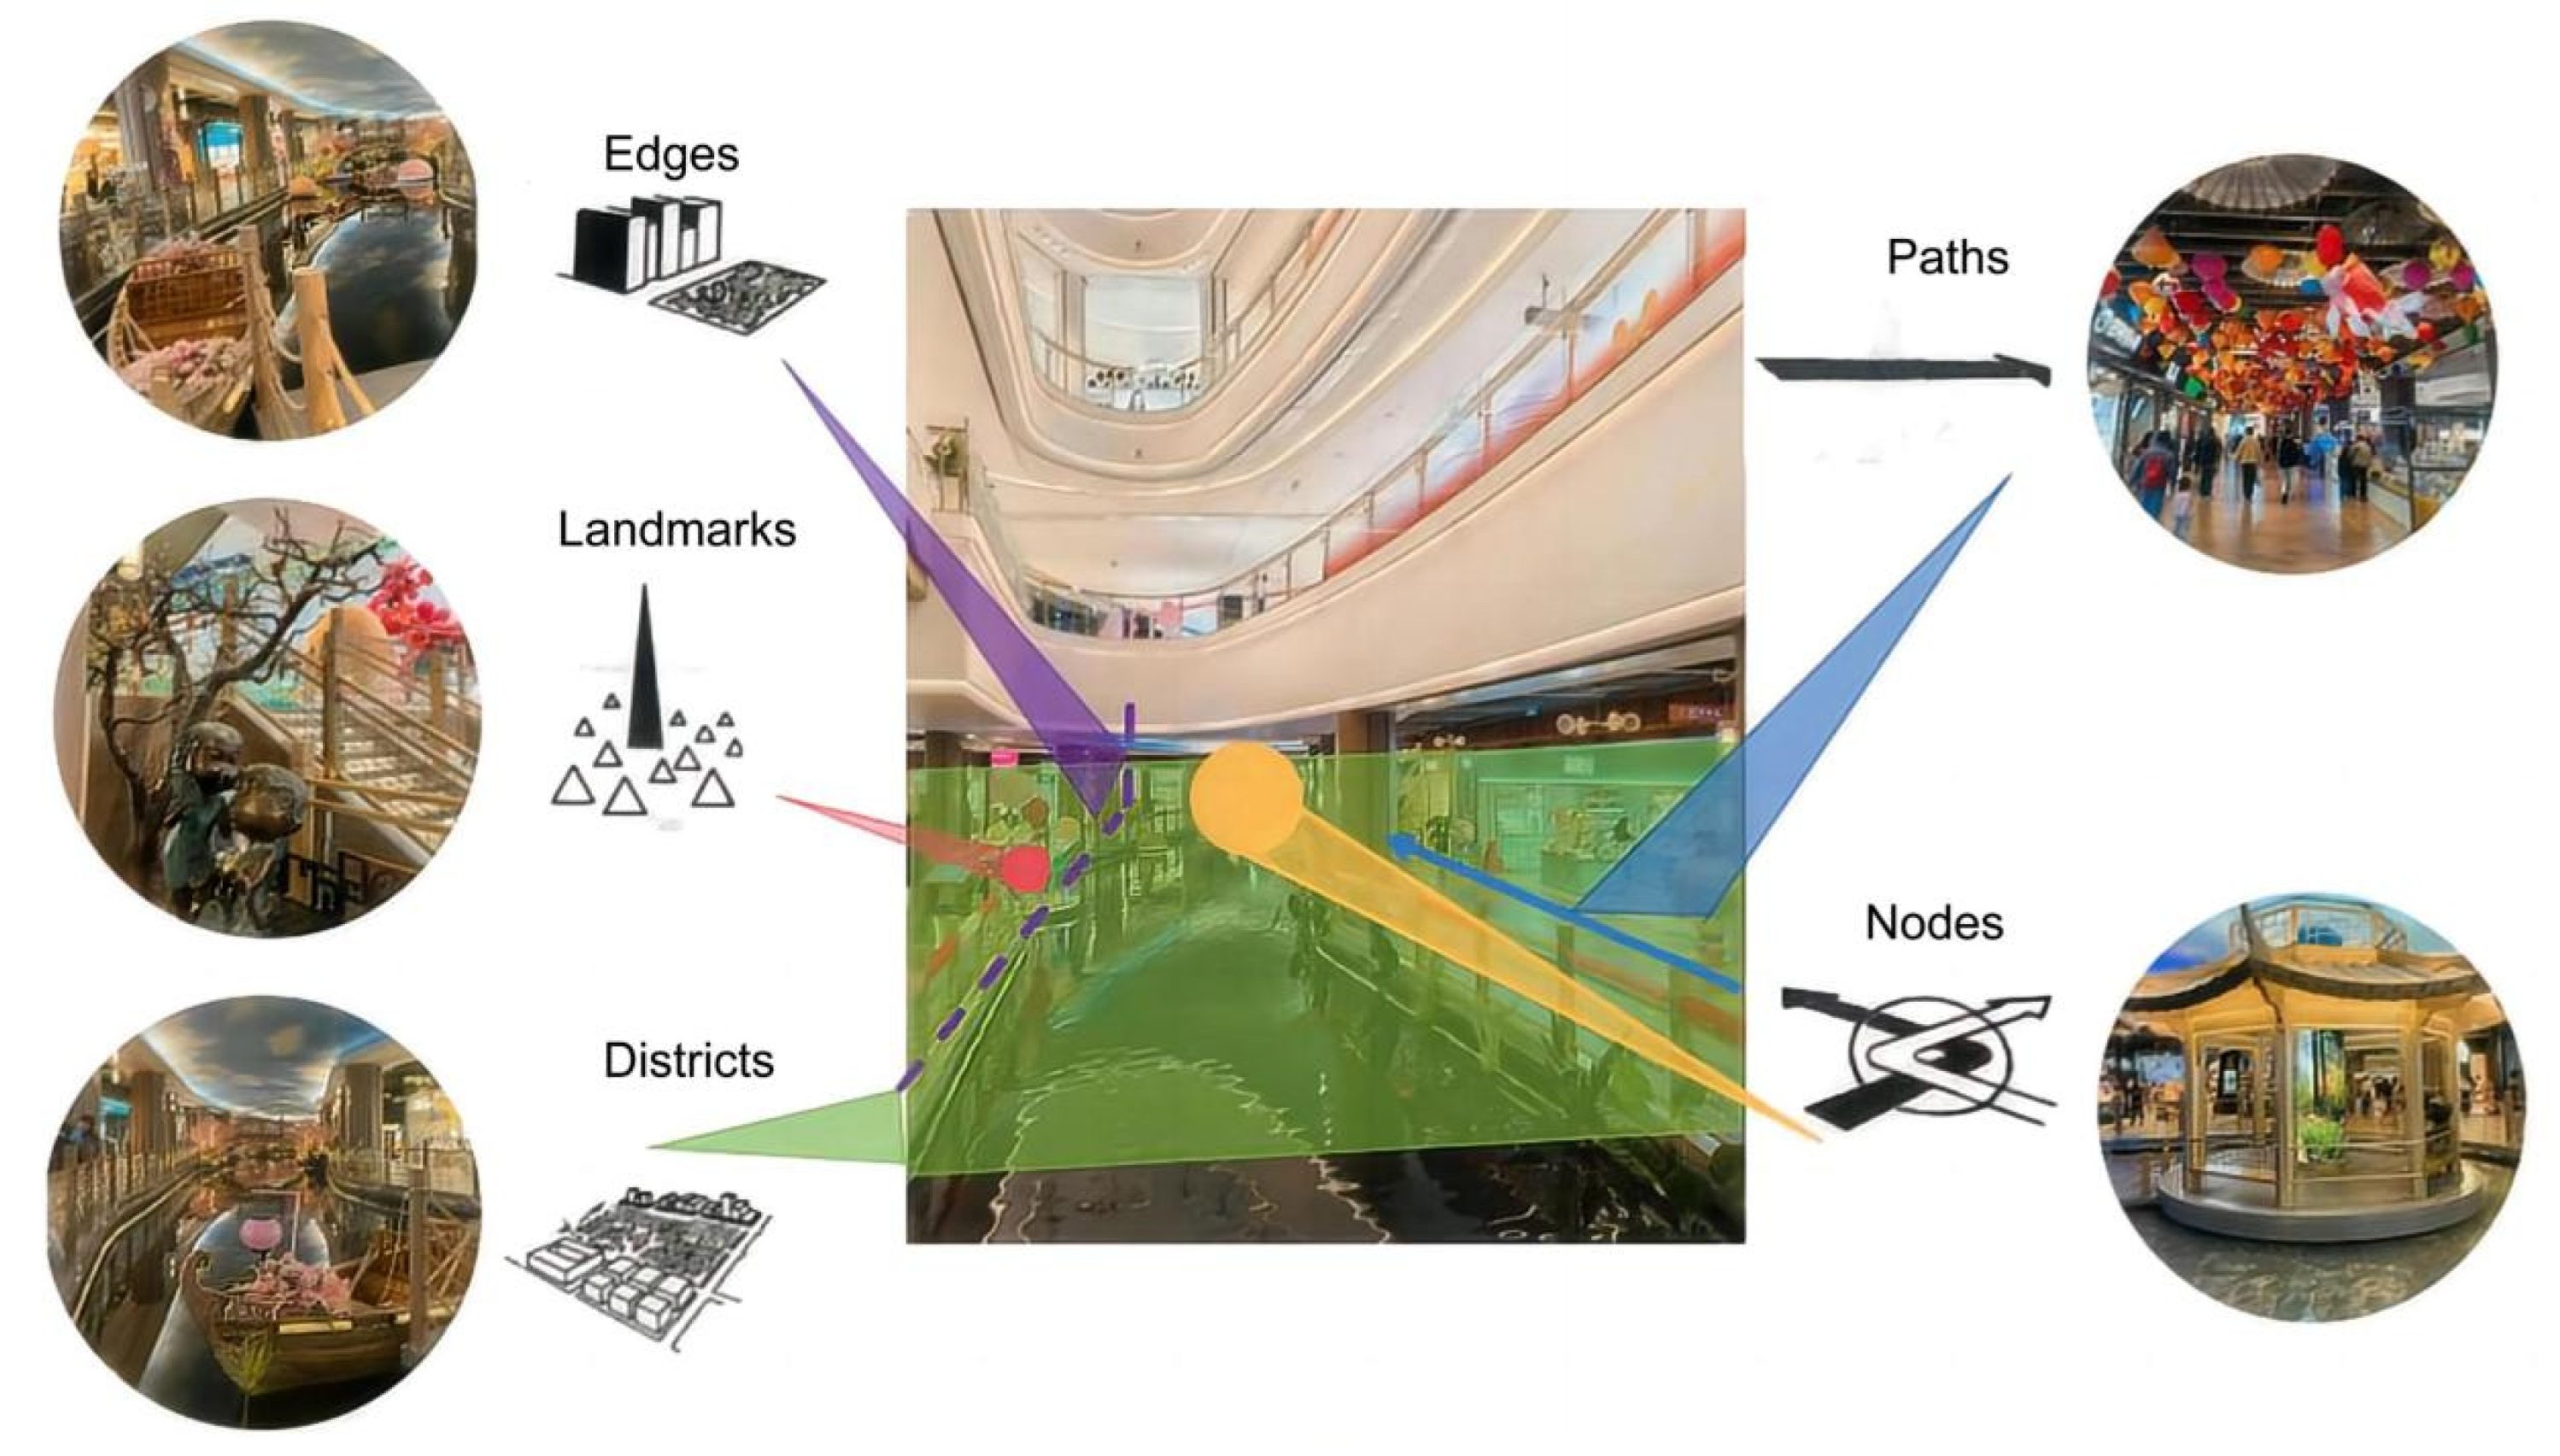
2.2. Step 2: Collection of Quantitative Data Related to Spatial Characteristics

In the second step of this study, we classified the USMs and compiled a database of their spatial characteristics. This approach draws on Lynch’s influential theories on urban environmental quality [57]. The image of urban space, including underground environments, is continuously shaped by the interaction between spatial form and societal needs. It is this dynamic collision that generates contradictions within the image of UUSs, which are continuously adjusted to meet evolving social demands for underground environments. UUS, as an inevitable aspect of urban development, is not merely a physical entity but is also imbued with the quality of a “perceivable experience” by the city. Thus, urban design methods can be applied to shape the intention and design of underground spaces. Lynch identified five key elements of the city image: nodes, landmarks, paths, edges, and districts. We adapted these elements to the context of USMs by extending them to fit the underground spatial scale (Figure 5) and defining the content for each element within our study area (Table 2).
For paths (Figure 6), user movement was analyzed based on the form, length, and aspect ratio of the primary passageways, which informed the architectural configurations across different areas. For edges, linear elements demarcating different functional areas within the commercial space were evaluated for their organizational and visual characteristics, including material, color, and lighting at various interfaces. For districts, the systems designed to help users orient themselves within the USM were primarily assessed based on their ability to differentiate functional areas. Landmarks, which serve as distinct and identifiable reference points, were studied in terms of natural interior features, casual seating, artistic elements, and signage. Finally, nodes, entry points, and common areas where daily interactions occur—such as entrances, atriums, and traditional or sunken plazas—were examined. All data were collected through site visits; the survey record form is shown in Supplementary Materials File S1. The descriptive characteristics of each USM were quantitatively coded for subsequent analysis according to the criteria shown in Table 3.

2.3. Step 3: Statistical Analysis

In the third step, statistical analyses were conducted on the user experience and spatial feature data of the USMs using correlation and multiple regression techniques. The dependent variable was the average score of each user’s rating in response to questions about their perceptions of environmental comfort. The independent variables included the spatial characteristics of the USM, along with additional factors that could influence the user experience. These factors primarily consisted of the respondent’s individual characteristics (gender and age) and social activity level (frequency of visits, method of orientation, method of entrance, day, and time of interview) within the USMs. All statistical analyses were conducted using the R programming language 4.4.2.

3. Results

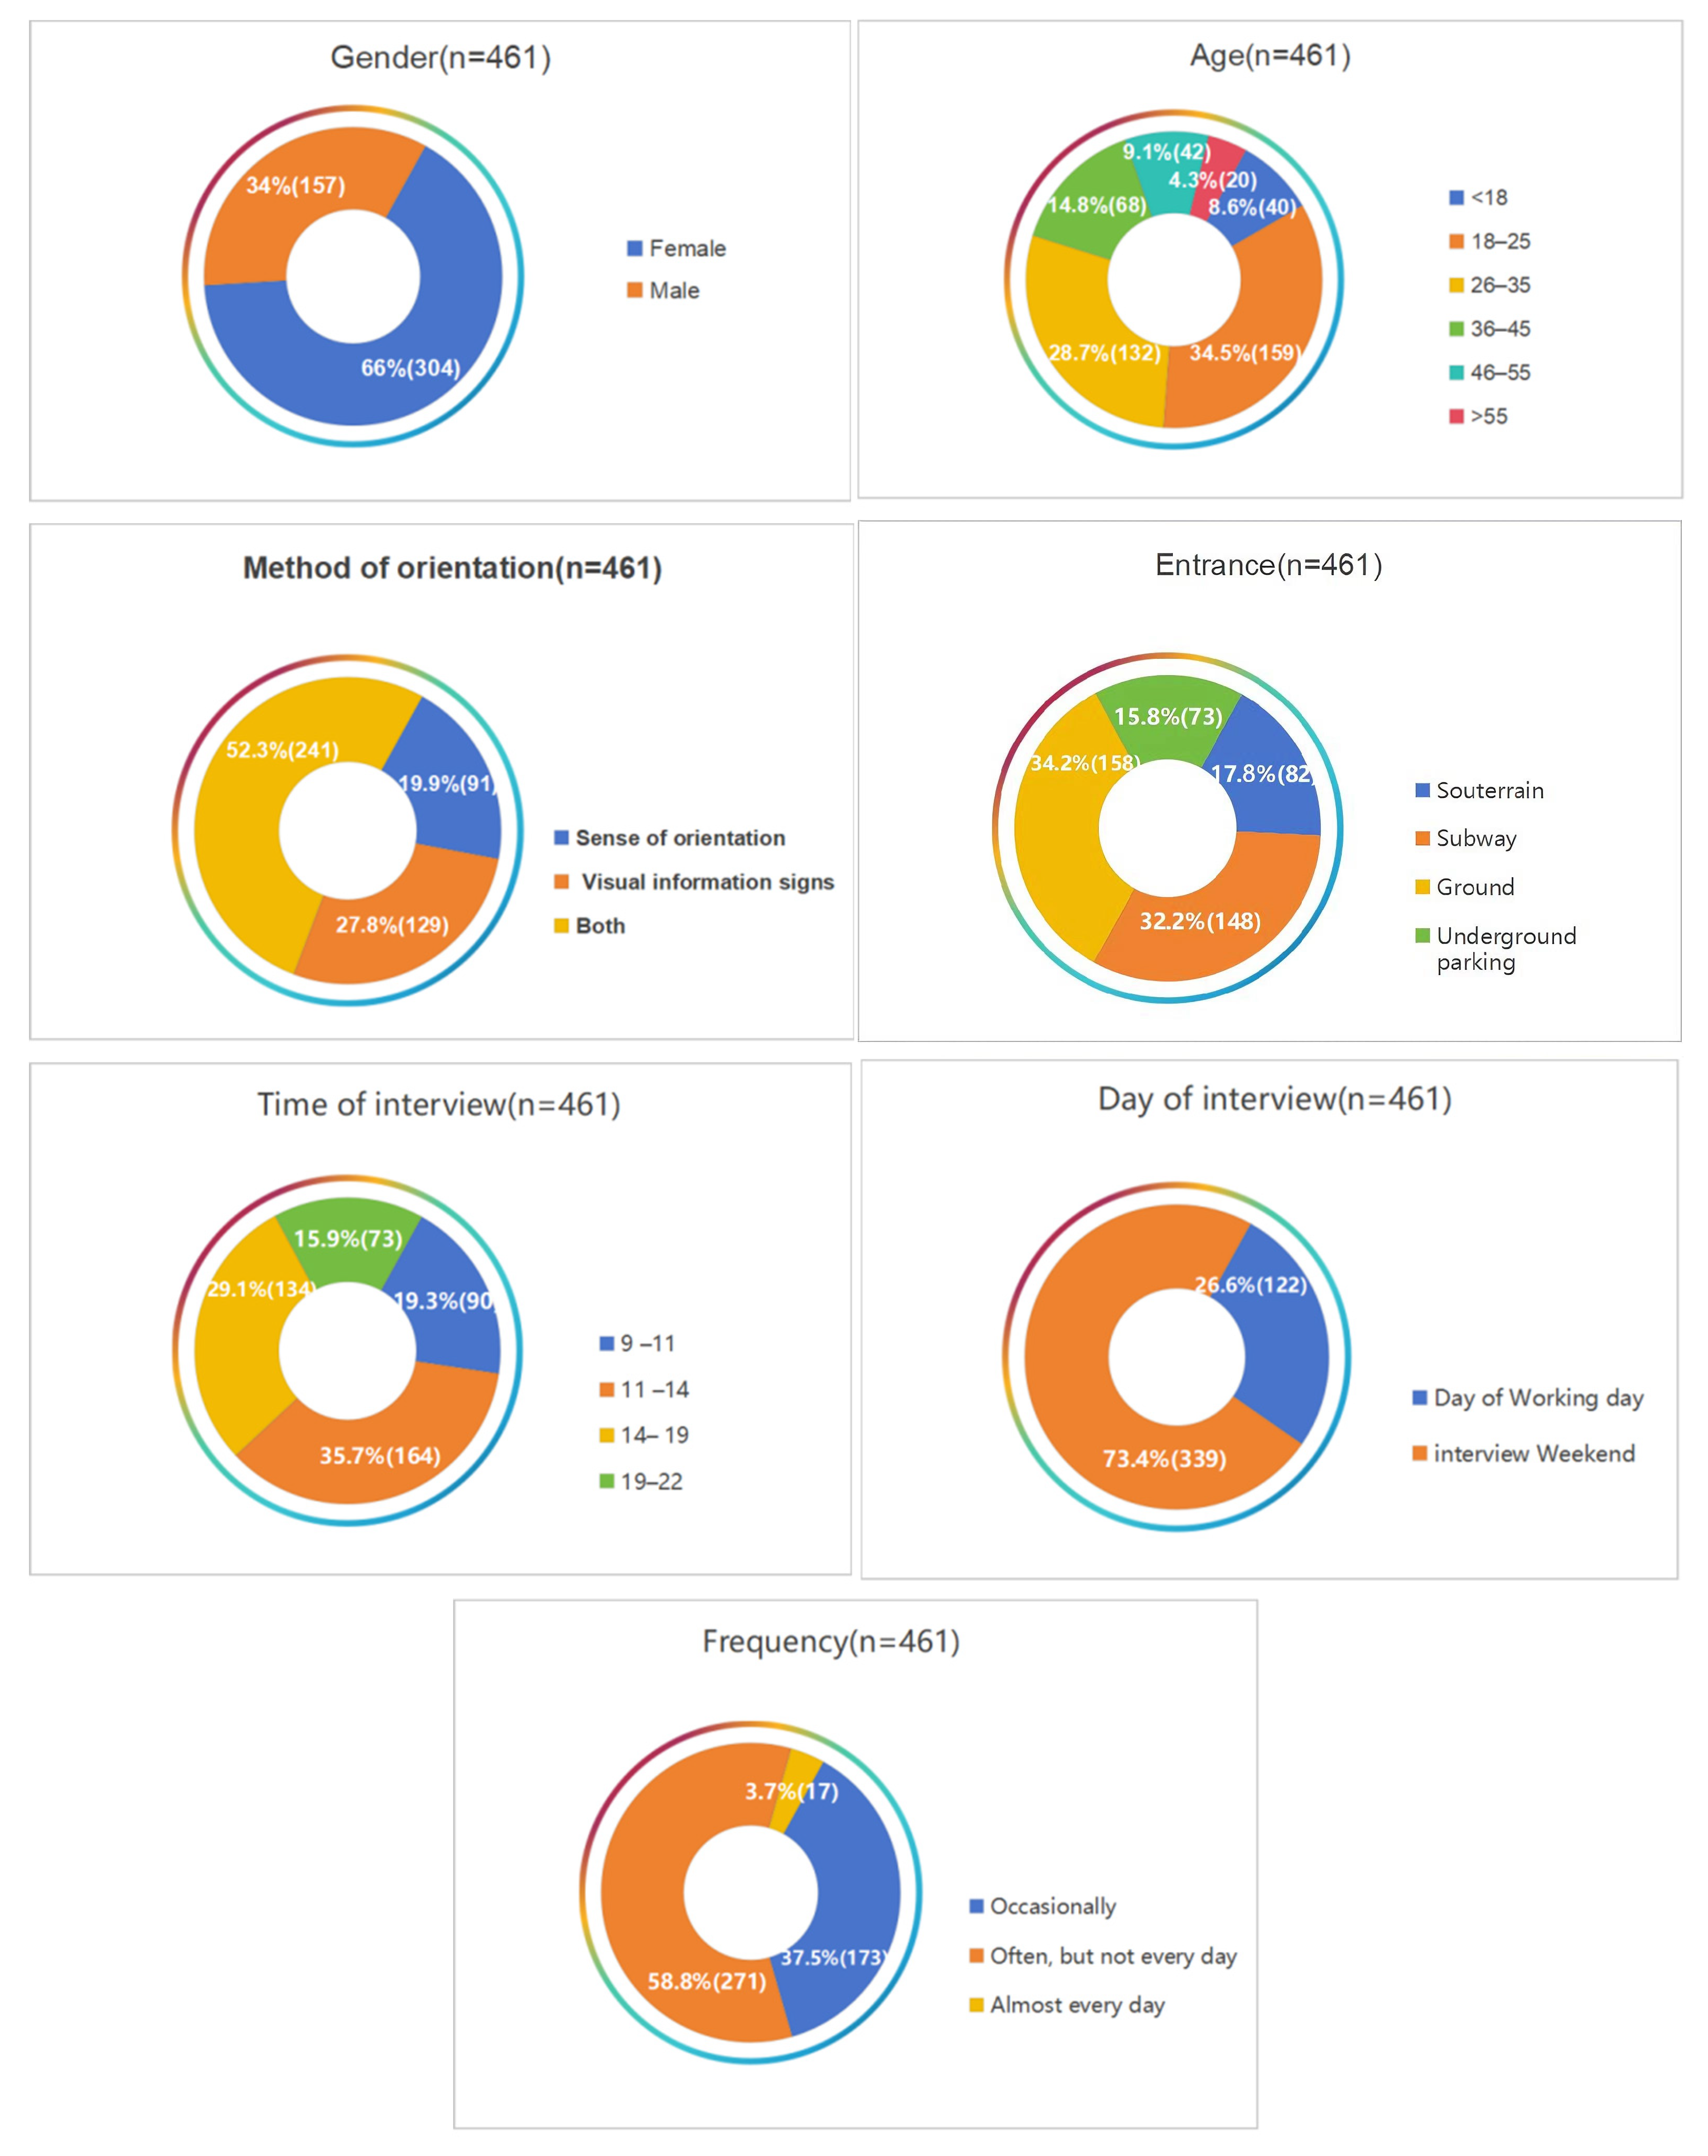
3.1. Individual Characteristics, Social Activity Levels, and SD Evaluation Levels

The individual characteristics and social activity levels of the USM users who responded to the questionnaire are shown in Figure 7. Among the respondents (n = 461), a higher response rate was observed among women (66%) than men (34%). The primary user group consisted of individuals aged 18–25 (34.5%), followed by those aged 26–35 (28.7%), which aligns with the age distribution of users in related studies [20,22]. Most respondents were familiar with the USMs in which they were interviewed. The majority entered the USM either from the subway (32.2%) or ground level (34.2%), and a significant portion (80.1%) relied on the signage system for navigation.
User ratings for each USM revealed varying levels of satisfaction across different attributes, reflecting the SD evaluation levels of the USMs. As shown in Figure 8, the three USMs with the highest average SD scores are Aqua City (1.47), Jianye Wuyue Plaza (1.38), and Deji Plaza (1.31). Compared to previous negative impressions, users generally have a positive attitude toward the current underground environment. A statistical analysis of the average scores for the USM evaluations (Figure 9) indicated significant fluctuations in the curves representing the quantitative evaluation of spatial perceptions. This variability arose from two main factors: differences in respondents’ evaluations of the various USMs and differences in their evaluations of the perceptual attributes. These variations were influenced by the unique characteristics of each USM, corroborating the feasibility of a diverse and differentiated sampling method. Consequently, these evaluation factors were confirmed to effectively capture the distinctive characteristics and shortcomings of each USM.

3.2. Architectural Spatial Characteristics

On the whole, USMs show a trend toward humanization, human culture, and landscape in their spatial characteristics. The spatial feature data for the USMs reflect the diversity of the samples (Table 3). In terms of paths (Figure 10a,b), the prevalence of annular layouts (41.7%) underscores their effectiveness in reducing cognitive load through continuous visual references (e.g., curved corridors with repetitive landmarks), which aligns with wayfinding studies [60]. Conversely, radial layouts (25%) prioritize direct access to key nodes (e.g., exits, retail hubs) but risk disorientation in complex junctions. The mixed-type paths (33%) reconcile these trade-offs by integrating annular segments for orientation stability and radial branches for functional efficiency, a common hybrid strategy increasingly adopted in high-traffic underground environments. Together, these ratios reflect a deliberate balance: annular paths dominate to enhance intuitive navigation, while radial and mixed designs address context-specific demands (e.g., emergency egress, commercial clustering). Regarding edges, 75% of USMs used materials and decorations with prominent colors, while 83% employed varied lighting methods to distinguish regions.
In terms of nodes, 75% of USM entrances featured complex layouts, offering options for vertical entry from the first floor of a shopping mall or underground parking facility, or horizontal entry through a sunken square or connected subway station (Figure 10h). Additionally, the interconnected pedestrian networks found in 16.7% of the USMs reflect a systematic approach to urban underground planning, where multiple commercial zones are linked through subterranean walkways (e.g., DJ, XB, CE, and LD) (Figure 10f). The presence of irregularly planned atriums in most USMs (Figure 10d,e) adds a significant architectural feature that not only serves as a central gathering space but also breaks the monotony of underground environments.
For landmarks, the use of natural elements, particularly water features and plant life, plays a critical role in creating a sense of biophilic design, which is essential for enhancing user comfort and psychological well-being in underground spaces. The winding artificial water system in AC and the recreation of Nanjing’s Qinhuai River in JYWY are examples of how designers aim to introduce elements of the natural world into otherwise confined, artificial environments. However, only 30% of USMs offered adequate casual seating (more than five locations). Half of the USMs displayed a wide variety of artistic elements, which included sculptures (JYWY), artistic lighting (WXTD and AC), wall reliefs and columns with local characteristics (GLWY), and underwater worlds (YL).

3.3. Multivariate Statistical Analysis

3.3.1. Correlation Between User Perceptions and Architectural Spatial Characteristics

A Pearson’s correlation analysis was conducted between the SD perception data and the spatial characteristics of the USMs. To assess normality, we normalized the data set using z-scores to mitigate dimensional and distribution disparities. Applying the Shapiro–Wilk test, all relevant variables’ p-values exceeded 0.05, statistically supporting the assumption of normal distribution. Detailed results of this analysis are provided in Supplementary Materials File S2. The user perception of spatial form showed significant correlations with multiple indices related to paths, districts, and nodes as shown in Figure 11. In the figure, the vertical coordinate represents the spatial eigenvalue, and the horizontal coordinate represents the average SD score of the respondents. The analysis shows a significant positive correlation between channel spatial scale sense (CSS) and corridor aspect ratio (A2), where wider corridors with higher aspect ratios enhance perceived spaciousness (r(10) = 0.9, p = 0.005), supporting ergonomic guidelines recommending aspect ratios greater than 1.5:1. A strong linkage is observed between local characteristics (LCs) and the difference in primary color in areas (B1), indicating that greater color contrast amplifies place identity recognition (r(10) =0.88, p < 0.001). The results reveal an inverse relationship between channel space length (CL) and corridor length (A3), demonstrating that compact layouts reduce perceived monotony (r(10) = −0.84, p = 0.009), which aligns with wayfinding efficiency models. A high correlation is identified between spatial attraction (SA) and art elements (E3), suggesting that installations like murals or sculptures significantly boost esthetic appeal (r(10) = 0.93, p < 0.001). Furthermore, user perceptions of the physiological environment were found to be related to the entrance form (D1) and atrium plan form (D2), while perceptions of functional services were found to be correlated with various indicators. Perceptions of esthetic experience were found to be significantly associated with indicators related to edges, districts, and landmarks.

3.3.2. Impact of Individual Characteristics and Social Activity Level on User Perceptions

The individual characteristics of the questionnaire respondents were collected as critical background information, and a binary logistic regression analysis was conducted to explore their impact on environmental perception. The factors from Section 2.3 and Section 3.1 were used as independent variables (sorted and assigned values), with the user SD rating as the dependent variable. Following the methodology of Wongbumru and Dewancker [61] and guided by the results of a descriptive statistical analysis, a notable shift was uncovered between the frequencies of scores ranging from −3 to −1 and from 0 to 3. Consequently, the scores were classified into dichotomous data using dummy variables, with scores from 0 to 3 indicating high satisfaction and scores from −3 to −1 indicating low satisfaction, based on a binomial scale for logistic regression. The coefficient B was calculated using the Maximum Likelihood Estimation method to ensure that the estimated model best conforms to the data under the logistic regression framework.
The results (Table 4) indicated that people aged 46–55 had more positive environmental perceptions (B = 1.38), while women reported poorer experiences in USMs compared to men. Additionally, users who relied solely on signage for navigation perceived the environment more negatively (B = −1.01), and visits during the hours of 14:00–19:00 and on weekends were associated with less favorable experiences.

3.3.3. Impact of Architectural Spatial Characteristics on User Perceptions

Further analysis focused on the impact of the five considered architectural elements on the environmental perceptions expressed by USM users. A binary logistic regression was conducted using the elements listed in Table 2 as independent variables and the user SD evaluations as the dependent variables. The analysis results (Table 5) indicated that several variables had significant impacts on the respondents’ perceptions: A1. Corridor form (B = −1.38), A3. Corridor length (B = −0.91), B1. Difference in primary color in areas (B = 0.99), C1. Number of internal space functions (B = −1.38), D1. Entrance form (B = −0.98), E1. Natural elements (B = 0.97), and E4. Signage systems (B = −0.99).

4. Discussion

4.1. Individual Characteristics and Social Activity Level Within USMs

The results of the questionnaire analysis indicated that age significantly affects user perceptions of USMs. People’s perception of space is divided into sensation, intuitive perception, and cognition, which are all closely related to age. Previous studies on underground space users have also confirmed that age significantly affects users’ cognition of underground space [18,41,62]. In our study, respondents aged 46–55 reported higher satisfaction, which may be the result of a combination of physiological, psychological, and social experiences. Therefore, USM design should focus more on the needs of younger individuals. Furthermore, user experiences were negatively impacted during peak hours between 14:00 and 19:00 and on weekends, likely owing to the perception of overcrowding resulting from increased numbers of people in USMs [63]. In particular, we observed that congestion was most prominent in dining areas, especially owing to queues for food that hindered the flow of traffic. Numerous studies have indicated that high perceptions of crowding can lead to negative outcomes, such as decreased satisfaction and increased irritability [64]. Designers can mitigate congestion by optimizing store layouts and managing the number of features within a USM. Additionally, incorporating music [65], greenery [66], and virtual reality [67] can effectively reduce the negative effects of perceived crowding.

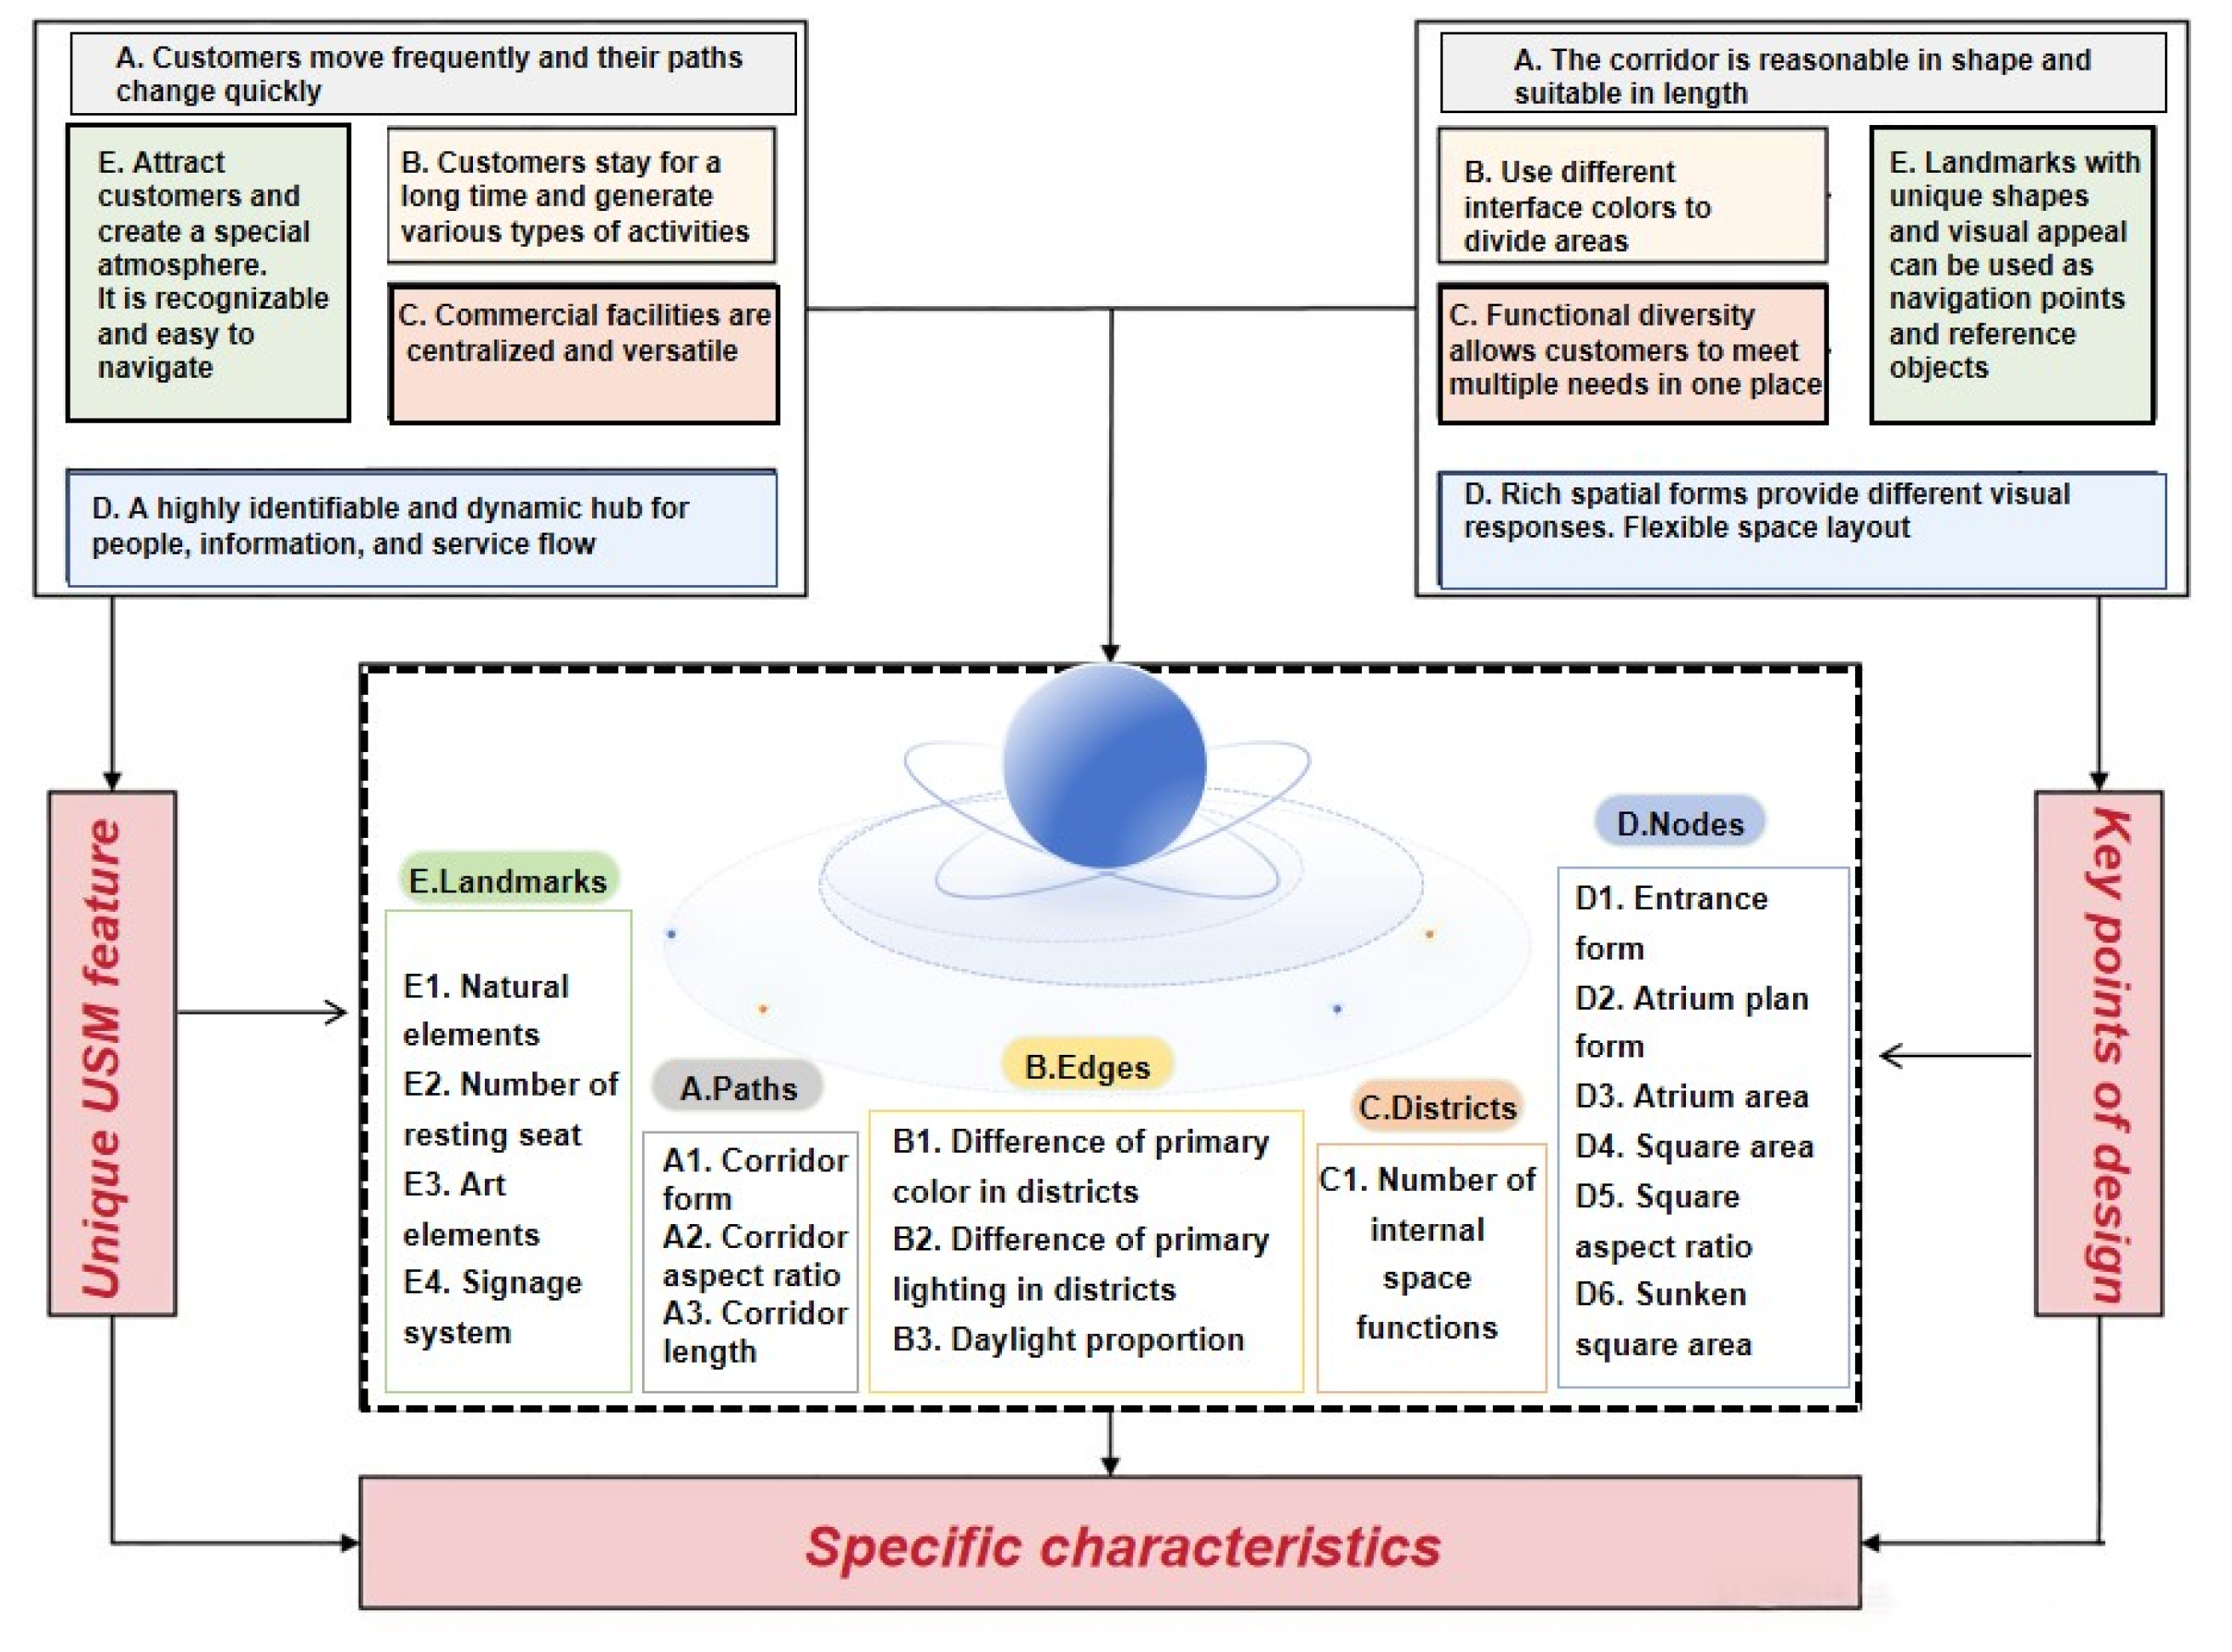
4.2. Spatial Feature Elements of USM Image

The statistical analysis identified key points for the five architectural elements of USMs that affect users’ environmental perceptions and should be considered during the design stage (Figure 12).
Among the five considered elements, paths were dominant. Research has shown that corridors are critical pathways within USMs, and their forms are influenced by the overall spatial structure and functional layout of the USM. Longer corridors provide more information but may be perceived as monotonous if too lengthy or uniformly designed. We found that the form of the corridor could determine its maximum length: in USMs with high user satisfaction, the average annular corridor was 177.7 m long, whereas the average radial corridor was 44.6 m long. Although longer corridors were correlated with the perception of distance, no correlation was found between corridor length and overall satisfaction in USMs (Figure 13a). In addition, the perception of corridor scale was positively correlated with the aspect ratio, defined as the width (W) to the height (H). Corridors in USMs with high SD scores typically had aspect ratios between 1:1 and 2:1 (Figure 13b,c), consistent with ergonomic standards for spatial comfort in underground environments, aligning with findings reported by Park and Zhang [68].
To mitigate claustrophobia, USMs typically use soft visual elements as spatial boundaries of functional areas. Indeed, studies have shown that texture, color, decoration, and lighting can significantly influence the user perception of USMs [42,69]. The results of this study suggested that differences between the predominant colors used in different areas had the most substantial impact on respondents’ recognition of spatial areas, in contrast to findings reported by Jasińska and Kłosek-Kozłowska [18].
From a psychological perspective, creating a social environment that shares a collectivist culture and addresses users’ social needs can provide the necessary social support and reduce feelings of isolation. The nodes within a USM, including entrances, exits, sunken plazas, and atriums, naturally facilitate congregation and enhance social interactions among the underground populace. Therefore, the design and quantity of these access points will significantly affect users’ experiences. Our findings indicate that many users prefer to access USMs via underground passageways and subway entrances, aligning with recognized trends in transit-oriented development and underground walking networks. The impact of these access points on USM user experience was significant, suggesting that designers should consider optimizing the location and number of entrances and exits. In addition, the perception of spatial openness within a USM was heavily influenced by the presence of an atrium, which serves as a primary social hub. An appropriately sized atrium with a glass ceiling can also establish a visual connection to the external environment, enhancing the overall user experience.
One of the outstanding architectural challenges facing the development of underground spaces is the absence of windows, which results in obscured visibility in underground environments and a disconnection from natural vistas. This, in turn, reduces people’s sense of environmental mastery [14]. Therefore, USMs must incorporate a wide variety of landmarks. The survey in this study revealed that respondents heavily relied on signage, underscoring the need to provide sufficient information to reduce feelings of lost control. Effective wayfinding can be facilitated by the consistency and uniformity of signage. Intelligent and interactive navigation equipment can enhance convenience in wayfinding. In addition, creating a distinctive and unique atmosphere within USMs can significantly enhance customer perceptions and experiences [70], and the restorative qualities of natural elements such as water features and plantings can reduce stress and promote energy recovery [71]. Furthermore, psychological compensation theory suggests that the use of artificial windows and natural landscape imagery can improve users’ acceptance of underground settings. Artistic interventions that capitalize on regional culture, embodying the social identity of a specific region, can also reduce the negative effects of isolation by inspiring social cohesion and enhancing users’ sense of belonging. The efficacy of this approach was confirmed in this study by respondents’ high satisfaction with unique USMs that effectively mimicked urban cultural features (JYWY and AC).

4.3. Recommendations

The direction and methods of architectural design optimization for USMs are predicated on enhancing user perception, with a core objective of refining each spatial image element and their combined effects. The suggestions summarized in this section are derived from the results of this study to improve the comfort, planning, and design quality of USMs; address the diverse needs of users; and increase satisfaction.
From an urban planning perspective, the various connections of USMs should be strengthened, including links with above-ground developments, neighboring underground projects, and urban rail transit networks. This facilitates the formation of an underground walking network, allowing users to access USMs quickly, safely, and conveniently. From an architectural perspective, the functional layout should be meticulously designed to cater to the predominant user groups, especially young women. From a spatial perspective, adopting a “fishbone” layout (Figure 14) with balanced path proportions and clear node configurations is advisable to relieve the discomfort caused by crowding in the dining area during peak hours. Design emphasis should be placed on key nodes such as atriums and sunken plazas, which can enhance the appeal of the space and meet users’ needs for social and natural connections. Additionally, a variety of novel landmarks—such as digital signage, artistic water features, distinctive plant arrangements, and culturally relevant artistic elements—should be incorporated into USM design to create captivating and unique underground landscapes that enhance users’ perceptions of USMs.
To address the limitations of manual data collection (e.g., human interference, environmental complexity), future research will integrate LiDAR-SLAM robotic backpacks for millimeter-level 3D mapping, enabling high-speed field data acquisition and high-precision data processing in USMs. Wearable devices will synchronize physiological data with environmental sensors to quantify subjective comfort, replacing error-prone survey responses. These technologies, combined with AI-powered digital twins, will optimize energy-efficient designs, advancing USMs toward data-driven, sustainable paradigms aligned with the SDG 11.

5. Conclusions

Although USMs are rapidly expanding across China, they represent a relatively young category of underground buildings. The consumer experience of USMs must be explored to evaluate whether the implementation results of their planning and design match the needs of users, to clarify the direction of USM design optimization and improvement. Therefore, based on environmental psychology, this study systematically examined how the spatial characteristics of underground buildings affect subjective environmental perception, extracted the key influencing factors by establishing a regression model, revealed the relevance between each factor and subjective evaluation results, and put forward suggestions for USM optimization and improvement on this basis. Specific research conclusions are as follows:
(1)
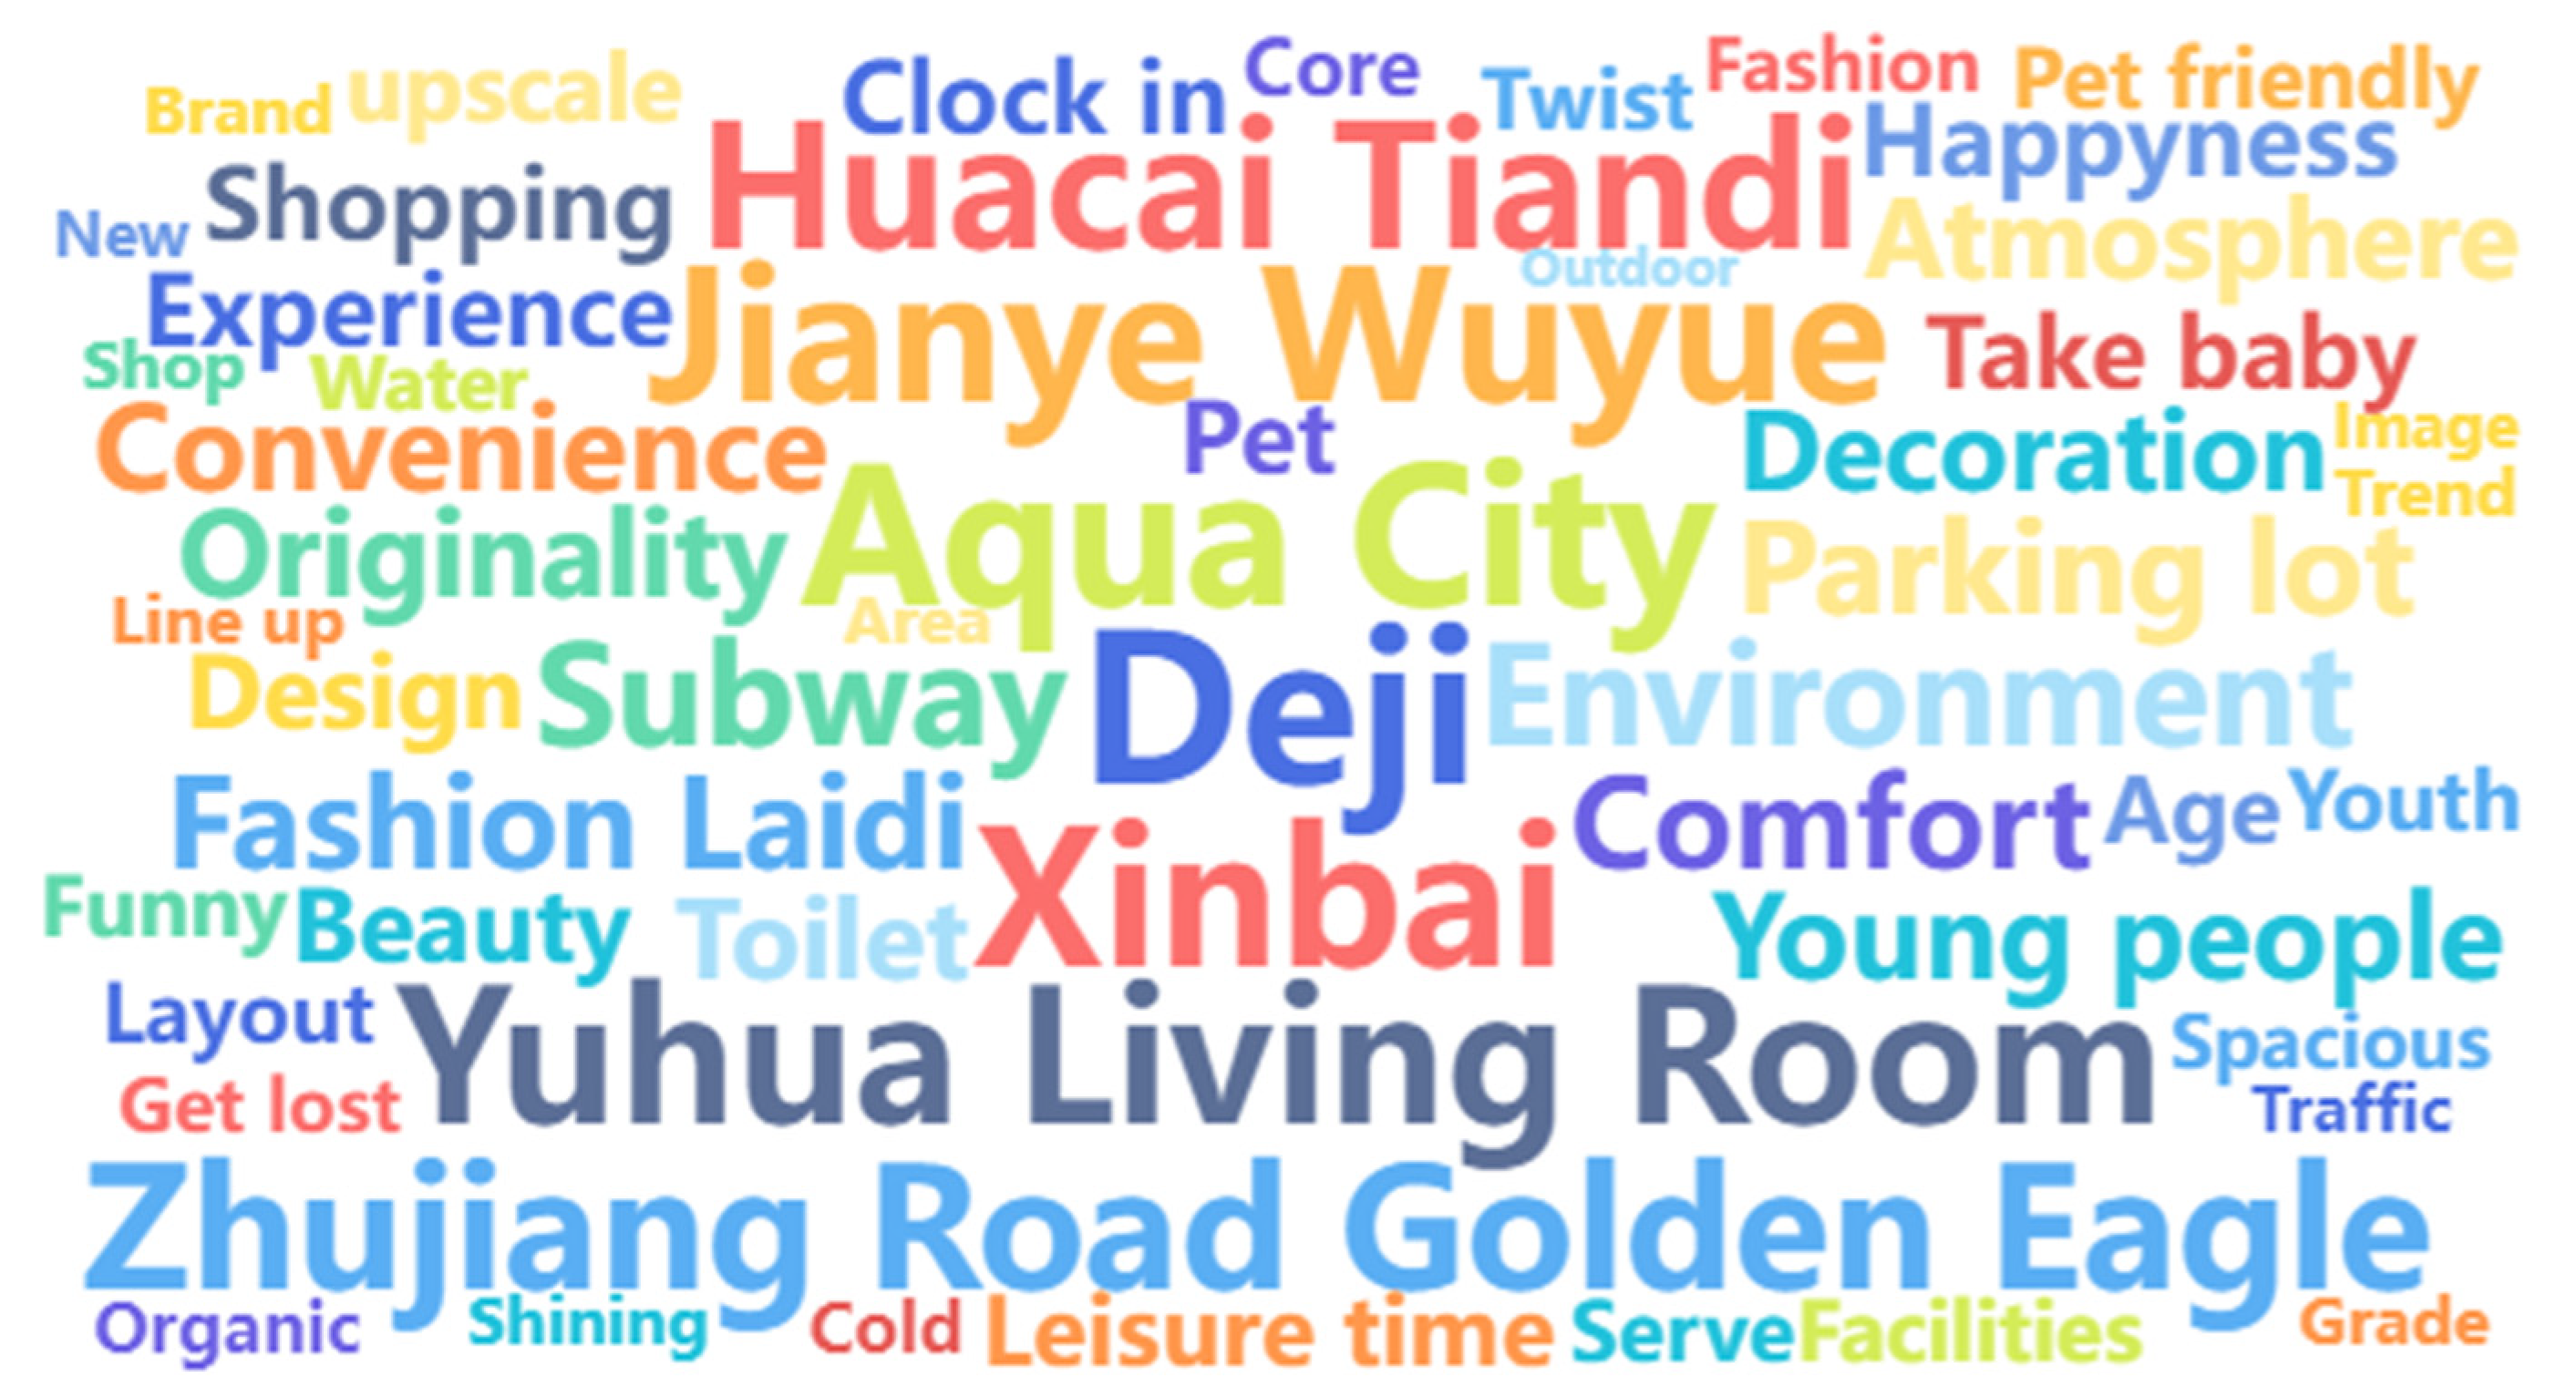
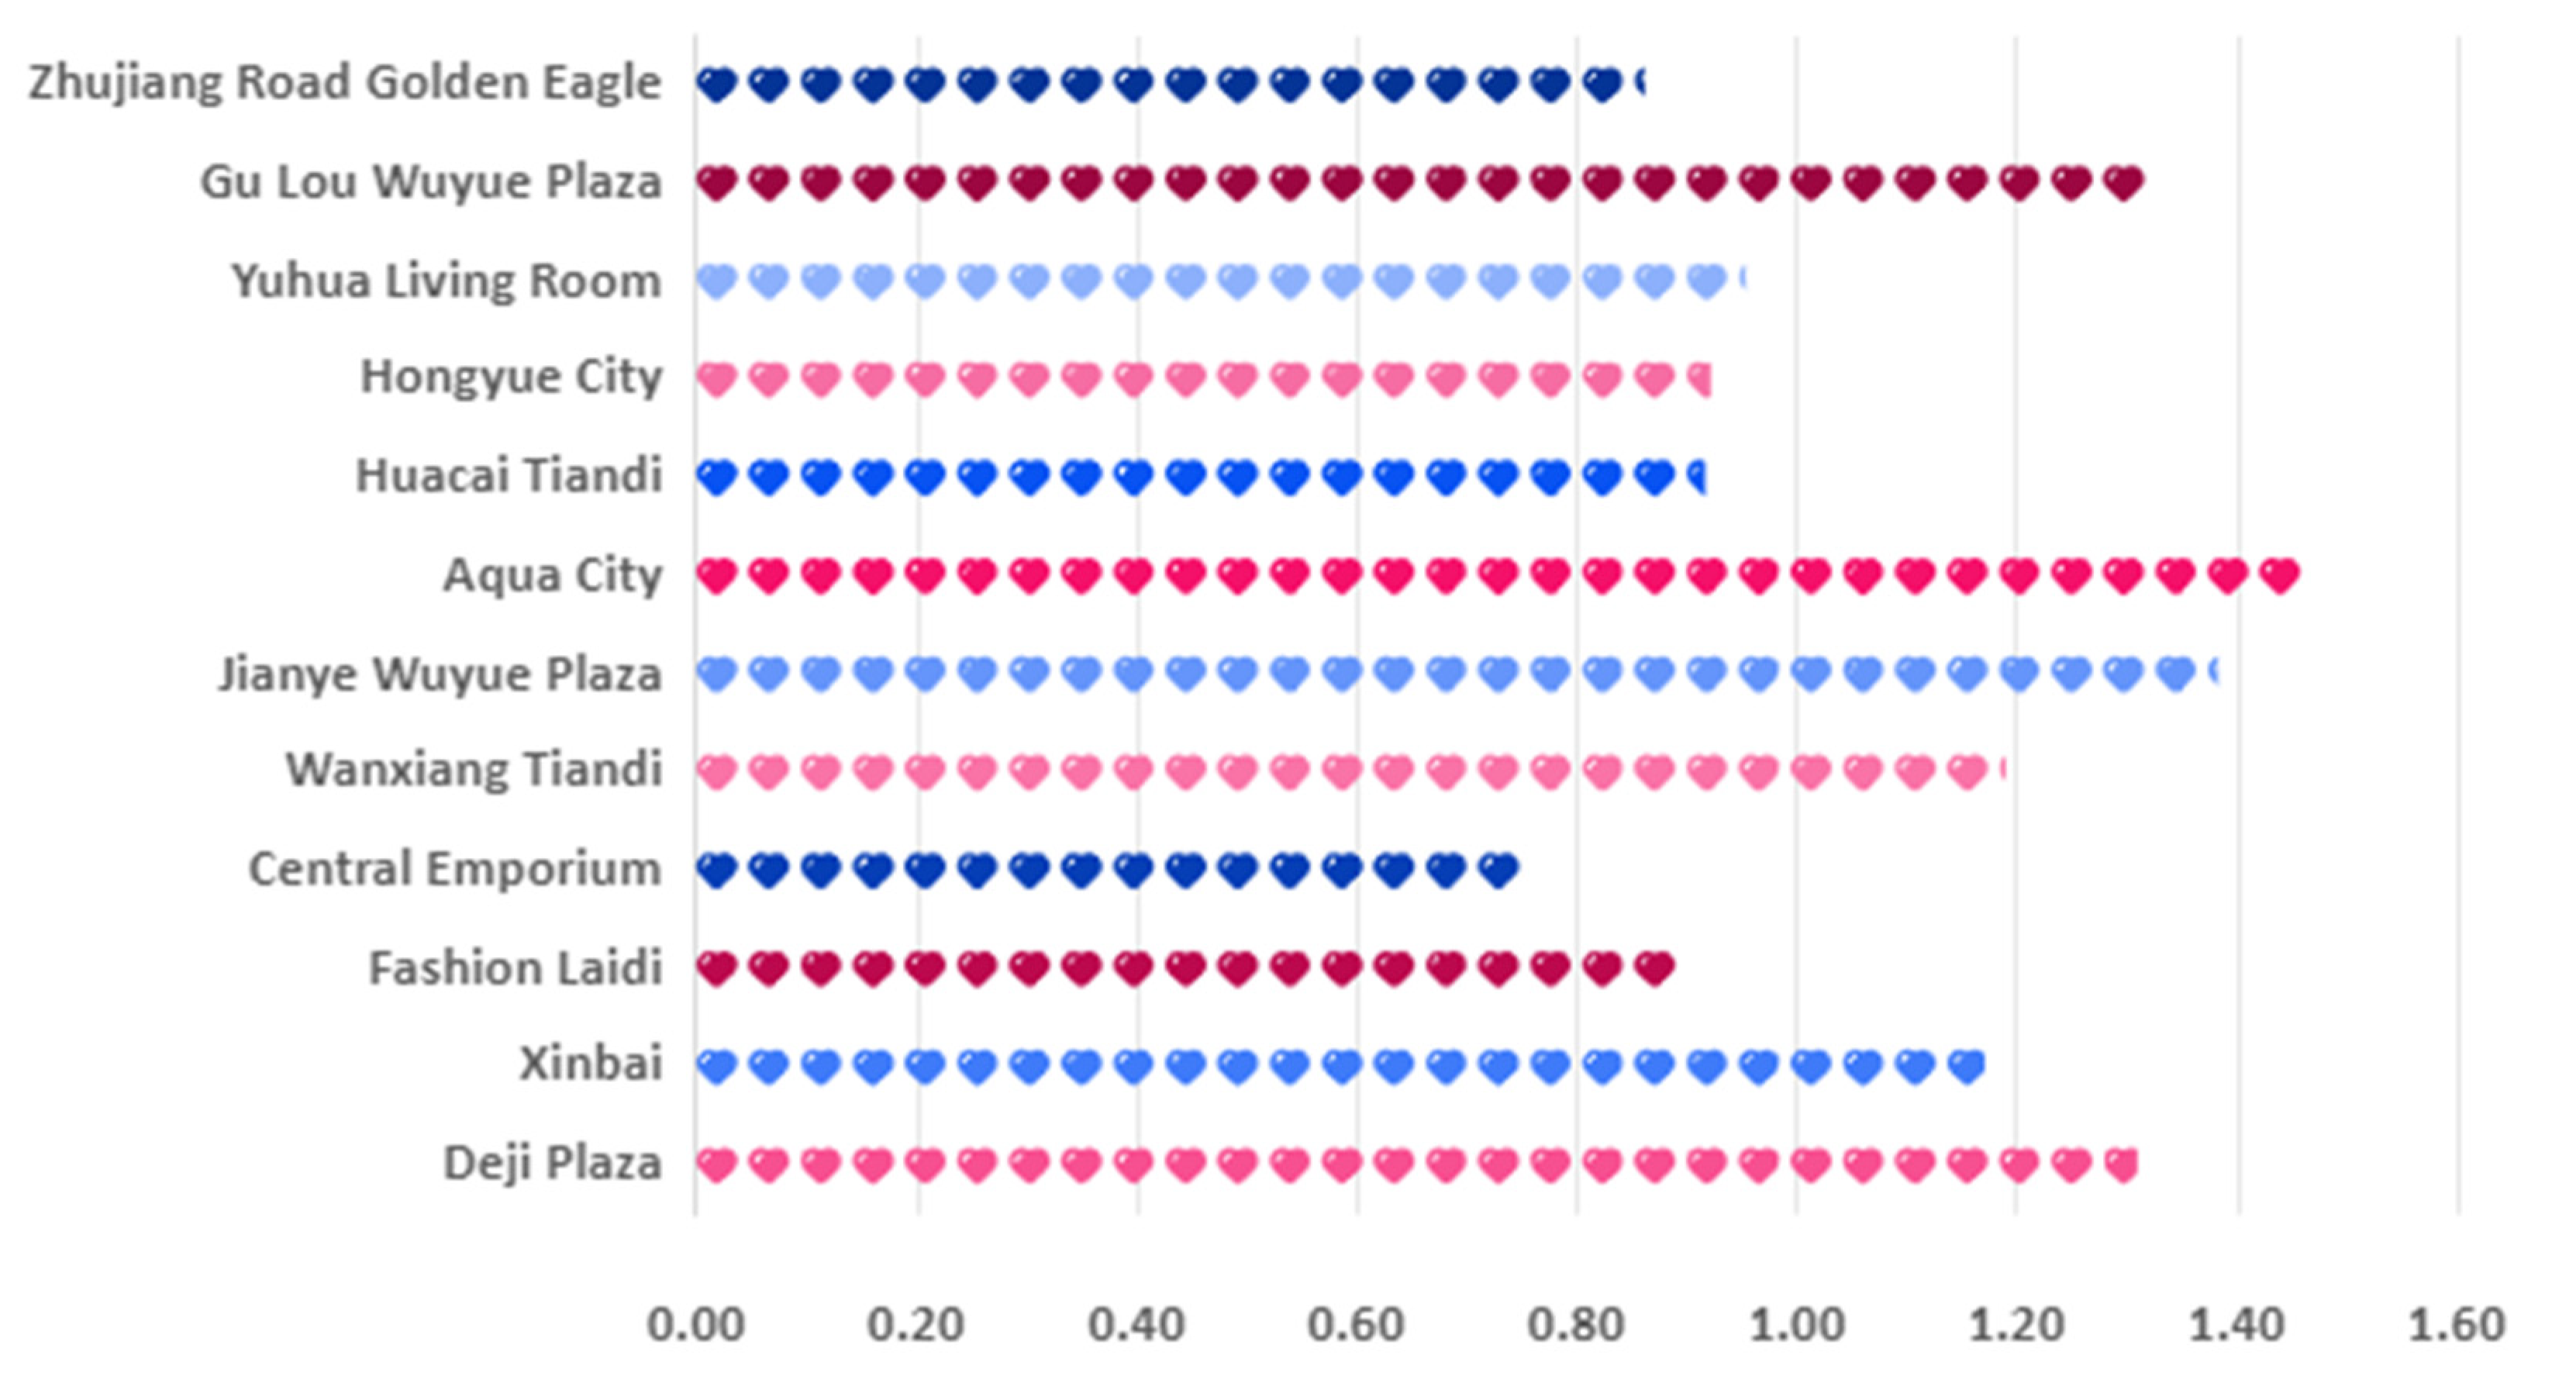
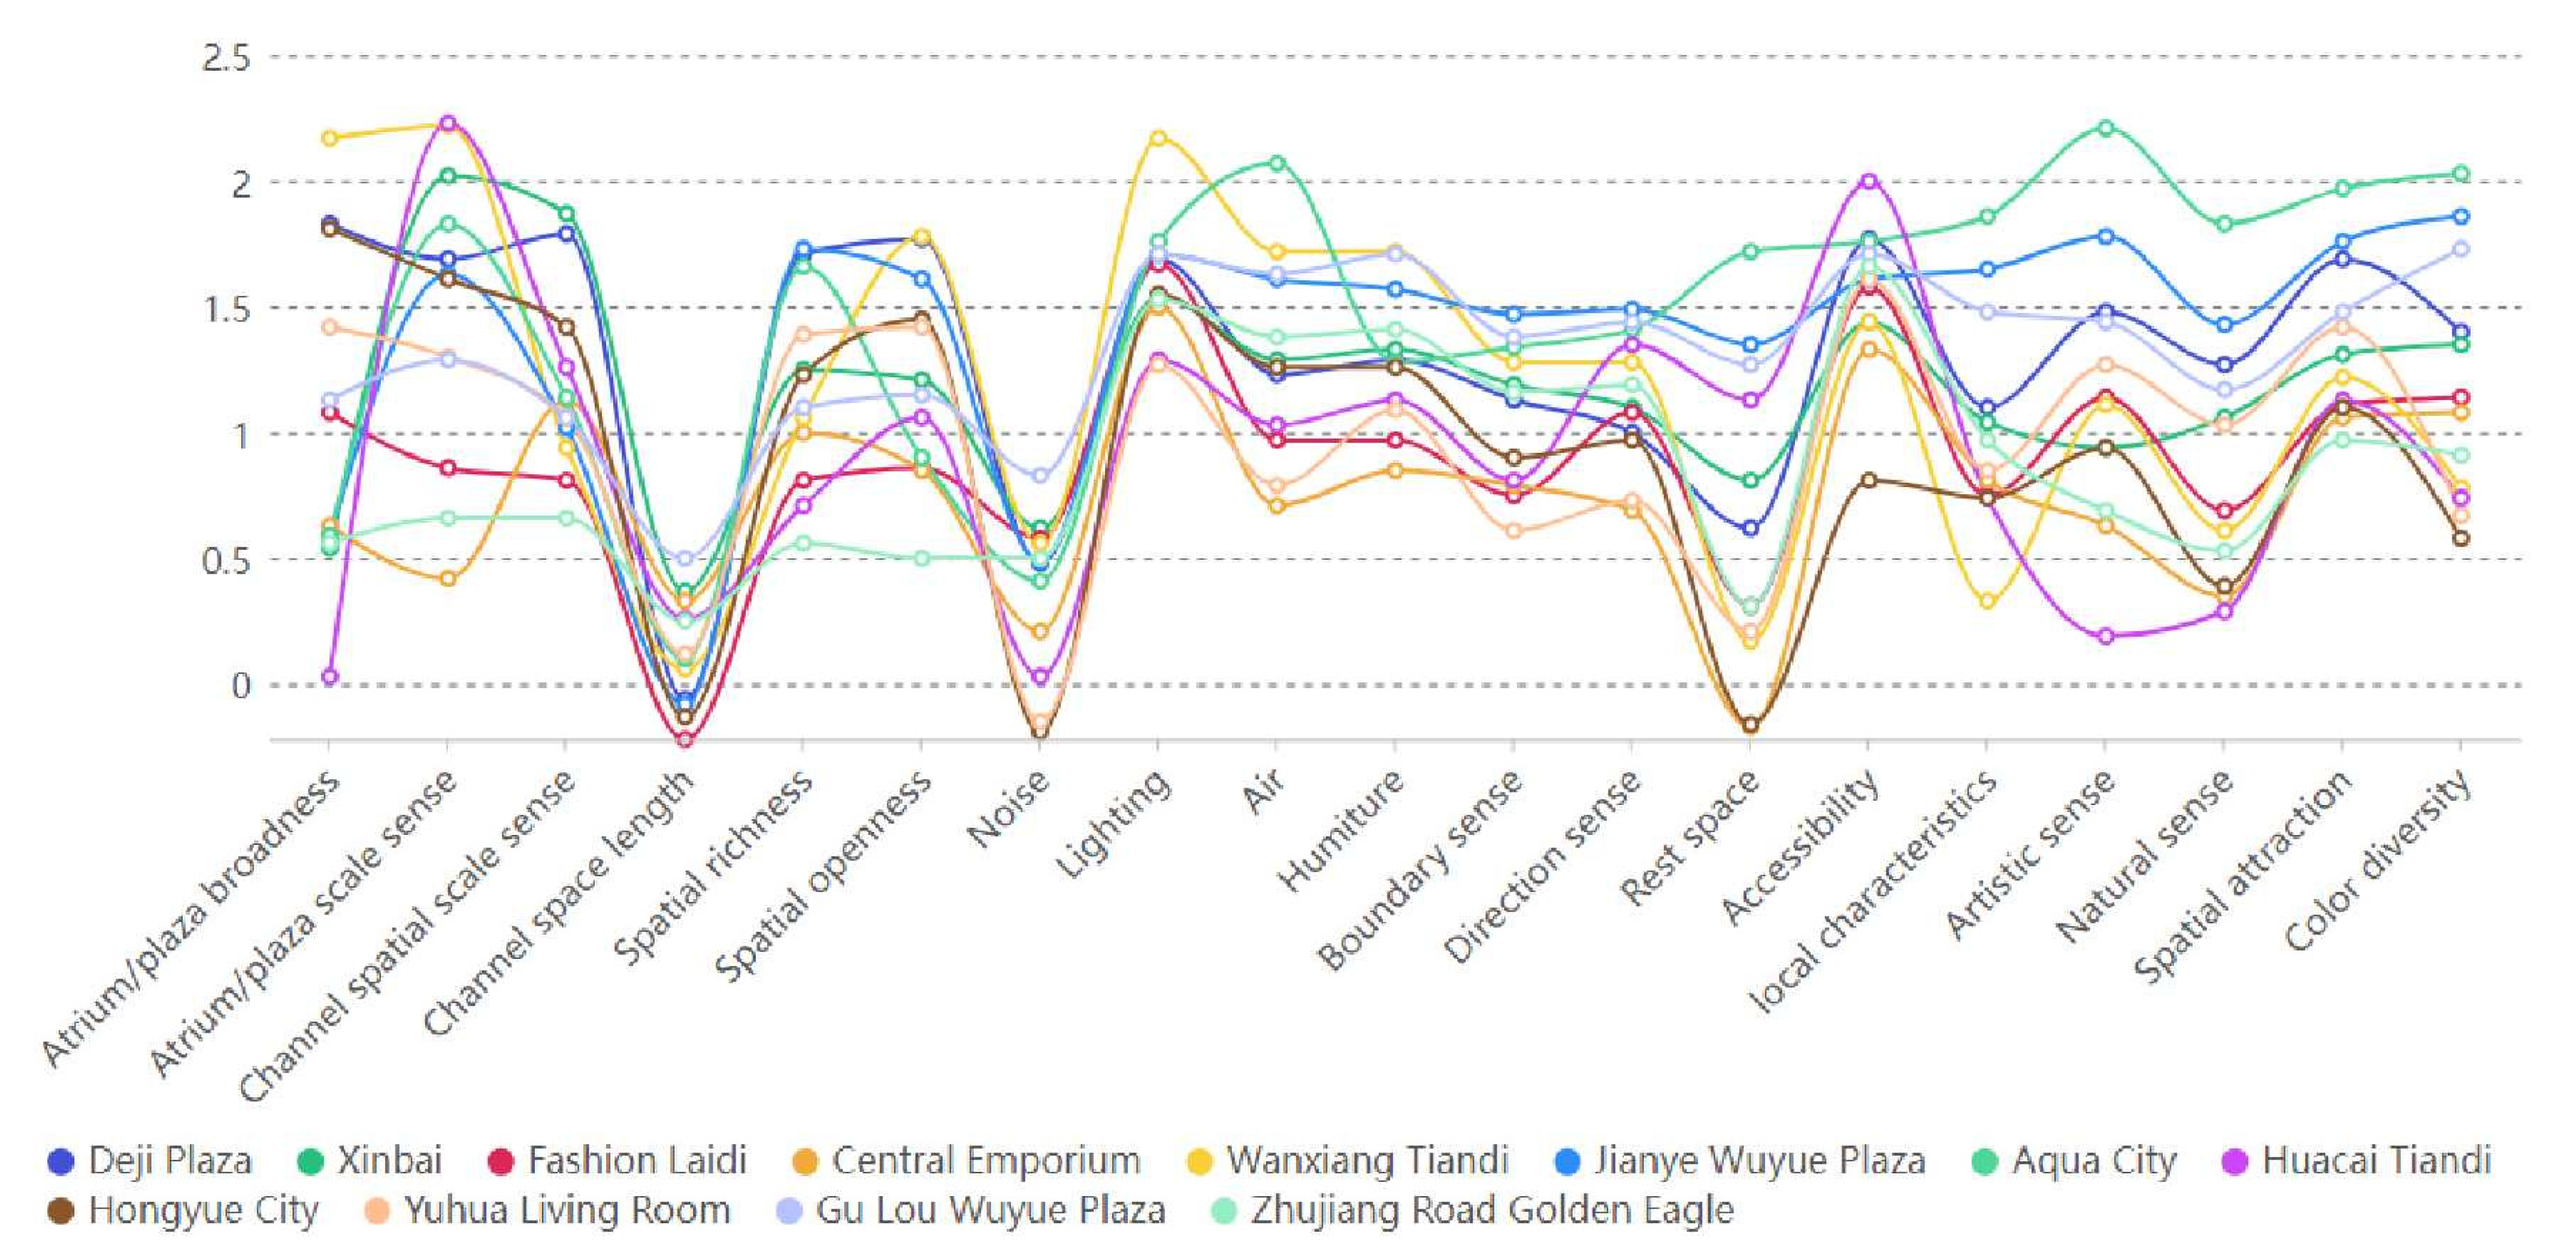
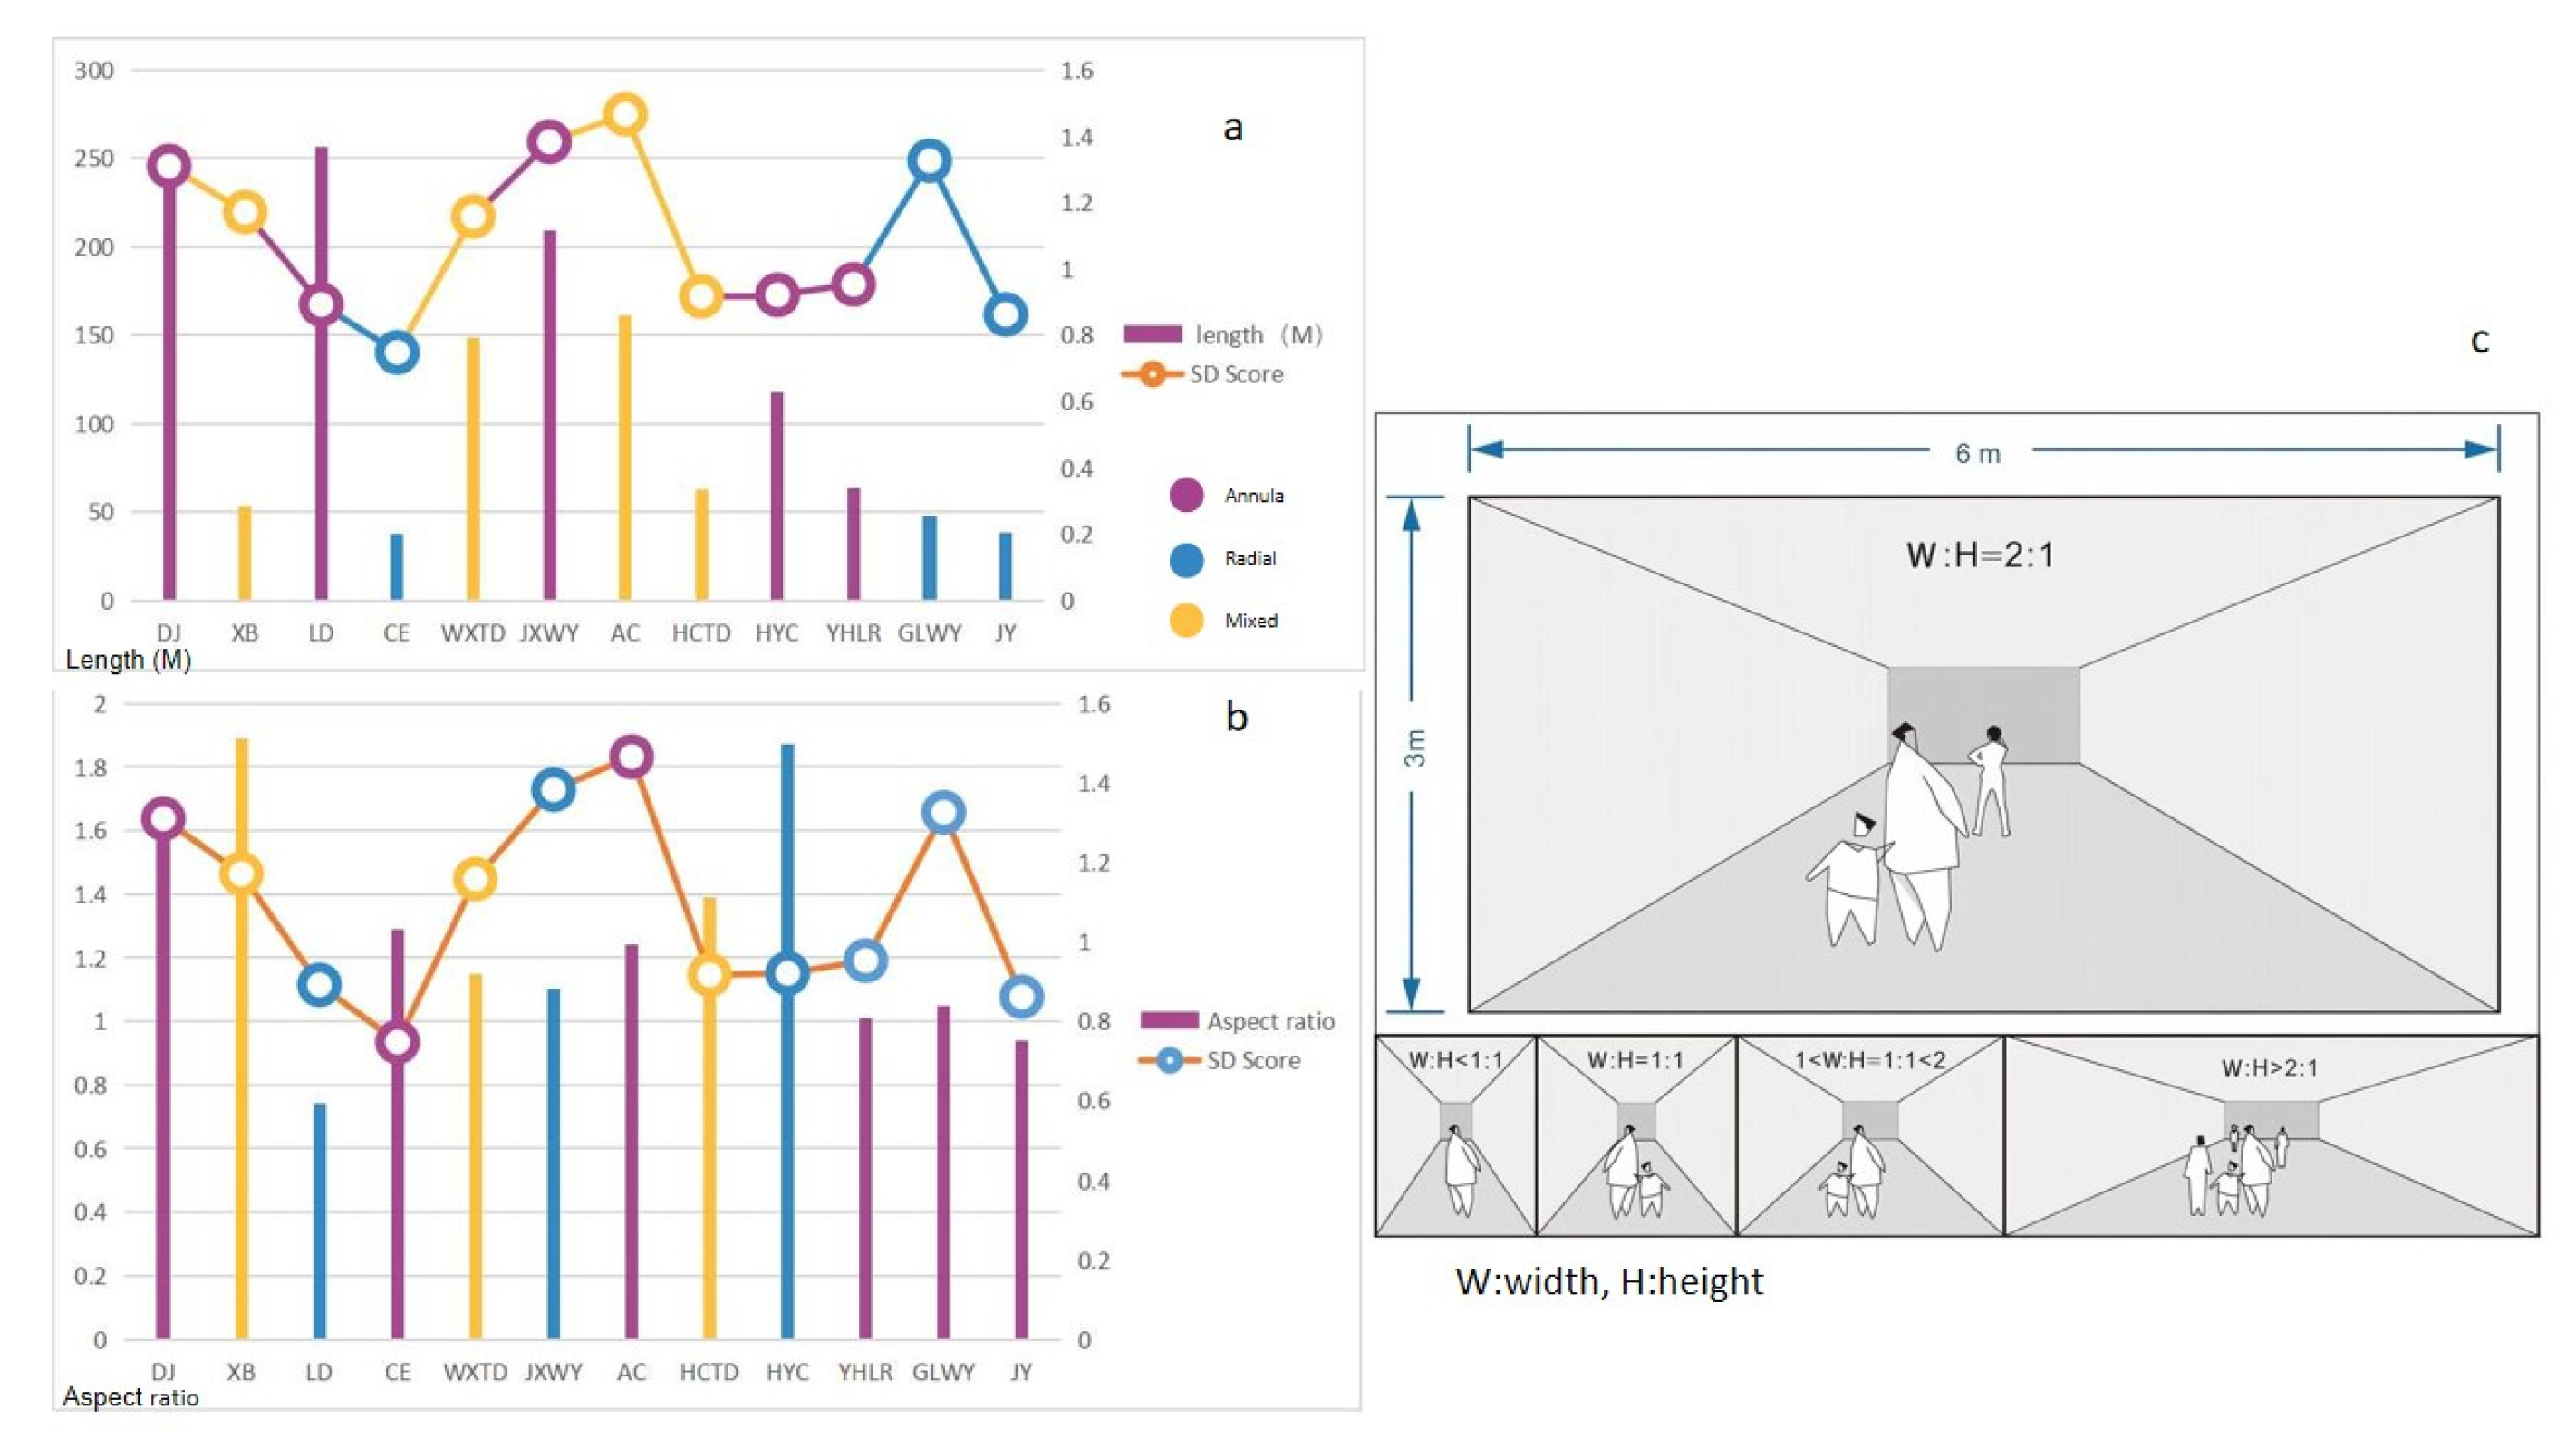
Users generally have a positive attitude toward the current underground environment. In the survey sample, the SD score of Aqua City was the highest at 1.47. There were notable differences in the subjective views of users on different attributes of the 12 USMs. USM shows the trends of humanization, human culture, and landscape in spatial characteristics. The spatial feature data for the USMs reflects the diversity of the samples. This preference aligns with sustainable urban development goals by promoting long-term user retention, which reduces the need for resource-intensive renovations due to low acceptance.
(2)
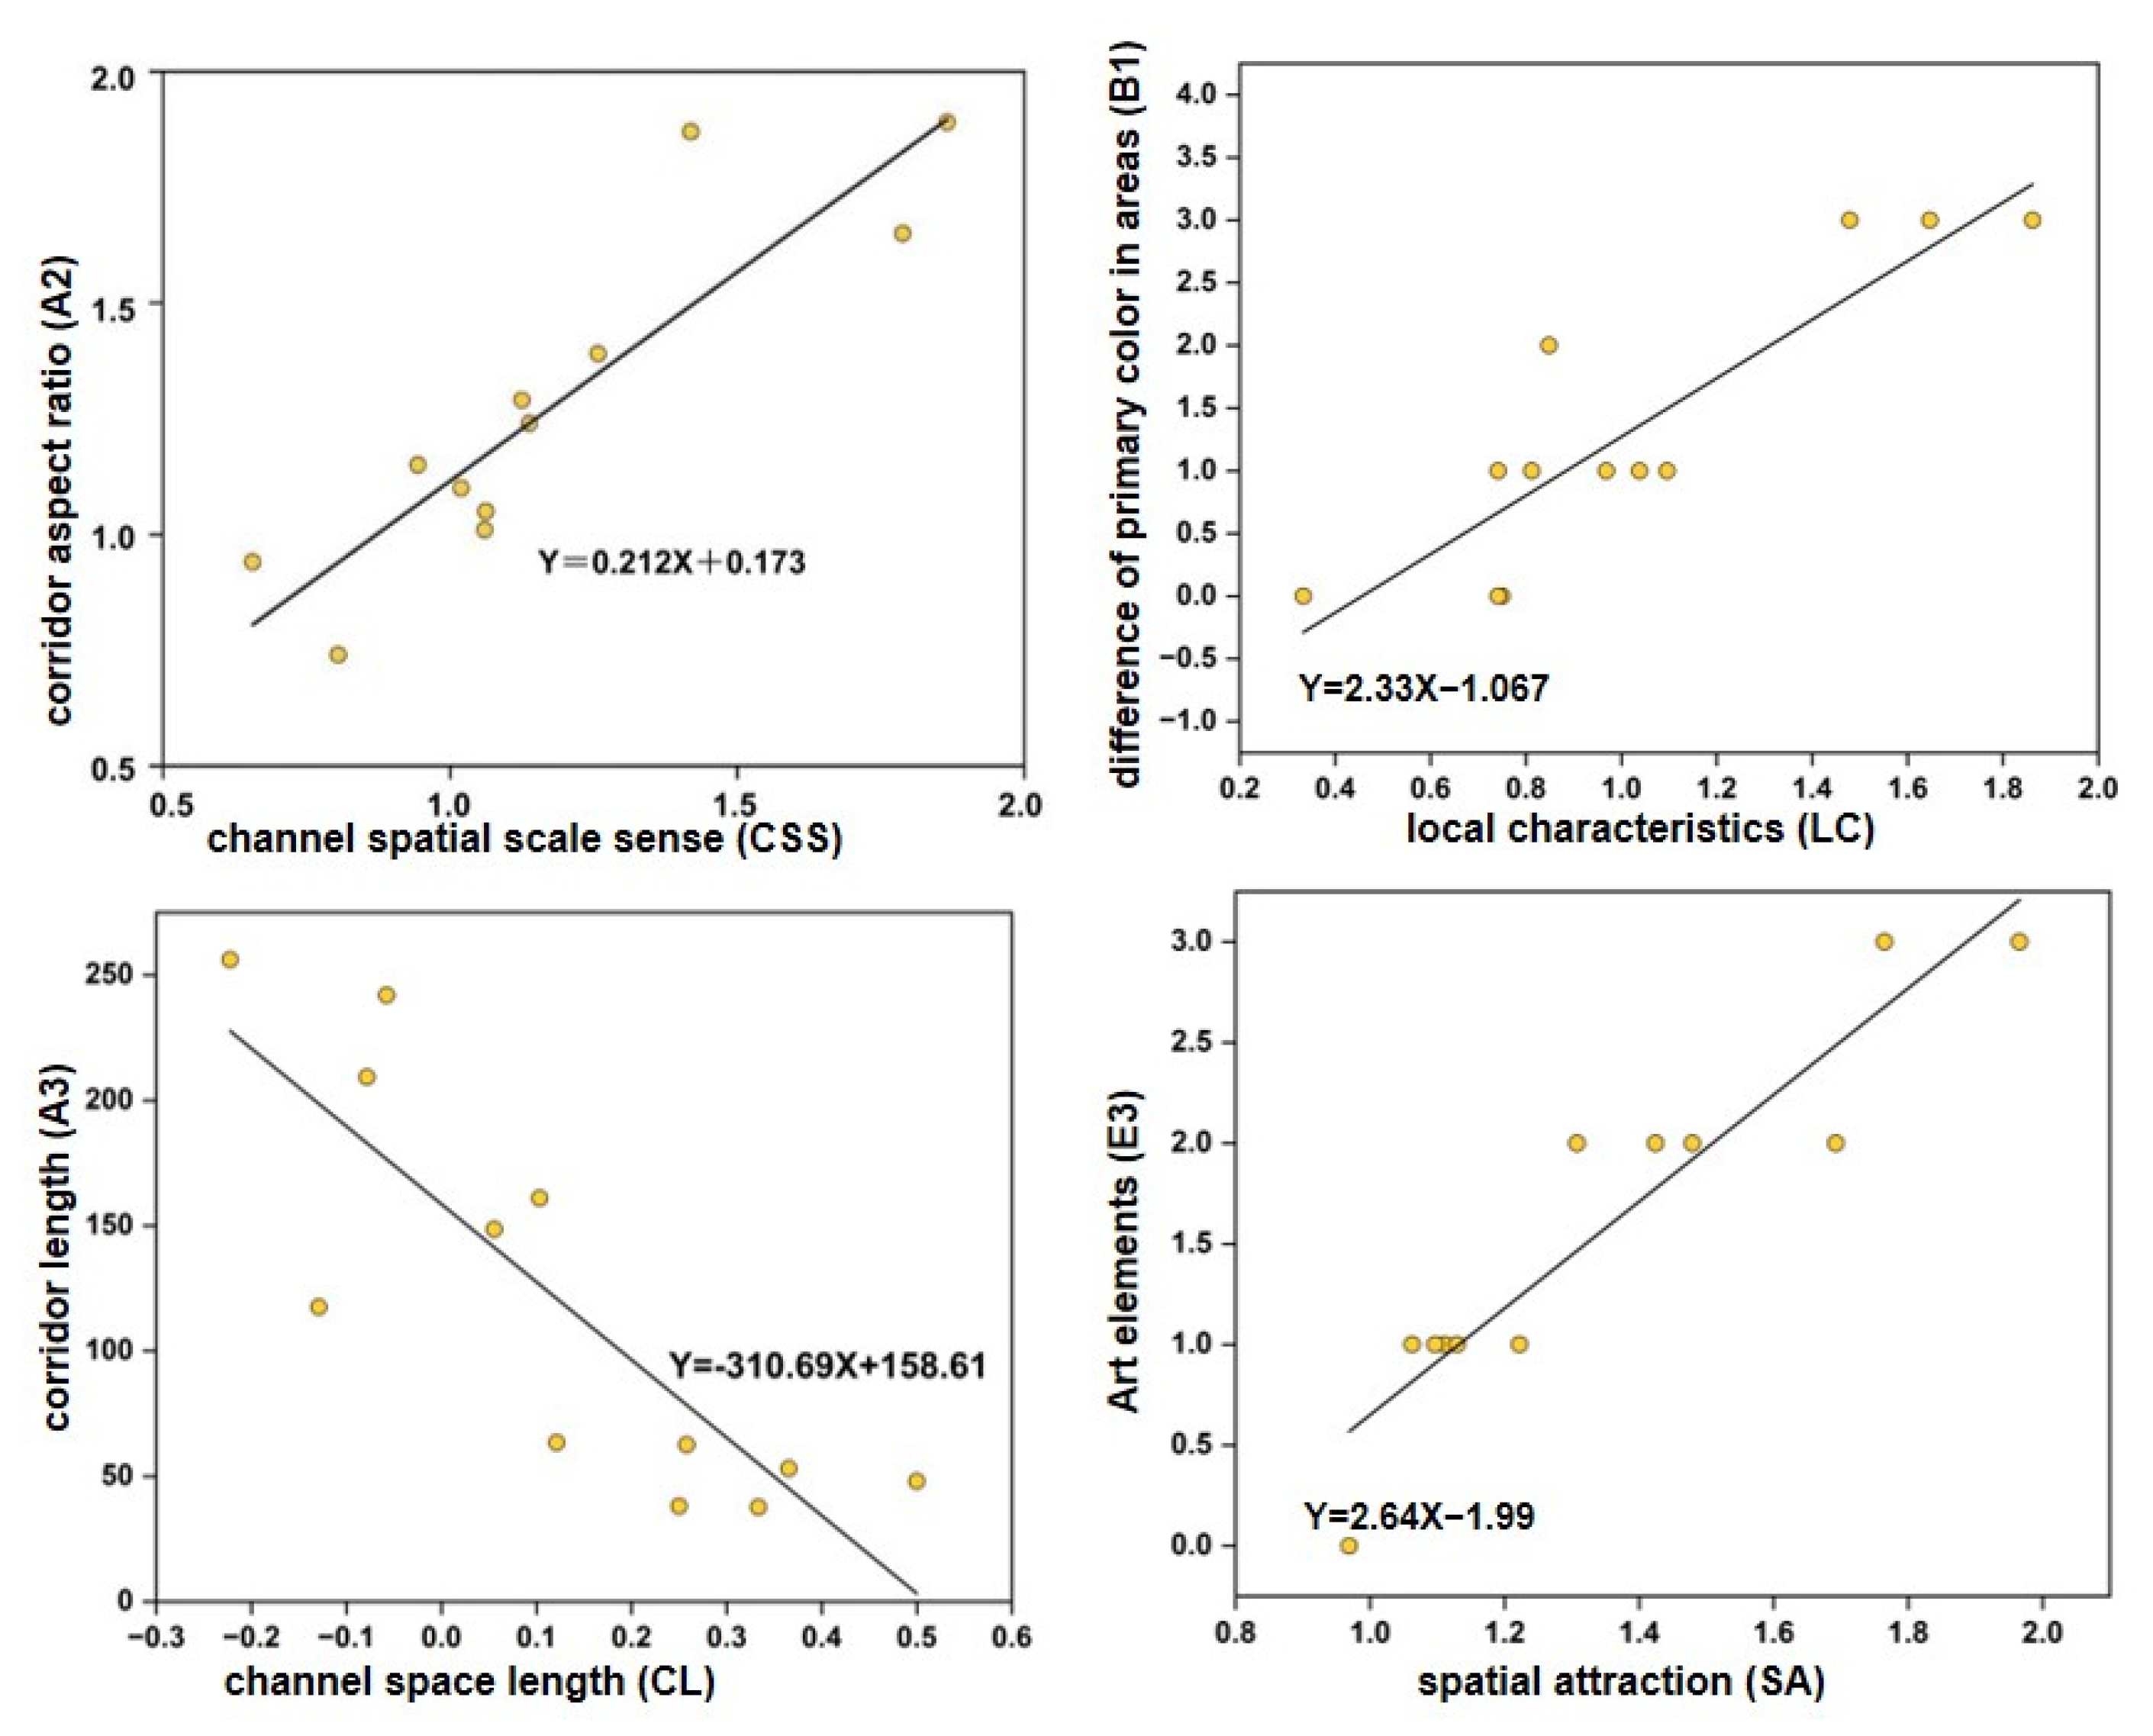
The comfort of USMs was largely determined by various architectural spatial characteristics and individual and social activity level characteristics. The subjective experiences of USM users were found to be predominantly shaped by seven spatial characteristics—corridor form, corridor length, color differentiation, number of internal functional spaces, entrance form, signage system, and natural elements. In USMs with high user satisfaction, the average annular corridor was 177.7 m long, whereas the average radial corridor was 44.6 m long. Experiences were further affected by five individual and social activity level characteristics—age, orientation method employed, choice of entrance, and the day and time of interview. These findings directly support energy conservation strategies.
(3)
The findings of this study support a stronger emphasis on human-centered design by suggesting improvements that (a) enhance the various connectivities of USMs; (b) refine the functional zoning and configuration according to diversified demand; (c) adopt a “fishbone” spatial layout with well-proportioned paths and clear nodes to relieve the discomfort caused by crowding in the dining area during peak hours; and (d) incorporate cultural and novel landmarks into USMs.
However, this study still has a few shortcomings. In terms of methodology, we used the SD method to measure human perception. Although we employed various approaches to make the adjective pairs used to measure perception more accurate and suitable, heterogeneity in individual studies is inevitable. In terms of data collection, while the results of this study provide useful insights into the relationship between underground environments and building design, these insights are limited by the scope of the data. This limitation arose primarily due to the complexity of the underground experimental environment, the limitations of measurement tools, the interference of human factors, and the challenges of data processing.
Future research should incorporate a wider range of data acquisition methods. Robotic mapping technology and intelligent equipment will enable real-time monitoring of sustainability metrics to overcome the above limitations and improve the accuracy and efficiency of spatial data measurement in USMs. Furthermore, this study’s findings are contextualized within Nanjing’s unique cultural and social landscape, where historical heritage, local esthetic preferences, and community behavioral patterns (e.g., the prominence of signage reliance and affinity for nature-inspired designs) significantly shaped user perceptions. To ensure broader applicability, future studies will extend to cities with distinct cultural identities, climatic conditions, and urban planning frameworks. This expansion is critical, as regional differences (such as varying cultural symbolism of landmarks, social norms around spatial navigation, and attitudes toward underground spaces) can significantly impact user satisfaction and perception. For instance, Nanjing-specific factors like its historical preservation ethos and compact urban layout influenced respondents’ prioritization of corridor forms and cultural landmarks. These insights provide a reference for USM design in culturally analogous cities while underscoring the need for adaptive strategies elsewhere. Innovative underground space design methods integrating region-specific cultural narratives (e.g., dialect-inspired signage, locally resonant art installations) and addressing site-specific social dynamics (e.g., crowd management in high-density vs. low-density cities) will be the focus of the next stage of research.

Supplementary Materials

The following supporting information can be downloaded at: https://www.mdpi.com/article/10.3390/su17062717/s1, File S1: Survey Record Form; File S2: Overall correlation analysis between SD perception data and USM spatial characteristics.

Author Contributions

Conceptualization, X.Z. (Xingxing Zhao) and D.G.; Data Curation, C.D.; Formal Analysis, D.G.; Investigation, X.Z. (Xingxing Zhao); Methodology, X.Z. (Xingxing Zhao) and X.Z. (Xingping Zhu); Software, Y.C.; Supervision, Z.C.; Validation, D.G., Y.W. and X.Z. (Xingping Zhu); Visualization, X.Z. (Xingxing Zhao) and C.D.; Writing—Original Draft Preparation, X.Z. (Xingxing Zhao); Writing—Review and Editing, Y.C. and X.Z. (Xingping Zhu). All authors have read and agreed to the published version of the manuscript.

Funding

This research was funded by the National Natural Science Foundation of China (NNSFC) [Grant No. 52378083] and the Natural Science Foundation of Jiangsu Province [Grant No. BK20231488].

Institutional Review Board Statement

The study was conducted in accordance with the Declaration of Helsinki, and approved by the Ethics Committee of College of Civil Engineering and Architecture, Huanghuai University.

Informed Consent Statement

Informed consent was obtained from all subjects involved in the study.

Data Availability Statement

Data are available upon request due to privacy restrictions.

Conflicts of Interest

The authors declare no conflicts of interest.

References

  1. Hooimeijer, F.L.; Tummers, L.C. Integrating subsurface management into spatial planning in The Netherlands, Sweden and Flanders. Urban Des. Plan. 2017, 170, 161–172. [Google Scholar] [CrossRef]
  2. Hunt, D.V.L.; Makana, L.O.; Jefferson, I.; Rogers, C.D.F. Liveable cities and urban underground space. Tunn. Undergr. Space Technol. 2016, 55, 8–20. [Google Scholar] [CrossRef]
  3. Sterling, R.; Carmody, J. Underground Space Design; Wiley: Hoboken, NJ, USA, 1993. [Google Scholar]
  4. Broere, W. Urban underground space: Solving the problems of today’s cities. Tunn. Undergr. Space Technol. 2016, 55, 245–248. [Google Scholar] [CrossRef]
  5. Cao, S.; Leng, J.; Qi, D.; Kumar, P.; Chen, T. Sustainable underground spaces: Design, environmental control and energy conservation. Energy Build. 2022, 257, 111779. [Google Scholar] [CrossRef]
  6. Durmisevic, S. The future of the underground space. Cities 1999, 16, 233–245. [Google Scholar] [CrossRef]
  7. Cui, J.Q.; Nelson, J.D. Underground transport: An overview. Tunn. Undergr. Space Technol. 2019, 87, 122–126. [Google Scholar] [CrossRef]
  8. Li, H.; Fan, Y.; Yu, M. Deep Shanghai project—A strategy of infrastructure integration for megacities. Tunn. Undergr. Space Technol. 2018, 81, 547–567. [Google Scholar] [CrossRef]
  9. Zhang, P.; Chen, Z.; Yang, H.; Wang, H. On utilization of underground space to protect historical relics model. Tunn. Undergr. Space Technol. 2009, 24, 245–249. [Google Scholar] [CrossRef]
  10. Boyd Thomas, J.; Lee Okleshen Peters, C. The underground mall: An investigation of factors influencing gray market consumption. Int. J. Retail Distrib. Manag. 2006, 34, 106–120. [Google Scholar] [CrossRef]
  11. Gu, Z.; Su, S.; Lu, W.; Yao, Y. Estimating spatiotemporal contacts between individuals in underground shopping streets based on multi-agent simulation. Front. Phys. 2022, 10, 882904. [Google Scholar] [CrossRef]
  12. Vilnai-Yavetz, I.; Gilboa, S.; Mitchell, V. Experiencing atmospherics: The moderating effect of mall experiences on the impact of individual store atmospherics on spending behavior and mall loyalty. J. Retail. Consum. Serv. 2021, 63, 102704. [Google Scholar] [CrossRef]
  13. Lee, E.H.; Christopoulos, G.I.; Lu, M.; Heo, M.Q.; Soh, C.K. Social aspects of working in underground spaces. Tunn. Undergr. Space Technol. 2016, 55, 135–145. [Google Scholar] [CrossRef]
  14. Lee, E.H.; Christopoulos, G.I.; Kwok, K.W.; Roberts, A.C.; Soh, C.K. A psychosocial approach to understanding underground spaces. Front. Psychol. 2017, 8, 452. [Google Scholar] [CrossRef]
  15. Edelenbos, J.; Monnikhof, R.; Haasnoot, J.K.; Hoeven, F.v.d.; Horvat, E.; Krogt, R.v.d. Strategic study on the utilization of underground space in the Netherlands. Tunn. Undergr. Space Technol. 1998, 13, 159–165. [Google Scholar] [CrossRef]
  16. Hane, T.; Muro, K.; Sawada, H. Psychological factors involved in establishing comfortable underground environments. In Proceedings of the 4th International Conference on Underground Space and Earth Sheltered Buildings: Urban Underground Utilization, Tokyo, Japan, 3 December 1991; pp. 480–492. [Google Scholar]
  17. Cui, J.Q.; Allan, A.; Lin, D. SWOT analysis and development strategies for underground pedestrian systems. Tunn. Undergr. Space Technol. 2019, 87, 127–133. [Google Scholar] [CrossRef]
  18. Jasińska, K.; Kłosek-Kozłowska, D. Passengers’ experience in underground non-transfer metro stations: The impact of spatial characteristics. Tunn. Undergr. Space Technol. 2024, 143, 105482. [Google Scholar] [CrossRef]
  19. Durmisevic, S.; Sarıyıldız, S. A systematic quality assessment of underground spaces—Public transport stations. Cities 2001, 18, 13–23. [Google Scholar] [CrossRef]
  20. Swamidurai, S. Evaluation of people’s willingness to use underground space using structural equation modeling—Case of Phoenix market city mall in Chennai city, India. Tunn. Undergr. Space Technol. 2019, 91, 103012. [Google Scholar] [CrossRef]
  21. van der Hoeven, F.; Juchnevic, K. The significance of the underground experience: Selection of reference design cases from the underground public transport stations and interchanges of the European Union. Tunn. Undergr. Space Technol. 2016, 55, 176–193. [Google Scholar] [CrossRef]
  22. Wang, X.; Shen, L.; Shi, S. Evaluation of underground space perception: A user-perspective investigation. Tunn. Undergr. Space Technol. 2023, 131, 104822. [Google Scholar] [CrossRef]
  23. Kim, J.; Shim, I.K.; Won, S.R.; Hwang, E.S.; Lee, Y.M.; Park, S.; Ryu, J.; Lee, J.C. Indoor air quality and its determinants in underground shopping malls in Korea. Environ. Int. 2024, 183, 108395. [Google Scholar] [CrossRef] [PubMed]
  24. Yamamoto, R.; Takizawa, A. Partitioning vertical evacuation areas in Umeda Underground Mall to minimize the evacuation completion time. Rev. Socionetwork Strateg. 2019, 13, 209–225. [Google Scholar] [CrossRef]
  25. Wang, S.; He, H.; Li, F.; Xiao, Q. A study on the soundscape of underground commercial space in Lu’an City and Hefei City, China. Int. J. Environ. Res. Public Health 2023, 20, 1971. [Google Scholar] [CrossRef] [PubMed]
  26. Nang, E.E.K.; Abuduxike, G.; Posadzki, P.P.; Divakar, U.; Visvalingam, N.; Nazeha, N.; Dunleavy, G.; Christopoulos, G.I.; Soh, C.K.; Jarbrink, K.; et al. Review of the potential health effects of light and environmental exposures in underground workplaces. Tunn. Undergr. Space Technol. 2019, 84, 201–209. [Google Scholar] [CrossRef]
  27. Venugopal, V.; Roberts, A.C.; Kwok, K.W.; Christopoulos, G.I.; Soh, C.K. Employee experiences in underground workplaces: A qualitative investigation. Ergonomics 2020, 63, 1337–1349. [Google Scholar] [CrossRef]
  28. Dong, X.; Wu, Y.; Chen, X.; Li, H.; Cao, B.; Zhang, X.; Yan, X.; Li, Z.; Long, Y.; Li, X. Effect of thermal, acoustic, and lighting environment in underground space on human comfort and work efficiency: A review. Sci. Total Environ. 2021, 786, 147537. [Google Scholar] [CrossRef]
  29. Li, J.; Wu, W.; Jin, Y.; Zhao, R.; Bian, W. Research on environmental comfort and cognitive performance based on EEG+VR+LEC evaluation method in underground space. Build. Environ. 2021, 198, 107886. [Google Scholar] [CrossRef]
  30. Han, S.-U.; Jang, J.-H.; Choi, Y. Analysis on the factors affecting the satisfaction of underground shopping centers: From the cases in Busan Metropolitan Region. J. Korea Acad.-Ind. Coop. Soc. 2017, 18, 297–307. [Google Scholar] [CrossRef]
  31. Xu, H.; Huang, Q.; Zhang, Q. A study and application of the degree of satisfaction with indoor environmental quality involving a building space factor. Build. Environ. 2018, 143, 227–239. [Google Scholar] [CrossRef]
  32. Su, Y.; Roberts, A.C.; Yap, H.S.; Car, J.; Kwok, K.W.; Soh, C.-K.; Christopoulos, G.I. White- and blue-collar workers’ responses towards underground workspaces. Tunn. Undergr. Space Technol. 2020, 105, 103526. [Google Scholar] [CrossRef]
  33. Meng, Q.; Kang, J.; Jin, H. Field study on the influence of spatial and environmental characteristics on the evaluation of subjective loudness and acoustic comfort in underground shopping streets. Appl. Acoust. 2013, 74, 1001–1009. [Google Scholar] [CrossRef]
  34. Hoeven, F.v.d.; Nes, A.v. Improving the design of urban underground space in metro stations using the space syntax methodology. Tunn. Undergr. Space Technol. 2014, 40, 64–74. [Google Scholar] [CrossRef]
  35. Zhao, J.; Künzli, O. An introduction to connectivity concept and an example of physical connectivity evaluation for underground space. Tunn. Undergr. Space Technol. 2016, 55, 205–213. [Google Scholar] [CrossRef]
  36. Prasertsubpakij, D.; Nitivattananon, V. Evaluating accessibility to Bangkok Metro Systems using multi-dimensional criteria across user groups. IATSS Res. 2012, 36, 56–65. [Google Scholar] [CrossRef]
  37. Ylinen, J. Spatial planning in subsurface architecture. Tunn. Undergr. Space Technol. 1989, 4, 5–9. [Google Scholar] [CrossRef]
  38. Moliner, L.A.; Clavell, G.G. The TramArt experience: Domesticating graffiti in public transport. J. Place Manag. Dev. 2016, 9, 105–115. [Google Scholar] [CrossRef]
  39. Lee, J.Y.S.; Lam, W.H.K. Levels of service for stairways in Hong Kong underground stations. J. Transp. Eng. 2003, 129, 196–202. [Google Scholar] [CrossRef]
  40. Carmody, J.C.; Sterling, R.L. Design strategies to alleviate negative psychological and physiological effects in underground space. Tunn. Undergr. Space Technol. 1987, 2, 59–67. [Google Scholar] [CrossRef]
  41. Zeng, R.; Shen, Z.; Luo, J. Post-occupancy evaluation of user satisfaction: Case studies of 10 urban underground complexes in China. Tunn. Undergr. Space Technol. 2024, 143, 10550. [Google Scholar] [CrossRef]
  42. Xie, Y.; Liao, J.; Guo, C.; Zhang, K.; Zhang, J.; Yang, K. Lighting environment analysis of Chengdu underground commercial spaces. IOP Conf. Ser. Mater. Sci. Eng. 2020, 741, 012033. [Google Scholar] [CrossRef]
  43. Fontaine, S. Spatial cognition and the processing of verticality in underground environments. In Proceedings of the Conference on Spatial Information Theory, Morro Bay, CA, USA, 19–23 September 2001. [Google Scholar]
  44. Wang, D.C.; Liang, S.; Chen, B.B.; Wu, C.L. Investigation on the impacts of natural lighting on occupants’ wayfinding behavior during emergency evacuation in underground space. Energy Build. 2022, 255, 111613. [Google Scholar] [CrossRef]
  45. Zhang, S.; Park, S. Study of effective corridor design to improve wayfinding in underground malls. Front. Psychol. 2021, 12, 631531. [Google Scholar] [CrossRef] [PubMed]
  46. Tang, S.; Xiang, D.; Yang, H.; Liu, W.; He, G.; Ma, Z.; Wang, J.; Meng, Y.; Shen, S. Research on pathfinding cognition in complex underground public space utilizing eye movement and EEG synchronous detection. Dev. Built Environ. 2023, 16, 100251. [Google Scholar] [CrossRef]
  47. Strategy Consulting Center of the Chinese Academy of Engineering; The Urban Sustainable Development Branch of the China Society of Resource Management and Environment. China’s Urban Underground Space Development Blue Book; Science Press: Beijing, China, 2023. [Google Scholar]
  48. Kaplan, S.; Kaplan, R. Cognition and Environment: Coping in an Uncertain World; Praeger: New York, NY, USA, 1982. [Google Scholar]
  49. Osgood, C.E. The nature and measurement of meaning. Psychol. Bull. 1952, 49, 197–237. [Google Scholar] [CrossRef]
  50. Osgood, C.E. The Measurement of Meaning; University of Illinois Press: Chicago, IL, USA, 1957. [Google Scholar]
  51. Cao, Y.; Huang, L. Research on the healing effect evaluation of campus small-scale courtyards based on the method of semantic differential and the perceived restorative scale. Sustainability 2023, 15, 8369. [Google Scholar] [CrossRef]
  52. Ma, K.W.; Wong, H.M.; Mak, C.M. A systematic review of human perceptual dimensions of sound: Meta-analysis of semantic differential method applications to indoor and outdoor sounds. Build. Environ. 2018, 133, 123–150. [Google Scholar] [CrossRef]
  53. Eckhardt, G. Culture’s consequences: Comparing values, behaviors, institutions and organisations across nations. Aust. J. Manag. 2002, 27, 89–94. [Google Scholar] [CrossRef]
  54. Durmisevic, S. Perception Aspects in Underground Spaces Using Intelligent Knowledge Modeling. Ph.D. Thesis, Delft University of Technology, Delft, The Netherlands, 2002. [Google Scholar]
  55. T/CSRME 012-2021; Standard for Quality Evaluation of Urban Underground Space. Chinese Society for Rock Mechanics and Engineering: Beijing, China, 2021.
  56. Kanire, G. Social Science Research Methodology: Concepts, Methods and Computer Applications; GRIN Verlag: Munich, Germany, 2013. [Google Scholar]
  57. Lynch, K. The Image of the City; MIT Press: Cambridge, MA, USA, 1960. [Google Scholar]
  58. Xu, Y.; Chen, X. Uncovering the relationship among spatial vitality, perception, and environment of urban underground space in the metro zone. Undergr. Space 2023, 12, 167–182. [Google Scholar] [CrossRef]
  59. Debrock, S.; Van Acker, M.; Admiraal, H.W. Design recommendations for sustainable urban underground spaces. Tunn. Undergr. Space Technol. 2023, 140, 105332. [Google Scholar] [CrossRef]
  60. Wiener, J.M.; Hölscher, C.; Büchner, S.; Konieczny, L. Gaze behaviour during space perception and spatial decision making. Psychol. Res. 2012, 76, 713–729. [Google Scholar] [CrossRef]
  61. Wongbumru, T.; Dewancker, B. Post-occupancy evaluation of user satisfaction: A case study of “old” and “new” public housing schemes in Bangkok. Archit. Eng. Des. Manag. 2016, 12, 107–124. [Google Scholar] [CrossRef]
  62. Tan, Z.; Roberts, A.C.; Lee, E.H.; Kwok, K.-W.; Car, J.; Soh, C.K.; Christopoulos, G. Transitional areas affect perception of workspaces and employee well-being: A study of underground and above-ground workspaces. Build. Environ. 2020, 179, 106840. [Google Scholar] [CrossRef]
  63. Machleit, K.A.; Kellaris, J.J.; Eroglu, S.A. Human versus spatial dimensions of crowding perceptions in retail environments: A note on their measurement and effect on shopper satisfaction. Mark. Lett. 1994, 5, 183–194. [Google Scholar] [CrossRef]
  64. d’Astous, A. Irritating aspects of the shopping environment. J. Bus. Res. 2000, 49, 149–156. [Google Scholar] [CrossRef]
  65. Eroglu, S.A.; Machleit, K.A.; Chebat, J.C. The interaction of retail density and music tempo: Effects on shopper responses. Psychol. Mark. 2005, 22, 577–589. [Google Scholar] [CrossRef]
  66. Brengman, M.; Willems, K.; Joye, Y. The impact of in-store greenery on customers. Psychol. Mark. 2012, 29, 807–821. [Google Scholar] [CrossRef]
  67. Van Kerrebroeck, H.; Brengman, M.; Willems, K. Escaping the crowd: An experimental study on the impact of a virtual reality experience in a shopping mall. Comput. Hum. Behav. 2017, 77, 437–450. [Google Scholar] [CrossRef]
  68. Park, S.; Zhang, S. A pilot study of circulation layout based on perceived retail crowding. J. Retail. Consum. Serv. 2019, 49, 305–315. [Google Scholar] [CrossRef]
  69. Xue, M.H.; Hu, J.Y.; Zhang, S.S.; Huang, J.Y. Sense of security evaluation of underground streets in Japan from the pedestrians’ perspective: A case study of Nagoya. New Archit. 2021, 1, 63–68. [Google Scholar]
  70. Ortegón-Cortázar, L.; Royo-Vela, M. Nature in malls: Effects of a natural environment on the cognitive image, emotional response, and behaviors of visitors. Eur. Res. Manag. Bus. Econ. 2019, 25, 38–47. [Google Scholar] [CrossRef]
  71. Bell, P.A.; Greene, T.C.; Fisher, G.D.; Baum, A. Environmental Psychology, 5th ed.; Psychology Press: London, UK, 2005. [Google Scholar]
Figure 1. Locations of 12 USMs in the city center of Nanjing.
Sustainability 17 02717 g001
Figure 2. The word cloud map of 12 USMs.
Sustainability 17 02717 g002
Figure 3. Research framework.
Sustainability 17 02717 g003
Figure 4. Example of SD scale on questionnaire.
Sustainability 17 02717 g004
Figure 5. Five elements of the USM image.
Sustainability 17 02717 g005
Figure 6. An illustration of each element in a USM.
Sustainability 17 02717 g006
Figure 7. Individual characteristics and social activity levels.
Sustainability 17 02717 g007
Figure 8. SD evaluation scores of sampled USMs.
Sustainability 17 02717 g008
Figure 9. SD evaluation curve of sampled USMs.
Sustainability 17 02717 g009
Figure 10. Examples in USMs. Corridor forms: (a) annular type; (b) radial type. Layouts of atriums: (c) regular, (d) free fold, and (e) curved. Entrance configurations: (f) network, (g) basic, and (h) complex.
Sustainability 17 02717 g010
Figure 11. Correlations between spatial eigenvalues and user perception scores (SD).
Sustainability 17 02717 g011
Figure 12. Unique features of USMs in five architectural elements and associated key design points.
Sustainability 17 02717 g012
Figure 13. (a) Relationship between corridor length and overall satisfaction; (b) relationship between corridor aspect ratio and overall satisfaction; and (c) illustration of aspect ratio comfort range.
Sustainability 17 02717 g013
Figure 14. “Fishbone” spatial layout.
Sustainability 17 02717 g014
Table 1. Metrics for evaluation of USMs based on the SD method.
ClassificationAttributeAdjective Pair
1Spatial formAtrium/plaza broadness (APB)Narrow/Wide
2Atrium/plaza scale sense (APS)Repressed/Wide-open
3Channel spatial scale sense (CSS)Repressed/Wide-open
4Channel space length (CL)Short/Long
5Spatial richness (SR)Single/Rich
6Spatial openness (SO)Closed/Open
7Physiological environmentNoise (N)Noticeable/Slight
8Lighting (L)Insufficient/Plenty
9Air (A)Poor/Clear
10Humiture (H)Uncomfortable/Suitable
11Functional serviceBoundary sense (BS)Blurred/Clear
12Direction sense (DS)Confused/Clear
13Rest space (RS)Insufficient/Sufficient
14Accessibility (Ac)
Local characteristics
Inconvenient/Convenient
15Esthetic experienceLocal characteristics (LC)Indistinctive/Distinctive
16Artistic sense (AS)Unartistic/Artistic
17Natural sense (NS)Unnatural/Natural
18Spatial attraction (SA)Unattractive/Attractive
19Color diversity (CD)Single/Various
Table 2. Survey content for each USM image element.
ElementSurvey ContentReferences
PathsA1. Corridor form;
A2. Corridor aspect ratio (W:H);
A3. Corridor length (m).
[18,22,41,58,59]
EdgesB1. Difference in primary color in areas;
B2. Difference in primary lighting in areas;
B3. Proportion of daylight brought from glass ceilings in the area of the total area (%).
DistrictsC1. Number of internal space functions (kinds).
NodesD1. Entrance form;
D2. Atrium plan form;
D3. Atrium area (m2);
D4. Square area (m2);
D5. Square aspect ratio (W:H);
D6. Sunken square area (m2).
LandmarksE1. Natural elements;
E2. Number of resting seats (places);
E3. Art elements;
E4. Signage systems.
Note: A1/B1/B2/D1/D2/E1/E3/E4 are descriptive, and A2/A3/B3/C1/D3/D4/D5/D6/E2 are measurable. B1 includes colors, materials, and decorations; B2 includes illuminance, color temperature, and light sources; E1 includes plants, greenery, water, and fountains; E4 includes facilities located on the ground, walls, pillars, and ceilings, as well as vertical panels and smart devices.
Table 3. Classification of architectural descriptive characteristics.
AttributeCategoryPercent
A10—Annular type
1—Radial type
2—Mixed type
41.7%
25%
33.3%
B10—None
1—One difference
2—Two differences
3—Three differences
25%
41.7%
8.3%
25%
B20—None
1—One difference
2—Two differences
3—Three differences
16.7%
41.7%
8.3%
33.3%
D10—Basic layout (UP + GF)
1—Complex layout (UP + GF + Sur)
2—Complex layout (UP + GF + Sub)
3—Network layout (UP + GF + Sub + Sur)
8.3%
33.3%
41.7%
16.7%
D20—Regular type
1—Curved type
2—Free fold type
16.7%
33.3%
8.3%
E10—None
1—One kind
2—Two kinds
33.3%
50%
16.7%
E30—None
1—One–two kinds
2—>Two kinds
8.3%
75%
16.7%
E40—Two kinds
1—Three–four kinds
2—>Four kinds
16.7%
58.3%
25%
Note: UP is underground parking, GF is ground floor, Sub is subway, and Sur is surface.
Table 4. Influence of individual characteristics on environmental perceptions.
Individual CharacteristicBStd.
GenderMale
Female
−0.34
−0.68
0.16 *
0.12 ***
Age
(years)
<18
18–25
25–36
36–45
46–55
>55
−0.51
−0.53
−0.69
−1.02
1.38
−0.47
0.32
0.14 ***
0.17 ***
0.27 ***
0.18 ***
0.86
Frequency
of visits
Occasionally
Often, but not every day
Almost every day
−0.52
−0.65
−0.45
0.12 ***
0.16 ***
0.14 ***
Method
of orientation
Sense of orientation
Visual information signs
Both
−0.44
−1.01
−0.39
0.21 *
0.20 ***
0.13 **
EntranceSouterrain
Subway
Ground
Underground parking
−0.76
−0.61
−0.54
−0.30
0.23 **
0.17 ***
0.16 ***
0.23
Time of
interview
09:00–11:00
11:00–14:00
14:00–19:00
19:00–22:00
−0.52
−0.55
−0.85
0.14
0.21 *
0.16 ***
0.18 ***
0.24
Day of week
of interview
Working day
Weekend
−0.14
−0.72
0.18
0.11 ***
*** p < 0.001, ** p < 0.01, * p < 0.05.
Table 5. Influence of architectural spatial characteristics on users’ environmental perceptions.
ElementCharacteristicBStd.
PathsA1. Corridor form
A2. Corridor aspect ratio
A3. Corridor length
−1.38
−0.36
−0.91
0.12 ***
0.17
0.22 *
EdgesB1. Difference in primary color in areas
B2. Difference in primary lighting in areas
B3. Daylight proportion
0.99
0.44
0.28
0.14 **
0.16 **
0.76
DistrictsC1. Number of internal space functions−1.380.11 ***
NodesD1. Entrance form
D2. Atrium plan form
D3. Atrium area
D4. Square area
D5. Square aspect ratio
D6. Sunken square area
−0.98
0.17
0.40
−0.40
−0.40
−0.28
0.18 **
0.25
0.21 *
0.21 *
0.21 *
0.76
LandmarksE1. Natural elements
E2. Number of resting seats
E3. Art elements
E4. Signage systems
0.97
−0.40
−0.33
0.99
0.14 **
0.64
0.71
0.23 *
*** p < 0.001, ** p < 0.01, * p < 0.05.
Disclaimer/Publisher’s Note: The statements, opinions and data contained in all publications are solely those of the individual author(s) and contributor(s) and not of MDPI and/or the editor(s). MDPI and/or the editor(s) disclaim responsibility for any injury to people or property resulting from any ideas, methods, instructions or products referred to in the content.

