Abstract
Green technological innovation is an essential pathway for transforming extensive production methods characterized by “high energy and high emissions”, achieving corporate green transformation, and ascending the value chain. Adhering to the scientific principles of energy conservation, emission reduction, and low-carbon development, this study, set against the backdrop of carbon peak, constructs a green technological innovation ecosystem comprising government, enterprises, and consumers. It analyzes the evolutionary processes of each stakeholder and the system under different scenarios, further simulating the impact of various factors on system equilibrium through numerical simulations. The research reveals that proactive government regulation can guide enterprises toward green technological innovation and the development of low-carbon production; an increase in consumers’ green preferences helps to expand the green consumer market and stimulates enterprises’ willingness to innovate greenly; and the initial strong willingness of each stakeholder significantly influences the system’s evolutionary path. Based on evolutionary game theory, this paper enriches the theory of green technological innovation ecosystems and provides references for overcoming barriers such as the difficulty in expanding the green consumer market and the premium pricing of green products during the green consumption process.
1. Introduction
Since the early 21st century, global warming has intensified, with anthropogenic carbon emissions increasing by 1.5% annually over the past decade, reaching 36.8 billion metric tons in 2022 [1]. According to “Made in China 2025”, the Chinese government aims to comprehensively implement the green transformation of the manufacturing industry and accelerate the establishment of a world-leading low-carbon, zero-carbon, and negative-carbon technological innovation system. It is evident that the progress of constructing China’s green ecological civilization continues to advance, with the concept of low-carbon and environmental protection becoming a widespread consensus. Traditional manufacturing industries and industrial civilizations face the challenge of green transformation and upgrading. In the specific planning of the carbon peak achievement path, the role of green and low-carbon production is particularly important. Traditional manufacturing and energy industries must align with historical trends by accelerating the elimination of extensive production methods and transitioning to green and clean production to achieve value chain ascension. Faced with enormous resource and environmental pressures, sustainable development is the inevitable path to effectively improve resource utilization efficiency and enhance the competitiveness of enterprises. Innovation has become one of the most important sources of sustainable competitiveness for enterprises [2,3]. Technological innovation is the driving force behind the transformation of production methods; only through green technological innovation can green production be realized, creating dual economic and environmental value effects. Breakthrough green innovative technologies can enable enterprises to gain sustainable development capabilities, overcome existing bottlenecks and constraints, and further enhance the sustainable competitiveness of Chinese enterprises in the international market [4], striving to achieve carbon neutrality ahead of schedule.
This study addresses these gaps by constructing a tripartite evolutionary game model integrating government regulation, enterprise innovation, and consumer behavior under carbon peaking constraints. Drawing on Handayani et al. [5], who emphasized institutional complementarity in energy transitions, we analyze threshold effects of subsidy-penalty mechanisms and identify critical leverage points for market expansion. Our contributions are threefold: (1) quantifying threshold effects of subsidy-penalty mechanisms on stakeholder equilibria; (2) identifying critical leverage points for expanding green consumer markets; and (3) providing actionable insights for designing adaptive policies that align with China’s dual carbon goals. By bridging macro-level regulatory frameworks with micro-level behavioral dynamics, this research advances the theoretical underpinnings of GTI ecosystems while offering pragmatic solutions for sustainable transition governance.
2. Literature Review
Given that green production is influenced by multiple external factors, relying solely on market mechanisms almost cannot achieve the optimal level of social production inputs. Therefore, government regulation and appropriate intervention can effectively overcome market failures and ensure the sustainable growth of sustainable agriculture and social productive forces [6]. On one hand, the ultimate goal of enterprise production is to maximize profits. If the government does not strengthen environmental regulation, enterprises typically will not proactively take measures for environmental protection and pollution control; some may even evade corresponding environmental responsibilities [7]. On the other hand, due to the limitations of their own perspectives, enterprises find it difficult to fully recognize the potential benefits of green production and technological innovation from a global viewpoint. Therefore, government intervention is necessary to help enterprises realize and seize the economic benefits of green production. Studies have shown that effective fulfillment of corporate environmental responsibilities is mainly driven by stricter environmental regulations; at the same time, the proactive fulfillment of corporate environmental responsibilities significantly enhances the sustainability of enterprises [8,9,10]. Regarding the impact of government environmental regulation on enterprise green technological innovation and production performance, scholars both domestically and internationally have conducted extensive explorations based on different backgrounds, data, and industries. Currently, there are two different opinions in academia regarding government regulation. One school of thought believes that the government should set stronger mandatory standards, such as emission standards [11] and product bans [12,13]. Command-and-control environmental regulations can significantly induce the willingness and behavior of green technological innovation [14]. Wu et al. [15] demonstrated through evolutionary game theory that enterprises are more sensitive to the severity of penalties and the distribution of benefits. Another viewpoint argues that since the ultimate goal of enterprises is profit maximization, market-based tools are more effective than mandatory policy tools in incentivizing enterprises. For example, imposing pollution taxes on traditional production and providing R&D funding, production subsidies, and incentives to green production enterprises can economically motivate corporate green behaviors [16,17]. Government subsidies play a positive moderating role in the impact of environmental regulation on enterprise green innovation [18]. Xiao and Zhao [19] believe that command-and-control environmental regulations can easily lead to vicious cycles of “race to the bottom”, while market-incentive environmental regulations promote competitive games that improve practices. Additionally, some scholars argue that relying solely on government regulation or market-based tools cannot fully stimulate enterprises’ enthusiasm for green production. A diversified combination of environmental regulations has a more significant promoting effect on green production. For example, mutual communication regulatory tools promote enterprise green product innovation and end-of-pipe treatment technology innovation [20,21,22], fee-based environmental regulations and investment-based regulations improve green productivity [23,24], and innovation subsidies and failure compensations can enhance enterprises’ confidence in green innovation [25]. Therefore, government policies should not only focus on the intensity of environmental regulation but also adopt diversified environmental policies, gradually transforming the environmental regulation process from traditional command-and-control to market-driven, and continuously formulate more market-friendly environmental regulations to provide incentives for enterprises, ultimately achieving simultaneous improvement of environmental quality and economic growth.
Green production has received extensive attention from society and academia. However, green products have not been widely popularized or become the mainstream of the consumer market. One reason is that enterprise green technological innovation leads to slightly higher prices of green products. Another reason is that consumers’ environmental awareness varies, and the market size for green products has not expanded synchronously with production scales. Existing studies have demonstrated the importance of consumers’ perceived value and satisfaction in promoting the diffusion of green innovation [26]. In the enterprise green supply chain, the higher the consumers’ environmental threshold and environmental awareness, the higher the system benefits of the supply chain [27,28]. However, current research on individual-level influencing factors is still in its infancy, and future studies need to identify more individual-level influencing factors.
Currently, scholars have conducted diverse studies focusing on the green technological innovation system composed of the government, enterprises, and consumers, but the research is not yet comprehensive. Regarding the cost issue of green production, Song and Sun [29] believe that proactive government regulation and full cooperation of enterprises not only promote the virtuous development of the circular economy but also represent the best strategic choice for enterprises to survive and develop in the larger context. However, their research neglects the consumer perspective. Zhao et al. [30] studied the evolutionary process of strategy choices between consumers and enterprises but lacked consideration of the macro-environment and the participation of government entities. Wang and Li [31], using system dynamics, studied the factors affecting equilibrium strategy choices, including consumers’ green preferences, product prices, government subsidy coefficients, and government regulation costs, etc., but did not consider the differences in initial willingness among various stakeholders.
The Chinese government is focusing on the green innovation ecosystem to promote green collaborative innovation activities within government–industry–academia–research alliances. However, due to the high cost of clean technology innovation, low profits, and long investment return cycles, the green innovation ecosystem often lacks stability [32]. The green innovation ecological network still has a large number of blank connections, which is a key constraint hindering structural evolution; furthermore, the green innovation ecological network has preferential connections and power-law distributions, leading to the inability of proactive green innovation strategies to fully converge under any initial strategy proportions [33]. Case studies of Chinese enterprises show that under the influence of enterprises pursuing maximum profit strategies, the intensity of shared willingness among enterprises within the green innovation ecosystem is negatively correlated with cooperation time [34].
In summary, to fulfill carbon reduction commitments and achieve green ecological civilization, green production is an indispensable path, and green technological innovation provides continuous impetus for green production. The green innovation ecosystem offers an important pathway for balancing exploratory and exploitative technological innovations in the manufacturing processes of green enterprises [35]. Enterprises are the main bodies of green technological innovation, and the environmental and economic performance generated by green technological innovation is closely related to consumers and the government. Consumers’ preferences and demands for green products affect the scale of enterprise production [36], while the government faces the issues of how to incentivize enterprises to engage in green production and how to expand the green consumer market. Changes in the strategy choices of any participating stakeholder will cause corresponding changes in the strategies of other related parties, forming a dynamically adjusting green system. The essence of the evolution of the green innovation ecosystem is the dissemination of proactive green innovation strategies within a complex network [33]. Previous studies have rarely simultaneously considered the strategy choices and impacts of consumers, enterprises, and the government. Therefore, building on previous research, this paper aims to construct an evolutionary analysis framework for the green innovation ecosystem. Through an evolutionary game model of a multi-stakeholder green technological innovation system, it analyzes the decision-making processes of different stakeholders and the impacts of green technological innovation, and combines numerical simulations to provide strategic recommendations for promoting the development of ecological civilization.
3. Research Methods and Model Construction
3.1. Model Assumptions
3.1.1. Strategy Choices and Probability Distributions of Game Participants
In the evolutionary game model, the government, enterprises, and consumers serve as the primary players. Their strategy choices are based on the assumption of bounded rationality, continuously adjusting their behaviors through dynamic comparisons of benefits and costs. The following sections provide a detailed analysis of the strategy choices and probability distributions of these three participants from a logical perspective.
- (1)
- Connotation of Bounded Rationality Assumption
The assumption of bounded rationality is a crucial premise of the evolutionary game model. It posits that game participants cannot fully grasp all information or make globally optimal decisions. Instead, they optimize their strategies through local learning and trial-and-error processes. Participants gradually update their strategy probabilities based on past experiences and the returns from their strategies, rather than directly achieving global optimality. Strategy selection is driven by perceived returns in the current game state, forming a dynamic adjustment process.
- (2)
- Enterprises’ Strategy Choices and Probability Distributions
Enterprises in the evolutionary game possess two strategic options: green technological innovation (with probability ) and traditional production (with probability ). The probability of choosing green technological innovation is directly related to the benefits enterprises derive from green products, including market revenue, brand value enhancement, and government subsidies. Conversely, the probability of opting for traditional production is influenced by pollution fees and market share loss. The high costs of green production may reduce , whereas increased government subsidies or heightened pollution fees will elevate . When the total revenue from green production () surpasses that from traditional production (), increases; otherwise, decreases.
- (3)
- Consumers’ Strategy Choices and Probability Distributions
Consumers have two strategic choices: purchasing green products (with probability ) and purchasing traditional products (with probability ). The probability of choosing green products depends on the trade-off between perceived benefits (such as environmental value and social responsibility) and cost utility (such as purchase price and functional utility). When the premium of green products exceeds consumers’ acceptable range, decreases; conversely, with price reductions or enhanced government promotion, increases. The consumers’ green preference coefficient is a key driver of ; the stronger the green preference, the closer approaches 1.
- (4)
- Government’s Strategy Choices and Probability Distributions
The government has two strategic options: adopting proactive regulation (with probability ) and opting for passive regulation (with probability ). The probability of choosing proactive regulation is determined by the government’s environmental benefits (such as pollution reduction and enhanced social reputation) and regulatory costs (subsidy expenditures and administrative costs). When regulatory costs exceed the sum of environmental benefits () and reputation gains (), decreases; conversely, significant subsidies and effective regulation lead to an increase in . Public demands for environmental governance and international climate commitments also elevate .
- (5)
- Comprehensive Analysis: Interactivity of Strategy Choices
The strategy choices of the government, enterprises, and consumers exhibit dynamic interactivity, with the behavior probabilities of the three parties influencing each other. Firstly, through subsidies, publicity, and pollution fee policies, the government increases the probability of enterprises engaging in green production and the probability of consumers choosing green products. Secondly, enterprises’ green production improves environmental quality, enhancing consumers’ perceived benefits and social welfare while reducing the government’s environmental governance costs, thereby boosting and . Additionally, the strengthening of consumers’ green preferences expands the green market, driving enterprises toward green production and providing the government with incentives to adjust policies.
- (6)
- Stability Analysis
Whether the probability distributions of strategy choices stabilize depends on whether the differences in benefits converge. When , the strategy choice probabilities of the three parties reach a stable state, corresponding to an Evolutionarily Stable Strategy (ESS) in the evolutionary game model. During the dynamic adjustment process, the bounded rationality decisions of the three parties may lead to cyclical fluctuations in strategy probabilities or multiple equilibrium states. Policy interventions such as subsidies, fines, or publicity are necessary to achieve stability.
Therefore, the strategy choices and probability distributions of the game participants not only reflect their dynamic decision-making processes under bounded rationality but also determine the evolutionary path of the green technological innovation ecosystem. By analyzing the interactions and driving factors of , , and , this study provides a theoretical basis for policy optimization, aiding in the achievement of green technological innovation goals under the carbon peak context.
3.1.2. Measures of Proactive Regulation by the Government and Its Cost Structure
Based on the research framework of the evolutionary game model, the government primarily adopts the following three types of measures in proactive regulation: incentivizing technological innovation, levying pollution fees, and intensifying green consumption publicity. Specifically, these measures include the following:
- (1)
- Incentivizing Technological Innovation
The government provides research and development subsidies and rewards to enterprises that adopt green technological innovations and offer green products. The subsidy cap is , and the actual subsidy is determined by the subsidy coefficient .
The subsidy coefficient α1 measures the extent of economic support the government provides to enterprises engaging in green technological innovation. Its value ranges within , representing the proportion of the subsidy relative to the enterprise’s green production costs. When , the government does not provide subsidies; when , the government fully covers the costs of green technological innovation for enterprises. The economic implications of the subsidy coefficient are as follows:
Increase in : Directly reduces the cost of green production for enterprises, enhancing their motivation to adopt green technological innovations. High subsidies help shorten the R&D cycle for green technologies, reduce financial pressures on enterprises, and significantly bolster competitiveness, especially for small and medium-sized enterprises.
Excessive : May impose excessive fiscal pressure on the government, potentially undermining policy sustainability. Therefore, the government needs to dynamically adjust the subsidy intensity based on the green transformation needs of different regions and industries.
Optimal : Should ensure that the net benefits of green technological innovation exceed those of traditional production while remaining within the government’s fiscal budget. An appropriate range for α1 is , within which the evolutionary rate of enterprise green production significantly accelerates.
- (2)
- Punishing Traditional Production
For enterprises continuing to adopt traditional polluting production methods, the government imposes pollution fees as a punitive measure. The pollution fee cap is , and the actual fine is determined by the pollution coefficient .
The punishment coefficient measures the intensity of pollution fees imposed by the government on enterprises using traditional high-pollution production methods. Its value ranges within , representing the proportion of the fine relative to the profits from traditional production. When , the government does not levy pollution fees; when , the profits from traditional production are entirely offset by fines. The economic implications of the punishment coefficient are as follows:
Increase in : Raises the costs of traditional production, compelling enterprises to choose green technological innovations to avoid financial risks, especially when profits from traditional production are significantly penalized.
High : Can substantially reduce environmental pollution governance costs. However, excessively high punishment coefficients may lead to enterprise exits from the market, causing instability in the industrial chain.
Optimal : Should ensure that the net benefits of traditional production are lower than those of green production while avoiding large-scale enterprise withdrawals. An appropriate range for is , within which enterprises’ willingness to engage in green production and consumers’ willingness to purchase green products are significantly enhanced, and government regulatory costs are effectively controlled.
- (3)
- Regulatory Costs and Environmental Governance Costs
In implementing proactive regulation, the government incurs regulatory costs . Additionally, due to pollution generated by traditional production methods, the government must expend environmental governance costs to restore the ecological environment.
Government Regulatory Costs: Measure the financial expenditures associated with implementing subsidies, levying taxes, and conducting market publicity.
Environmental Governance Costs: Reflect the funds required by the government to manage pollution and restore the environment.
The government’s regulatory costs should be less than the sum of environmental benefits and reputation gains, i.e., , to ensure the economic sustainability of policies. Studies on water pollution control indicate that developing countries should incorporate both agricultural and industrial sectors into environmental governance to maximize the coordination of cross-sectoral environmental policies [37].
In summary, these measures constitute the core components of the government’s proactive regulation strategy and directly influence the strategy choices and system stability of the three participants in the evolutionary game.
3.1.3. Composition of Benefits and Costs of Enterprises’ Green Technological Innovation
Enterprises engaging in green technological innovation and offering green products experience a multi-dimensional composition of benefits and costs, closely related to market demand, government policies, and the enterprises’ own technological capabilities. The following sections provide a detailed logical analysis of the benefits and costs associated with enterprises’ green technological innovation.
- (1)
- Benefits of Enterprises’ Green Technological Innovation
These include the following:
Brand Value Enhancement (): Through green technological innovation, enterprises can effectively improve their brand image, earning consumer trust and market recognition, thereby increasing brand value. Brand value enhancement is reflected not only in the improved premium pricing ability of products but also in the long-term competitiveness of the enterprise. As consumers’ green preferences increase, the market demand for green products gradually rises, making brand value enhancement a significant incentive for enterprises to adopt green production. Government proactive regulation policies (e.g., green certifications, subsidies) enhance the market reputation of green brands, further amplifying brand value enhancement.
Government Environmental Benefits (): Enterprises adopting green technological innovations can significantly reduce pollution emissions during production processes, thereby decreasing the government’s environmental governance costs and improving ecological environmental quality, resulting in government environmental benefits . Green production reduces damage to ecosystems, supporting the government’s sustainable development goals. By decreasing expenditures on environmental governance, the government can allocate saved resources to other economic or social development areas.
- (2)
- Costs of Enterprises’ Green Technological Innovation
The specific classifications of costs associated with enterprises’ green technological innovation are as follows:
Production Costs of Green Products (): The production costs of green products are higher than those of traditional products, primarily due to research and development investments, equipment upgrades, and the procurement of green materials. These additional costs pose significant barriers during the initial stages of enterprise transformation. Green technological innovation requires substantial upfront R&D investments, with a complex cost structure and delayed returns. As production scales up, the unit production cost of green products may gradually decrease, achieving cost optimization.
Production Costs of Traditional Products (): Compared to green products, the production costs of traditional products are lower. However, they include implicit environmental damage costs, which negatively impact social welfare and government finances in the long term.
- (3)
- Sales Revenue from Enterprises’ Green Technological Innovation
The sales revenue from enterprises’ green technological innovation is categorized as follows:
Sales Revenue from Green Products (): Green products typically have higher market pricing capabilities due to their added value (e.g., environmental attributes, consumer preferences), resulting in higher sales revenue . However, their market performance depends on factors such as consumers’ green preference coefficient and government policy support (e.g., subsidies, tax incentives).
Sales Revenue from Traditional Products (): The sales revenue from traditional products is relatively stable but may face market contraction and increased pollution fees and other additional expenditures due to their environmental destructiveness.
- (4)
- Comprehensive Analysis and Strategy Selection
The benefits and costs of enterprises’ green technological innovation ultimately influence their strategy choices. To make green technological innovation a sustainable option, the government needs to intervene through policies (e.g., subsidies and pollution fees) to narrow the cost gap between green production and traditional production, thereby promoting enterprises to evolve toward green production.
Through the aforementioned logical analysis, it is evident that enterprises’ green technological innovation is not only a crucial pathway for maximizing their economic benefits but also a key link in enhancing government ecological benefits and meeting consumers’ green demands. This complex structure of benefits and costs provides theoretical support and practical basis for the strategy choices of enterprises within the evolutionary game model.
3.1.4. Utility and Benefit Composition of Consumers’ Purchase Decisions
Consumers’ decisions to purchase green or traditional products are influenced by multiple factors, including basic utility, purchase costs, government regulatory measures, and perceived benefits. The following sections provide an in-depth logical analysis of consumers’ purchase decisions from the perspective of utility and benefit composition (see Table 1).

Table 1.
Variables and their specific meanings.
- (1)
- Basic Utility (U)
Regardless of whether consumers choose to purchase green or traditional products, they obtain a basic functional utility . This utility reflects the product’s ability to meet consumers’ fundamental needs and is not directly related to the product’s green attributes. Firstly, basic utility is a necessary condition for purchase decisions but not a sufficient one. If the purchase cost of green products is higher than that of traditional products and the perceived benefits are low, consumers are more inclined to choose traditional products to satisfy functional needs. Secondly, as the functionality of green products improves and aligns with that of traditional products, the equilibrium of basic utility will promote consumers to choose green products.
- (2)
- Purchase Cost (P)
The purchase costs of green and traditional products are significant economic factors influencing consumers’ decisions. Green products, due to their higher production costs, often have higher prices than traditional products. The difference in purchase costs (green products) and (traditional products) directly affects consumer choices. Firstly, if the added value of green products (perceived benefits and social welfare) does not cover their additional price premium, consumers may switch to traditional products. Secondly, government subsidy policies that lower the price of green products or punitive policies that increase the price of traditional products can narrow the cost gap between the two, encouraging consumers to choose green products.
- (3)
- Social Welfare (G)
Government proactive regulatory measures (e.g., environmental governance, policy subsidies) can significantly improve the ecological environment, thereby enhancing consumers’ social welfare . Firstly, social welfare represents the external benefits indirectly obtained by consumers, typically manifested as improved environmental quality and better living conditions. This benefit plays a supplementary role in consumers’ decision-making. Secondly, when increases to a certain extent (e.g., significant environmental improvement), its marginal utility may diminish, making consumers’ choices of green products more reliant on direct perceived benefits.
- (4)
- Perceived Benefits (W)
Through vigorous government publicity and market education, green consumers gradually recognize the environmental value and social significance of green products, thereby obtaining perceived benefits . This benefit reflects the guiding role of consumers’ green preference in their purchasing behavior. The consumers’ green preference coefficient ranges within , where indicates a complete preference for traditional products, and indicates a complete preference for green products. Firstly, perceived benefits include psychological satisfaction, a sense of social responsibility, and recognition of contributions to environmental protection. Secondly, the higher the green preference coefficient , the greater the demand for green products, and the more significant the market pull for green technological innovation. Thirdly, the larger the perceived benefits , the more inclined consumers are to choose green products. Fourthly, the suitable range for the consumers’ green preference coefficient is , within which the green consumer market scale expands significantly.
- (5)
- Government Reputation Benefits (S)
When consumers choose green products due to the government’s proactive regulation and publicity, the government gains reputation benefits from the effective implementation of its policies. This benefit not only enhances the government’s image but also provides political and social support for further environmental policy implementation. Firstly, the government enhances consumers’ green preferences through publicity, and consumers’ choices, in turn, bring reputational benefits to the government. Secondly, the increase in reputation benefits provides the government with motivation and justification for resource allocation and policy design.
In conclusion, consumers’ purchase decisions are a comprehensive result of multi-dimensional utility and benefits, with the core logic centered on the trade-off between perceived benefits and purchase costs . The market promotion of green products requires support from government regulatory policies (e.g., subsidies and publicity) to amplify perceived benefits and the marginal utility of social welfare while narrowing the purchase cost gap between green and traditional products. On this basis, consumers’ green preference plays a decisive guiding role, laying the foundation for the expansion of the green consumer market. Through the above analysis, the utility and benefit composition of consumers are key components of the green technological innovation ecosystem, with their dynamic changes directly affecting the strategy adjustments of enterprises and the government, ultimately driving the system toward a green stable state.
It is noteworthy that the key parameters in this study not only reflect the leverage effects of policy tools (subsidies and penalties) but also ensure the sustainability of policies by setting reasonable boundary conditions. Firstly, subsidy coefficients and punishment coefficients should be optimally coordinated within appropriate ranges to achieve a dynamic balance between green production and traditional production. Secondly, the enhancement of consumers’ green preference coefficients should be guided through publicity and education to inject momentum into market demand. Thirdly, government regulatory measures must balance fiscal burdens and policy objectives, harmonizing incentives and constraints to ensure the long-term development of the green technological innovation ecosystem. Through the design of these parameters, this study provides theoretical support and practical basis for green technological innovation under the carbon peak context, clarifying the direction and focus of policy formulation, and assisting in the realization of ecological civilization construction goals.
3.2. Rationale for Model Assumptions
The model’s assumptions are grounded in contemporary research and empirical observations, reflecting the dynamic interplay among government policies, corporate strategies, and consumer behaviors in promoting green technological innovation.
Bounded Rationality and Evolutionary Game Theory: The assumption of bounded rationality acknowledges that decision-makers—governments, enterprises, and consumers—adapt their strategies based on limited information and evolving payoffs. This perspective aligns with evolutionary game theory, which models how strategies evolve over time toward equilibrium rather than assuming instantaneous optimal decisions. Recent studies have utilized evolutionary game theory to analyze interactions among multiple stakeholders in green technology innovation systems, highlighting the importance of adaptive behaviors in achieving sustainable outcomes [38].
Tripartite Actor Framework: Focusing on the interactions among government, enterprises, and consumers is theoretically justified, as these stakeholders collectively drive green innovation. Recent research has expanded this framework to include financial institutions, emphasizing the collaborative efforts required to promote green technology adoption [39].
Government’s Proactive vs. Passive Regulation: The model’s distinction between proactive and passive government regulation reflects contemporary policy debates. Proactive regulation, such as subsidies for green innovation and stringent environmental standards, can incentivize firms to adopt sustainable practices. Conversely, passive regulation may lead to suboptimal investment in green technologies. Recent analyses have demonstrated that government intervention plays a crucial role in diminishing carbon emissions and promoting green innovation within supply chains [40].
Binary Strategy Sets for Enterprises: Simplifying enterprises’ choices to binary strategies—adopting green technologies or not—captures the strategic extremes firms face. This approach is consistent with recent studies that model firms’ decisions to invest in green innovation under varying regulatory and market conditions. For instance, research has shown that firms’ green innovation performance is significantly influenced by external pressures such as customer demand and environmental regulations [41].
Consumer Behavior and Green Preferences: The model assumes that consumers weigh basic utility and price against environmental benefits when choosing between green and conventional products. This assumption is supported by studies indicating that customer pressure positively affects firms’ green innovation performance, especially when reinforced by environmental regulations [42].
Interactive Dynamics and Feedback Loops: The model posits that government policy, enterprise strategy, and consumer behavior are interdependent, creating feedback loops that influence the evolution of green innovation. For example, government incentives can encourage firms to adopt green technologies, which in turn can shift consumer preferences toward sustainable products, further motivating policy support. Recent research utilizing evolutionary game theory has elucidated these dynamic interactions, demonstrating how the strategies of one stakeholder group can significantly influence others’ payoffs and strategic choices [43].
In summary, the model’s assumptions are rooted in contemporary theoretical frameworks and empirical findings. By incorporating bounded rationality, evolutionary game dynamics, and the interactions among key stakeholders, the model provides a robust foundation for analyzing the drivers of green technological innovation.
3.3. Model Construction
Based on the model assumptions, the payoff matrices for the government, enterprises, and consumers under different strategy choices can be derived.
As can be seen from Table 2, the expected benefits for firms offering green products and for firms offering traditional products are as follows:
Table 2.
Corporate payment matrix.
The replication dynamics equation for the business is as follows:
The expected benefits for consumers purchasing green products and for consumers purchasing traditional products are as follows:
The replication dynamics equation for consumers is as follows:
The expected benefits of positive government regulation and of negative regulation are as follows:
The replication dynamics equation for government is as follows:
Thus, the intensity of government regulation depends on whether environmental and reputation benefits can cover the regulation costs, and is also constrained by fiscal budgets and policy stability.
4. Analysis of Evolutionarily Stable Strategies of the Three Parties
To find the evolutionarily stable strategic equilibrium point, let , and . The evolutionarily stable equilibrium points of the firm, consumer, and government are obtained as , , , , , , , and , where is the equilibrium point requiring the following conditions to be satisfied:
The stability of the evolutionary strategy of each subject is analyzed below.
4.1. Asymptotic Stability Analysis of Enterprises
Let , then we have , , and . It follows from the stability theorem for replicated dynamic equations that is an Evolutionarily Stable Strategy when , , where
When , , then is steady state when it takes any value in the interval, and the firm’s probability of strategy choice does not change over time.
When , x = 0 and x = 1 are the two strategies of the firm, which are discussed below in two cases:
- (1)
- When , by substituting and into , respectively, we can obtain and . Then we can know that is the evolutionary stability point. Therefore, when the government’s willingness to take active measures to regulate the market is lower than , firms choose conventional production.
- (2)
- When , , then is the evolutionary stability point. Therefore, when the probability of active government regulation is higher than , firms choose green innovative technologies to provide green products. Based on the above analysis, the replication dynamic phase diagram of the firm is obtained (as shown in Figure 1).
 Figure 1. Replication dynamic phase diagram of enterprise.
4.2. Asymptotic Stability Analysis of Consumers
Let , then we have , , and . When , , is the evolutionary stabilization strategy, where
When , , takes any value in the interval and is in a steady state, and the consumer’s choice probability does not change over time.
When , , and are two different strategies for the consumer in two cases:
- (1)
- When , substituting and into , we obtain and . At this time, is the evolutionary stability point. Therefore, when the strategic probability of a firm offering a green product is lower than , consumers choose not to buy green products enough.
- (2)
- When , and . At this point is the evolutionary stability point, i.e., consumers are willing to buy green products when the probability of the firm’s strategy to produce green products is higher than (as shown in Figure 2).
 Figure 2. Replicated dynamic phase diagram of consumer.
4.3. Asymptotic Stability Analysis of the Government
Let , then we have , , and . From the stability theorem of replicated dynamic equations, is an evolutionary stable strategy when and , where
When , . At this point, takes any value in the interval and is a steady state, and the probability of the government’s strategy choice does not change over time.
When , , and are two strategies of the government, which are discussed below in two scenarios:
- (1)
- When , by substituting and into , we obtain and , then is the evolutionary stability point. That is, when consumers’ willingness to purchase green products is lower than , the green consumption market is depressed, and the government chooses a negative regulation strategy.
- (2)
- When , by substituting and into , we obtain and , then is the evolutionary stability point. Therefore, the government chooses active measures to regulate the market when consumer preferences for green products are higher than (as shown in Figure 3).
 Figure 3. Replicated dynamic phase diagram of government.
4.4. Evolutionary Stability Analysis of the Green Technological Innovation System
The evolutionary stability of the green technological innovation system can be determined through the local stability of the Jacobian matrix of the replicator dynamic system in the evolutionary game. According to Friedman [44], an Evolutionarily Stable Strategy (ESS) is a stable state that the system reaches during the evolutionary process.
In the asymmetric evolution game, the stability of the pure strategy equilibrium is considered, so only eight equilibria , , , , , , , and , need to be discussed in the system evolution game. From the Liyanov discriminant, we know that the equilibrium point is stable (ESS) when all eigenvalues of the Jacobian matrix are negative; the rest are non-stable.
Taking as an example to analyze its asymptotic stability,
Therefore, the eigenvalues of are , , . The stability analysis of the other equilibria is similar, and the eigenvalues of the Jacobian matrix are obtained by substituting the eight equilibria in turn as shown in Table 3.
Table 3.
Jacobian matrix eigenvalues.
When the interests of all parties are satisfied, in order to make the stability analysis simple without losing reasonableness, the initial parameters should meet , , . The stability of the evolutionary game of the model is discussed below in three cases:
- (1)
- When , , and , The gap between the benefits and costs of providing green products is lower than the benefits of providing traditional products. The cost of government regulation is higher than the benefit obtained, and at this point, and corresponding to Jacobian matrix eigenvalues are less than 0 and are equilibrium points. Therefore, {provide traditional products, buy traditional products, and negatively regulate} and {provide green products, buy green products, and positively regulate} are evolutionary stable strategies.
- (2)
- When , , and , government’s emissions charges and subsidies for green products are lower than the difference between the cost of green production and the benefits received by companies when consumers choose traditional products and the sum of the benefits of traditional production by companies. Table 4 shows that the equilibrium points and correspond to negative eigenvalues, at which time {provide traditional products, buy traditional products, and negatively regulate} and {provide green products, buy green products, and positively regulate} are evolutionary stabilization strategies.
Table 4. Local equilibrium point stability analysis.
- (3)
- When or , when consumers choose traditional products, the difference between the benefits and costs of providing green products is only lower than the benefits that companies receive from providing traditional products; or when companies produce green products, the benefits that consumers receive from purchasing green products are higher than the benefits that companies receive from green production when purchasing traditional products. Therefore, corresponding to eigenvalues all less than 0 is the equilibrium point and {provide green products, buy green products, actively regulate} is the evolutionary stabilization strategy.
5. Discussion Based on Simulation Analysis
According to the replication dynamic equation and its constraints, simulation based on Python 3.9.21 software is conducted to analyze the subsidy coefficient , penalty coefficient , and consumer perceived benefits on the evolutionary process of green product production and consumption. Assume that at the initial time, firms, consumers, and government choose different strategies with probability 0.5 and the relevant parameters: , , , , , , , , , , , , , , , , where ,, and are taken as , respectively.
5.1. Impact of Subsidy Coefficient α1 on the Evolutionary Behavior of the Three-Party Game
The evolution path of the tripartite game of green production of enterprises under different subsidy coefficients is shown in Figure 4. In order to encourage green production, the government subsidizes firms that develop green innovations. As the subsidy coefficient increases, firms evolve toward providing green products, consumers tend to purchase green products, and the government evolves toward a negative regulatory strategy.
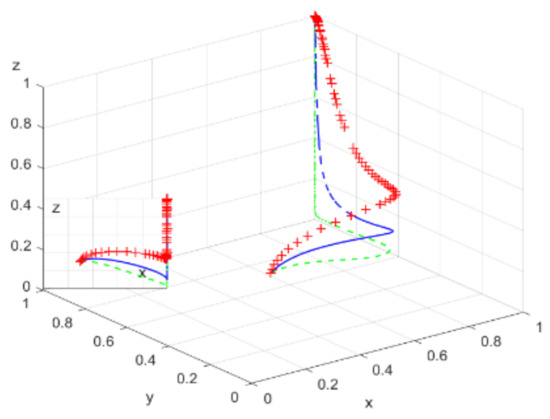
Figure 4.
Evolutionary trajectory of the tripartite game under different subsidy coefficients.
- (1)
- Evolutionary Trends in Enterprises’ Strategy Choices
The evolution of enterprises’ strategy choices over time is depicted in Figure 5. When the subsidy coefficient is low, the total benefits enterprises obtain from green technological innovation are insufficient to cover the high costs of green production, coupled with the government’s low willingness to engage in proactive regulation at this stage, leading enterprises to continue adopting traditional production methods. However, as the subsidy coefficient increases, enterprises gradually recognize the benefits derived from green products, accelerating their evolution toward green production. Particularly, in scenarios with strong initial willingness, enterprises are inclined to assume social responsibility and actively engage in green production even with a relatively small subsidy coefficient. Notably, green human resource management practices (such as building green capabilities, strengthening green motivation, and involving employees in green practices) significantly improve the green behaviors of enterprise employees [45]. Consequently, green human resource management practices enhance employees’ sense of belonging to nature, prompting them to proactively participate in various environmental activities, thereby encouraging enterprises to implement more environmentally friendly practices and ultimately transition to green production. When both the subsidy coefficient and enterprises’ initial willingness increase simultaneously, the rate at which enterprises evolve toward green production accelerates, eventually stabilizing in a green production state.

Figure 5.
Impact of subsidy coefficients on firm evolutionary trajectories with different initial intentions.
- (2)
- Evolutionary Trends in Consumers’ Strategy Choices
The changes in consumers’ strategy choices over time are shown in Figure 6. Under constant initial willingness, when the subsidy coefficient is low, enterprises opt for traditional production, and consumers only obtain the basic utility of traditional products. However, as the subsidy coefficient increases, enterprises choose green production, and consumers gradually evolve toward purchasing green products. When initial willingness increases, consumers’ environmental awareness and green consumption demand also rise accordingly. Within an acceptable premium range, consumers are more willing to purchase green products. Therefore, the larger the subsidy coefficient, the faster consumers evolve toward green consumption. Notably, over time, regardless of the subsidy coefficient’s magnitude, consumers ultimately tend to purchase green products. This may be attributed to two factors: firstly, the government successfully activates the sluggish green consumer market through effective publicity; secondly, consumers’ own green awareness and environmental literacy improve, leading them to choose green products even under the government’s passive regulation.
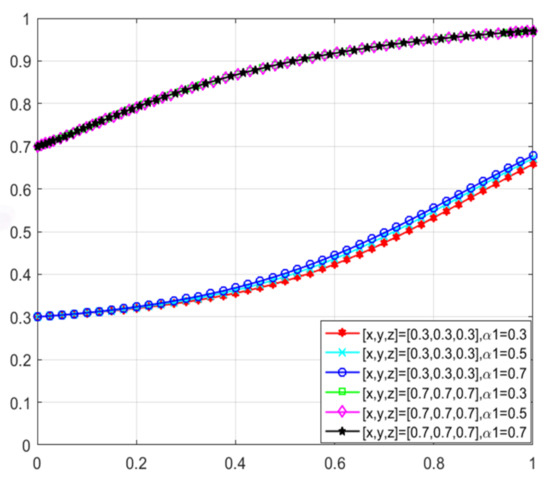
Figure 6.
Impact of subsidy coefficients on consumer evolutionary trajectories with different initial intentions.
- (3)
- Evolutionary Trends in Government’s Strategy Choices
The evolutionary trends in the government’s strategy choices are depicted in Figure 7. When the government’s probability of adopting proactive regulation is low, an increase in the subsidy coefficient leads to a significant rise in regulatory costs, making it difficult for the total benefits from environmental and reputation gains to cover the regulation costs. Consequently, the government’s willingness to regulate significantly declines, gradually evolving toward a passive regulation strategy. Furthermore, as the subsidy coefficient continues to increase, the rate at which the government shifts toward passive regulation accelerates. When the government’s probability of proactive regulation is high, insufficient subsidy intensity hampers enterprises’ green innovation motivation, preventing the government from obtaining corresponding returns from proactive regulation and ultimately leading to a shift toward passive regulation. Conversely, if the subsidy coefficient is excessively high, the government’s financial burden increases, which may also result in a shift toward passive regulation. Therefore, to avoid undermining government interests while effectively promoting enterprises’ green technological innovations, the subsidy coefficient must be controlled within a reasonable range (as shown in Figure 8, Figure 9 and Figure 10).
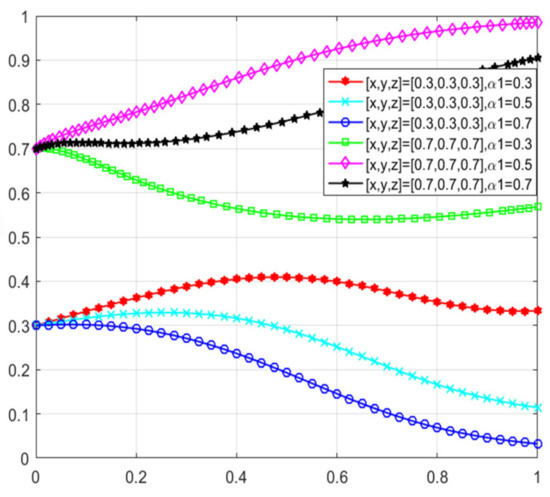
Figure 7.
Impact of subsidy coefficients on government evolutionary trajectories with different initial intentions.
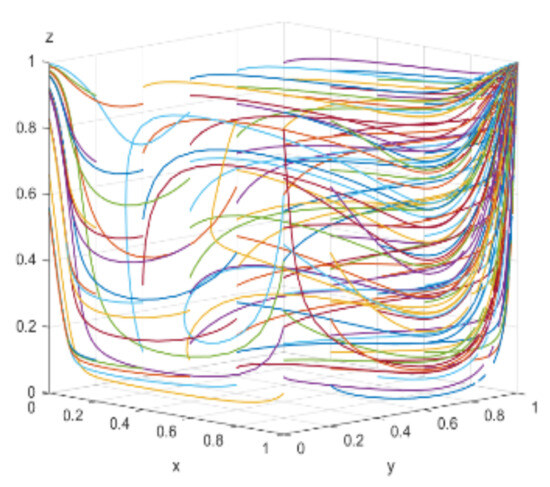
Figure 8.
Results of 50 evolutions when the subsidy coefficients are 0.3.
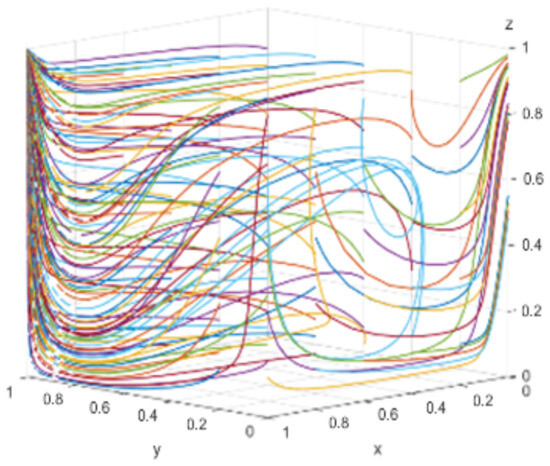
Figure 9.
Results of 50 evolutions when the subsidy coefficients are 0.5.
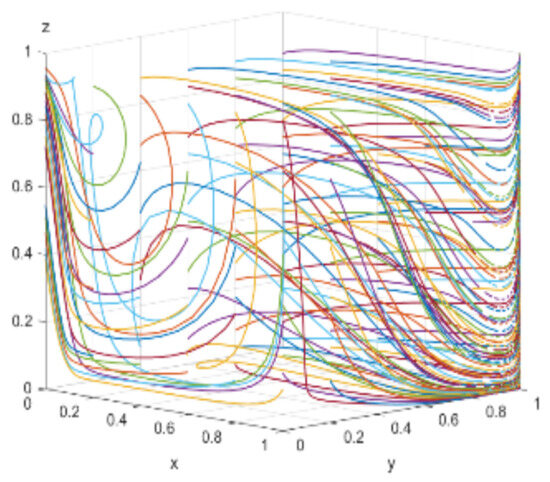
Figure 10.
Results of 50 evolutions when the subsidy coefficients are 0.7.
Through simulation analysis of the evolutionary behaviors of enterprises, consumers, and the government in the three-party game under varying subsidy coefficients, it is evident that a reasonable subsidy policy not only facilitates enterprises’ evolution toward green production but also incentivizes consumers’ green consumption behaviors. However, the government’s subsidy intensity must strike a balance between incentive effectiveness and fiscal costs to achieve both economic and environmental performance objectives.
5.2. Impact of Punishment Coefficient α2 on the Evolutionary Behavior of the Three-Party Game
As environmental regulations continue to strengthen, enterprises’ demands for green technological innovations are also increasing [46]. When the government imposes varying levels of punishment on enterprises, the behavioral strategies of enterprises, consumers, and the government in the evolutionary game exhibit significant changes, as shown in Figure 11. Simulation results indicate that when the punishment coefficients are set to 0.3, 0.5, and 0.7, the evolutionary outcomes after 50 iterations for the three parties are illustrated in Figure 12, Figure 13 and Figure 14, respectively.
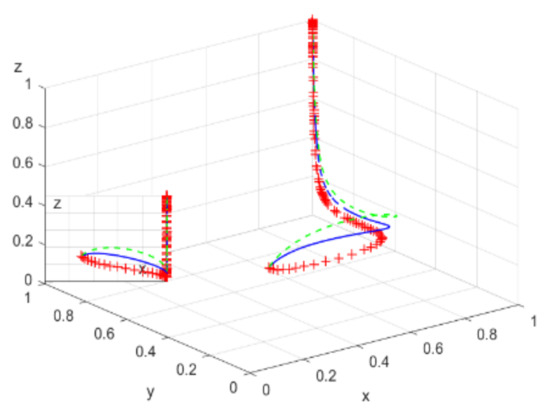
Figure 11.
Evolutionary trajectory of the three-party game under different penalty coefficients.

Figure 12.
Results of 50 evolutions with penalty coefficients of 0.3.
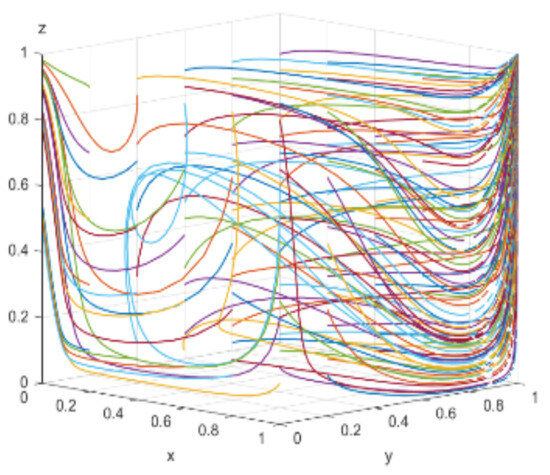
Figure 13.
Results of 50 evolutions with penalty coefficients of 0.5.
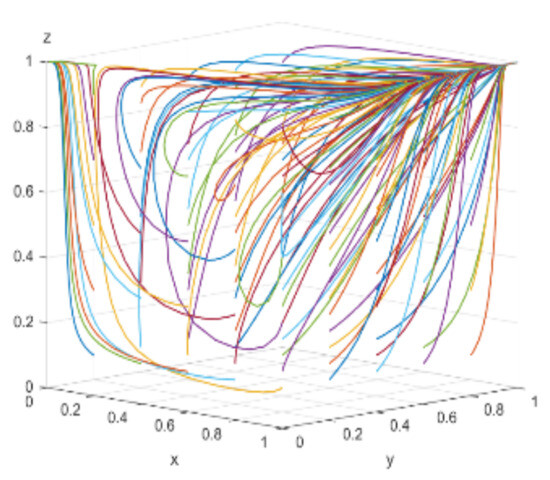
Figure 14.
Results of 50 evolutions with penalty coefficients of 0.7.
- (1)
- Evolutionary Trends in Enterprises’ Strategy Choices
The evolutionary trajectories of enterprises under different punishment coefficients are depicted in Figure 15. Simulation results indicate that when initial willingness is low and the punishment coefficient is small, the costs of green production for enterprises are high, and the pollution fees levied by the government on traditional production models are relatively low, resulting in insufficient motivation for enterprises to implement green technological innovations and, consequently, a reluctance to provide green products. As the punishment coefficient gradually increases, enterprises face higher pollution fee pressures, gradually recognizing the potential dividends of green production, and evolving toward green production. When the initial probability of green production is high, an increase in the punishment coefficient significantly accelerates the enterprises’ evolution toward green production, ultimately stabilizing in this state. Overall, the punishment costs imposed by the government on enterprises and the provision of innovation subsidies are positively correlated with the stability of the green innovation ecosystem [32].
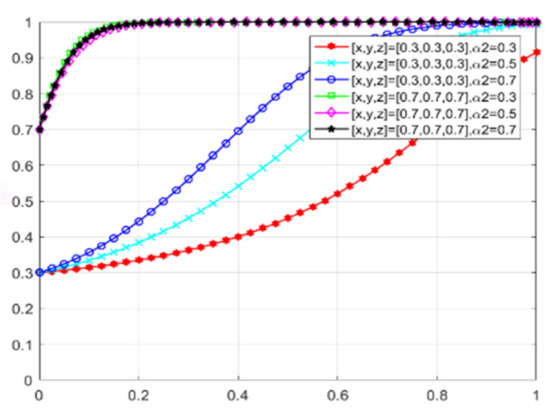
Figure 15.
Impact of penalty coefficients on the evolutionary trajectory of firms with different initial intentions.
- (2)
- Evolutionary Trends in Consumers’ Strategy Choices
The evolutionary trajectories of consumers’ strategy choices are illustrated in Figure 16. Simulation results indicate that, under identical initial willingness, the higher the punishment coefficient, the more enterprises are inclined to adopt green technological innovations to avoid fines, and government subsidies reduce the price of green products, causing consumers to gradually evolve toward purchasing green products. The rate of evolution accelerates as the punishment coefficient increases. If consumers’ initial willingness is high, the rate of evolution further accelerates, ultimately stabilizing in this state.
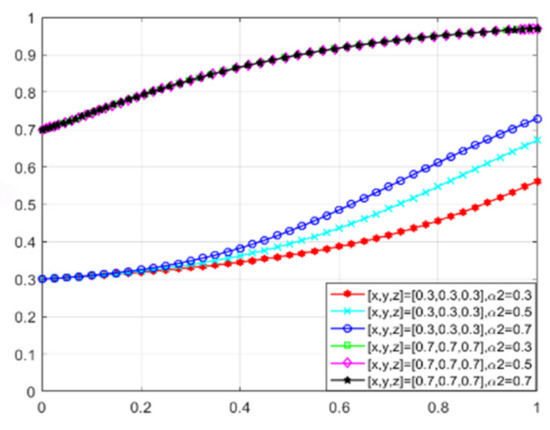
Figure 16.
Impact of penalty coefficients on consumer evolutionary trajectories with different initial intentions.
- (3)
- Evolutionary Trends in Government’s Strategy Choices
The evolutionary trajectory of the government’s strategy choices over time is illustrated in Figure 17. When the punishment coefficient is low, enterprises choose traditional production due to the high costs of green production, and the government’s regulatory costs are relatively high with low returns. Consequently, the government’s willingness to engage in proactive regulation is low, gradually shifting toward passive regulation. However, when the government’s initial willingness to regulate is strong and the punishment coefficient increases, enterprises gradually transition to green production due to high pollution fees, and consumers’ green consumption behaviors are stimulated. This leads to the government obtaining environmental and reputation benefits that offset the costs of proactive regulation, thereby evolving toward proactive regulation.
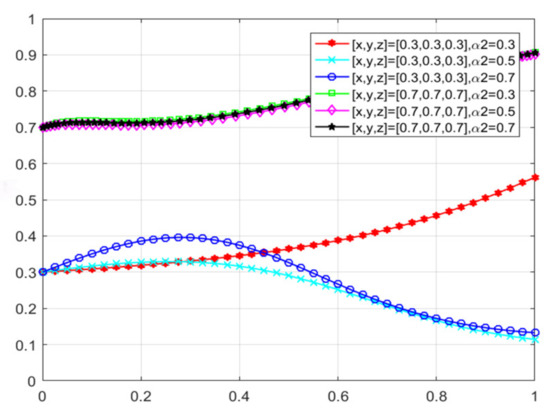
Figure 17.
Impact of penalty coefficients on government evolutionary trajectories with different initial willingness.
Therefore, the setting of punishment coefficients plays a crucial incentive role in guiding enterprises toward green production and consumers toward green consumption. However, the government’s strategy choices are also influenced by initial regulatory willingness. Thus, when formulating punishment policies, it is essential to comprehensively consider the initial willingness and behavioral responses of all parties to achieve optimal green development outcomes.
Through simulation analysis of the evolutionary behaviors of enterprises, consumers, and the government in the three-party game under varying punishment coefficients, it is evident that a reasonable punishment policy not only promotes enterprises’ evolution toward green production but also incentivizes consumers’ green consumption behaviors. However, the intensity of government punishments must balance between incentive effectiveness and fiscal costs to achieve both economic and environmental performance objectives.
5.3. Impact of Consumers’ Green Preference γ on the Evolutionary Behavior of the Three-Party Game
When consumers have varying degrees of green preference, the evolutionary trajectories of the three-party game are shown in Figure 18. As consumers’ green awareness awakens, the scale of the green consumer market expands, enterprises perceive profit opportunities and consider engaging in green technological innovations, and the government, aiming to open up the green consumer market, is willing to adopt proactive regulation. Figure 19, Figure 20 and Figure 21 respectively illustrate the evolutionary outcomes after 50 iterations for green preference levels of 0.3, 0.5, and 0.7.
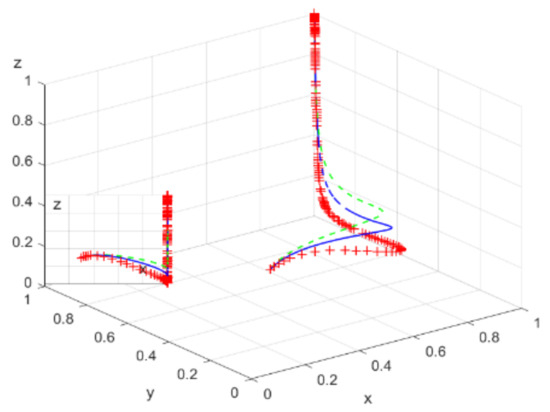
Figure 18.
Evolutionary trajectory of the tripartite game under different green preferences.
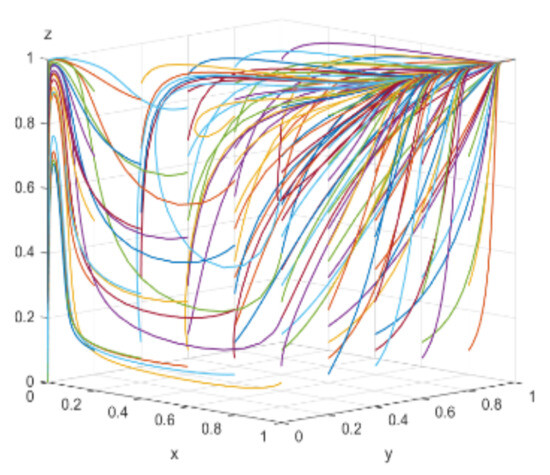
Figure 19.
Results of 50 evolutions with green preferences of 0.3.

Figure 20.
Results of 50 evolutions with green preferences of 0.5.
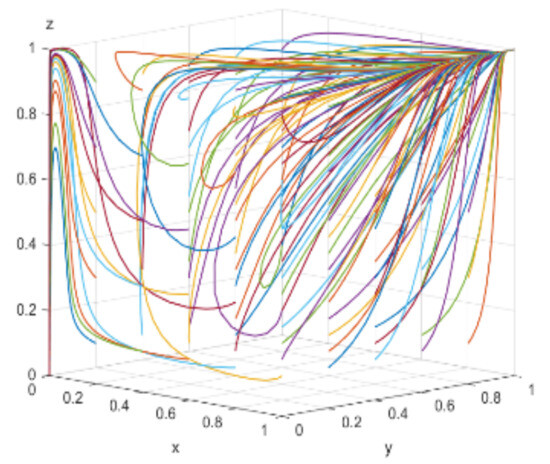
Figure 21.
Results of 50 evolutions with green preferences of 0.7.
- (1)
- Evolutionary Trends in Enterprises’ Strategy Choices
The changes in enterprises’ strategy choices over time are depicted in Figure 22. When the willingness of all three parties to adopt proactive strategies to promote green transformation is low, the green consumer market gradually expands as consumers’ green preference increases. Enterprises recognize market opportunities and begin to evolve toward green production, albeit at a relatively slow rate. Conversely, when all parties choose to cooperate and jointly promote the development of green ecological civilization, the rate at which enterprises evolve toward green production significantly accelerates. Additionally, as consumers’ green preference increases, the rate of evolution far exceeds that observed under low willingness levels.

Figure 22.
Impact of green preferences on the evolutionary trajectory of firms with different initial intentions.
- (2)
- Evolutionary Trends in Consumers’ Strategy Choices
The evolutionary trajectories of consumers’ strategy choices are illustrated in Figure 23. Simulation results indicate that, under identical initial willingness, the higher the green preference level, the more consumers are inclined to choose purchasing green products. When consumers’ own green awareness is strong, even in the absence of external incentives, consumers autonomously choose to purchase green products, demonstrating a high preference for environmentally friendly products.
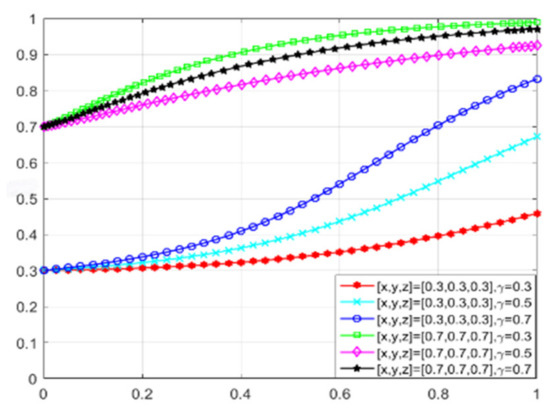
Figure 23.
Impact of green preferences on the evolutionary trajectory of consumers with different initial intentions.
- (3)
- Evolutionary Trends in Government’s Strategy Choices
The government enhances public green preference levels by increasing green publicity efforts, and the evolutionary trajectories of the government’s strategy choices under different consumer preferences are shown in Figure 24. When the initial willingness levels of all three parties are low, even if consumers’ green preferences improve, the expansion of the green consumer market remains constrained, enterprises’ motivation for green technological innovation is low, and the costs of proactive regulation are not offset by benefits, leading the government to ultimately choose passive regulation. However, when the initial willingness of all parties increases, consumers gradually recognize the importance of environmental protection and ecological civilization, becoming more proactive in choosing green products. Under the government’s active guidance and publicity, consumers’ green preference levels further increase, driving the expansion of the green consumer market. As the demand for green products grows, enterprises actively engage in green technological innovations to provide more green products. At this point, the costs of the government’s proactive regulation and subsidy expenditures are relatively low, significantly lower than the sum of environmental and reputation benefits obtained. Consequently, the government evolves toward proactive regulation.
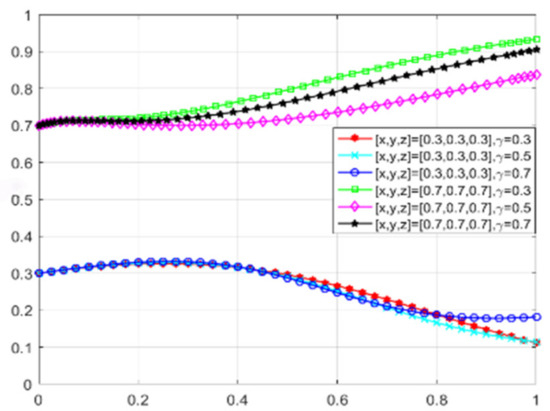
Figure 24.
Impact of green preferences on the evolutionary trajectory of government with different initial intentions.
Therefore, consumers’ green preference levels and the government’s punishment coefficients have significant impacts on the evolutionary behaviors of the three parties. A reasonable policy incentive mechanism can effectively promote enterprises’ green production, enhance consumers’ green consumption awareness, and drive the government to adopt proactive regulatory measures, thereby achieving the sustainable development of the green technological innovation ecosystem under the context of carbon peak.
6. Conclusions and Recommendations
6.1. Conclusions
Under the assumption of bounded rationality for all game participants, this study constructs an evolutionary game model involving enterprises, consumers, and the government, addressing the challenges of market expansion and premium pricing of green products encountered during the promotion of green consumption. The model systematically analyzes the impact paths of each participant’s behavioral strategies on green production and green technological innovation. Combined with numerical simulations, this study explores the evolutionary characteristics of the three parties under different conditions. The main research findings are summarized as follows:
- (1)
- Impact of Government Regulation on Enterprises’ Green Production
This study reveals that proactive government regulation, including incentive policies or imposed pressures, effectively promotes enterprises to engage in green production. In scenarios of proactive regulation, providing subsidies and rewards to enterprises adopting green technologies, while penalizing those persisting with traditional production methods, significantly accelerates the evolution rate towards green production, expands the scale of green product manufacturing, and effectively controls production costs. For consumers, the accessibility of green products improves, market demand expands, thereby further stimulating enterprises’ enthusiasm for green technological innovation. However, subsidy and punishment coefficients must remain within reasonable ranges to avoid adverse effects on the government’s fiscal health. Under passive regulation, relying solely on market-driven behaviors fails to achieve a win–win outcome for both economic and environmental performance.
- (2)
- Influence of Consumers’ Green Preferences on Green Product Demand
As consumers’ green preferences increase, the demand for green products significantly rises, expanding the consumer market. Enterprises, recognizing the growth in green demand, actively pursue green technological innovations to meet market needs and achieve excess profits. Green production not only reduces the government’s environmental governance costs but also enhances consumers’ social welfare and environmental benefits, thereby increasing the government’s reputation benefits and reducing the costs of proactive regulation. This encourages the government to implement fiscal and monetary policies that stimulate the prosperity of the green consumer market.
- (3)
- Effect of Initial Willingness of Participants on Evolutionary Outcomes
Simulation results indicate that when the initial willingness of all three parties is low, increases in subsidies, punishments, or publicity efforts have minimal overall effects, failing to achieve substantial breakthroughs or improvements in the evolutionary path. Conversely, when the initial willingness of all participants is strong and they actively cooperate, the effectiveness of various policies is significantly enhanced. Enterprises rapidly evolve towards green production, consumers’ willingness to purchase green products increases, and proactive regulation by the government further promotes the stable development of the green supply chain.
6.2. Recommendations
- (1)
- Strengthen Government Regulation and Policy Incentives to Promote Green Technological Innovation
Given the dual externalities of green technological innovation—environmental benefits and economic gains—the government should actively implement environmental regulatory measures and provide favorable subsidy policies to positively incentivize enterprises to invest in green technological innovations. This will ultimately achieve the scaling and popularization of green production. Specifically, the government should scientifically determine the intensity of environmental regulation and related policies based on the actual conditions of different regions and industries to ensure their targeting and effectiveness. For example, establishing special funds to support green technology R&D, offering tax reductions or financial subsidies to enterprises adopting green technologies, and strengthening intellectual property protection for green innovations to create a fair competitive market environment. Additionally, the government should set up robust evaluation and supervision mechanisms to ensure the effectiveness and transparency of policy implementation. Collaboration between the government and enterprises through policy guidance, resource sharing, and information exchange is essential to drive enterprises’ green transformation, enhance their competitiveness in international markets, and support the nation’s sustainable development strategic goals.
- (2)
- Accelerate Industrial Green Transformation and Fulfill Global Climate Governance Commitments
Rapid development in manufacturing and industry, while generating economic value, also results in substantial energy consumption and carbon emissions, exerting significant pressure on the environment and ecosystems. As the world’s second-largest economy and a major carbon emitter, China actively fulfills its energy conservation and emission reduction commitments in global climate governance, demonstrating the responsibility of a major power. To establish and improve a green, low-carbon, circular, and sustainable development system, accelerating industrial green transformation is crucial. Achieving carbon reduction targets requires coordinated efforts from the government, enterprises, and consumers. The government should implement stricter environmental regulations and standards, promote technological upgrades and structural adjustments in high-energy-consuming and high-pollution industries, and increase support for green industries. Enterprises are expected to enhance their investment in green technologies, optimize production processes, improve resource utilization efficiency, reduce pollutant emissions, and actively fulfill their social responsibilities. Consumers should raise their environmental awareness, prioritize purchasing green products, and generate effective demand for green industries. Through the organic combination of environmental regulation, green technological innovation, green production, and green consumption, supported by green finance instruments such as green bonds and green loans [47], as well as risk management tools in the agricultural sector like crop insurance [48], society can be propelled toward a sustainable green development path. Moreover, international cooperation is vital for achieving global climate governance goals. China should actively participate in international environmental projects, share green technologies and experiences with other countries, and jointly address climate change challenges.
- (3)
- Expand the Green Consumer Market and Enhance Public Environmental Awareness
Currently, the green product consumer market in China is still in the phase of widespread adoption and has not yet achieved significant consumer enthusiasm. The primary reasons include the relatively higher prices of green products and varying levels of consumers’ environmental awareness and green consumption concepts. To overcome these barriers, the government should introduce reasonable policy measures to regulate green product prices, thus reducing the economic burden on consumers when purchasing green products. For instance, implementing tax incentives for the production and sale of green products, providing consumer subsidies, or setting up green consumption point reward systems can encourage consumers to buy green products. For example, implementing tax incentives for the production and sale of green products, providing consumer subsidies, or establishing green consumption point reward systems can encourage consumers to purchase green products. Simultaneously, the government should intensify green consumption publicity efforts through various channels such as media, educational institutions, and community activities to enhance public environmental awareness and green preferences. Educational institutions should incorporate environmental protection and sustainable development content into curricula to instill green consumption concepts in young people from an early age. Enterprises should actively fulfill their social responsibilities by promoting their green products and environmental-friendly concepts through transparent information disclosure, enabling consumers to understand the environmental attributes of products. Community organizations and non-governmental organizations can also conduct various environmental activities to boost public recognition and participation in green consumption. Through the collaborative efforts of the government, enterprises, educational institutions, and social organizations, consumers can develop a habit of conscious green consumption, fostering and expanding the green product consumer market, creating a virtuous cycle of green production and consumption, and driving the green transformation of the economy and society.
In summary, this study conducts an in-depth analysis of the evolutionary path of the green technology innovation ecosystem under the background of carbon peak, revealing the interactive mechanism and key influencing factors among the government, enterprises, and consumers in green transformation. To achieve the goals of carbon peak and carbon neutrality, the government should balance regulatory intensity with fiscal incentives, enterprises should actively promote green technology innovation, and consumers should raise their awareness of green environmental protection. The collaborative efforts of the three parties will be the key to achieving sustainable development.
Author Contributions
Conceptualization, Z.Z. and M.L.; methodology, M.L.; software, X.C.; writing—original draft preparation, X.C.; writing—review and editing, M.L.; supervision, A.U.K. All authors have read and agreed to the published version of the manuscript.
Funding
This study acknowledges the support of National Foreign Expert Project (Foreign Youth Talent Program) (QN2023014008, QN2023014009).
Institutional Review Board Statement
Not applicable.
Informed Consent Statement
Not applicable.
Data Availability Statement
Data are contained within the article.
Acknowledgments
This paper thanks two foreign experts, Oswin Aganda Anaba and Michael Appiah. They provided valuable advice and guidance during the process of writing the paper, helping to overcome difficulties and make the paper more complete.
Conflicts of Interest
The authors declare no conflict of interest.
References
- IEA. Global Energy Review: CO2 Emissions in 2022. Available online: https://www.iea.org/reports/global-energy-review-co2-emissions-in-2022 (accessed on 22 February 2025).
- Lianto, B. Identifying Key Assessment Factors for a Company’s Innovation Capability Based on Intellectual Capital: An Application of the Fuzzy Delphi Method. Sustainability 2023, 15, 6001. [Google Scholar] [CrossRef]
- Xing, X.; Chen, T.; Yang, X.; Jiang, Z. Factors Affecting Manufacturing Enterprises’ Sustainable Development Performance: Based on the fsQCA Method. Pol. J. Environ. Stud. 2022, 32, 353–369. [Google Scholar] [CrossRef]
- Liu, W.; Li, Z. On the Option Game Model of the Investment Decisions for Radica Technology Innovation in Enterprises. Manag. Rev. 2016, 28, 89–97. [Google Scholar] [CrossRef]
- Handayani, K.; Anugrah, P.; Goembira, F.; Overland, I.; Suryadi, B.; Swandaru, A. Moving beyond the NDCs: ASEAN pathways to a net-zero emissions power sector in 2050. Appl. Energy 2022, 311, 118580. [Google Scholar] [CrossRef]
- Sarkar, A.; Azim, J.A.; Asif, A.A.; Qian, L.; Peau, A.K. Structural equation modeling for indicators of sustainable agriculture: Prospective of a developing country’s agriculture. Land Use Policy 2021, 109, 105638. [Google Scholar] [CrossRef]
- Zhang, J.; Geng, H.; Xu, G.; Chen, J. Research on the influence of environmental regulation on greentechnology innovation. China Popul. Resour. Environ. 2019, 29, 168–176. [Google Scholar]
- Le, T.T.; Gia, L.L.C. How Green Innovation and Green Corporate Social Responsibility Transform Green Transformational Leadership Into Sustainable Performance? Evidence From an Emerging Economy. Corp. Soc. Responsib. Environ. Manag. 2024, 32, 2527–2541. [Google Scholar] [CrossRef]
- Li, W.; Liu, C.; Yang, Q.; You, Y.; Zhuo, Z.; Zuo, X. Factors Influencing Farmers’ Vertical Collaboration in the Agri-Chain Guided by Leading Enterprises: A Study of the Table Grape Industry in China. Agriculture 2023, 13, 1915. [Google Scholar] [CrossRef]
- Wu, T.; Wen, L.; Yi, M. Balancing growth targets and environmental regulations: An empirical analysis of dual policy impact on corporate environmental responsibility-insights from China. J. Environ. Manage 2024, 355, 120500. [Google Scholar] [CrossRef]
- Wu, S.; Sun, X.; Yang, P. Game analysis of carbon emission regulation under dual governance system. China Popul. Resour. Environ. 2017, 27, 21–30. [Google Scholar]
- Li, Y. Environmental innovation practices and performance: Moderating effect of resource commitment. J. Clean. Prod. 2014, 66, 450–458. [Google Scholar] [CrossRef]
- Stavropoulos, S.; Wall, R.; Xu, Y. Environmental regulations and industrial competitiveness: Evidence from China. Appl. Econ. 2017, 50, 1378–1394. [Google Scholar] [CrossRef]
- Wang, J.; Zhang, Y. Environmental regulation, green technological innovative intention andgreen technological innovative behavior. Stud. Sci. Sci. 2018, 36, 352–360. [Google Scholar] [CrossRef]
- Wu, J.; Che, X.; Sheng, Y. Study on Government-industry-university-institute CollaborativeInnovation Based on Tripartite Evolutionary Game. Chin. J. Manag. Sci. 2019, 27, 162–173. [Google Scholar] [CrossRef]
- Li, M.; Chi, X.; Su, J.; Sun, H.; Anaba, O.A.; Khan, A.U.; Qadri, S.U. Evolutionary game theory in patent alliance dynamics: Strategy and policy implications. Technol. Anal. Strateg. Manag. 2024, 1–16. [Google Scholar] [CrossRef]
- Zeng, S.X.; Meng, X.H.; Zeng, R.C.; Tam, C.M.; Tam, V.W.Y.; Jin, T. How environmental management driving forces affect environmental and economic performance of SMEs: A study in the Northern China district. J. Clean. Prod. 2011, 19, 1426–1437. [Google Scholar] [CrossRef]
- Zhong, Z.; Peng, B. Can environmental regulation promote green innovation in heavily polluting enterprises? Empirical evidence from a quasi-natural experiment in China. Sustain. Prod. Consum. 2022, 30, 815–828. [Google Scholar] [CrossRef]
- Xiao, Q.; Zhao, L. Heterogeneous Environmental Regulation, FDl and the Efficiency of China’s Green Technology Innovation. Mod. Econ. Res. 2020, 29–40. [Google Scholar] [CrossRef]
- Comfort, S.E.; Park, Y.E. On the Field of Environmental Communication: A Systematic Review of the Peer-Reviewed Literature. Environ. Commun. 2018, 12, 862–875. [Google Scholar] [CrossRef]
- He, M.; Blye, C.-J.; Halpenny, E. Impacts of environmental communication on pro-environmental intentions and behaviours: A systematic review on nature-based tourism context. J. Sustain. Tour. 2022, 31, 1921–1943. [Google Scholar] [CrossRef]
- Li, W.; Bi, K.; Cao, X. Impact of Environmental Regulation Tools onGreen Technological Innovation in Manufacturing Enterprises’: Taking Papermaking and Paper Products Manufacturing Enterprises for Example. Syst. Eng. 2013, 31, 112–122. [Google Scholar]
- Wang, X.; Sun, C.; Wang, S.; Zhang, Z.; Zou, W. Going Green or Going Away? A Spatial Empirical Examination of the Relationship between Environmental Regulations, Biased Technological Progress, and Green Total Factor Productivity. Int. J. Environ. Res. Public Health 2018, 15, 1917. [Google Scholar] [CrossRef] [PubMed]
- Yuan, Y.; Xie, R. Environmental Regulation and the ‘Green’ Productivity Growth of China’s Industry. China Soft Sci. 2016, 7, 144–154. [Google Scholar]
- Wang, W.; Zhang, Z. The Influence of Innovation Subsidy and Failure Compensation on the Choice of Green Innovation Strategy of Enterprises. Soft Sci. 2019, 33, 86–92. [Google Scholar] [CrossRef]
- Peng, X.; Wei, J. Stakeholder environmental orientation and corporate ecological innovation: The moderating effect of executive environmental awareness. Stud. Sci. Sci. 2015, 33, 1109–1120. [Google Scholar] [CrossRef]
- Chen, D.; Ignatius, J.; Sun, D.; Zhan, S.; Zhou, C.; Marra, M.; Demirbag, M. Reverse logistics pricing strategy for a green supply chain: A view of customers’ environmental awareness. Int. J. Prod. Econ. 2019, 217, 197–210. [Google Scholar] [CrossRef]
- Ulph, A.; Ulph, D. Environmental policy when consumers value conformity. J. Environ. Econ. Manag. 2021, 109, 102172. [Google Scholar] [CrossRef]
- Song, P.; Sun, H. Game and Co-win: Choice Analysis on Corporate Strategy in Context of Circular Economy. Sci. Technol. Manag. Res. 2013, 33, 109–112. [Google Scholar]
- Zhao, A.; Du, J.; Guan, H. Evolution of Enterprise Environmental Innovation Behavior under Heterogeneity Demand of Consumer. Chin. J. Manag. Sci. 2018, 26, 124–132. [Google Scholar] [CrossRef]
- Wang, M.; Li, Y. Market regulation, product consumption choice and enterprise green technological innovation. J. Ind. Eng. Eng. Manag. 2021, 35, 44–54. [Google Scholar] [CrossRef]
- Yang, Z.; Chen, H.; Du, L.; Lin, C.; Lu, W. How does alliance-based government-university-industry foster cleantech innovation in a green innovation ecosystem? J. Clean. Prod. 2021, 283, 124559. [Google Scholar] [CrossRef]
- Zhang, R.-J.; Tai, H.-W.; Cao, Z.-X.; Wei, C.-C.; Cheng, K.-T. Green innovation ecosystem evolution: Diffusion of positive green innovation game strategies on complex networks. J. Innov. Knowl. 2024, 9, 100500. [Google Scholar] [CrossRef]
- Song, J.; Yu, Z.; Zhao, Y.; Sun, J. Research on Technology Transfer Strategy of Digital Economy Enabling Green Innovation System. Pol. J. Environ. Stud. 2024, 33, 4721–4733. [Google Scholar] [CrossRef]
- Qin, H.; Zou, H.; Ji, H. Research on Enterprise Interactive Innovation Balance Decision in Green Manufacturing Innovation Ecosystem. Sustainability 2023, 15, 7767. [Google Scholar] [CrossRef]
- Sun, J.; Zhai, N.; Miao, J.; Sun, H. Can Green Finance Effectively Promote the Carbon Emission Reduction in “Local-Neighborhood” Areas?—Empirical Evidence from China. Agriculture 2022, 12, 1550. [Google Scholar] [CrossRef]
- Xiao, L.; Liu, J.; Ge, J. Dynamic game in agriculture and industry cross-sectoral water pollution governance in developing countries. Agric. Water Manag. 2021, 243, 106417. [Google Scholar] [CrossRef]
- Jamali, M.-B.; Rasti-Barzoki, M.; Khosroshahi, H.; Altmann, J. An evolutionary game-theoretic approach to study the technological transformation of the industrial sector toward renewable electricity procurement: A case study of Iran. Appl. Energy 2022, 318, 119083. [Google Scholar] [CrossRef]
- Liu, L.; Wang, Z.; Song, Z.; Zhang, Z. Evolutionary game analysis on behavioral strategies of four participants in green technology innovation system. Manag. Decis. Econ. 2022, 44, 960–977. [Google Scholar] [CrossRef]
- Bera, S.; Giri, B.C. Evolutionary game analysis for non-cooperative behavior of entities in a closed-loop green supply chain under government intervention. Soft Comput. 2023, 27, 17785–17808. [Google Scholar] [CrossRef]
- Lestari, E.R.; Dania, W.A.P.; Indriani, C.; Firdausyi, I.A. The impact of customer pressure and the environmental regulation on green innovation performance. IOP Conf. Ser. Earth Environ. Sci. 2021, 733, 012048. [Google Scholar] [CrossRef]
- Al-Swidi, A.K.; Al-Hakimi, M.A.; Gelaidan, H.M.; Al-Temimi, S.K.A.J. How does consumer pressure affect green innovation of manufacturing SMEs in the presence of green human resource management and green values? A moderated mediation analysis. Bus. Ethics Environ. Responsib. 2022, 31, 1157–1173. [Google Scholar] [CrossRef]
- Talajić, M.; Vrankić, I.; Pejić Bach, M. Strategic Management of Workforce Diversity: An Evolutionary Game Theory Approach as a Foundation for AI-Driven Systems. Information 2024, 15, 366. [Google Scholar] [CrossRef]
- Friedman, D. Evolutionary games in economics. Econometrica 1991, 59, 637–666. [Google Scholar]
- Waqas, M.; Yahya, F.; Ahmed, A.; Rasool, Y.; Hongbo, L. Unlocking employee’s green behavior in fertilizer industry: The role of green HRM practices and psychological ownership. Int. Food Agribus. Manag. Rev. 2021, 24, 827–844. [Google Scholar] [CrossRef]
- Li, M.; Wang, X.; Wang, Z.; Maqbool, B.; Hussain, A.; Khan, W.A. Bibliometric Analysis of the Research on the Impact of Environmental Regulation on Green Technology Innovation Based on CiteSpace. Int. J. Environ. Res. Public Health 2022, 19, 13273. [Google Scholar] [CrossRef]
- Sun, H.; Samad, S.; Rehman, S.U.; Usman, M. Clean and green: The relevance of hotels’ website quality and environmental management initiatives for green customer loyalty. Brit. Food J. 2022, 124, 4266–4285. [Google Scholar] [CrossRef]
- Islam, D.I.; Rahman, A.; Sarker, M.S.R.; Luo, J.; Liang, H. Factors affecting farmers’ willingness to adopt crop insurance to manage disaster risk: Evidence from Bangladesh. Int. Food Agribus. Manag. Rev. 2021, 24, 463–480. [Google Scholar] [CrossRef]
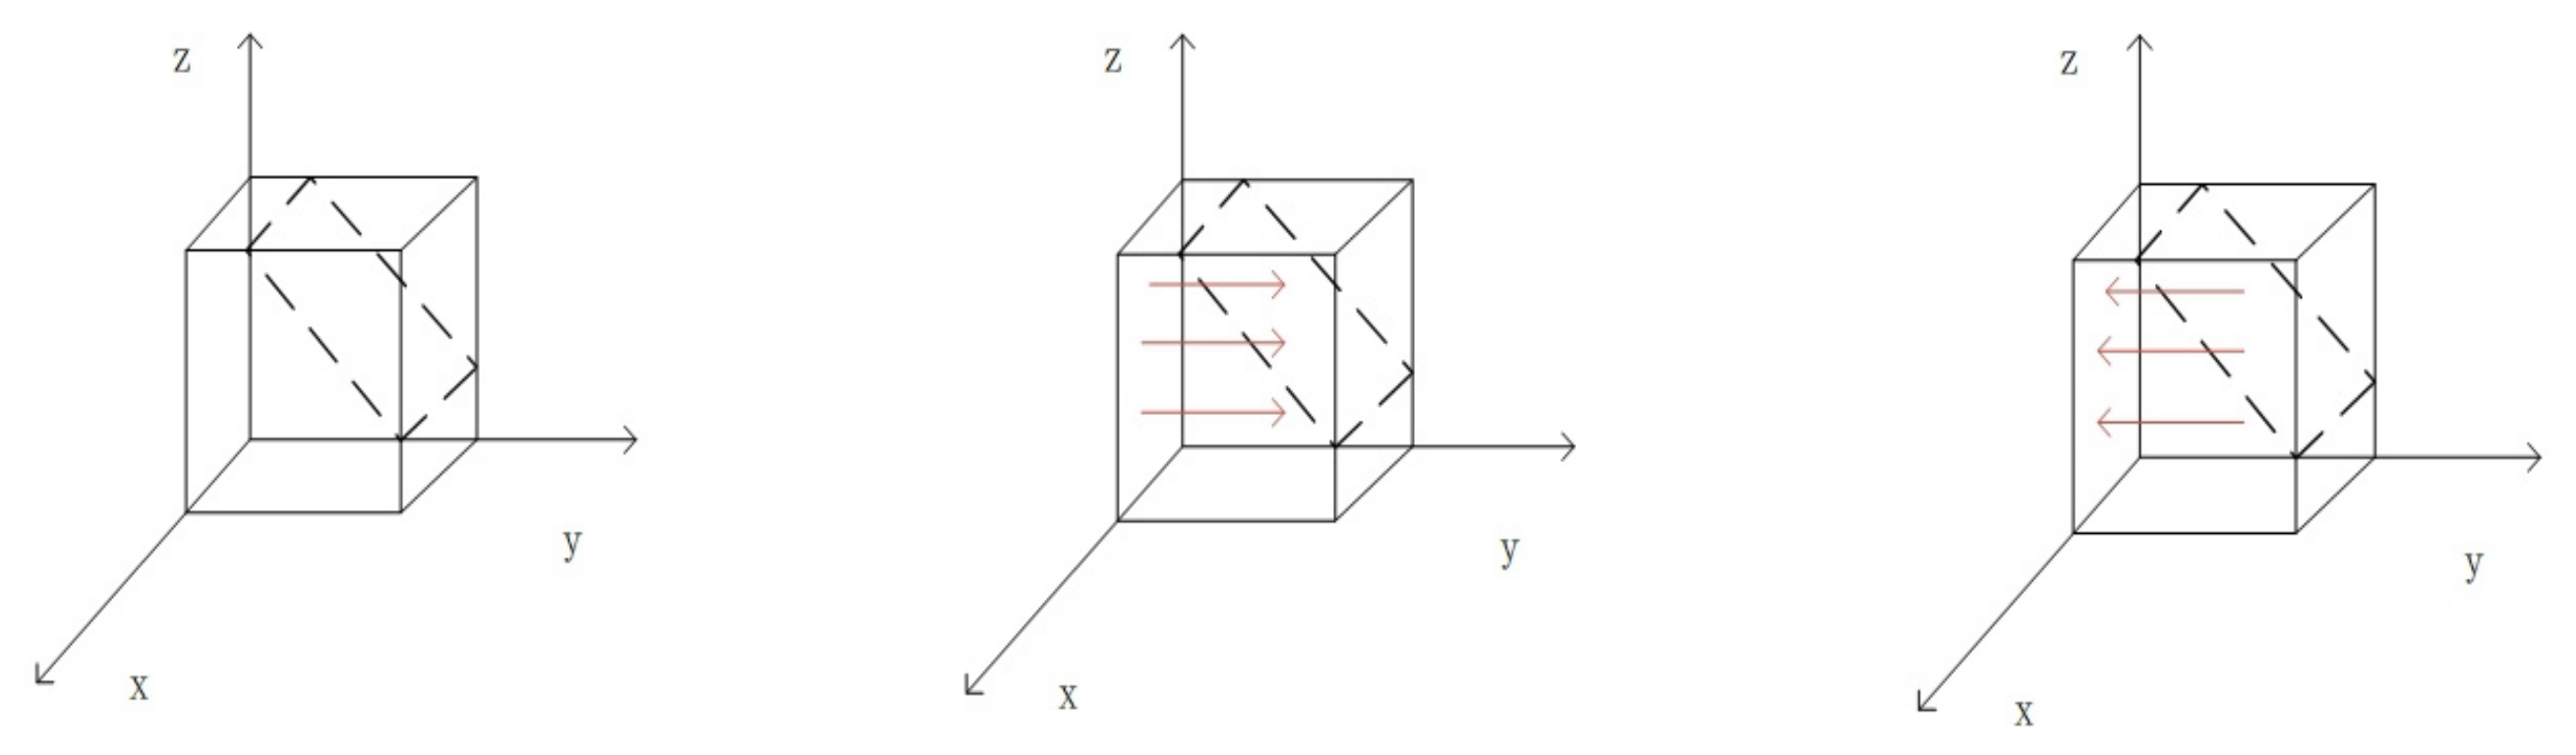
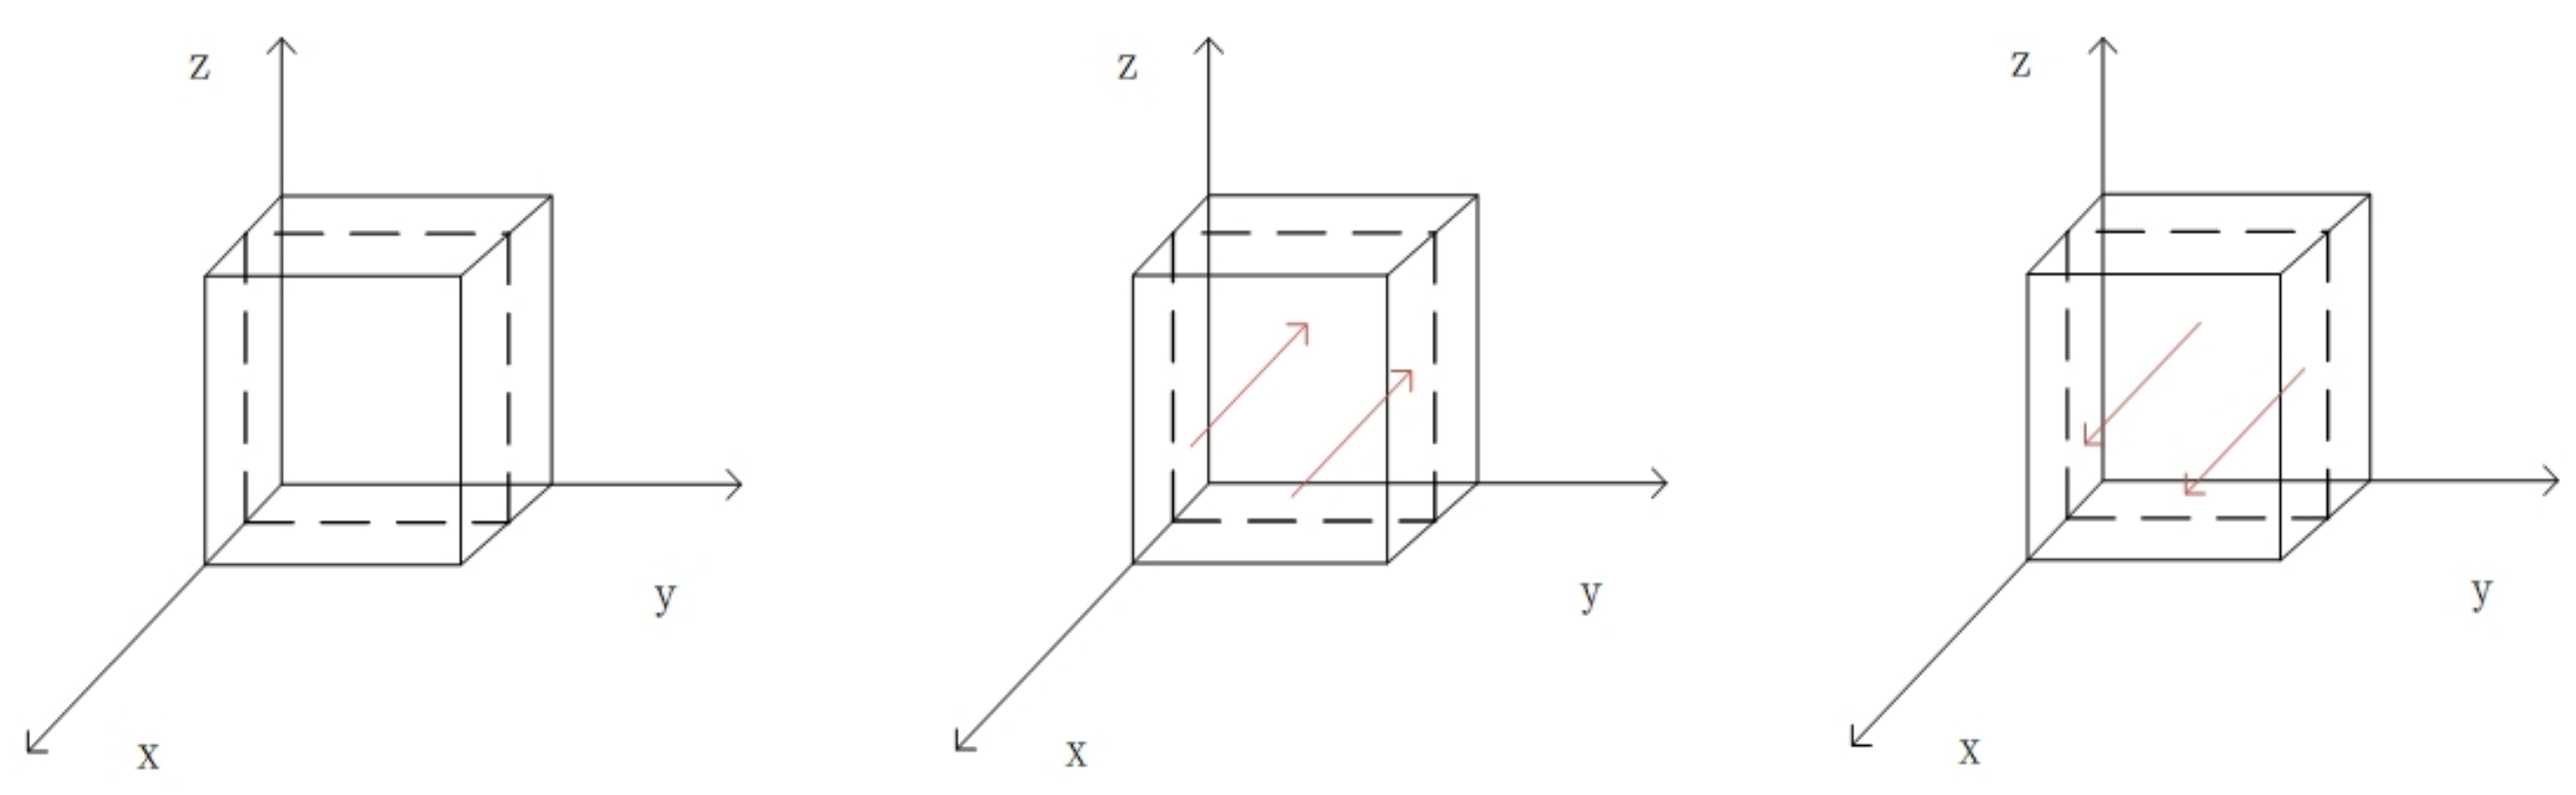
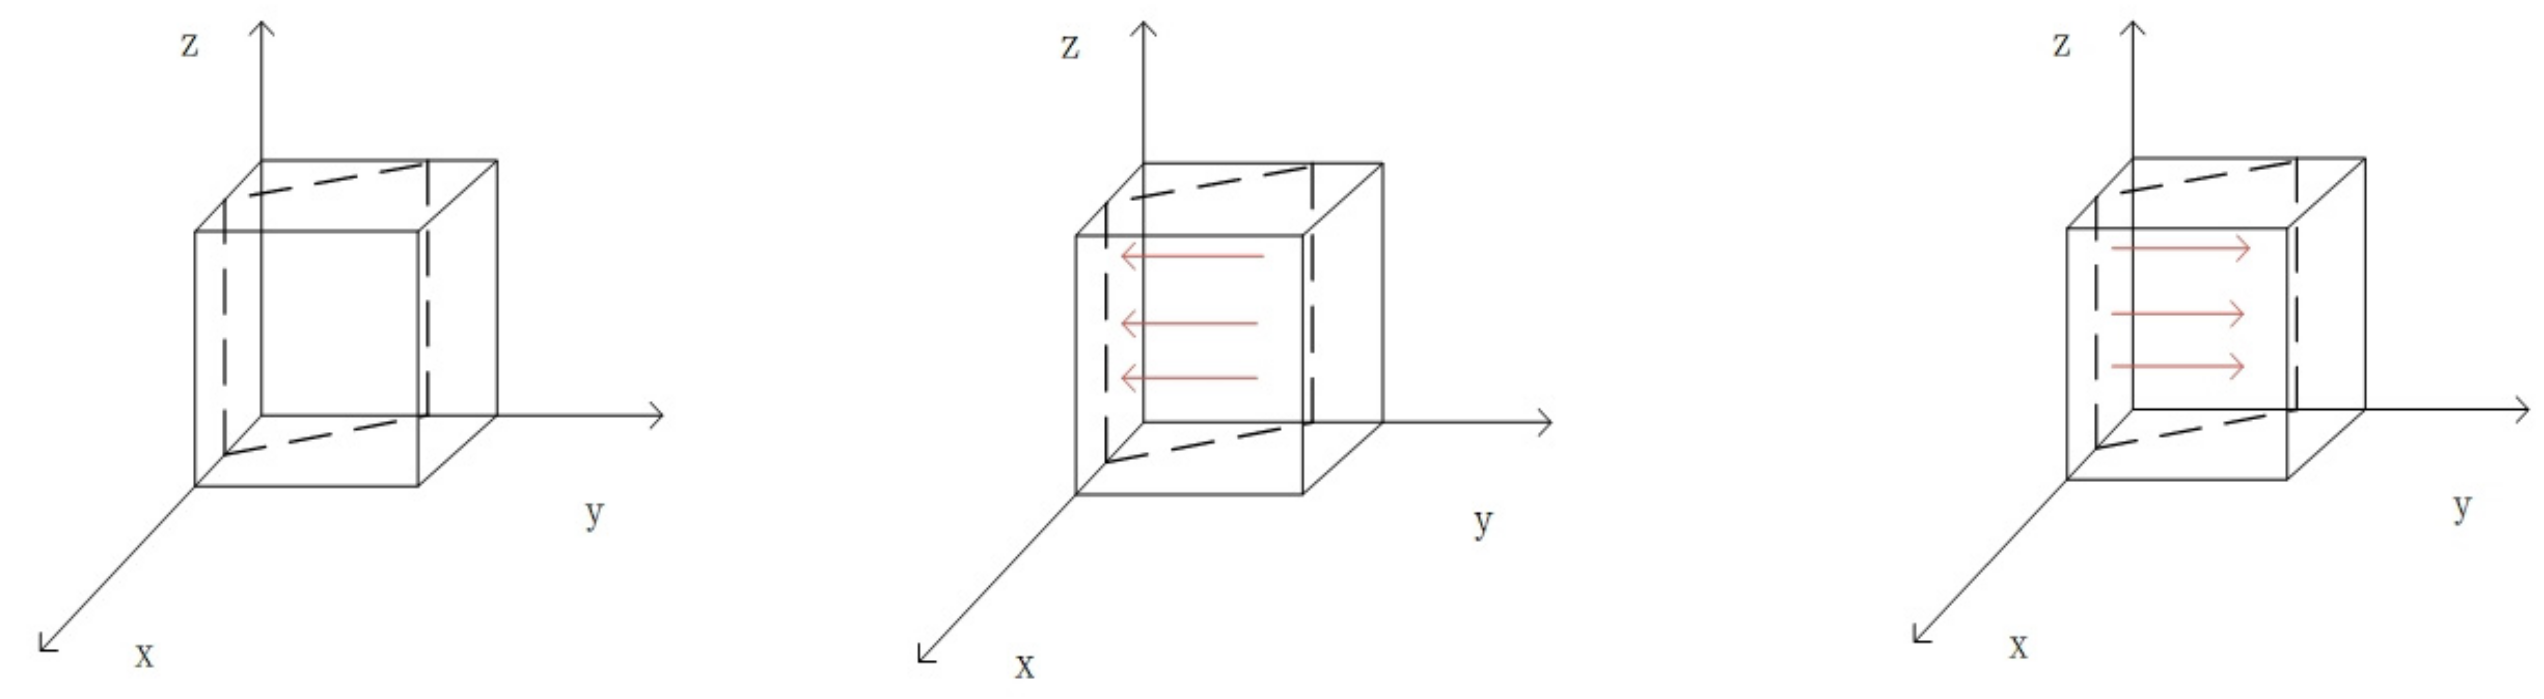

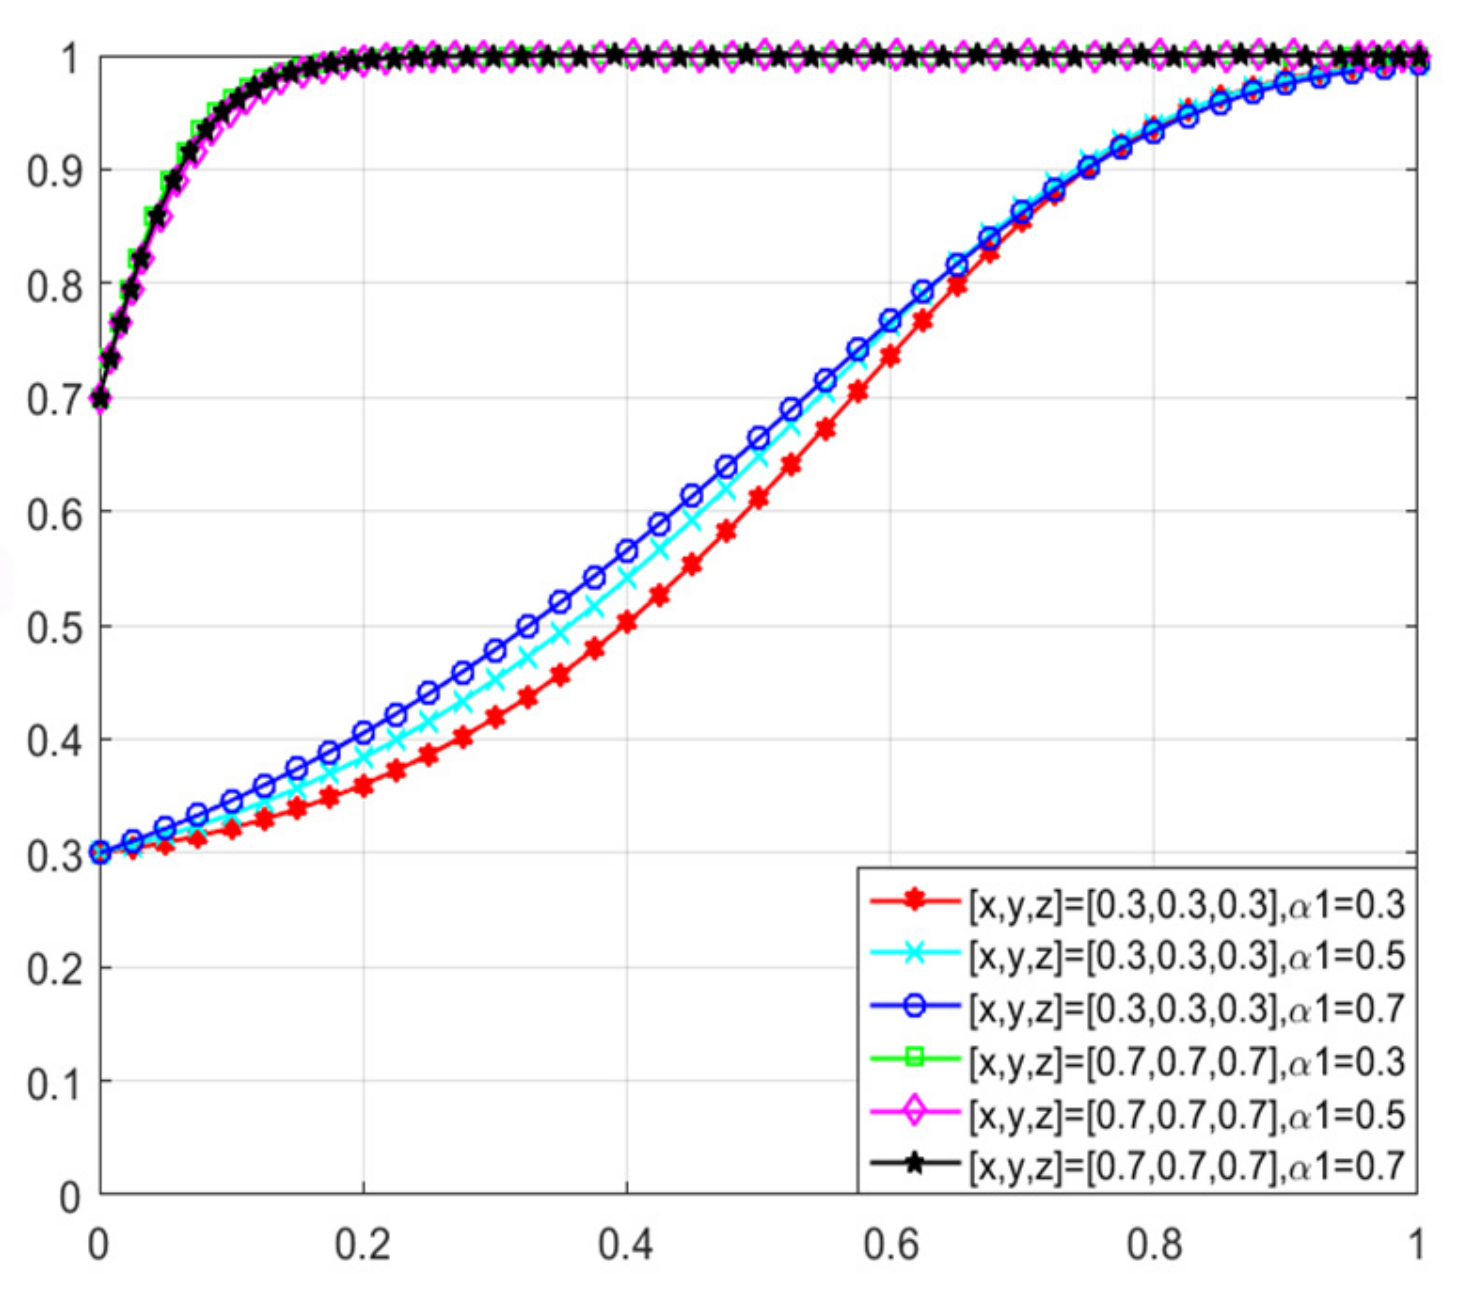
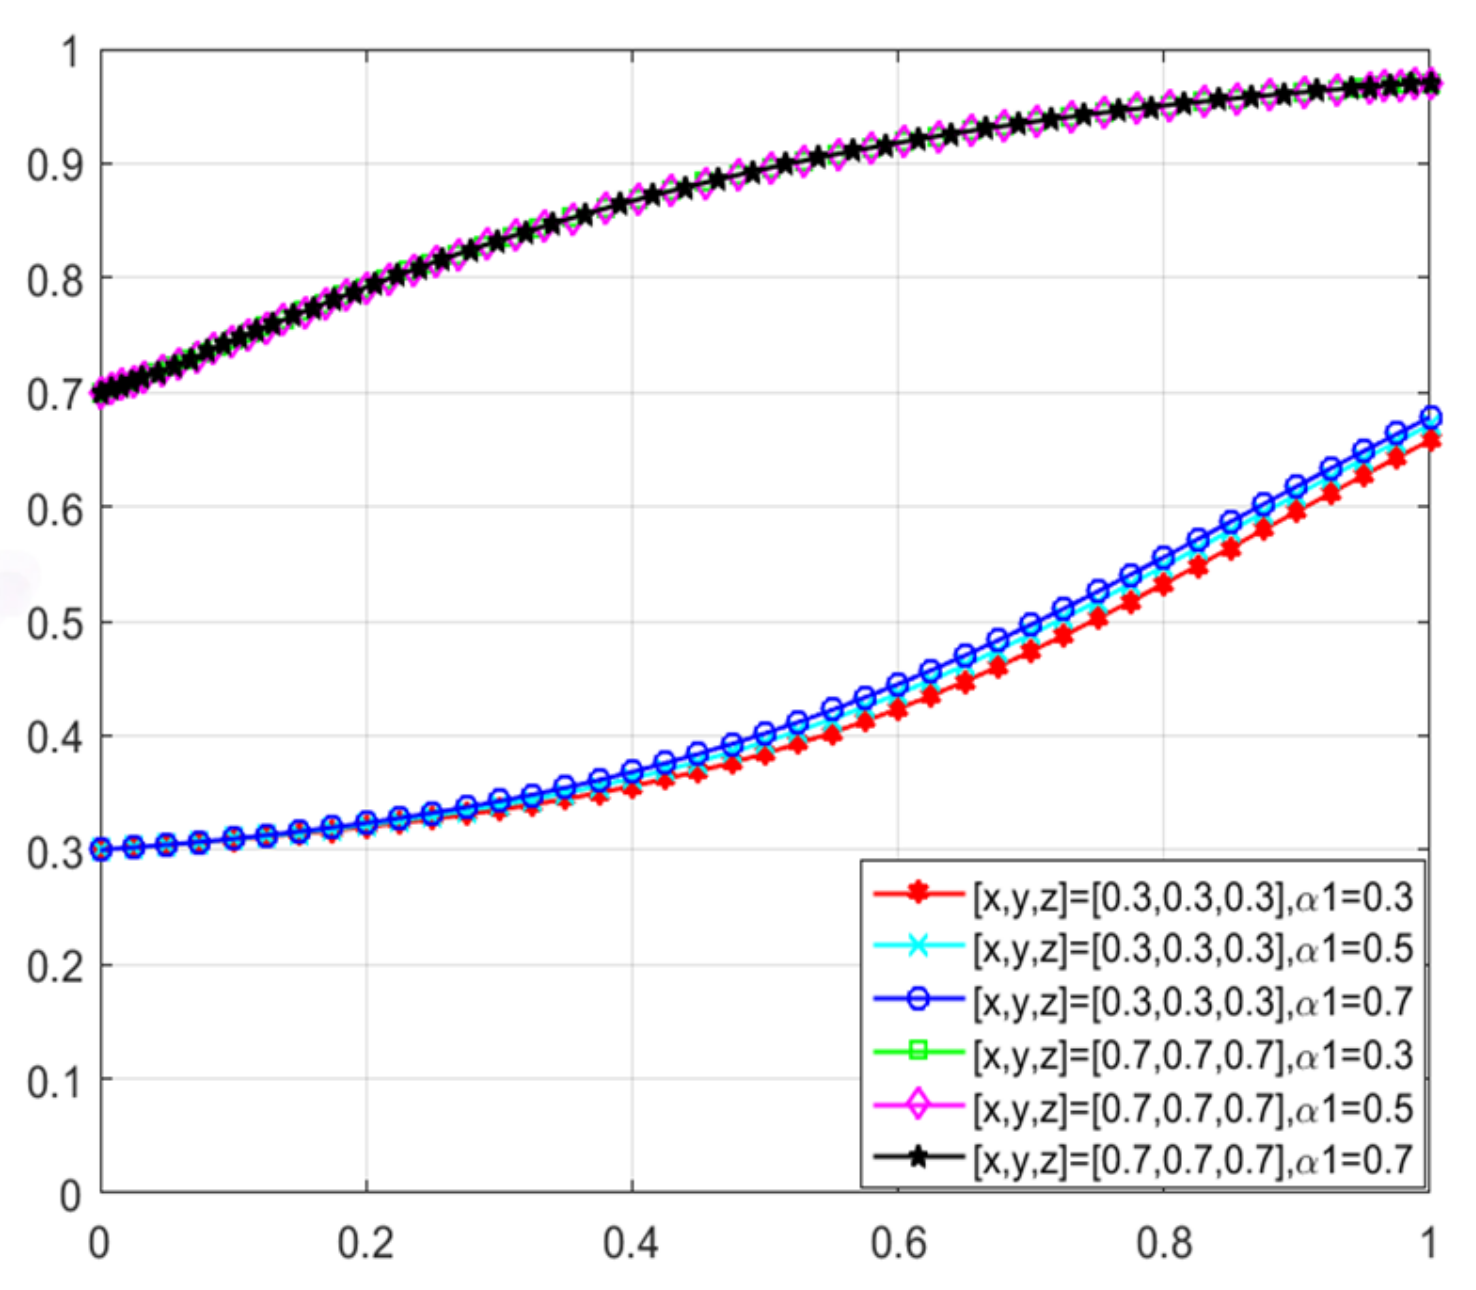
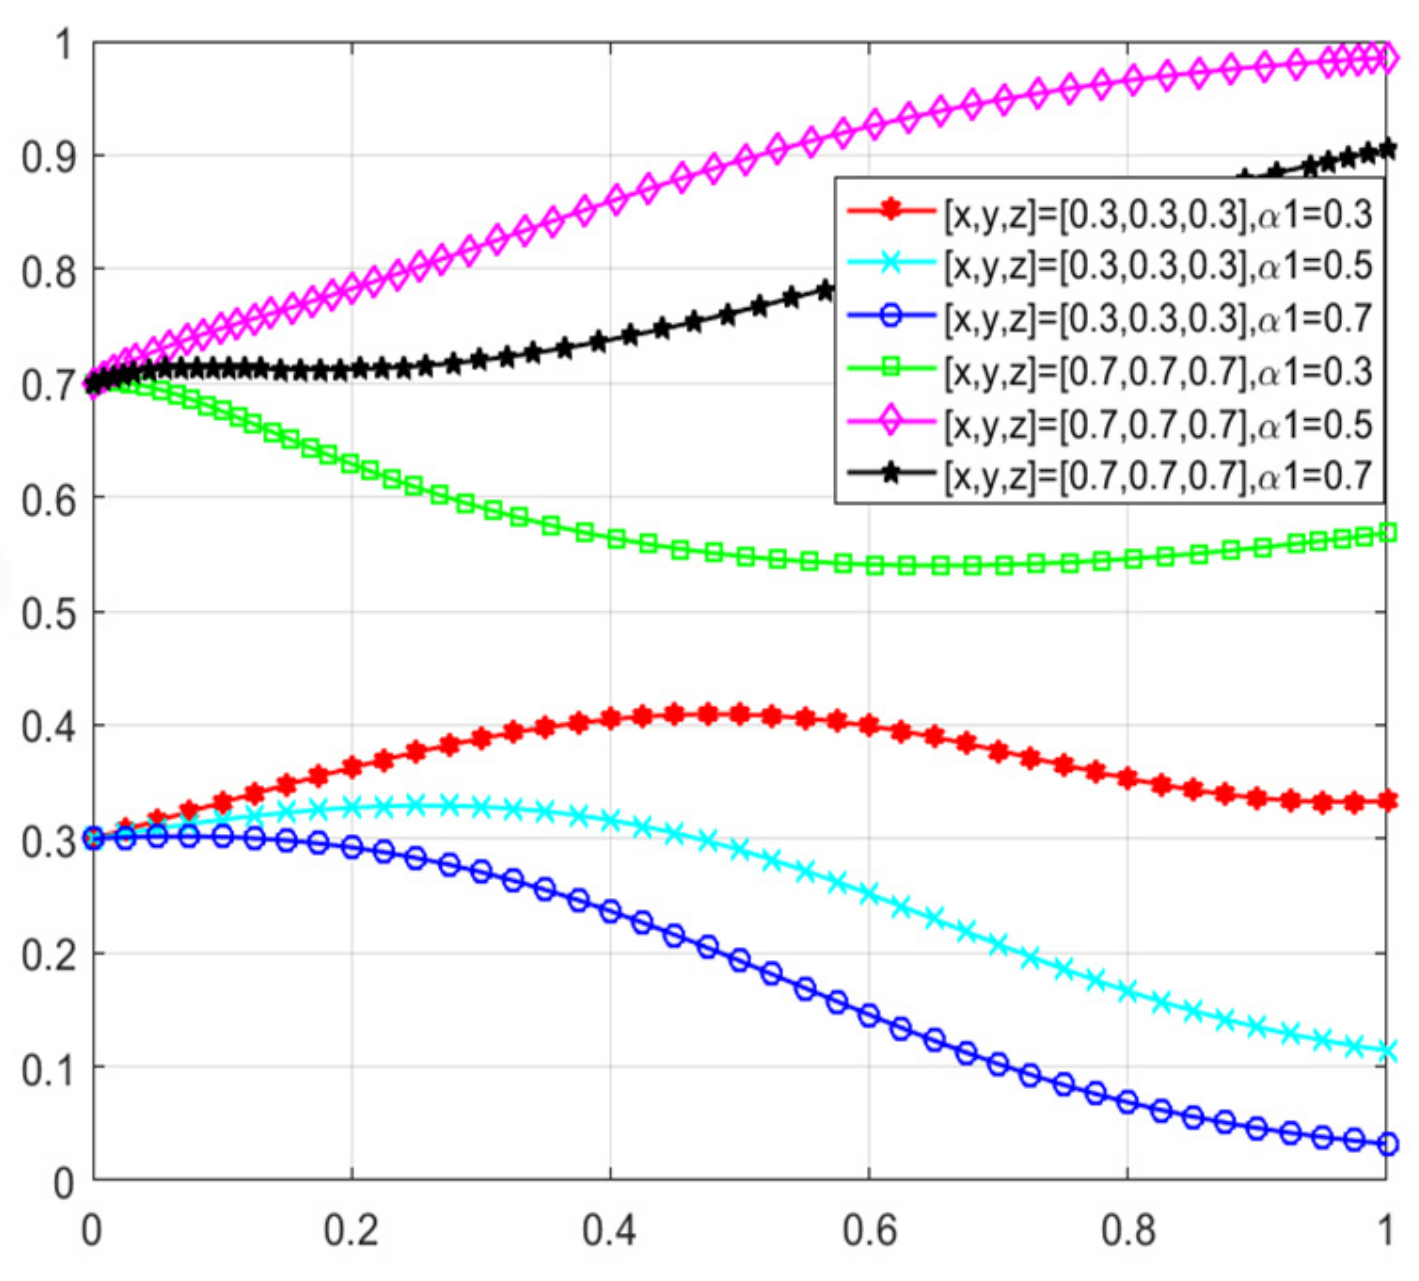
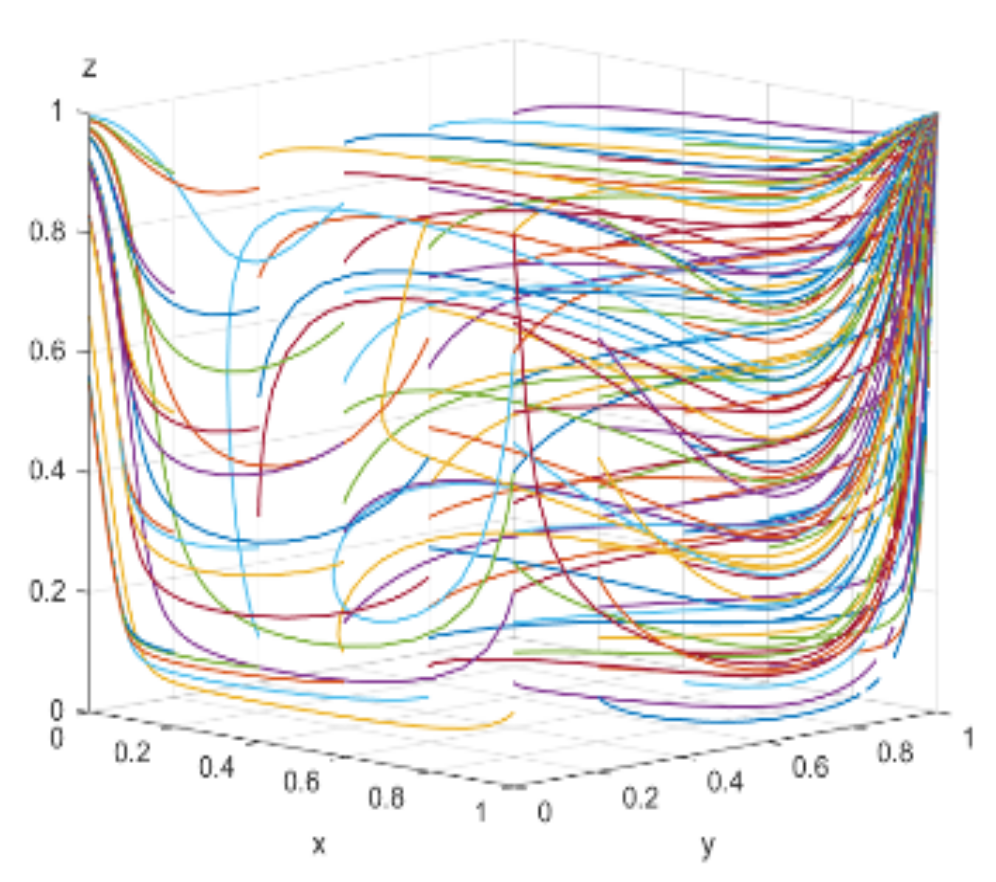
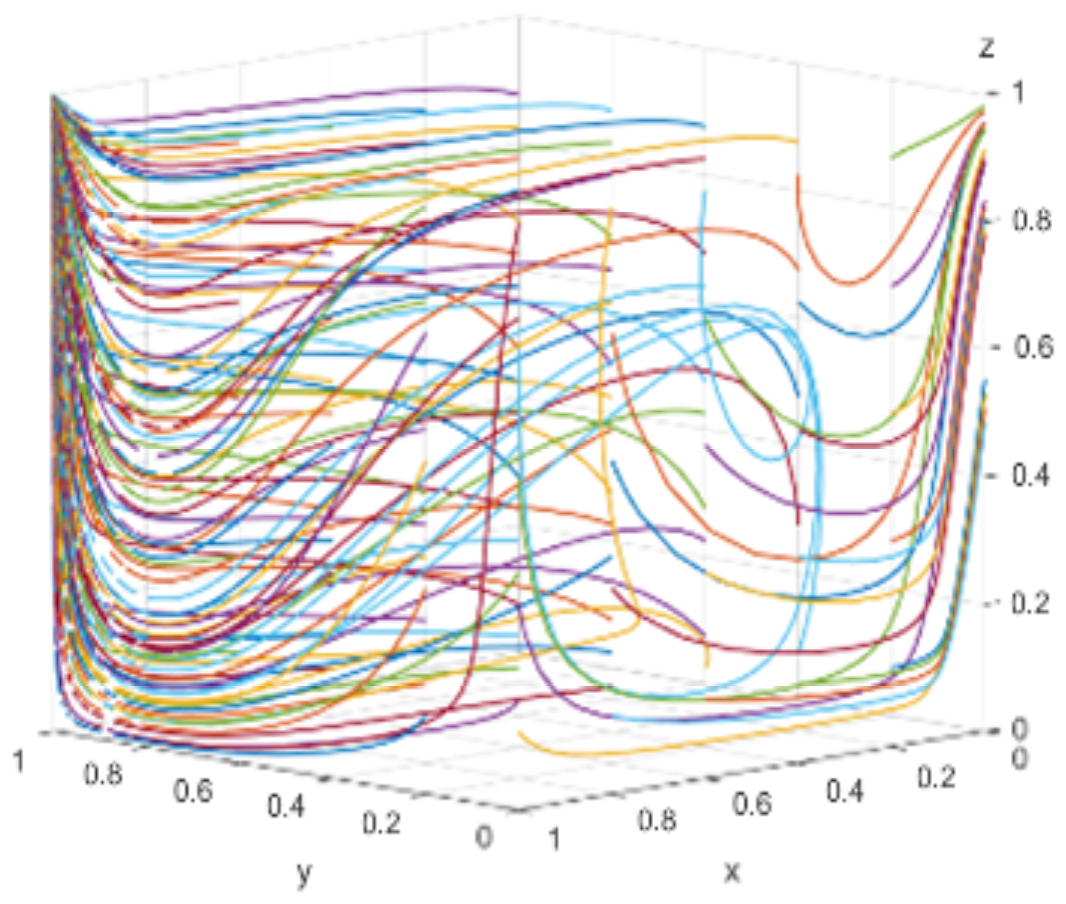
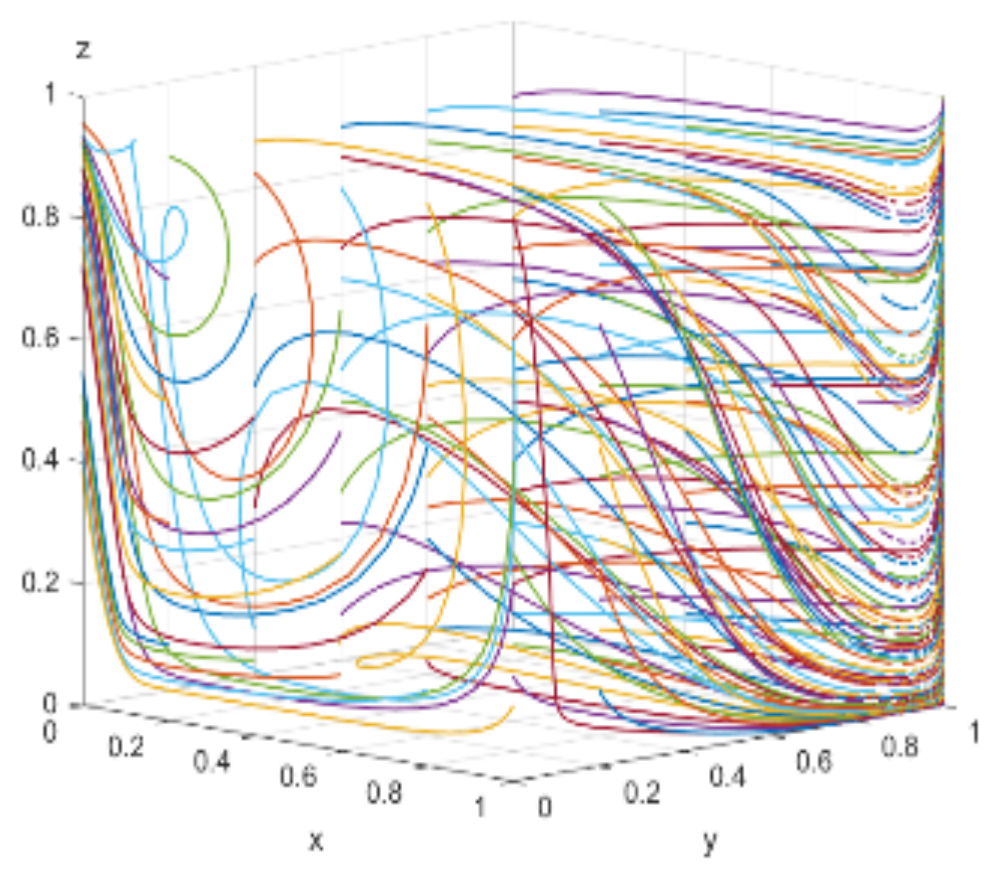

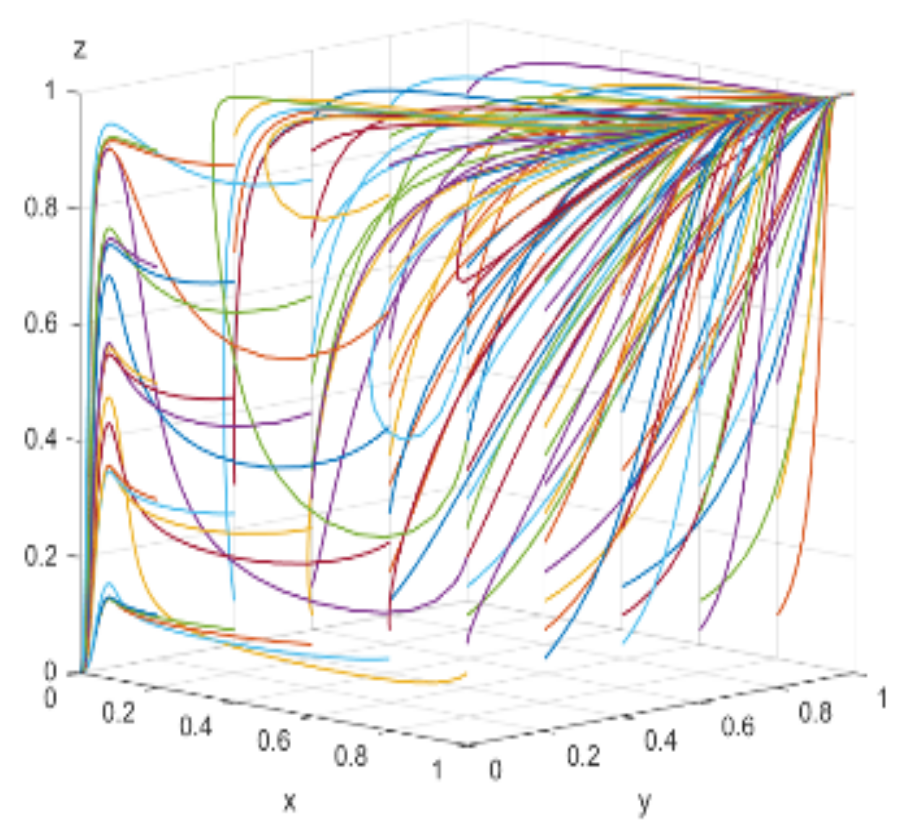


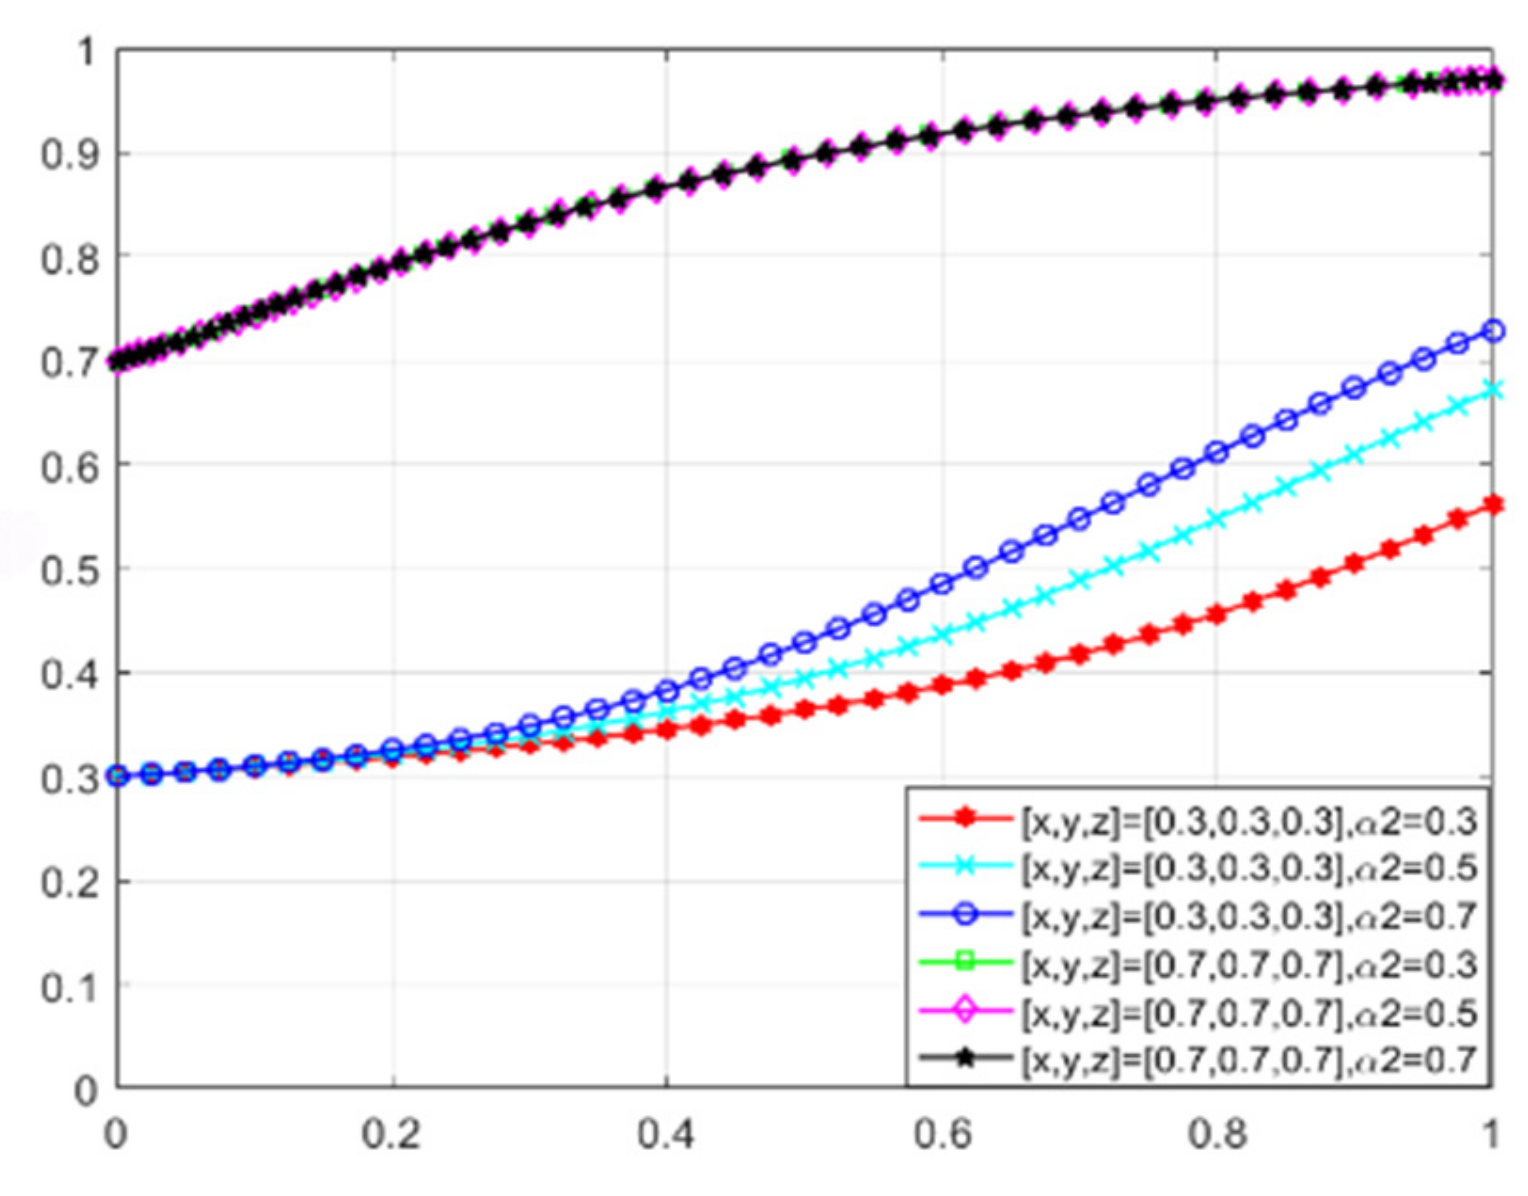


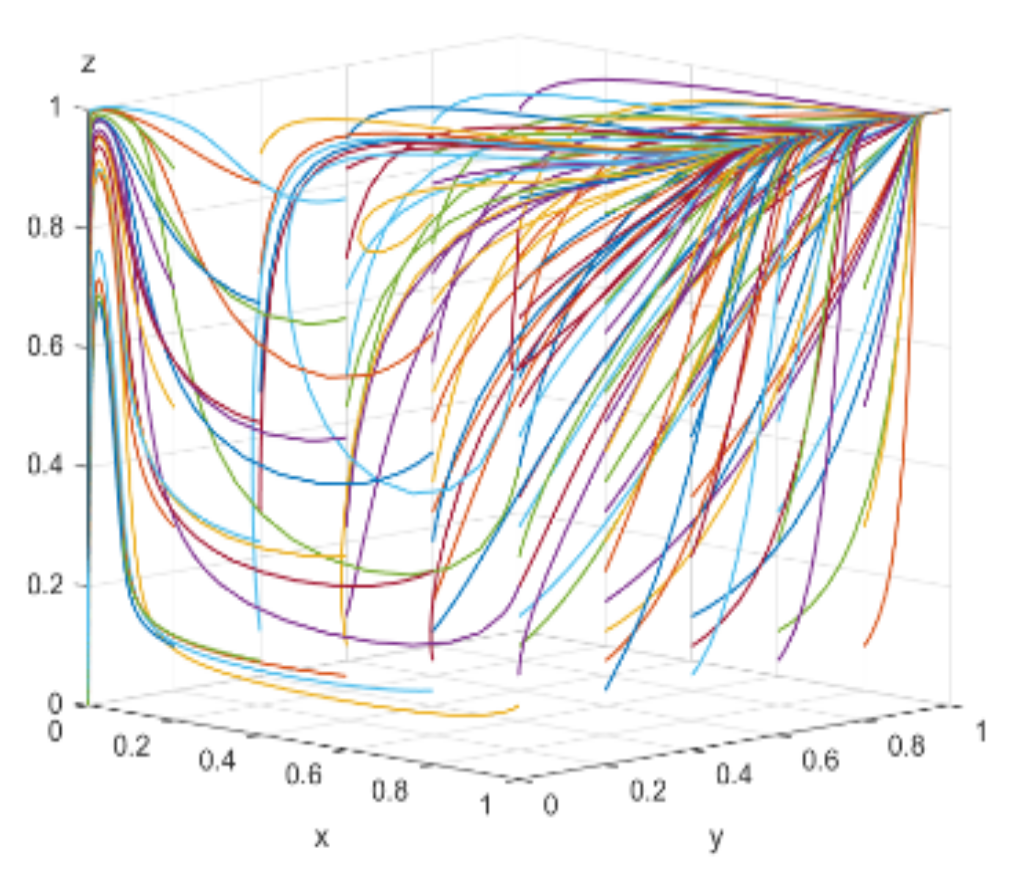
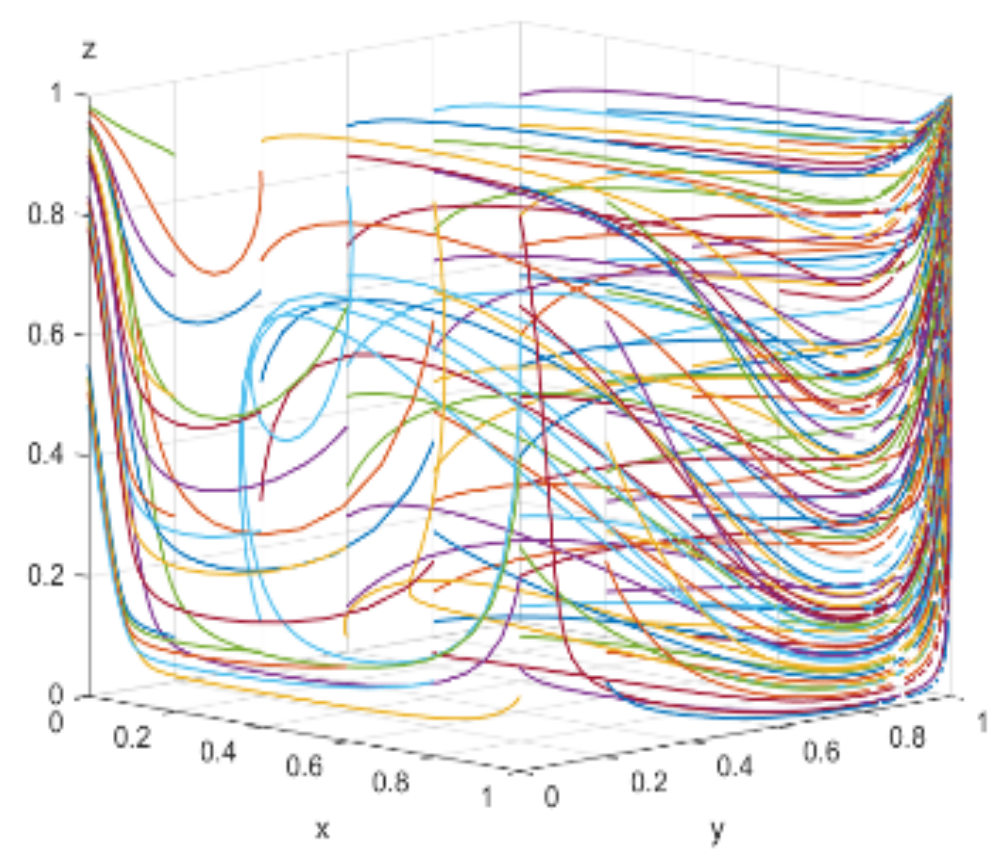
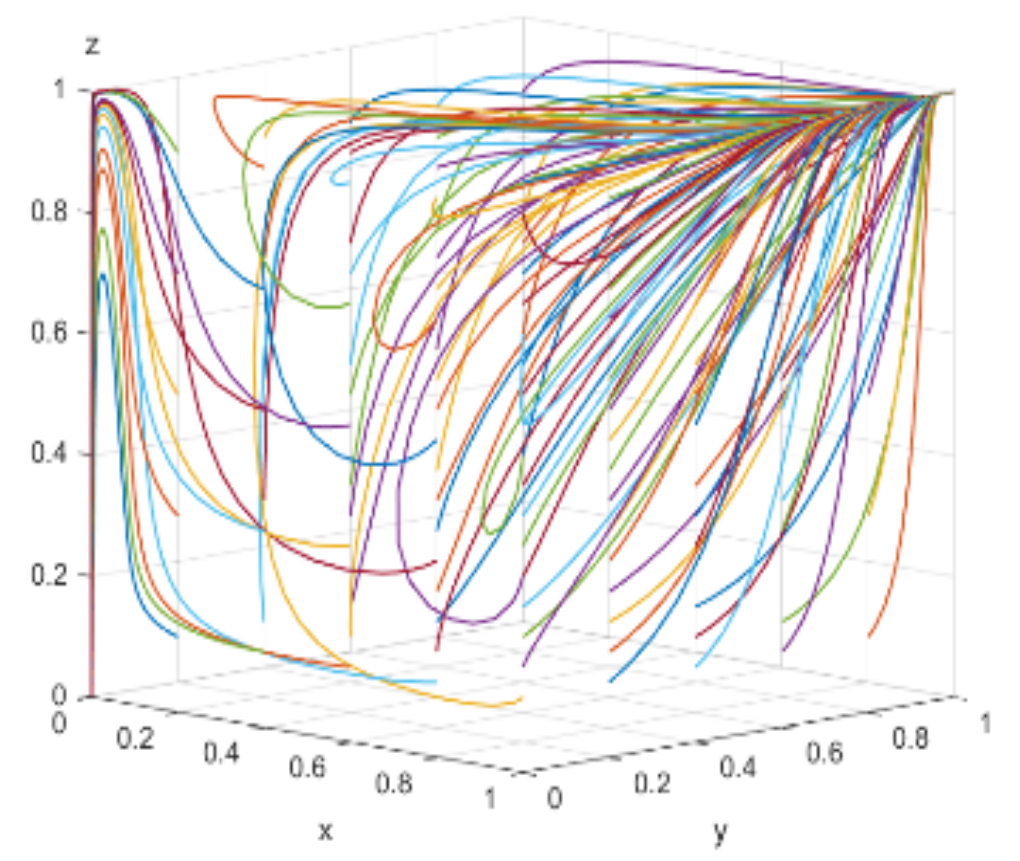
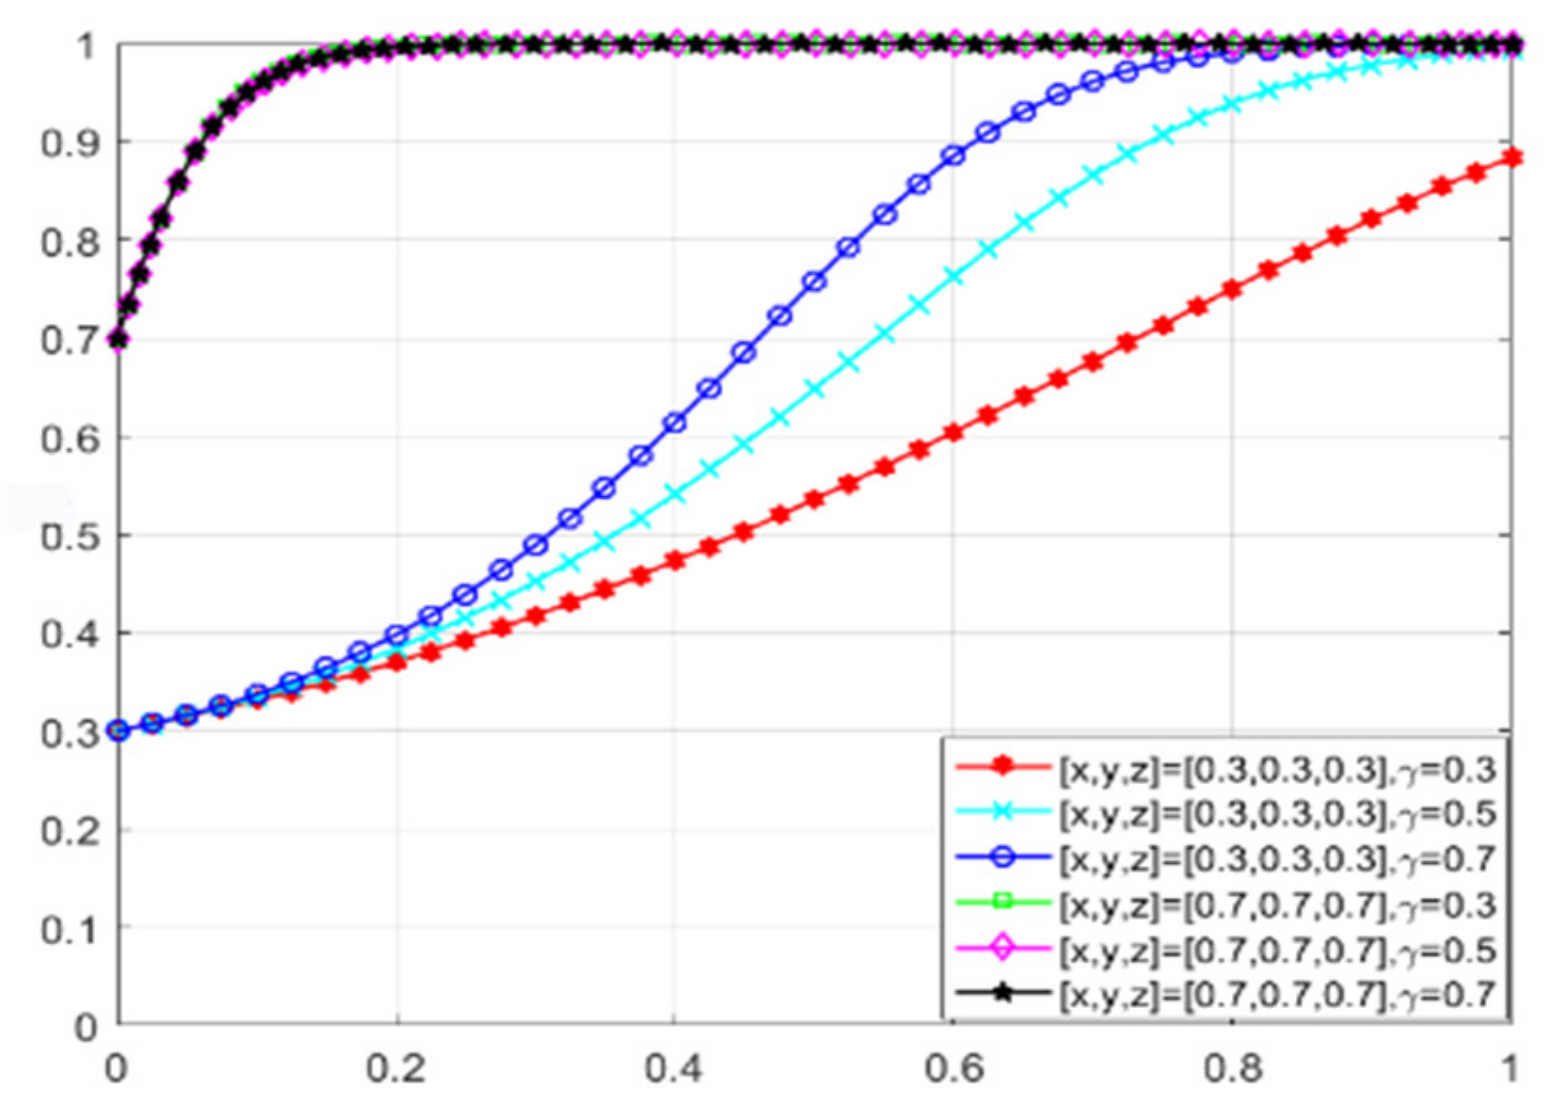
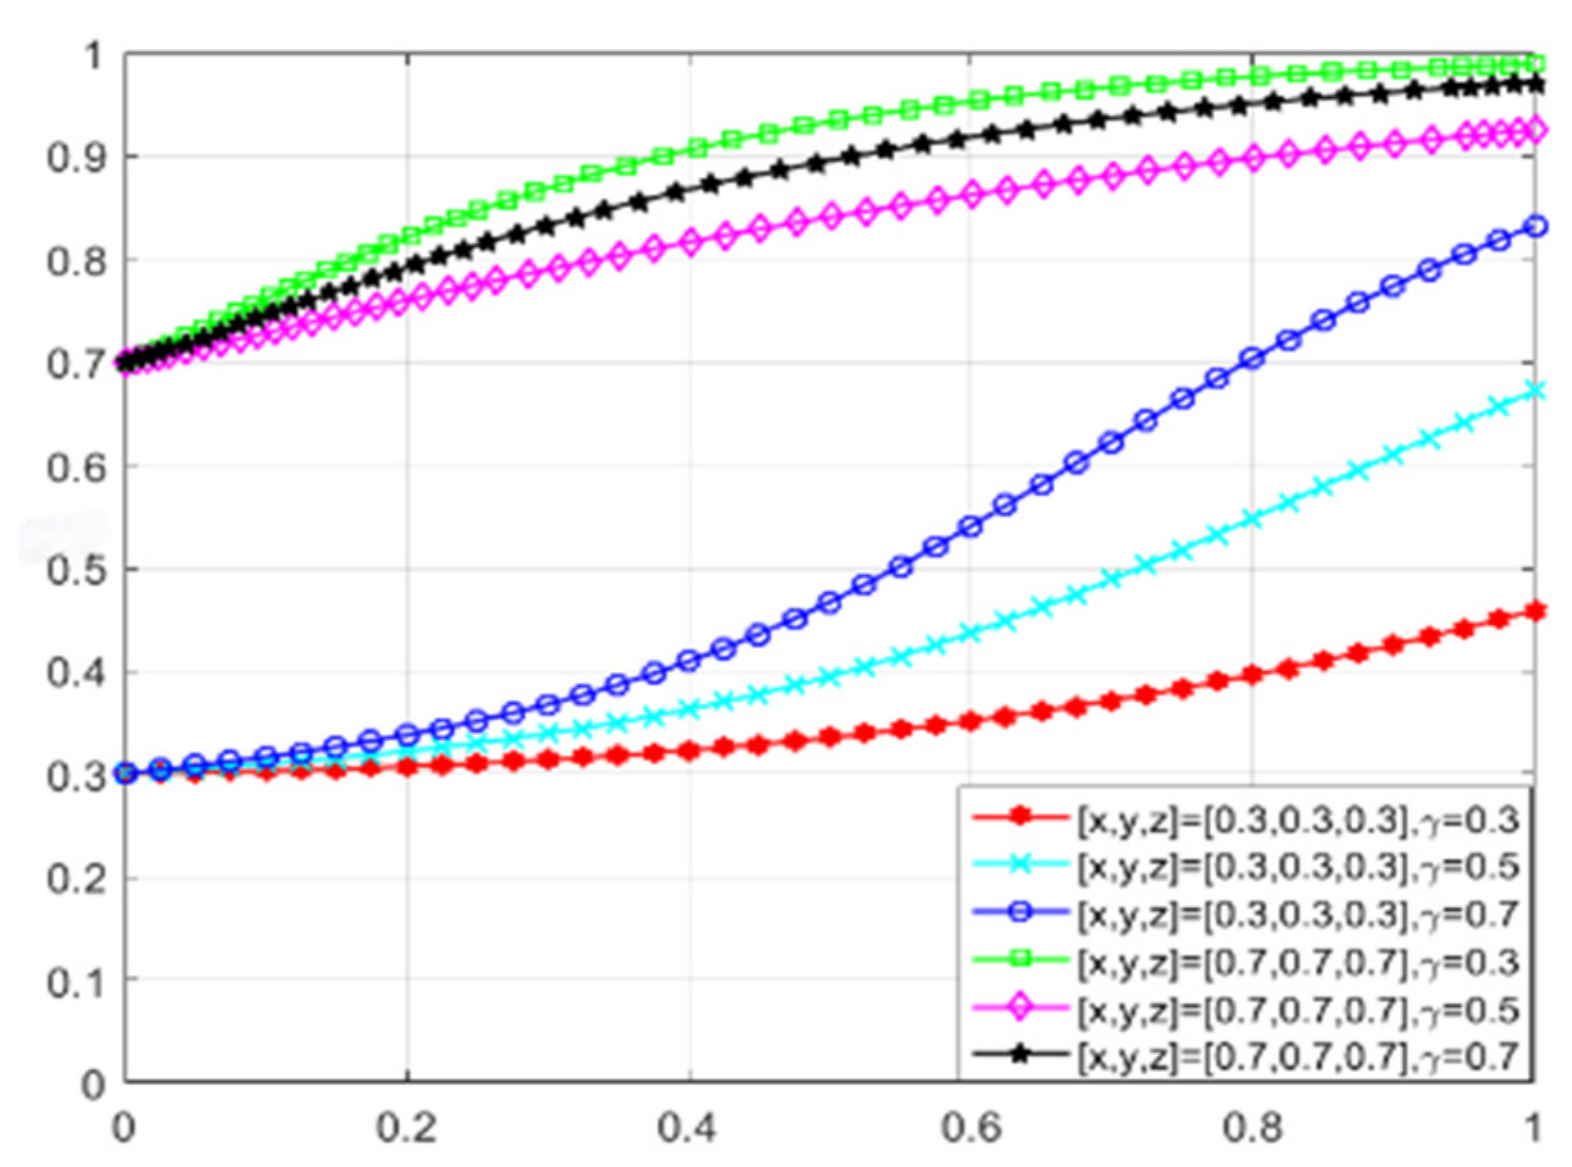

Disclaimer/Publisher’s Note: The statements, opinions and data contained in all publications are solely those of the individual author(s) and contributor(s) and not of MDPI and/or the editor(s). MDPI and/or the editor(s) disclaim responsibility for any injury to people or property resulting from any ideas, methods, instructions or products referred to in the content. |
© 2025 by the authors. Licensee MDPI, Basel, Switzerland. This article is an open access article distributed under the terms and conditions of the Creative Commons Attribution (CC BY) license (https://creativecommons.org/licenses/by/4.0/).