
Suitability Evaluation of Underground Space Development by Considering Socio-Economic Factors—An Empirical Study from Longgang Region of China


Abstract
:1. Introduction
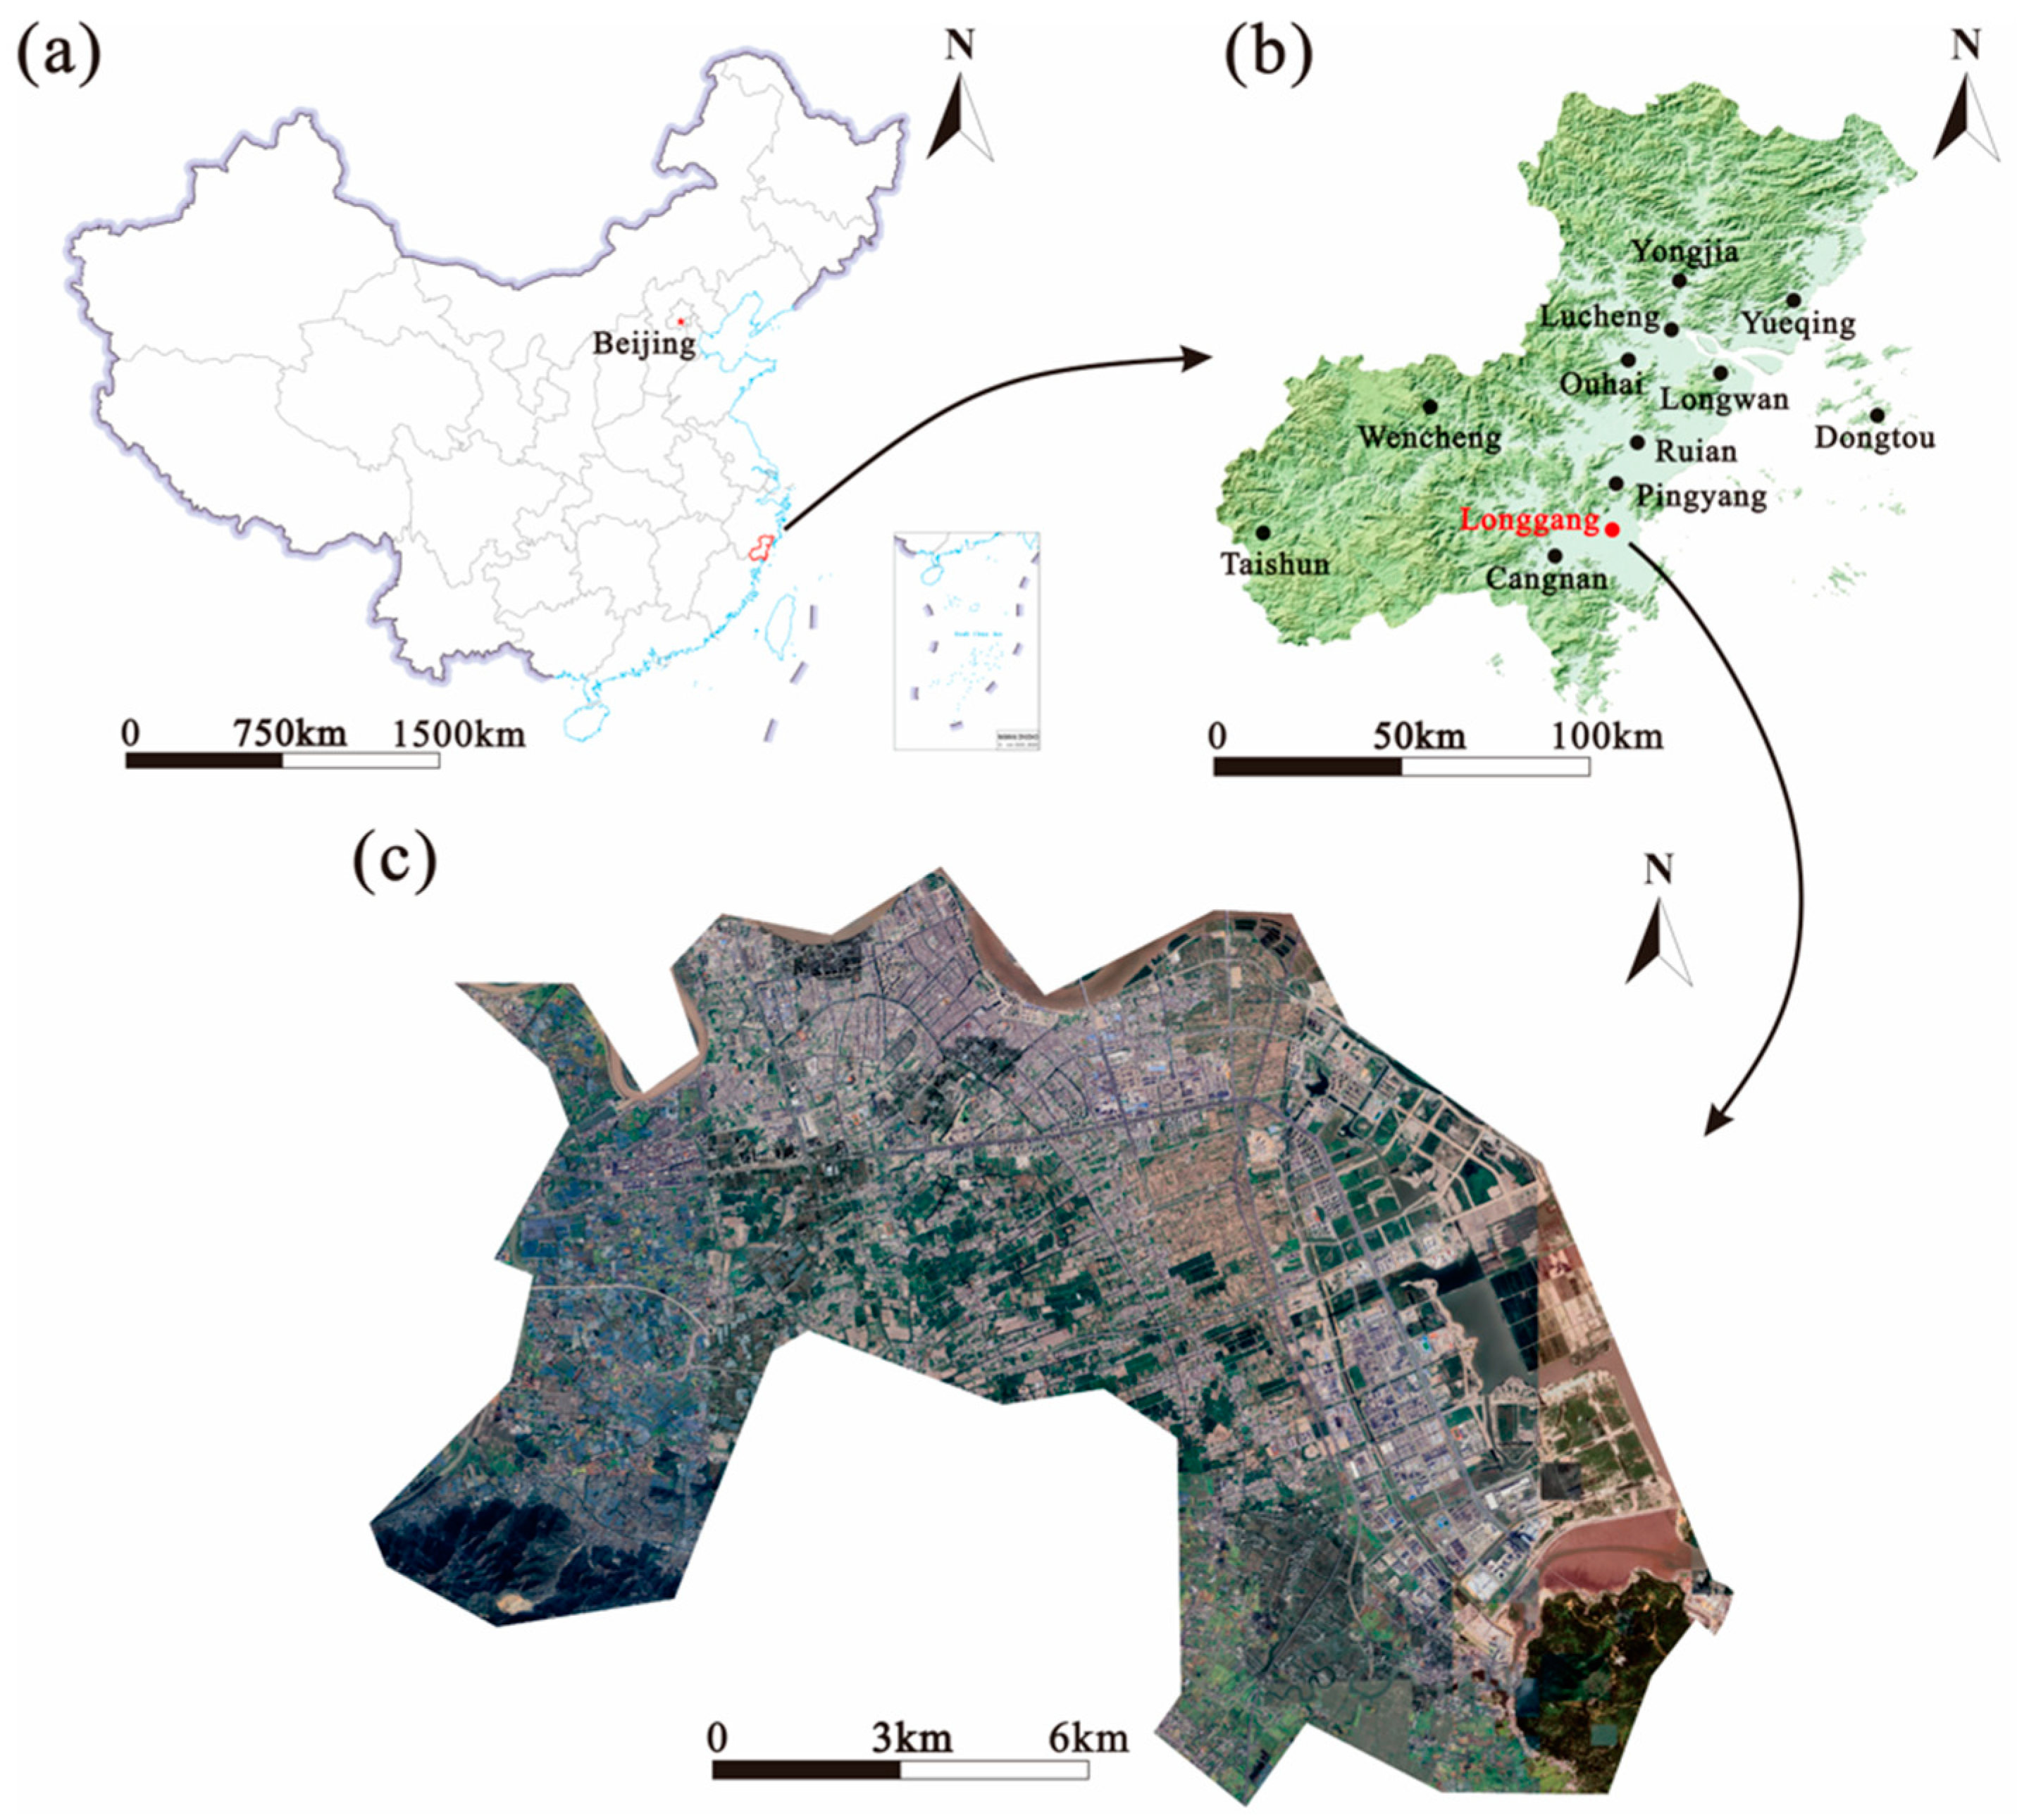
2. Study Area
3. Data and Methods
3.1. General Overview of the Modeling Process
3.2. Fuzzy Comprehensive Evaluation Method
3.2.1. Model Principles
3.2.2. FCE Modeling Process
- (i)
- The relationship between the influencing factors of underground space development and the evaluation objects was analyzed. Based on the classification criteria of the evaluation objects, the factor set (H) was determined. Given that the criteria for underground space development and utilization are multi-level standards, the characteristics of each level were described and quantified to determine the evaluation set (V).
- (ii)
- The fuzzy relationship for each indicator was determined during this step. It should be noted that the indicator system included both qualitative and quantitative indicators. The former were mainly descriptive factors such as lithology and groundwater corrosivity, and their membership degree was determined according to expert experience and knowledge. The quantitative indicators were in numerical form such as land subsidence and soft soil thickness. According to the statistical characteristics of the data of each factor, we applied three different mathematical functions to determine their membership degree, namely the descending half-trapezoid membership function, the ascending half-trapezoid membership function, and the triangular distribution membership function, represented by μ (x). In these equations, x represents the value of the indicator. For the descending half-trapezoid membership function, the thresholds (a and b) were set as mean and mean plus standard deviation. For the ascending half-trapezoid membership function, the thresholds were mean minus standard deviation and mean values. For the triangular distribution membership function, the three thresholds (a, b, and c) were mean minus standard deviation, mean, mean plus standard deviation, respectively. The detailed equations for the three functions are as follows:
- (iii)
- The AHP and group judgment matrix methods were used to determine the weights of geological environmental and socio-economic factors, respectively. The details of these two methods will be presented in the following section. After determining the fuzzy evaluation matrix R and fuzzy weight W, the comprehensive evaluation model expression is B = W * R. B is a fuzzy comprehensive evaluation set, denoted by B = (b1, b2, …, bn). bn is the membership degree of the evaluation grade Vn to the grade fuzzy subset B obtained by the comprehensive evaluation.
3.3. Evaluation System Construction
3.3.1. Geological Environmental Factors
3.3.2. Socio-Economic Factors
3.4. Determination of Indicator Weight
3.4.1. Analytic Hierarchy Process
- (i)
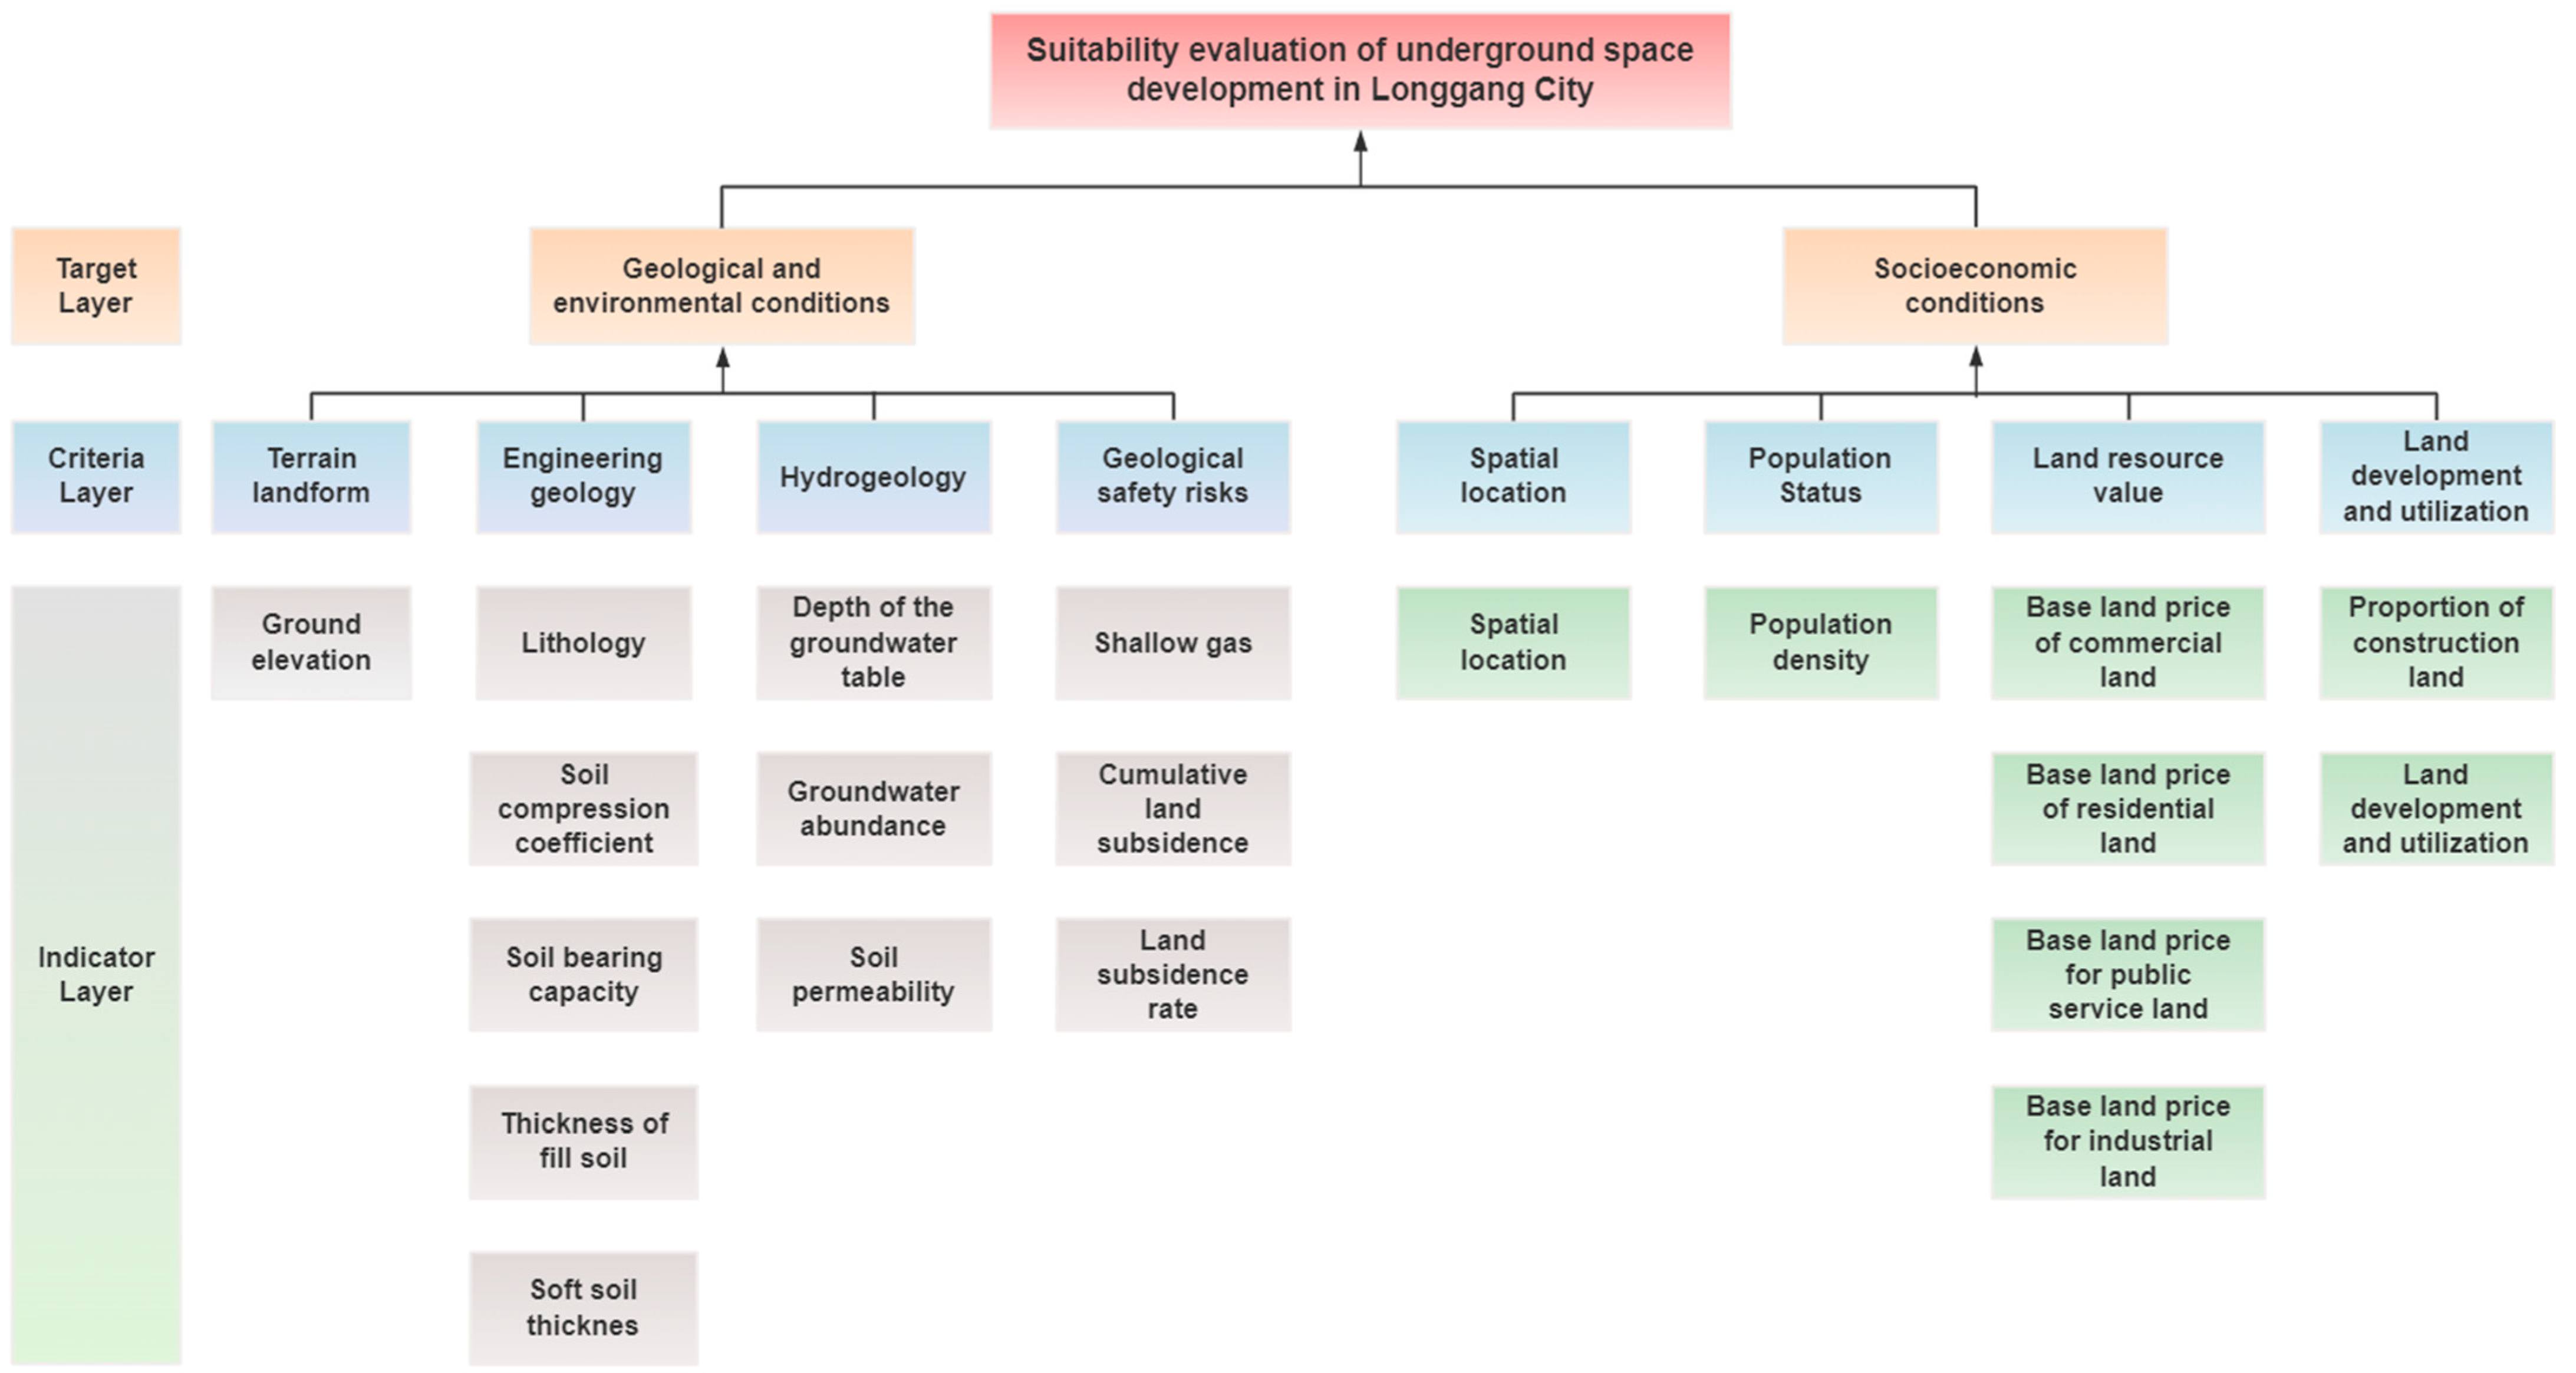
- Establish the hierarchical structure model for weight calculation: The evaluation model is structured into three levels: the goal layer, the criterion layer, and the indicator layer (as shown in Figure 11), forming a complete site suitability evaluation process. The target layer represents the final result of the site suitability evaluation. The criterion layer classifies indicators based on their relevance, dividing the evaluation indicators into four categories: hydrogeological conditions, engineering geological conditions, geological safety risk conditions, and topographic and geomorphological conditions. The indicator layer consists of specific evaluation factors.
- (ii)
- Target–criterion layer comparison matrix and consistency test: According to the comparison matrix element discrimination scale, the target–criterion layer judgment matrix is established (Table 6). The maximum eigenvalue of the comparison matrix is obtained and substituted into the matrix. The normalized eigenvector corresponding to the maximum eigenvalue can be obtained as W = (0.0846,0.3891,0.2632,0.2631) T. Therefore, the consistency of the A-B (target–criterion layer) discriminant matrix meets the requirements.
- (iii)
- Criteria–index layer comparison matrix and consistency test: In the same way, a comparison matrix for the criterion–index layer can be established to calculate the maximum eigenvalue of the matrix and the corresponding normalized eigenvector. At the same time, a consistency test is required. The results show that the consistency test results of each comparison matrix meet the preset standards.
- (iv)
- Hierarchical total ranking and consistency test: After completing the hierarchical analysis of the target–criterion layer and the criterion–index layer, the weights of the two layers need to be weighted and integrated to perform hierarchical total ranking. The goal of this process is to calculate the relative importance of the weight of each index relative to the target layer and determine the overall weight of the index layer factors. The results are shown in Table 7 and Table 8. In order to ensure the credibility of the analysis results, the total ranking of the hierarchy was tested for consistency, and the results showed that the consistency reached a satisfactory level.
3.4.2. Group Judgment Matrix Method
- (i)
- Expert Selection: The selection of experts plays a crucial role in the evaluation results in the group judgment matrix method. To ensure the scientific and objective nature of the evaluation, the experts were chosen based on the following criteria: first, experts should have at least five years of research or practical experience in fields such as underground space development, urban planning, or geotechnical engineering; second, experts should possess a certain academic background or industry influence, having published multiple papers or participated in large-scale projects in the relevant fields.
- (ii)
- Weight Assignment: In the weight allocation process, experts assign scores to each evaluation factor based on the practical situation of underground space development and the importance of each indicator. Quantified scoring standards are used to ensure objectivity and standardization in the scoring process. All scoring results are input into the judgment matrix, and the final weights are calculated using the group judgment matrix method. The scoring criteria are based on the relative importance of each indicator in the context of underground space development.
- (iii)
- Handling Expert Discrepancies: To address potential biases and differences in expert ratings, this study adopts a discussion mechanism for expert scores. During the initial scoring phase, experts independently submit their scores. In cases of significant discrepancies, a collective discussion is organized, where experts share their reasoning and scoring basis, and consensus is reached through collaborative negotiation. If large differences still persist after the discussion, extreme value removal or weighted averaging methods will be applied to ensure the objectivity and consistency of the scoring results.
- (iv)
- Consistency Check: To ensure that the scores in the group judgment matrix method are consistent and reasonable, a consistency check is conducted. After calculating the weights, the consistency ratio (CR) is tested. If the CR value exceeds 0.1, the scoring matrix will be further revised. If the CR value is less than 0.1, the scoring matrix is considered to be sufficiently consistent, and the final weight values are deemed reliable. The core principle behind this approach is explored below.
4. Results
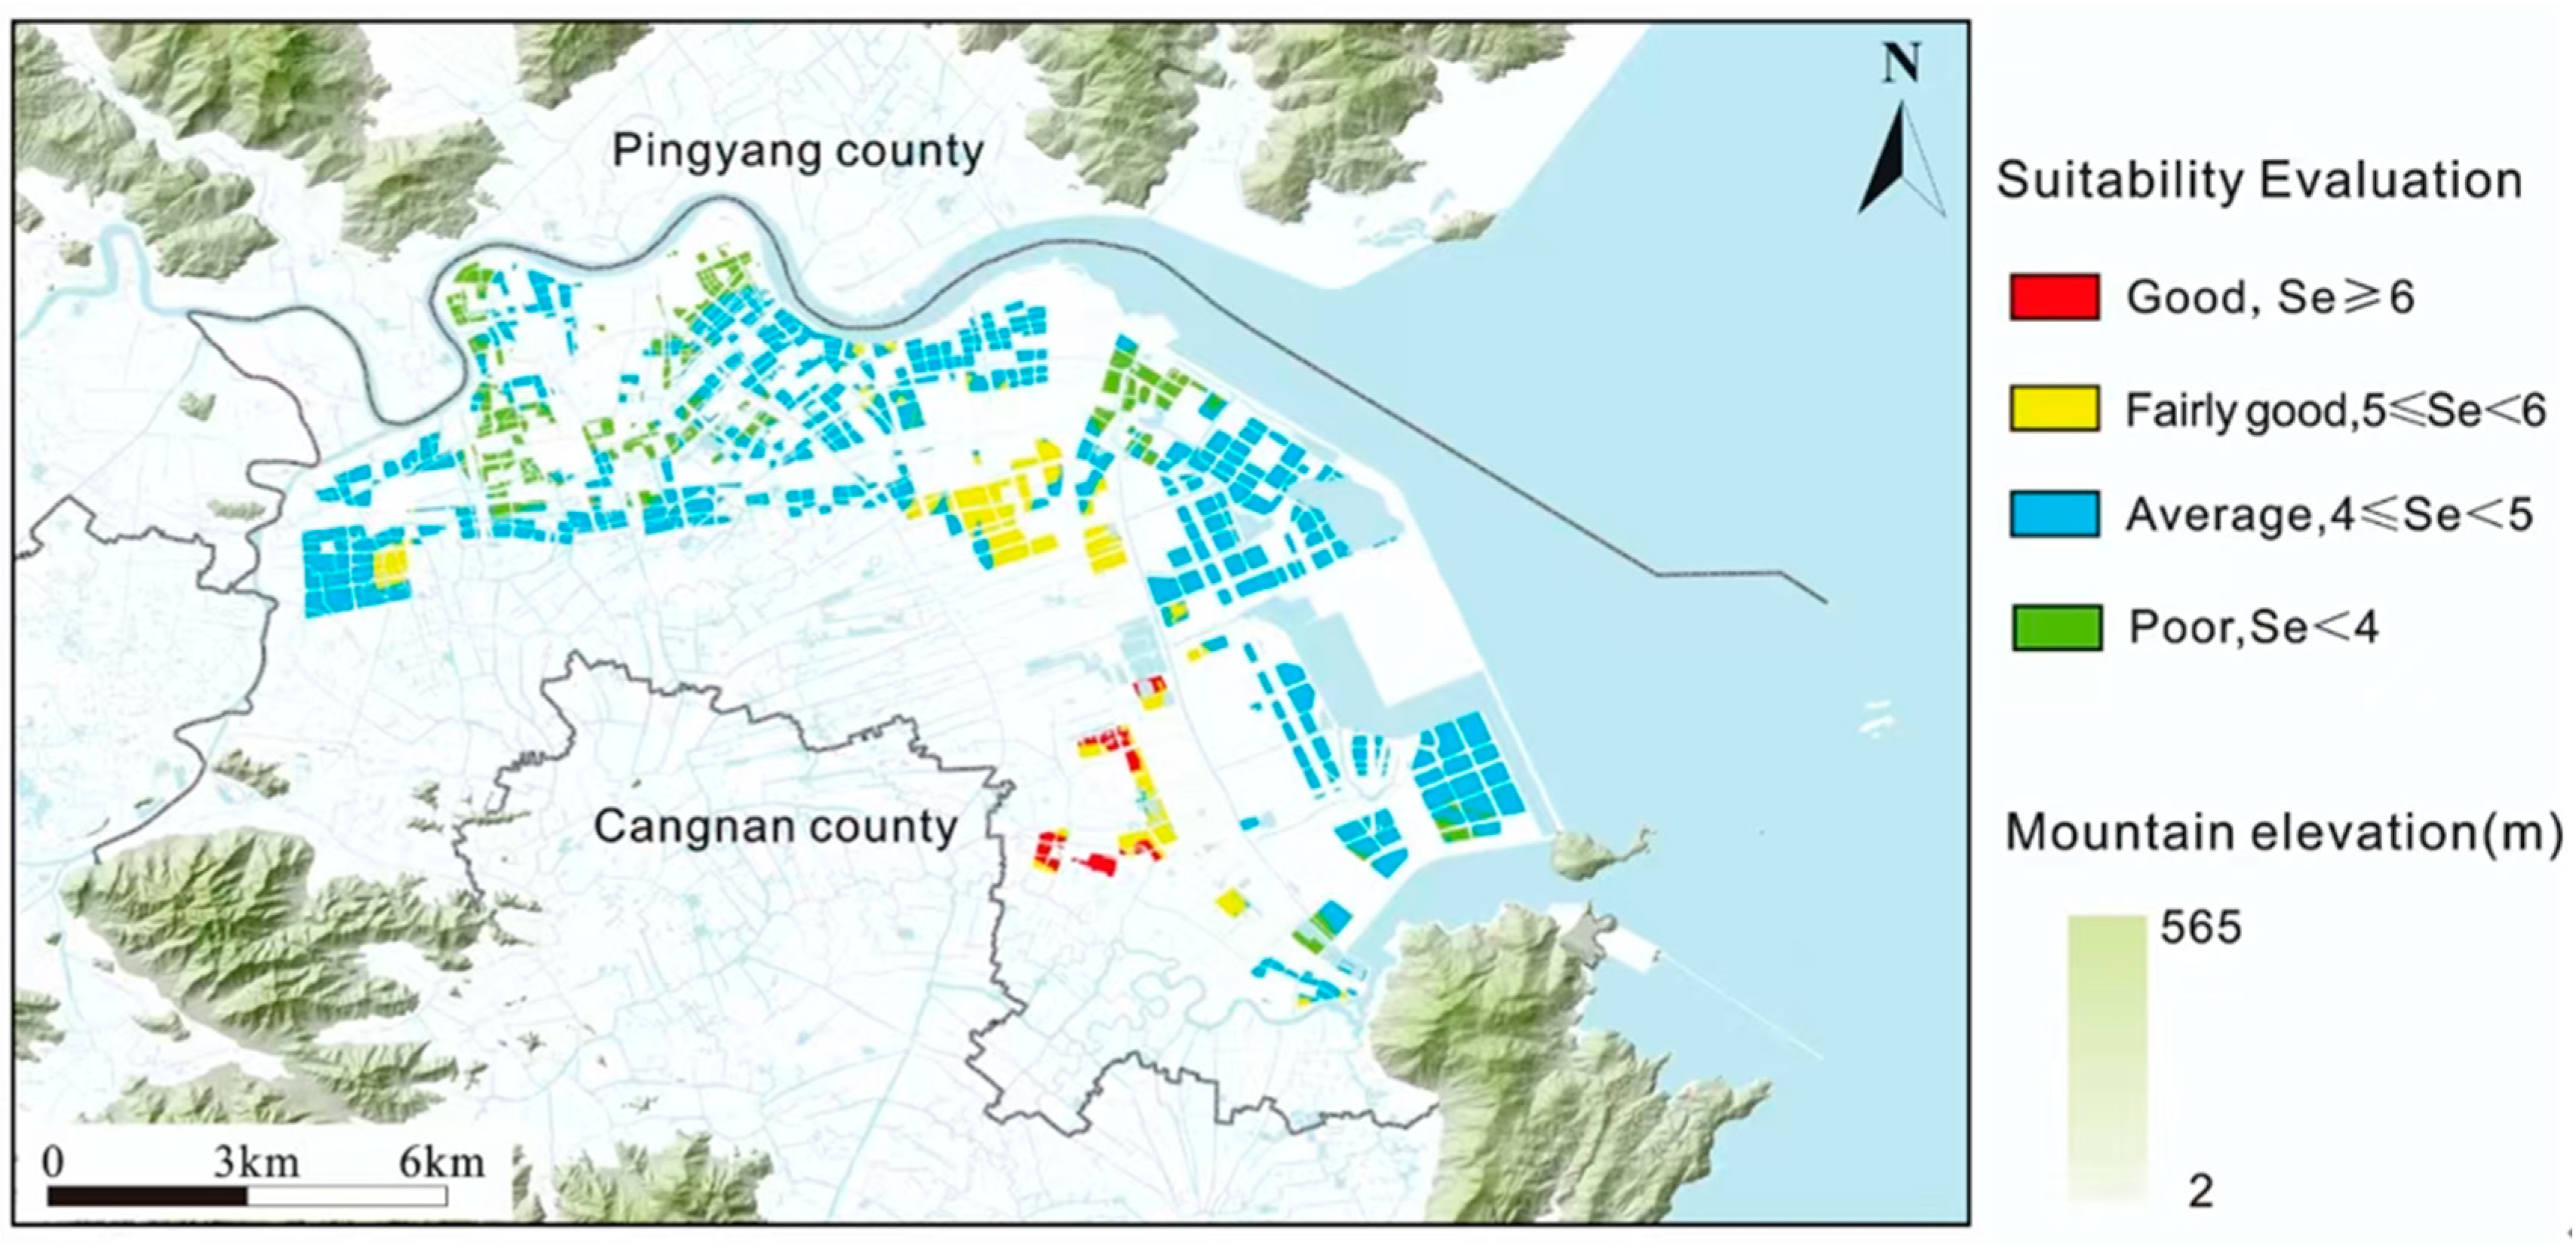
4.1. Geological Environmental Suitability Evaluation
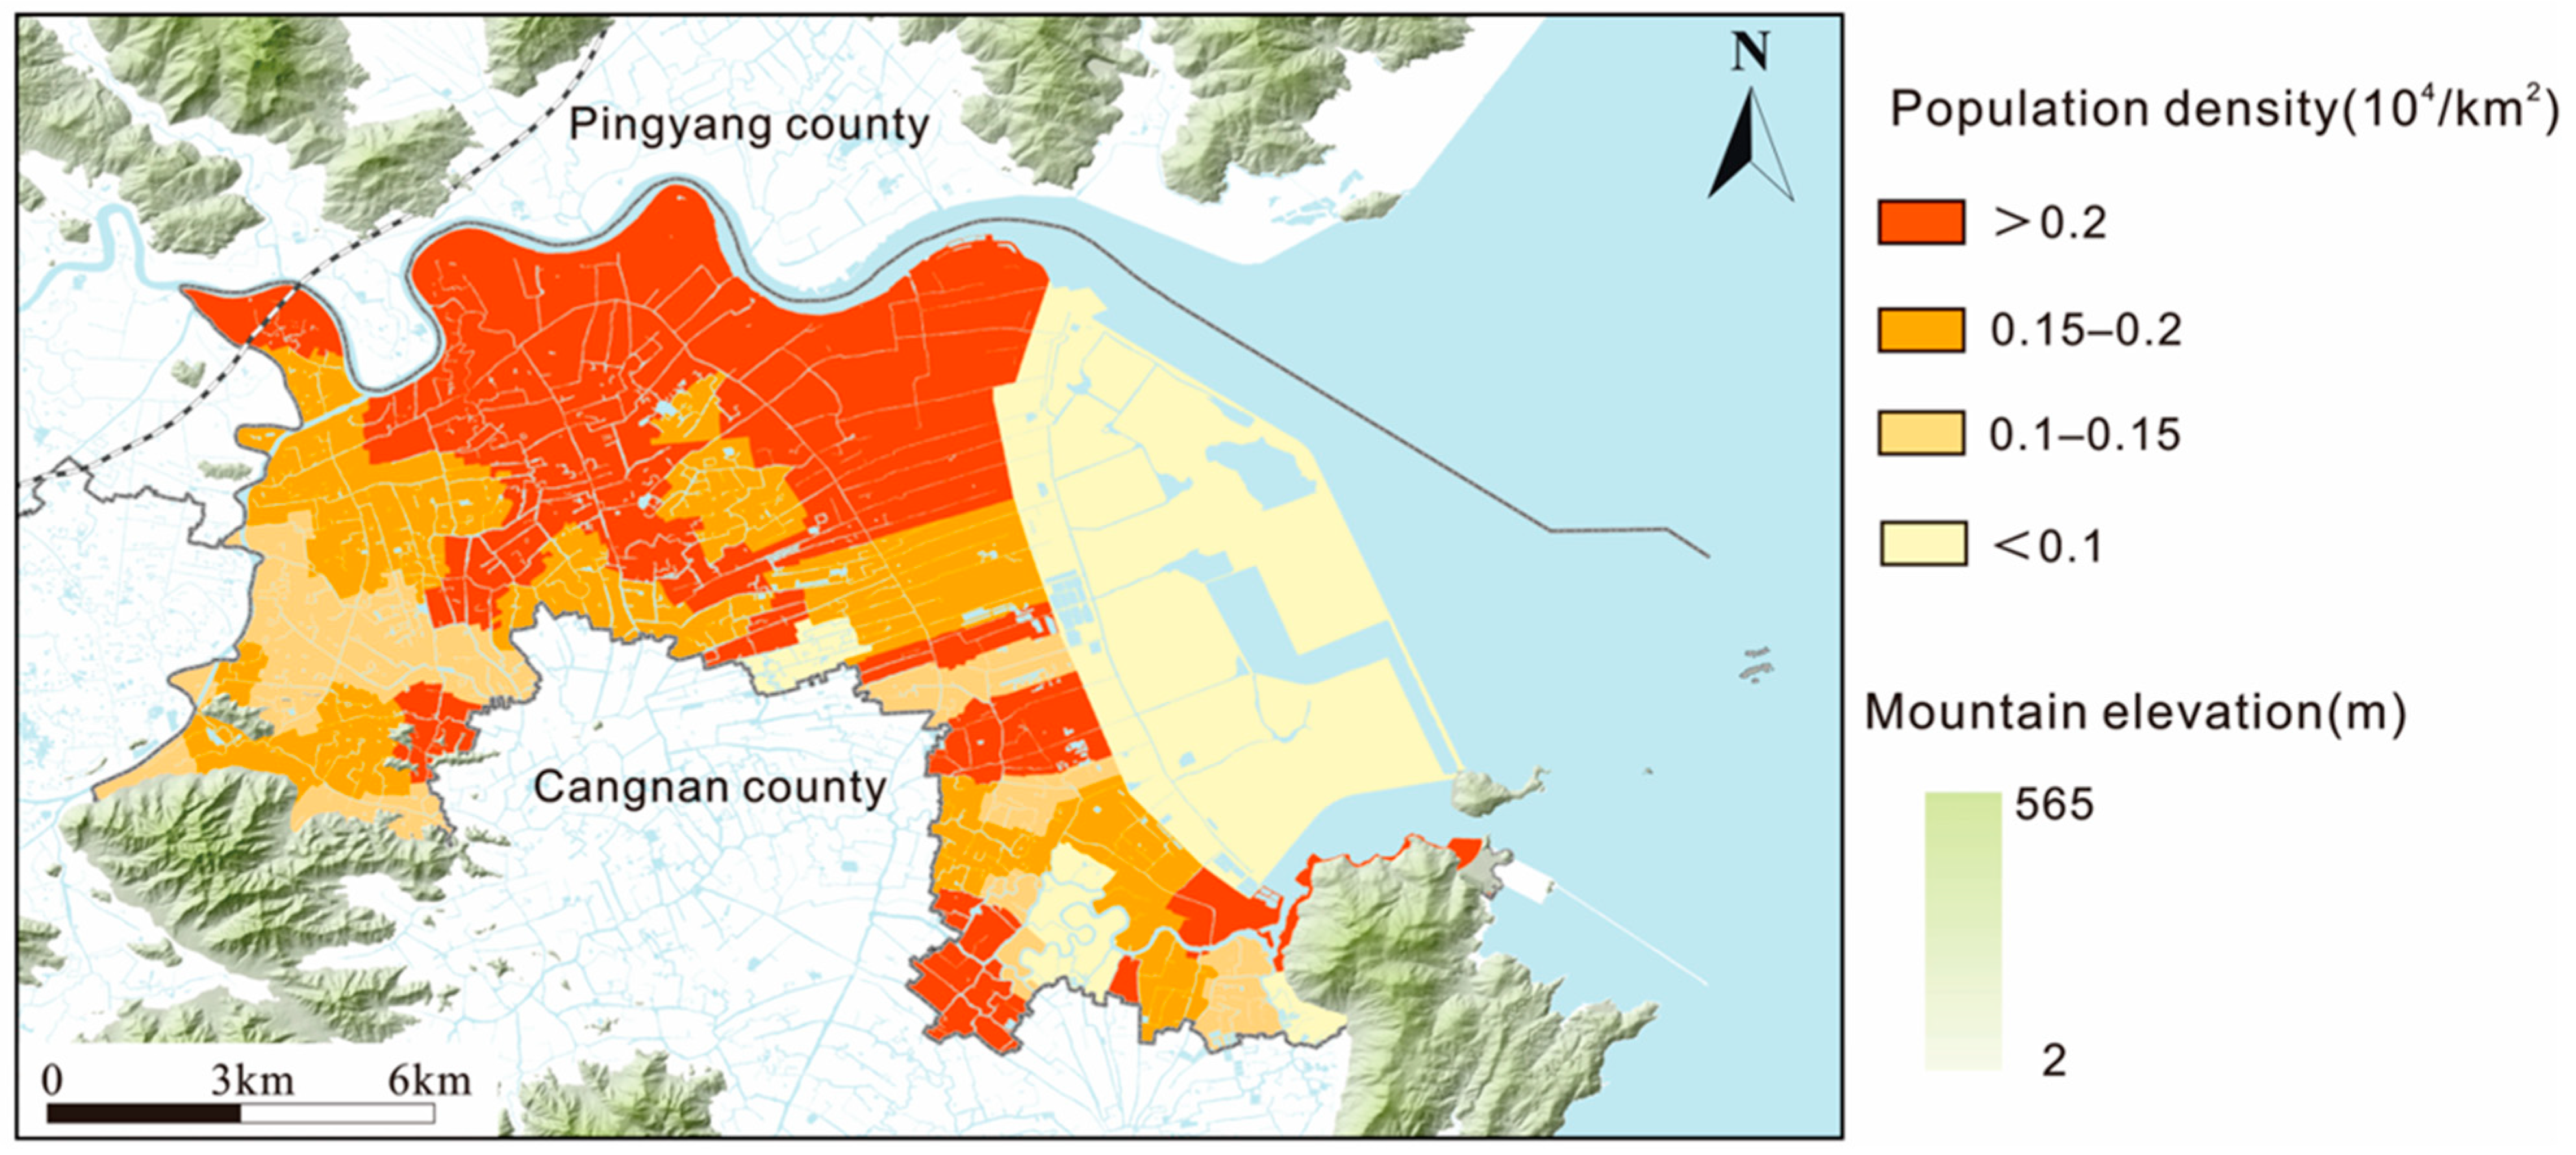
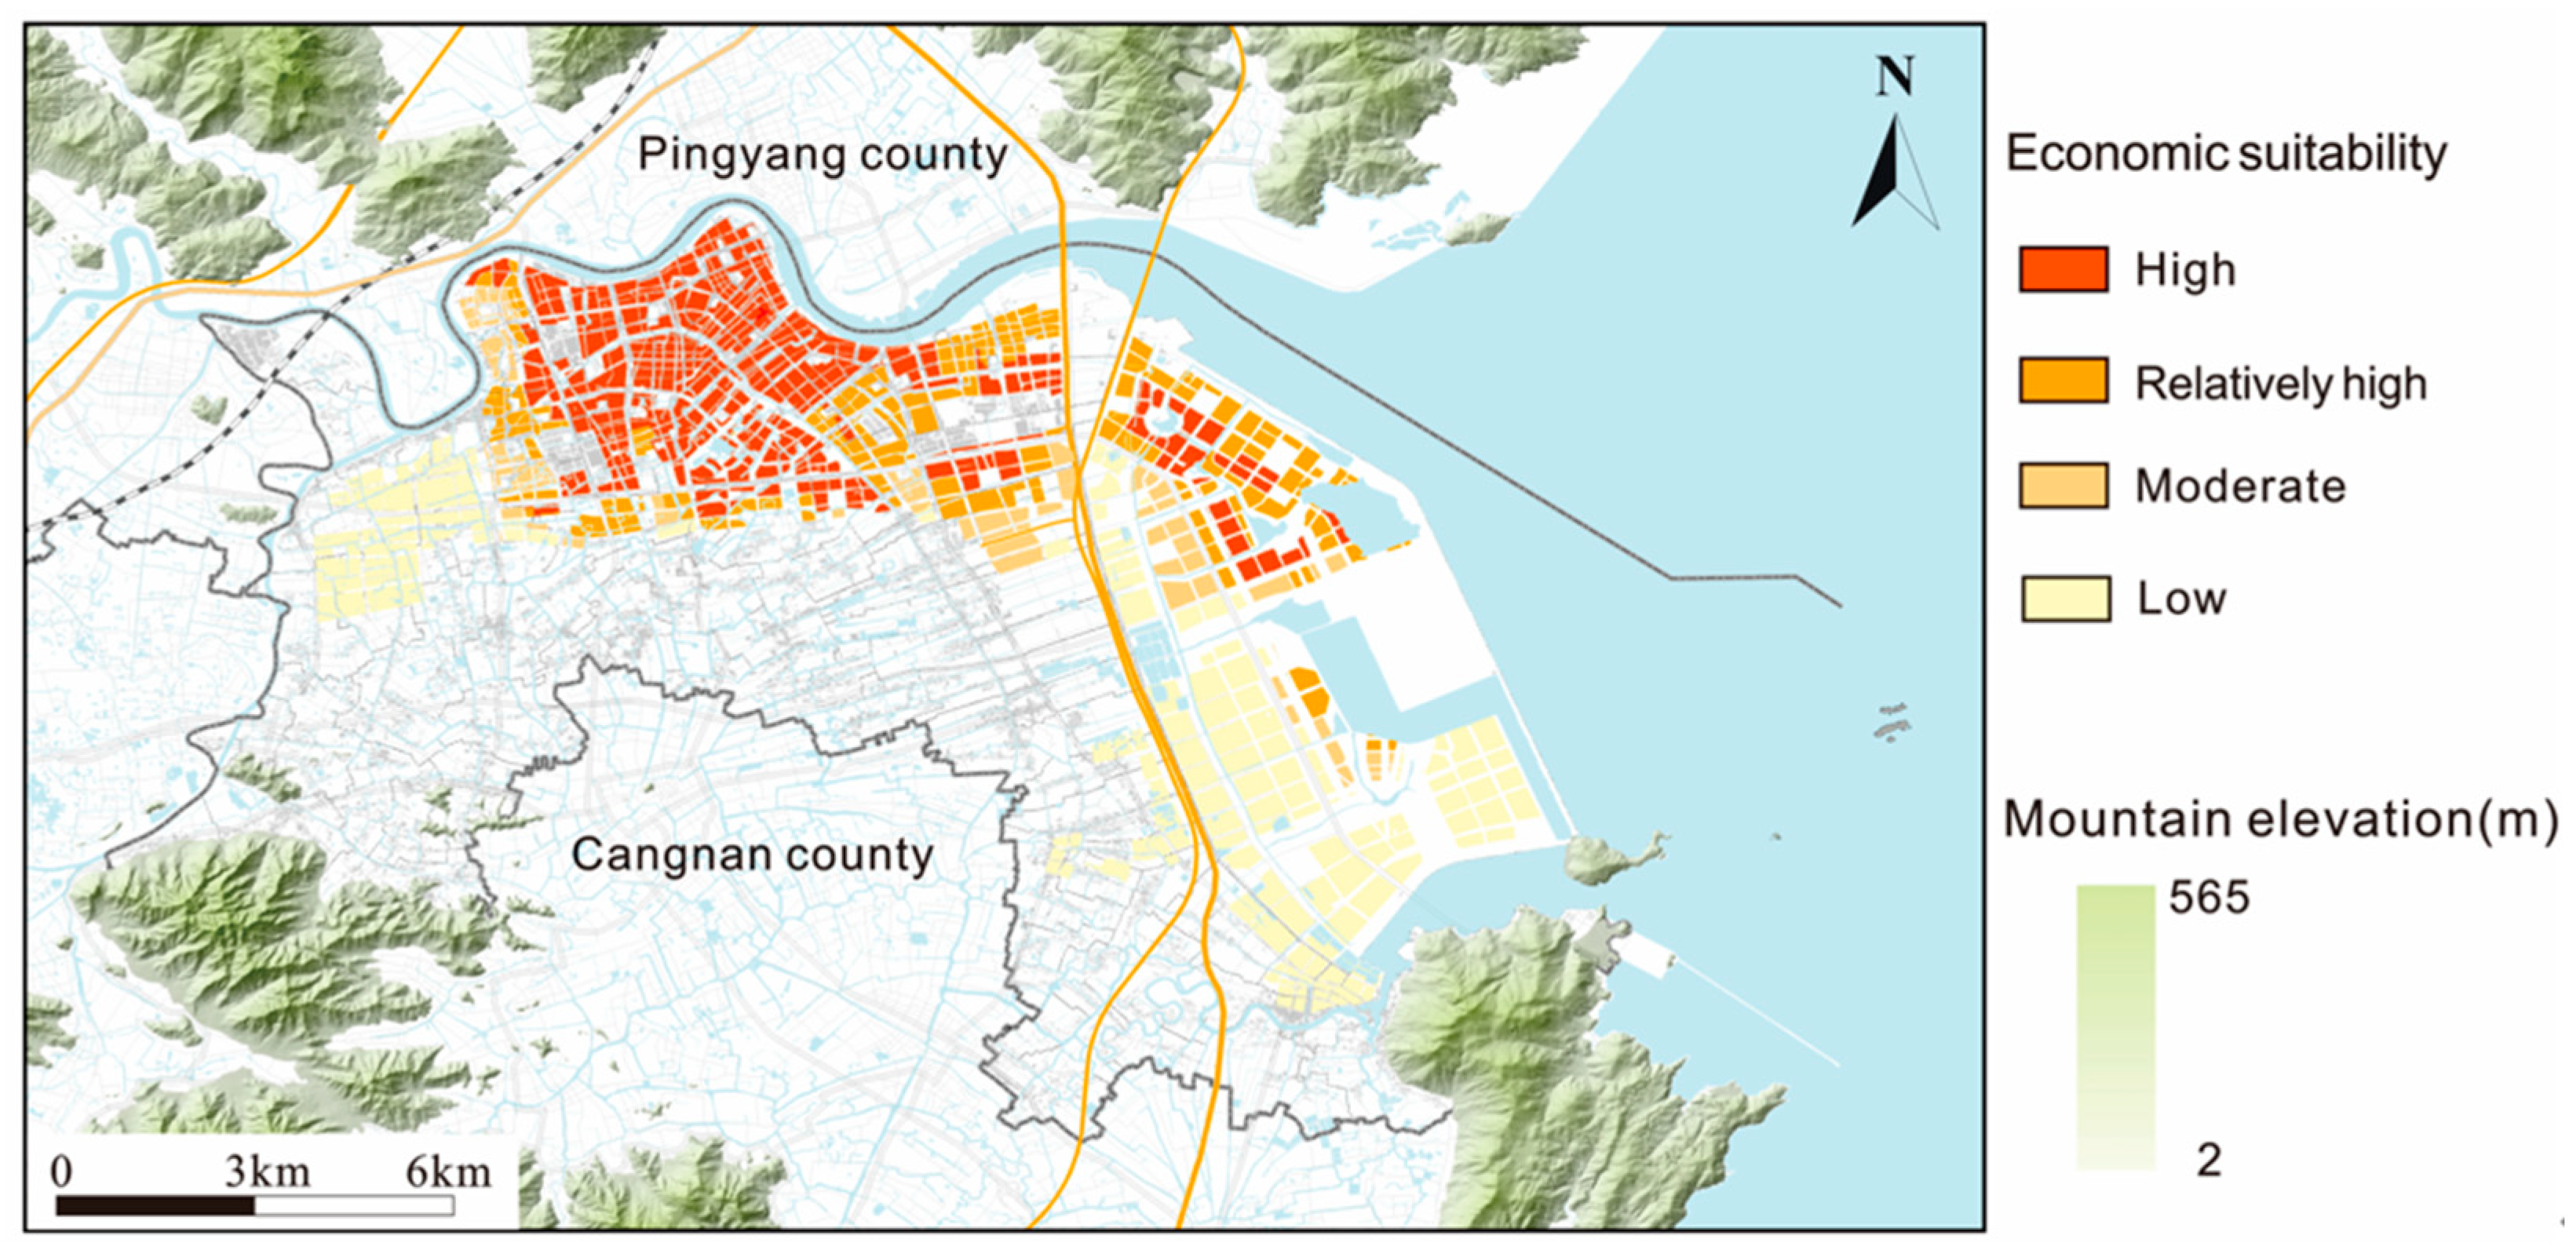
4.2. Socio-Economic Value Evaluation
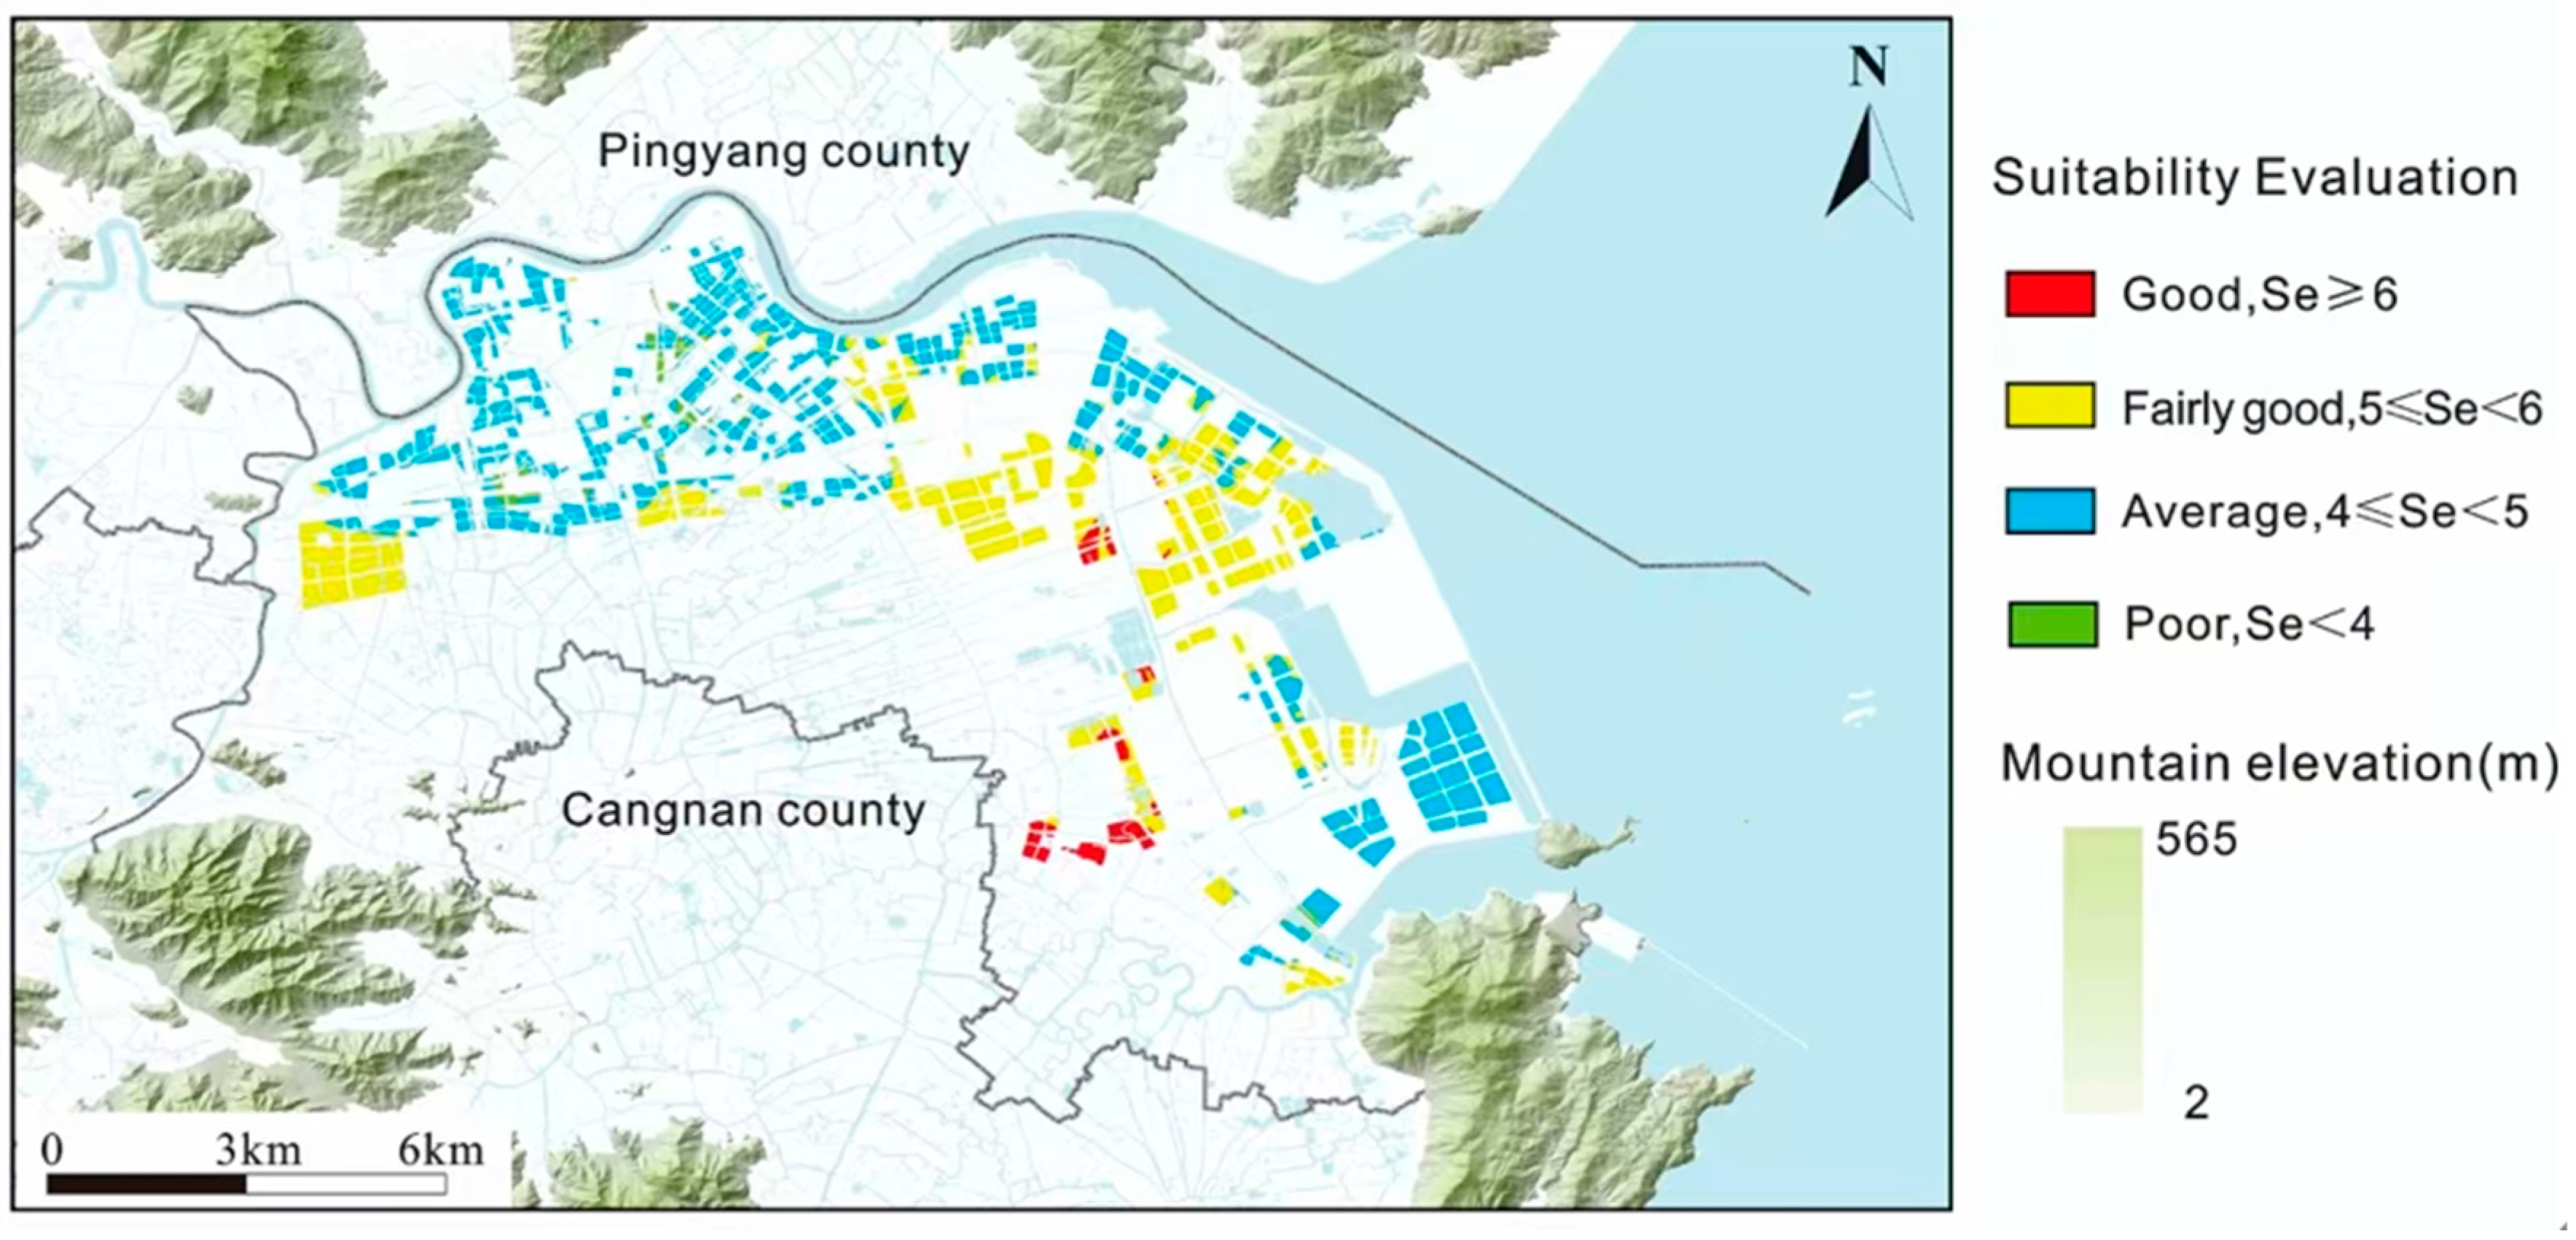
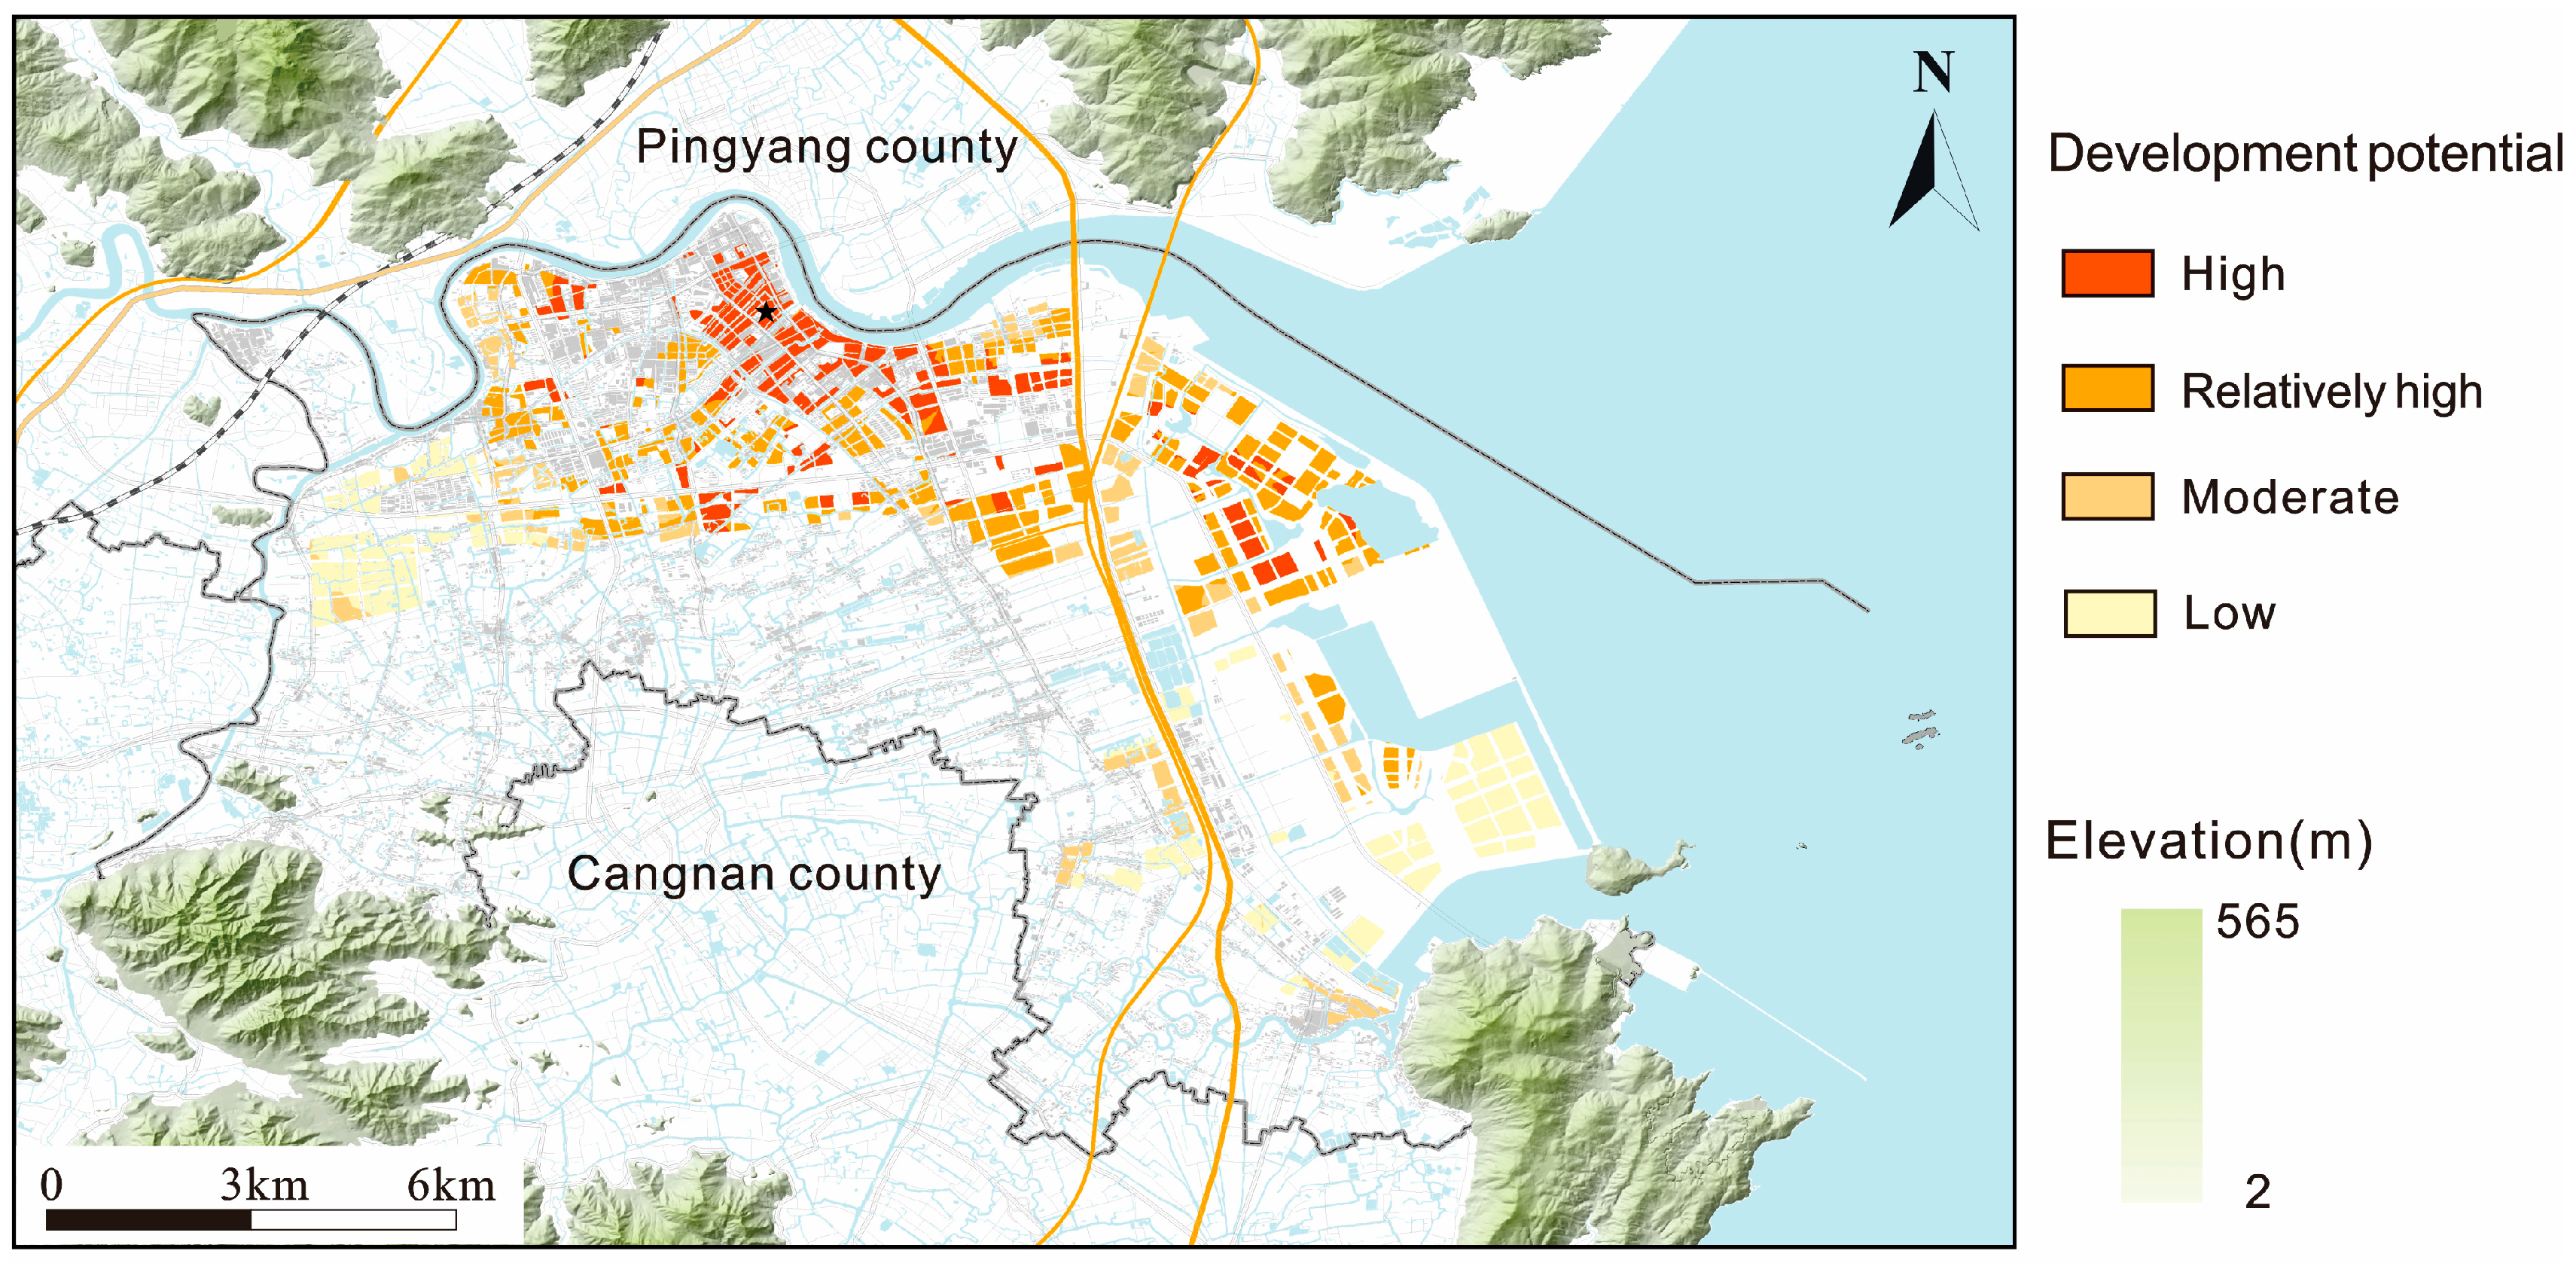
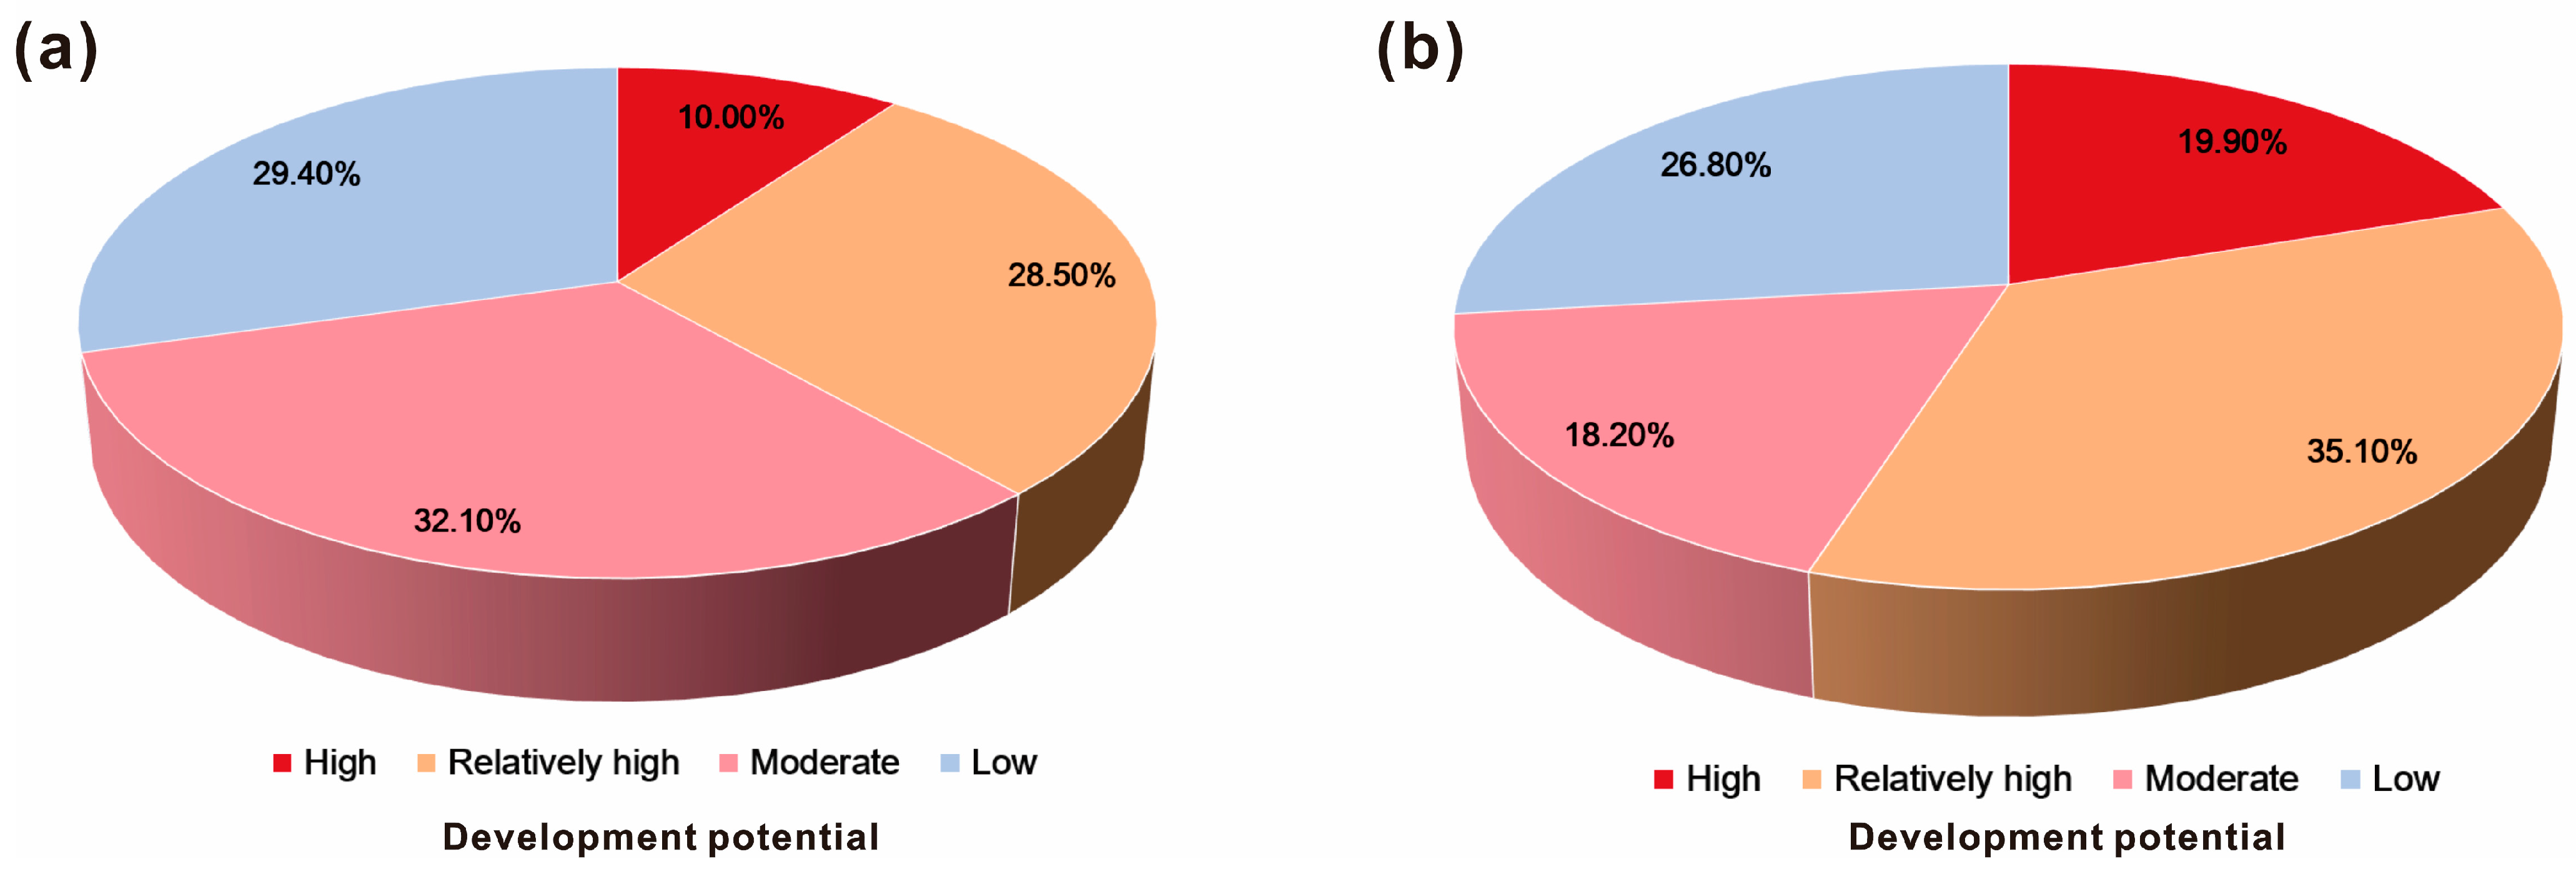
4.3. Evaluation of the Development and Utilization Potential of Underground Space
5. Discussion
6. Conclusions
Author Contributions
Funding
Institutional Review Board Statement
Informed Consent Statement
Data Availability Statement
Conflicts of Interest
References
- Chen, Z.L.; Chen, J.Y.; Liu, H.; Zhang, Z.F. Present status and development trends of underground space in Chinese cities: Evaluation and analysis. Tunn. Undergr. Space Technol. 2018, 71, 253–270. [Google Scholar] [CrossRef]
- Shao, J.; Liu, G.; Yuan, H.; Song, Q.; Yang, M.; Luo, D.; Zhang, X.; Tan, Y.; Zhang, Y. Evaluation and scale forecast of underground space resources of historical and cultural cities in China. ISPRS Int. J. Geo-Inf. 2022, 11, 31. [Google Scholar] [CrossRef]
- Broere, W. Urban underground space: Solving the problems of today’s cities. Tunn. Undergr. Space Technol. 2016, 55, 245–248. [Google Scholar] [CrossRef]
- Zhao, J.W.; Peng, F.L.; Wang, T.Q.; Zhang, X.Y.; Jiang, B.N. Advances in master planning of urban underground space (UUS) in China. Tunn. Undergr. Space Technol. 2016, 55, 290–307. [Google Scholar] [CrossRef]
- Hou, W.; Yang, L.; Deng, D.; Ye, J.; Clarke, K.; Yang, Z.; Zhuang, W.; Liu, J.; Huang, J. Assessing quality of urban underground spaces by coupling 3D geological models: The case study of Foshan city, South China. Comput. Geosci. 2016, 89, 1–11. [Google Scholar] [CrossRef]
- Li, W.; Huang, Y. Model Tests on the Effect of Dip Angles on Flow Behavior of Liquefied Sand. J. Earth Sci. 2023, 34, 381–385. [Google Scholar] [CrossRef]
- Zhu, H.; Huang, X.; Li, X.; Zhang, L.; Liu, X. Evaluation of urban underground space resources using digitalization technologies. Undergr. Space 2016, 1, 124–136. [Google Scholar] [CrossRef]
- Zhang, P.; Jin, T.; Wang, M.; Zhou, N.; Jia, X. Evaluation of the Suitability of Urban Underground Space Development Based on Multi-Criteria Decision-Making and Geographic Information Systems. Appl. Sci. 2025, 15, 543. [Google Scholar] [CrossRef]
- Guo, Z.; Tian, B.; Zhu, Y.; He, J.; Zhang, T. How do the landslide and non-landslide sampling strategies impact landslide susceptibility assessment?—A case study at catchment scale from China. J. Rock Mech. Geotech. Eng. 2024, 16, 877–894. [Google Scholar] [CrossRef]
- Guo, Z.; Ferrer, J.V.; Hürlimann, M.; Medina, V.; Puig-Polo, C.; Yin, K.; Huang, D. Shallow landslide susceptibility assessment under future climate and land cover changes: A case study from southwest China. Geosci. Front. 2023, 14, 101542. [Google Scholar] [CrossRef]
- Admiraal, H.; Cornaro, A. Why underground space should be included in urban planning policy–And how this will enhance an urban underground future. Tunn. Undergr. Space Technol. 2016, 55, 214–220. [Google Scholar] [CrossRef]
- Mao, W.; Li, W.; Rasouli, R.; Ahmad, N.; Zheng, H.; Huang, Y. Numerical Simulation of Liquefaction-Induced Settlement of Existing Structures. J. Earth Sci. 2023, 34, 339–346. [Google Scholar] [CrossRef]
- Tan, F.; Wang, J.; Jiao, Y.Y.; Ma, B.; He, L. Suitability evaluation of underground space based on finite interval cloud model and genetic algorithm combination weighting. Tunn. Undergr. Space Technol. 2021, 108, 103743. [Google Scholar] [CrossRef]
- Guo, Z.; Chen, L.; Yin, K.; Shrestha, D.P.; Zhang, L. Quantitative risk assessment of slow-moving landslides from the viewpoint of decision-making: A case study of the Three Gorges Reservoir in China. Eng. Geol. 2020, 273, 105667. [Google Scholar] [CrossRef]
- An, R.; Wang, S.; Gao, Z.; Wang, Z.; Li, W.; Deng, Q.; Lin, L.; Liu, Y. Groundwater Quality and Vulnerability Assessment in a Semiarid Karst Region of Northern China. J. Earth Sci. 2024, 35, 313–316. [Google Scholar] [CrossRef]
- Tong, D.; Tan, F.; Ma, B.; Jiao, Y.Y.; Wang, J. A suitability evaluation method of urban underground space based on rough set theory and conditional entropy: A case study in wuhan changjiang new town. Appl. Sci. 2022, 12, 1347. [Google Scholar] [CrossRef]
- Vähäaho, I. Underground space planning in Helsinki. J. Rock Mech. Geotech. Eng. 2014, 6, 387–398. [Google Scholar] [CrossRef]
- Yuan, H.; He, Y.; Wu, Y. A comparative study on urban underground space planning system between China and Japan. Sustain. Cities Soc. 2019, 48, 101541. [Google Scholar] [CrossRef]
- Deng, F.; Cheng, T.; Huang, Y.; Chen, Z.; Han, Q. Evaluation of urban underground space via automated constraint identification and hybrid analysis. Tunn. Undergr. Space Technol. 2024, 153, 106005. [Google Scholar] [CrossRef]
- Guan, P.; Shao, C.; Jiao, Y.; Zhang, G.; Zou, J.; Tan, F. 3-D Tunnel Seismic Advance Prediction Method with Wide Illumination and High-Precision. J. Earth Sci. 2024, 35, 970–979. [Google Scholar] [CrossRef]
- Zhang, X.; Wang, C.; Fan, J.; Wang, H.; Li, H. Optimizing the analytic hierarchy process through a suitability evaluation of underground space development in Tonghu District, Huizhou City. Energies 2020, 13, 742. [Google Scholar] [CrossRef]
- Deng, F.; Pu, J.; Huang, Y.; Han, Q. 3D geological suitability evaluation for underground space based on the AHP-cloud model. Undergr. Space 2023, 8, 109–122. [Google Scholar] [CrossRef]
- Zhang, Y.; Zhu, J.; Liao, Z.; Guo, J.; Xie, H.; Peng, Q. An intelligent planning model for the development and utilization of urban underground space with an application to the Luohu District in Shenzhen. Tunn. Undergr. Space Technol. 2021, 112, 103933. [Google Scholar] [CrossRef]
- Peng, J.; Peng, F.L. A GIS-based evaluation method of underground space resources for urban spatial planning: Part 1 methodology. Tunn. Undergr. Space Technol. 2018, 74, 82–95. [Google Scholar] [CrossRef]
- Lyu, H.M.; Shen, S.L.; Zhou, A.; Yang, J. Risk assessment of mega-city infrastructures related to land subsidence using improved trapezoidal FAHP. Sci. Total Environ. 2020, 717, 135310. [Google Scholar] [CrossRef] [PubMed]
- Wu, L.; Jiang, Y.; Che, D. Fuzzy synthesis evaluation and 3D visualization for resource quality of urban underground space. J. China Univ. Min. Technol. 2007, 36, 97. [Google Scholar]
- Peng, J.; Hong, T.; Xie, Z.; Hou, Z.; Zuo, X. Suitability assessment of urban underground space development based on fuzzy comprehensive evaluation. Bull. Surv. Mapp. 2015, 12, 66–69. [Google Scholar] [CrossRef]
- Zhou, D.; Li, X.; Wang, Q.; Wang, R.; Wang, T.; Gu, Q.; Xin, Y. GIS-based urban underground space resources evaluation toward three-dimensional land planning: A case study in Nantong, China. Tunn. Undergr. Space Technol. 2019, 84, 1–10. [Google Scholar] [CrossRef]
- Guo, J.M.; Zhu, W.J. Potential value evaluation of underground space resource based on AHP method. Chin. J. Undergr. Space Eng. 2005, 1, 654–664. [Google Scholar]
- Liu, D.; Wu, L.; Yang, Y. A hybrid weight assignment model for urban underground space resources evaluation integrated with the weight of time dimension. Appl. Sci. 2020, 10, 5152. [Google Scholar] [CrossRef]
- Xu, Z.; Zhou, S.; Zhang, C.; Yang, M.; Jiang, M. A Bayesian network model for suitability evaluation of underground space development in urban areas: The case of Changsha, China. J. Clean. Prod. 2023, 418, 138135. [Google Scholar] [CrossRef]
- Dou, F.; Li, X.; Xing, H.; Yuan, F.; Ge, W. 3D geological suitability evaluation for urban underground space development–A case study of Qianjiang Newtown in Hangzhou, Eastern China. Tunn. Undergr. Space Technol. 2021, 115, 104052. [Google Scholar] [CrossRef]
- Alogayell, H.M.; Kamal, A.; Alkadi, I.I.; Ramadan, M.S.; Ramadan, R.H.; Zeidan, A.M. Spatial modeling of land resources and constraints to guide urban development in Saudi Arabia’s NEOM region using geomatics techniques. Front. Sustain. Cities 2024, 6, 1370881. [Google Scholar] [CrossRef]
- Alogayell, H.M.; Kamal, A.; Alkadi, I.I.; Ramadan, R.H.; Ramadan, M.S. Geospatial modeling of optimal zones for sustainable urbanization in southwestern NEOM, Saudi Arabia using geomatics techniques. Front. Built Environ. 2024, 10, 1379269. [Google Scholar] [CrossRef]
- Karim, A.A.E.; Alogayell, H.M.; Alkadi, I.I.; Youssef, I. Mapping of GIS-Land Use Suitability in the Rural–Urban Continuum between Ar Riyadh and Al Kharj Cities, KSA Based on the Integrating GIS Multi Criteria Decision Analysis and Analytic Hierarchy Process. Environments 2020, 7, 75. [Google Scholar] [CrossRef]
- Zargarian, R.; Hunt, D.V.; Braithwaite, P.; Bobylev, N.; Rogers, C.D. A new sustainability framework for urban underground space. Proc. Inst. Civ. Eng.-Eng. Sustain. 2016, 171, 238–253. [Google Scholar] [CrossRef]
- Qiao, Y.K.; Peng, F.L.; Wang, Y. Monetary valuation of urban underground space: A critical issue for the decision-making of urban underground space development. Land Use Policy 2017, 69, 12–24. [Google Scholar] [CrossRef]
- He, L.; Song, Y.; Dai, S.; Durbak, K. Quantitative research on the capacity of urban underground space–The case of Shanghai, China. Tunn. Undergr. Space Technol. 2012, 32, 168–179. [Google Scholar] [CrossRef]
- Yan, Y.; Sun, M.; Li, Y. Evaluating the suitability of underground space development based on social and economic factors. Urban, Plan. Transp. Res. 2023, 11, 2233608. [Google Scholar] [CrossRef]
- Bobylev, N. Mainstreaming sustainable development into a city’s Master plan: A case of Urban Underground Space use. Land Use Policy 2009, 26, 1128–1137. [Google Scholar] [CrossRef]
- Wang, X.; Zhen, F.; Huang, X.; Zhang, M.; Liu, Z. Factors influencing the development potential of urban underground space: Structural equation model approach. Tunn. Undergr. Space Technol. 2013, 38, 235–243. [Google Scholar] [CrossRef]
- Zadeh, L.A. Fuzzy sets. Inf. Control 1965, 8, 338–353. [Google Scholar] [CrossRef]
- Zhang, P.; Feng, G. Application of fuzzy comprehensive evaluation to evaluate the effect of water flooding development. J. Pet. Explor. Prod. Technol. 2018, 8, 1455–1463. [Google Scholar] [CrossRef]
- Du, Y.W.; Wang, S.S.; Wang, Y.M. Group fuzzy comprehensive evaluation method under ignorance. Expert Syst. Appl. 2019, 126, 92–111. [Google Scholar] [CrossRef]
- Chan, F.T.; Kumar, N. Global supplier development considering risk factors using fuzzy extended AHP-based approach. Omega 2007, 35, 417–431. [Google Scholar] [CrossRef]
- Feng, S.; Xu, L.D. Decision support for fuzzy comprehensive evaluation of urban development. Fuzzy Sets Syst. 1999, 105, 1–12. [Google Scholar] [CrossRef]
- Zhang, X.; Lyu, L.; Bai, Y.; Bai, G. Research on the fuzzy comprehensive evaluation method of urban underground space. Chin. J. Undergr. Space Eng. 2012, 8, 8–13. [Google Scholar]
- Cui, L. Applying fuzzy comprehensive evaluation method to evaluate quality in crisis and emergency management. Commun. Stat.-Theory Methods 2012, 41, 3942–3959. [Google Scholar] [CrossRef]
- Wang, X.; Shen, L.; Shi, S. Evaluation of underground space perception: A user-perspective investigation. Tunn. Undergr. Space Technol. 2023, 131, 104822. [Google Scholar] [CrossRef]
- Vaidya, O.S.; Kumar, S. Analytic hierarchy process: An overview of applications. Eur. J. Oper. Res. 2006, 169, 1–29. [Google Scholar] [CrossRef]
- Zhou, X.; Hu, Y.; Deng, Y.; Chan, F.T.; Ishizaka, A. A DEMATEL-based completion method for incomplete pairwise comparison matrix in AHP. Ann. Oper. Res. 2018, 271, 1045–1066. [Google Scholar] [CrossRef]
- Hyun, K.C.; Min, S.; Choi, H.; Park, J.; Lee, I.M. Risk analysis using fault-tree analysis (FTA) and analytic hierarchy process (AHP) applicable to shield TBM tunnels. Tunn. Undergr. Space Technol. 2015, 49, 121–129. [Google Scholar] [CrossRef]
- Ishizaka, A.; Labib, A. Review of the main developments in the analytic hierarchy process. Expert Syst. Appl. 2011, 38, 14336–14345. [Google Scholar] [CrossRef]
- Gomez-Ruiz, J.A.; Karanik, M.; Peláez, J.I. Estimation of missing judgments in AHP pairwise matrices using a neural network-based model. Appl. Math. Comput. 2010, 216, 2959–2975. [Google Scholar] [CrossRef]
- Hürlimann, M.; Guo, Z.; Puig-Polo, C.; Medina, V. Impacts of future climate and land cover changes on landslide susceptibility: Regional scale modelling in the Val d’ Aran region (Pyrenees, Spain). Landslides 2022, 19, 99–118. [Google Scholar] [CrossRef]
- Zhang, Y.; Buyuklieva, B. Spatial Cluster Pattern and Influencing Factors of the Housing Market: An Empirical Study from the Chinese City of Shanghai. Buildings 2025, 15, 708. [Google Scholar] [CrossRef]
- Torres, J.R.V.; McArthur, D.P. Public transport accessibility indicators to urban and regional services in Great Britain. Sci. Data 2024, 11, 53. [Google Scholar] [CrossRef]
- Xia, H.; Lin, C.; Liu, X.; Liu, Z. Urban underground space capacity demand forecasting based on sustainable concept: A review. Energy Build. 2022, 255, 111656. [Google Scholar] [CrossRef]
- Guo, Z.; Wang, H.; He, J.; Huang, D.; Song, Y.; Wang, T.; Liu, Y.; Ferrer, J.V. PSLSA v2.0: An automatic Python package integrating machine 1 learning models for regional landslide susceptibility assessment. Environ. Model. Softw. 2025, 186, 106367. [Google Scholar] [CrossRef]
- Li, Y.; Luo, Z.; Qi, S. Characteristics and Genesis of Acid Drainage Contamination from a Rock Tunneling Project Site. J. Earth Sci. 2024, 35, 190–200. [Google Scholar] [CrossRef]
- Kaliampakos, D.; Benardos, A.; Mavrikos, A. A review on the economics of underground space utilization. Tunneling Undergr. Space Technol. 2016, 55, 236–244. [Google Scholar] [CrossRef]
- Dikareva, V.; Voytolovskiy, N. The Efficiency and Financial Feasibility of the Underground Infrastructure Construction Assessment Methods. Procedia Eng. 2016, 165, 1197–1202. [Google Scholar] [CrossRef]
- Peng, Z.; Zhang, Y.; Tan, F.; Lv, J.; Li, L. Variable-weight suitability evaluation of underground space development considering socioeconomic factors. Sustainability 2023, 15, 3574. [Google Scholar] [CrossRef]
- Zhan, D.; Kwan, M.P.; Zhang, W.; Fan, J.; Yu, J.; Dang, Y. Assessment and determinants of satisfaction with urban livability in China. Cities 2018, 79, 92–101. [Google Scholar] [CrossRef]


| Evaluation Factors | Evaluation Indices | Evaluation Index Classification Criteria | |||
|---|---|---|---|---|---|
| I | II | II | IV | ||
| Terrain landform | Ground elevation | >6 m | 4~6 m | 2~4 m | <2 m |
| Engineering geology | Lithology | Bedrock | Cohesive soil | Gravel soil, sand, silt | Special soil |
| Soil compression coefficient | <0.1 Mpa−1 | 0.1~0.5 MPa−1 | 0.5~1 Mpa−1 | >1 MPa−1 | |
| Soil bearing capacity | >120 KPa | 100~120 KPa | 80~100 KPa | <80 KPa | |
| Thickness of fill soil | No distribution | 0~1.5 m | 1.5~3.0 m | >3.0 m | |
| Soft soil thickness | No distribution | 0~30 m | 30~40 m | >40 m | |
| Hydrogeology | Depth of the groundwater table | >0.8 m | 0.6~0.8 m | 0.4~0.6 m | <0.4 m |
| Groundwater abundance | <5.0 m3/d | 5.0~10.0 m3/d | 10.0~15.0 m3/d | >15.0 m3/d | |
| Soil permeability | <0.01 m/d | 0.01~0.5 m/d | 0.5~1.0 m/d | >1.0 m/d | |
| Geological safety risks | Shallow gas | Main distribution | Secondary distribution area | Potential distribution | Probability small area |
| Cumulative land subsidence | <50 mm | 50~100 mm | 100~200 mm | >200 mm | |
| Land settlement rate | <10 mm/a | 10~20 mm/a | 20~30 mm/a | >30 mm/a | |
| Evaluation Factors | Evaluation Indices | Evaluation Index Classification Criteria | |||
|---|---|---|---|---|---|
| I | II | III | IV | ||
| Terrain landform | Ground elevation | >6 m | 4~6 m | 2~4 m | <2 m |
| Engineering geology | Lithology | Bedrock | Cohesive soil | Gravel soil, sand, silt | Special soil |
| Soil compression coefficient | <0.1 MPa−1 | 0.1~0.5 MPa−1 | 0.5~1 MPa−1 | >1 MPa−1 | |
| Soil bearing capacity | >350 KPa | 300~350 KPa | 250~300 KPa | <250 KPa | |
| Thickness of fill soil | No distribution | 0–1.5 m | 1.5–3.0 m | >3.0 m | |
| Soft soil thickness | No distribution | 0~30 m | 30~40 m | >40 m | |
| Thickness of anti-burst soil layer | >40 m | 30~40 m | 20~30 m | <20 m | |
| Hydrogeology | Depth of the groundwater table | >0.8 m | 0.6~0.8 m | 0.4~0.6 m | <0.4 m |
| Groundwater abundance | <5.0 m3/d | 5.0~10.0 m3/d | 10.0~15.0 m3/d | >15.0 m3/d | |
| Soil permeability | <0.01 m/d | 0.01~0.5 m/d | 0.5~1.0 m/d | >1.0 m/d | |
| Geological safety risks | Shallow gas | Main distribution | Secondary distribution area | Potential distribution | Probability small area |
| Cumulative land subsidence | <50 mm | 50~100 mm | 100~200 mm | >200 mm | |
| Land subsidence rate | <10 mm/a | 10~20 mm/a | 20~30 mm/a | >30 mm/a | |
| Evaluation Factors | Evaluation Indices | Evaluation Index Classification Criteria | |||
|---|---|---|---|---|---|
| I | II | III | IV | ||
| Spatial location | Spatial location | Urban core | Business centers and other urban administrative centers | Urban residential, office areas, and other public areas of the city | Protected areas such as urban style, history, and culture, as well as other prohibited and restricted areas |
| Population status | Population density | 0.20 × 10⁴/km2 | 0.15~0.20 × 10⁴/km2 | 0.1~0.15 × 10⁴/km2 | <0.1 × 10⁴/km2 |
| Land resource value | Base land price of commercial land | Class I commercial | Class II commercial | Class III commercial | Class IV and V commercial |
| Base land price of residential land | Class I residential | Class II residential | Class III residential | Class IV and V residential | |
| Base land price for public service land | Class I public service | Class II public service | Class III public service | Class IV and V public service | |
| Base land price for industrial land | Class I industrial | Class II industrial | Class III industrial | Class IV and V industrial | |
| Land development and utilization | Proportion of construction land | >60% | 30%~60% | <30% | |
| Land development intensity | Class IV and V density areas | Class III density areas | Class II density areas | Class I density areas | |
| Scale | Implication |
|---|---|
| 1 | The two factors are equally important. |
| 3 | One factor is slightly more important than the other. |
| 5 | One factor is moderately more important than the other. |
| 7 | One factor is strongly more important than the other. |
| 9 | One factor is exceptionally more important than the other. |
| 2, 4, 6, 8 | Median of the above two adjacent judgments. |
| Reciprocal | The judgment of factor i compared with j is aij; then, the judgment of factor j compared with i is aji = 1/aij |
| n | 1 | 2 | 3 | 4 | 5 | 6 | 7 | 8 | 9 |
|---|---|---|---|---|---|---|---|---|---|
| RI | 0 | 0 | 0.58 | 0.90 | 1.12 | 1.24 | 1.32 | 1.41 | 1.45 |
| Suitability A | Terrain Landform B1 | Engineering Geology B2 | Hydrogeology B3 | Geological Safety Risk B4 |
|---|---|---|---|---|
| Terrain landform B1 | 1 | 1/3 | 2 | 4 |
| Engineering geology B2 | 3 | 1 | 3 | 5 |
| Hydrogeology B3 | 1/2 | 1/3 | 1 | 2 |
| Geological safety risks B4 | 1/4 | 1/5 | 1/2 | 1 |
| Primary Indicators | Weights | Secondary Indicators | Weights | Comprehensive Weight |
|---|---|---|---|---|
| Terrain landforms | 0.0846 | Ground elevation | 1 | 0.0846 |
| Engineering geology | 0.3890 | Lithology | 0.2589 | 0.1007 |
| Soil compression index | 0.1651 | 0.0642 | ||
| Soil bearing capacity | 0.1722 | 0.0670 | ||
| Thickness of fill soil | 0.2883 | 0.1122 | ||
| Soft soil thickness | 0.1155 | 0.0449 | ||
| Hydrogeology | 0.2632 | Depth of groundwater table | 0.3672 | 0.0966 |
| Groundwater abundance | 0.2446 | 0.0644 | ||
| Soil permeability | 0.3882 | 0.1022 | ||
| Geological safety risk | 0.2631 | Shallow gas | 0.4286 | 0.1128 |
| Cumulative ground settlement | 0.2037 | 0.0536 | ||
| Ground settlement rate | 0.3677 | 0.0967 |
| Primary Indicators | Weights | Secondary Indicators | Weights | Comprehensive Weight |
|---|---|---|---|---|
| Terrain landforms | 0.0846 | Ground elevation | 1 | 0.0846 |
| Geotechnical conditions | 0.3929 | Lithology | 0.2214 | 0.0870 |
| Soil compression index | 0.2101 | 0.0825 | ||
| Soil bearing capacity | 0.2472 | 0.0971 | ||
| Thickness of fill soil | 0.1001 | 0.0393 | ||
| Soft soil thickness | 0.1111 | 0.0437 | ||
| Thickness of anti-burst soil layer | 0.1101 | 0.0433 | ||
| Hydrogeology | 0.2631 | Depth of groundwater table | 0.1532 | 0.0403 |
| Groundwater abundance | 0.3895 | 0.1025 | ||
| Soil permeability | 0.4573 | 0.1203 | ||
| Geological safety risk | 0.2630 | Shallow gas | 0.4367 | 0.1149 |
| Cumulative ground settlement | 0.1989 | 0.0523 | ||
| Ground settlement rate | 0.3644 | 0.0958 |
| Primary Indicators | Weights | Secondary Indicators | Weights | Comprehensive Weight |
|---|---|---|---|---|
| Spatial location | 0.1832 | Spatial location | 1 | 0.1832 |
| Population status | 0.1598 | Population density | 1 | 0.1598 |
| Land resource value | 0.3312 | Base land price of commercial land | 0.2771 | 0.0918 |
| Base land price of residential land | 0.2653 | 0.0879 | ||
| Base land price for public service land | 0.2690 | 0.0891 | ||
| Base land price for industrial land | 0.1886 | 0.0625 | ||
| Land development and utilization | 0.3258 | Proportion of construction land | 0.4673 | 0.1522 |
| Land development intensity | 0.5327 | 0.1736 |
| Suitability Classification | Good Suitability | Fairly Good Suitability | Moderate Suitability | Poor Suitability |
| Se ≥ 6.0 | 5.0 ≤ Se < 6.0 | 4.0 ≤ Se < 5.0 | Se < 4.0 |
| Suitability Classification | High Socio-Economic Value | Fairly High Socio-Economic Value | Moderate Socio-Economic Value | Low Socio-Economic Value |
| Ee ≥ 6.0 | 5.0 ≤ Ee < 6.0 | 4.0 ≤ Ee < 5.0 | Ee < 4.0 |
| Suitability Classification | High Resource Potential | Fairly High Resource Potential | Moderate Resource Potential | Low Resource Potential |
| Pe ≥ 30.0 | 23.0 ≤ Pe < 30.0 | 16.0 ≤ Pe < 23.0 | Pe < 16.0 |
Disclaimer/Publisher’s Note: The statements, opinions and data contained in all publications are solely those of the individual author(s) and contributor(s) and not of MDPI and/or the editor(s). MDPI and/or the editor(s) disclaim responsibility for any injury to people or property resulting from any ideas, methods, instructions or products referred to in the content. |
© 2025 by the authors. Licensee MDPI, Basel, Switzerland. This article is an open access article distributed under the terms and conditions of the Creative Commons Attribution (CC BY) license (https://creativecommons.org/licenses/by/4.0/).
Share and Cite
Ye, W.; Huang, J.; Xu, P.; Yuan, J.; Zeng, L.; Zhang, Y.; Wang, Y.; Wang, S.; Xu, X.; Guo, Z.; et al. Suitability Evaluation of Underground Space Development by Considering Socio-Economic Factors—An Empirical Study from Longgang Region of China. Sustainability 2025, 17, 2788. https://doi.org/10.3390/su17072788
Ye W, Huang J, Xu P, Yuan J, Zeng L, Zhang Y, Wang Y, Wang S, Xu X, Guo Z, et al. Suitability Evaluation of Underground Space Development by Considering Socio-Economic Factors—An Empirical Study from Longgang Region of China. Sustainability. 2025; 17(7):2788. https://doi.org/10.3390/su17072788
Chicago/Turabian StyleYe, Wenrong, Ji Huang, Pengfei Xu, Jing Yuan, Li Zeng, Yuzhi Zhang, Yiming Wang, Shaokai Wang, Xiongchao Xu, Zizheng Guo, and et al. 2025. "Suitability Evaluation of Underground Space Development by Considering Socio-Economic Factors—An Empirical Study from Longgang Region of China" Sustainability 17, no. 7: 2788. https://doi.org/10.3390/su17072788
APA StyleYe, W., Huang, J., Xu, P., Yuan, J., Zeng, L., Zhang, Y., Wang, Y., Wang, S., Xu, X., Guo, Z., & Zhang, Y. (2025). Suitability Evaluation of Underground Space Development by Considering Socio-Economic Factors—An Empirical Study from Longgang Region of China. Sustainability, 17(7), 2788. https://doi.org/10.3390/su17072788