The Impact of Exogenous Shocks on the Sustainability of Supply Chain Relationships: Evidence from the COVID-19 Pandemic


Abstract
:1. Introduction
2. Literature Review and Hypothesis Development
2.1. The Impact of Exogenous Shocks on Firms
2.2. Supply Chain Relationships and Firm Economic Outcomes
2.3. Spillover Effects of Exogenous Shocks in Supply Chains
2.4. The Sustainability of Supply Chain Relationships
2.5. Theoretical Analysis and Hypothesis Development
3. Research Design
3.1. Sample Selection and Data Sources
3.2. Definition of Variables
3.2.1. The Sustainability of Supply Chain Relationship (Duration)
3.2.2. Impact of the Shock on the Firm (Affected)
3.2.3. Other Control Variables
3.2.4. Trade Credit
3.3. Empirical Methodology
4. Empirical Results
4.1. Sample Statistics
4.2. Baseline Results: The Impact of Exogenous Shock on the Sustainability of Supply Chain
4.3. Robustness Tests
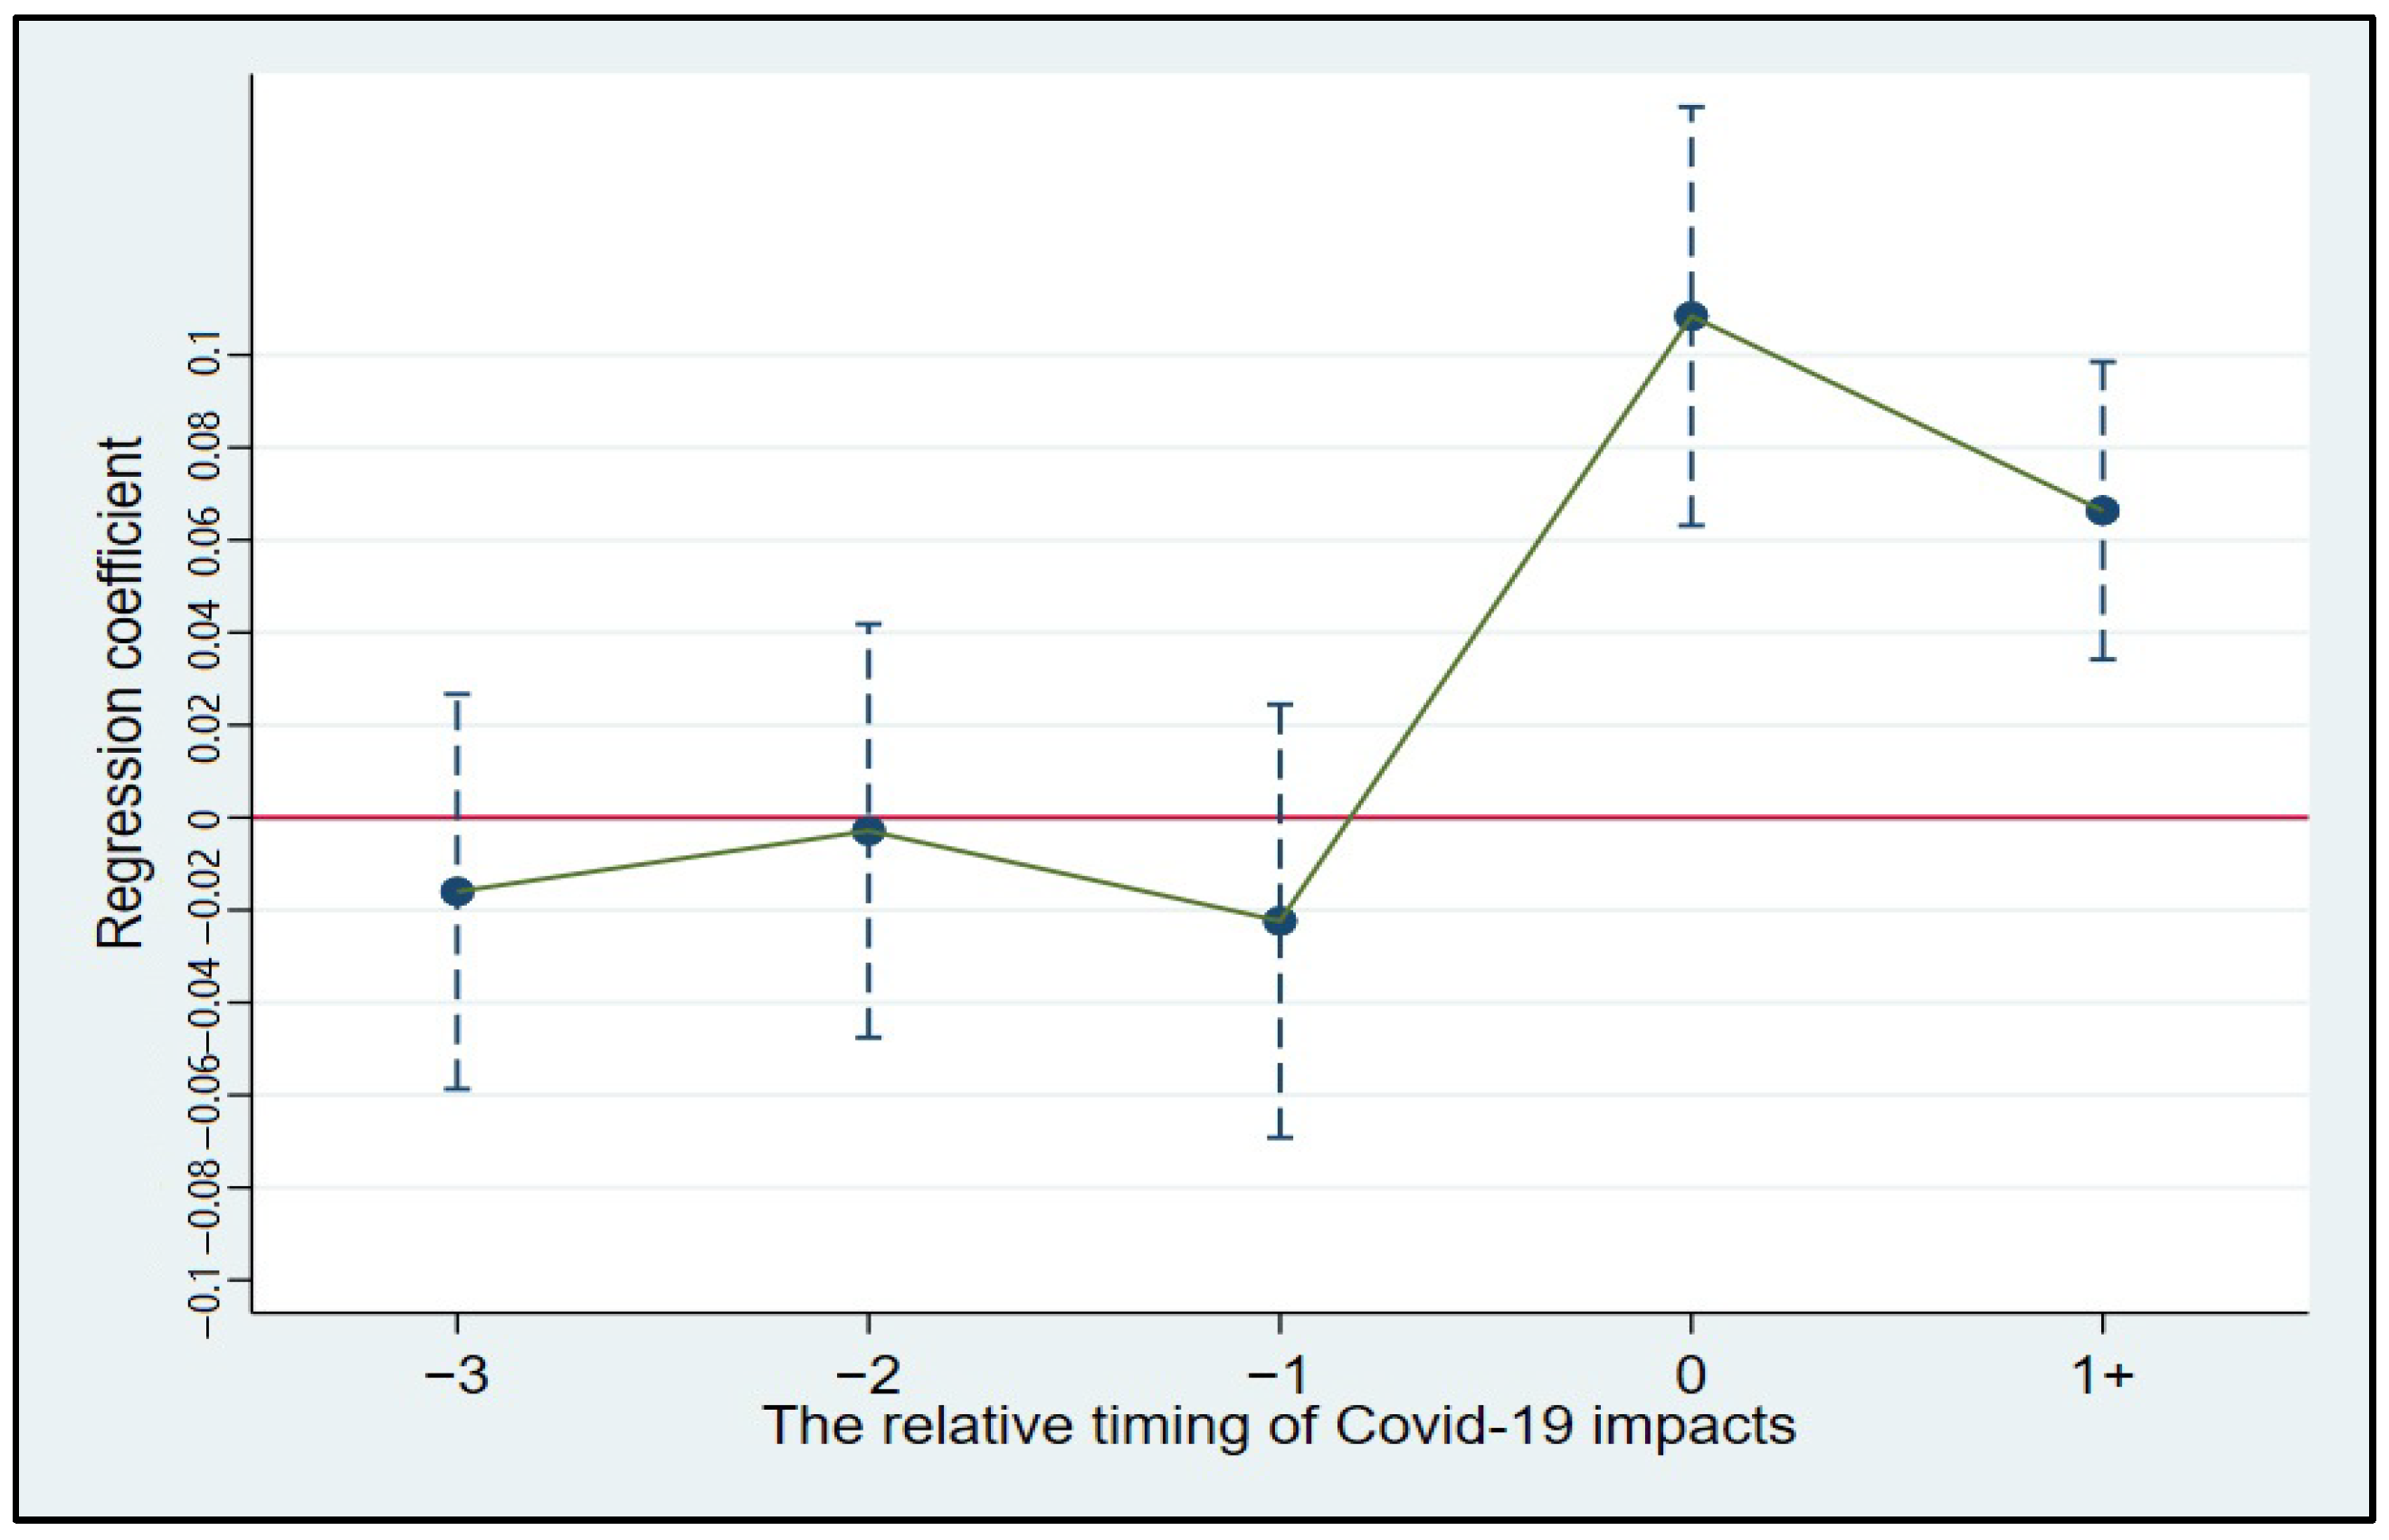
4.3.1. Parallel Trend Test and Dynamic Effect Analysis
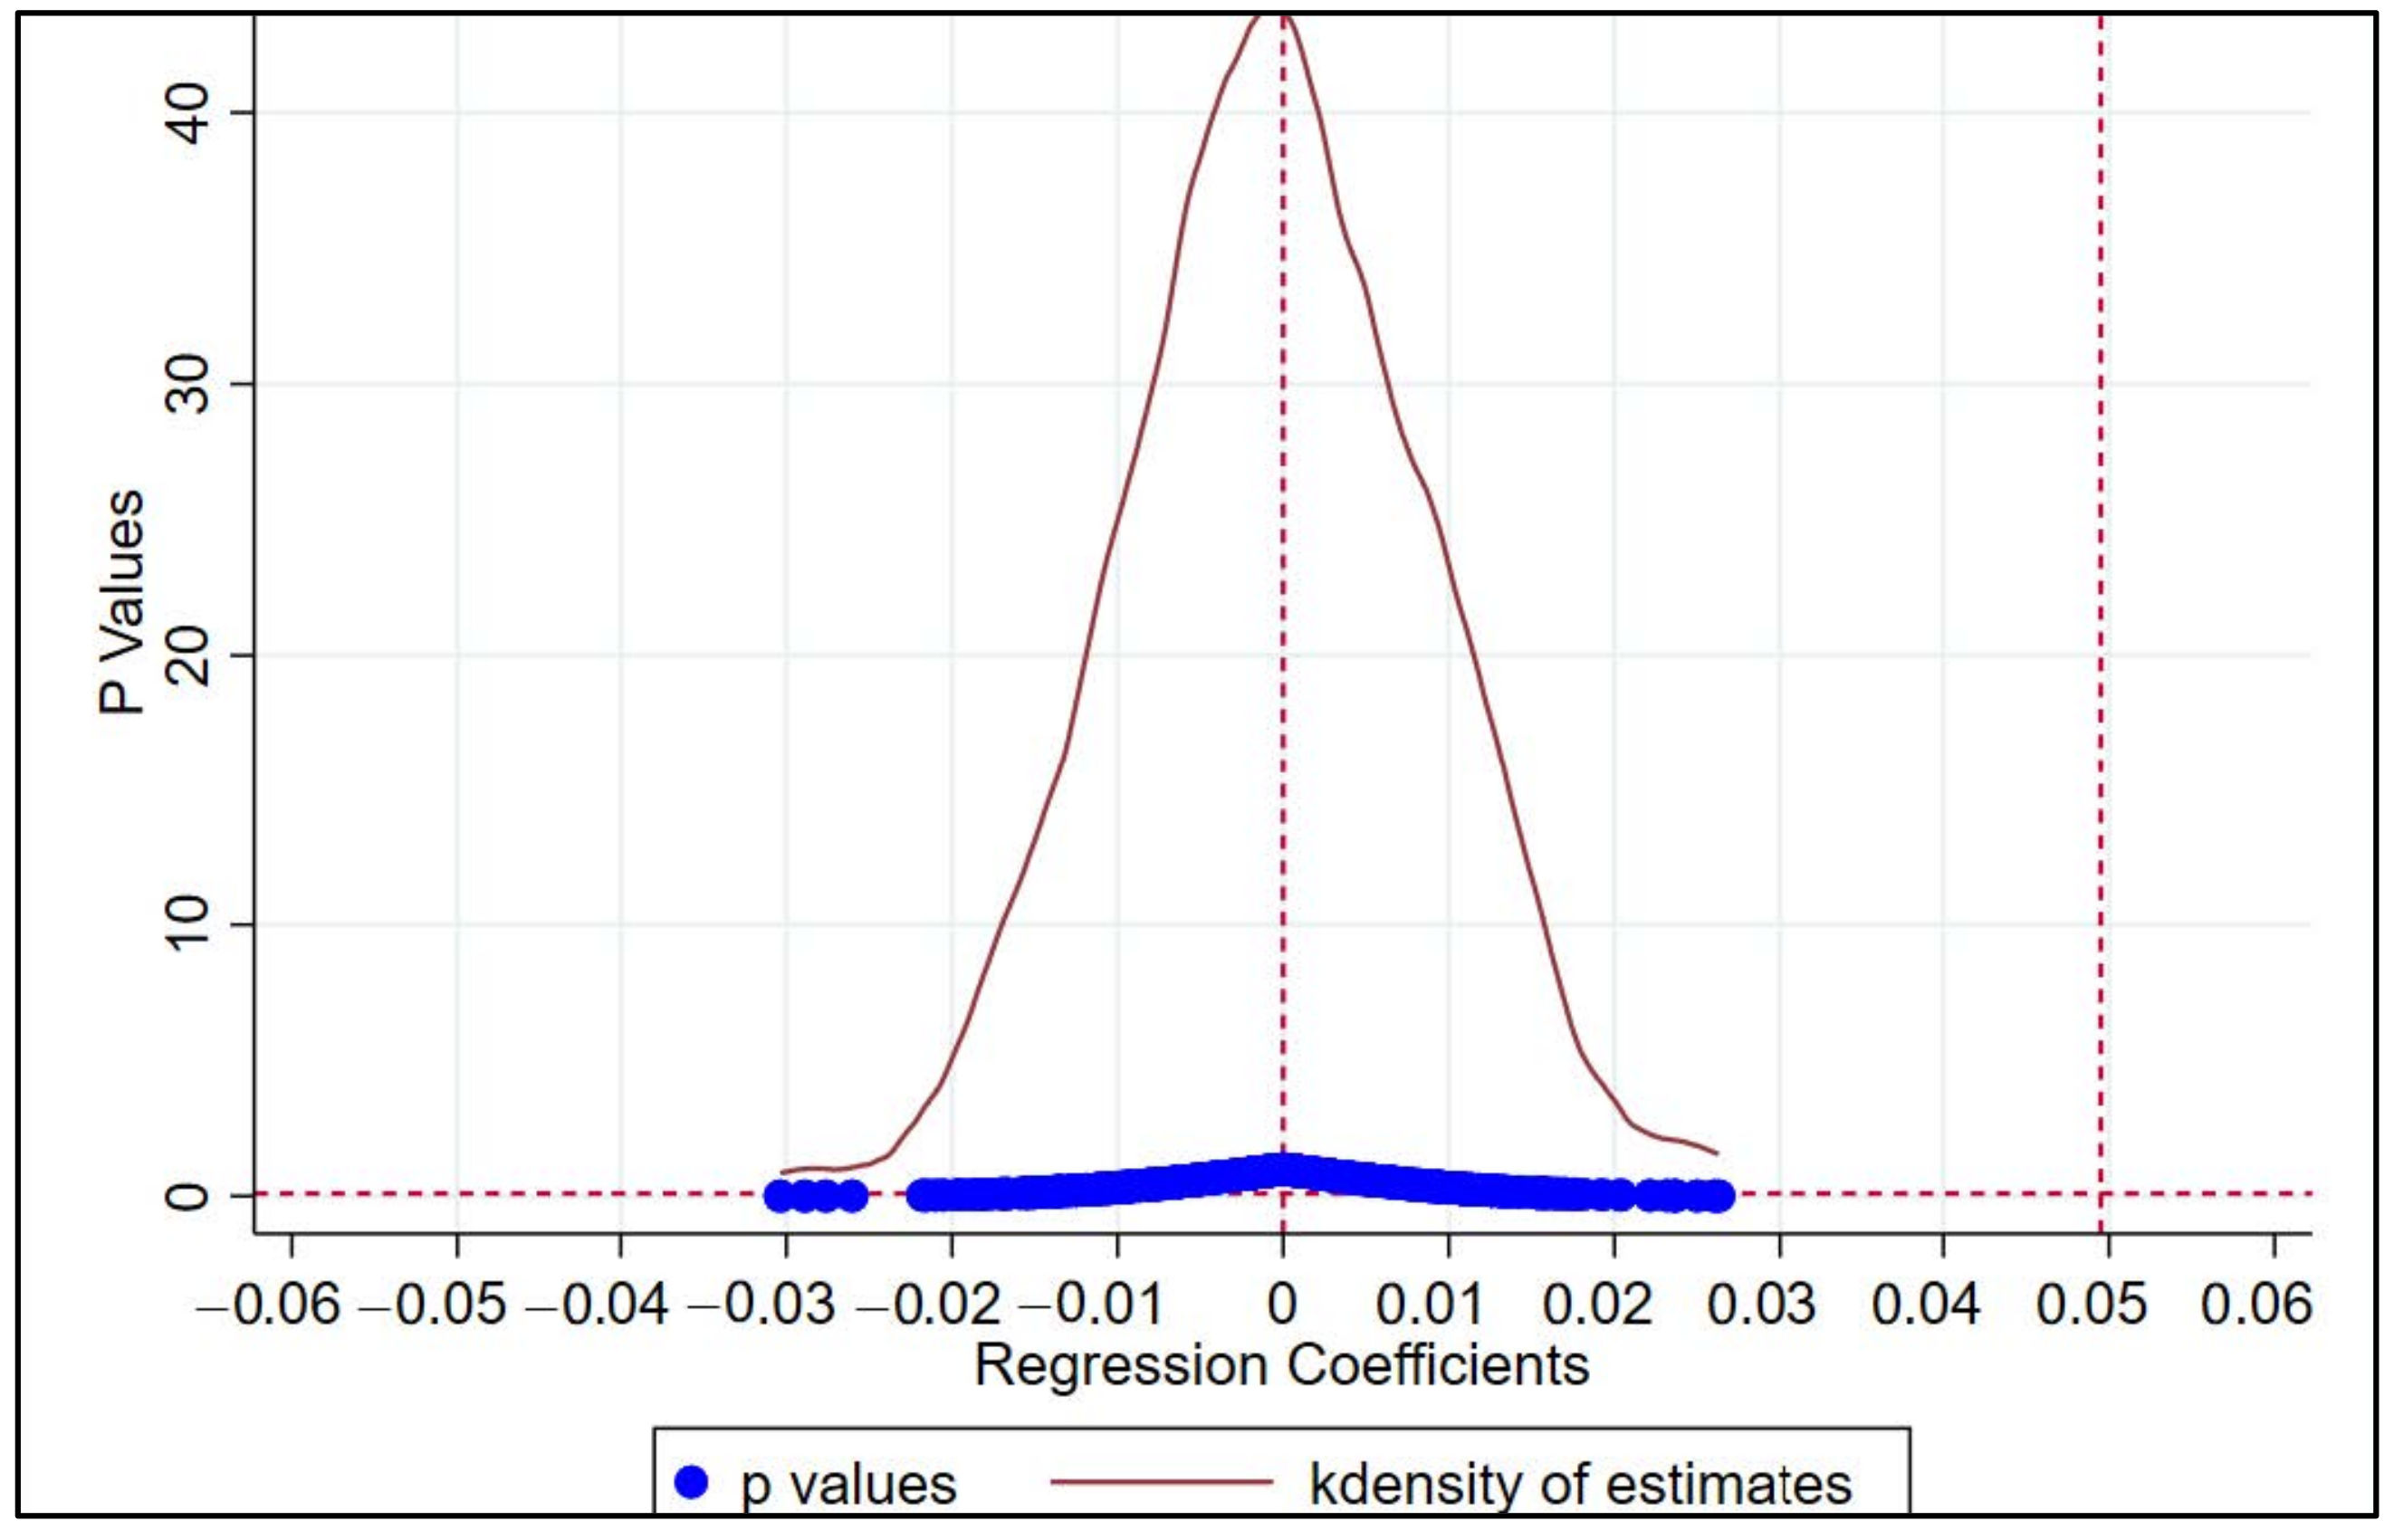
4.3.2. Placebo Tests
4.3.3. Replacement of Explained Variables
4.3.4. Replacement of Explanatory Variables
4.3.5. Heckman Two-Stage Regression
4.4. Channel Analysis
4.5. Heterogeneity Analysis
5. Discussion
6. Conclusions and Policy Suggestions
6.1. Conclusions
6.2. Policy Suggestions
6.2.1. For Companies
- (1)
- With the refinement of market division of labor, the coordination requirements from production to sales at each stage necessitate increasingly close relationships between major suppliers and clients, leading to a scenario where prosperity and adversity are shared. Consequently, enterprises must prioritize supply chain relationship management, not only to meet current production demands but also to effectively mitigate the risks of external shocks transmitted through the supply chain.
- (2)
- Research indicates that trade credit, as an alternative financing channel, can provide short-term liquidity for firms and serve as a tool to maintain supply chain relationships sustainability. Therefore, to prevent the risk of supply chain disruptions, firms should leverage trade credit as a buffer against supply chain risks, thereby ensuring the stability of the supply chain.
- (3)
- Firms should optimize their existing supply chain structures by, for example, reducing the concentration of clients and suppliers, acquiring more heterogeneous resources, avoiding excessive dependency, and fostering a cooperative and mutually beneficial environment to prevent the deep propagation of supply chain risks.
- (4)
- Since small- and medium-sized enterprises (SMEs) or non-state-owned private enterprises often occupy a weaker position in the supply chain, they should actively establish long-term cooperative relationships with upstream and downstream enterprises to secure credit support from upstream partners. At the same time, they should establish mutual assistance mechanisms within the supply chain to jointly cope with external shocks alongside industry peers.
- (5)
- The results of the heterogeneity analysis in this study indicate that only enterprises with low input product heterogeneity can maintain the sustainability of existing supply chain relationships through trade credit when facing exogenous shocks. Therefore, this study also suggests that while enterprises pursue product uniqueness to enhance competitiveness, they should avoid becoming overly innovative. When the heterogeneity of input products is too high, enterprises may struggle to find suitable substitutes during production and operational disruptions, making it difficult to mitigate losses caused by risks.
6.2.2. For Governments
- (1)
- Governments and industry associations should introduce relevant policies to encourage firms to stabilize supply chains through trade credit adjustments. For example, tax incentives could be provided to firms that offer trade credit support, such as tax reductions or exemptions.
- (2)
- Regulatory agencies should actively guide and encourage firms to disclose information about their suppliers and customers while protecting business confidentiality. At the same time, they should continuously monitor the concentration of suppliers and customers to establish a supply chain risk early warning system and response strategies. This aims to prevent the rapid spread of risks caused by excessively high supply chain concentration and avoid potential negative effects.
- (3)
- Governments should also formulate and implement relevant laws and regulations to create a healthy competitive environment for supply chains. Differentiated management strategies should be adopted based on varying market competition conditions to prevent market monopolies. Additionally, governments should encourage enterprises to pursue win–win cooperation, thereby avoiding unfair competition.
Author Contributions
Funding
Institutional Review Board Statement
Informed Consent Statement
Data Availability Statement
Conflicts of Interest
References
- Pfeffer, J.; Salancik, G. External Control of Organizations—Resource Dependence Perspective. In Organizational Behavior 2; Routledge: London, UK, 2015; pp. 355–370. [Google Scholar]
- Christopher, M.; Peck, H. Building the Resilient Supply Chain. Int. J. Logist. Manag. 2004, 15, 1–13. [Google Scholar] [CrossRef]
- Sheffi, Y. The Resilient Enterprise: Overcoming Vulnerability for Competitive Advantage; MIT Press: Cambridge, MA, USA, 2005. [Google Scholar]
- Acemoglu, D.; Carvalho, V.M.; Ozdaglar, A.; Tahbaz-Salehi, A. The Network Origins of Aggregate Fluctuations. Econometrica 2012, 80, 1977–2016. [Google Scholar]
- Barrot, J.-N.; Sauvagnat, J. Input Specificity and the Propagation of Idiosyncratic Shocks in Production Networks. Q. J. Econ. 2016, 131, 1543–1592. [Google Scholar]
- Gao, J. Managing Liquidity in Production Networks: The Role of Central Firms. Rev. Financ. 2021, 25, 819–861. [Google Scholar]
- Pankratz, N.M.; Schiller, C.M. Climate Change and Adaptation in Global Supply-Chain Networks. Rev. Financ. Stud. 2024, 37, 1729–1777. [Google Scholar]
- Noth, F.; Rehbein, O. Badly Hurt? Natural Disasters and Direct Firm Effects. Financ. Res. Lett. 2019, 28, 254–258. [Google Scholar]
- Baldwin, R.; Di Mauro, B.W. Economics in the Time of COVID-19: A New eBook. Vox CEPR Policy Portal 2020, 2, 105–109. [Google Scholar]
- Ivanov, D.; Dolgui, A. Viability of Intertwined Supply Networks: Extending the Supply Chain Resilience Angles towards Survivability. A Position Paper Motivated by COVID-19 Outbreak. Int. J. Prod. Res. 2020, 58, 2904–2915. [Google Scholar]
- Blundell, R.; Costa Dias, M.; Joyce, R.; Xu, X. COVID-19 and Inequalities. Fisc. Stud. 2020, 41, 291–319. [Google Scholar]
- Baker, S.; Bloom, N.; Davis, S.; Terry, S. COVID-Induced Economic Uncertainty and Its Consequences. VoxEU. Org 2020, 13, 1–10. [Google Scholar]
- Ramelli, S.; Wagner, A.F. Feverish Stock Price Reactions to COVID-19. Rev. Corp. Financ. Stud. 2020, 9, 622–655. [Google Scholar] [CrossRef]
- Javadi, S.; Masum, A.-A. The Impact of Climate Change on the Cost of Bank Loans. J. Corp. Financ. 2021, 69, 102019. [Google Scholar] [CrossRef]
- Berg, G.; Schrader, J. Access to Credit, Natural Disasters, and Relationship Lending. J. Financ. Intermediation 2012, 21, 549–568. [Google Scholar] [CrossRef]
- Carletti, E.; Oliviero, T.; Pagano, M.; Pelizzon, L.; Subrahmanyam, M.G. The COVID-19 Shock and Equity Shortfall: Firm-Level Evidence from Italy. Rev. Corp. Financ. Stud. 2020, 9, 534–568. [Google Scholar] [CrossRef]
- Campello, M.; Gao, J. Customer Concentration and Loan Contract Terms. J. Financ. Econ. 2017, 123, 108–136. [Google Scholar] [CrossRef]
- Cen, L.; Maydew, E.L.; Zhang, L.; Zuo, L. Customer–Supplier Relationships and Corporate Tax Avoidance. J. Financ. Econ. 2017, 123, 377–394. [Google Scholar] [CrossRef]
- Croci, E.; Degl’Innocenti, M.; Zhou, S. Large Customer-Supplier Links and Syndicate Loan Structure. J. Corp. Financ. 2021, 66, 101844. [Google Scholar] [CrossRef]
- Christensen, C.M.; Bower, J.L. Customer Power, Strategic Investment, and the Failure of Leading Firms. Strateg. Manag. J. 1996, 17, 197–218. [Google Scholar] [CrossRef]
- Chu, Y.; Tian, X.; Wang, W. Corporate Innovation along the Supply Chain. Manag. Sci. 2019, 65, 2445–2466. [Google Scholar] [CrossRef]
- Hagedoorn, J.; Lokshin, B.; Zobel, A.-K. Partner Type Diversity in Alliance Portfolios: Multiple Dimensions, Boundary Conditions and Firm Innovation Performance. J. Manag. Stud. 2018, 55, 809–836. [Google Scholar] [CrossRef]
- Cao, M.; Zhang, Q. Supply Chain Collaboration: Impact on Collaborative Advantage and Firm Performance. J. Oper. Manag. 2011, 29, 163–180. [Google Scholar]
- Flynn, B.B.; Huo, B.; Zhao, X. The Impact of Supply Chain Integration on Performance: A Contingency and Configuration Approach. J. Oper. Manag. 2010, 28, 58–71. [Google Scholar]
- Ivanov, D. Supply Chain Viability and the COVID-19 Pandemic: A Conceptual and Formal Generalisation of Four Major Adaptation Strategies. Int. J. Prod. Res. 2021, 59, 3535–3552. [Google Scholar]
- Hendricks, K.B.; Singhal, V.R. The Effect of Supply Chain Disruptions on Shareholder Value. Total Qual. Manag. 2008, 19, 777–791. [Google Scholar]
- Craighead, C.W.; Blackhurst, J.; Rungtusanatham, M.J.; Handfield, R.B. The Severity of Supply Chain Disruptions: Design Characteristics and Mitigation Capabilities. Decis. Sci. 2007, 38, 131–156. [Google Scholar] [CrossRef]
- Handfield, R.; McCormack, K.P. Supply Chain Risk Management: Minimizing Disruptions in Global Sourcing; Auerbach Publications: Boca Raton, FL, USA, 2007; ISBN 0-429-24550-5. [Google Scholar]
- Di Giovanni, J.; Levchenko, A.A.; Mejean, I. The Micro Origins of International Business-Cycle Comovement. Am. Econ. Rev. 2018, 108, 82–108. [Google Scholar]
- Lai, S.-M. Internal Control Quality and Relationship-specific Investments by Suppliers and Customers. J. Bus. Financ. Account. 2019, 46, 1097–1122. [Google Scholar]
- Bauer, A.M.; Henderson, D.; Lynch, D.P. Supplier Internal Control Quality and the Duration of Customer-Supplier Relationships. Account. Rev. 2018, 93, 59–82. [Google Scholar]
- Chen, T.; Levy, H.; Martin, X.; Shalev, R. Buying Products from Whom You Know: Personal Connections and Information Asymmetry in Supply Chain Relationships. Rev. Account. Stud. 2021, 26, 1492–1531. [Google Scholar] [CrossRef]
- Raman, K.; Shahrur, H. Relationship-Specific Investments and Earnings Management: Evidence on Corporate Suppliers and Customers. Account. Rev. 2008, 83, 1041–1081. [Google Scholar]
- Cen, L.; Chen, F.; Hou, Y.; Richardson, G.D. Strategic Disclosures of Litigation Loss Contingencies When Customer-Supplier Relationships Are at Risk. Account. Rev. 2018, 93, 137–159. [Google Scholar]
- Morgan, R.M. The Commitment-Trust Theory of Relationship Marketing. J. Mark. 1994, 58, 20–38. [Google Scholar]
- Anderson, J.C.; Narus, J.A. A Model of Distributor Firm and Manufacturer Firm Working Partnerships. J. Mark. 1990, 54, 42–58. [Google Scholar]
- Ivanov, D. Viable Supply Chain Model: Integrating Agility, Resilience and Sustainability Perspectives—Lessons from and Thinking beyond the COVID-19 Pandemic. Ann. Oper. Res. 2022, 319, 1411–1431. [Google Scholar]
- Elliott, M.; Golub, B. Networks and Economic Fragility. Annu. Rev. Econ. 2022, 14, 665–696. [Google Scholar]
- Pfeffer, J.; Salancik, G.R. The External Control of Organizations: A Resource Dependence Perspective. Soc. Sci. Electron. Publ. 2003, 23, 123–133. [Google Scholar]
- Coase, R.H. The Nature of the Firm (1937). Economica 1993, 4, 396–405. [Google Scholar]
- Tang, C.S. Robust Strategies for Mitigating Supply Chain Disruptions. Int. J. Logist. Res. Appl. 2006, 9, 33–45. [Google Scholar]
- Kocornik-Mina, A.; McDermott, T.K.; Michaels, G.; Rauch, F. Flooded Cities. Am. Econ. J. Appl. Econ. 2020, 12, 35–66. [Google Scholar]
- Elliott, M.; Golub, B.; Leduc, M.V. Supply Network Formation and Fragility. Am. Econ. Rev. 2022, 112, 2701–2747. [Google Scholar]
- Teece, D.J.; Pisano, G.; Shuen, A. Dynamic Capabilities and Strategic Management. Strateg. Manag. J. 1997, 18, 509–533. [Google Scholar]
- Gofman, M.; Wu, Y. Trade Credit and Profitability in Production Networks. J. Financ. Econ. 2022, 143, 593–618. [Google Scholar]
- Jin, X.; Zhang, M.; Sun, G.; Cui, L. The Impact of COVID-19 on Firm Innovation: Evidence from Chinese Listed Companies. Financ. Res. Lett. 2022, 45, 102133. [Google Scholar]
- Apergis, N.; Lau, C.K.; Xu, B. The Impact of COVID-19 on Stock Market Liquidity: Fresh Evidence on Listed Chinese Firms. Int. Rev. Financ. Anal. 2023, 90, 102847. [Google Scholar]
- Athira, A.; Ramesh, V.K.; Sinu, M. COVID-19 Pandemic and Firm Performance: An Empirical Investigation Using a Cross-Country Sample. IIMB Manag. Rev. 2024, 36, 269–281. [Google Scholar]
- Chebbi, K.; Ammer, M.A.; Hameed, A. The COVID-19 Pandemic and Stock Liquidity: Evidence from S&P 500. Q. Rev. Econ. Financ. 2021, 81, 134–142. [Google Scholar]
- Costello, A.M. Credit Market Disruptions and Liquidity Spillover Effects in the Supply Chain. J. Political Econ. 2020, 128, 3434–3468. [Google Scholar]
- Garcia-Appendini, E.; Montoriol-Garriga, J. Firms as Liquidity Providers: Evidence from the 2007–2008 Financial Crisis. J. Financ. Econ. 2013, 109, 272–291. [Google Scholar]
- Amberg, N.; Jacobson, T.; Von Schedvin, E.; Townsend, R. Curbing Shocks to Corporate Liquidity: The Role of Trade Credit. J. Political Econ. 2021, 129, 182–242. [Google Scholar]
- Lai, S.; Chen, L.; Wang, Q.S.; Anderson, H. Natural Disasters, Trade Credit, and Firm Performance. Econ. Model. 2022, 116, 106029. [Google Scholar]
- Billett, M.T.; Freeman, K.; Gao, J. Access to Debt and the Provision of Trade Credit. Available SSRN 3966713 2023. [Google Scholar] [CrossRef]
- Liu, F. The Impact of China’s Low-Carbon City Pilot Policy on Carbon Emissions: Based on the Multi-Period DID Model. Environ. Sci. Pollut. Res. 2023, 30, 81745–81759. [Google Scholar]
- Li, P.; Lu, Y.; Wang, J. Does Flattening Government Improve Economic Performance? Evidence from China. J. Dev. Econ. 2016, 123, 18–37. [Google Scholar]
- Cao, G.; Liu, C.; Zhou, L.-A. Suing the Government under Weak Rule of Law: Evidence from Administrative Litigation Reform in China. J. Public Econ. 2023, 222, 104895. [Google Scholar]
- Sun, L.; Abraham, S. Estimating Dynamic Treatment Effects in Event Studies with Heterogeneous Treatment Effects. J. Econ. 2021, 225, 175–199. [Google Scholar]
- Braghieri, L.; Levy, R.; Makarin, A. Social Media and Mental Health. Am. Econ. Rev. 2022, 112, 3660–3693. [Google Scholar]
- Luo, H. COVID-19 and Trade Credit Speed of Adjustment. Financ. Res. Lett. 2022, 47, 102541. [Google Scholar]
- Lin, T.-T.; Chou, J.-H. Trade Credit and Bank Loan: Evidence from Chinese Firms. Int. Rev. Econ. Financ. 2015, 36, 17–29. [Google Scholar]
- Chen, S.; Ma, H.; Wu, Q. Bank Credit and Trade Credit: Evidence from Natural Experiments. J. Bank. Financ. 2019, 108, 105616. [Google Scholar]
- Wu, W.; Firth, M.; Rui, O.M. Trust and the Provision of Trade Credit. J. Bank. Financ. 2014, 39, 146–159. [Google Scholar]
- Li, W.; Xu, X.; Long, Z. Confucian Culture and Trade Credit: Evidence from Chinese Listed Companies. Res. Int. Bus. Financ. 2020, 53, 101232. [Google Scholar] [CrossRef]
- Lambert, D.M.; Cooper, M.C. Issues in Supply Chain Management. Ind. Mark. Manag. 2000, 29, 65–83. [Google Scholar] [CrossRef]
- Summers, B.; Wilson, N. Trade Credit and Customer Relationships. Manag. Decis. Econ. 2003, 24, 439–455. [Google Scholar] [CrossRef]
- Dai, R.; Liang, H.; Ng, L. Socially Responsible Corporate Customers. J. Financ. Econ. 2021, 142, 598–626. [Google Scholar] [CrossRef]
- Ersahin, N.; Giannetti, M.; Huang, R. Trade Credit and the Stability of Supply Chains. J. Financ. Econ. 2024, 155, 103830. [Google Scholar] [CrossRef]


| Variable | Definition |
|---|---|
| Duration | The dummy variable is set to 1 if the customer similarity between two consecutive periods for a firm exceeds 50%; otherwise, it is set to 0 |
| Affected | The dummy variable equals 1 if the firm experiences a shock in the current period; otherwise, it is set to 0 |
| Size | Natural logarithm of total assets in the end of the period |
| Lev | Net profit divided by the average of net assets at the beginning and end of the period |
| ListedAge | The natural logarithm of the firm’s years since listing plus one |
| Roe | Net profit divided by the average of net assets at the beginning and end of the period |
| Growth | The difference in operating revenue between two consecutive periods divided by operating revenue from the same period in the previous year |
| SOE | The dummy variable equals 1 if the firm is state-owned; otherwise, it is set to 0 |
| CashFlow | Net cash flow from operating activities divided by total assets |
| PPE | Net fixed assets divided by total assets |
| TC1 | (Accounts receivable−accounts payable)/total assets |
| TC2 | (Accounts receivable + notes receivable + prepayments−advance receipts−accounts payable−notes payable)/total assets |
| TC3 | (Accounts receivable + notes receivable−accounts payable−notes payable)/total assets. |
| Variable | N | Mean | SD | Min | p50 | Max |
|---|---|---|---|---|---|---|
| Duration | 9500 | 0.408 | 0.492 | 0 | 0 | 1 |
| Affected | 9500 | 0.311 | 0.463 | 0 | 0 | 1 |
| Size | 9500 | 22.030 | 1.704 | 18.580 | 21.950 | 26.550 |
| Lev | 9500 | 0.429 | 0.207 | 0.059 | 0.423 | 0.931 |
| ListedAge | 8200 | 2.290 | 0.970 | 0 | 2.485 | 3.367 |
| Roe | 9000 | 0.046 | 0.092 | −0.434 | 0.037 | 0.322 |
| Growth | 8400 | 0.434 | 0.805 | −0.913 | 0.481 | 3.213 |
| SOE | 8000 | 0.431 | 0.495 | 0 | 0 | 1 |
| CashFlow | 9500 | 0.021 | 0.068 | −0.177 | 0.016 | 0.225 |
| PPE | 9500 | 0.206 | 0.166 | 0.002 | 0.167 | 0.669 |
| (1) | (2) | (3) | (4) | |
|---|---|---|---|---|
| Duration | Duration | Duration | Duration | |
| Affected | 0.0495 ** | 0.0425 ** | 0.0526 ** | 0.0413 * |
| (0.0212) | (0.0214) | (0.0247) | (0.0249) | |
| Size | −0.0658 ** | −0.0877 *** | −0.0905 ** | −0.1069 *** |
| (0.0328) | (0.0334) | (0.0374) | (0.0382) | |
| Lev | −0.1051 | −0.0603 | −0.0288 | −0.0014 |
| (0.0858) | (0.0886) | (0.0981) | (0.1003) | |
| ListedAge | −0.2039 *** | −0.1952 *** | −0.2158 *** | −0.2020 *** |
| (0.0610) | (0.0631) | (0.0674) | (0.0695) | |
| Roe | 0.0075 | 0.0560 | 0.0629 | 0.1190 |
| (0.0768) | (0.0763) | (0.0962) | (0.0963) | |
| Growth | −0.0091 | −0.0089 | −0.0080 | −0.0079 |
| (0.0118) | (0.0118) | (0.0130) | (0.0130) | |
| SOE | −0.0396 | −0.0514 | −0.0769 | −0.0858 * |
| (0.0412) | (0.0415) | (0.0487) | (0.0492) | |
| CashFlow | −0.2059 * | −0.2141 * | −0.2986 ** | −0.3019 ** |
| (0.1202) | (0.1216) | (0.1358) | (0.1384) | |
| PPE | 0.4722 *** | 0.4597 *** | 0.2928 | 0.2710 |
| (0.1562) | (0.1571) | (0.1789) | (0.1788) | |
| N | 6162 | 6162 | 5988 | 5988 |
| firm | YES | YES | YES | YES |
| quarter | YES | YES | NO | NO |
| city | NO | YES | NO | YES |
| industry_quarter | NO | NO | YES | YES |
| Adj R-Square | 0.571 | 0.574 | 0.586 | 0.590 |
| (1) | (2) | (3) | (4) | |
|---|---|---|---|---|
| Duration | Duration | Duration | Duration | |
| Affected2 | 0.0271 | 0.0232 | 0.0354 | 0.0284 |
| (0.0202) | (0.0204) | (0.0228) | (0.0230) | |
| Controls | YES | YES | YES | YES |
| firm | YES | YES | YES | YES |
| quarter | YES | YES | NO | NO |
| city | NO | YES | NO | YES |
| industry_quarter | NO | NO | YES | YES |
| N | 6162 | 6162 | 5988 | 5988 |
| Adj R-Square | 0.571 | 0.574 | 0.586 | 0.590 |
| (1) | (2) | (3) | (4) | |
|---|---|---|---|---|
| Duration_rep | Duration_rep | Duration_rep | Duration_rep | |
| Affected | 0.0283 * | 0.0274 * | 0.0422 ** | 0.0390 ** |
| (0.0146) | (0.0147) | (0.0178) | (0.0181) | |
| Controls | YES | YES | YES | YES |
| firm | YES | YES | YES | YES |
| quarter | YES | YES | NO | NO |
| city | NO | YES | NO | YES |
| industry_quarter | NO | NO | YES | YES |
| N | 6162 | 6162 | 5988 | 5988 |
| Adj R-square | 0.6881 | 0.6903 | 0.7038 | 0.7071 |
| (1) | (2) | (3) | (4) | |
|---|---|---|---|---|
| Duration | Duration | Duration | Duration | |
| Affected | 0.0926 *** | 0.0843 *** | 0.1116 *** | 0.1017 *** |
| (0.0215) | (0.0219) | (0.0249) | (0.0254) | |
| Controls | YES | YES | YES | YES |
| firm | YES | YES | YES | YES |
| year | YES | YES | NO | NO |
| city | NO | YES | NO | YES |
| industry_quarter | NO | NO | YES | YES |
| N | 6162 | 6162 | 5988 | 5988 |
| Adj R-Square | 0.5724 | 0.5752 | 0.5877 | 0.5916 |
| The First Stage | The Second Stage | |
|---|---|---|
| (1) | (2) | |
| Disclosure | Duration | |
| Affected | 0.0834 ** | |
| (0.0381) | ||
| Size | −0.1944 ** | −0.1448 * |
| (0.0794) | (0.0816) | |
| Lev | 0.1306 | −0.3161 ** |
| (0.2660) | (0.1444) | |
| ListedAge | 0.4433 *** | −0.3410 ** |
| (0.1387) | (0.1448) | |
| Roe | 0.2164 | −0.0343 |
| (0.2635) | (0.0977) | |
| Growth | 0.0790 * | −0.0129 |
| (0.0467) | (0.0315) | |
| SOE | −0.1536 | −0.0015 |
| (0.1296) | (0.0642) | |
| CashFlow | −0.4190 | −0.2836 |
| (0.4009) | (0.1917) | |
| PPE | −0.5971 | 0.6456 ** |
| (0.2736) | ||
| IMR | −0.0243 | |
| (0.5049) | ||
| N | 7848 | 3191 |
| firm | YES | YES |
| quarter | YES | YES |
| (1) | (2) | (3) | |
|---|---|---|---|
| Duration | Duration | Duration | |
| Affected | 0.0411 * | −0.0867 | 0.0585 * |
| (0.0233) | (0.0545) | (0.0343) | |
| TC1 | 0.1671 | ||
| (0.1230) | |||
| Affected * TC1 | 0.3029 ** | ||
| (0.1322) | |||
| TC2 | 0.2332 * | ||
| (0.1381) | |||
| Affected * TC2 | 0.5965 ** | ||
| (0.2556) | |||
| TC3 | 0.2456 * | ||
| (0.1370) | |||
| Affected * TC3 | 0.4264 ** | ||
| (0.1677) | |||
| Controls | YES | YES | YES |
| firm | YES | YES | YES |
| quarter | YES | YES | YES |
| N | 5300 | 1603 | 2723 |
| Adj R-Square | 0.5768 | 0.5929 | 0.5871 |
| Market Concentration | Input Heterogeneity | Ownership Type | ||||
|---|---|---|---|---|---|---|
| (1) Higher HHI | (2) Lower HHI | (3) Higher Unique | (4) Lower Unique | (5) SOEs | (6) non-SOEs | |
| Affected | 0.0067 | 0.0637 * | −0.0672 | 0.1448 * | 0.1161 *** | −0.0233 |
| (0.0309) | (0.0327) | (0.0782) | (0.0756) | (0.0322) | (0.0298) | |
| Controls | YES | YES | YES | YES | YES | YES |
| firm | YES | YES | YES | YES | YES | YES |
| quarter | YES | YES | YES | YES | YES | YES |
| city | YES | YES | YES | YES | YES | YES |
| N | 3195 | 2882 | 540 | 563 | 2781 | 3393 |
| Adj R-Square | 0.5854 | 0.5983 | 0.3706 | 0.3883 | 0.5289 | 0.6286 |
Disclaimer/Publisher’s Note: The statements, opinions and data contained in all publications are solely those of the individual author(s) and contributor(s) and not of MDPI and/or the editor(s). MDPI and/or the editor(s) disclaim responsibility for any injury to people or property resulting from any ideas, methods, instructions or products referred to in the content. |
© 2025 by the authors. Licensee MDPI, Basel, Switzerland. This article is an open access article distributed under the terms and conditions of the Creative Commons Attribution (CC BY) license (https://creativecommons.org/licenses/by/4.0/).
Share and Cite
Chen, S.; Ren, G. The Impact of Exogenous Shocks on the Sustainability of Supply Chain Relationships: Evidence from the COVID-19 Pandemic. Sustainability 2025, 17, 2828. https://doi.org/10.3390/su17072828
Chen S, Ren G. The Impact of Exogenous Shocks on the Sustainability of Supply Chain Relationships: Evidence from the COVID-19 Pandemic. Sustainability. 2025; 17(7):2828. https://doi.org/10.3390/su17072828
Chicago/Turabian StyleChen, Shengmei, and Gui Ren. 2025. "The Impact of Exogenous Shocks on the Sustainability of Supply Chain Relationships: Evidence from the COVID-19 Pandemic" Sustainability 17, no. 7: 2828. https://doi.org/10.3390/su17072828
APA StyleChen, S., & Ren, G. (2025). The Impact of Exogenous Shocks on the Sustainability of Supply Chain Relationships: Evidence from the COVID-19 Pandemic. Sustainability, 17(7), 2828. https://doi.org/10.3390/su17072828