Article

The Impact of Electricity Grid Development on Economic Growth and Energy Consumption in Anhui Province: A Seemingly Unrelated Regression-Based Analysis

1
Economic Research Institute, State Grid Anhui Electric Power Co., Ltd., Hefei 230022, China
2
School of Economics, Hefei University of Technology, Hefei 230601, China
*
Author to whom correspondence should be addressed.
Sustainability 2025, 17(7), 3193; https://doi.org/10.3390/su17073193
Submission received: 24 January 2025 / Revised: 30 March 2025 / Accepted: 30 March 2025 / Published: 3 April 2025

Abstract

:
Endogeneity is an important issue that needs to be addressed in research. By integrating infrastructure into the input–output system based on a profit function framework, this paper investigates the impact of electricity infrastructure on economic development and energy consumption. Using city-level data from Anhui Province spanning 2012 to 2022 and applying seemingly unrelated regression techniques for parameter estimation, this study finds that an increase in grid density leads to a reduction in energy consumption. While the short-term effect of increased grid density may cause a decline in output, a positive long-term effect on output is observed. This study concludes that the advantages of robust power infrastructure in lowering energy intensity manifest only over an extended time horizon. Based on our findings, we provide relevant recommendations that can be applied to other regions as well.

1. Introduction

With the advent of the Industrial Revolution and advancements in electrical technology, the immense potential of electricity in industrial production and daily life gradually became apparent, leading to a rapidly growing and increasingly urgent demand for a stable and reliable power supply. To meet this demand, large-scale power plants and transmission networks were constructed worldwide, giving rise to extensive power grids. By the early 20th century, the electricity sector had become a critical area of national development, with many countries establishing state-owned grid corporations to centralize the management of electricity generation, transmission, and distribution [1]. Investments in large-scale infrastructure emerged as powerful catalysts for economic transformation and growth [2]. As electricity demand continued to rise, grid scale and coverage expanded, with various countries continuously introducing technological innovations to enhance transmission efficiency and reliability. This process promoted optimized energy resource allocation, enabling power to transition from balancing local supply and demand to establishing interregional and even transnational grid interconnections. With the gradual expansion of power grids and the introduction of smart grid technologies, the role of electricity networks in supporting industrialization and urbanization became increasingly prominent, establishing them as essential pillars of the modern economic system.
The development of electricity in China began in the early 20th century, but significant rapid growth occurred after the reform and opening-up period. With accelerating economic growth and advancing industrialization, China gradually established a nationwide power network. In recent years, substantial investments have led to significant improvements in electrical infrastructure. Currently, China not only possesses the world’s largest power grid but also actively promotes advanced technologies such as ultra-high voltage transmission, smart grids, and clean energy integration to enhance the efficiency and stability of its power system [3]. As a key province in central China, Anhui has made remarkable progress in power grid construction in recent years. For instance, the smart grid project in Hefei employs advanced monitoring and control technologies, significantly improving the grid’s ability to respond to emergencies and manage energy distribution more effectively. This initiative not only enhances the reliability of power supply but also provides a solid foundation for diverse economic activities. Additionally, Anhui has vigorously developed clean energy, particularly wind and solar power, which offers sustainable energy support for the grid. Multiple wind farms and photovoltaic projects in Wuhu have not only facilitated local economic development but also made significant contributions to optimizing the energy structure of the grid. Furthermore, Anhui places great importance on grid construction, viewing it as a crucial initiative to support economic development, optimize the energy structure, and promote regional coordination. Continuous investment in infrastructure and the development of clean energy have laid a solid foundation for Anhui’s sustainable development, positioning the province as a model for others in balancing economic growth with environmental responsibility.
The interrelationship between power infrastructure, urban economic development, and energy consumption is tightly interconnected, forming the foundation of endogeneity. Specifically, advancements in power infrastructure provide essential energy support for the expansion of urban industries and services, thereby driving economic growth. However, as urban economies expand, energy demand concurrently increases, further intensifying the development of power infrastructure. Urbanization leads to population concentration and shifts in consumption patterns, significantly increasing dependence on electricity. Additionally, the diversification of economic activities imposes higher demands on the stability and flexibility of the power system. Particularly, the rapid development of emerging industries and high-tech sectors necessitates substantial power support to ensure sustained growth and innovation capabilities. We focus on the period from 2012 to 2022, during which Anhui Province experienced rapid economic growth. This paper contributes to the existing literature in the following ways: (1) This study employs the variable profit function approach in conjunction with the duality principle, offering a more rigorous identification strategy compared to traditional methods. The profit function framework incorporates firms’ optimization behavior, effectively integrating electricity infrastructure into the production system. This approach addresses endogeneity issues and provides a more accurate estimation of the causal impact of electricity infrastructure on economic growth. (2) Anhui Province shows significant variations in electricity infrastructure across its cities, offering a unique opportunity to analyze its heterogeneous effects at the city level. As a key province in central China, Anhui has seen substantial infrastructure investments, especially in the West-to-East Power Transmission Project and ultra-high voltage (UHV) networks. This study focuses on Anhui to provide a regional analysis of infrastructure-driven growth, offering valuable policy insights for other economies on similar development paths. (3) This study extends beyond merely confirming the general relationship between electricity infrastructure and economic growth by differentiating between short-term and long-term effects. It demonstrates that while infrastructure expansion may initially lead to an increase in energy intensity, it ultimately enhances energy efficiency in the long run. Furthermore, this study finds that the impact of power infrastructure on reducing energy intensity is predominantly observed in the long term.
The remainder of this paper is structured as follows: Section 2 presents the background and literature review. In Section 3, we provide a brief overview of the methodology and data. Section 4 discusses the results and provides an analysis. Finally, Section 5 concludes with a summary and policy recommendations.

2. Literature Review

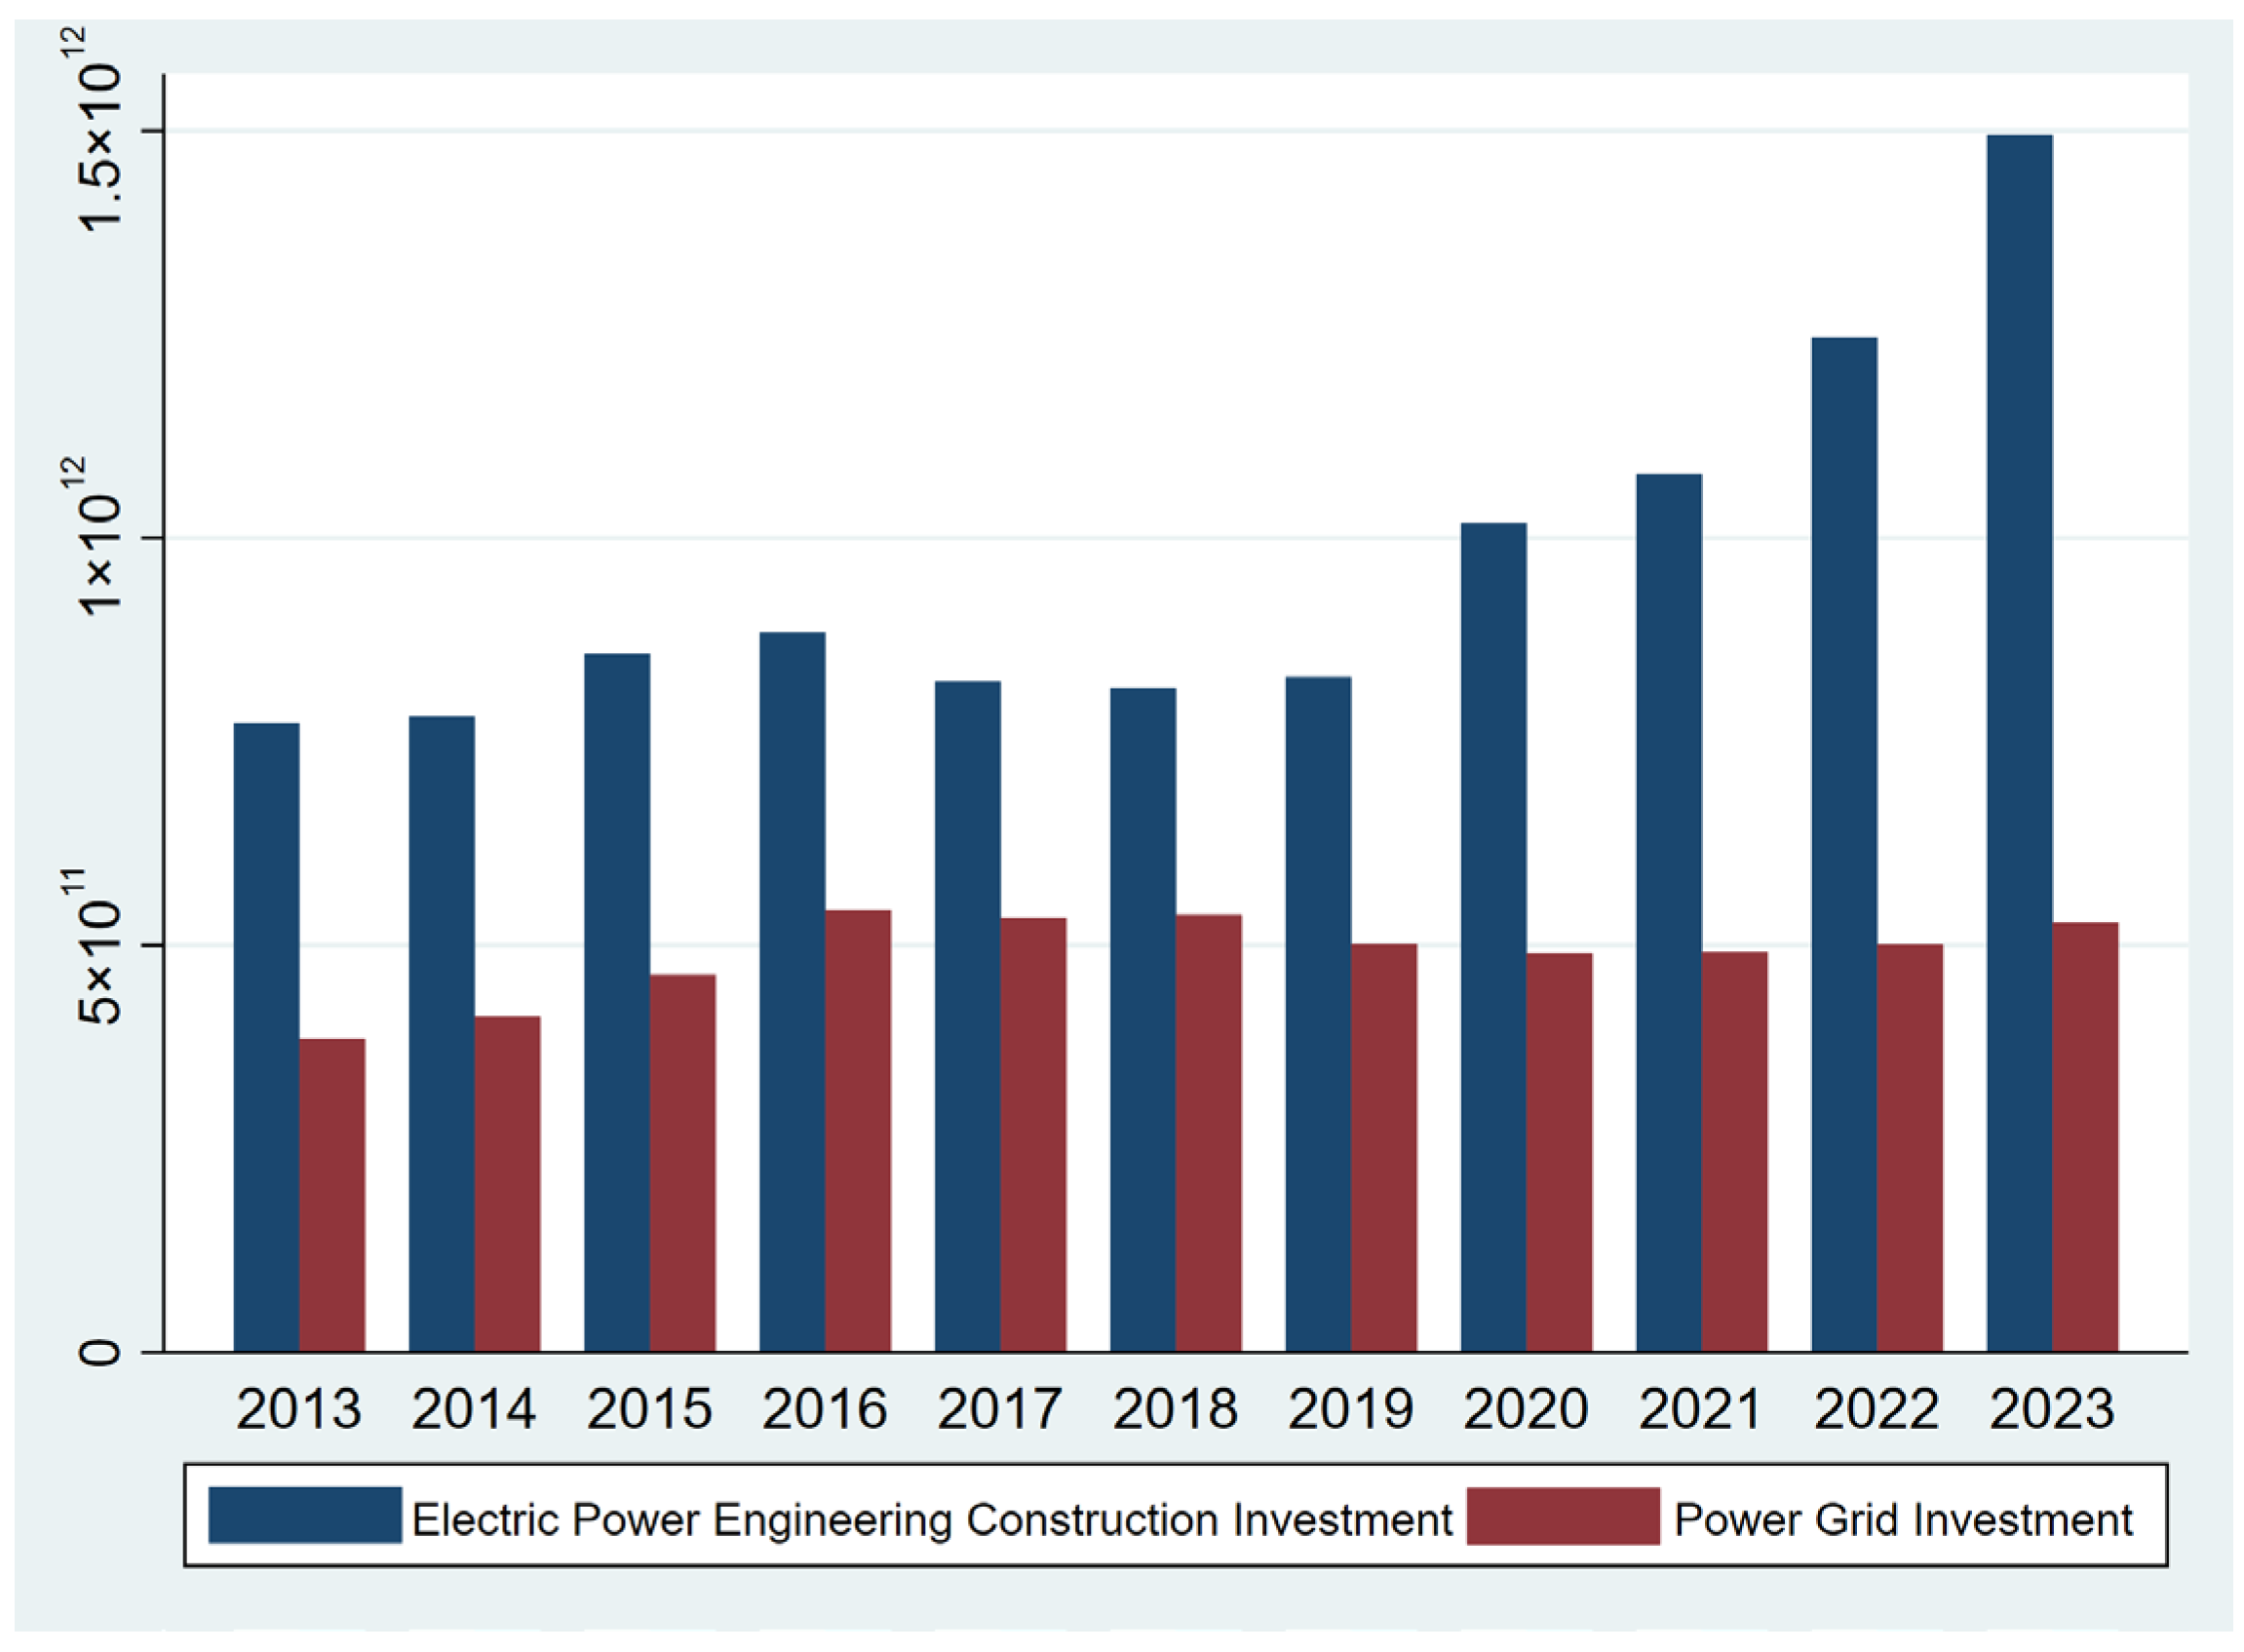
2.1. Development of the Power Grid in China

In its early stages, China’s power system adopted a “local balance” model, wherein power plants were established in electricity-deficient regions to meet local demand. However, this approach overlooked the overall planning of the grid system and the development of cross-regional energy coordination [4,5]. Establishing small power plants in areas facing electricity shortages can promptly meet local energy demands and significantly ease power supply tensions. While this approach temporarily alleviated regional power shortages, the lack of coordinated planning and management of generation facilities ultimately led to bottlenecks in electricity transmission and power shortages during peak demand periods. Furthermore, the imbalance between power supply and demand was particularly evident in the rapidly developing eastern coastal regions, such as Guangdong and Jiangsu, where the rapidly growing economies required substantial electricity supply, but the resource endowments (such as hydropower and coal) were relatively insufficient, necessitating long-term reliance on electricity imports from other regions and resulting in inefficient power resource allocation. These challenges highlighted the necessity of increased investment in grid infrastructure [6,7]. The advancement of grid infrastructure not only effectively mitigated regional supply and demand imbalances—such as through the “West-to-East Power Transmission” project, which transmitted abundant hydropower resources from the southwest to the eastern and southern regions—but also significantly improved the efficiency of energy resource utilization and allocation, thereby enhancing the stability and reliability of electricity supply.
Nowadays, China has developed into the world’s largest electricity producer, marking significant progress in addressing the challenges faced during the early stages of the power system’s development. In 2010, China’s per capita electricity consumption surpassed the global average for the first time, a milestone attributable to rapid economic growth and continuous improvements in grid infrastructure. Since 2015, China has implemented multiple rounds of rural grid upgrades to address issues such as low voltage and insufficient power supply. For instance, in rural areas of Henan and Sichuan, grid upgrades have effectively resolved power supply shortages during peak agricultural seasons, ensuring that farmers can operate machinery and irrigation systems without interruptions. Through ongoing infrastructure development and upgrades, China has established a comprehensive power grid system covering nearly all urban and most rural areas [7]. This grid layout not only enhances transmission capacity and supply stability but also provides a solid foundation for promoting rural economic development and narrowing the urban–rural electricity gap. The increased reliability of electricity access has empowered rural communities, fostering small enterprises and improving overall quality of life. Additionally, cross-regional grid interconnection provides a crucial platform for the efficient utilization of clean energy. These initiatives facilitate the transfer of surplus electricity generated from renewable sources in western regions to high-demand eastern cities, promoting energy equity across the country. Through large-scale grid expansion, renewable energy sources, such as wind and solar power, can be more effectively distributed across the nation, ensuring optimal utilization in major load centers like Beijing and Shanghai. This not only enhances energy security but also aligns with China’s goals for a green, low-carbon economy, driving the nation towards a more sustainable energy future.
In parallel, the Chinese government has made substantial investments in grid construction through state-owned enterprises, particularly the State Grid Corporation, channeling significant funding into this critical sector. This strategy not only reinforces governmental control over grid planning and construction but also effectively supports rural grid upgrades and enhances cross-regional transmission capacity. Such efforts are crucial for ensuring the successful implementation of national energy strategies and fostering a more balanced allocation of regional power resources.
Figure 1 illustrates the trends in electric power engineering construction and grid investment in China from 2012 to 2023, with data sourced from CEIC Electricity Construction Investment Data. Between 2014 and 2019, grid investment remained stable, representing a significant share of total energy infrastructure funding. Over the entire period from 2012 to 2023, grid investment increased from CNY 3.7 trillion to CNY 5.3 trillion, reflecting an average annual growth rate of approximately 3.1%. Notably, 2015 marked a significant turning point, with grid investment rising sharply from CNY 4.1 trillion to CNY 4.6 trillion, ultimately reaching CNY 5.4 trillion in 2016. A sharp increase occurred in 2015, when grid investment rose significantly, marking a shift towards prioritizing grid development. Since 2020, the landscape of electric power engineering construction investment has experienced substantial growth, peaking in 2022 and 2023. This upward trend signifies a renewed emphasis on infrastructure development amid rising energy demands. Despite this surge in construction investment, grid investment has also maintained steady growth, reflecting the government’s sustained commitment to grid development.

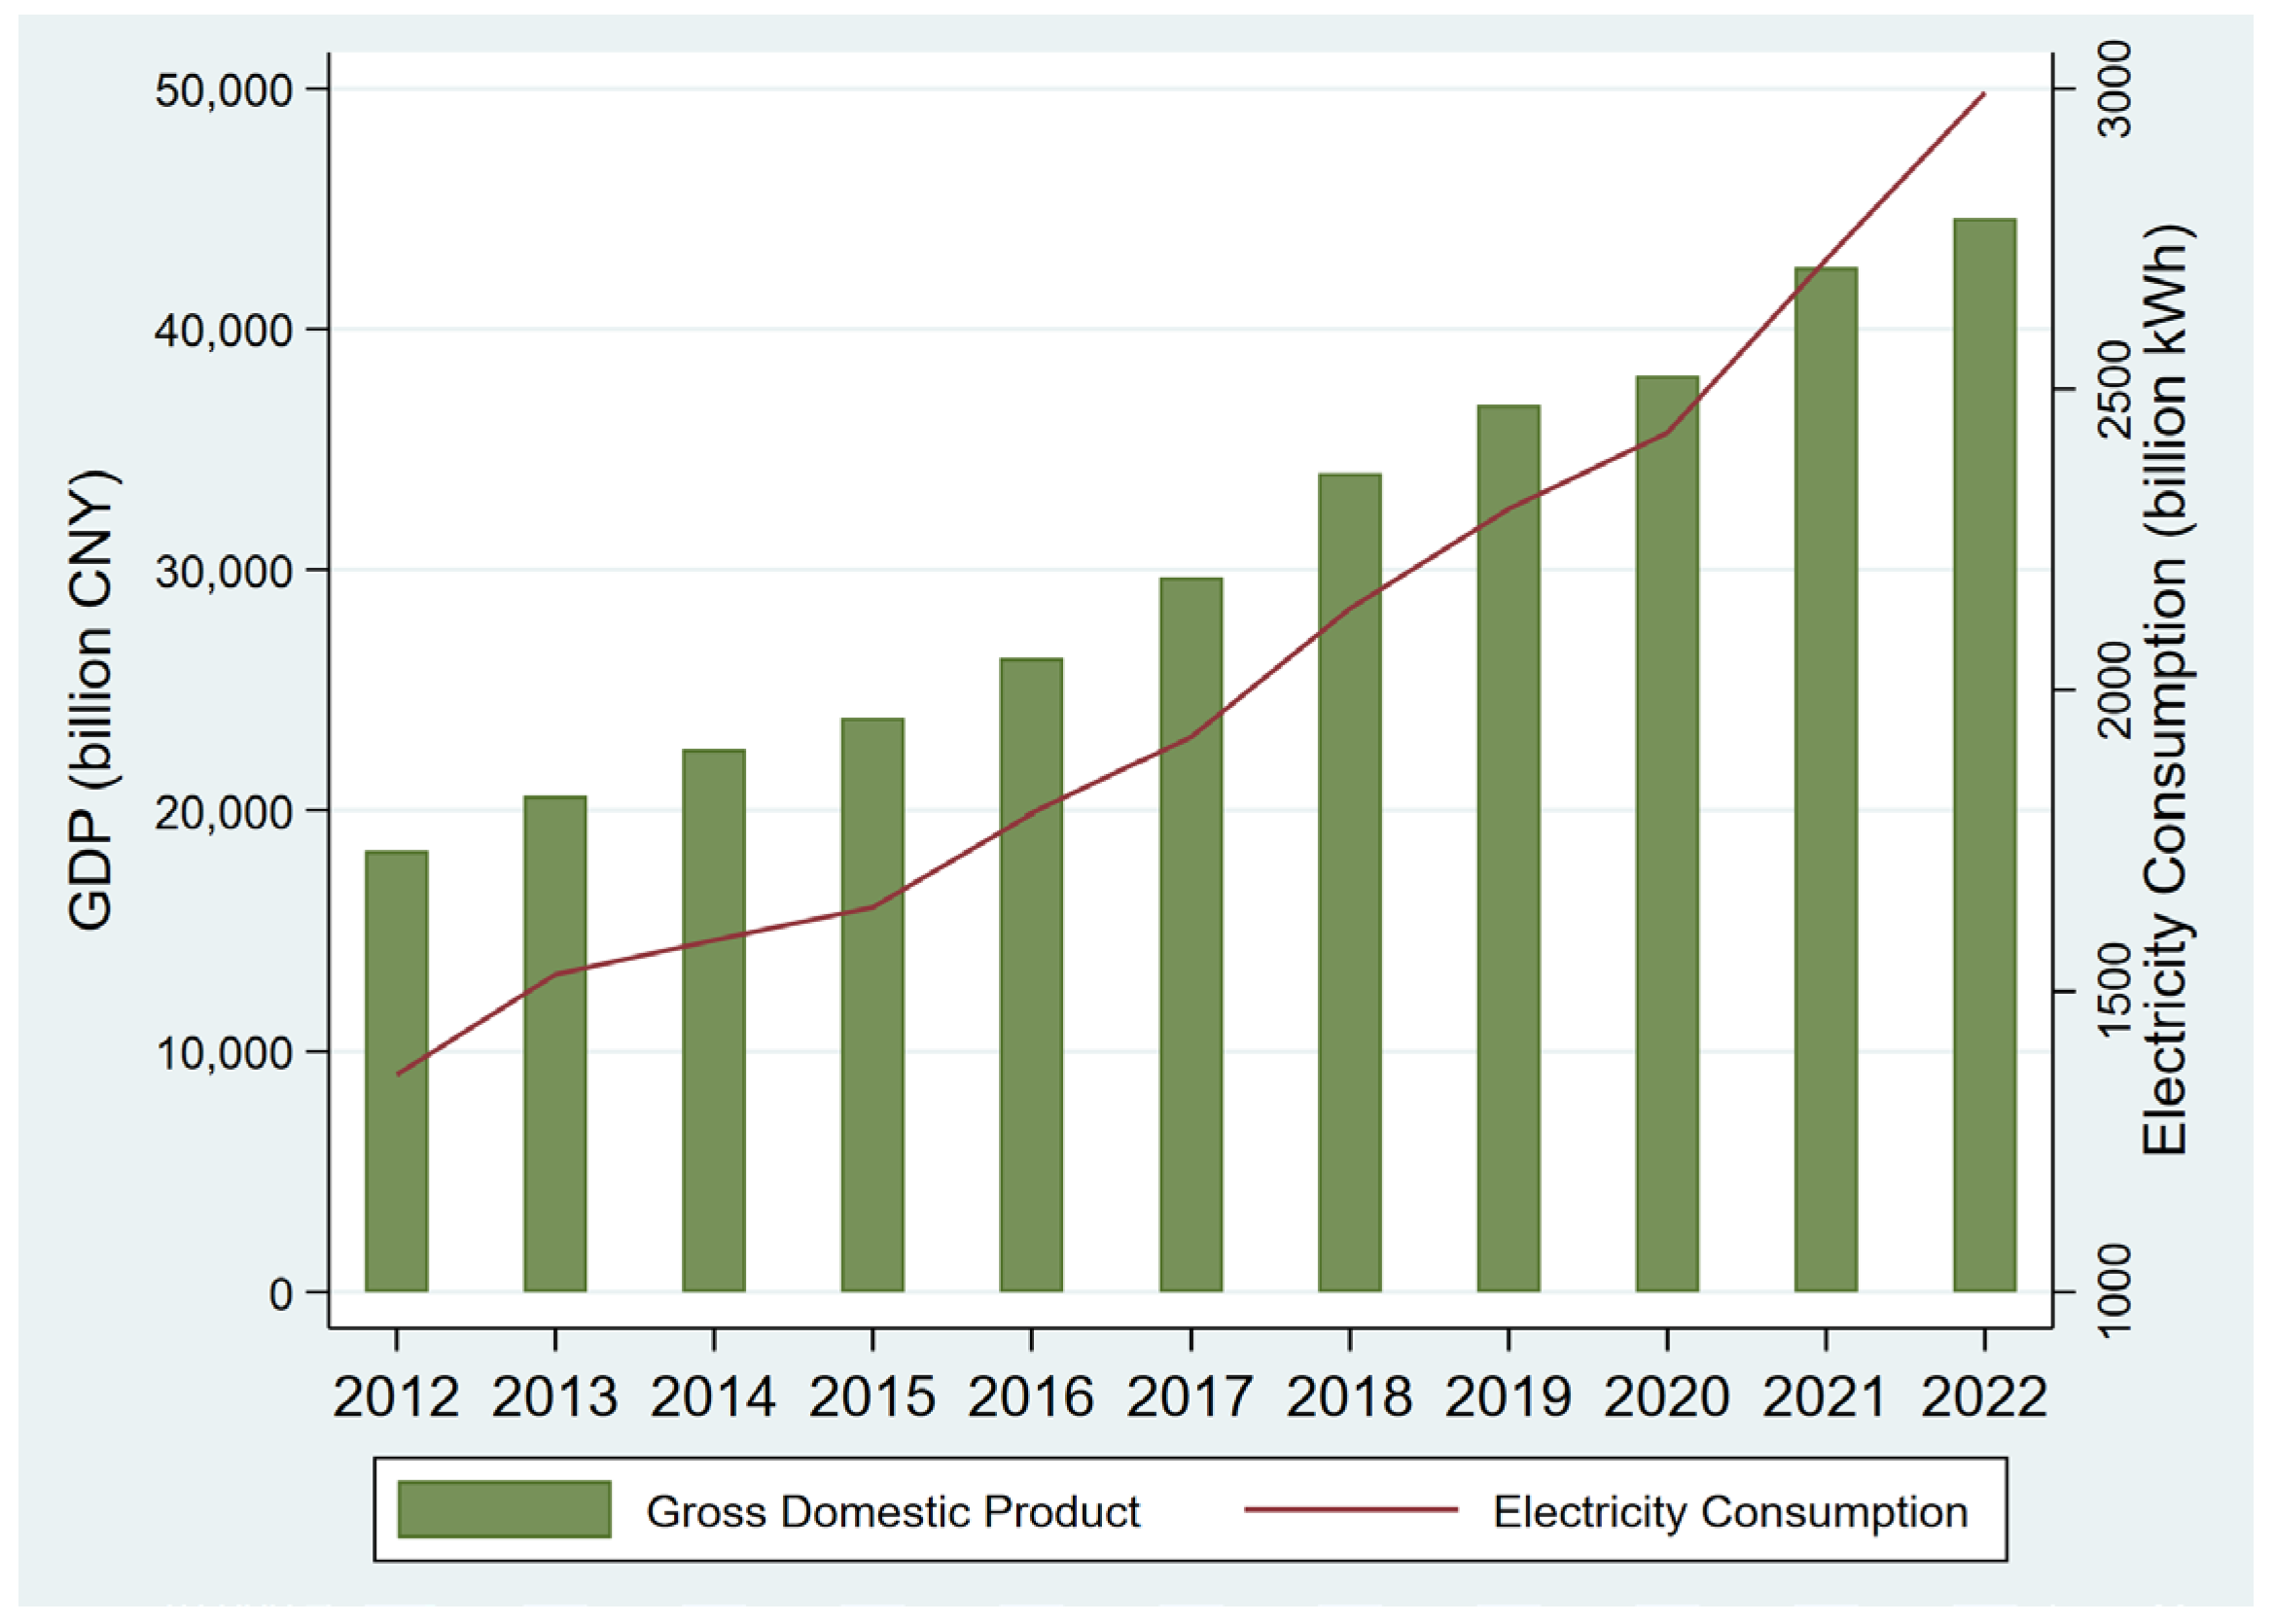
2.2. Development of the Power Grid in Anhui Province

As a major agricultural province, Anhui’s early power grid construction projects primarily focused on supporting agricultural development and facilitating rural poverty alleviation, addressing the persistent challenges of electricity supply in agricultural and rural areas. In 1996, Anhui achieved the goal of electrifying every village, injecting new vitality into rural economic and social development. This milestone not only improved access to electricity but also empowered local communities to enhance productivity and quality of life. Subsequently, Anhui implemented systematic reforms of the rural power grid and regulated rural electricity pricing, further enhancing the quality and affordability of electricity services in rural areas. These efforts received high recognition from the central government, making Anhui a model for rural power grid construction and renovation nationwide. In 1998, Anhui took the lead in initiating village-level grid renovation, which was later promoted across the country, sparking a new wave of rural grid modernization. Over the next six years, Anhui Power invested a total of CNY 8.589 billion in upgrading the rural power grid, including constructing and upgrading low-voltage lines, modernizing aging facilities, and promoting new transmission and distribution technologies, significantly improving the reliability and safety of the power supply. These initiatives greatly enhanced the electricity conditions for over 50 million rural residents and laid a solid foundation for the harmonious development of the rural economy, contributing to increased agricultural productivity and improved living standards.
Following this period, Anhui’s power grid entered a phase of steady development, gradually establishing a robust transmission network spanning the province from north to south, ensuring reliable power supply and distribution. This strategic development facilitated not only local economic growth but also regional integration. In 2012, with the large-scale deployment of ultra-high voltage (UHV) infrastructure, Anhui’s power grid entered a rapid development phase. A series of UHV alternating current transmission projects were launched, significantly enhancing Anhui’s cross-regional power transmission capabilities and contributing to the optimal allocation of power resources across the country. Among these projects, the Huainan–Nanjing–Shanghai UHV AC project officially went into operation in 2016, further consolidating Anhui’s position as a key hub within the East China power grid. This advancement enabled more efficient electricity distribution, thus supporting the growing energy demands of major urban centers. Anhui’s power grid has also actively promoted extensive interconnection with neighboring and external power grids. By effectively integrating with power grids in adjacent provinces such as Jiangsu and Zhejiang, Anhui has increased the flexibility of cross-regional power dispatch and transmission, providing robust support for power balance and stable supply in the East China region. The implementation of these major projects has enabled Anhui’s power grid to evolve from simply “transmitting power” to “transmitting power effectively”, enhancing both the efficiency and quality of power transmission. Consequently, Anhui’s UHV grid has become an indispensable hub in the power network of eastern China, playing a crucial role in ensuring energy security and supporting the region’s sustainable development goals.
Over the past decade, Anhui Power has accelerated the construction of a world-class modernized grid system, striving to create a highly reliable, interactive, and economically efficient grid to better serve regional economic development. The strategic evolution of the grid follows a unified long-term blueprint that aligns with regional load forecasts, balancing long-term goals with current needs. Additionally, the grid development has been scientifically planned to account for urban–rural and regional disparities, ensuring the efficient allocation of power resources. Meanwhile, Anhui Power has actively advanced the integration of information technology, automated control, and artificial intelligence applications, further enhancing the grid’s level of digitalization, automation, and interactivity, thus providing strong support for the efficient operation of a modern power grid. Figure 2 visually illustrates the economic growth and electricity consumption in Anhui Province from 2012 to 2022. GDP grew steadily from RMB 1834.17 billion in 2012 to RMB 4460.77 billion in 2022, with an average annual growth rate of 9.3%. A notable acceleration in the growth rate occurred after 2017, reflecting significant economic development driven by industrial expansion and infrastructure improvements. Similarly, electricity consumption increased from 136.11 billion kWh in 2012 to 299.32 billion kWh in 2022, paralleling GDP growth. The sharp rise in electricity consumption after 2017 further highlights the increased energy demand accompanying economic growth. Particularly, electricity consumption surpassed 200 billion kWh for the first time in 2018, signaling a pivotal moment when the economy’s expansion began to exert a stronger influence on energy requirements. This close correlation between GDP and electricity consumption underscores the essential role of electricity in supporting economic activities. The continued acceleration in electricity demand suggests that future energy policies should focus not only on sustaining economic growth but also on ensuring that energy infrastructure can meet the increasing demand in a sustainable manner.

2.3. Existing Research

According to the World Bank’s definition, infrastructure broadly refers to the economic infrastructure required for social production and residents’ daily lives (such as transportation and power systems) as well as social infrastructure (such as public health and social welfare facilities). It serves as the essential material foundation for the normal operation and healthy development of a region. Keynesian economics views infrastructure investment as a policy tool for government intervention in the economy. Aschauer [8] conducts pioneering research on infrastructure, identifying it as both indirect capital and social precursor capital. Simultaneously, infrastructure development is expected to exhibit spatial spillover effects [9,10] as it facilitates economic cooperation and labor mobility between regions, thereby lowering transaction costs and transportation expenses in neighboring areas. This suggests that infrastructure in one region can positively influence the economic growth of adjacent regions, enhancing overall regional economic integration and development [11,12]. Infrastructure development’s role in economic growth has been widely studied, especially in regions like China, South Africa, and the EU [13,14]. Banerjee et al. [14] highlight that improved transportation in China has widespread economic activities, particularly in urbanized areas. Dinlersoz and Fu [15] found that infrastructure investment drives economic growth, but its impact varies by region and urbanization level. Bluhm et al. [16] showed that while transportation infrastructure boosts economic activity, it has a limited effect on per capita income. However, some studies suggest that the impact of infrastructure investment is uncertain. Asher and Novosad [17] found that India’s road infrastructure projects underperformed due to a lack of economic support in rural areas. Maciulyte-Sniukiene and Butkus [12] showed that while infrastructure investments in the EU28 had a positive effect on growth, the impact was often not significant. Zhang and Cheng [18] noted that UK transportation infrastructure has long-term positive effects but a short-term negative impact. The effectiveness of infrastructure investment depends on factors like regional differences, policy environment, and investment efficiency [19].
As a critical energy infrastructure, electricity infrastructure is closely linked to residents’ daily lives, the normal functioning of industrial production, and the sustainable development of agriculture and rural areas [20,21]. The stable supply of electricity not only ensures convenience in daily life but also supports the sustainability of essential public services such as healthcare, education, and water supply [22]. Ortega and Lederman [23] studied the impact of rural infrastructure on agricultural total factor productivity using data from 38 countries between 1961 and 1997. Their research indicates that rural electricity infrastructure significantly enhances agricultural total factor productivity. Increasingly, scholars are recognizing the profound impact of electrical grids and employing econometric methods to conduct in-depth studies on their effects across various economic and social domains. It has been proven that weak power infrastructure in Africa has greatly hindered economic growth and led to unemployment [21,24]. Grid expansion is particularly important in driving economic growth and improving social welfare. For example, Kassem [25] examined the impact of grid expansion on industrial development in Indonesia, finding that grid access significantly increased the number of manufacturing firms and workers, and the manufacturing output, highlighting the essential role of electricity in industrial development and its function as a powerful driver of economic growth. Similarly, Lewis and Severnini [2] analyzed the impact of rural electrification in the United States from 1930 to 1960, revealing that grid access improved productivity and residents’ quality of life, facilitating long-term regional development by coordinating population and investment flows. In addition, Burlig and Preonas [26] found that the benefits of electrification are heterogeneous, with large villages experiencing significant gains, while small villages see limited benefits. The economic effects of grid development may take a longer time to fully materialize. The environmental impact of electricity infrastructure should also not be overlooked. With the development of clean energy technologies, the smartification of electrical networks and the integration of renewable energy have become important directions for optimizing electricity infrastructure [27]. Through large-scale deployment of smart meters and renewable energy generation facilities, modern grids are better able to manage energy supply and demand, reduce carbon emissions, and promote sustainable energy use. Infrastructure serves as a crucial pillar of economic growth [24]. However, the economic impact of infrastructure construction is often affected by endogeneity issues; scholars commonly use instrumental variable methods to effectively address this problem, enhancing the identification and reliability of research findings.
Incorporating infrastructure as an input factor in the production function and estimating its output elasticity can effectively assess the impact of infrastructure on economic development [28]. Infrastructure not only provides essential support resources in the production process but also promotes long-term economic growth by enhancing factor productivity. Esfahani and Ramirez [29] included infrastructure investment in a Cobb–Douglas function framework and found that part of the poor growth performance in Sub-Saharan Africa is related to insufficient investment in electricity and telecommunications infrastructure, illustrating how inadequate infrastructure can constrain production efficiency and overall economic performance. Insufficient investment, particularly in key infrastructure like electricity and communication, directly affects the basic conditions for economic development, further hindering capital accumulation and technological progress. Goel [30] treated infrastructure as a quasi-fixed input in a translog cost function, revealing that the provision of infrastructure not only improves manufacturing productivity but also helps reduce production costs, thereby enhancing the competitiveness of the industrial sector. Infrastructure as a quasi-fixed input can provide long-term production support, achieving economies of scale and reducing long-term marginal costs for enterprises. This indicates that well-developed infrastructure, especially in energy and transportation, not only directly promotes output but also creates a more favorable environment for manufacturing and other production sectors by improving productivity and reducing operational costs.
Existing research on infrastructure focuses on the impact of infrastructure on economic growth and employment [2,25]. There is more limited discussion on electricity infrastructure and its interaction with energy consumption. Our study constructs a theoretical model of supply and demand that includes energy, capital, labor, and infrastructure and explores the energy and output effects and regional differences resulting from grid development.

3. Methodology and Data

3.1. Methodology

Straub [31] identified two main sources of endogeneity: one is the correlation between infrastructure stock and the residual term caused by omitted variables; the other is reverse causality. Fixed-effect models or difference terms can address the estimation bias caused by omitted variables; they do not resolve the endogeneity issue caused by reverse causality. The improvement in power infrastructure provides the necessary energy support for the expansion of urban industries and services, thereby promoting economic growth. However, as the urban economy expands, energy demand increases significantly. This rising demand in turn further drives the development of power infrastructure. Analytical approaches based on production functions implicitly assume causality from infrastructure to output, which can easily give rise to endogeneity problems [32,33].
To address endogeneity, instrumental variable methods are employed to isolate the causal effect of electricity infrastructure on economic development. Geographic relief (such as elevation and terrain features) and lightning intensity (the frequency or strength of lightning strikes) have been used as instrumental variables in studies related to electricity development [20,34]. These variables are valid instruments because they are strongly correlated with electricity infrastructure but are unlikely to be directly influenced by economic factors, helping to isolate causal effects. However, identifying appropriate instruments remains a challenge [35].
Instrumental variable methods provide one way to overcome endogeneity, while dual theory offers another approach. The profit function is based on economic theory to construct the model, considering the relationships between various inputs and outputs and capturing the nonlinear relationships and interactions among the factors. Therefore, it is more flexible than some traditional regression methods. For instance, starting from the dual relationship between the cost function and the production function, one can directly estimate the equations derived from the cost function. This helps avoid endogeneity issues in the production function model [36].
This paper draws on the main ideas of Demetriades and Mamuneas [37], and Kratena [38] to derive a supply and demand theoretical model based on a variable profit function. There are two main advantages to using the profit function as the foundation of the model. First, starting from the profit function and using the duality principle to derive total output and factor demand effectively addresses the endogeneity problem caused by reverse causality. Second, China’s energy infrastructure is primarily driven by public investment from the government and its costs and prices do not fully reflect the true nature of the construction and operational activities. As a result, it is difficult to price the services provided by these facilities based on marginal output. In contrast, the profit function does not assume the pricing of production factors based on marginal products.
The profit function can be written as follows:
π t = F P t , W t , Z t 1
where P t   refers to the price of output in period t ; W t refers to the price of variable input in period t ; and Z t 1 refers to the price of invariable input in period t 1 , since we assume that the invariable input can function while lagging behind by one period.
For a given input–output price and invariable inputs, in the short run the producer can only choose output y and variable inputs x to maximize the profit problem [39].
M a x π P t , W t , Z t 1
π * P t , W t ,   Z t 1 = P t y * P t , W t , Z t 1 W t x * P t , W t , Z t 1
According to Hotelling’s lemma and envelope theorem, the optimal output and input can be obtained by the following two formulas.
y P t , W t , Z t 1 = π P t , W t , Z t 1 / P t
x P t , W t , Z t 1 = π P t , W t , Z t 1 / W t
Given the potential short-term additional expenses that cities may face when expanding infrastructure or capital stock, the profit function typically incorporates adjustment cost terms for invariable factors such as capital stock or infrastructure. This inclusion allows for a more accurate representation of the dynamic effects of investment decisions. Therefore, the variable profit function with adjustment costs can be expressed as follows:
  π t = F P t , W t , Z t 1 + C Δ Z t
C Δ Z t represents the adjustment cost function. To derive the specific expressions for output and input, we must assume a particular form for the profit function, with the trans-log function being one option [40,41]. The variable profit function including adjustment costs can be expressed as follows:
π t = β 0 + i = 1 I β i q i + j = 1 J α j Z j , t 1 + 1 2 i = 1 I h = 1 H β i h q i q h + 1 2 m = 1 M j = 1 J α j m Z i , t 1 Z m , t 1 + i = 1 I j = 1 J γ i j q i Z j , t 1 + j ζ j Δ Z j , t + 1 2 j ζ j j Δ Z j , t 2 + i j ζ i j Z i , t 1 Δ Z j , t + i j α i j q i Δ Z j , t
where q = P , W represents the vector of output prices and the vector of variable input prices. Z denotes the vector of invariable input prices. β i represents the contribution of the price of each output or variable input to profit. β i h reflects the interaction effect between different output prices or variable input prices.   α j represents the marginal impact of each input factor Z j   on profit. α j m   reflects the interaction between different input factors. γ i j represents the interaction effect between output prices/variable input prices and invariable input factors. ζ i j and α i j represent the relationship between inputs, outputs, and adjustment costs.
Several assumptions needed to be made to Equation (7) including symmetry and homogeneity: β i h = β h i , α m j = α j m , i I β i = 1 , i = 1 I h = 1 H β i h = 0 , i = 1 I α i j = 0 . Adjustment costs represent the additional costs incurred when changing input factors. The items containing Δ Z j , t are the adjustment costs. In the long run, when the invariable input factor reaches its equilibrium level, adjustment costs will become zero. In other words, no further adjustments to the production factors are needed in the long run, or adjustments no longer incur additional costs. That means π t / Z j , t | Z j , t = 0 , Z j , t = 0 = 0 . Therefore, ζ j = ζ i j = α i j = 0 ,   ζ j j 0 .
In this paper, energy (E) and labor (L) are thought to be variable inputs; capital (K) and electricity infrastructure (Ei) are invariable inputs (Table 1). In addition, we use the price of labor ( W l ) to normalize the price of output and other inputs and p y = P y / W l ,     w e = W e / W l , where   P y and   p y refer to the price of output before and after normalization. Since investment in infrastructure is outside the decision-making domain of producers, only the adjustment costs incurred by capital are considered. Then, Equation (7) in this paper can be specified like this:
π t / W l = β 0 + β y p y + β e w e + α k K t 1 + α E E i t 1 + 1 2 β e e w e 2 + β y y p y 2 + α k k K t 1 2 + α E E E i t 2 + ζ k k Δ K t 2 + α k E K t 1 E i t 1 + β y e p y w e + γ e k w e K t 1 + γ e E w e E i t 1 + γ y k p y K t 1 + γ y E p y E i t 1
When the long-term equilibrium is achieved, the optimal capital stock K * can be obtained to maximize the profit:
max { π * p , w , K * , K ˙ , E i q k K } = p y * p , w , K * , K ˙ , E i w x * p , w , K * , K ˙ , E i q k K *
Here, q k   represents the cost of capital usage. Taking the first derivative with respect to K on both sides of Equation (9), we obtain
E π * K | K = K * = q k
This implies that, at the optimal capital stock, the marginal profit from capital is equal to the cost of using capital. Plugging Equation (8) into Equation (10),
k * = α k + α k E E i + γ e k w e + γ y k p y q k α k k
According to Equations (4), (5) and (8), the supply function of total output and the demand function of variable inputs are
Y t = β y + β y y p y + β y e w e + γ y k K t 1 + γ y E E i t 1
E t = β e + β e e w e + β y e p y + γ e k K t 1 + γ e E E i t 1
L t = π p y Y + w e E = β 0 + α k K t 1 + α E E i t 1 β y e p y w e + α k E K t 1 E i t 1 + 1 2 ζ k k Δ K t 2 + 1 2 β e e w e 2 β y y p y 2 + α k k K t + 1 2 + α E E E i t 1 2
In Equations (12) and (13), the coefficients γ e E and γ y E reflect the influences of electricity infrastructure on energy consumption and output. In the short run, we assume that capital input remains invariable. Therefore, the elasticities of energy consumption and output with respect to electricity infrastructure are as follows:
ε E E = γ e E E i E , ε Y E = γ y E E i Y
However, in the long run, firms can adjust capital investment (K), so electricity infrastructure (Ei) affects capital (K), which in turn influences energy consumption (E) and output (Y). According to the first-order condition of the optimal capital stock ( K * ),
k * E i = α k E α k k  
Therefore, the elasticities of energy consumption and output with respect to electricity infrastructure are as follows:
η E E = E E i + E k * k * E i E i E = γ e E γ e k α k E α k k E i E
η Y E = Y E i + Y k * k * E i E i Y = γ y E γ y k α k E α k k E i Y
If we use the ratio of energy consumption to output of each city in Anhui Province to represent energy intensity, that is e = E / Y , then the elasticity of electricity infrastructure with respect to energy intensity in the short run is as follows:
ε E E = γ e E E i E γ y E E i Y
The long-run elasticity is
η E E = γ e E γ e k α k E α k k E i E γ y E γ y k α k E α k k E i Y

3.2. Data

The data utilized in this paper encompass energy consumption and its pricing, capital stock, labor and its pricing, as well as output and its pricing for 16 cities in Anhui Province. Common infrastructure indicators can be divided into two categories: (a) monetary value indicators and (b) physical indicators. Monetary value indicators typically measure the capital stock of infrastructure by directly summing the capital value of various types of infrastructure. However, obtaining such value data is often difficult, and if the monetary value of infrastructure is estimated, there may be overestimation biases, with related indicators (such as initial capital stock and depreciation rate) also affecting the results. Therefore, this paper uses physical indicators to measure the level of electricity grid infrastructure.
To achieve a more precise measurement of infrastructure stock, this paper employs a single physical indicator to assess the level of electricity grid infrastructure, effectively reflecting the development of energy infrastructure. Given that geographical area differences may bias infrastructure assessments, we adopt the concept of “power grid density” at the regional level. Additionally, to reflect operational efficiency and practical effectiveness, this paper introduces the adjusted indicator “power grid density”, calculated as Equation (21):
G = τ g
where g represents the actual grid density and τ represents the adjustment coefficient, which is typically indicated by the capacity utilization rate [42]. By applying this adjustment, the analysis not only reflects the theoretical availability of infrastructure but also considers the practical effectiveness and operational efficiency of the energy grid, providing a more comprehensive understanding of how infrastructure impacts economic activities in the region.
Other variables include capital stock, labor and its price, output and its price, and energy consumption and its price. For capital stock, there are no directly available data, so we estimate them by using the perpetual inventory method. The basic formula of the method is shown as Equation (22):
K t = K t 1 1 δ t + I t
where K t and K t 1 represent capital stock in each city in year t and year t − 1, respectively; δ t represents the depreciation rate in year t; and I t represents the investment in year t. In the calculation process, since the data for the year 2000 are relatively complete, we use 2000 as the base year to estimate the capital stock for each city. The depreciation rate is set at 9.6%, with I t representing the total fixed asset formation in year t [43]. The relevant data are obtained from the statistical yearbooks of each city.
For output, the gross regional product of prefecture-level cities is employed as a key indicator, capturing the overall economic performance of each city. The producer price index (PPI) of industrial products is utilized to represent the output price, reflecting the market value of goods produced within the region. The total regional energy end-consumption is used as an indicator of energy consumption, and these data can be obtained directly from the statistical yearbooks of each city. Energy prices are indicated by the index of raw materials, fuel, and power prices, which provide insight into the cost structure affecting energy utilization. Labor is measured by the total number of employees in urban non-private units, reflecting the formal employment landscape in the cities. Labor prices are represented by the average wage. All data utilized in this analysis are sourced from the Anhui Statistical Yearbook and City Statistical Yearbook, ensuring the reliability and consistency of the information. Table 2 presents a comprehensive overview of the economic and infrastructure-related data for the 15 cities in Anhui Province, comprising a total of 165 observations. These data clearly highlight the disparities among the cities, revealing significant differences in economic output, infrastructure development, and labor dynamics.

4. Results and Discussion

By incorporating error terms into Equations (11)–(13), we assume an intrinsic relationship among these three equations, as they reflect the outputs and inputs of the same city, leading to correlated disturbances. In the system of Equations (11)–(13), there are many parameters that need to be estimated, and the quadratic terms formed by the interaction terms may lead to multicollinearity issues. Additionally, the data need to have sufficient variability to provide more information. Panel data can meet these requirements. The seemingly unrelated regression (SUR) method can simultaneously account for heteroscedasticity and contemporaneous correlation of residuals across different equations. This method is particularly well suited for systematic parameter estimation, as it allows for more accurate inferences by taking into account the interdependencies among the equations [44,45]. To account for regional differences, city dummy variables are included in each equation, ensuring that variations specific to each city are adequately captured in the model. This approach enhances the robustness of our analysis by controlling for unobserved heterogeneity that may influence the results. To further validate the robustness of our findings, we replace the original grid density with the product of grid density and capacity utilization rate for each city.
All results are shown in Table 3. Columns (1) to (3) present the estimation results without adjustments for infrastructure utilization rate, while columns (4) to (6) show the re-estimation results with these adjustments. Comparing the two sets of results, the coefficients and their significance levels are nearly identical, indicating that our estimation results are robust. The following discussion is based on the results in columns (4) to (6).
As shown in columns (2) and (5) of the energy equation in Table 3, the impact of energy prices on energy consumption in various cities is statistically insignificant. Although, in theory, the demand for a commodity should be influenced by its price, with price increases typically leading to a decrease in demand, energy consumption in this study does not exhibit this typical price response, indicating a price distortion phenomenon. This may be due to several factors: First, energy prices are controlled by the government and are not entirely determined by market supply and demand, failing to effectively reflect the scarcity of energy and its externalities. Second, during the processes of urbanization and industrialization, the energy demand in many cities is relatively rigid, especially in regions with higher levels of industrialization, where energy demand is mainly driven by infrastructure development and production activities. As a result, even if energy prices rise, demand remains relatively unchanged.

4.1. The Analysis of the Elasticities of Electricity Infrastructure to Energy and Output Consumption

Table 4 reveals that the short-term average elasticities of energy consumption and output relative to electricity infrastructure density in cities across Anhui Province are −0.136 and −0.197, respectively, both indicating negative relationships. This finding suggests that a 1% increase in electricity infrastructure density would reduce energy consumption by 0.136% and output by 0.197% in these cities. The reduction in energy consumption resulting from increased grid density can be attributed to the following key reasons: First, a higher grid density significantly improves transmission efficiency, reducing power losses and enabling the same amount of electricity generation to more effectively meet consumption needs. Second, a stable and reliable power supply reduces dependence on inefficient, high-emission backup generators such as diesel, thereby lowering overall energy consumption. Lastly, an increased grid density supports the integration of more renewable energy sources, allowing for better utilization of wind and solar power, which reduces reliance on fossil fuels and enhances energy efficiency. Therefore, the increase in grid density effectively reduces energy consumption by improving transmission efficiency, reducing the need for backup power sources, and promoting the integration of clean energy. However, an increase in grid density may lead to a reduction in output. After the increase in grid density, the improvement in energy efficiency takes some time to translate into actual economic benefits. Even though the power supply improves, the response of energy demand in the production sector may have a delayed effect, so the economic growth rebound may not immediately appear in the short term. The construction and deployment of power infrastructure typically require substantial capital, raw materials, and human resources, which are diverted from productive sectors in the short term, potentially causing temporary economic disruptions, especially when resource reallocation and supply–demand dynamics have not yet fully adjusted. This diversion of resources can result in decreased energy utilization efficiency and reduced economic output in the short term, thereby manifesting as negative elasticity. Moreover, in cities with relatively well-developed infrastructure, further expansion of the grid may face diminishing marginal returns. The incremental expansion of the grid in these cities may not significantly improve the power quality or reduce outages, meaning that additional investments may still fail to generate substantial economic returns [46].
In the long term, an increase in power infrastructure density is often accompanied by technological advancements, such as the intelligent upgrading of distribution networks and the widespread adoption of energy-efficient equipment, which significantly enhance overall energy efficiency. This cumulative improvement substantially reduces energy consumption over time, leading to a long-term negative elasticity of “electricity to energy”, with the magnitude of long-term elasticity exceeding that of short-term elasticity. As power infrastructure density increases, firms and industries gradually adapt to the expanded power supply and leverage economies of scale to achieve greater production efficiency. This process greatly improves energy efficiency per unit of output, thereby reducing overall energy consumption. Furthermore, in the long term, the elasticity of power infrastructure with respect to output becomes positive. Increased power infrastructure density creates favorable conditions for large-scale industrial and commercial activities. When firms are able to rely on a stable power supply to expand production, they can benefit from economies of scale [47], which reduce average costs through increased production scale. These economies of scale enhance production efficiency, ultimately leading to increased economic output. This positive elasticity arises as the improved power infrastructure supports more efficient resource utilization, attracts investment, and facilitates industrial growth, all of which contribute to higher long-term economic performance.
Electricity infrastructure plays an important role in the transition of traditional energy-intensive and inefficient industries to technology-driven and low-carbon industries. Emerging industries (e.g., high-tech information technology) often have more efficient and energy-saving demands for electricity, and upgraded power infrastructure provides these industries with a reliable supply of electricity, which facilitates the rapid growth of emerging industries, which in turn increases economic output and reduces overall energy consumption. At the same time, government policies to encourage the use of green energy, such as support for renewable energy investment and development, not only enhance the sustainability of the power system but also reduce reliance on traditional energy sources and lower energy consumption.
As shown in Table 4, there are significant differences in short-term and long-term elasticity across different cities. The short-term and long-term electricity-to-energy elasticity in Bengbu are −0.418 and −3.015, respectively, which are notably higher than those in other cities. This is primarily due to the city’s outdated distribution network, with over 50% of the grid being aged. The aging grid is unable to efficiently distribute and transmit electricity, resulting in unstable power supply and low energy efficiency, which requires more energy to meet demand. The advancement of new grid construction helps reduce energy loss and improve energy utilization efficiency, ensuring that changes in electricity demand do not lead to excessive energy consumption. In contrast, cities such as Hefei and Ma’anshan exhibit lower electricity elasticity, mainly due to their relatively well-developed power infrastructure, which enables more efficient energy use. Bengbu’s long-term electricity-to-output elasticity is as high as 20.258, much higher than in other cities. This can be attributed to the city’s industrial structure, which is dominated by energy-intensive sectors such as chemicals and steel, where electricity demand is significantly high. Similarly, other heavy industrial cities like Fuyang and Huainan also exhibit high electricity dependency, leading to a close relationship between electricity supply and output. In contrast, cities like Hefei and Wuhu, with more diversified industrial structures and a significant share of services and high-tech industries, show lower electricity dependency, meaning that changes in electricity supply have less impact on their output.

4.2. The Analysis of the Elasticities of Electricity Infrastructure to Energy Intensity

Table 5 presents the elasticity of energy intensity in cities of Anhui Province relative to power infrastructure. The results indicate that, in the short term, most cities have a positive energy intensity elasticity, suggesting that an increase in power infrastructure may lead to a rise in energy intensity in the short run. This phenomenon reflects that, in the context of inadequate power supply, cities may enhance power infrastructure to support economic activities, even if this leads to a temporary decrease in resource utilization efficiency. However, in the long term, increased power infrastructure density significantly reduces energy intensity in cities, indicating a gradual improvement in energy efficiency. This suggests that enhancing power infrastructure not only satisfies current energy demands but also serves as a crucial factor in promoting long-term sustainable development.
In the short term, increased power supply provides more favorable conditions for business production and operations, lowering the costs and risks associated with energy acquisition. This convenience often encourages firms to expand production in pursuit of higher profits, particularly in industries that respond rapidly to market demand. In such cases, companies tend to focus more on increasing output rather than immediately adopting measures to improve energy efficiency. As a result, the emphasis on expanding production in the short term may lead to decreased energy use efficiency, resulting in positive energy intensity elasticity.
In contrast, in the long term, increased power infrastructure density can effectively enhance energy efficiency. As firms gradually adapt to the new power supply conditions, they upgrade technologies and adopt more energy-efficient equipment and processes. This not only improves production efficiency but also promotes environmental sustainability. Furthermore, by continually expanding production, firms achieve economies of scale, further enhancing energy utilization efficiency. Therefore, a 1% increase in power infrastructure density leads to an average 7.85% reduction in energy intensity in cities. This long-term effect indicates that the benefits of dense power infrastructure in reducing energy intensity require a process of firm adaptation, technological upgrades, and the accumulation of economies of scale to fully manifest their potential economic and environmental benefits.
Table 5 also shows the elasticity values between electricity and energy intensity for different cities in the short and long terms. Fuyang and Bengbu show significant differences in the relationship between electricity supply and energy intensity, which are closely related to their respective industrial structures, infrastructure development, and technological progress. In the short term, the increase in electricity supply in these two cities may not have effectively improved energy efficiency. On the contrary, due to lagging infrastructure development, a surge in electricity demand, and a high proportion of traditional energy-intensive industries, excessive energy consumption occurred, leading to an increase in energy intensity. Particularly in Fuyang, the higher short-term elasticity suggests that the increase in electricity supply has not quickly modernized the production process. In the long term, with improvements in power infrastructure, technological progress, and industrial structure optimization, the increase in electricity supply has brought significant economic benefits and enhanced energy use efficiency in both cities.

5. Conclusions and Policy Recommendations

This paper employs a profit function and seemingly unrelated regression (SUR) method, using data from cities in Anhui Province to investigate the impact of power infrastructure on output and energy consumption in these cities. The main findings are as follows: First, an increase in grid density significantly reduces energy consumption in cities across Anhui Province, with long-term energy elasticity greater than short-term elasticity, indicating that the positive impact of power infrastructure on energy efficiency becomes more pronounced over time. Second, although an increase in grid density may lead to a decline in output in the short term, it contributes to output growth in the long term, demonstrating that the long-term return on investment in power infrastructure is positive. Lastly, the effect of grid density on reducing energy intensity in cities remains stable over a longer period, providing strong support for cities to achieve economic growth while reducing energy consumption.
Based on the above research findings, we offer the following recommendations. Firstly, the government should adopt a differentiated approach to electricity infrastructure development based on the level of infrastructure in different regions. In areas with relatively underdeveloped infrastructure (such as Bengbu and Fuyang), priority should be given to increasing investment in electricity infrastructure to improve the stability and efficiency of power supply, promote the rational allocation of resources, and enhance both short-term and long-term economic benefits. In cities with more developed infrastructure (such as Hefei and Ma’anshan), the focus should be on upgrading the power grid with smart technologies and optimizing the electricity distribution system, avoiding excessive investment that may lead to diminishing marginal returns, and prioritizing system efficiency and energy utilization. Secondly, regions should formulate targeted policies to promote technological innovation and industrial structure optimization according to their respective industrial characteristics. In cities dominated by heavy industry and energy-intensive sectors (such as Bengbu, Fuyang, and Huainan), the government should strengthen support for clean energy and energy-saving technologies, facilitating the transformation of these cities’ industries toward low-carbon and high-efficiency models. For cities with more diversified industrial structures and greater potential for technological innovation (such as Hefei and Wuhu), the government should further increase support for high-tech and green industries, enhancing sustainable economic growth by improving the energy efficiency of enterprises. Finally, when planning electricity infrastructure investments, the government should carefully balance the short-term economic costs and long-term economic benefits. By providing policy support (such as fiscal subsidies and loan incentives), the government can mitigate the short-term impacts of resource reallocation and ensure the long-term returns on investment. Although our study is based on the Anhui region, the results are an important guide for other regions.
Our results may still contain some potential limitations. First, we assume a depreciation rate of 9.6%, which may not accurately reflect the actual capital usage. Second, we use “regional energy final consumption” as the energy consumption indicator. However, since the power grid infrastructure is considered a fixed input and its development level is highly correlated with electricity consumption, this may lead to multicollinearity between energy consumption and infrastructure variables, resulting in duplicated effects on the profit function. Therefore, electricity consumption should be deducted from the energy consumption measure. Finally, when estimating the total output supply equation and the variable input demand equation, a large number of parameters are involved, along with interaction terms, which may lead to multicollinearity issues in the quadratic terms. Therefore, large datasets with sufficient variability are required to provide enough information to ensure the accuracy and reliability of the estimates; otherwise, estimation bias may occur.

Author Contributions

Conceptualization, R.L., K.H. and Y.S.; methodology, K.H.; software, K.H.; validation, K.H. and Z.L.; formal analysis, K.H. and Z.L.; investigation, Z.L.; resources, K.H.; data curation, K.H.; writing—original draft preparation, K.H. and Z.L.; writing—review and editing, K.H. and R.L.; visualization, K.H.; supervision, Y.S.; project administration, Y.S. and R.L.; funding acquisition, X.S. and X.G. All authors have read and agreed to the published version of the manuscript.

Funding

This paper is supported by State Grid Science and Technology Project (grant No. B11209230006) and the project of The Ministry of Education Philosophy and Social Sciences Laboratory for Data Science and Smart Society Governance of Hefei University of Technology (Grant No. DSSSG2024P18, DSSSG2024P17).

Data Availability Statement

The data will be made available upon reasonable request through the corresponding author.

Conflicts of Interest

Authors Xiaomin Shi, Xiang Gao, and Rong Li were employed by the company Economic Research Institute, State Grid Anhui Electric Power Co., Ltd. The remaining authors declare that the research was conducted in the absence of any commercial or financial relationships that could be construed as a potential conflict of interest.

References

  1. Williams, J.; Ghanadan, R. Electricity reform in developing and transition countries: A reappraisal. Energy 2006, 31, 815–844. [Google Scholar]
  2. Lewis, J.; Severnini, E. Short- and long-run impacts of rural electrification: Evidence from the historical rollout of the U.S. power grid. J. Dev. Econ. 2020, 143, 102412. [Google Scholar]
  3. Yuan, J.; Xu, Y.; Hu, Z.; Yu, Z.; Liu, J.; Hu, Z.; Xu, M. Managing electric power system transition in China. Renew. Sustain. Energy Rev. 2012, 16, 5660–5677. [Google Scholar]
  4. Liu, X.; Lin, B.; Zhang, Y. Sulfur dioxide emission reduction of power plants in China: Current policies and implications. J. Clean. Prod. 2016, 113, 133–143. [Google Scholar]
  5. Xu, X.; Xu, X.; Chen, Q.; Che, Y. The impacts on CO2 emission reduction and haze by coal resource tax reform based on dynamic CGE model. Resour. Policy 2018, 58, 268–276. [Google Scholar]
  6. Ming, Z.; Lilin, P.; Qiannan, F.; Yingjie, Z. Trans-regional electricity transmission in China: Status, issues and strategies. Renew. Sustain. Energy Rev. 2016, 66, 572–583. [Google Scholar]
  7. Wang, H.; Zhang, Y.; Lin, W.; Wei, W. Transregional electricity transmission and carbon emissions: Evidence from ultra-high voltage transmission projects in China. Energy Econ. 2023, 123, 106751. [Google Scholar]
  8. Aschauer, D.A. Is public expenditure productive? J. Monet. Econ. 1989, 23, 177–200. [Google Scholar]
  9. Delgado, M.J.; Álvarez, I. Network infrastructure spillover in private productive sectors: Evidence from Spanish high capacity roads. Appl. Econ. 2007, 39, 1583–1597. [Google Scholar]
  10. Konno, A.; Kato, H.; Takeuchi, W.; Kiguchi, R. Global evidence on productivity effects of road infrastructure incorporating spatial spillover effects. Transp. Policy 2021, 103, 167–182. [Google Scholar]
  11. Andersen, T.B.; Dalgaard, C.J. Power outages and economic growth in Africa. Energy Econ. 2013, 38, 19–23. [Google Scholar] [CrossRef]
  12. Maciulyte-Sniukiene, A.; Butkus, M. Does infrastructure development contribute to EU countries’ economic growth? Sustainability 2022, 14, 5610. [Google Scholar] [CrossRef]
  13. Xu, Z.; Das, D.K.; Guo, W.; Wei, W. Does power grid infrastructure stimulate regional economic growth? Energy Policy 2021, 155, 112296. [Google Scholar]
  14. Banerjee, A.; Duflo, E.; Qian, N. On the road: Access to transportation infrastructure and economic growth in China. J. Dev. Econ. 2020, 145, 102442. [Google Scholar]
  15. Dinlersoz, E.M.; Fu, Z. Infrastructure investment and growth in China: A quantitative assessment. J. Dev. Econ. 2022, 158, 102916. [Google Scholar]
  16. Bluhm, R.; Dreher, A.; Fuchs, A.; Parks, B.C.; Strange, A.M.; Tierney, M.J. Connective financing: Chinese infrastructure projects and the diffusion of economic activity in developing countries. J. Urban Econ. 2025, 145, 103730. [Google Scholar]
  17. Asher, S.; Novosad, P. Rural roads and local economic development. Am. Econ. Rev. 2020, 110, 797–823. [Google Scholar]
  18. Zhang, Y.; Cheng, L. The role of transport infrastructure in economic growth: Empirical evidence in the UK. Transp. Policy 2023, 133, 223–233. [Google Scholar]
  19. Fernald, J.G. Roads to prosperity? Assessing the link between public capital and productivity. Am. Econ. Rev. 1999, 89, 619–638. [Google Scholar]
  20. Dinkelman, T. The Effects of Rural Electrification on Employment: New Evidence from South Africa. Am. Econ. Rev. 2011, 101, 3078–3108. [Google Scholar]
  21. Kaygusuz, K. Energy services and energy poverty for sustainable rural development. Renew. Sustain. Energy Rev. 2011, 15, 936–947. [Google Scholar]
  22. Oyedepo, S.O. Energy and sustainable development in Nigeria: The way forward. Energy Sustain. Soc. 2012, 2, 15. [Google Scholar]
  23. Ortega, C.B.; Lederman, D. Agricultural productivity and its determinants: Revisiting international experiences. Estud. Econ. 2004, 31, 133–163. [Google Scholar]
  24. Fedderke, J.W.; Perkins, P.; Luiz, J.M. Infrastructural investment in long-run economic growth: South Africa 1875–2001. World Dev. 2006, 34, 1037–1059. [Google Scholar] [CrossRef]
  25. Kassem, D. Does electrification cause industrial development? Grid expansion and firm turnover in Indonesia. J. Dev. Econ. 2024, 167, 103234. [Google Scholar]
  26. Burlig, F.; Preonas, L. Out of the darkness and into the light? Development effects of rural electrification. J. Political Econ. 2024, 132, 2937–2971. [Google Scholar]
  27. Lin, X.J.; Zhang, N.; Mao, Y.H.; Chen, J.Y.; Tian, X.T.; Zhong, W. A review of the transformation from urban centralized heating system to integrated energy system in smart city. Appl. Therm. Eng. 2024, 240, 122272. [Google Scholar] [CrossRef]
  28. Moyo, B. Power infrastructure quality and manufacturing productivity in Africa: A firm level analysis. Energy Policy 2013, 61, 1063–1070. [Google Scholar]
  29. Esfahani, H.S.; Ramirez, M.T. Institutions, infrastructure, and economic growth. J. Dev. Econ. 2003, 70, 443–477. [Google Scholar]
  30. Goel, D. Impact of infrastructure on productivity: Case of Indian registered manufacturing. Indian Econ. Rev. 2003, 38, 95–113. [Google Scholar]
  31. Straub, S. Infrastructure and development: A critical appraisal of the macro-level literature. J. Dev. Stud. 2011, 47, 683–708. [Google Scholar]
  32. Shi, H.; Huang, S. How Much Infrastructure Is Too Much? A New Approach and Evidence from China. World Dev. 2014, 56, 272–286. [Google Scholar]
  33. Wei, W.; Cai, W.; Guo, Y.; Bai, C.; Yang, L. Decoupling relationship between energy consumption and economic growth in China’s provinces from the perspective of resource security. Resour. Policy 2020, 68, 101693. [Google Scholar]
  34. Mensah, J.T. Jobs! Electricity shortages and unemployment in Africa. J. Dev. Econ. 2024, 167, 103231. [Google Scholar]
  35. Murray, M.P. The Bad, the Weak, and the Ugly: Avoiding the Pitfalls of Instrumental Variables Estimation. 2006. Available online: http://ssrn.com/abstract=843185 (accessed on 1 December 2024).
  36. Tan, R.; Liu, K.; Lin, B. Transportation infrastructure development and China’s energy intensive industries—A road development perspective. Energy 2018, 149, 587–596. [Google Scholar]
  37. Demetriades, P.O.; Mamuneas, T.P. Intertemporal Output and Employment Effects of Public Infrastructure Capital: Evidence from 12 OECD Economies. Econ. J. 2000, 110, 687–712. [Google Scholar]
  38. Kratena, K. Technical Change, Investment and Energy Intensity. Econ. Syst. Res. 2007, 19, 295–314. [Google Scholar]
  39. Berndt, E.R.; Fuss, M.A. Economic Capacity Utilization and Productivity Measurement for Multi-Product Firms with Multiple Quasi-Fixed Inputs; NBER Working Papers; National Bureau of Economic Research, Inc.: Cambridge, MA, USA, 1989. [Google Scholar]
  40. Bergman, M.A. The restricted profit function and the application of the generalised Leontief and the translog functional forms. Int. J. Prod. Econ. 1997, 49, 249–254. [Google Scholar] [CrossRef]
  41. McElroy, M.B. Additive General Error Models for Production, Cost, and Derived Demand or Share Systems. J. Political Econ. 1987, 95, 737–757. [Google Scholar]
  42. Castells, A.; Solé-Ollé, A. The regional allocation of infrastructure investment: The role of equity, efficiency and political factors. Eur. Econ. Rev. 2005, 49, 1165–1205. [Google Scholar]
  43. Gao, Y.; Zhang, M.; Zheng, J. Accounting and determinants analysis of China’s provincial total factor productivity considering carbon emissions. China Econ. Rev. 2021, 65, 101576. [Google Scholar]
  44. Chakir, R.; Le Gallo, J. Predicting land use allocation in France: A spatial panel data analysis. Ecol. Econ. 2013, 92, 114–125. [Google Scholar] [CrossRef]
  45. Susaeta, A.; Lal, P.; Carter, D.R.; Alavalapati, J. Modeling nonindustrial private forest landowner behavior in face of woody bioenergy markets. Biomass Bioenergy 2012, 46, 419–428. [Google Scholar]
  46. Deng, T. Impacts of Transport Infrastructure on Productivity and Economic Growth: Recent Advances and Research Challenges. Transp. Rev. 2013, 33, 686–699. [Google Scholar] [CrossRef]
  47. Achour, H.; Belloumi, M. Investigating the causal relationship between transport infrastructure, transport energy consumption and economic growth in Tunisia. Renew. Sustain. Energy Rev. 2016, 56, 988–998. [Google Scholar]
Figure 1. Trends in electric power engineering construction and power grid investment in China from 2012 to 2023.
Sustainability 17 03193 g001
Figure 2. The gross domestic product and electricity consumption of Anhui Province from 2012 to 2022.
Sustainability 17 03193 g002
Table 1. Key variable descriptions.
VariableDescription
yOutput.
xVariable input. In the short run, producers can only change variable inputs.
PThe price of an output.
WThe price of a variable input.
ZThe price of an invariable input, which functions with a one-period lag and involves adjustment costs. In the long run, adjustment costs will become zero.
EEnergy is the variable input.
LLabor is the variable input.
KCapital is the invariable input. In the long run, producers can change this invariable input.
EiElectricity infrastructure is the invariable input.
Table 2. Descriptive statistics of variables.
VariableObsMeanStd. Dev.MinMax
Y16519.97618.4114.257120.131
K1656.1785.5971.28533.794
Py165100.7034.16993.94107.980
E1658.0105.8801.73427.718
We165101.1385.36993.46111.520
L16534.95133.91710.324183.289
Wl16565,775.90318,529.41135,062112,019
Ei1651.1730.9490.1485.509
Note: Y: gross regional product, representing output. K: capital stock. Py: producer price index (PPI) of industrial products, representing output price. E: total energy consumption. We: energy price. L: employment in non-private units. Wl: average wage. Ei: power grid density.
Table 3. Estimation results of the Simultaneous Equation Model.
(1)(2)(3)(4)(5)(6)
Without Adjustment for Infrastructure
Utilization Rate
With Adjustment for Infrastructure
Utilization Rate
OutputEnergyLaborOutputEnergyLabor
VariablesEquationEquationEquationEquationEquationEquation
Kt−13.160 ***−0.194 ***−2.323 ***3.280 ***−0.178 ***−2.586 ***
(27.71)(−6.40)(−6.42)(27.39)(−5.49)(−5.92)
Eit−1−2.016 **−0.830 ***7.773 **−3.632 ***−1.137 ***11.13 **
(−2.68)(−4.16)(3.03)(−3.74)(−4.33)(2.85)
PyWe −0.000733 −0.0599
(−0.00) (−0.22)
Kt−1Eit−1 0.365 * 0.299 *
(2.51) (1.99)
K t 2 −0.0123 0.0343
(−0.13) (0.36)
WeWe −0.00125 0.0281
(−0.01) (0.21)
PyPy 0.00395 0.0337
(0.03) (0.25)
Kt−1Kt−1 −0.0107 −0.00753
(−0.90) (−0.58)
Eit−1Eit−1 −1.514 ** −1.412 **
(−2.83) (−2.59)
Py−0.238−0.123 −0.266−0.115
(−0.90)(−1.74) (−1.03)(−1.65)
We0.08770.0784 0.1070.0730
(0.43)(1.44) (0.54)(1.35)
Constant21.29 **0.981−40.86 ***22.19 **
(2.89)(0.50)(−6.29)(3.11)
Time fixed effect
City fixed effect
Observations150150150150150150
R-squared0.9870.9900.9890.9870.9900.990
Note: √ represents controlling for time and city fixed effects. z-values in parentheses. *** Parameter estimation is significant at the 1% critical level. ** Parameter estimation is significant at the 5% critical level. * Parameter estimation is significant at the 10% critical level.
Table 4. Elasticity of output and energy consumption in cities of Anhui Province based on electricity infrastructure.
Short-Term ElasticityLong-Term Elasticity
CityArea (km2)/
Population (Million)
Electricity to EnergyElectricity to OutputElectricity to EnergyElectricity to Output
Bozhou8429/670−0.101−0.099−0.7253.462
Lu’an15,351/581−0.052−0.079−0.3772.746
Hefei11,496/800−0.067−0.064−0.4802.247
Anqing13,528/523−0.075−0.072−0.5372.524
Xuancheng12,340/275−0.084−0.133−0.6034.640
Suzhou9787/658−0.070−0.098−0.5083.428
Huainan5650/387−0.237−0.445−1.71115.502
Chuzhou13,433/453−0.174−0.244−1.2588.522
Wuhu6026/387−0.091−0.091−0.6593.172
Huaibei2732/218−0.136−0.182−0.9826.349
Tongling2992/168−0.143−0.162−1.0315.641
Bengbu5959/386−0.418−0.581−3.01520.258
Ma’anshan4049/226−0.151−0.110−1.0893.822
Fuyang10,118/1074−0.140−0.502−1.01017.499
Huangshan9678/147−0.100−0.093−0.7203.237
Average −0.136−0.197−0.9806.870
Table 5. Elasticity of energy intensity in cities of Anhui Province based on electricity infrastructure.
Short-Term ElasticityLong-Term Elasticity
CityArea (km2)/
Population (Million)
Electricity to
Energy Intensity
Electricity to
Energy Intensity
Bozhou8429/670−0.001−4.187
Lu’an15,351/5810.027−3.123
Hefei11,496/800−0.002−2.727
Anqing13,528/523−0.002−3.061
Xuancheng12,340/2750.049−5.243
Suzhou9787/6580.028−3.936
Huainan5650/3870.207−17.213
Chuzhou13,433/4530.070−9.780
Wuhu6026/387−0.000−3.831
Huaibei2732/2180.046−7.332
Tongling2992/1680.019−6.672
Bengbu5959/3860.163−23.273
Ma’anshan4049/226−0.041−4.910
Fuyang10,118/10740.362−18.508
Huangshan9678/147−0.007−3.957
Average 0.061−7.850
Disclaimer/Publisher’s Note: The statements, opinions and data contained in all publications are solely those of the individual author(s) and contributor(s) and not of MDPI and/or the editor(s). MDPI and/or the editor(s) disclaim responsibility for any injury to people or property resulting from any ideas, methods, instructions or products referred to in the content.

