Abstract
Urban heat island (UHI) effect significantly influences the urban sustainability and health of cities and varies seasonally. However, spring and autumn have received less attention. Furthermore, research on long-term seasonal UHI changes and impacts is insufficient. This study examines the seasonal spatiotemporal dynamics and gradient characteristics of UHI in spring, summer, autumn, and winter in Changsha, a typical subtropical “furnace city” from 2006 to 2022. (1) Spatiotemporal dynamics: The high-temperature UHI (relatively high-temperature zone and high-temperature zone) range expands most significantly in spring and least in autumn. Additionally, the UHI migrates northward within the study area, and proximity to the urban core results in multiple high-temperature UHI effects. (2) Gradient characteristics: The proportion of the high-temperature UHI in spring, summer, autumn, and winter decreases to varying degrees within the 5 km gradient from the central point, but increases within the 6–8 km and 11–13 km gradients, especially in spring and autumn. Additionally, within the 8 km gradient in spring, the aggregation index (AI), contagion index (CONTAG), and largest patch index (LPI) decreased, with UHI patches more affected by these metrics in autumn. Overall, this study offers new insights into the seasonal effects and development of UHI, which are crucial for addressing climate change, promoting sustainability, and improving human well-being.
1. Introduction
Currently, the world is facing the acute challenge of global warming [1]. The UHI, characterized by significantly higher temperatures in urban central areas compared to surrounding regions [2], is a significant area of global warming research [3]. Global urban heat islands demonstrate distinct regional characteristics and seasonal and latitudinal variations. Seasonal variations reveal distinct behaviors in the warm temperate and snow zones. A marked latitudinal disparity is evident between 10° S and 20° S [4]. Understanding the variation patterns and causes of UHI is crucial for controlling their intensity and mitigating their expansion. The pollutants and persistent high temperatures concentrated in UHI can cause respiratory diseases, skin conditions, and psychological problems [5,6,7]. Heat stroke, for instance, has a mortality rate exceeding 70% [8]. The formation of UHI is closely linked to rapid urbanization [9], which leads to changes in land surfaces, increased artificial heat sources, air pollution, and population growth [10,11,12]. Due to continuous urbanization and global warming, the heat island effect in spring and autumn has gradually emerged [13,14]. This phenomenon is particularly evident in subtropical regions [15,16], which are characterized by warm winters, hot summers, and distinct seasonal climates.
Due to cloud cover and the temporal limitations of high-resolution remote sensing data, studies of UHI have primarily focused on summer and winter, often characterizing a single day [17,18]. Research on the spring and autumn seasons remains limited. In terms of gradients, most existing studies analyze the seasonal variation patterns of heat island intensity along the urban development gradient [19,20] within the same or adjacent years [21,22,23], but the time span is relatively short. Furthermore, long-term climate change cumulatively affects the seasonal dynamics of the urban heat island. A significant correlation links early warming in spring to prolonged heat island duration, and this cross-seasonal interaction may alter the urban energy balance, particularly in subtropical cities with distinct vegetation phenological characteristics [24]. Additionally, subtropical cities endure consistently high temperatures in summer, coupled with a unique combination of high temperatures and high humidity, including precipitation regulation during the Meiyu season, which results in heterogeneous urban heat island effects [25]. Therefore, researching the four-season variation trend and spatial gradient of the heat island effect in subtropical cities over a long time span can effectively reveal its patterns and causes. UHI studies primarily utilize atmospheric temperature [26] or land surface temperature [27] as data sources. Atmospheric temperature data offer high accuracy and temporal continuity [28], but the limited distribution of meteorological stations makes large-scale temperature data collection challenging [29]. Conversely, surface temperature data rely on the wide coverage of thermal band satellite products, allowing convenient large-scale data acquisition [30]. The MODIS and Landsat series satellites are widely used among satellite products due to their short data acquisition cycles and low costs [31,32]. MODIS data are more frequently used in studies of heat island changes at global and urban agglomeration scales [4,33]. Landsat data, with its higher resolution and accuracy, are more commonly used in urban-scale studies [34,35].
Changsha City, located in a typical subtropical area of China, is often referred to as a “furnace city” [36], which is a popular online term nowadays. Each year, China’s Climate Center “http://ncc-cma.net/cn (accessed on 28 June 2024)” releases rankings of furnace cities based on the number of days with daily maximum temperatures of ≥35 °C and at least 60 continuous high-temperature days “https://www.wikipedia.org/ (accessed on 28 June 2024)”. Most of these furnace cities are located in China’s subtropical regions, with Changsha consistently ranking highly “https://baike.baidu.com/ (accessed on 28 June 2024)”. The rapid urbanization of Changsha City began in the early 20th century, and the UHI phenomenon has gradually emerged and intensified [37,38]. This research aims to: (1) reveal the spatiotemporal differentiation characteristics and variation patterns of the heat island effect in Changsha across four seasons; (2) clarify the spatial gradient characteristics and variation patterns of the UHI before and after rapid urbanization in Changsha; and (3) explore the causes of the UHI in Changsha and propose strategies for mitigating the heat island effect.
2. Materials and Methods
2.1. Study Area
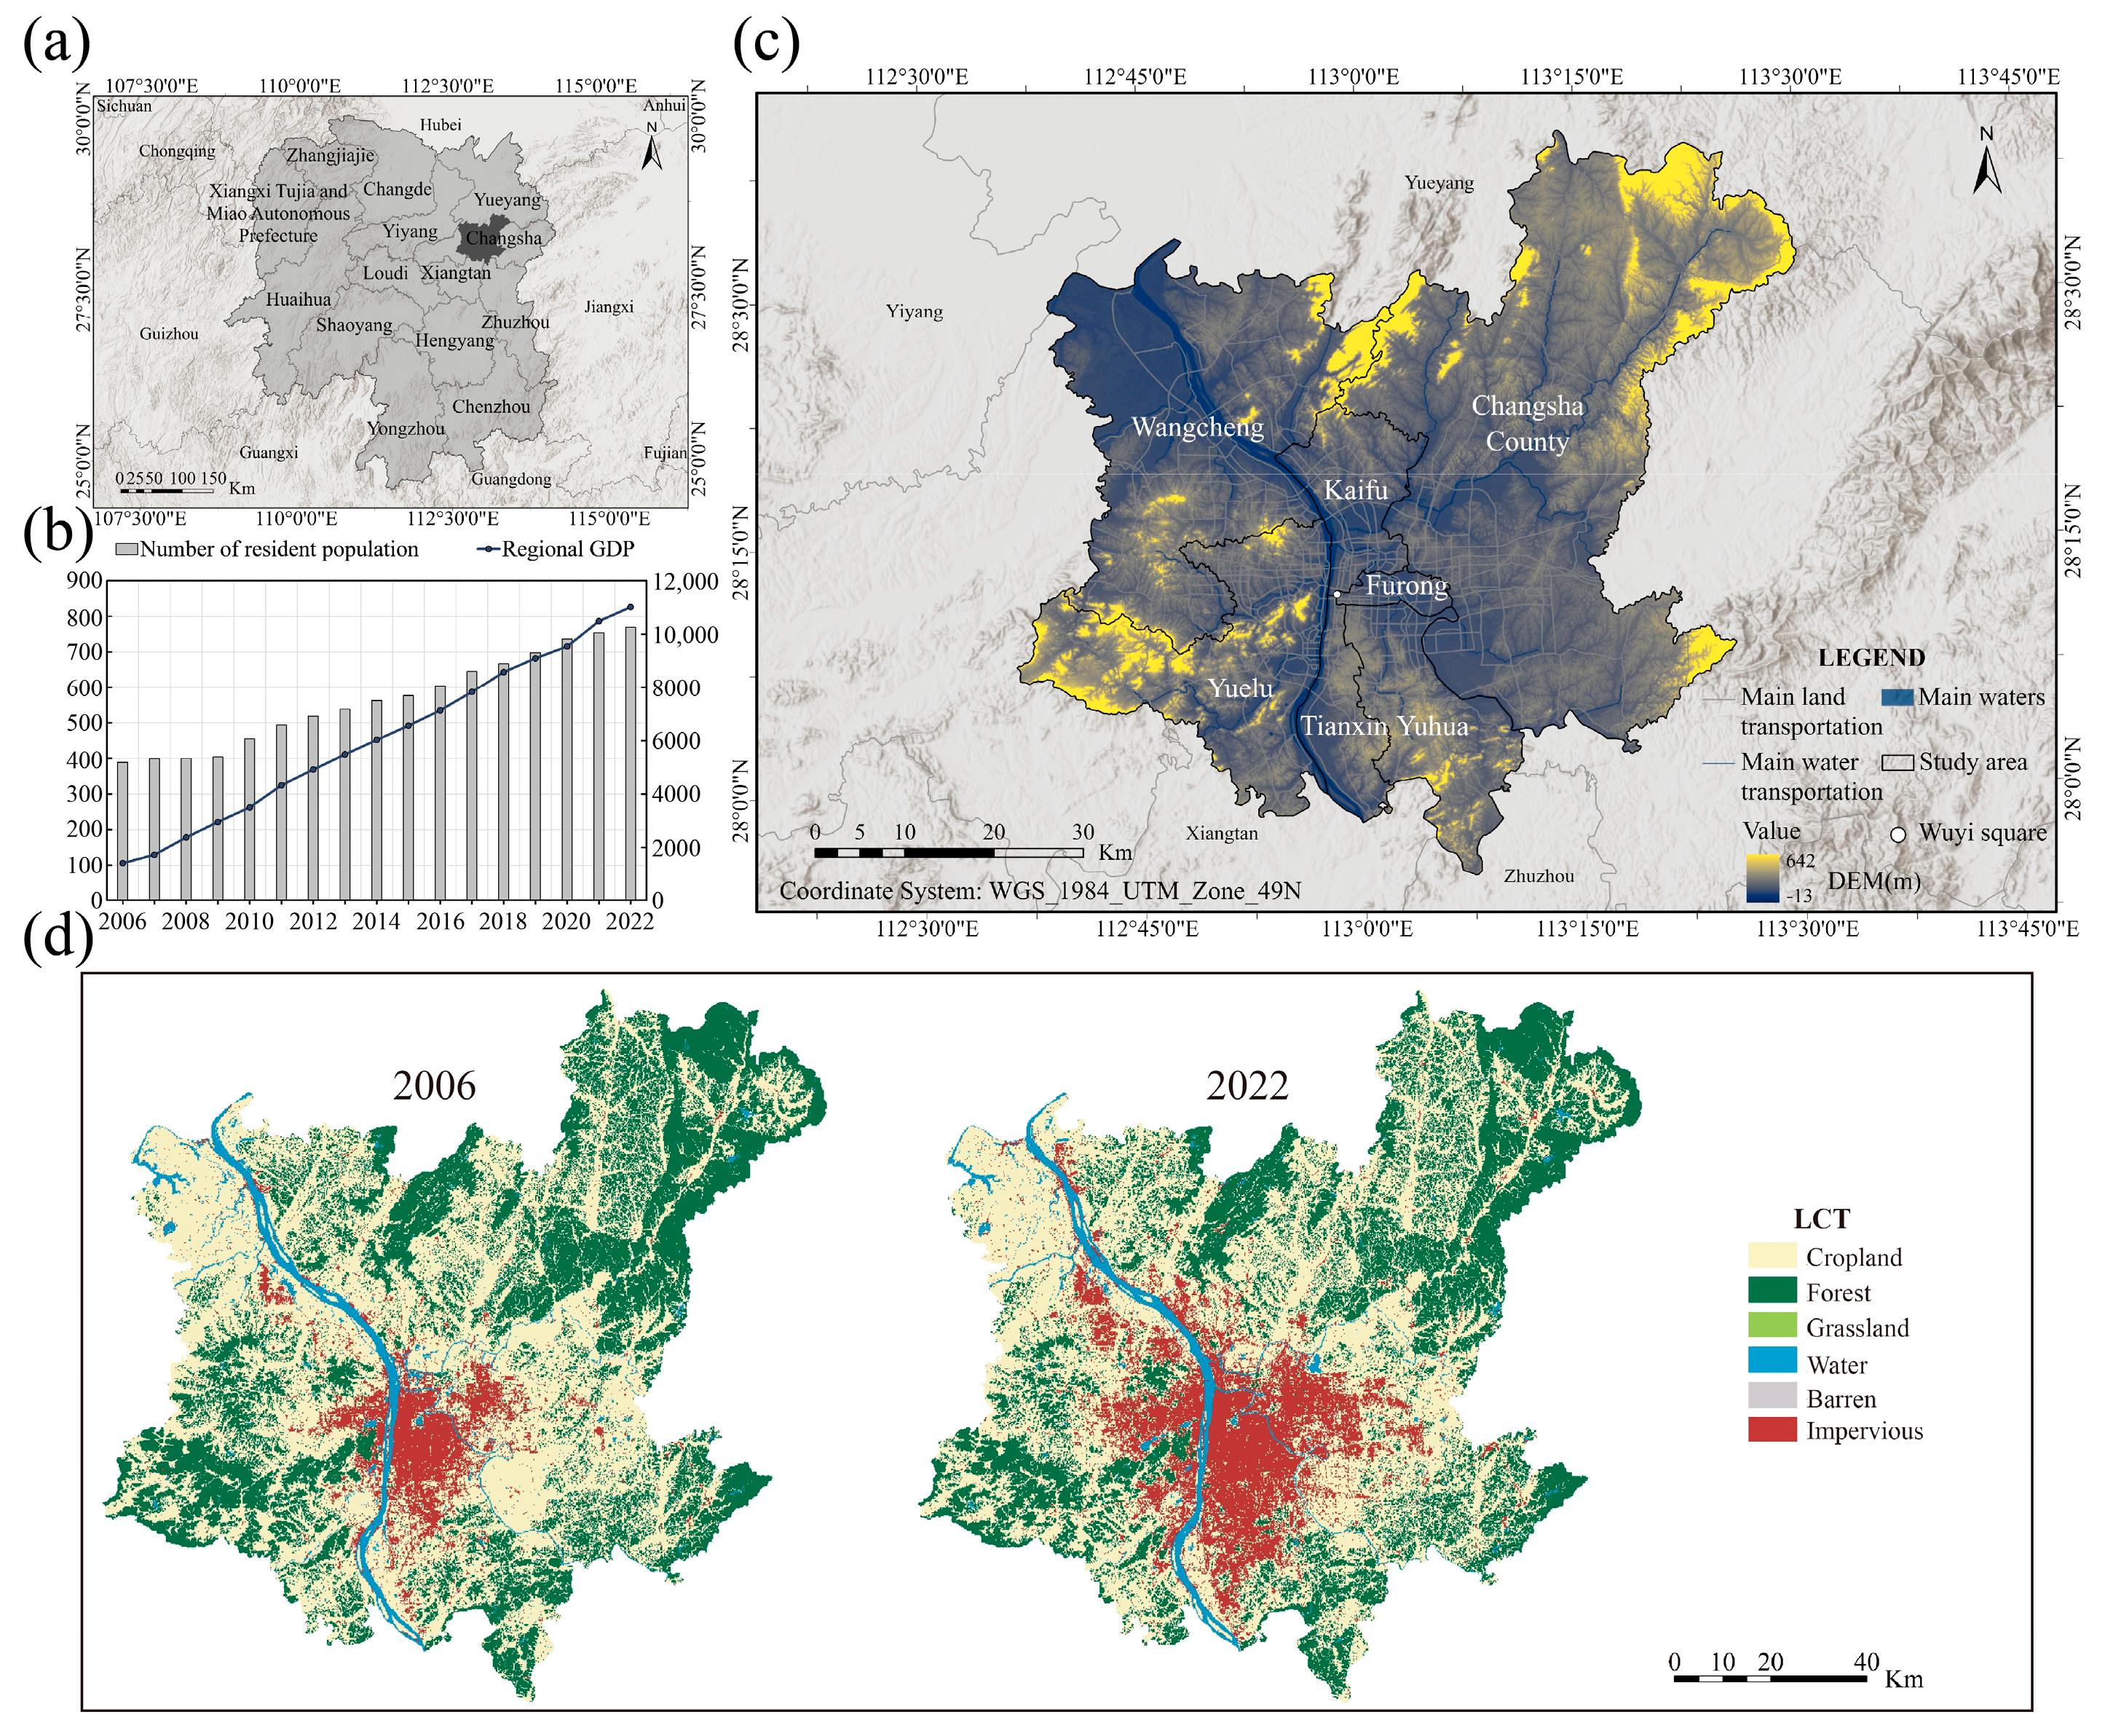
Changsha, a megacity and the provincial capital of Hunan Province “https://www.stats.gov.cn/ (accessed on 28 June 2024)”, is located in the middle and lower reaches of the Yangtze River (Figure 1a), spanning 111°53′ to 114°15′ east longitude and 27°51′ to 28°40′ north latitude, within the subtropical monsoon climate zone. The average annual precipitation is 1362 mm, with an average temperature of 18.5 °C over the past decade. To reflect the status of the heat island effect, Changsha County and the built-up areas of Changsha City were chosen as the study area, covering a total area of 3910.03 km2 (Figure 1c). Additionally, economic growth (GDP) and population increase propel urban infrastructure expansion and land-use changes (Figure 1d), leading to and exacerbating the UHI effect. This effect intensifies with urbanization, with GDP and population size as key indicators. Over the past 15 years, Changsha has experienced rapid urbanization in terms of economy and population [39], particularly from 2009 to 2019 (Figure 1b). With a three-year buffer period, 2006 and 2022 are designated as the time nodes before and after rapid urbanization.
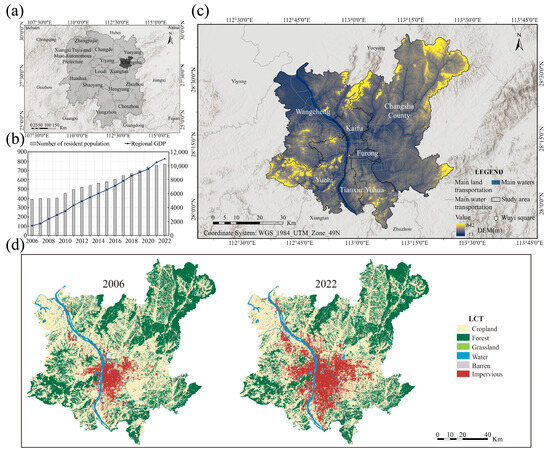
Figure 1.
Study area. (a) Hunan Province; (b) the trend of the permanent population and local GDP within the study region from 2006 to 2022. The horizontal axis indicates the year. The left vertical axis depicts the number of permanent residents (10,000 persons), while the right vertical axis represents the local GDP value (100 million yuan); (c) study region; (d) land cover types (LCT) of the study area during the period from 2006 to 2022.
2.2. Datasets
Based on Landsat 5 and 8 data, and considering the climatic characteristics of the four subtropical seasons, spring spans from March to May, summer from June to August, autumn from September to November, and winter from December to February [40]. Secondly, the satellite orbit row and column numbers are consistently 123/40 and 123/41, respectively, with transit times occurring at approximately 02:50 and cloud cover typically below 10%. Furthermore, the land cover data originated from the 30 m Annual China Land Cover Dataset (CLCD) provided by Wuhan University [41].
2.3. Methods
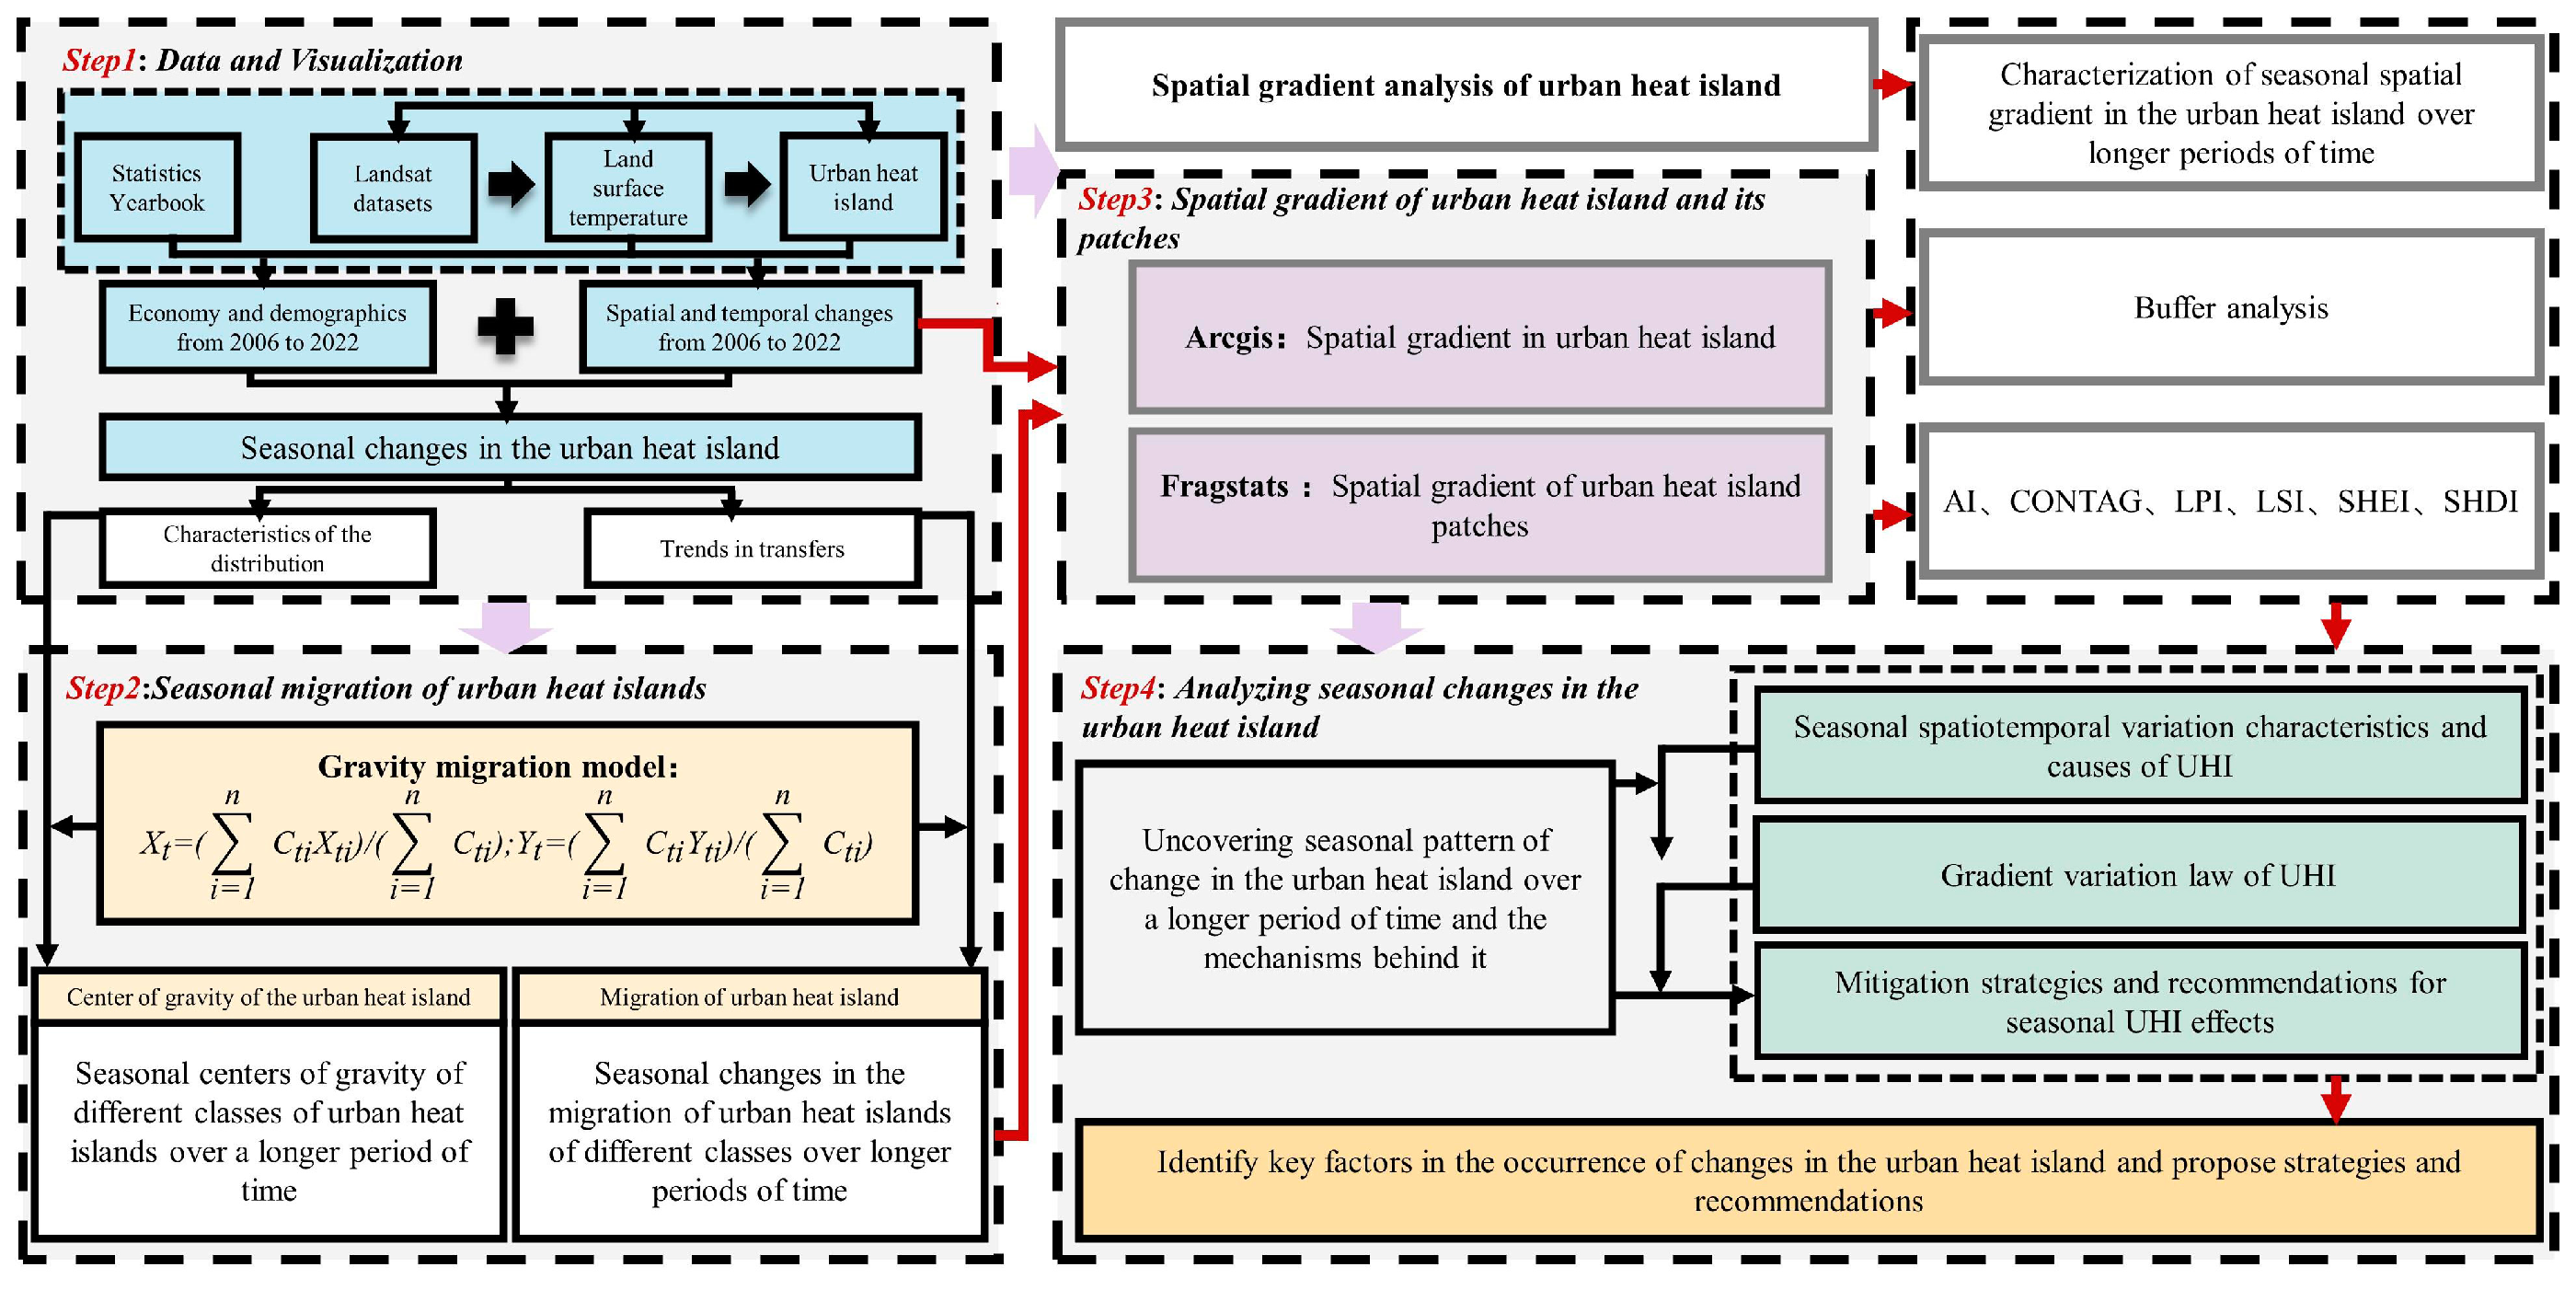
Based on data from the Changsha Statistical Yearbook and the development of the urban economy and population over the past 15 years, this study determined the study period. The land surface temperature was inverted, the urban heat island index was calculated, and the heat island level was classified. Using methods including the transition matrix, gravity migration model, and spatial gradient analysis, this study explores the seasonal spatiotemporal variation traits and migration patterns of the UHI in Changsha City from 2006 to 2022, as well as the spatial gradient of the heat islands and their patches (Figure 2).
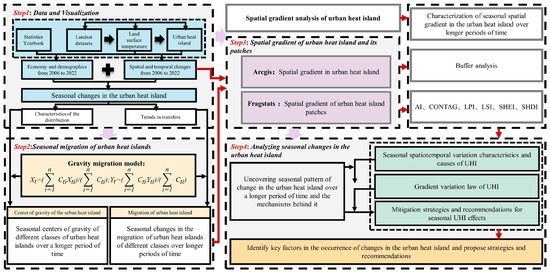
Figure 2.
Flow chart of this study.
2.3.1. Land Surface Temperature Retrieval and Classification of UHI
This study employed the radiative transfer equation algorithm using ENVI 5.3 to retrieve the land surface temperature. The fundamental principle involves initially estimating the atmospheric impact on the surface thermal emission. Subsequently, this atmospheric impact is subtracted from the total thermal radiation observed by the satellite sensor to determine the surface thermal radiation intensity. This intensity is then converted into the corresponding land surface temperature [42]. The process can be represented by the following formula:
denotes the thermal infrared radiation luminance received by the satellite sensor; represents the upward radiation luminance of the atmosphere; denotes the energy reflected after the atmosphere’s downward radiation reaches the ground; represents the blackbody thermal radiation luminance; is the transmissivity of the atmosphere in the thermal infrared band; is the surface emissivity, calculated using the NDVI threshold method proposed by Sobrino [43]; the values for , , and were obtained from the NASA Atmospheric Correction Parameter Calculator [44]. is the actual surface temperature, which can be determined using the Planck formula (Formula (3)):
and are calibration coefficients. For Landsat 5, = 607.76 W/m−2·sr·µm and = 1260.56 K; for Landsat 8, = 774.89 W/m−2·sr·µm and = 1321.08 K.
To verify the accuracy of the Landsat data inversion of land surface temperature, a 3 km × 3 km grid was created in the study area based on the resolution of the raster data, and Pearson correlation analysis was performed between the retrieved land surface temperature and the average value of MODIS (MOD11A2) products in 200 effective grids [45]. The reliability of the land surface temperature data retrieved from Landsat was further verified (Figure S1).
The land surface temperature was standardized using the extreme value normalization method. Due to the distinct imaging times of the remote sensing images, the mean-standard deviation methodology, effective in characterizing the distribution features of the heat island effect [46], was employed to categorize the heat island into five zones: low-temperature zone (LTZ) (Tb ≤ μ-std), relatively low-temperature zone (RLTZ) (μ-std < Tb ≤ μ-0.5std), medium-temperature zone (MTZ) (μ-0.5std < Tb ≤ μ + 0.5std), relatively high-temperature zone (RHTZ) (μ + 0.5std < Tb ≤ μ + std), and high-temperature zone (HTZ) (Tb > μ + std). Here, μ represents the mean of the standardized surface temperature, and std represents the standard deviation.
2.3.2. Spatiotemporal Dynamics of the UHI
The transfer matrix was used to calculate the various grades of land surface temperature and the transfer of UHI in spring, summer, autumn, and winter from 2006 to 2022, quantitatively depicting the temporal variation features of land surface temperature and UHI in different periods and seasons. Subsequently, the gravity migration model (Formula (4)) was used to analyze the migration characteristics of heat islands of different grades in different time intervals, thereby understanding the spatial trend and direction of them.
and denote the barycentric coordinates of heat islands of different grades in year t, weighted by their areas. and represent the geometric center coordinates of the i-th patch of heat islands in year t. indicates the area of the i-th patch in year t. Finally, n denotes the total number of patches with distinct heat island types in year t.
2.3.3. Gradient Analysis of the UHI
Wuyi Square, the urban origin point of Changsha City “http://zygh.changsha.gov.cn/ (accessed on 28 June 2024)”, was chosen as the central point, and buffer zones were created at 1 km intervals. To ensure all values were within the study area, 18 buffer zones were established. Using Fragstats software, indices such as the Aggregation Index (AI), Contagion Index (CONTAG), Largest Patch Index (LPI), Shape Index (LSI), Shannon’s Evenness Index (SHEI), and Shannon’s Diversity Index (SHDI) were selected to explore the changes in aggregation, fragmentation, equilibrium, and diversity of the heat island patches, quantitatively delineating their spatial gradient variations.
To effectively investigate changes in the heat island spatial gradient, determining the optimal moving window size is essential. A comparative analysis of moving window sizes (900 m, 1800 m, 2700 m, 3600 m, and 4500 m) was conducted based on the study area scope and data resolution. The optimal moving window size was selected based on curve smoothness and richness. The landscape pattern index curves for the 900 m and 1800 m moving window scales were insufficiently smooth, exhibited weak regularity, and showed substantial fluctuations. The landscape pattern index curves for the 3600 m and 4500 m moving window scales had relatively low richness, overlooked some detailed changes, and could not effectively represent the landscape pattern change. The landscape index curve for the 2700 m moving window showed the most favorable smoothness and richness, and the calculated index change characteristics more accurately reflected changes in the spatial pattern of the heat island patches in the study area. Therefore, this study utilized the 2700 m moving window scale to represent the spatial gradient variations of the heat island.
3. Results
3.1. Analysis of Spatiotemporal Changes in Land Surface Temperature in Changsha City
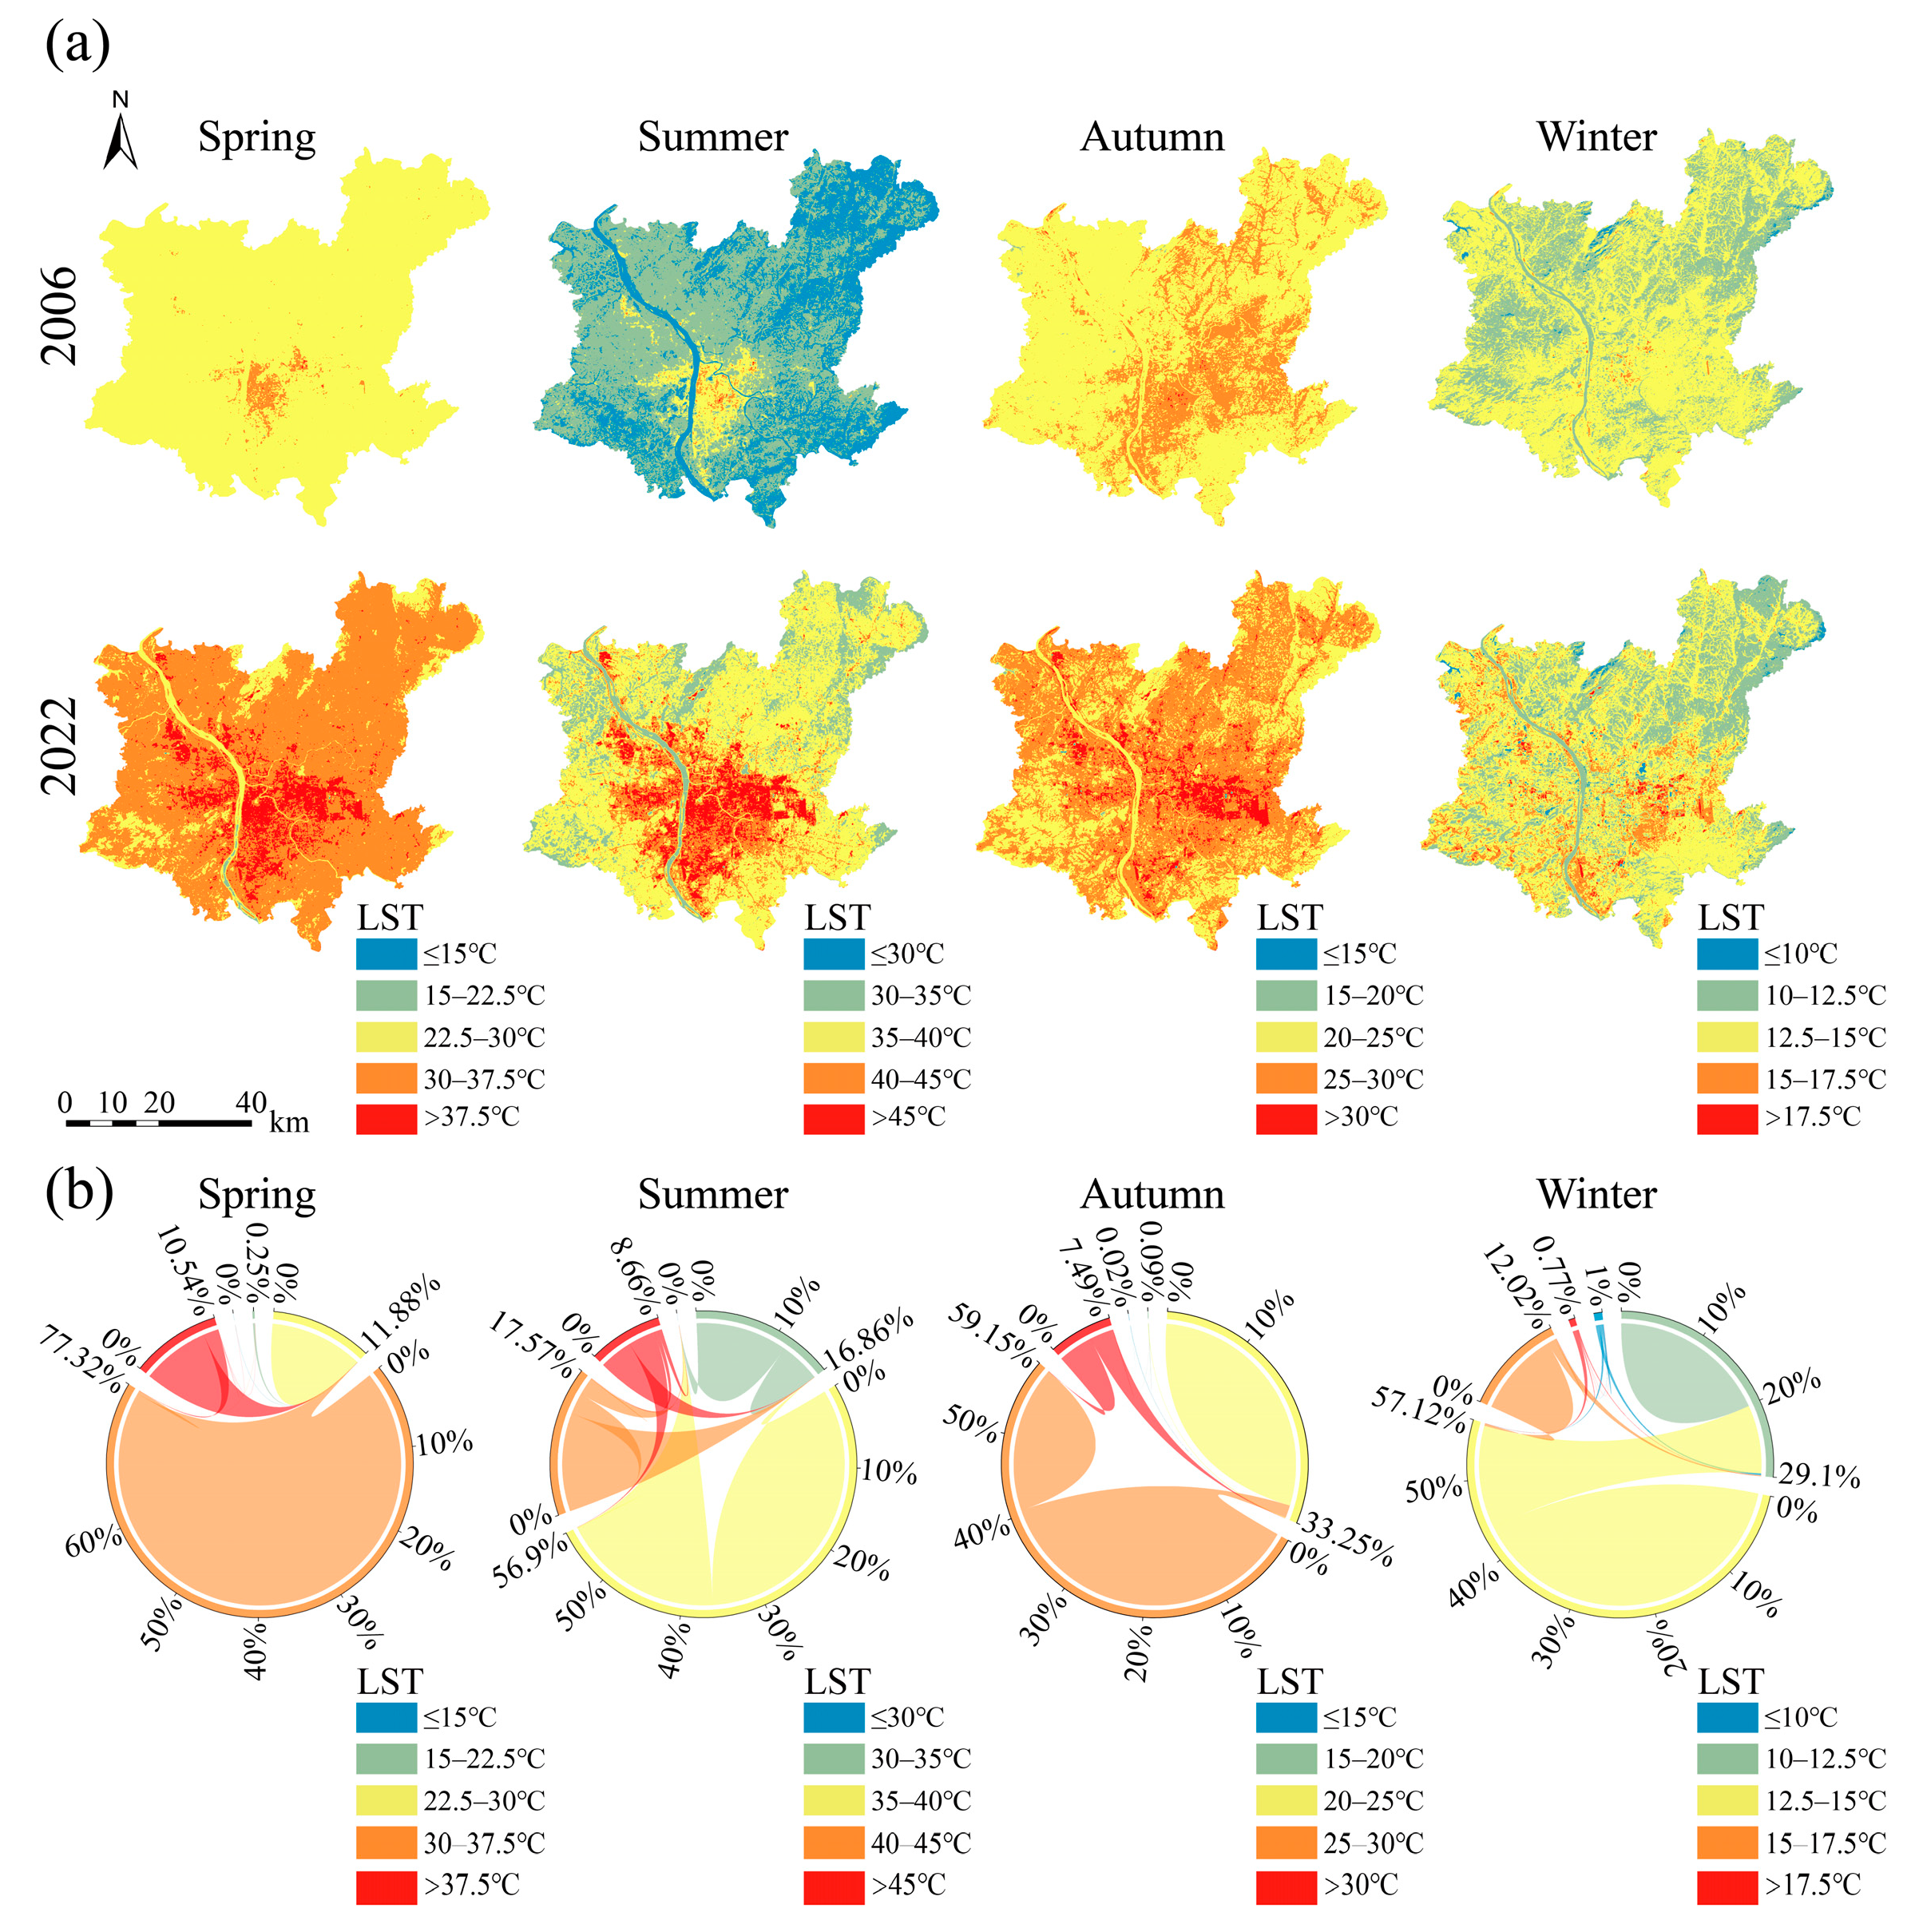
Figure 3a illustrates the seasonal spatial variation pattern of land surface temperature in Changsha City from 2006 to 2022, categorizing the temperature into five distinct intervals [47]. Specifically, the low-level land surface temperature zones for spring, summer, autumn, and winter are ≤15 °C, ≤30 °C, ≤15°C, and ≤10 °C, respectively; the relatively low-level zones are 15–22.5 °C, 30–35 °C, 15–20 °C, and 10–12.5 °C, respectively; the medium-level zones are 22.5–30 °C, 35–40 °C, 20–25 °C, and 12.5–15 °C, respectively; the relatively high-level zones are 30–37.5 °C, 40–45 °C, 25–30 °C, and 15–17.5 °C, respectively; and the high-level zones are >37.5 °C, >45 °C, >30 °C, and >17.5 °C, respectively (Table 1).

Figure 3.
Seasonal variation characteristics of land surface temperature in Changsha City from 2006 to 2022 (a). Seasonal transitions of land surface temperature categories in Changsha City from 2006 to 2022 (b).

Table 1.
Characteristics of land surface temperature in Changsha City from 2006 to 2022 (unit: °C).
In 2006, medium-level land surface temperature zones were predominant in spring and autumn. During summer and winter, relatively low-level land surface temperature zones were widely distributed. In 2022, during spring and summer, high-level land surface temperature zones in Changsha City concentrated in the urban core and significantly expanded towards surrounding areas. Low-level and relatively low-level land surface temperature zones nearly vanished in spring and autumn and were only present in the peripheral regions of the city during summer and winter.
Figure 3b shows that the seasonal transfer characteristics of different land surface temperature grades in Changsha City from 2006 to 2022 indicate that relatively high-level land surface temperature domains in spring and autumn are long-term stationary regions. In summer and winter, medium-level land surface temperature domains are stationary. Additionally, transfers in spring and autumn mainly occur among high-level, relatively high-level, and medium-level land surface temperature domains, whereas in winter, they primarily occur among low-level, relatively low-level, and medium-level domains.
Overall, from 2006 to 2022, high-level land surface temperature domains in the study area showed a marked expansion trend, with their distribution varying by season. A notable feature is that high-level land surface temperature domains are frequently concentrated in the urban core area. Moreover, transfer patterns among land surface temperature domains in spring, summer, autumn, and winter are distinct. Transfers among high-level, relatively high-level, and medium-level land surface temperature domains occur frequently, but low-level and relatively low-level domains do not predominate.
3.2. Analysis of the Spatiotemporal Dynamics of the UHI in Changsha City
3.2.1. Analysis of the Spatiotemporal Variations of UHI from 2006 to 2022
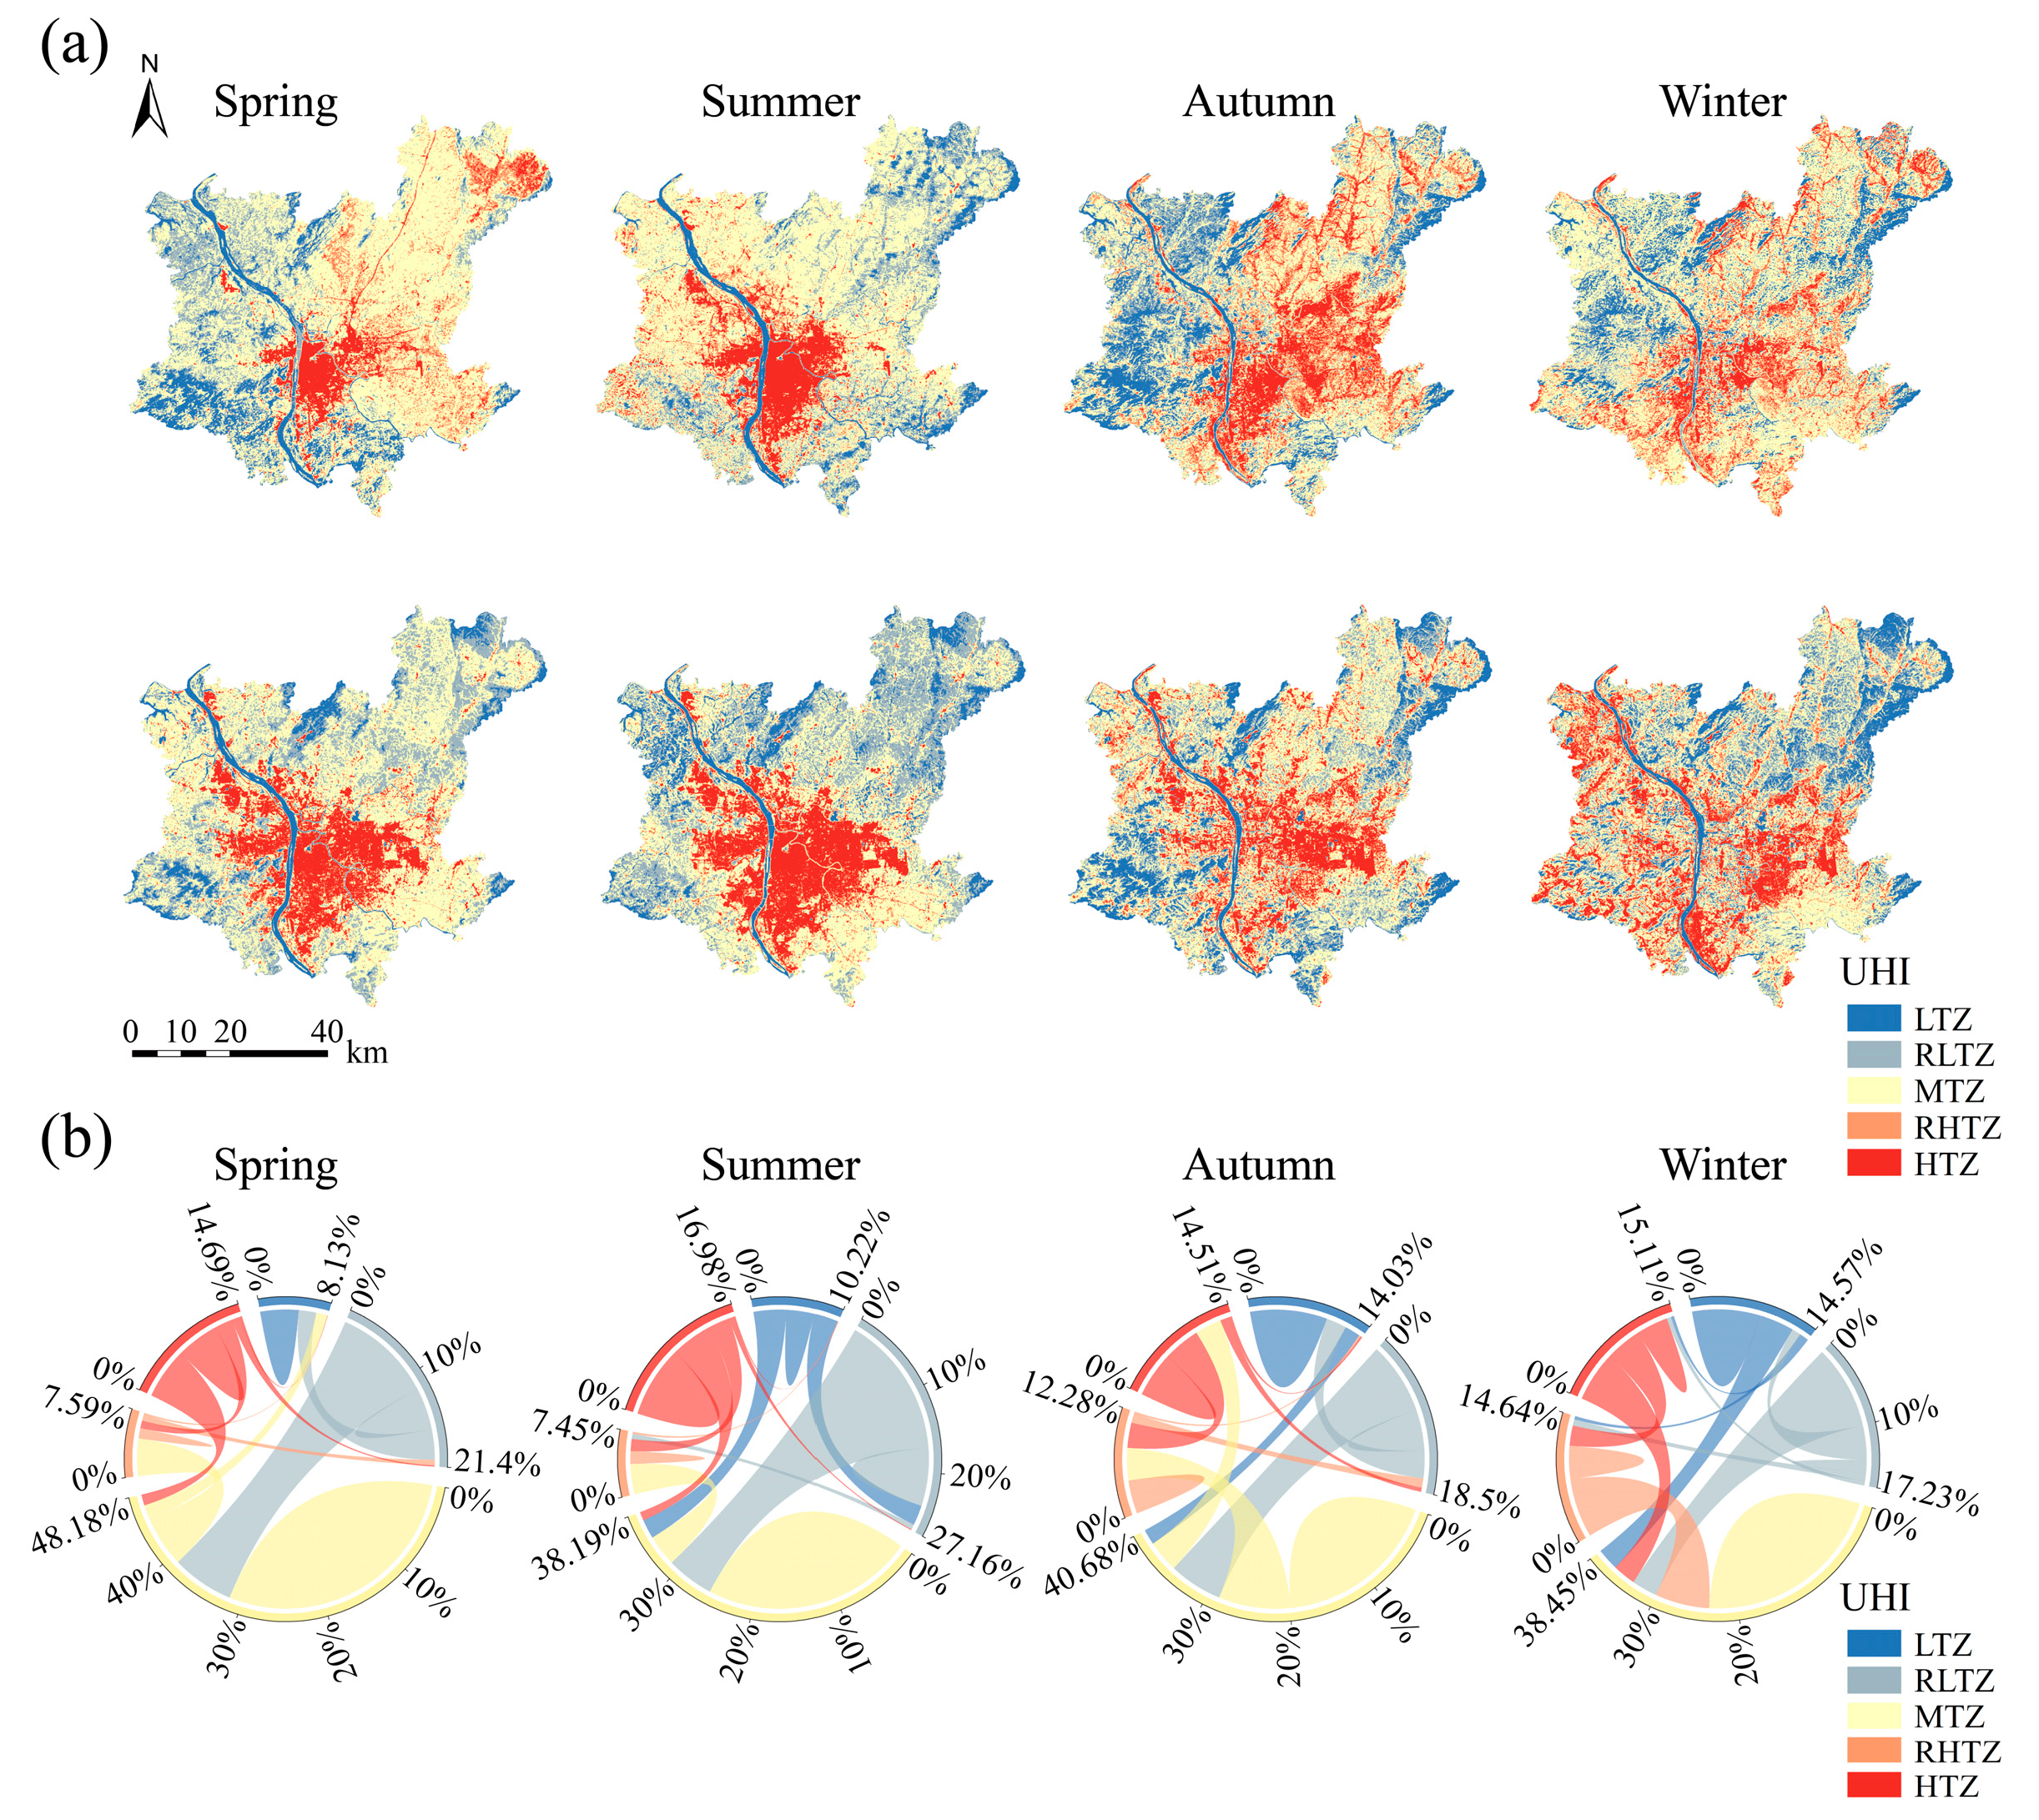
Figure 4a illustrates the seasonal spatial variation pattern of the UHI in Changsha City from 2006 to 2022, with heat island intensity categorized into five intervals ranging from low to high. In 2006, high-temperature UHI in spring and summer were predominantly concentrated in the urban core. In autumn and winter, high-temperature UHI were dispersed across the eastern and southern regions of the city. In 2022, the extent of high-temperature UHI in spring, summer, and winter expanded significantly, while the MTZ contracted overall. Between 2006 and 2022, the distribution patterns of high-temperature UHI exhibited distinct seasonal variations: centralized in the urban core during spring and summer, distributed in a linear pattern during autumn, and scattered in a patchy pattern during winter.
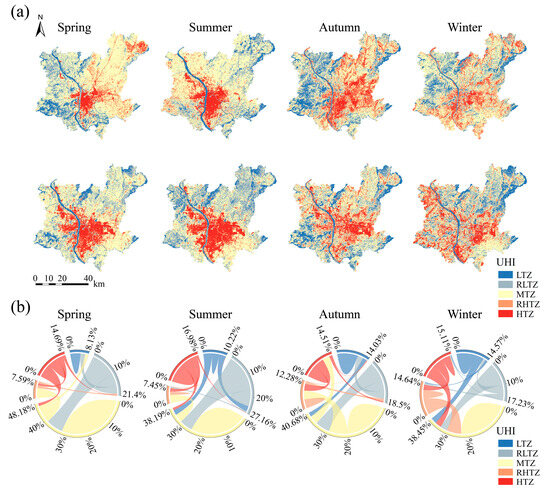
Figure 4.
Illustrates the seasonal variation characteristics of the heat island effect in Changsha City from 2006 to 2022 (a). Depicts the seasonal transitions of various heat island categories in Changsha City from 2006 to 2022 (b).
Figure 4b illustrates that from 2006 to 2022, the proportions of high-temperature UHI in spring, summer, autumn, and winter were 22.28%, 24.52%, 26.79%, and 29.75%, respectively, while low-temperature cold islands (LTZ and RLTZ) accounted for 29.53%, 37.38%, 32.53%, and 31.80%, respectively. Furthermore, the area of heat island transformation was largest in winter in Changsha City, at 2309.06 km2, followed by autumn at 2208.52 km2, with the smallest area of transformation in spring at 2050.16 km2. This may be associated with the heat island solidification in spring. The highest proportion of transfers out of high-temperature UHI occurred in autumn, at 38.83%, followed by winter at 31.5%, with the lowest proportion in summer at 17.87%. This suggests a potential phenomenon of heat island degradation in autumn.
In 2006, the areas of the LTZ in spring and autumn were 413.14 km2 and 592.19 km2, respectively, whereas the HTZ covered 295.05 km2 and 508.62 km2, respectively. By 2022, the areas of the LTZ in spring and autumn had decreased to 318.07 km2 and 548.68 km2, respectively, while those of the HTZ had increased to 574.31 km2 and 567.48 km2, respectively. Between 2006 and 2022, the LTZ areas in summer and winter decreased by −69.14 km2 and 42.78 km2, respectively, corresponding to reduction rates of −17.30% and 7.51%, respectively. In contrast, the areas of the HTZ in summer and winter increased by 223.94 km2 and 198.80 km2, respectively, reflecting growth rates of 50.91% and 50.73%, respectively. In spring and autumn, the reduction rates for the LTZ were 29.89% and 7.93%, respectively, while the growth rates for the HTZ were 94.65% and 11.57%, respectively (Table 2).
Table 2.
Characteristics of changes in different grades of UHI in Changsha City from 2006 to 2022 (Unit: km2). LTZ, RLTZ, MTZ, RHTZ, and HTZ represent different UHI levels.
Overall, from 2006 to 2022, the high-temperature UHI in Changsha City exhibited different expansion trends across seasons, while the ranges of low-temperature cold islands and MTZ were significantly compressed. The expansion of high-temperature UHI in Changsha may result from the urbanization process and population growth, leading to the expansion of impermeable surfaces and the reduction of forested areas (Figure 1d). Additionally, the distinctive characteristics of the subtropical climate may exacerbate this phenomenon. Among the areas undergoing transformation, the net transfer-in (transfer-in minus transfer-out) area of low-temperature cold islands was the largest in summer, while the net transfer-in area of high-temperature UHI was the largest in spring. The coverage range of the MTZ has been continuously decreasing across all four seasons. Notably, the reduction rate of the LTZ in spring is higher than in other seasons, while the growth rate of the HTZ in autumn is significantly lower compared to other seasons, especially spring. This indicates that heat island dynamics in spring and autumn differ from those observed in summer and winter.
3.2.2. Analysis of the Gravity Center Migration of UHI from 2006 to 2022
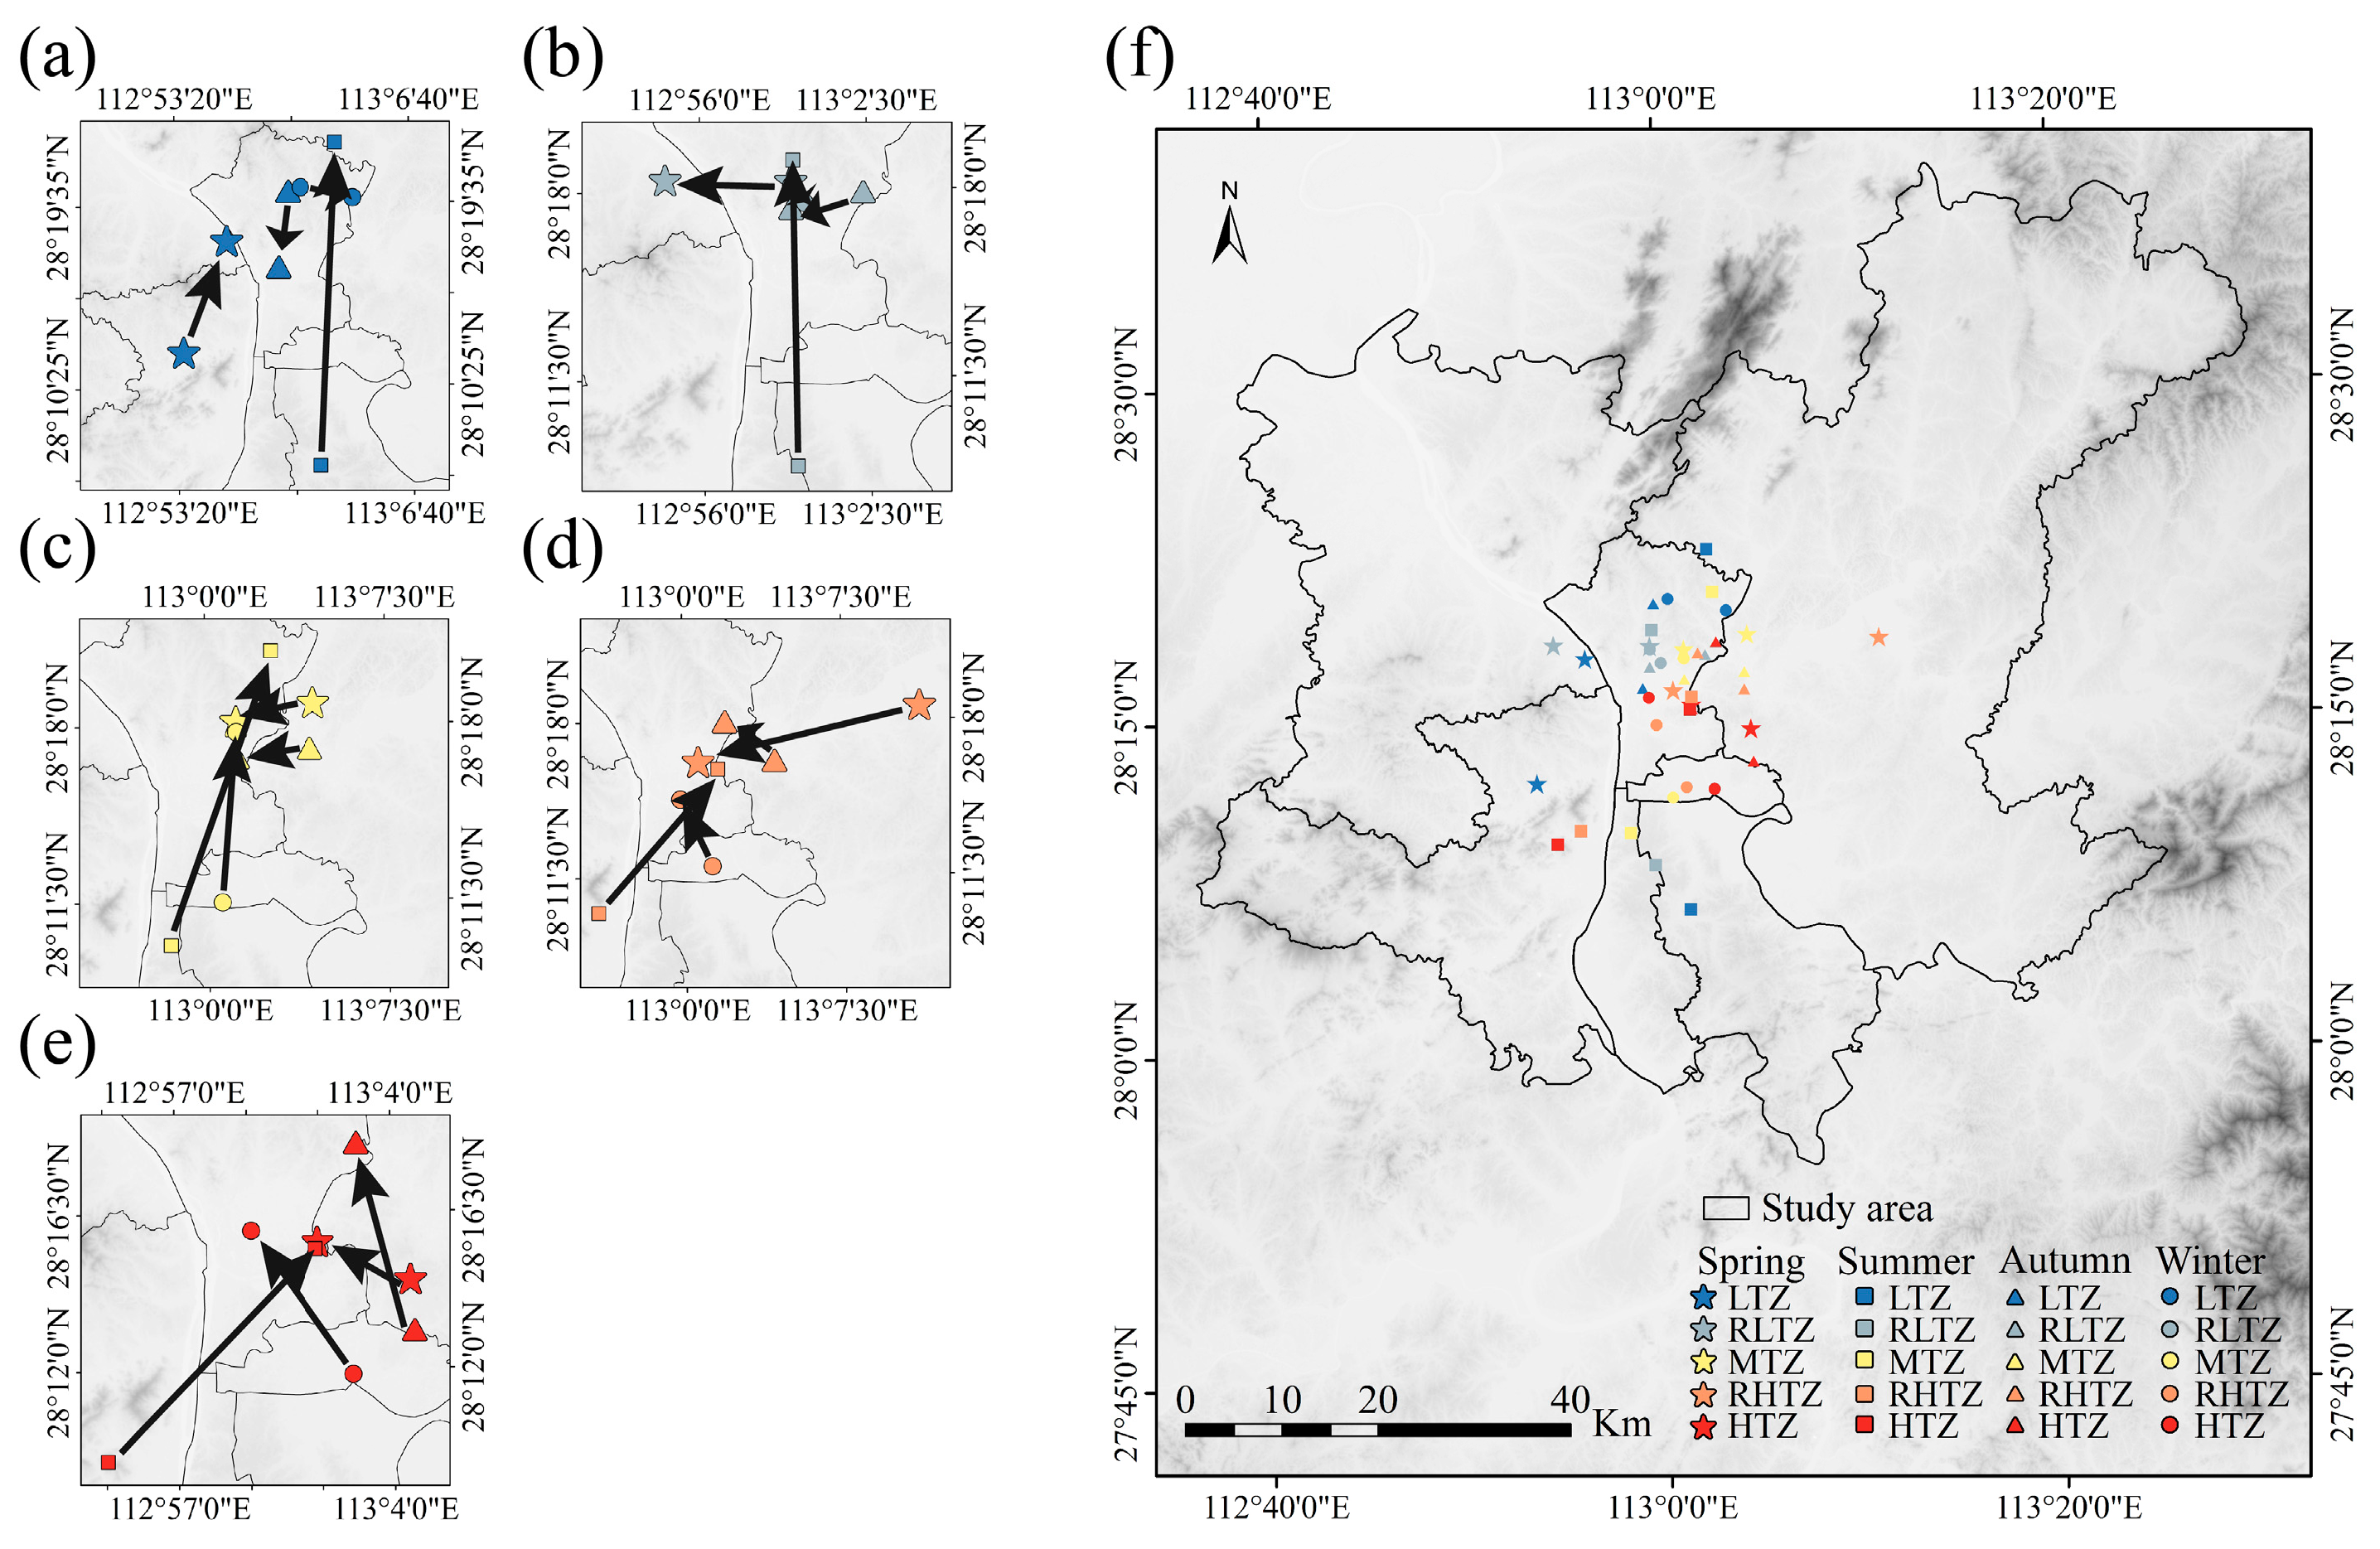
Figure 5 shows the gravity center migration of different grades of heat islands from 2006 to 2022. From 2006 to 2022, the migration of the RHTZ was the most significant in spring and concentrated towards the urban center at the same time, while the low-temperature cold island moved to the north of the city. In summer, the low-temperature cold island and the MTZ migrated from the south of the urban center to its north, and the high-temperature UHI increasingly concentrated in the northern area adjacent to the urban center. In autumn, the LTZ shifted towards the urban center but still remained far from the area adjacent to it. In winter, the MTZ and the HTZ underwent obvious migrations. Among them, the MTZ migrated to the north of the city, and the HTZ migrated to the northern area adjacent to the urban center. This may be related to the influence of meteorological factors, such as land use planning policies or local wind directions.
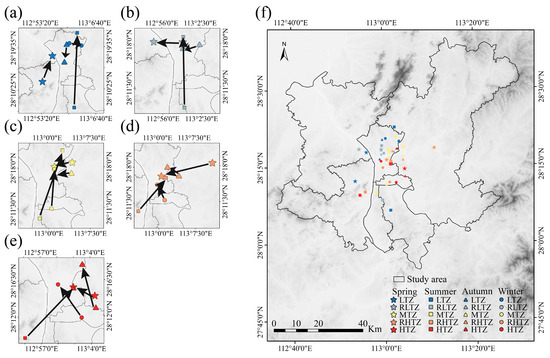
Figure 5.
Gravity center migration of different grades of UHI from 2006 to 2022. The arrowhead points to 2022, and the arrowtail faces 2006. A through f represent the gravity center migration of various temperature zones across different seasons from 2006 to 2022: (a) LTZ, (b) RLTZ, (c) MTZ, (d) RHTZ, (e) HTZ, and (f) each grade of UHI.
Overall, from 2006 to 2022, different grades of heat islands in Changsha City generally migrated to the north of the city. At the same time, the higher the heat island grade, the closer it is to the urban center. The high-temperature UHI in spring, summer, and autumn increasingly concentrated at the regional junction and were close to the urban core, while the low-temperature cold islands moved farther away from the urban center. This indicates that the seasonal transfer of urban high-temperature UHI is concentrated in this area, making it more likely to be affected by heat islands in multiple seasons. Additionally, the migration of heat islands of all grades was more pronounced in summer, but the changes in spring also warrant attention.
3.3. Spatial Gradient Analysis of UHI in Changsha City
Changsha City is classified as a central UHI city due to the concentration of the heat island effect in the core urban area and its surroundings. Selecting this area for the gradient analysis of the UHI reflects its conditions across different gradient belts of the city [48].
3.3.1. Spatial Gradient Analysis of UHI by Grade
Figure 6 shows that in 2006, within the gradient range of 6 km from the center point in spring and summer, the proportion of high-temperature UHI exceeded 60% and then declined consistently. In autumn and winter, within the gradients of 1 km and 6 km from the center point, high-temperature UHI prevailed. In 2022, within the gradient range of 5 km from the center point in spring, summer, autumn, and winter, the proportion of high-temperature UHI declined at varying rates. However, within the gradient range of 6–8 km or 11–13 km from the center point, there was a marked increase, especially in spring and autumn.
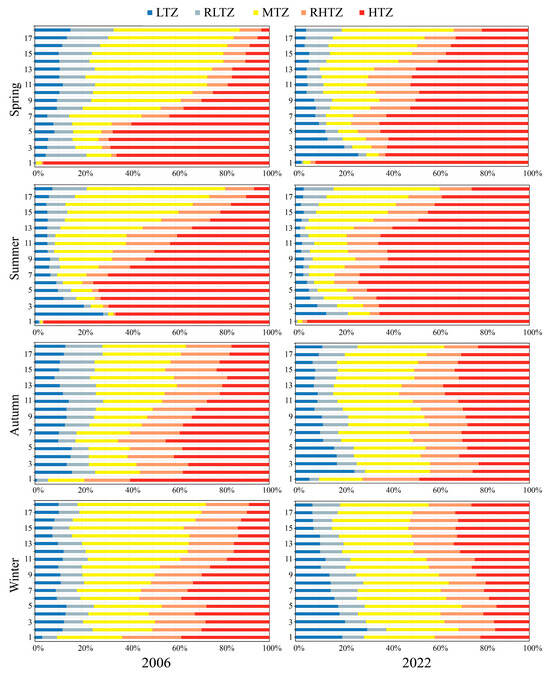
Figure 6.
Spatial gradient characteristics of UHI by grade in Changsha City (2006–2022). LTZ, RLTZ, MTZ, RHTZ, and HTZ represent different UHI levels. The vertical axis represents buffer distance from the center point (km), while the horizontal axis shows the area percentage of different-grade heat islands (%).
Overall, from 2006 to 2022, in spring, summer, autumn, and winter, the proportion of high-temperature UHI beyond the gradient range of 5 km from the center point increased, especially in spring and autumn and within the gradient range of 6–8 km and 11–13 km from the center point. Additionally, a notable observation is that the low-temperature cold islands in summer in 2006 presented an inverted “n” shape, while in other seasons they presented a trapezoidal shape. By 2022, the low-temperature cold islands in spring also presented an inverted “n” shape, which reflects that the high-temperature UHI are constantly moving away from the urban center.
3.3.2. Spatial Gradient Analysis of UHI Across Landscape Pattern Indices
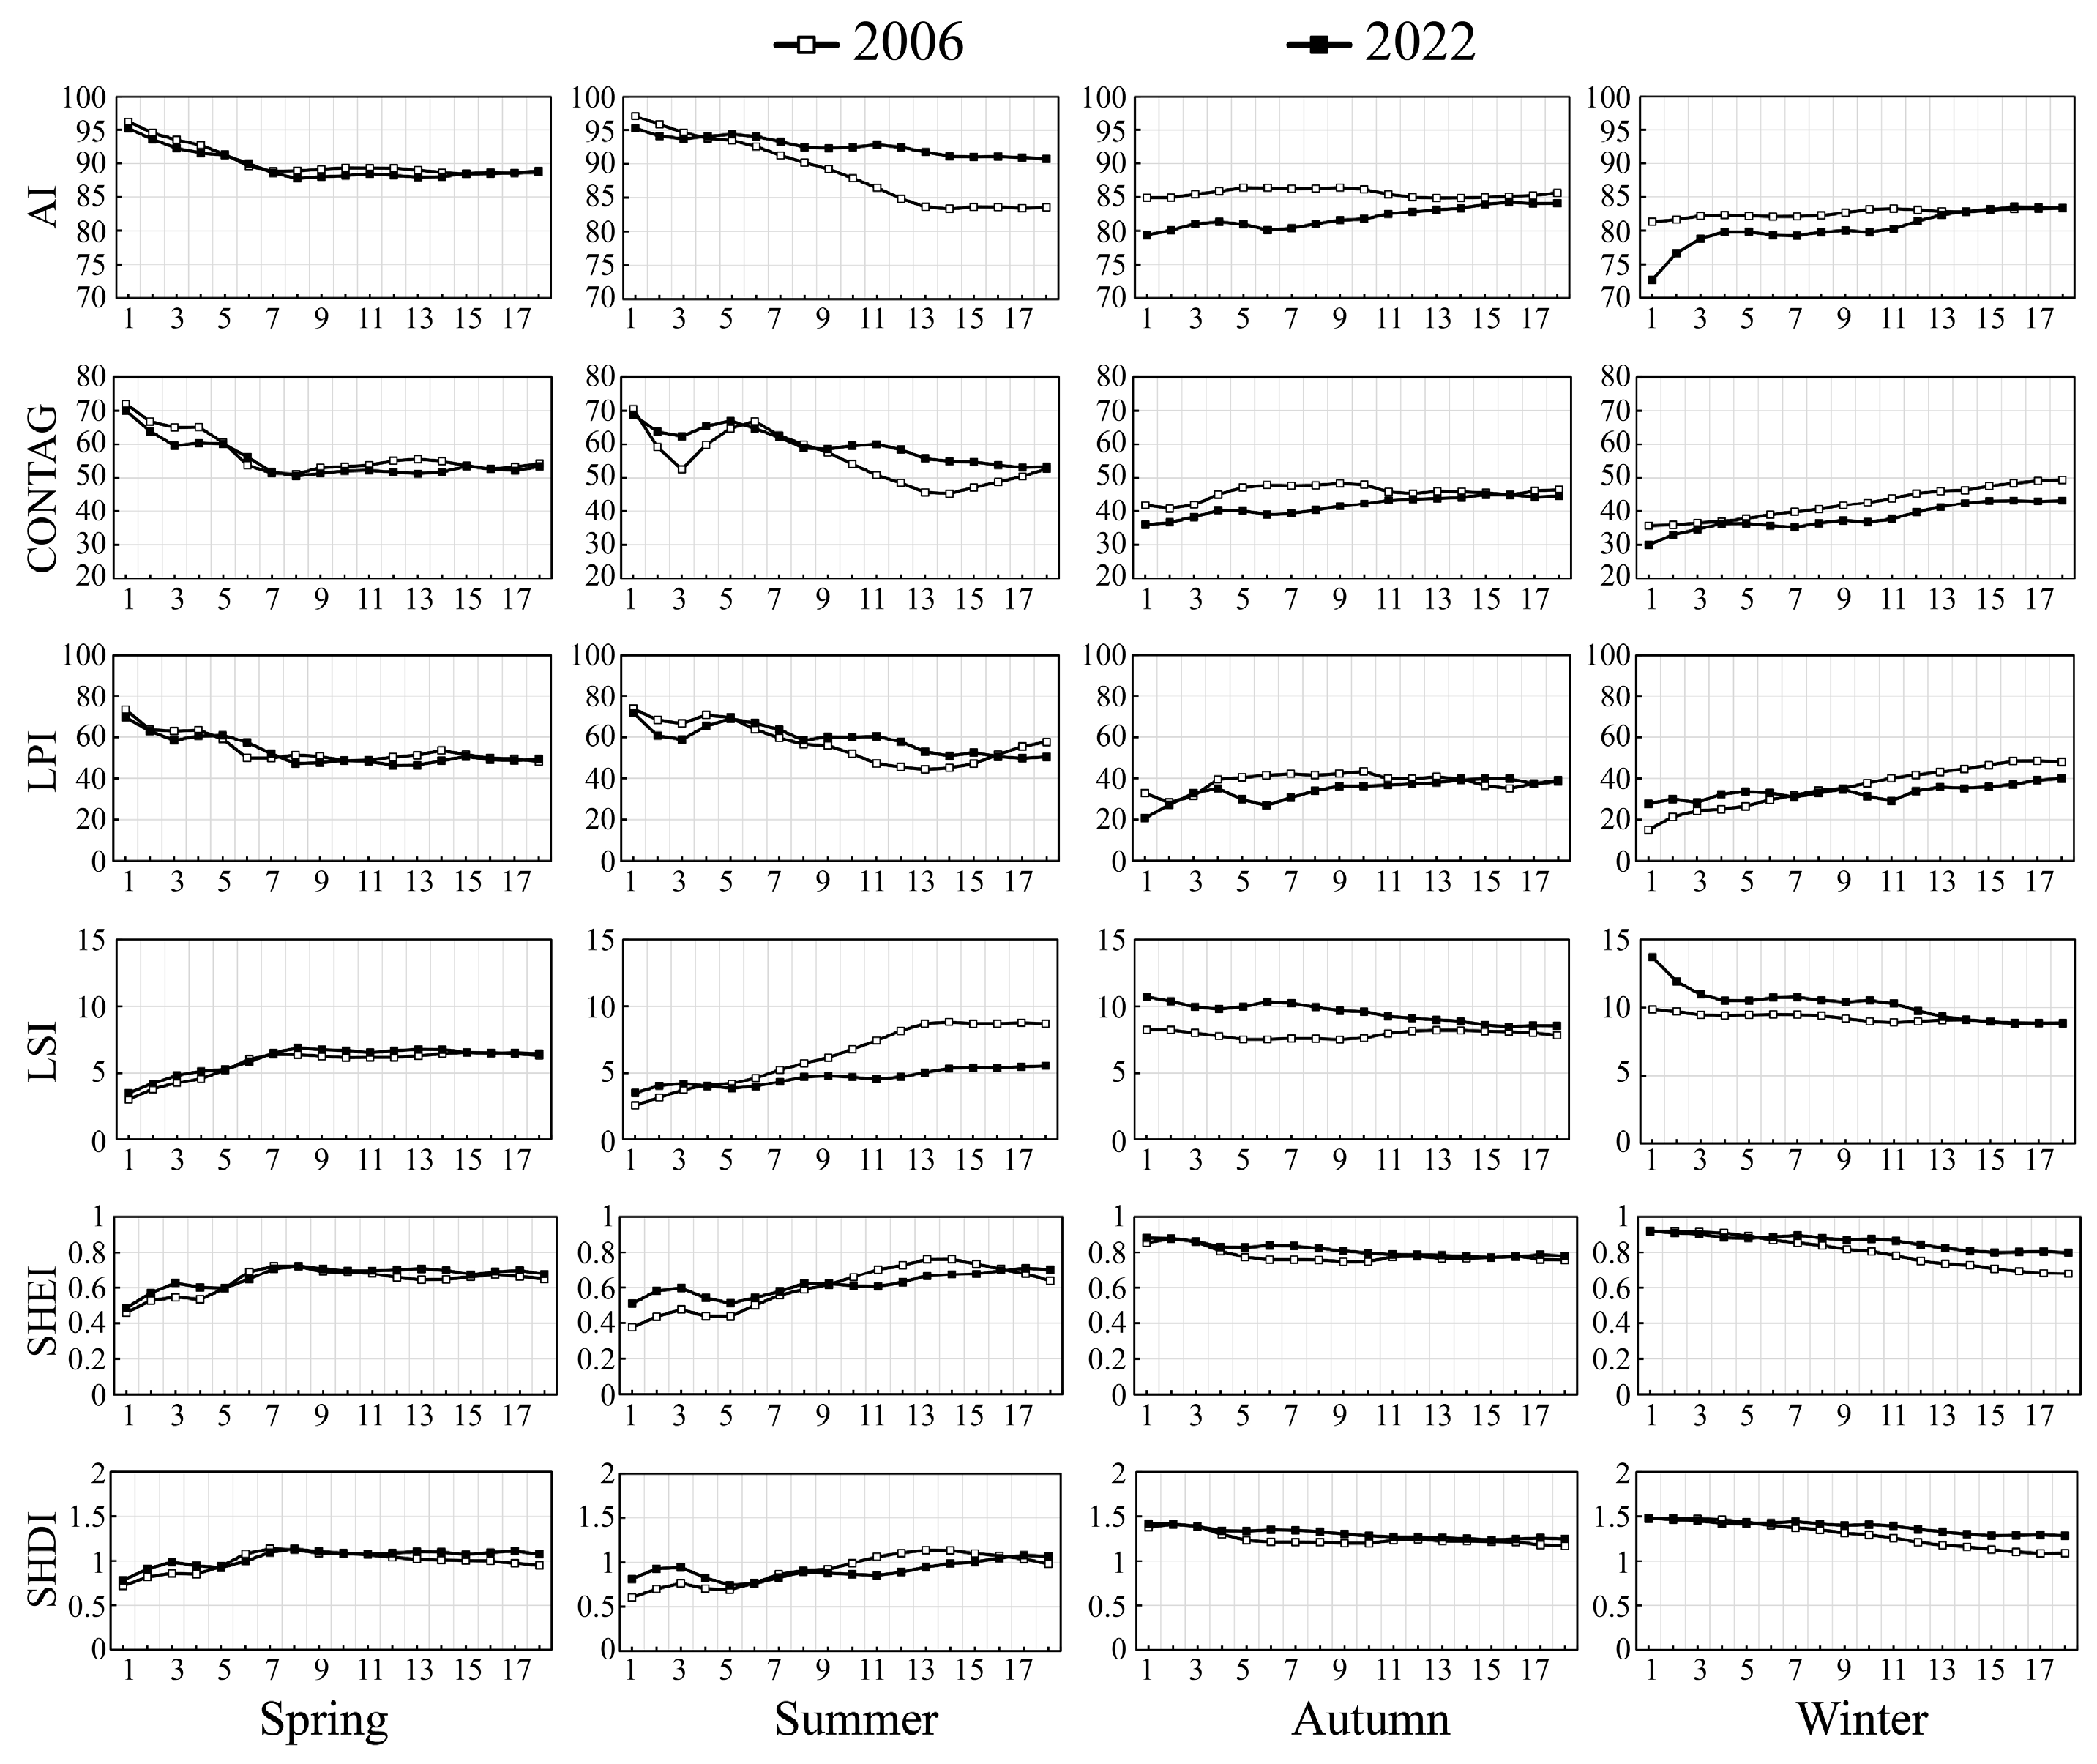
It can be observed from Figure 7 that: (1) Aggregation degree of heat island patches: In 2006, the AI in spring, summer, and autumn displayed a trend of initial decline followed by a gradual rise. In 2022, the AI in spring exhibited a similar trend to 2006. The CONTAG in spring and summer was largely consistent with the trend in 2006, but the CONTAG in autumn within the 5–11 km gradient range from the center showed an opposite trend to 2006. (2) Fragmentation degree of heat island patches: In 2006, the LPI in summer and autumn decreased continuously and then rose slowly. In 2022, the trends of the LPI in summer within the 9–15 km gradient range from the center point and the LPI in autumn within the 4–11 km gradient range from the center point were different from 2006. Additionally, for the LPI and LSI in spring, the trends were the same in 2006 and 2022, with the former constantly decreasing and the latter showing an upward trend. (3) Equilibrium and diversity of heat island patches: In 2006 and 2022, the SHEI and SHDI in spring, summer, autumn, and winter maintained the same trend but showed seasonal variations. Specifically, they continuously rose in spring and summer and continuously declined in autumn and winter, yet the decline was relatively gentle in autumn. Additionally, distinct trends emerged within the 10–15 km range from the center point in summer and the 5–10 km gradient range from the center point in autumn.
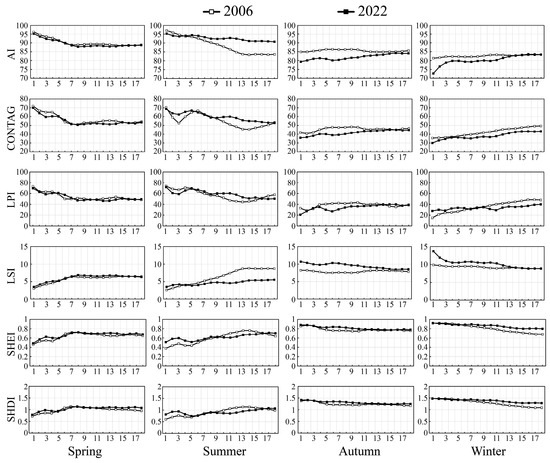
Figure 7.
Spatial gradient distribution characteristics of heat island patches of different landscape pattern indices in Changsha City from 2006 to 2022. The horizontal axis represents different buffer distance grades from the center point (km), while the vertical axis represents various landscape pattern index values.
Overall, from 2006 to 2022, the SHEI and SHDI in spring, summer, autumn, and winter exhibited relatively consistent trends. Additionally, the trends of different landscape pattern indices in spring were largely the same, but within the 2–4 km and 12–14 km ranges from the center point, the heat island patches were diverse but relatively independent. Within the 10–15 km gradient range from the center point in summer, the heat island patches were more aggregated and continuous, with its prominent dominant patches and more regular and unified shapes and types. Within the 5–8 km gradient range from the center point, the aggregation connectivity of autumn heat island patches declines, and the dominant ones weaken, yet their shapes and types grow increasingly diverse and balanced. Within the 10–18 km gradient range from the center point, the connectivity of winter heat island patches drops, and the dominant ones weaken.
4. Discussion
4.1. Seasonal Spatiotemporal Variation Characteristics and Causes of UHI
The heat island effect variation in spring was the most significant, with the high-temperature UHI area increasing by approximately 182.35 km2, followed by summer (178.16 km2). The heat island effect variation in autumn was the smallest, with the high-temperature UHI area decreasing by approximately 180.99 km2. This might be attributed to increased sunshine duration and enhanced solar radiation intensity in spring, which result in a gradual temperature increase [49]. The low-reflectance surfaces in cities, such as roads and buildings, absorb a large amount of heat, intensifying the heat island effect [50]. In autumn, weaker sunshine intensity, gradual temperature drops, and increased wind speed contribute to heat dissipation [51]. Simultaneously, differing atmospheric circulation patterns in spring and autumn in the subtropical region directly affect heat transportation and distribution [52]. Common high-pressure systems and stable weather in spring can lead to heat accumulation in cities, enhancing the heat island effect. In contrast, autumn often features more low-pressure systems and cold air activities, facilitating heat diffusion and mitigating the heat island effect. In comparison to temperate cities, subtropical cities experience more intense heat island effects in spring [53], which sharply contrasts with the cooling effect brought by rapid vegetation greening in temperate regions [54]. Mediterranean climate cities experience a more significant summer heat island effect, which is more susceptible to nonlinear regulation by precipitation during the Meiyu period [55]. In tropical cities, the heat island effect remains pronounced, but seasonal fluctuations remain minimal due to consistently high year-round temperatures [56].
Furthermore, over the past decade, urbanization has led to extensive infrastructure development and urban expansion, causing decreases in forestland, cultivated land, and water bodies by 159.36 km2, 116.24 km2, and 10.15 km2, respectively. Concurrently, the area of impervious surfaces has increased from 256.05 km2 to 541.78 km2, marking a growth rate of 111.59% (Table 3). The expansion of impervious surfaces has displaced forestland, cultivated land, and water bodies, which are crucial for climate regulation [17], leading to an increase of approximately 6.13 °C in spring, 7.53 °C in summer, 1.98 °C in autumn, and 0.55 °C in winter in Changsha City. Additionally, the heat island effect in Changsha City exhibits significant spatial heterogeneity. The most severe heat island effects are concentrated in the urban core (Furong District) and commercial-intensive areas (Wuyi Square), where high-density buildings and a lack of green spaces exacerbate the phenomenon [57].
Table 3.
Transfer characteristics of various LCT in Changsha City from 2006 to 2022 (unit: km2).
With the urbanization of Changsha City, the heat island effect tends to migrate to the surrounding areas, particularly in spring and summer. This is due to rising temperatures and favorable weather conditions in the subtropical region during spring and summer, which facilitate urbanization. Numerous construction projects result in concentrated land property changes, causing the rapid expansion of the UHI [58]. Additionally, high-temperature UHI in spring and autumn are increasingly concentrated at the junction near (Kaifu District and Changsha County) the urban core. The higher heat island intensity in the urban center causes heat to conduct from high-temperature areas to surrounding low-temperature areas [59]. The unique geographical location, lacking lakes and other cooling elements, increases the likelihood of seasonal multiple heat island effects in this area [60]. Furthermore, the heat island in all seasons shows a significant northward migration. Low-temperature cold islands are moving farther from the urban center, while high-temperature UHI are settling near or at the junction of the urban core. This is closely related to urban expansion and development, accompanied by the emergence of the heat island effect.
4.2. Gradient Variation Law of UHI
From 2006 to 2022, high-temperature UHI were most significant within the 5 km gradient range from the center point in all seasons and within the 6–8 km and 11–13 km gradient ranges from the center point in spring and autumn. This is because the gradient range near 6 km from the center point is part of the urban ring road area, housing urban development facilities such as commercial centers, government agencies, cultural facilities, educational institutions, and medical service centers within the outer ring road of the main urban roads “https://jtt.hunan.gov.cn/ (accessed on 28 June 2024)”. The gradient range near 13 km from the center point is in the urban expressway ring road area “https://jtt.hunan.gov.cn/ (accessed on 28 June 2024)”. The development of urban transportation drives the growth of surrounding functional areas such as catering, logistics, and residential areas. Furthermore, in the process of modernization, to preserve historical culture while meeting urban development needs, the urban development model in many subtropical regions of China often expands outward with the old urban area as the center [61,62,63]. The central outward-expanding cities that rely on the urban central area are linked to major economic arteries such as population and transportation, leading to the aggregation of heat islands in the urban center and its normalization [64]. As the city expands outward, the heat island phenomenon near the urban ring roads also intensifies gradually [65]. As a typical, centrally outward-expanding city, Changsha has a distinct circular structure in the distribution of heat islands, presenting seasonal variation characteristics.
In addition, within the gradient ranges of 2–4 km and 12–14 km from the central point in spring, and 5–10 km in autumn, significant disparities in CONTAG appeared. The connectivity of heat island patches decreased, and its dominant patches weakened. These ranges are closely linked with the areas of urban ring roads and expressway ring roads, suggesting that the heat island patches within this scope are continually evolving. The accumulation of high-temperature UHI disrupted the balance among the original heat islands of various grades. Nevertheless, the shapes and types of heat island patches became more diverse and balanced. This might be due to the increasingly fragmented and decentralized distribution of low-temperature cold island areas, where the original single-grade heat island areas transformed into multi-grade ones. In contrast to spring, within the 10–15 km gradient range from the central point in summer, heat island patches exhibited greater aggregation and continuity, with its prominent dominant patches and more regular and unified shapes and types. Simultaneously, within the 2–4 km gradient range from the central point, connectivity and balanced diversity improved. This could be due to the persistent heat island effect in summer, particularly within the urban ring road area. In winter, there is a decrease in temperature and sunlight duration [66]. Consequently, surface heat accumulation in this area decreased, relationships between different grades of heat islands weakened, and the dominance of its single grade diminished.
4.3. Mitigation Strategies and Recommendations for Seasonal UHI Effects
Resource conservation perspective: (1) Within the urban ring road area, protect existing arbor trees and increase green spaces such as pocket parks and street greenery. Vegetation growth can reduce surface temperature and increase evaporation, aiding in cooling the surrounding air [67]. Optimize green corridors along main urban roads, with planting in spring and maintenance in summer. For instance, plant dust- and haze-removing plants, and make a reasonable combination of arbor, shrub, and herbaceous plants. (2) In the urban expressway ring road and newly developed areas, protect and restore the natural ecosystem in autumn and winter. For example, protect urban water areas, rivers, and lakes to prevent water pollution. Proper water resource management can stabilize green coverage, reduce drought in water bodies, maintain their ecological functions, and mitigate the heat island effect [68]. Reduce wetland development, restore tributary water areas, and increase the water area of artificial lakes and wetland parks within the urban expressway ring road.
Planning and construction perspective: (1) Within the urban ring road area, increase regional greening by adding vertical greening and roof garden facilities. In spring and summer, plant more low shrubs and herbs to maintain a smooth urban landscape, improve convective heat dissipation efficiency, increase the city’s green coverage rate, and mitigate the heat island effect [69]. Use light-colored materials for roofs, pavements, and parking lots, implement wall greening, and increase the city’s reflectivity in spring and summer [70]. Use more permeable pavement to reduce surface runoff, increase groundwater recharge, and enhance the water supply rate in autumn and winter. (2) In the urban expressway ring road and newly developed areas, retain the original form and function of plant communities, such as preserving arbor and shrub groups, reserving sufficient green space, and building urban forests, parks, green belts, greenways, and lawns. Add shrubs and creeping vegetation on both sides of the ring road to reduce road heat sources [71].
Social management perspective: (1) Prioritize the development of urban green infrastructure, focusing on areas within the urban ring road and the expressway ring road. Enhance the integration and optimization of spatial structures to ensure the alignment of the urban green space system with urban development. (2) Enforce stringent environmental protection regulations. Within the urban expressway ring road, control and reduce waste heat emissions and other heat source pollutants. Simultaneously, provide financial incentives and tax benefits to encourage enterprises and individuals to utilize renewable energy and reduce reliance on fossil fuels. (3) Encourage residents within the urban ring road to engage in UHI management. Plant trees in spring to increase urban greenery, and use inverter air conditioners during summer and winter. Additionally, use public transportation to decrease heat source emissions.
4.4. Limitations and Prospects
This study provides insights for heat island governance and sustainable development, although it faced limitations due to cloud cover and the non-consecutive selection of periods from 2006 to 2022. The seasonal time points were selected according to prior research [40], and the results revealed the characteristics of the heat island effect in Changsha City. Future research could incorporate predictions or scenario simulations, and the influences of the sky angle, building height, and albedo on UHI changes should be analyzed quantitatively to better inform strategy formulation.
5. Conclusions
The focus on the seasonal variations of UHI is crucial for understanding their evolution and intensity, which contributes to mitigating global warming and enhancing human–nature harmony. This study investigates the seasonal spatiotemporal dynamics and spatial gradient characteristics of the UHI in Changsha City from 2006 to 2022. The results indicate that:
- (1)
- Spatiotemporal dynamics: With urbanization, significant seasonal changes in the UHI have occurred. From before urbanization in 2006 to after in 2022, the overall land surface temperatures in spring, summer, autumn, and winter have increased. The areas of low-level and relatively low-level surface temperature regions have decreased, while high-level surface temperature regions have become concentrated in the urban core. The extent of high-temperature UHI significantly increases in spring and changes minimally in autumn. Meanwhile, the area of high-temperature UHI experiences the largest net inflow in spring and the smallest in autumn. These trends are closely related to the unique climate of subtropical regions and their urbanization development. Additionally, the migration patterns of heat islands vary. Areas adjacent to or bordering the urban core, due to their geographical locations, are significantly affected by high-temperature UHI and likely experience multiple heat island effects.
- (2)
- Gradient characteristics: The gradient increase is positively correlated with the intensity increase of urban high-temperature UHI, particularly in spring and autumn, within the 6–8 km and 11–13 km gradient ranges from the center point. The landscape pattern indices of various heat island patches also display seasonal and gradient characteristics. In spring and summer, AI, CONTAG, LPI, and LSI exhibit trends opposite to those in autumn and winter, while SHEI and SHDI are less influenced by the seasons. Climatic characteristics constrain the aggregation connectivity of heat island patches, disrupting the original dynamics between dominant patches. Smaller and more irregularly aggregated heat island patches are less dominant as high-temperature UHI. Significant variations and discontinuities in heat island patches are observed within the 8 km gradient from the center point in spring and the 13 km gradient in summer, suggesting that the circular urbanization development model significantly influences heat island patch changes.
This study theoretically fills the gap in understanding the long-term seasonal changes in UHI, particularly during rapid urbanization. Practically, identifying the key factors influencing changes in UHI is crucial for developing effective mitigation strategies.
Supplementary Materials
The following supporting information can be downloaded at: https://www.mdpi.com/article/10.3390/su17073238/s1, Figure S1: Correlation between the retrieved LST and the MOD11A2 LST.
Author Contributions
Conceptualization, C.F. and Z.F.; methodology, C.F., C.C. and Z.F.; resources, Z.F.; writing—original draft preparation, C.F., C.C. and Z.F.; writing—review and editing, C.F., C.C. and Z.F.; supervision, Z.F.; project administration, Z.F.; funding acquisition, Z.F. All authors have read and agreed to the published version of the manuscript.
Funding
This work was supported by the Major scientific and technological projects of Yunnan Province [202202AD080010]; the Key Laboratory of State Forestry and Grassland Administration on Forestry and Ecological Big Data Open Fund Priority Project [2022-BDK-01].
Institutional Review Board Statement
Not applicable.
Informed Consent Statement
Not applicable.
Data Availability Statement
The original contributions presented in this study are included in the article/Supplementary Material. Further inquiries can be directed to the corresponding author(s).
Acknowledgments
We are very grateful for the support from the Major scientific and technological projects of Yunnan Province [202202AD080010]; the Key Laboratory of State Forestry and Grassland Administration on Forestry and Ecological Big Data Open Fund Priority Project [2022-BDK-01] and the Key Discipline of the State Forestry Administration [grant number 2016-21] and the “Double First-Class” Cultivating Subject of Hunan Province [grant number 2018-469].
Conflicts of Interest
The authors declare no conflicts of interest.
References
- Liang, Y.; Gillett, N.P.; Monahan, A.H. Accounting for Pacific Climate Variability Increases Projected Global Warming. Nat. Clim. Change 2024, 14, 608–614. [Google Scholar] [CrossRef]
- KIM, H.H. Urban Heat Island. Int. J. Remote Sens. 1992, 13, 2319–2336. [Google Scholar] [CrossRef]
- Yang, M.; Ren, C.; Wang, H.; Wang, J.; Feng, Z.; Kumar, P.; Haghighat, F.; Cao, S.-J. Mitigating Urban Heat Island through Neighboring Rural Land Cover. Nat. Cities 2024, 1, 522–532. [Google Scholar] [CrossRef]
- Si, M.; Li, Z.-L.; Nerry, F.; Tang, B.-H.; Leng, P.; Wu, H.; Zhang, X.; Shang, G. Spatiotemporal Pattern and Long-Term Trend of Global Surface Urban Heat Islands Characterized by Dynamic Urban-Extent Method and MODIS Data. ISPRS J. Photogramm. Remote Sens. 2022, 183, 321–335. [Google Scholar] [CrossRef]
- Deng, S.-Z.; Jalaludin, B.B.; Antó, J.M.; Hess, J.J.; Huang, C.-R. Climate Change, Air Pollution, and Allergic Respiratory Diseases: A Call to Action for Health Professionals. Chin. Med. J. (Engl.) 2020, 133, 1552–1560. [Google Scholar] [CrossRef] [PubMed]
- Gu, X.; Li, Z.; Su, J. Air Pollution and Skin Diseases: A Comprehensive Evaluation of the Associated Mechanism. Ecotoxicol. Environ. Saf. 2024, 278, 116429. [Google Scholar] [CrossRef]
- Vargas, N.T.; Schlader, Z.J.; Jay, O.; Hunter, A. Prioritize Research on Human Behaviour during Extreme Heat. Nat. Hum. Behav. 2023, 7, 473–474. [Google Scholar] [CrossRef] [PubMed]
- Wu, Y.; Hou, H.; Wang, R.; Murayama, Y.; Wang, L.; Hu, T. Effects of Landscape Patterns on the Morphological Evolution of Surface Urban Heat Island in Hangzhou during 2000–2020. Sustain. Cities Soc. 2022, 79, 103717. [Google Scholar] [CrossRef]
- Magnaye, A.M.T.; Kusaka, H. Potential Effect of Urbanization on Extreme Heat Events in Metro Manila Philippines Using WRF-UCM. Sustain. Cities Soc. 2024, 110, 105584. [Google Scholar] [CrossRef]
- Santamouris, M. Recent Progress on Urban Overheating and Heat Island Research. Integrated Assessment of the Energy, Environmental, Vulnerability and Health Impact. Synergies with the Global Climate Change. Energy Build. 2020, 207, 109482. [Google Scholar] [CrossRef]
- Yuan, Y.; Li, C.; Geng, X.; Yu, Z.; Fan, Z.; Wang, X. Natural-Anthropogenic Environment Interactively Causes the Surface Urban Heat Island Intensity Variations in Global Climate Zones. Environ. Int. 2022, 170, 107574. [Google Scholar] [CrossRef]
- Cuce, P.M.; Cuce, E.; Santamouris, M. Towards Sustainable and Climate-Resilient Cities: Mitigating Urban Heat Islands Through Green Infrastructure. Sustainability 2025, 17, 1303. [Google Scholar] [CrossRef]
- Huang, Q.; Huang, J.; Yang, X.; Fang, C.; Liang, Y. Quantifying the Seasonal Contribution of Coupling Urban Land Use Types on Urban Heat Island Using Land Contribution Index: A Case Study in Wuhan, China. Sustain. Cities Soc. 2019, 44, 666–675. [Google Scholar] [CrossRef]
- Bokaie, M.; Shamsipour, A.; Khatibi, P.; Hosseini, A. Seasonal Monitoring of Urban Heat Island Using Multi-Temporal Landsat and MODIS Images in Tehran. Int. J. Urban Sci. 2019, 23, 269–285. [Google Scholar] [CrossRef]
- Liu, Y.; Zhang, W.; Liu, W.; Tan, Z.; Hu, S.; Ao, Z.; Li, J.; Xing, H. Exploring the Seasonal Effects of Urban Morphology on Land Surface Temperature in Urban Functional Zones. Sustain. Cities Soc. 2024, 103, 105268. [Google Scholar] [CrossRef]
- Lu, Y.; Wu, P.; Ma, X.; Yang, H.; Wu, Y. Monitoring Seasonal and Diurnal Surface Urban Heat Islands Variations Using Landsat-Scale Data in Hefei, China, 2000–2017. IEEE J. Sel. Top. Appl. Earth Obs. Remote Sens. 2020, 13, 6410–6423. [Google Scholar] [CrossRef]
- Yuan, S.; Ren, Z.; Shan, X.; Deng, Q.; Zhou, Z. Seasonal Different Effects of Land Cover on Urban Heat Island in Wuhan’s Metropolitan Area. Urban Clim. 2023, 49, 101547. [Google Scholar] [CrossRef]
- Renc, A.; Łupikasza, E. Changes in the Surface Urban Heat Island between 1986 and 2021 in the Polycentric Górnośląsko-Zagłębiowska Metropolis, Southern Poland. Build. Environ. 2024, 247, 110997. [Google Scholar] [CrossRef]
- Liang, Z.; Wu, S.; Wang, Y.; Wei, F.; Huang, J.; Shen, J.; Li, S. The Relationship between Urban Form and Heat Island Intensity along the Urban Development Gradients. Sci. Total Environ. 2020, 708, 135011. [Google Scholar] [CrossRef]
- Liu, X.; Wang, N.; Li, Z.; Jia, R.; Qiao, Z. Research on Time Series and Spatial Gradient of Urban Heat Island Expansion from the Perspective of Urban Renewal. IEEE J. Sel. Top. Appl. Earth Obs. Remote Sens. 2023, 16, 8680–8688. [Google Scholar] [CrossRef]
- Yao, X.; Zhu, Z.; Zhou, X.; Shen, Y.; Shen, X.; Xu, Z. Investigating the Effects of Urban Morphological Factors on Seasonal Land Surface Temperature in a “Furnace City” from a Block Perspective. Sustain. Cities Soc. 2022, 86, 104165. [Google Scholar] [CrossRef]
- Liu, J.; Wu, J.; Yang, Y.; Zhang, B.; Yin, L. Evaluation of the Seasonal Thermal Environmental Benefits of Urban Green Space in the Core Areas of Urban Heat Island. Forests 2023, 14, 1500. [Google Scholar] [CrossRef]
- Firozjaei, M.K.; Sedighi, A.; Mijani, N.; Kazemi, Y.; Amiraslani, F. Seasonal and Daily Effects of the Sea on the Surface Urban Heat Island Intensity: A Case Study of Cities in the Caspian Sea Plain. Urban Clim. 2023, 51, 101603. [Google Scholar] [CrossRef]
- Wang, J.; Xiang, Z.; Wang, W.; Chang, W.; Wang, Y. Impacts of Strengthened Warming by Urban Heat Island on Carbon Sequestration of Urban Ecosystems in a Subtropical City of China. Urban Ecosyst. 2021, 24, 1165–1177. [Google Scholar] [CrossRef]
- Shi, Y.; Zhang, Y. Urban Morphological Indicators of Urban Heat and Moisture Islands under Various Sky Conditions in a Humid Subtropical Region. Build. Environ. 2022, 214, 108906. [Google Scholar] [CrossRef]
- Xia, P.; Peng, W.; Yuan, P.; Ye, S. Monitoring Urban Heat Island Intensity Based on GNSS Tomography Technique. J. Geod. 2024, 98, 1. [Google Scholar] [CrossRef]
- Xu, D.; Wang, Y.; Zhou, D.; Wang, Y.; Zhang, Q.; Yang, Y. Influences of Urban Spatial Factors on Surface Urban Heat Island Effect and Its Spatial Heterogeneity: A Case Study of Xi’an. Build. Environ. 2024, 248, 111072. [Google Scholar] [CrossRef]
- De Cristo, E.; Evangelisti, L.; Battista, G.; Guattari, C.; De Lieto Vollaro, R.; Asdrubali, F. Annual Comparison of the Atmospheric Urban Heat Island in Rome (Italy): An Assessment in Space and Time. Buildings 2023, 13, 2792. [Google Scholar] [CrossRef]
- Yao, R.; Huang, X.; Zhang, Y.; Wang, L.; Li, J.; Yang, Q. Estimation of the Surface Urban Heat Island Intensity across 1031 Global Cities Using the Regression-Modification-Estimation (RME) Method. J. Clean. Prod. 2024, 434, 140231. [Google Scholar] [CrossRef]
- Li, L.; Zhan, W.; Hu, L.; Chakraborty, T.; Wang, Z.; Fu, P.; Wang, D.; Liao, W.; Huang, F.; Fu, H.; et al. Divergent Urbanization-Induced Impacts on Global Surface Urban Heat Island Trends since 1980s. Remote Sens. Environ. 2023, 295, 113650. [Google Scholar] [CrossRef]
- Xu, X.; Pei, H.; Wang, C.; Xu, Q.; Xie, H.; Jin, Y.; Feng, Y.; Tong, X.; Xiao, C. Long-Term Analysis of the Urban Heat Island Effect Using Multisource Landsat Images Considering Inter-Class Differences in Land Surface Temperature Products. Sci. Total Environ. 2023, 858, 159777. [Google Scholar] [CrossRef] [PubMed]
- Li, T.; Huang, X.; Guo, H.; Hong, T. Contribution and Marginal Effects of Landscape Patterns on Thermal Environment: A Study Based on the BRT Model. Buildings 2024, 14, 2388. [Google Scholar] [CrossRef]
- Chen, M.; Zhou, Y.; Hu, M.; Zhou, Y. Influence of Urban Scale and Urban Expansion on the Urban Heat Island Effect in Metropolitan Areas: Case Study of Beijing–Tianjin–Hebei Urban Agglomeration. Remote Sens. 2020, 12, 3491. [Google Scholar] [CrossRef]
- Tanoori, G.; Soltani, A.; Modiri, A. Machine Learning for Urban Heat Island (UHI) Analysis: Predicting Land Surface Temperature (LST) in Urban Environments. Urban Clim. 2024, 55, 101962. [Google Scholar] [CrossRef]
- Deilami, K.; Kamruzzaman, M.; Liu, Y. Urban Heat Island Effect: A Systematic Review of Spatio-Temporal Factors, Data, Methods, and Mitigation Measures. Int. J. Appl. Earth Obs. Geoinf. 2018, 67, 30–42. [Google Scholar] [CrossRef]
- Tan, J.; Kuang, W.; Yu, D.; Zhou, W.; Li, X.; Liu, Q.; He, L. Investigating the Cooling Effects of Land Cover and Landscape Patterns Surrounding Rivers: Insights from the Subtropical City of Changsha, China. Urban Clim. 2024, 55, 101975. [Google Scholar] [CrossRef]
- Gao, X.; Xia, N.; Zhuang, S.; Zhao, X.; Liang, J.; Wang, Z.; Li, M. Integrating Multisource Geographic Big Data to Delineate Urban Growth Boundary: A Case Study of Changsha. IEEE J. Sel. Top. Appl. Earth Obs. Remote Sens. 2024, 17, 9018–9036. [Google Scholar] [CrossRef]
- Xiong, Y.; Zhang, F. Effect of Human Settlements on Urban Thermal Environment and Factor Analysis Based on Multi-Source Data: A Case Study of Changsha City. J. Geogr. Sci. 2021, 31, 819–838. [Google Scholar] [CrossRef]
- Peng, J.; Dan, Y.; Yu, X.; Xu, D.; Yang, Z.; Wang, Q. Response of Urban Green Space Cooling Effect to Urbanization in the Three Ring Road Area of Changsha City. Sustain. Cities Soc. 2024, 109, 105534. [Google Scholar] [CrossRef]
- Xie, J.; Zhou, S.; Chung, L.C.H.; Chan, T.O. Evaluating Land-Surface Warming and Cooling Environments across Urban–Rural Local Climate Zone Gradients in Subtropical Megacities. Build. Environ. 2024, 251, 111232. [Google Scholar] [CrossRef]
- Yang, J.; Huang, X. The 30 m Annual Land Cover Dataset and Its Dynamics in China from 1990 to 2019. Earth Syst. Sci. Data 2021, 13, 3907–3925. [Google Scholar] [CrossRef]
- Hu, C.; Li, S.; Dong, X. A New Method for Evaluate the Cold Island Effect in Cities. Urban Clim. 2024, 54, 101846. [Google Scholar] [CrossRef]
- Sobrino, J.A.; Jimenez-Munoz, J.C.; Soria, G.; Romaguera, M.; Guanter, L.; Moreno, J.; Plaza, A.; Martinez, P. Land Surface Emissivity Retrieval From Different VNIR and TIR Sensors. IEEE Trans. Geosci. Remote Sens. 2008, 46, 316–327. [Google Scholar] [CrossRef]
- Barsi, J.A.; Schott, J.R.; Palluconi, F.D.; Hook, S.J. Validation of a Web-Based Atmospheric Correction Tool for Single Thermal Band Instruments. In Earth Observing Systems X, Proceedings of the SPIE 5882, New York, NY, USA, 18 August 2005; SPIE: Bellingham, WA, USA, 2005; Volume 5882, pp. 136–142. [Google Scholar]
- Sun, X.; Fang, P.; Huang, S.; Liang, Y.; Zhang, J.; Wang, J. Impact of Urban Green Space Morphology and Vegetation Composition on Seasonal Land Surface Temperature: A Case Study of Beijing’s Urban Core. Urban Clim. 2025, 60, 102367. [Google Scholar] [CrossRef]
- Lu, Y.; He, T.; Xu, X.; Qiao, Z. Investigation the Robustness of Standard Classification Methods for Defining Urban Heat Islands. IEEE J. Sel. Top. Appl. Earth Obs. Remote Sens. 2021, 14, 11386–11394. [Google Scholar] [CrossRef]
- Zhang, M.; Tan, S.; Zhang, C.; Chen, E. Machine Learning in Modelling the Urban Thermal Field Variance Index and Assessing the Impacts of Urban Land Expansion on Seasonal Thermal Environment. Sustain. Cities Soc. 2024, 106, 105345. [Google Scholar] [CrossRef]
- Yang, Y.; Guangrong, S.; Chen, Z.; Hao, S.; Zhouyiling, Z.; Shan, Y. Quantitative Analysis and Prediction of Urban Heat Island Intensity on Urban-Rural Gradient: A Case Study of Shanghai. Sci. Total Environ. 2022, 829, 154264. [Google Scholar] [CrossRef]
- Sun, Z.; Ouyang, Z.; Zhao, J.; Li, S.; Zhang, X.; Ren, W. Recent Rebound in Observational Large-Pan Evaporation Driven by Heat Wave and Droughts by the Lower Yellow River. J. Hydrol. 2018, 565, 237–247. [Google Scholar] [CrossRef]
- Morabito, M.; Crisci, A.; Guerri, G.; Messeri, A.; Congedo, L.; Munafò, M. Surface Urban Heat Islands in Italian Metropolitan Cities: Tree Cover and Impervious Surface Influences. Sci. Total Environ. 2021, 751, 142334. [Google Scholar] [CrossRef]
- Ngarambe, J.; Oh, J.W.; Su, M.A.; Santamouris, M.; Yun, G.Y. Influences of Wind Speed, Sky Conditions, Land Use and Land Cover Characteristics on the Magnitude of the Urban Heat Island in Seoul: An Exploratory Analysis. Sustain. Cities Soc. 2021, 71, 102953. [Google Scholar] [CrossRef]
- Vautard, R.; Cattiaux, J.; Happé, T.; Singh, J.; Bonnet, R.; Cassou, C.; Coumou, D.; D’Andrea, F.; Faranda, D.; Fischer, E.; et al. Heat Extremes in Western Europe Increasing Faster than Simulated Due to Atmospheric Circulation Trends. Nat. Commun. 2023, 14, 6803. [Google Scholar] [CrossRef] [PubMed]
- Geng, X.; Zhang, D.; Li, C.; Yuan, Y.; Yu, Z.; Wang, X. Impacts of Climatic Zones on Urban Heat Island: Spatiotemporal Variations, Trends, and Drivers in China from 2001–2020. Sustain. Cities Soc. 2023, 89, 104303. [Google Scholar] [CrossRef]
- Zhou, D.; Zhao, S.; Zhang, L.; Liu, S. Remotely Sensed Assessment of Urbanization Effects on Vegetation Phenology in China’s 32 Major Cities. Remote Sens. Environ. 2016, 176, 272–281. [Google Scholar] [CrossRef]
- He, Y.; Wang, Z.; Wong, H.M.; Chen, G.; Ren, C.; Luo, M.; Li, Y.; Lee, T.; Chan, P.W.; Ho, J.Y.; et al. Spatial-Temporal Changes of Compound Temperature-Humidity Extremes in Humid Subtropical High-Density Cities: An Observational Study in Hong Kong from 1961 to 2020. Urban Clim. 2023, 51, 101669. [Google Scholar] [CrossRef]
- Garuma, G.F. Tropical Surface Urban Heat Islands in East Africa. Sci. Rep. 2023, 13, 4509. [Google Scholar] [CrossRef] [PubMed]
- Chen, X.; Wang, Z.; Yang, H.; Ford, A.C.; Dawson, R.J. Impacts of Urban Densification and Vertical Growth on Urban Heat Environment: A Case Study in the 4th Ring Road Area, Zhengzhou, China. J. Clean. Prod. 2023, 410, 137247. [Google Scholar] [CrossRef]
- Wan, J.; Yong, B.; Zhou, X. Spatial and Temporal Analysis of the Increasing Effects of Large-Scale Infrastructure Construction on the Surface Urban Heat Island. Ecotoxicol. Environ. Saf. 2022, 237, 113521. [Google Scholar] [CrossRef]
- Teng, X.; Zhang, Y.; Fan, Y.; Ge, J. Flow Patterns and Heat Transfer of an Idealized Square City in Non-Uniform Heat Flux and Different Background Wind Conditions. Build. Environ. 2024, 262, 111779. [Google Scholar] [CrossRef]
- Bai, P.; Wang, Y. The Importance of Heat Storage for Estimating Lake Evaporation on Different Time Scales: Insights From a Large Shallow Subtropical Lake. Water Resour. Res. 2023, 59, e2023WR035123. [Google Scholar] [CrossRef]
- Zhang, Z.; Gong, J.; Plaza, A.; Yang, J.; Li, J.; Tao, X.; Wu, Z.; Li, S. Long-Term Assessment of Ecological Risk Dynamics in Wuhan, China: Multi-Perspective Spatiotemporal Variation Analysis. Environ. Impact Assess. Rev. 2024, 105, 107372. [Google Scholar] [CrossRef]
- Li, J.; Wang, J.; Zhou, W. Different Impacts of Urbanization on Ecosystem Services Supply and Demand across Old, New and Non-Urban Areas in the ChangZhuTan Urban Agglomeration, China. Landsc. Ecol. 2024, 39, 107. [Google Scholar] [CrossRef]
- Wu, Z.; Tong, Z.; Wang, M.; Long, Q. Assessing the Impact of Urban Morphological Parameters on Land Surface Temperature in the Heat Aggregation Areas with Spatial Heterogeneity: A Case Study of Nanjing. Build. Environ. 2023, 235, 110232. [Google Scholar] [CrossRef]
- Zhao, H.; Fang, Y.; Xu, X. Quantifying Morphology Evolutions of Urban Heat Islands and Assessing Their Heat Exposure in a Metropolis. Sustain. Cities Soc. 2024, 102, 105244. [Google Scholar] [CrossRef]
- Qiu, J.; Li, X.; Qian, W. Optimizing the Spatial Pattern of the Cold Island to Mitigate the Urban Heat Island Effect. Ecol. Indic. 2023, 154, 110550. [Google Scholar] [CrossRef]
- Macintyre, H.L.; Heaviside, C.; Cai, X.; Phalkey, R. The Winter Urban Heat Island: Impacts on Cold-Related Mortality in a Highly Urbanized European Region for Present and Future Climate. Environ. Int. 2021, 154, 106530. [Google Scholar] [CrossRef] [PubMed]
- Wang, C.; Ren, Z.; Dong, Y.; Zhang, P.; Guo, Y.; Wang, W.; Bao, G. Efficient Cooling of Cities at Global Scale Using Urban Green Space to Mitigate Urban Heat Island Effects in Different Climatic Regions. Urban For. Urban Green. 2022, 74, 127635. [Google Scholar] [CrossRef]
- Lin, Y.; Wang, Z.; Jim, C.Y.; Li, J.; Deng, J.; Liu, J. Water as an Urban Heat Sink: Blue Infrastructure Alleviates Urban Heat Island Effect in Mega-City Agglomeration. J. Clean. Prod. 2020, 262, 121411. [Google Scholar] [CrossRef]
- Lu, L.; Guo, H.; Weng, Q.; Bartesaghi-Koc, C.; Osmond, P.; Li, Q. A Transferable Approach to Assessing Green Infrastructure Types (GITs) and Their Effects on Surface Urban Heat Islands with Multi-Source Geospatial Data. Remote Sens. Environ. 2024, 306, 114119. [Google Scholar] [CrossRef]
- Tabatabaei, S.S.; Fayaz, R. The Effect of Facade Materials and Coatings on Urban Heat Island Mitigation and Outdoor Thermal Comfort in Hot Semi-Arid Climate. Build. Environ. 2023, 243, 110701. [Google Scholar] [CrossRef]
- Xi, C.; Han, L.; Wang, J.; Feng, Z.; Kumar, P.; Cao, S.-J. How Can Greenery Space Mitigate Urban Heat Island? An Analysis of Cooling Effect, Carbon Sequestration, and Nurturing Cost at the Street Scale. J. Clean. Prod. 2023, 419, 138230. [Google Scholar] [CrossRef]

Disclaimer/Publisher’s Note: The statements, opinions and data contained in all publications are solely those of the individual author(s) and contributor(s) and not of MDPI and/or the editor(s). MDPI and/or the editor(s) disclaim responsibility for any injury to people or property resulting from any ideas, methods, instructions or products referred to in the content. |
© 2025 by the authors. Licensee MDPI, Basel, Switzerland. This article is an open access article distributed under the terms and conditions of the Creative Commons Attribution (CC BY) license (https://creativecommons.org/licenses/by/4.0/).