
Design, Development, and Validation of Driving Simulators for Enhancing the Safety and Sustainability of Electric Microvehicles


Abstract
1. Introduction
2. Materials and Methods
2.1. Design Concept and Requirements
- The structural frame has to be able to support the weight of the driver and the vehicle under all possible operational conditions, including vertical slope variations.
- The structural frame has to be able to support all necessary motors and sensors to record and digitize driving behavior parameters.
- The vehicle body has to remain unaffected in order to be functional when dismounted for other use or replaced by other microvehicles on the simulator.
- The total dimensions have to be kept small in order to fit in the laboratory premises and, even, be portable for demonstrations or experiments in other spaces.
2.2. Implementation
2.2.1. Mechanical Structure
- A rectangular frame made by a metal squared hollow section (25 mm) with total final dimensions of 250 mm × 1200 mm.
- A double-cylinder roller (50 mm diameter and 180 mm length each) where the e-scooter’s rear wheel is mounted.
- Stabilization parts: (a) a cylinder tube with a diameter of 5 mm and a length of 550 mm that is attached to the backside of the rectangular frame to ensure the stability of the simulator and (b) an X-shaped brace attached both on the e-scooter chassis and the rectangular frame to ensure vehicle stability during operations.
- Concerning the lean function, it has been installed in many bicycle simulators by using different techniques [20,24,26]. Besides Shoman and Imine’s [22] study on simulator sickness evaluation, there are no sufficient data about how the lean feature influences the drivers motion sickness or even more on how it augments the experience realism. Matviienko et al. [27] suggested that using handlebar input induces less simulation sickness than body leaning for lab-static simulators. Taking into account these studies and the fact that the e-scooter driving demands minor-to-no lean behavior (due to wheel radius, vehicle size, and speed limit), a decision was made not to take into account the lean function in the e-scooter simulator prototype in order to avoid user simulator sickness and/or possible injuries by side fall.
- A polygonal “V-shaped” main frame made by a metal squared hollow section (40 mm) with total final dimensions of 1000 mm × 1650 mm that holds the bicycle and the bike trainer.
- A triangle base with angled steel blade (40 mm × 40 mm) that supports the main frame with a cross joint and holds the linear actuators (LA), with total final distance of 1000 mm × 980 mm. The cross joint role is dual: on the one hand to offer freedom of movement of 2 degrees (2FoD) without the need of a third actuator, and, on the other hand, to support a large amount of total weight so as to avoid overloading the LA.
- A bike trainer attached to main frame that adjusts the friction gearbox and measures wheel speed.
- Concerning the slope and lean function, two linear actuators (LA) are attached to the triangle base and are connected with the main frame with setscrews and ball joints.
2.2.2. Electromechanical Equipment and Sensors
- The steering angle is measured using an incremental rotary encoder (RE) (Figure 2s1) with sensitivity of 400 pulses per revolution. The rotary has two wire signals and, thus, “feeds” the software with 800 steps per revolution. This corresponds to 0.45 degrees sensitivity, which is more than satisfactory for the needs of the present research. The values of RE are mapped to a range of −60° to +60° to reproduce the exact range of e-scooter handlebar rotation.
- Since the e-scooter steering wheel is almost vertical to the ground and the wheel diameter is significantly smaller than the one on bicycles (8″−10″ in the majority of urban models), there is much lower friction in steering rotation. Nevertheless, in order to reproduce the sense of ‘resistance’ when turning the handlebar, a metal spring is attached on both the front wheel and the e-scooter chassis (Figure 2s2). The metal spring has an additional practical value, as it returns the steering wheel to its initial position, i.e., after a riding session, and the simulator gets ready for use without any calibration needed related to starting position.
- The surface slope variations are managed by an LA that is attached to the front part of the rectangular frame (Figure 2s3) offering 1 Degree of Freedom (DoF). The LA includes a built-in potentiometer that provides the absolute position of the actuator. The potentiometer provides values from 0 to 1023 and the stroke extends up to 20 cm; therefore, the LA accuracy is up to 0.2 mm.
- As previously discussed, most e-scooters require an initial speeding up provided by the user’s physical effort. To reproduce this feature, an initial speed “starter” mechanism was installed (Figure 2s4). It consists of a DC motor, a set of gears, and a mechanical switch. One gear is attached to the motor, while the other is attached to one cylinder and acts as a clutch. The switch is used to turn on the motor when the starter is pushed and the two gears are engaged together.
- The wheel speed measurement is achieved by attaching a circular disk filled with 60 holes in its circumference to one cylinder roller. Then, a photoelectric sensor counts the number of passing holes per time interval (Figure 2s5). Since the wheel’s and the cylinder’s circumferences are 67.8 cm and 9.4 cm, respectively, the rotation ratio is approximately 1/4.3. The accuracy depends on the time interval and the rotational speed, but, as a rule of thumb, due to 60 holes on the attached disk, each complete cylinder circle covers 9.4 cm, and therefore each hole represents 0.16 cm (9.4/60).
- The steering angle is measured using a high-accuracy 5 k ohm potentiometer (Figure 3b1). The potentiometer provides values from 0 to 1023 to ARDUINO in a circular range from 0 to 300 degrees and corresponds to 0.29 degrees sensitivity, which is more than satisfactory for the needs of the present research. The values of potentiometer are mapped to a range of −60° to +60° to reproduce the exact e-bicycle handlebar rotation.
- In order to reproduce the sense of ‘resistance’ when turning the handlebar, a metal torsion spring is attached on the box that covers the potentiometer and holds the front wheel with a metal curved cover (Figure 3b1). The metal spring has an additional practical value, as it returns the steering wheel to its initial position, i.e., after a riding session, and the simulator gets ready for use without any calibration needed related to the starting position.
- The surface slope variations and lateral rotation (lean function) are managed by two linear actuators (LAs) that are attached to the back side of the triangle base and the V-shaped main frame (Figure 3b2) and offer a 2-DoF. Each actuator includes a built-in potentiometer that provides the absolute position of the actuator. The potentiometer provides values from 0 to 1023 and the stroke extends up to 25 cm; therefore, the LA accuracy is up to 0.25 mm.
- The wheel speed measurement is achieved by attaching a rotary encoder (RE) to the bikers’ trainer cylinder with a high magnet and a spring that serves as a regulator to smooth any fluctuation due to limited alignment (Figure 3b3). The encoder offers vibration resistance and sensitivity of 360 pulses per revolution and has two wire signals; thus, it “feeds” the software with 720 steps per revolution. Since the bicycle wheel circumference is about 200 cm and the trainers’ cylinder is 9.4 cm, the rotation ratio is 1/21.2. As stated previously, the accuracy depends on the time interval and the rotational speed. Due to 720 pulses, each complete cylinders’ circle covers 9.4 cm and 720 pulses that considering distance accuracy is up to 0.01 cm (9.4/720).
2.2.3. Virtual Reality Environment (VRE) Development
- Improving rider safety and training: VR can be used to simulate a number of different scenarios and risk environments, allowing for riders to practice and become more familiar with safe riding techniques before actually using a real vehicle. Also, to train riders on the proper use of micromobility vehicles, such as how to properly operate e-scooters or e-bicycles and safety information about the technology.
- Enhancing rider experience: VR can be used to create immersive and interactive experiences for riders, such as virtual tours of cities or virtual races with friends.
- Testing and design: VR can be used to test and design new micromobility vehicles, allowing for manufacturers to evaluate performance, stability, and other important aspects before going into production.
- Simulating scenarios to address electric vehicle driving challenges: VR can be used to tackle issues specific to electric vehicles, such as range anxiety (the driver’s fear of insufficient battery capacity) or battery malfunctions.
- Cost-effective: VR is cost-effective, as it eliminates the need for physical prototypes and reduces the costs associated with testing and design.
3. Calibration Process and Results
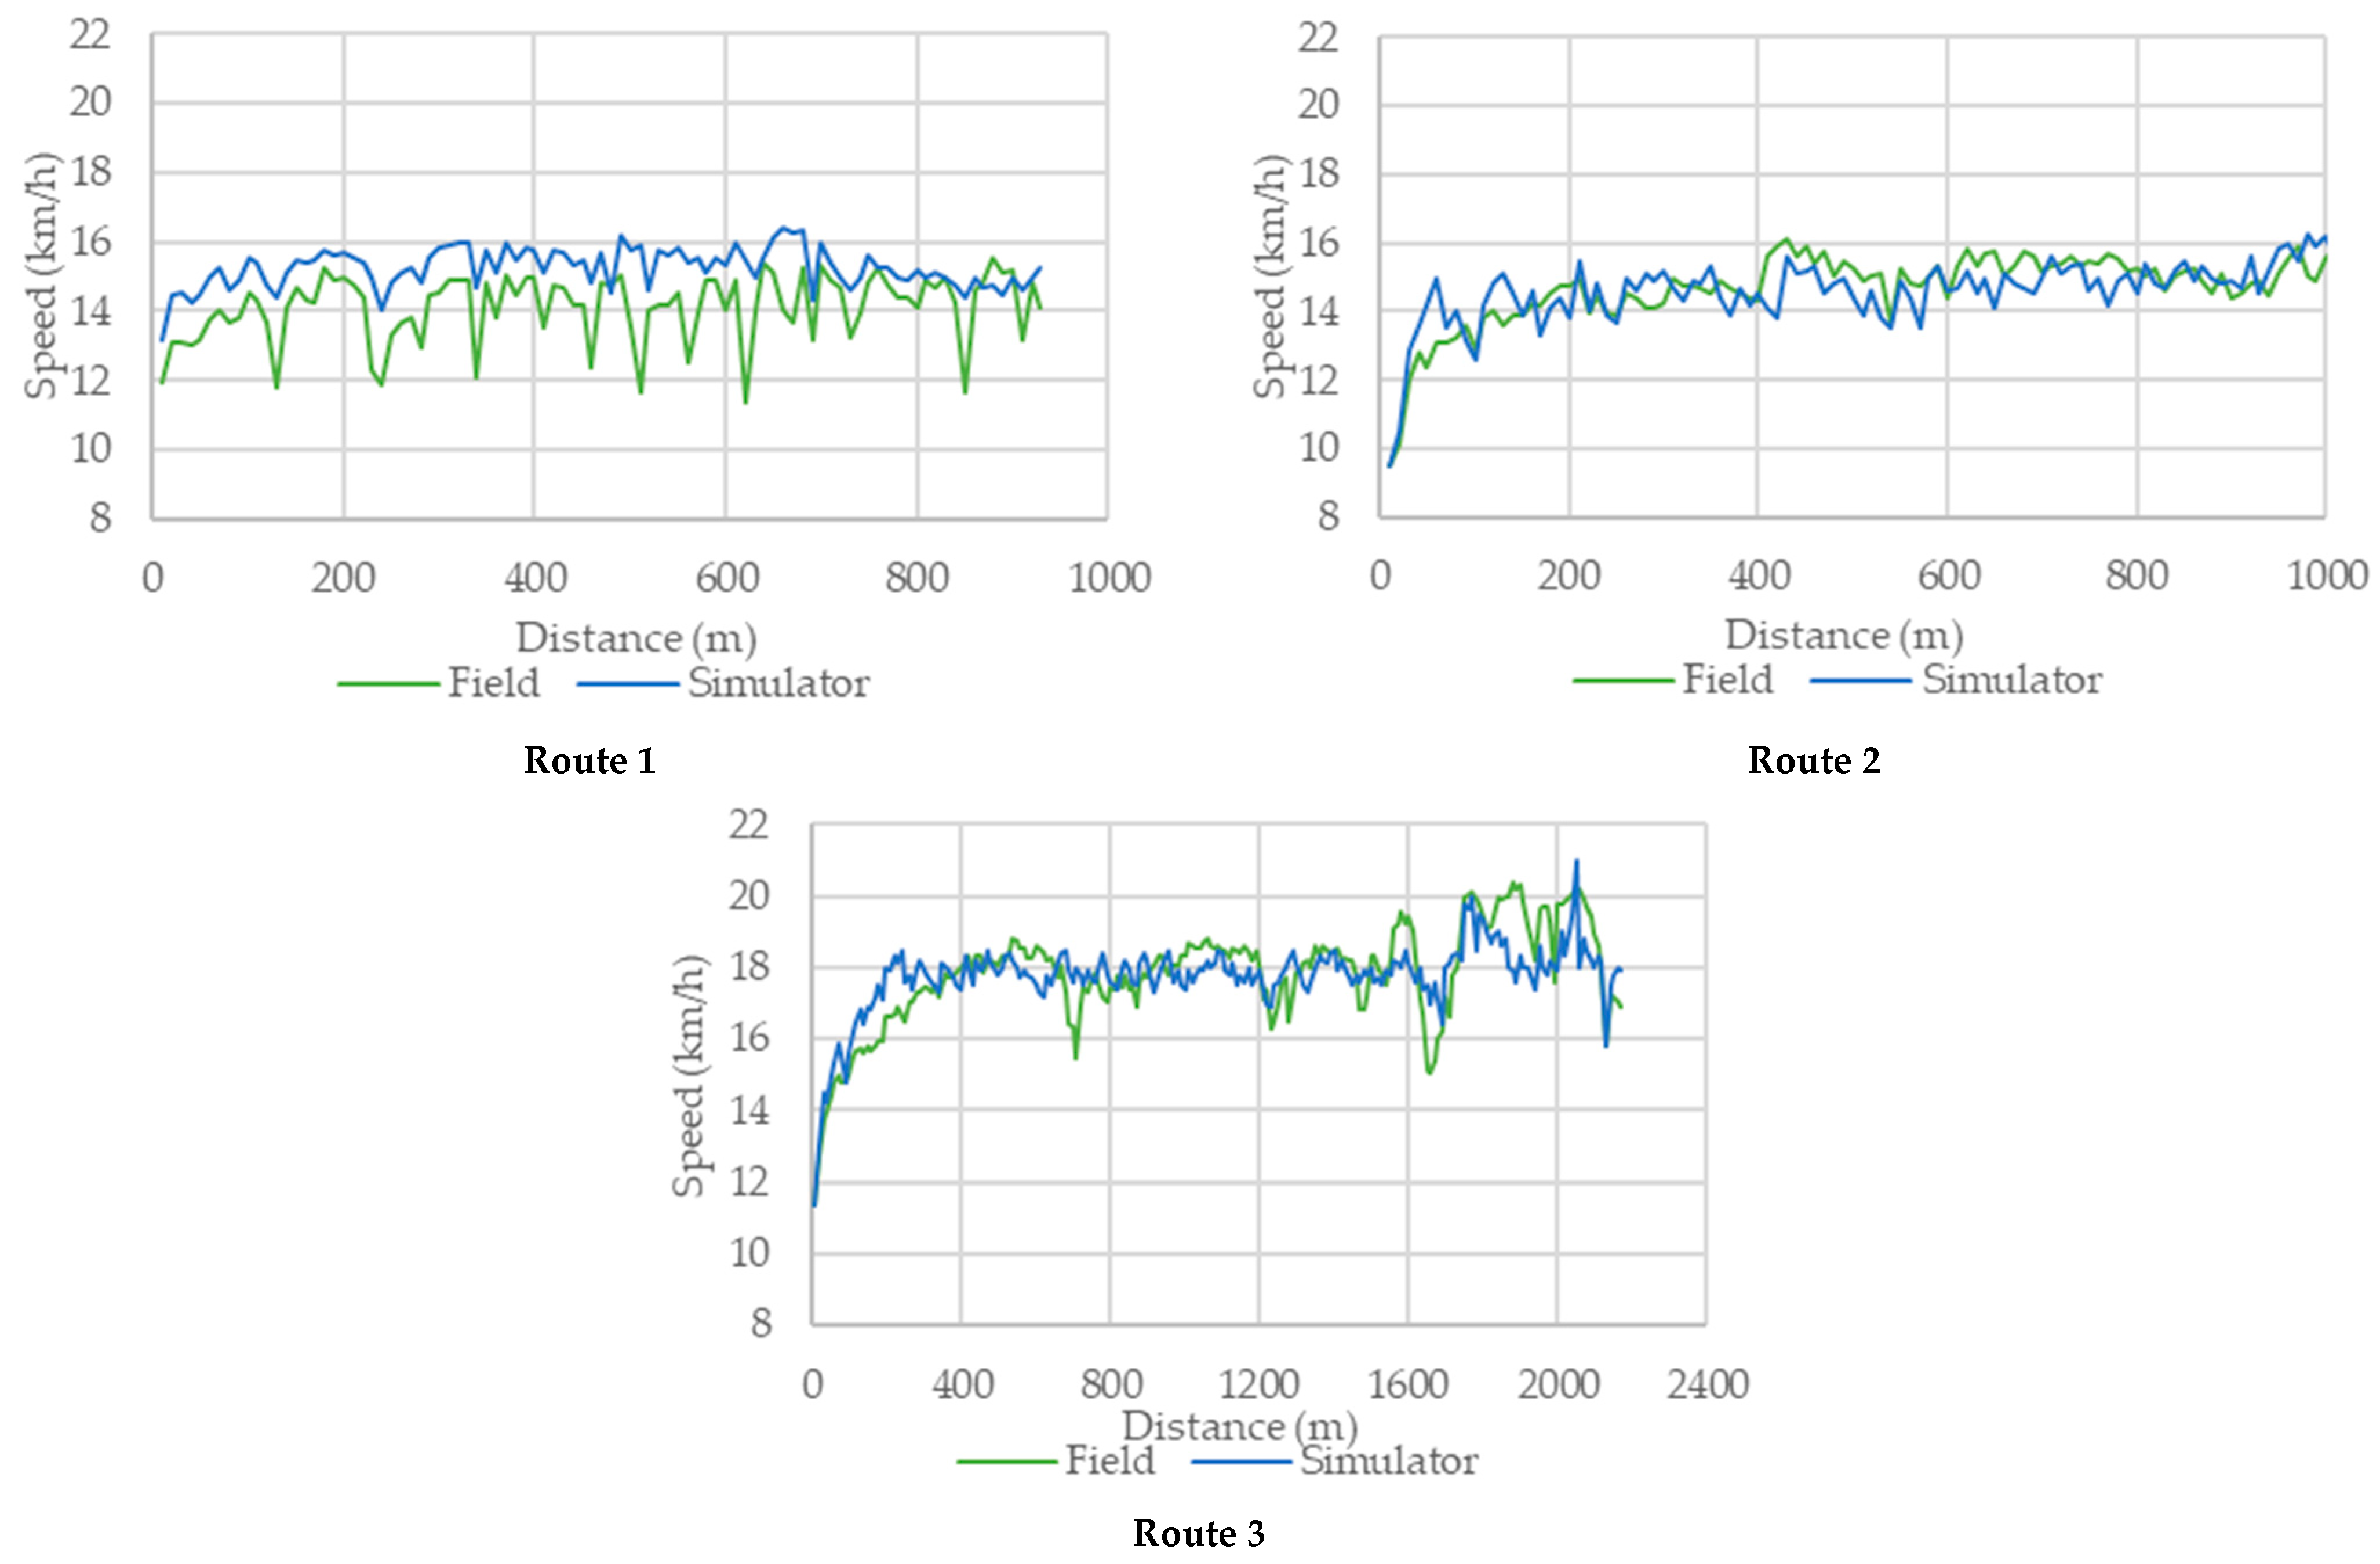
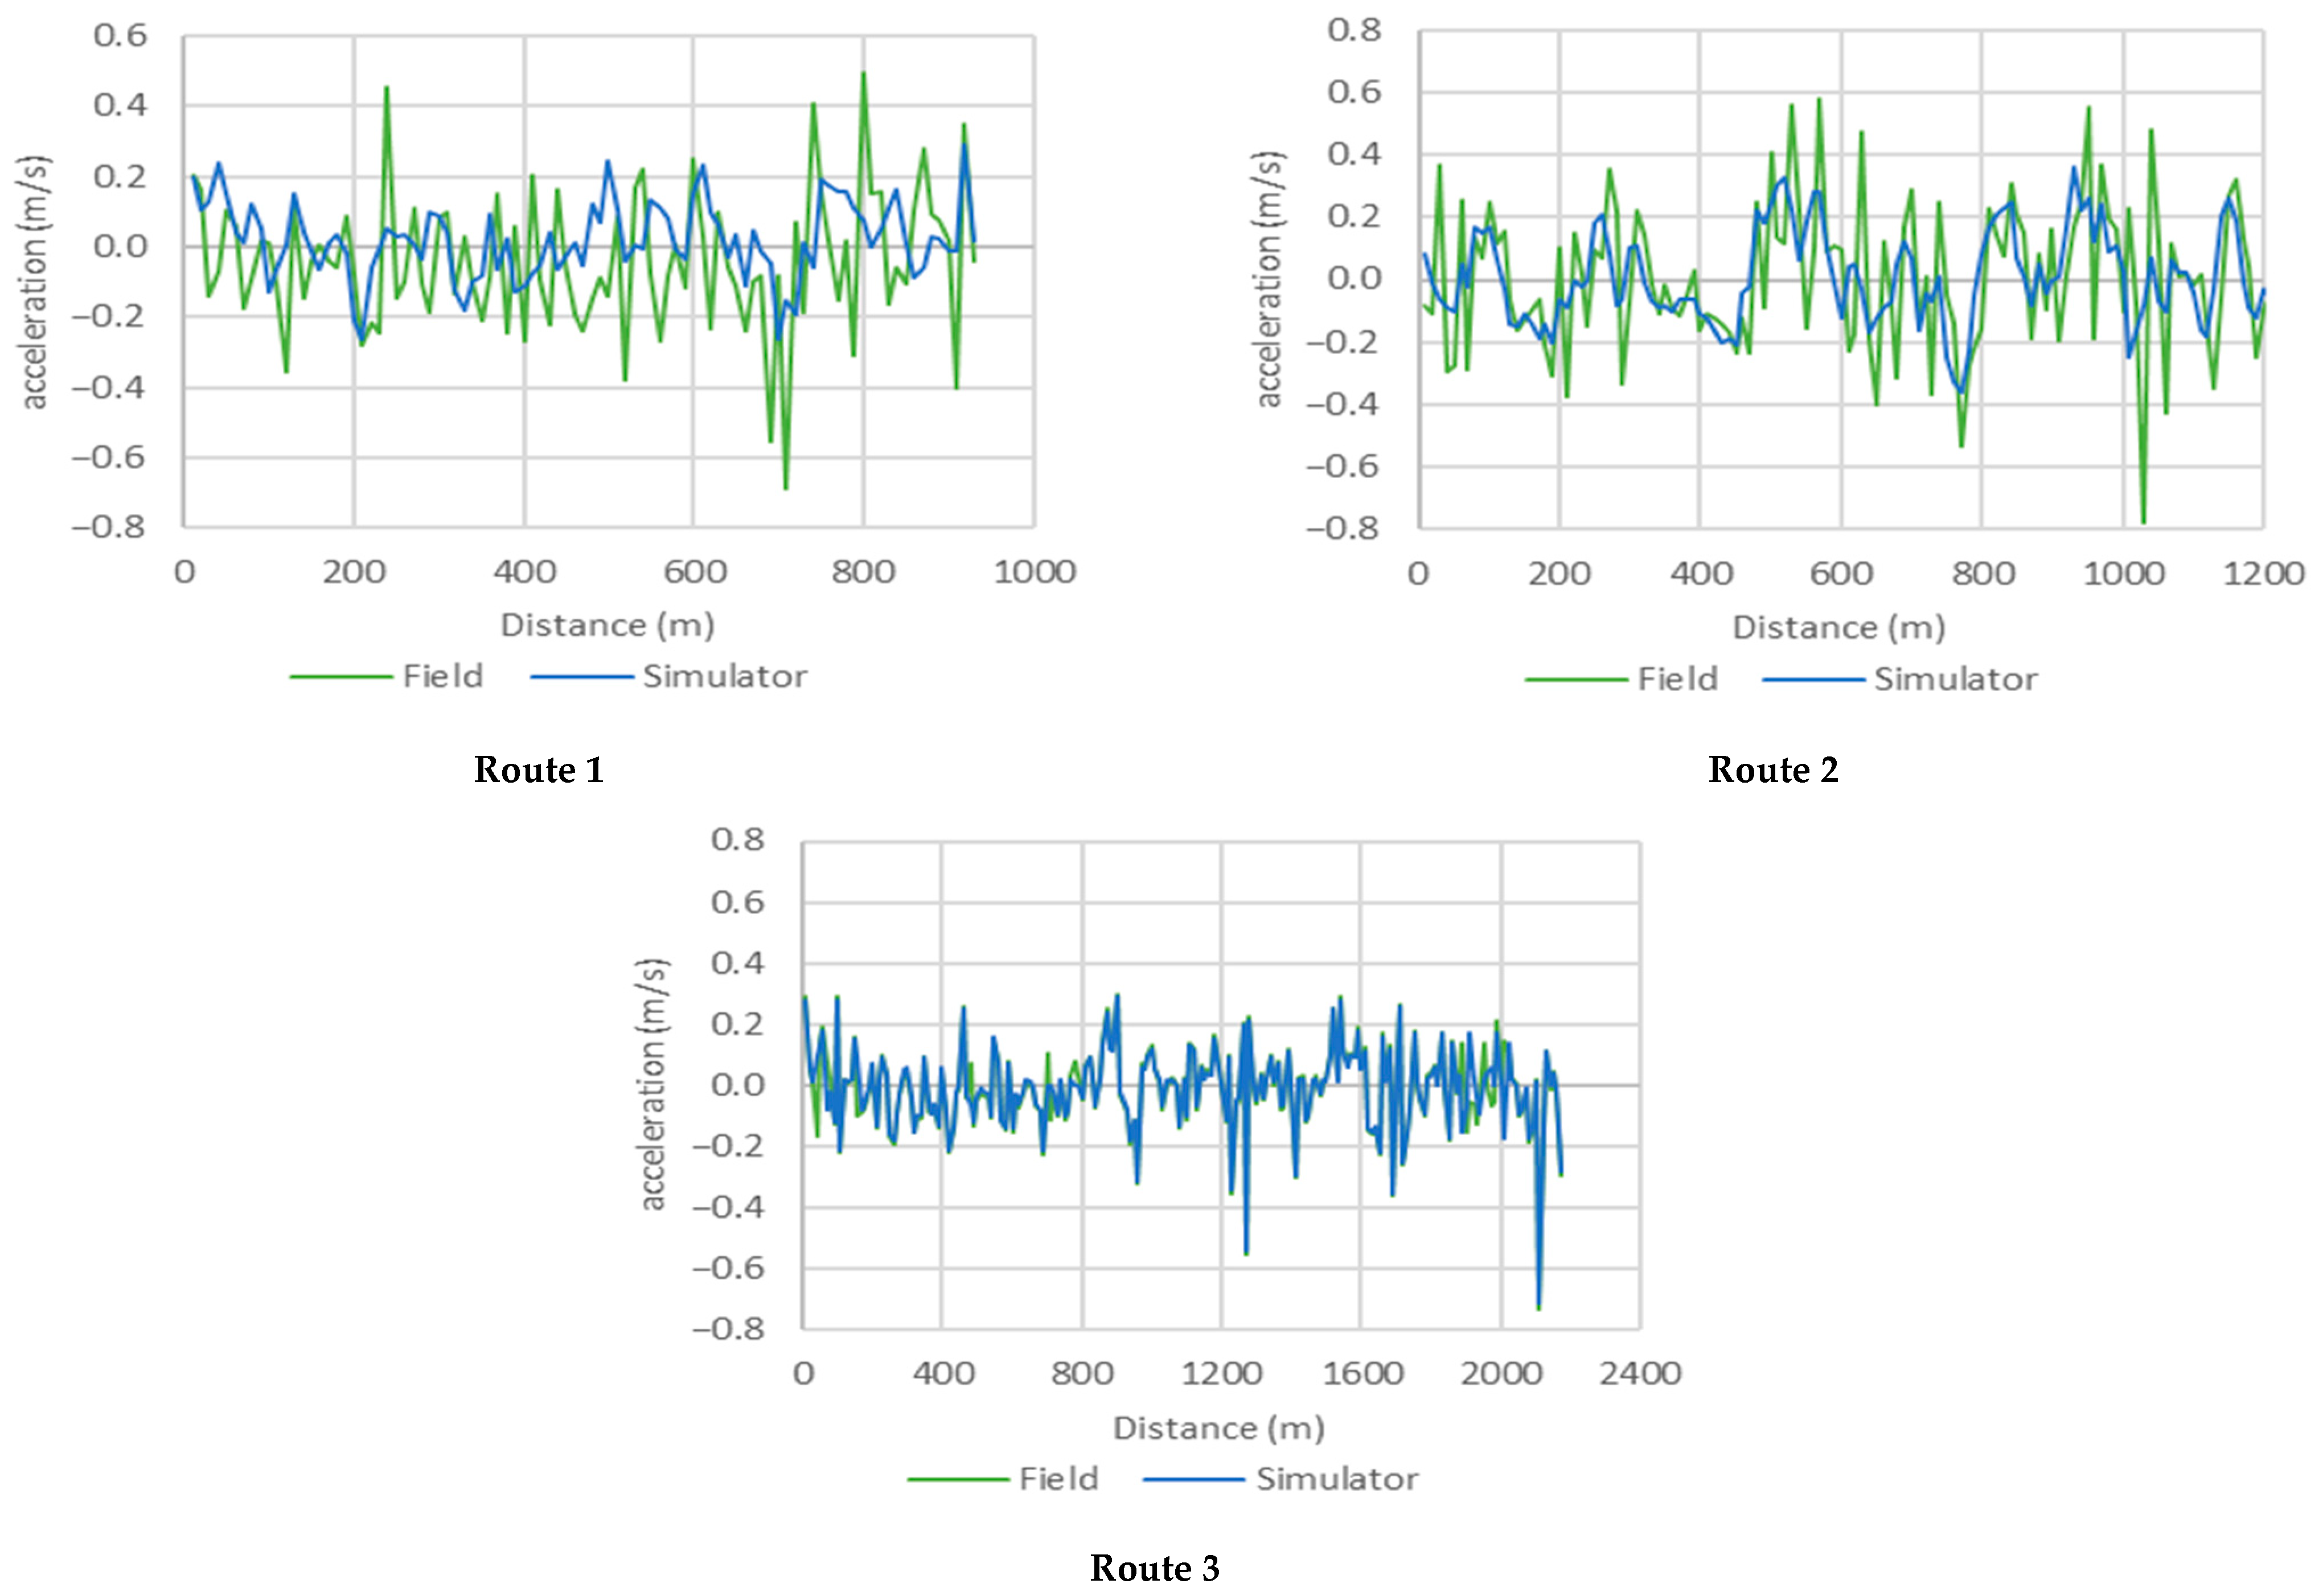
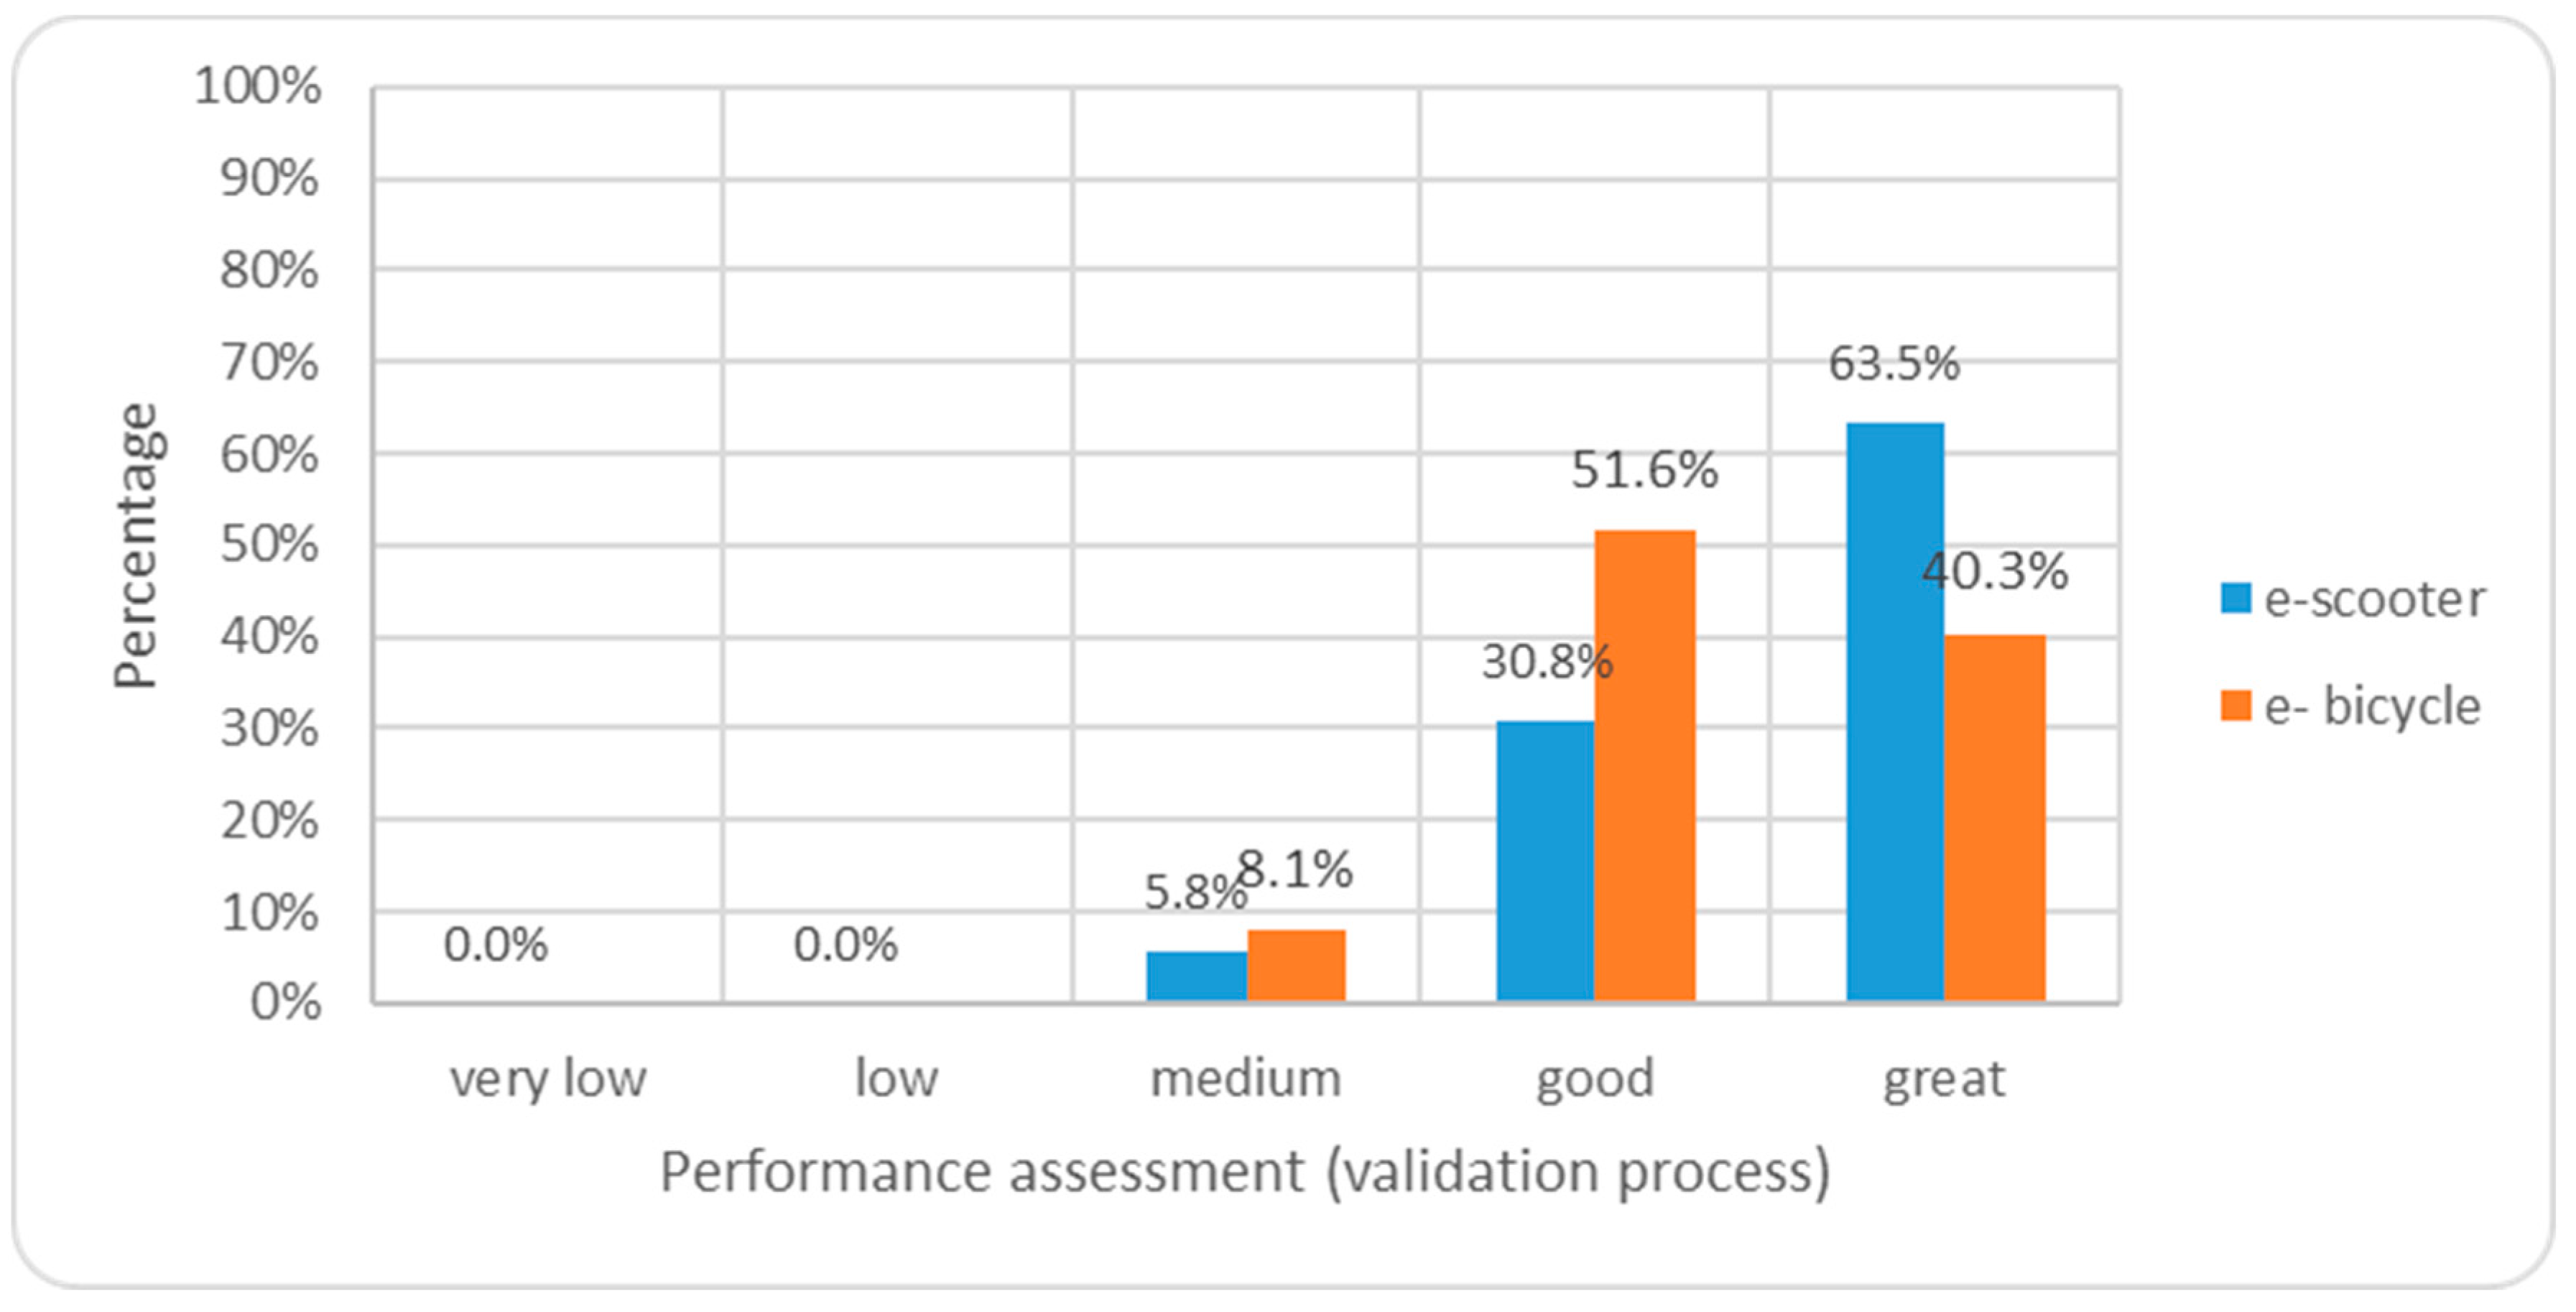
4. Validation Process and Results
5. Conclusions
Author Contributions
Funding
Institutional Review Board Statement
Informed Consent Statement
Data Availability Statement
Acknowledgments
Conflicts of Interest
Appendix A

| Bicycle Simulator | France (IFSTTAR Bicycle Simulator [22]) (Conventional) | USA (ZouSim Bicycling Simulator [14]) (Conventional) | Korea (KAIST Interactive Bicycle Simulator [20]) (Conventional) | Netherlands (Bicycle Simulator at TU Delft [17]) (Conventional) | Germany (MoSAIC-VRU-Lab [21]) (Electric) | Greece (Electric) |
|---|---|---|---|---|---|---|
| Vehicle Type | n/a | Trek 800 low frame | n/a | Low Frame | n/a | Ideal Futour 509 |
| Vision angle (degrees) | 225 horizontal, 55 vertical | n/a | n/a | n/a | n/a | 60 horizontal, 55 vertical (or 360o via VR headset) |
| VRE projection | 5 displays | 65″ LCD Display | PC Projector, VR Headset | PC Projector, VR Headset | VR Headset | PC Projector, VR Headset |
| Steering haptic devices | Yes | No | Yes | Yes | Yes | No |
| Steering angle range (degrees) | ±20 | ±45 | n/a | ±35 | n/a | ±60 |
| Steering angle measurement | Rotary encoder | Laser and 2 cameras, optical method | Rotary encoder | Rotary encoder | Steering force motor | Potentiometer |
| Speed measurement | Incremental encoder | Current production circuit | n/a | Disk with holes and Photoelectric sensor | Incremental encoder | Rotary encoder |
| Vehicle base frame/Degrees of Freedom (DoF) | Static platform, lateral suspension, 1DoF | Wooden platform, bike trainer, wheel rotation base, 1DoF | Stewart platform (6 legs), 3DoF | Bike trainer, wheel rotation base, 1DoF | Bike trainer, 2DoF | Bike trainer, V-shaped frame, triangle base, wheel rotation base 2DoF |
| Lateral suspension/Lean function | Yes | No | Yes | No | Yes | Yes |
| Surface slope function | Yes | No | Yes | No | Yes | Yes |
| Surface type simulation | Yes | No | Yes | No | No | No |
| Air flow impact | Yes | No | No | No | Yes | No |
| Adjustable steering wheel and seat dimensions | No | Yes | No | Yes | No | Yes |
| Validation process | Users’ evaluation (No. 36), velocity, steering (performance) | n/a | n/a | Users’ evaluation (No. 15), in-field, velocity, steering (performance, resistance), leaning, slope, brake | Users’ evaluation (No. 27), in-field, velocity, steering (performance, resistance), leaning, brake | Users’ evaluation (No. 112), in-field, velocity, steering (performance, resistance), leaning, slope, brake, users vision comfort |
| Vehicle Intervention | Minor | Minor | Major | Major | Major | None |
References
- Foissaud, N.; Gioldasis, C.; Tamura, S.; Christoforou, Z.; Farhi, N. Free-Floating E-Scooter Usage in Urban Areas: A Spatio-Temporal Analysis. J. Transp. Geogr. 2022, 100, 103335. [Google Scholar] [CrossRef]
- Dias, G.; Arsenio, E.; Ribeiro, P. The Role of Shared E-Scooter Systems in Urban Sustainability and Resilience during the COVID-19 Mobility Restrictions. Sustainability 2021, 13, 7084. [Google Scholar] [CrossRef]
- Psarrou Kalakoni, A.M.; Christoforou, Z.; Gioldasis, C. The Ambivalent Relationship of E-Scooters and Public Transport: Evidence from France. Transp. Policy 2024, 159, 215–229. [Google Scholar] [CrossRef]
- Christoforou, Z.; Psarrou Kalakoni, A.M.; Gioldasis, C. Mode Shifts from Public Transport to Bike-Sharing in the Era of COVID-19: Riding Back to Normality. J. Public Transp. 2023, 25, 100071. [Google Scholar] [CrossRef]
- Zhang, Y.; Nelson, J.D.; Mulley, C. Learning from the Evidence: Insights for Regulating E-Scooters. Transp. Policy 2024, 151, 63–74. [Google Scholar] [CrossRef]
- Ragonez, D.; Mimoun, M.; Chaouat, M.; Levy, S.; Vairinho, A.; Boccara, D.; Serror, K. Burns Caused by Exploding Standing Electric Scooters (E-Scooters): A New Phenomenon. J. Burn Care Res. 2020, 42, 348–349. [Google Scholar] [CrossRef]
- Blana, E. Driving Simulator Validation Studies: A Literature Review; Institute of Transport Studies, University of Leeds: Leeds, UK, 1996. [Google Scholar]
- Rashmi, B.S.; Marisamynathan, S. Factors Affecting Truck Driver Behavior on a Road Safety Context: A Critical Systematic Review of the Evidence. J. Traffic Transp. Eng. (Engl. Ed.) 2023, 10, 835–865. [Google Scholar]
- Shappell, S.; Wiegmann, D. Human Factors Investigation and Analysis of Accidents and Incidents. Encycl. Forensic Sci. 2013, 440–449. [Google Scholar]
- Bucsuházy, K.; Matuchová, E.; Zůvala, R.; Moravcová, P.; Kostíková, M.; Mikulec, R. Human Factors Contributing to the Road Traffic Accident Occurrence. Transp. Res. Procedia 2020, 45, 555–561. [Google Scholar] [CrossRef]
- Dols, J.F.; Molina, J.; Moll, S.; López, G.; Camacho-Torregrosa, F.J.; García, A. Analysis of the Vehicle-Bicycles Interaction on Two-Lane Rural Roads Using a Driving Simulator Based on Field Data. Transp. Res. Procedia 2021, 58, 543–550. [Google Scholar] [CrossRef]
- Scott-Deeter, L.; Hurwitz, D.; Russo, B.; Smaglik, E.; Kothur, S. Assessing the Impact of Three Intersection Treatments on Bicyclist Safety Using a Bicycling Simulator. Accid. Anal. Prev. 2023, 179, 106877. [Google Scholar] [CrossRef] [PubMed]
- Nazemi, M.; van Eggermond, M.; Erath, A.; Schaffner, D.; Joos, M.; Axhausen, K.W. Studying Bicyclists’ Perceived Level of Safety Using a Bicycle Simulator Combined with Immersive Virtual Reality. Accid. Anal. Prev. 2021, 151, 105943. [Google Scholar] [CrossRef]
- Sun, C.; Qing, Z.; Petit, C. Design and Construction of a Virtual Bicycle Simulator for Evaluating Sustainable Facilities Design. Adv. Civ. Eng. 2018. [Google Scholar] [CrossRef]
- O’Hern, S.; Oxley, J.; Stevenson, M. Validation of a Bicycle Simulator for Road Safety Research. Accid. Anal. Prev. 2017, 100, 53–58. [Google Scholar] [CrossRef]
- Wintersberger, P.; Matviienko, A.; Schweidler, A.; Michahelles, F. Development and Evaluation of a Motion-Based VR Bicycle Simulator. Proc. ACM Hum.-Comput. Interact. 2022, 6, 1–19. [Google Scholar] [CrossRef]
- Dialynas, G.; Happee, R.; Schwab, A.L. Design and Hardware Selection for a Bicycle Simulator. Mech. Sci. 2019, 10, 1–10. [Google Scholar] [CrossRef]
- He, Q.; Fan, X.; Ma, D. Full Bicycle Dynamic Model for Interactive Bicycle Simulator. J. Comput. Inf. Sci. Eng. 2005, 5, 373–380. [Google Scholar] [CrossRef]
- Abdelgawad, K.; Gausemeier, J.; Dumitrescu, R.; Grafe, M.; Stöcklein, J.; Berssenbrügge, J. Networked Driving Simulation: Applications, State of the Art, and Design Considerations. Designs 2017, 1, 4. [Google Scholar] [CrossRef]
- Kwon, D.-S.; Yang, G.-H.; Lee, C.-W.; Shin, J.-C.; Park, Y.; Jung, B.; Lee, D.Y.; Lee, K.; Han, S.-H.; Yoo, B.-H.; et al. KAIST Interactive Bicycle Simulator. In Proceedings of the 2001 IEEE International Conference on Robotics and Automation, Seoul, Republic of Korea, 21–26 May 2001. [Google Scholar]
- Garcia, D.M.; Gröne, K.; Fischer, M.; Zhao, M.; Bergen, M. Validation of a Bicycle Simulator Based on Objective Criteria. In The Evolving Scholar—BMD 2023, 5th ed.; TU Delft OPEN: Delft, The Netherlands, 2023. [Google Scholar]
- Shoman, M.M.; Imine, H. Bicycle Simulator Improvement and Validation. IEEE Access 2021, 9, 55063–55076. [Google Scholar] [CrossRef]
- Hammami, A.; Borsos, A.; Pál Sándor, Á. How Realistic a Bicycle Simulator Can Be?—A Validation Study. Multimodal Transp. 2025, 4, 1. [Google Scholar] [CrossRef]
- Haasnoot, J.; Happee, R.; van der Wijk, V.; Schwab, A. Validation of a Novel Bicycle Simulator with Realistic Lateral and Roll Motion. Veh. Syst. Dyn. 2023, 62, 1802–1826. [Google Scholar]
- Chang, E.; Kim, H.T.; Yoo, B. Virtual Reality Sickness: A Review of Causes and Measurements. Int. J. Hum.-Comput. Interact. 2020, 36, 1658–1682. [Google Scholar]
- Hamad, A. Two Wheelistic: Development of a High-Fidelity Virtual Reality Cycling Simulator for Transportation. Ph.D. Dissertation, University of Michigan-Dearborn, Dearborn, MI, USA, 2021. [Google Scholar]
- Matviienko, A.; Müller, F.; Zickler, M.; Gasche, L.A.; Abels, J.; Steinert, T.; Mühlhäuser, M. Reducing Virtual Reality Sickness for Cyclists in VR Bicycle Simulators. In Proceedings of the CHI Conference on Human Factors in Computing Systems, New Orleans, LA, USA, 29 April–5 May 2022. [Google Scholar]
- Christoforou, Z.; Gioldasis, C.; Valero, Y.; Vasileiou-Voudouris, G. Smart Traffic Data for the Analysis of Sustainable Travel Modes. Sustainability 2022, 14, 11150. [Google Scholar] [CrossRef]


| Variable | Values Range | Step | Optimal Value |
|---|---|---|---|
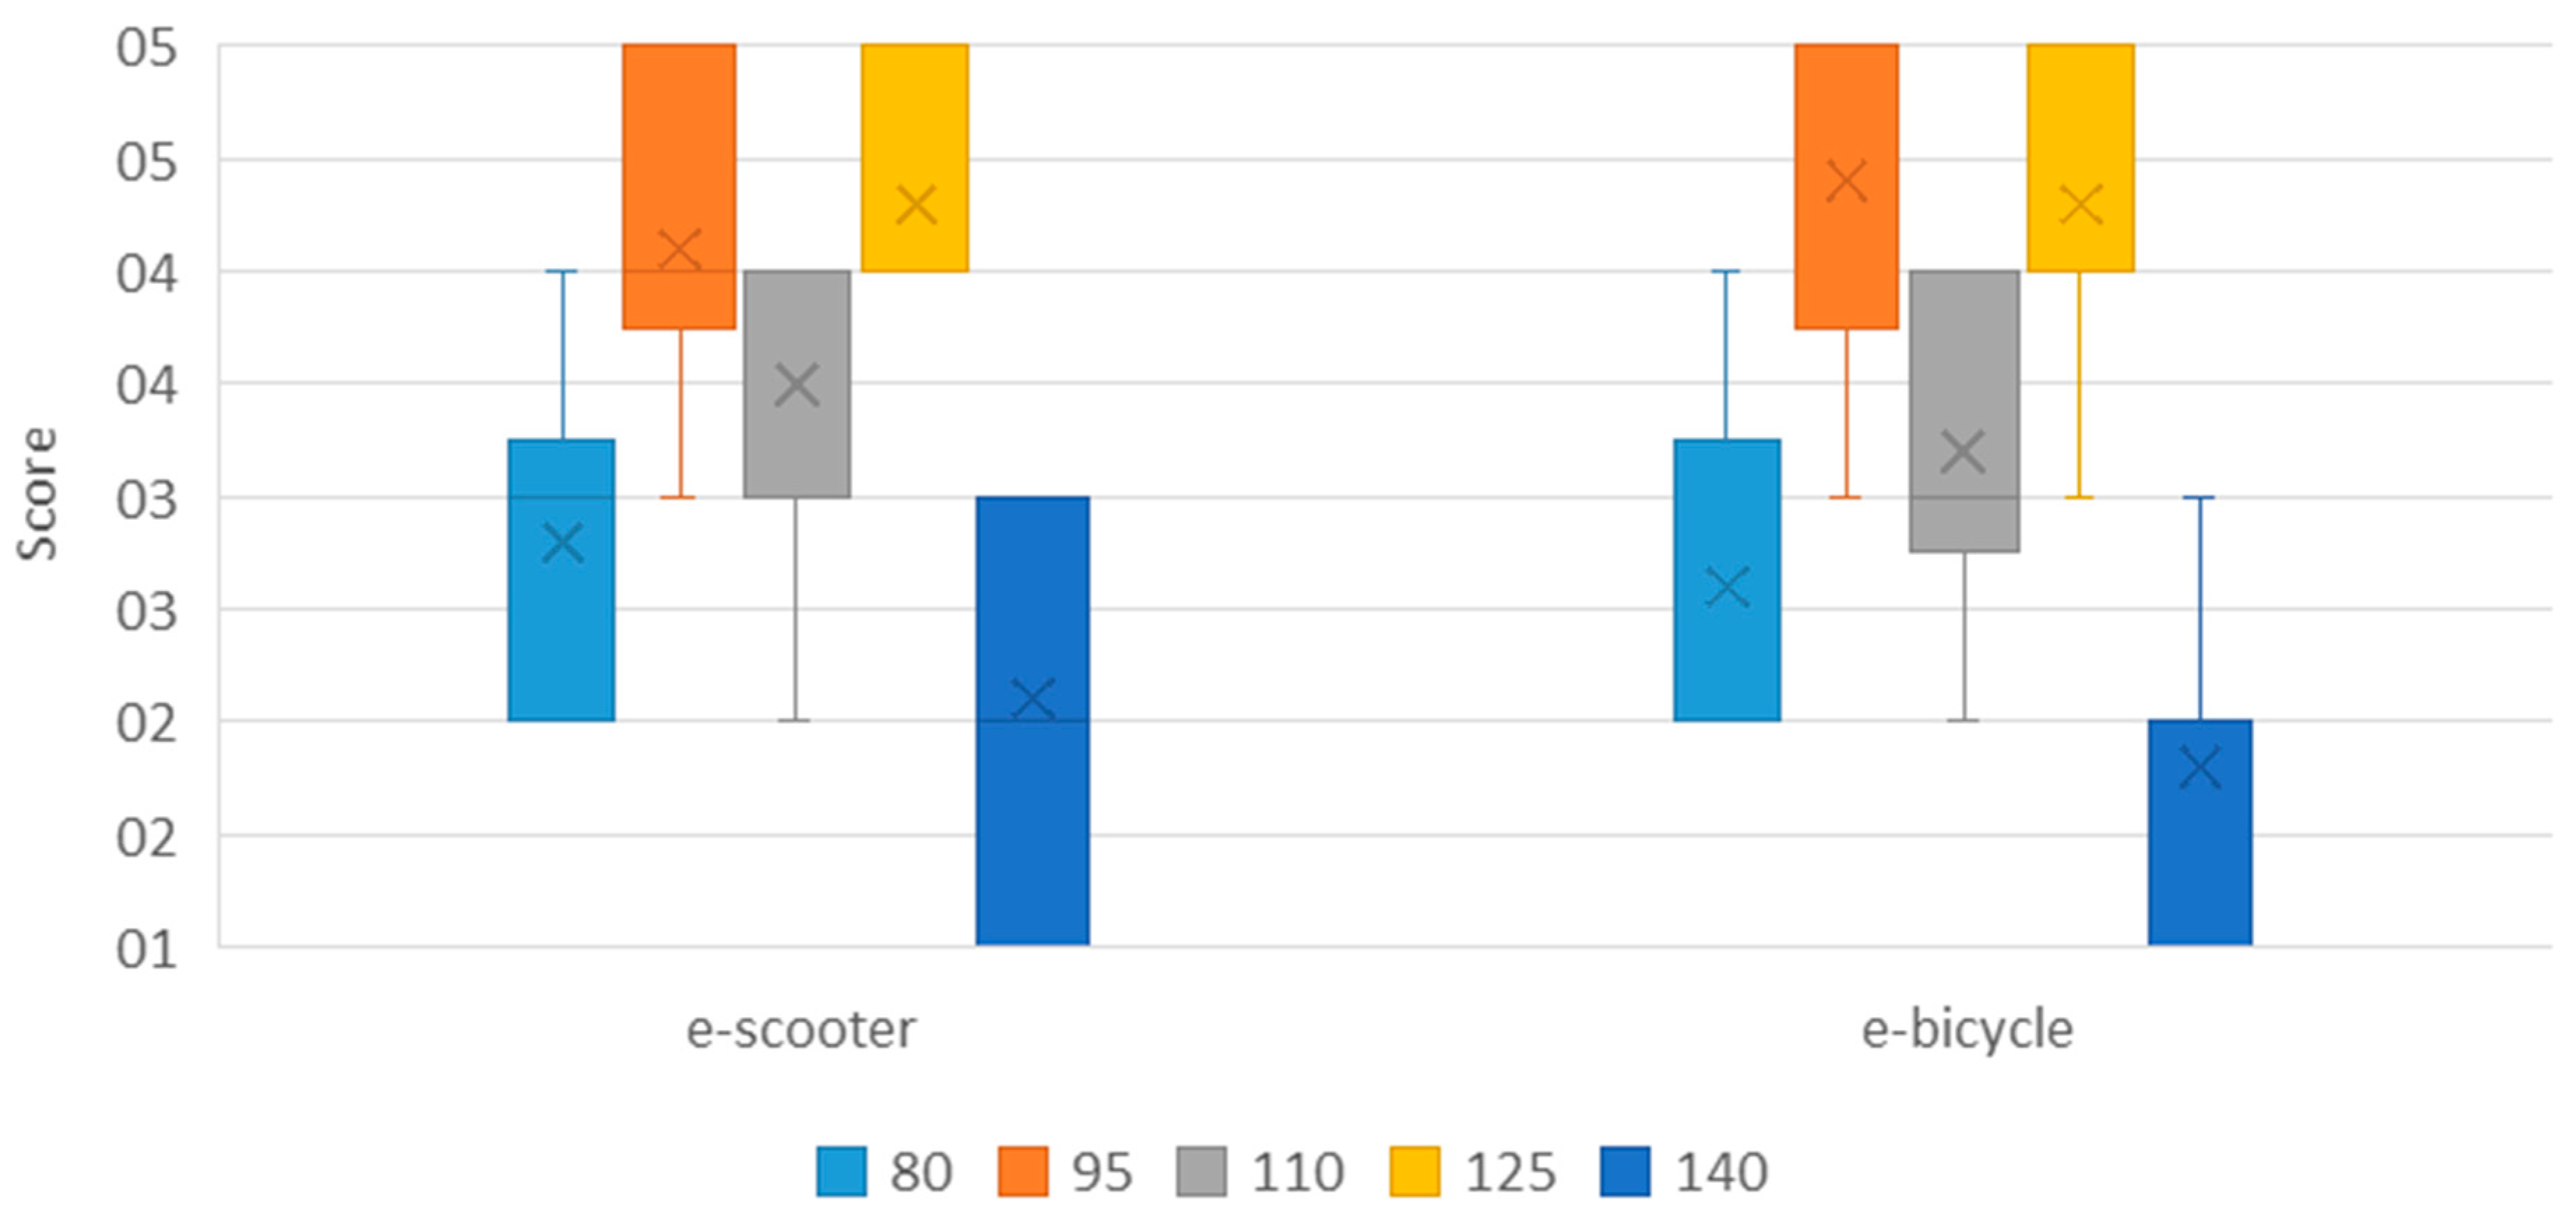
| FoV | 80–140 | 15 | 95, 125 |
| Wheel torque | 100–500 | 100 | 300 |
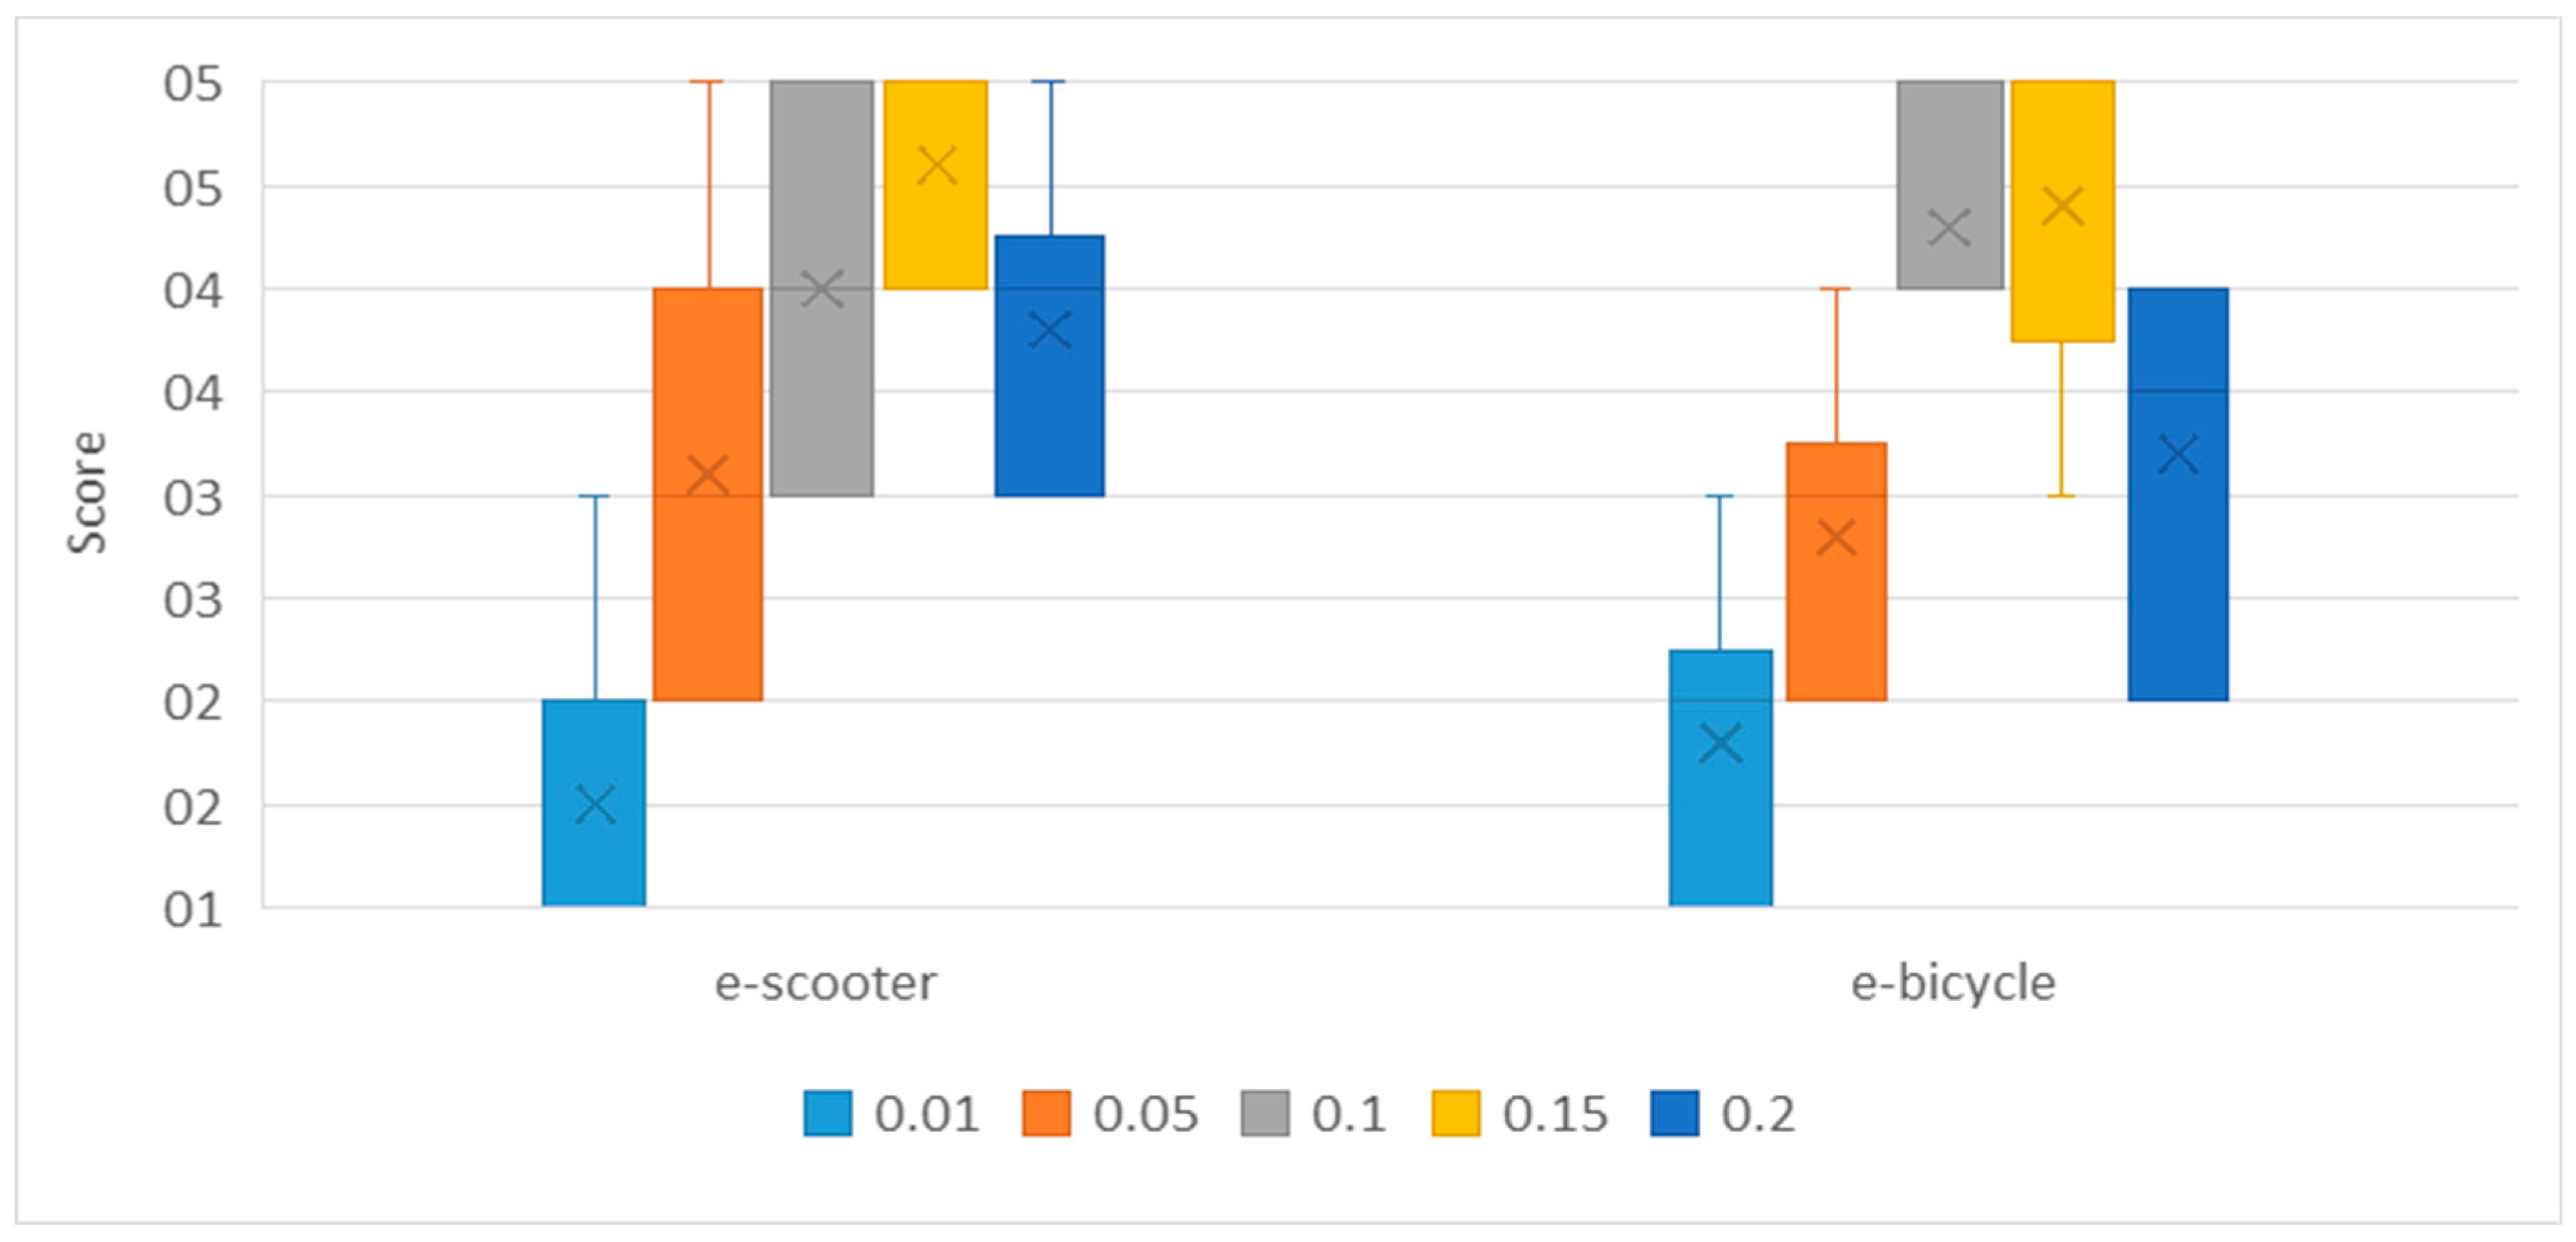
| Brake effect | 0.01–0.2 | 0.05 | 0.15 |
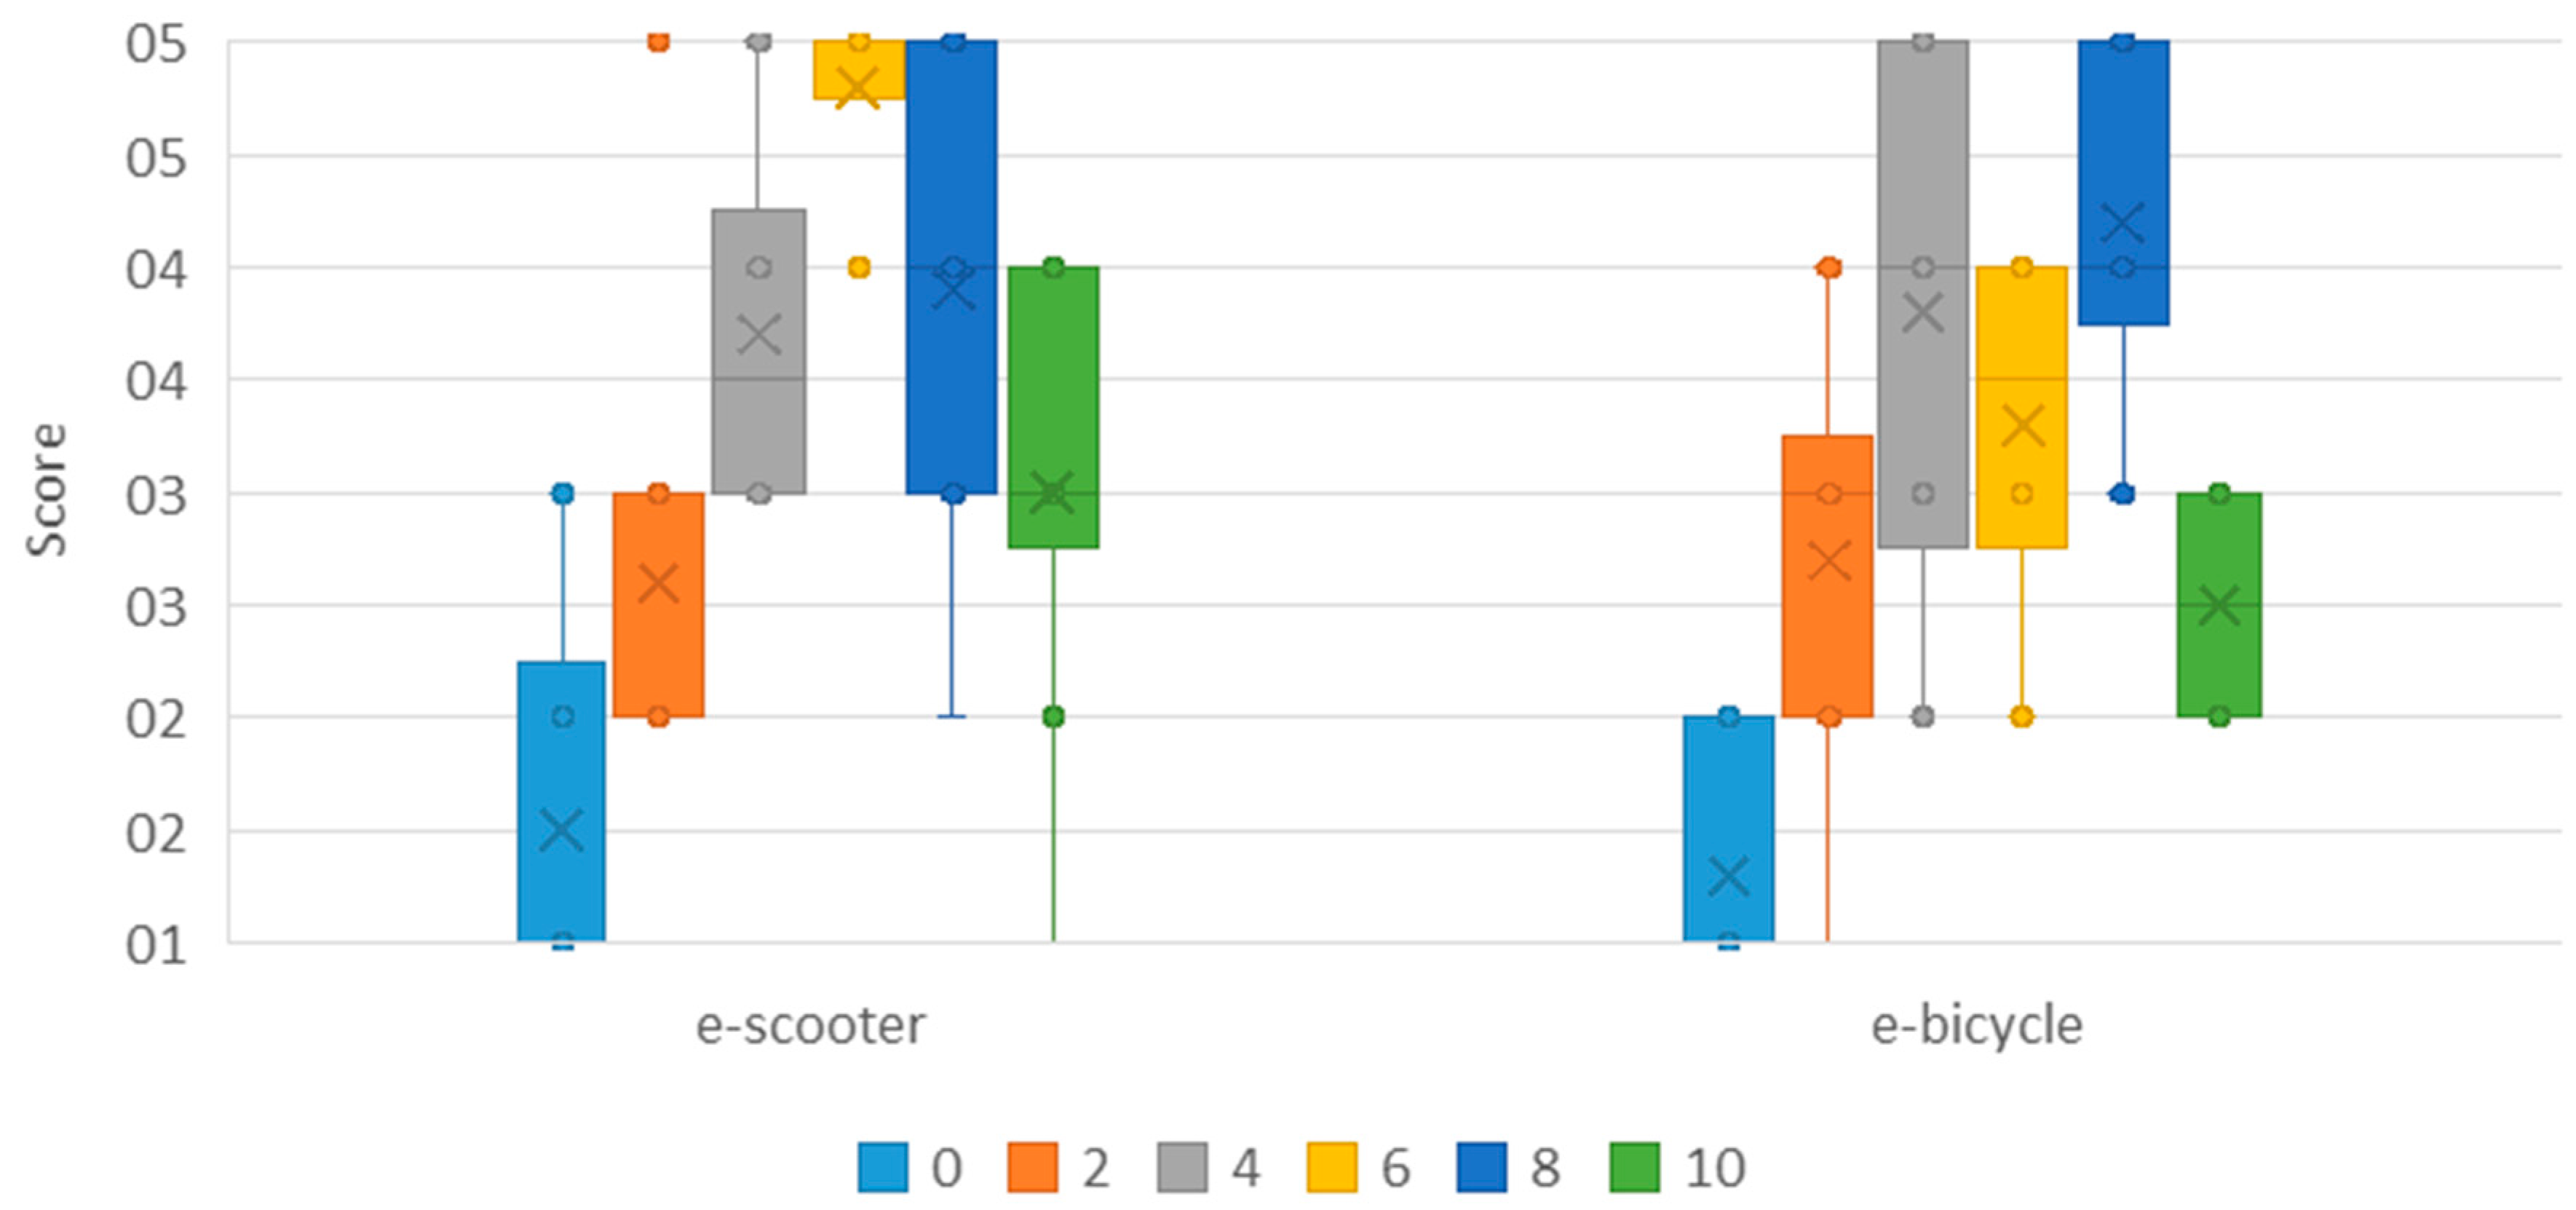
| Steering resistance | 0–10 | 2 | 4 |
| Variable | Parameter | Description |
|---|---|---|
| FoV | Distance assessment | Distance from buildings, obstacles, etc. |
| Wheel torque | Sense of speed | How close to field speed |
| Brake effect | Sense of braking | How close to real vehicle braking |
| Steering resistance | Handlebar performance | Steering realism |
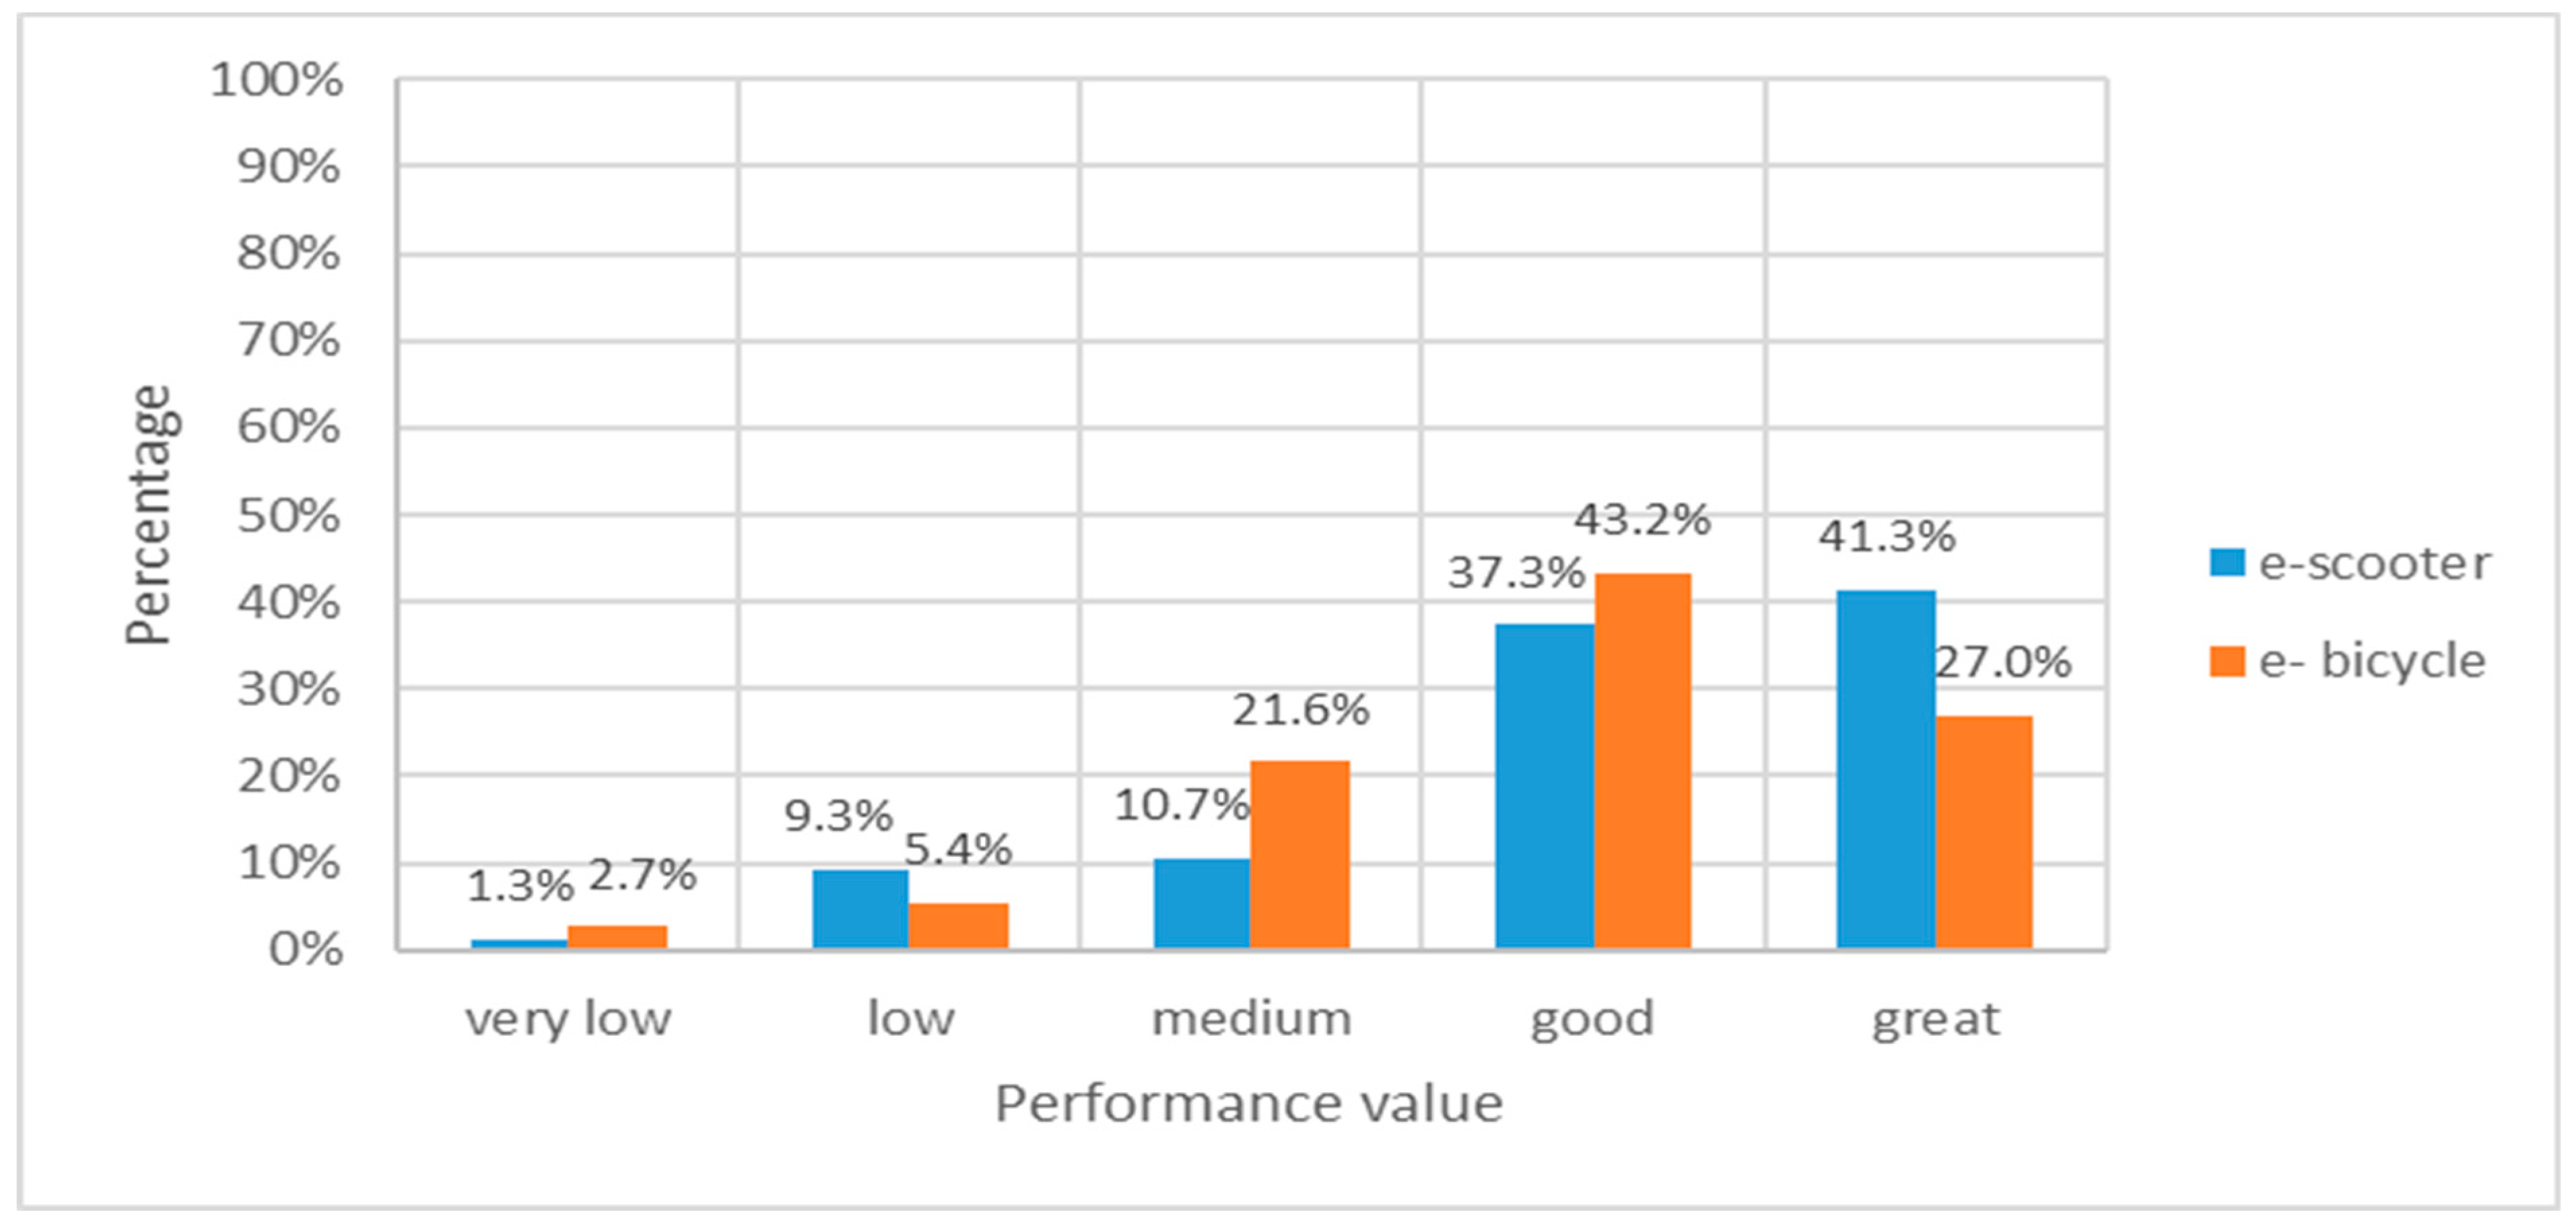
| n/a | Overall performance | Realism of the whole experience |
Disclaimer/Publisher’s Note: The statements, opinions and data contained in all publications are solely those of the individual author(s) and contributor(s) and not of MDPI and/or the editor(s). MDPI and/or the editor(s) disclaim responsibility for any injury to people or property resulting from any ideas, methods, instructions or products referred to in the content. |
© 2025 by the authors. Licensee MDPI, Basel, Switzerland. This article is an open access article distributed under the terms and conditions of the Creative Commons Attribution (CC BY) license (https://creativecommons.org/licenses/by/4.0/).
Share and Cite
Christoforou, Z.; Kallianiotis, A.; Farhi, N. Design, Development, and Validation of Driving Simulators for Enhancing the Safety and Sustainability of Electric Microvehicles. Sustainability 2025, 17, 3260. https://doi.org/10.3390/su17073260
Christoforou Z, Kallianiotis A, Farhi N. Design, Development, and Validation of Driving Simulators for Enhancing the Safety and Sustainability of Electric Microvehicles. Sustainability. 2025; 17(7):3260. https://doi.org/10.3390/su17073260
Chicago/Turabian StyleChristoforou, Zoi, Anastasios Kallianiotis, and Nadir Farhi. 2025. "Design, Development, and Validation of Driving Simulators for Enhancing the Safety and Sustainability of Electric Microvehicles" Sustainability 17, no. 7: 3260. https://doi.org/10.3390/su17073260
APA StyleChristoforou, Z., Kallianiotis, A., & Farhi, N. (2025). Design, Development, and Validation of Driving Simulators for Enhancing the Safety and Sustainability of Electric Microvehicles. Sustainability, 17(7), 3260. https://doi.org/10.3390/su17073260