Article

Numerical Study on the Mechanism of Stoichiometric Combustion Knock in Marine Natural Gas Low-Carbon Engines in Rapid Compression Machine Combustion Chambers

1
School of Mechanical Engineering, Beijing Institute of Technology, Beijing 100081, China
2
China North Engine Research Institute, Tianjin 300400, China
3
School of Mechanical and Energy Engineering, Beijing University of Technology, Beijing 100124, China
*
Authors to whom correspondence should be addressed.
Sustainability 2025, 17(7), 3274; https://doi.org/10.3390/su17073274
Submission received: 8 February 2025 / Revised: 20 March 2025 / Accepted: 27 March 2025 / Published: 7 April 2025
(This article belongs to the Special Issue Green Shipping and Operational Strategies of Clean Energy)

Abstract

:
The vigorous development of marine engines fueled by natural gas can effectively support the reform of energy structures in the field of ship power, aligning with the global trend toward sustainable development and green shipping. However, the presence of knock significantly hinders the improvement of engine thermal efficiency. Therefore, studying the knock mechanism in natural gas engines is not only crucial for enhancing engine power and economy but also for advancing the transition to cleaner and more sustainable energy sources in the maritime industry. In this paper, via a 2D numerical model, the dominant role in the knock mechanism of stoichiometric methane combustion in a combustion chamber of a rapid compression machine (RCM) is revealed. It further establishes the association mechanism between constant-volume combustion and pressure wave suppression at high temperatures. The results show that the knock is caused by the end-gas auto-ignition. The increase in initial temperature can significantly change auto-ignition modes and combustion modes, but initial pressure has little effect on this. The increase in initial temperature will inhibit the strength of pressure waves, and the increase in initial pressure cannot significantly increase the strength of pressure waves. The main cause why auto-ignition occurs earlier is not due to the increase in the strength of pressure waves, but the decrease in the required increase in temperature to attain ignition temperature caused by the increase in initial temperature. The peak pressure is affected by the initial pressure on the left wall before auto-ignition and the increase in pressure on the left wall at low to medium initial temperature. The pressure oscillation amplitude is positively correlated to the increase in pressure on the left wall. Constant volume combustion will occur at a high initial temperature. The increase and decrease in pressure are very uniform which will lead to the decrease in the pressure oscillation amplitude. The peak pressure depends on the influence of initial temperature and pressure on the increase in pressure produced by constant volume combustion.

1. Introduction

In recent years, with the development of international trade and cross-regional trade, the status of ship transportation is increasingly rising. At the same time, the harm of ship exhaust emissions to the environment is becoming more and more serious. Statistics show that greenhouse gases produced by maritime transport account for about 3% of the global total emissions, nitrogen oxides (NOx) about 13%, and sulfur oxides (SOx) about 12%, in addition to pollutants such as particulate matter (PM) and methane (CH4) [1]. In order to limit the increasing pollution emissions from international shipping and align with global sustainability goals, the International Maritime Organization (IMO) issued the Tier III standard in 2016, emphasizing the role of clean energy and energy management strategies in achieving low/zero carbon marine power systems. This standard requires a reduction of 80% in nitrogen oxide emissions compared to Tier I standards [2]. In addition, in April 2018, the IMO adopted an initial plan to limit greenhouse gas emissions from ships. The plan proposes that, compared with 2008, by 2050, greenhouse gas emissions should be reduced by at least 50% [3]. With the implementation of stricter ship emission regulations, new types of efficient and clean alternative fuels have gradually become a research hotspot in the shipping industry. The transition to clean and renewable energy in marine engines is a critical step toward achieving the new power system paradigms required for sustainable maritime operations. Natural gas, as one of the high-quality and clean fuels, has attracted extensive attention in this field in recent years.
The main component of natural gas is methane which has a high octane number, so it has strong anti-knock ability. Improving the compression ratio and the intake pressure are used to improve the economic and dynamic performance of natural gas engines, and equivalent ratio combustion is used to reduce NOX emissions, so the probability of knock in natural gas engines increases. The auto-ignition mode of the point source most likely happens to natural gas when the end-gas auto-ignites. It just can produce low pressure oscillation amplitude and cannot lead to strong knock. According to the theory of the end-gas auto-ignition, the auto-ignition mode should be hybrid auto-ignition, indicating that there are some factors that promote the transformation of auto-ignition modes. In addition, auto-ignition can also cause different combustion modes which can produce different levels of the pressure oscillation amplitude and the peak pressure. In the environment of high temperature and high pressure, the strength of pressure waves will increase greatly and the position of auto-ignition may also transfer, so further studies on the cause of natural gas knock is needed.
At present, there are three kinds of knock mechanisms. The end-gas auto-ignition theory [4] suggests that the knock is caused by the auto-ignition of end gas which is widely accepted. Both detonation theory [5,6] and flame acceleration theory [7] believe that the change in combustion modes is the cause of knock. There are many studies that examine the influencing factors on knock. Chen et al. [8] researched the effects of initial pressure to the knock intensity of combustion of propane-air equivalent ratio mixture on a rapid compression machine, the results show that the pressure oscillation amplitude produced by knock increases with the increase in initial pressure, and it mainly depends on the state of the end gas before auto-ignition. The larger the area of unburned gas when auto-ignition occurs, the higher the knock intensity. Chen et al. [9] demonstrated that under critical knock conditions, end-gas auto-ignition constitutes a sufficient condition rather than a necessary factor for engine knock. Their findings suggest that rapid flame propagation exhibits greater potential for inducing engine knock phenomena. Wu et al. [10] implemented a high-time resolution dynamic pressure difference method to identify a novel knock mechanism in large-bore marine engines, distinct from conventional end-gas auto-ignition and detonation wave theory. Their analysis demonstrated that differential amplification of high- and low-pressure regions by flame fronts amplifies pressure differences, ultimately culminating in knock formation. Zhang et al. [11] established significant correlations between knock behavior and maximum heat release rate, combustion duration, and peak combustion pressure, while revealing weaker associations with combustion phasing and cyclic variations. Xu et al. [12] identified ignition intensity and in-cylinder pressure as two critical factors influencing knock severity. Their research attributed knock initiation to auto-ignition at flame fronts caused by high-temperature compression effects from detonation waves.
There are also many studies on the influencing factors of knock in natural gas engines. For example, Xian et al. [13] studied the effects of air–fuel ratio, the temperature of intake air, and ethane content on natural gas knock. Wu et al. [14] studied the effects of propane content, n-butane content, and ignition time on natural gas knock at different compression ratios. The strength of pressure waves determines the characteristics of the flame propagation and the position of auto-ignition. Gao et al. [15] and Tao et al. [16] researched the characteristics of the flame and the pressure wave propagation and their effects on auto-ignition, finding that the higher the temperature and pressure or the flame propagation velocity, the higher the strength of the pressure waves is which will lead to stronger disturbance to the flame propagation and the transfer of the position of auto-ignition from the end wall to front of the flame. The interaction between the flame and the pressure wave will cause a change in the combustion modes. Urtiew et al. [17] found that the hotspots are caused by the shock wave produced by the combination of pressure waves in the process of DDT in the pipeline. Wei et al. [18] conducted a numerical study on the ignition characteristics and knock mechanism of a natural gas/diesel dual fuel engine using methane instead of natural gas and n-hexane instead of diesel. Research has found that the initial temperature and equivalence ratio in the cylinder not only have a significant impact on the reaction rate, but also have a significant impact on the reaction temperature range and pressure increase. Zou et al. [19] established a dual zone quasi dimensional model for marine dual fuel engines in the Matlab/Simulink environment. The effects of the intake temperature and compression ratio on engine knock characteristics were studied. The simulation results show that as the intake temperature and compression ratio increase, the knock intensity increases. Montoya et al. [20] investigated the turbulent effects on knock propensity in biogas–natural gas blended fuels. The results revealed that enhanced turbulence intensity elevates turbulent flame speed, thereby promoting increased knock tendency across most fuel blends except biogas mixtures. Xiang et al. [21] conducted parametric studies on knock performance in spark-ignited natural gas engines using GT-Power software. Their investigations indicated that elevated compression ratios induce higher peak cylinder pressures and IMEP, consequently enhancing knock propensity. Zhou et al. [22] performed numerical simulations of knock phenomena in natural gas/diesel RCCI engines. The pressure differential analysis revealed that knock in RCCI engines primarily originates from end-gas auto-ignition, with characteristic frequencies matching the natural resonance mode (0,1) of cylindrical combustion chambers. Guo et al. [23] used the CFD software CONVERGE to study the effects of pilot fuel injection conditions on the combustion and emission performance of low-pressure injection natural gas marine engines. As the pilot injection time increases, the combustion situation gradually deteriorates, which increases the tendency of knock. The study of Kangbainietz [24] shows that the flame propagation velocity should be fast enough to be coupled with the pressure wave, and the strength of pressure waves should be high enough to compress the unburned gas to auto-ignition. Both of these conditions must be met in order to produce a hotspot and then trigger the detonation wave. Different states in hotspots will lead to different combustion modes. Lee et al. [25] put forward the SWACER theory to explain the detonation process of hotspots. Bradley et al. [26] proposed two parameters, ξ and ε. ξ indicates the coupling degree of the pressure wave and the spontaneous reaction wave and ε indicates the excitation efficiency of the pressure wave caused by the spontaneous reaction wave. Five different combustion modes were proposed by Zeldovich [27] according to the relationship between spontaneous reaction wave velocity U s p , the C-J detonation wave velocity DC-J, local sound velocity, and laminar combustion velocity u f . All of the judgments of combustion modes in this paper are based on his theory.
At present, there are many studies on the factors affecting engine knock, and research on knock mechanisms only focuses on the moment of knock occurrence. However, there is little research on the overall process of knock, and the study of the entire process from flame propagation, pressure wave generation, hotspot formation, auto-ignition pressure wave generation and propagation to the highest pressure and pressure oscillation is not detailed. These links are interrelated and influence each other, determining the relationship between initial conditions, auto-ignition mode, combustion mode, and combustion characteristic parameters. It is these links that together constitute the mechanism of knock. Previous studies that examined flame acceleration and flame–pressure wave–wall interactions have been primarily conducted in straight ducts and constant-volume combustion chambers, but rarely in disk-shaped combustion chambers. Due to the different spaces in which combustion occurs, the mechanisms of auto-ignition and combustion mode changes also differ, especially in the propagation characteristics of pressure waves, which can have significant differences and shorter combustion times, limiting the development of flames and pressure waves. Due to the high temperature and pressure environment inside natural gas engines, the knock mechanism of natural gas may conform to flame acceleration theory or detonation theory, that is, knock is caused by a change in combustion mode. In addition, spontaneous combustion may also occur in front of the flame surface or other positions. Therefore, further experimental research is needed on the knock mechanism of natural gas.
Fluent 19.0 simulation software is used in this study to research the cause of natural gas knock, auto-ignition modes and combustion modes when knock occurs, the characteristics of the pressure wave propagation before auto-ignition, the effects of the pressure wave on pressure and temperature of the unburned gas, the influencing rule of the peak pressure and the pressure oscillation amplitude and the effects of different initial conditions to all the above research contents, so as to form a complete mechanism of natural gas knock.

2. Establishment of the Model

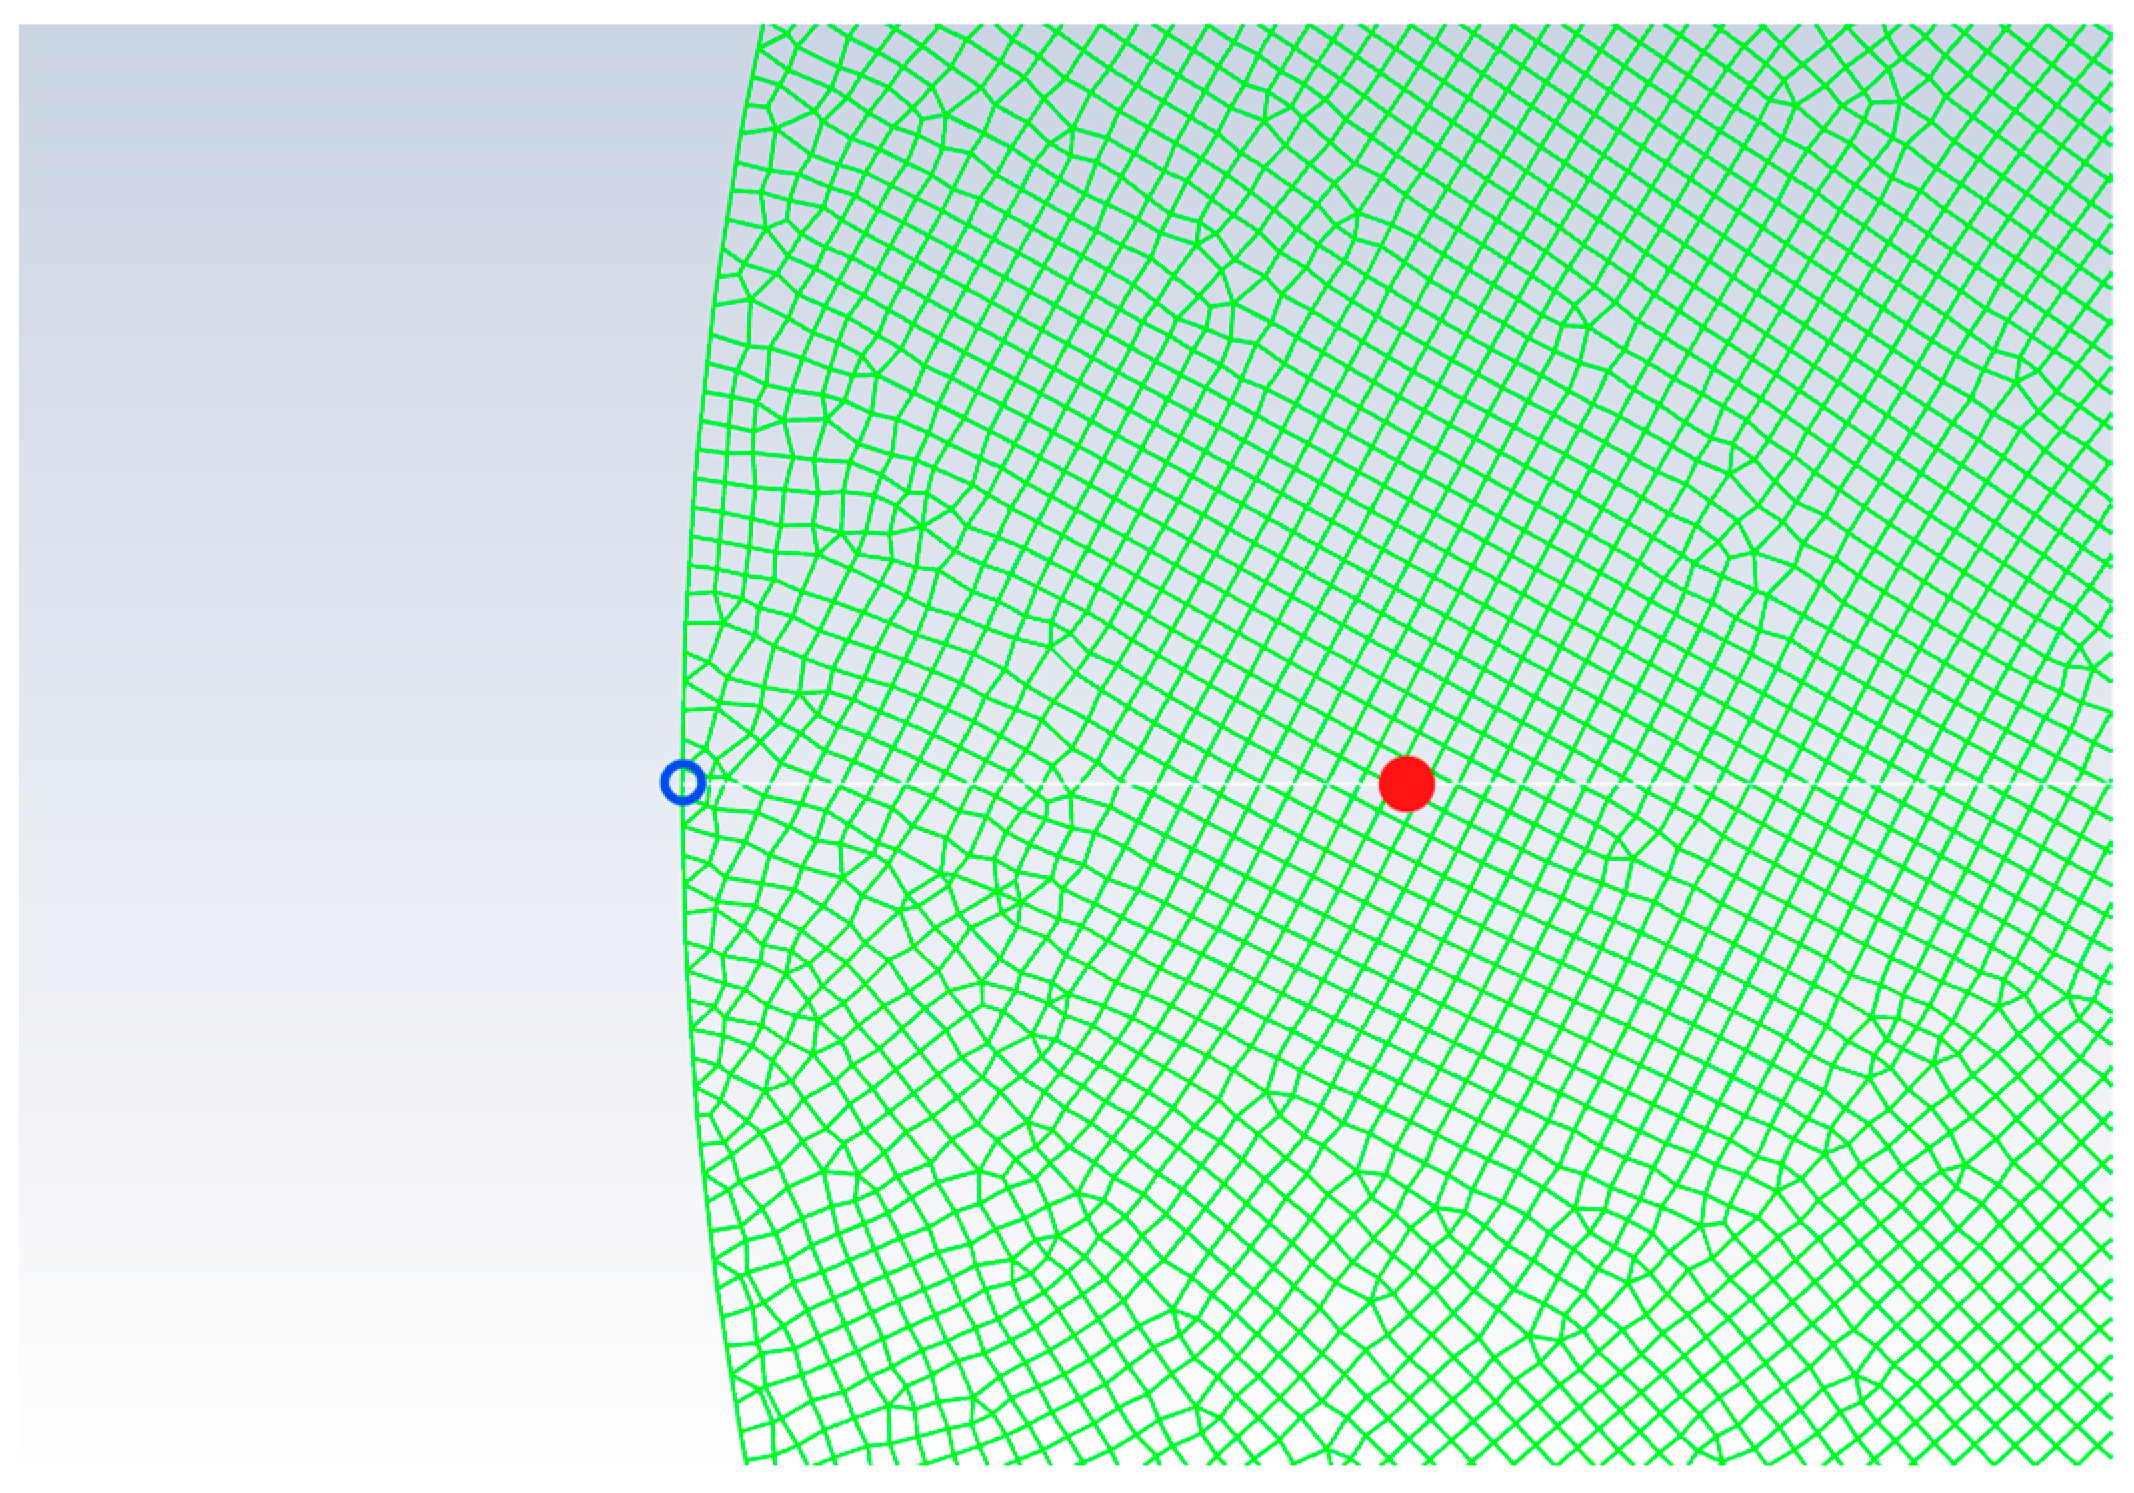
In this study, Fluent simulation software is used for 2D simulation experiments of the equivalent ratio combustion of methane and simulate the combustion process in the combustion chamber after the piston reaches the top dead center in the rapid compression machine. ANSYS/ICEM CFD 19.0 software is used to make the mesh of this model. The diameter of this mesh is set to 50 mm as the diameter of the prototype combustion chamber. The prototype combustion chamber is a rapid compression machine independently designed by Beijing University of Technology. The schematic diagram of the combustion chamber is shown in Figure 1, and the specific experimental parameters can be referred to in Ref. [28]. The grid of the combustion chamber model takes the center of the circle as the origin (0,0), and sets the ignition coordinates (−20,0) at the left end of the combustion chamber. The temperature and pressure measuring points are specific points on the wall surface. The specific ignition position and temperature and pressure measurement positions are shown in Figure 2, where the red dot represents the ignition position and the blue circular ring represents the measurement position on the left wall surface, and the measurement position on the right side corresponds to it. The mesh height is set to 0.0002 m after many experiments. This mesh precision is accurate enough to simulate the propagation process of the pressure wave and the flame, and the amount of calculation is moderate. The SST k -ω model is selected to simulate the flow in the flow field. This model is usually expressed using the turbulent kinetic energy k equation and the specific dissipation rate ω equation as follows:
t ρ k + x i ρ k u i = x j Γ k k x j + G k Y k + S k
t ρ ω + x i ρ ω u i = x j Γ ω ω x j + G ω Y ω + D ω + S ω
where G k represents the generation term of turbulent kinetic energy, G ω represents the generation term of specific dissipation rate, Γ k and Γ ω are the effective diffusion coefficients of k and ω, Y k and Y ω are the dissipation terms of k and ω, and D ω represents the cross-diffusion term.
Its advantages are as follows: the simulation of the flow near the wall is very accurate; both of the processes of laminar flow and turbulent flow can be simulated; and the calculation ability of the reverse pressure gradient is also very good. When using Finite-Rate/Eddy Dissipation model and Eddy Dissipation Concept model, the flame is difficult to propagate. Although the effects of turbulence to the burning rate should be considered, the experiments prove that the effects of these models are not good, so Finite-Rate/No TCI model is used. The flame propagation velocity and the shape of the flame are in accord with the optical experimental results. This model uses the Arrhenius formula to calculate the chemical source term. The production/decomposition molar rate of substance i in reaction r is given by the following formula:
R ^ i , r = Γ ( v i , r v i , r ) k f , r j = 1 N r C j , r η j , r k b , r j = 1 N r C j , r η j , r
where N r represents the number of chemical substances involved in the reaction r , C j , r represents the molar concentration of each reactant or product j in reaction r , η j , r and η j , r are the rate indices of the forward and reverse reactions of each reactant or product j in reaction r , respectively.
The set of methane two-step reaction from the component transport option is used as the combustion model. Transient calculation is used in this model, and the time step size is set to 1 × 10⁻⁵ s which is accurate enough to simulate the supersonic deflagration. If the time step size is too small, the calculation will cost too much time. The equivalent ratio methane–air mixture is charged into the combustion chamber, and a patch of the high-temperature region is used to ignite. The high-temperature region is at the left side of the combustion chamber and the products of the equivalent ratio combustion of methane is charged into the high-temperature region. In order to simulate the real engines which has the high compression ratio, the compression ratio is set to 14. Several initial pressure conditions between 0.06 MPa to 0.15 MPa are selected and the same group of initial temperature conditions between 300 K and 400 K are selected for each initial pressure condition. Hence, the compression end temperature is from 700 K to 1000 K and the compression end pressure is from 2 MPa to 5.5 MPa. This basically covers the temperature and pressure range of knock conditions for marine natural gas engines. The results obtained from the simulation using this model are compared with the results obtained from the actual experiment using the prototype equipment. The peak pressure calculated by the simulation experiment is slightly higher than that obtained in the actual experiment [29], but the accuracy still can be guaranteed because the heat dissipation condition is ignored in this study, and the working condition of this simulation experiment is carried out in an ideal state.

3. Results and Discussion

3.1. Analyses of Combustion Characteristic Parameters

As shown in Figure 3, the peak pressure decreases at low initial temperature, and it starts to increase at a certain temperature at middle to high initial temperature. At the region of high initial temperature, the peak pressure has a complex law. The peak pressure increases with the increase in initial pressure, but the trends at each initial pressure are different. The pressure oscillation amplitude increases firstly and then decreases with the increase in initial temperature. The inflection point appears at middle to high initial temperature. The peak pressure increases with the increase in initial pressure at low to middle initial temperature and has a complex law at the region of high initial temperature.

3.2. Auto-Ignition Modes and Combustion Modes When Knock Occurs

At all experimental conditions, the high pressure oscillation amplitude is related to the end-gas auto-ignition, so the knock mechanism of natural gas still conforms to the theory of the end-gas auto-ignition. As shown in Table 1, with the increase in initial temperature, auto-ignition occurs earlier, and the area of the unburned gas is larger. The flame propagation velocity generated by auto-ignition gradually accelerates from low subsonic velocity to supersonic velocity, and even constant volume combustion occurs, indicating that the increase in initial temperature has the effect of increasing the flame propagation velocity generated by auto-ignition. And this is consistent with the temperature gradient theory proposed by Zeldovich [30]. With the increase in initial pressure, auto-ignition occurs slightly earlier, the area of unburned gas also increases slightly, and the flame propagation velocity generated by auto-ignition increases slightly, indicating that the increase in initial pressure has less effect on this.
The flame propagation velocity generated by auto-ignition at the inflection point of the pressure oscillation amplitude varies from 1900 to 2750 m/s, and the local velocity of detonation wave is about 1850 m/s. When detonation occurs, the pressure oscillation amplitude should increase sharply, but it does not increase much at the inflection point. In addition, the pressure wave and the flame ignited by auto-ignition are not coupled together, indicating that at all experimental conditions, the detonation cannot occur, so they should be supersonic deflagration.
The initial temperature has a great influence on auto-ignition modes and combustion modes. The experimental results at an initial pressure of 0.06 MPa, part of the initial temperature are illustrated as follows:
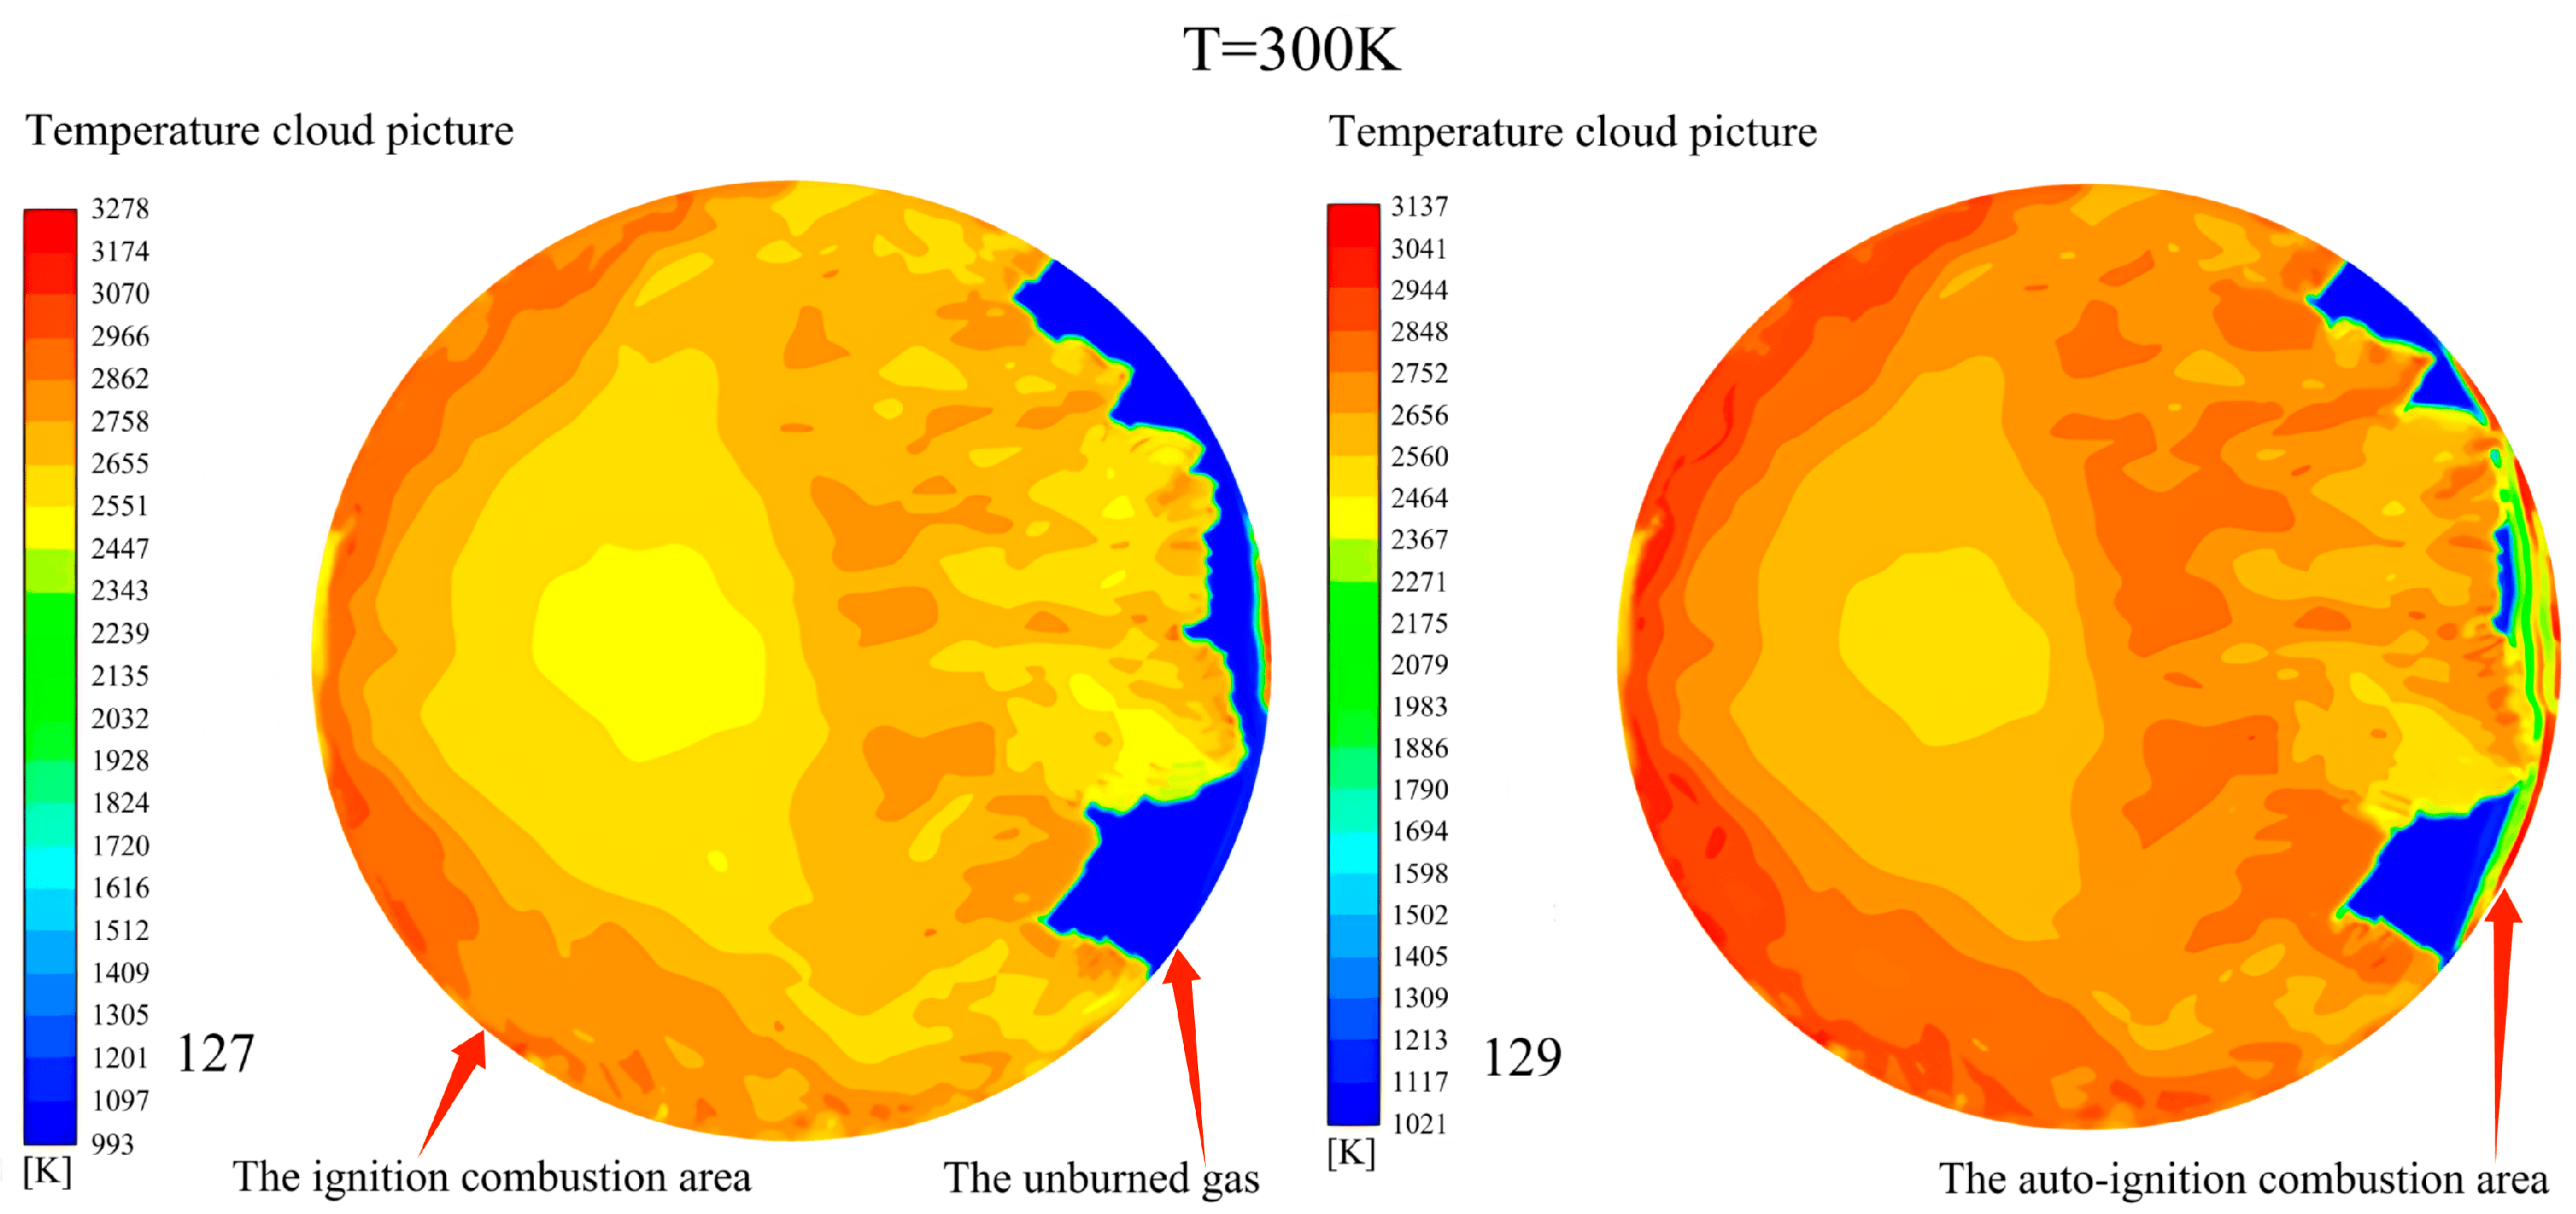
As shown in Figure 4, at initial temperature of 300 K, the area of the unburned gas before auto-ignition is very small and the area of the auto-ignition reaction is also very small. Under this condition, the unburned gas is ignited only by a small area of fire kernel. The flame propagation velocity generated by auto-ignition is only 50 m/s, while the local sound velocity is about 620 m/s, so it is far lower than the local sound velocity. The combustion mode is low subsonic deflagration. The pressure oscillation amplitude is only 0.333 MPa. The low flame velocity and moderate combustion caused by a small area of fire kernel is in accord with the characteristics of the auto-ignition mode of the point source.
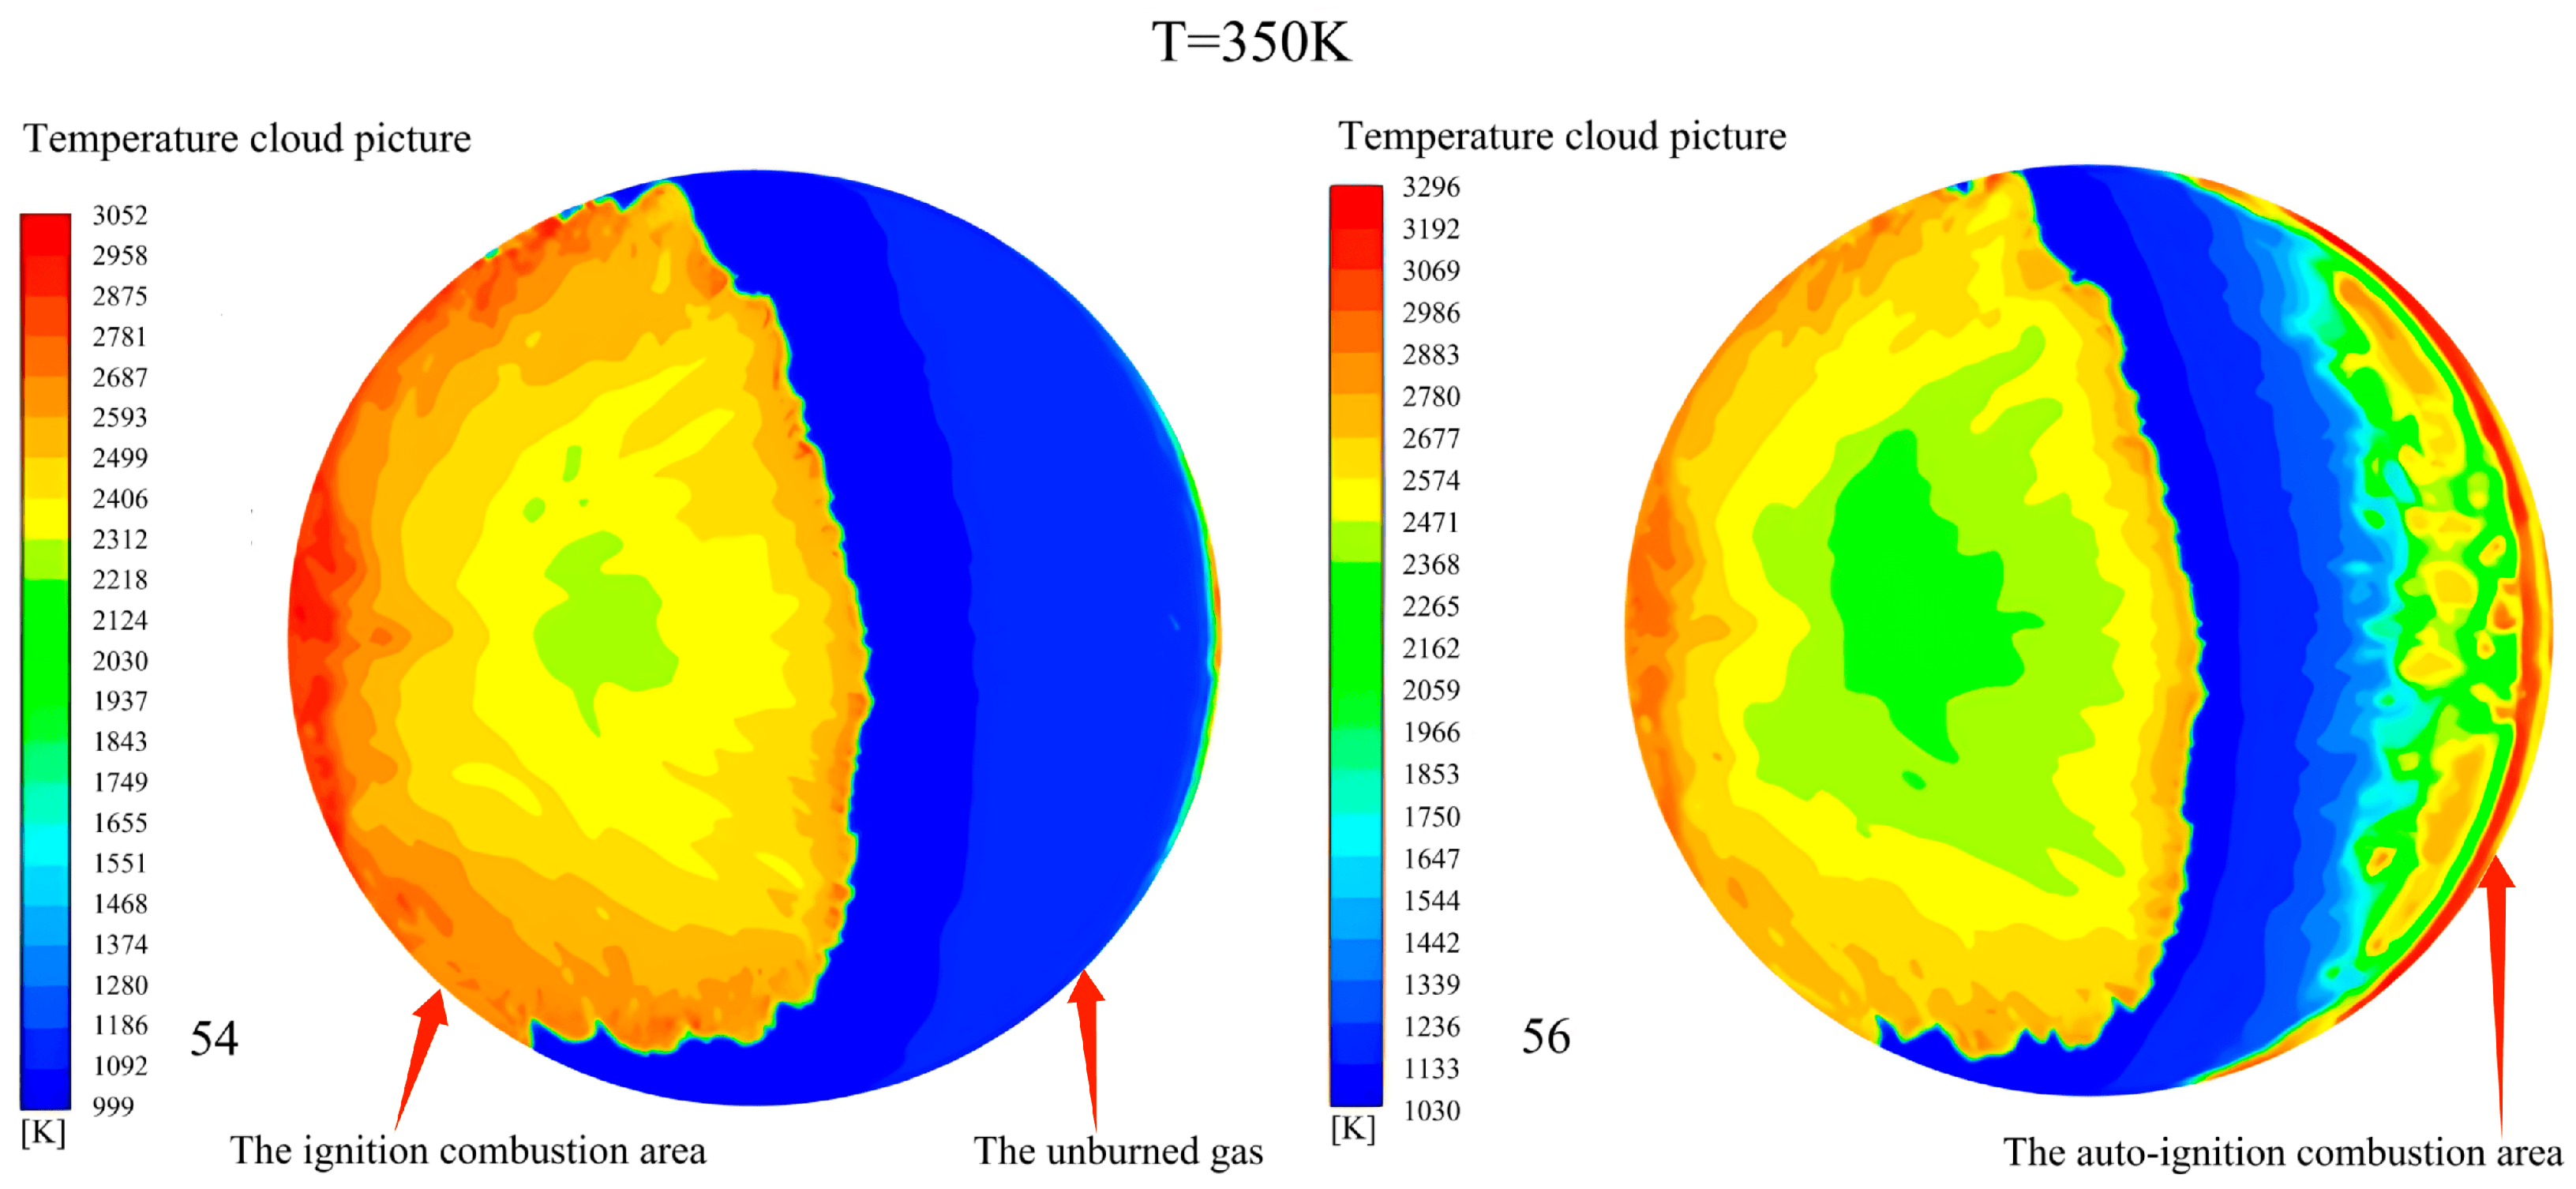
As shown in Figure 5, when the initial temperature increases to 350 K, the area of the unburned gas before auto-ignition is larger and the area of auto-ignition reaction is also larger, so it is similar to the surface ignition. The contact area of the flame and the unburned gas increases and the temperature of the unburned gas also increases. Both factors increase the burning rate which makes the flame propagation velocity generated by auto-ignition increase to 500 m/s, but it is still lower than the local sound velocity. The combustion mode is high subsonic deflagration. The pressure oscillation amplitude is 1.119 MPa. The increase in initial temperature leads to the transformation of the combustion mode. There are some isolated areas with high temperatures before the flame ignited by auto-ignition which is the small areas of volumetric auto-ignition. These areas of auto-ignition can ignite secondary deflagration waves and increase the flame propagation velocity generated by auto-ignition. This auto-ignition mode has the characteristics of the hybrid auto-ignition mode. The increase in the initial temperature leads to the transformation of the auto-ignition mode.
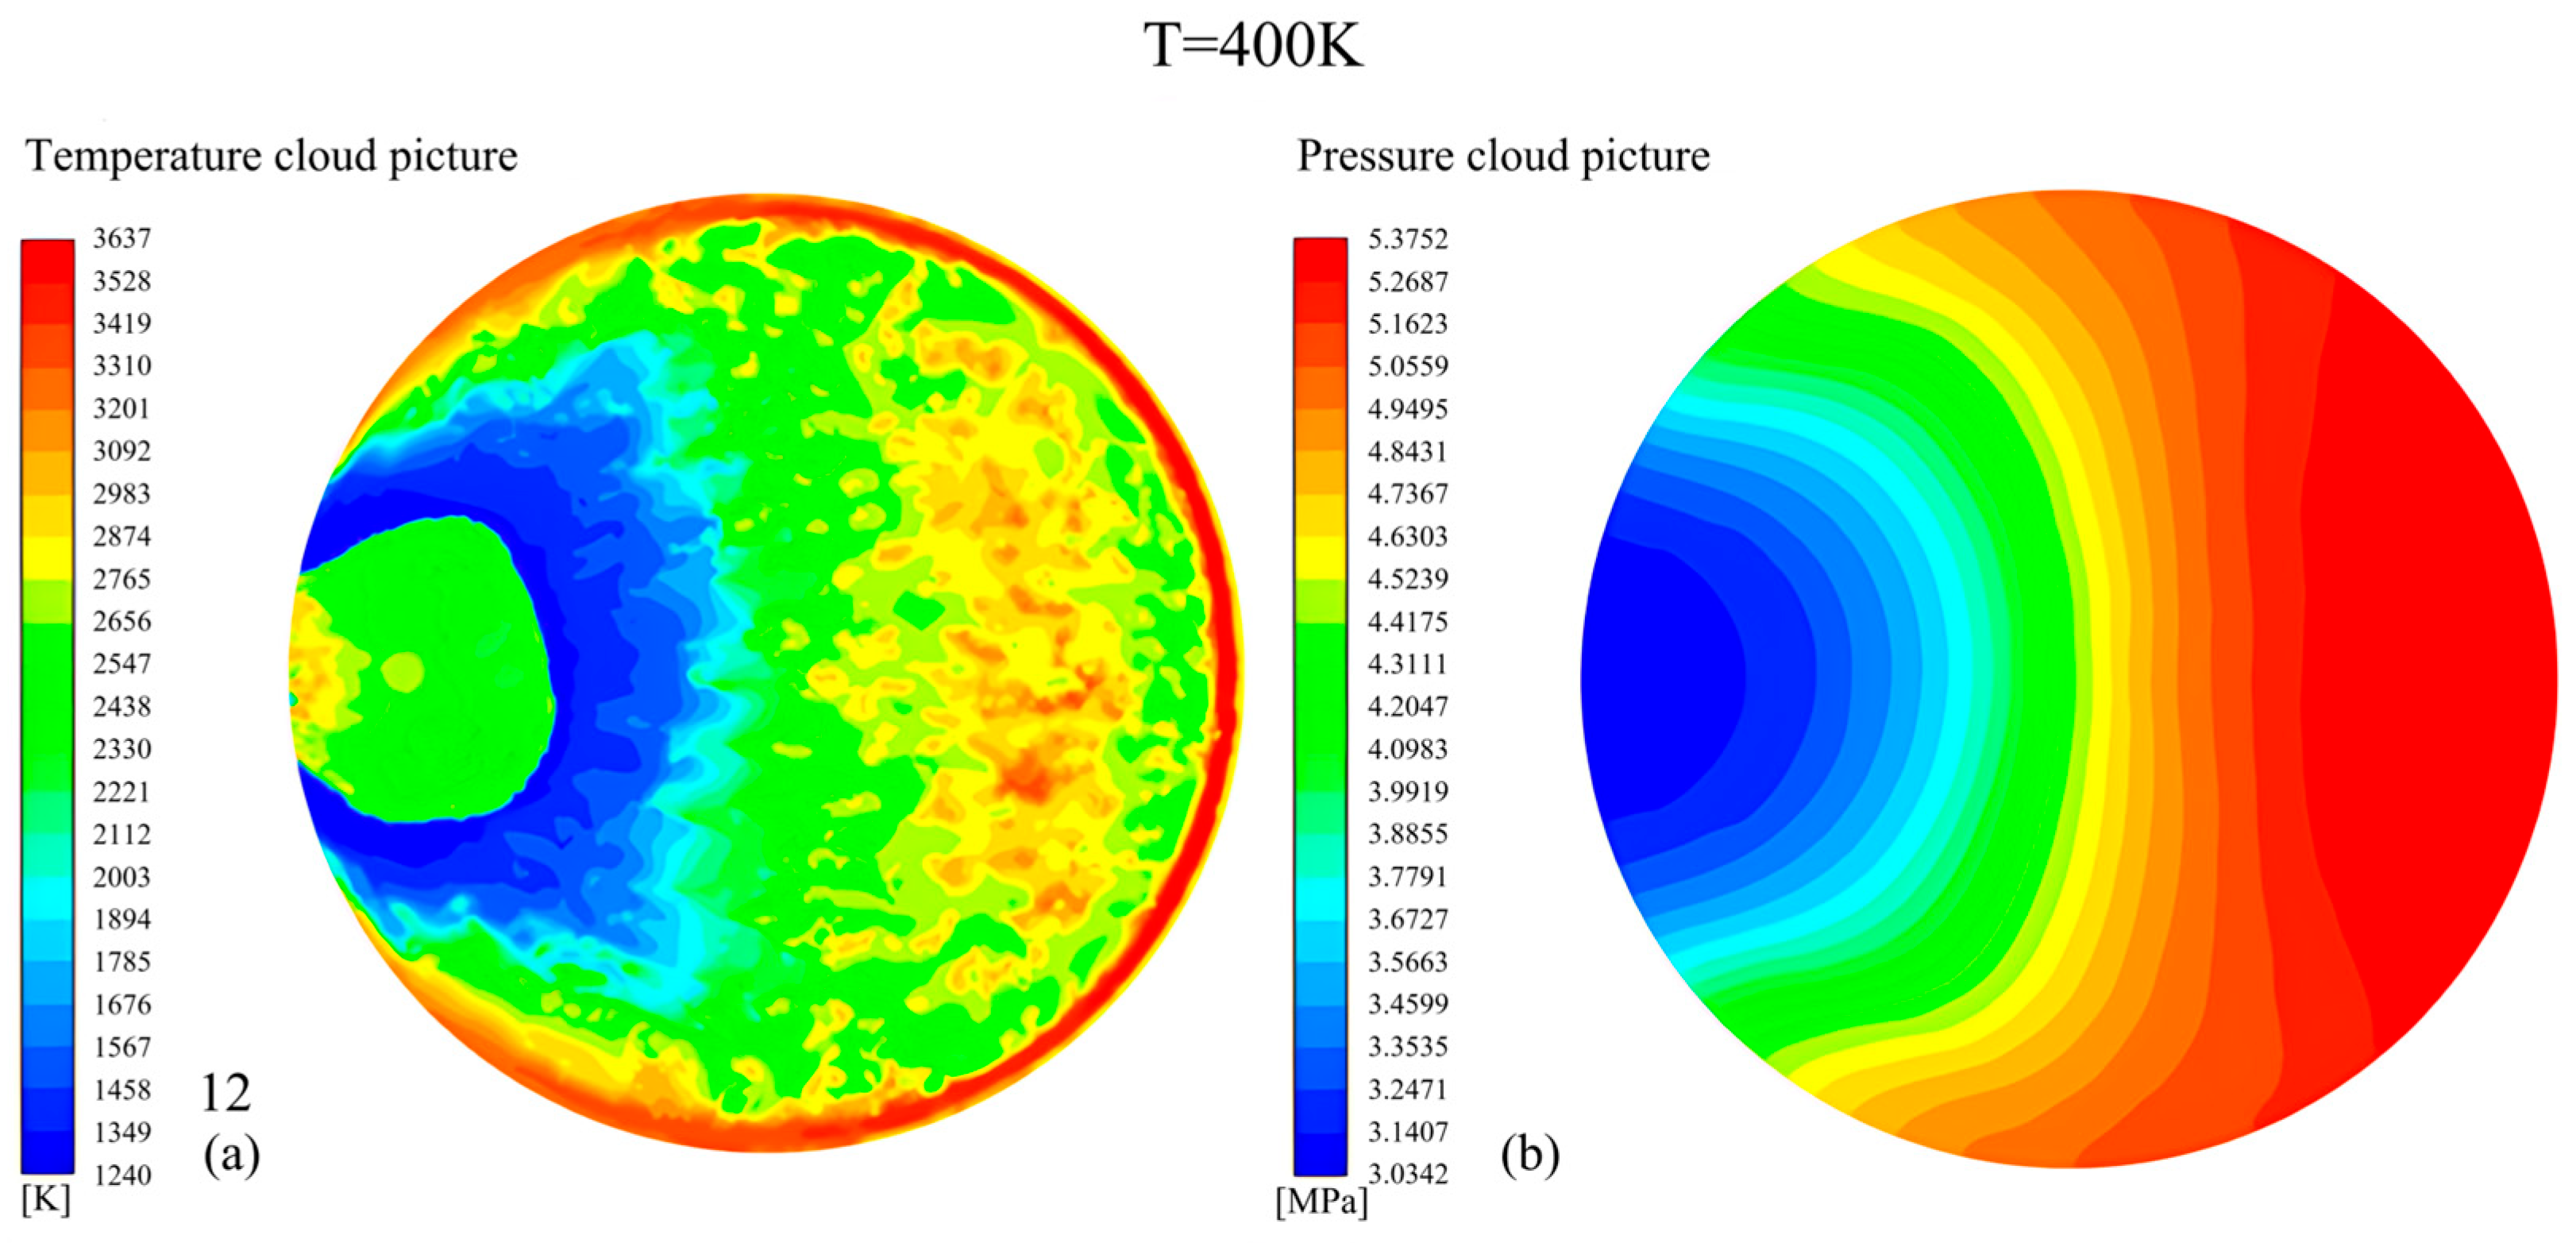
As shown in Figure 6, when the initial temperature increases to 400 K, a large area of uniformly high pressure appears in the burned area on the right side of the pressure cloud picture. This combustion mode is similar to the constant volume combustion. The pressure oscillation amplitude is 0.883 MPa, which is lower than that at the lower initial temperature. Although the mass of auto-ignition in the hybrid and volumetric auto-ignition mode has a large area which can produce the local area of high pressure and strong pressure waves, the area of auto-ignition in constant volume combustion is much larger than that in hybrid and volumetric auto-ignition mode, so the increase in pressure is very uniform which causes a very low decrease in pressure in the area of high pressure and it cannot produce strong pressure waves. Pressure in the cylinder is more uniform, so the pressure oscillation amplitude is lower than that in hybrid auto-ignition mode.

3.3. Change Rules of Pressurized Amplitude of Pressure Waves

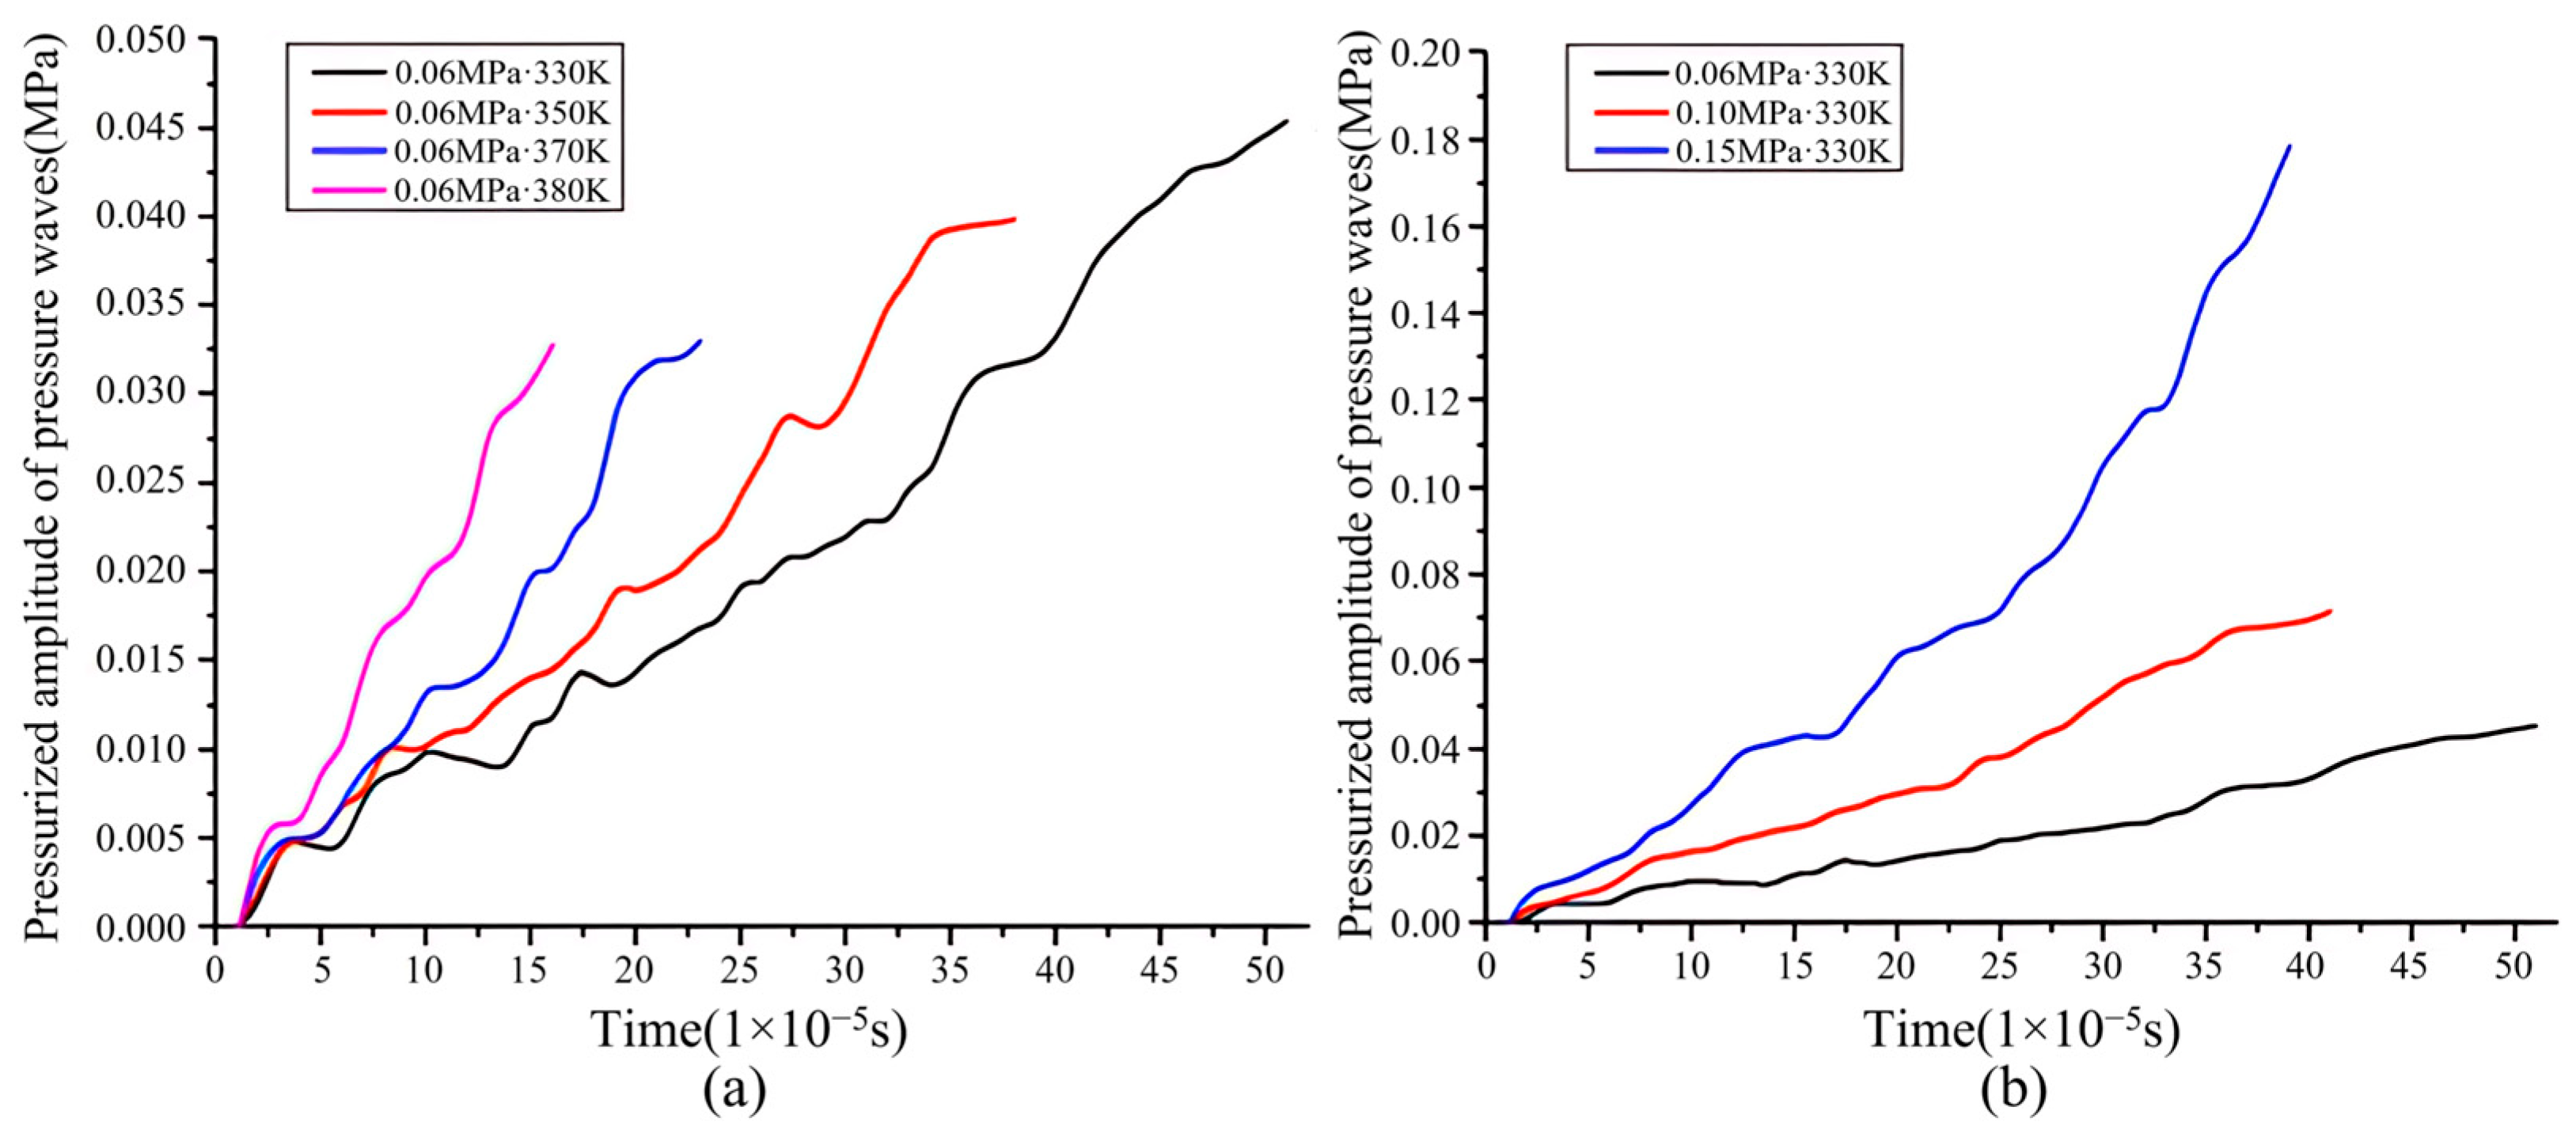
Using the change in average pressure in front of the flame with a large pressure gradient to calculate the pressurized amplitude of pressure waves which can indicate the strength of pressure waves. The forward pressure gradient appears in front of the flame in the early stage of combustion due to the effect of forward pressure waves and disappears in the later stage of combustion. At this time, pressure in the unburned area is more uniform which indicates that the strength of forward and reflected pressure waves are equal and the disappearance of the forward pressure gradient also indicates that auto-ignition can no longer appear in front of the flame. Figure 7 shows the graphs of the pressurized amplitude of pressure waves before auto-ignition occurs as part of the initial conditions, starting from the moment of ignition and ending to the moment when the area of the unburned gas has uniform pressure. Because this is the last moment to distinguish that auto-ignition occurs in front of the flame or at the end gas. The position of the highest pressure is the position of the lowest ignition temperature and is also the position of auto-ignition occurs first.
(a)
The pressurized amplitude of the pressure waves increases continuously from low at each initial condition. The higher the initial temperature, the higher the pressurized amplitude and the growth rate. However, because the time of uniform pressure appearing in the unburned area is greatly shortened, the increase in the pressurized amplitude is lower, resulting in the highest pressurized amplitude being lower. The increase in the initial temperature inhibits the highest strength of pressure waves. The strength of pressure waves is not high enough to make auto-ignition occur in front of the flame.
(b)
The higher the initial pressure, the higher the pressurized amplitude and the growth rate. Auto-ignition occurs just slightly earlier. The increase in the pressurized amplitude is higher, resulting in the highest pressurized amplitude being higher. However, the time of combustion in the combustion chamber is very short. Even if the strength of the pressure waves increases and the time to increase the strength is prolonged, the strength of the pressure waves is not high enough to make auto-ignition occur in front of the flame. In addition, it is also related to the high ignition temperature of natural gas, which requires higher strength of pressure waves.

3.4. The Effects of Pressure Waves on Temperature and Pressure on the Wall

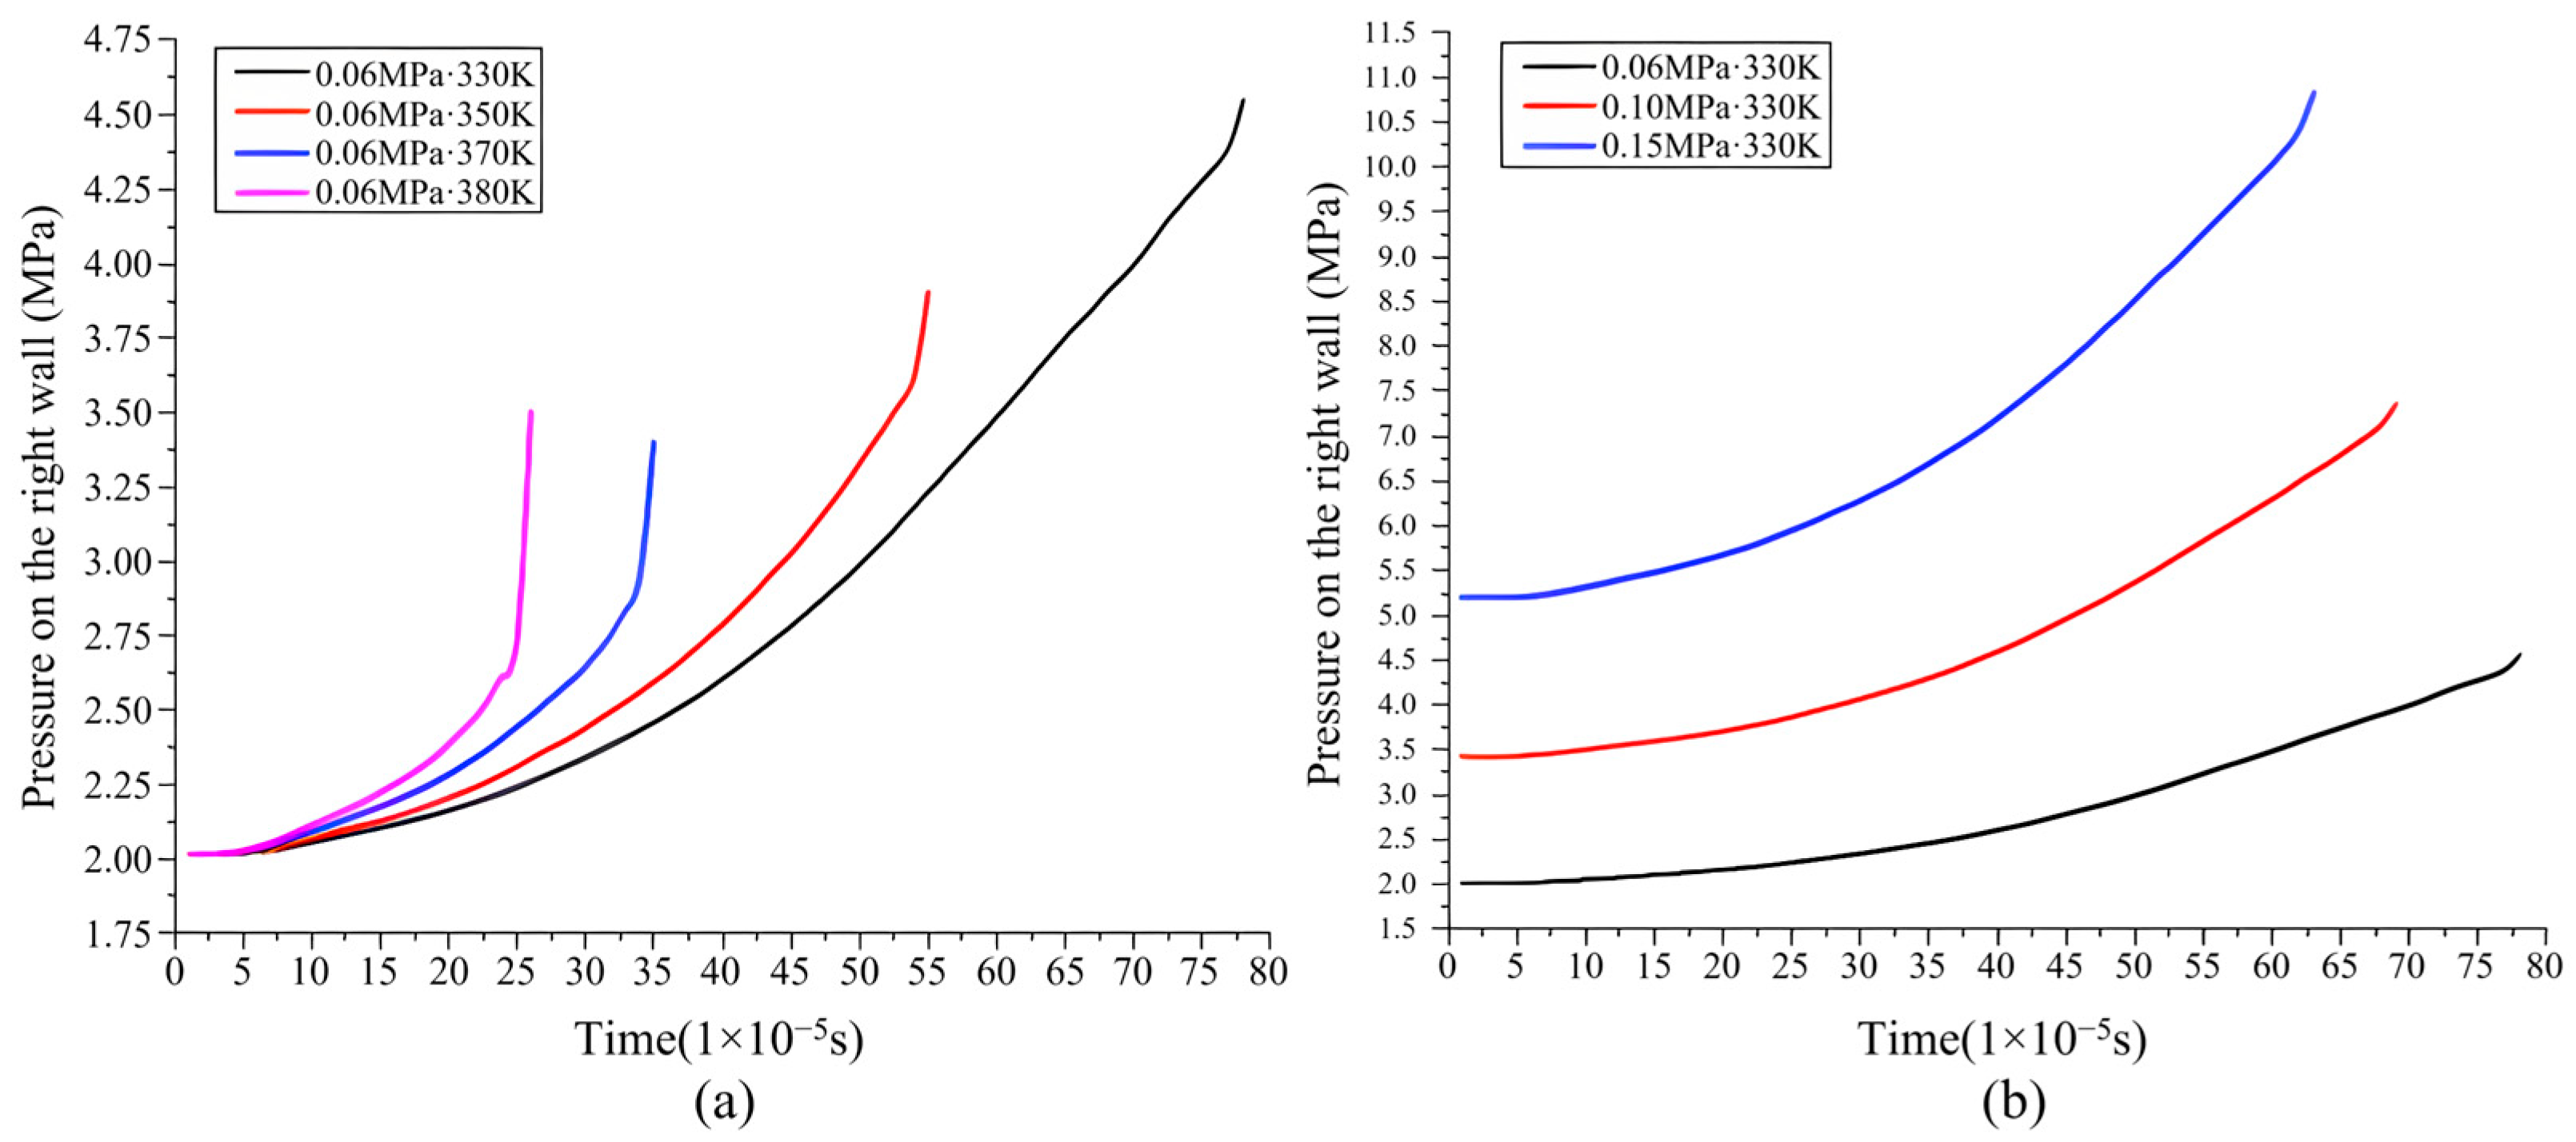
Figure 8 shows graphs of pressure on the right wall before auto-ignition occurs as part of the initial conditions, starting from the moment of ignition and ending at the moment when the area of auto-ignition reaction occurs. The higher the initial pressure, the higher the pressurized amplitude of pressure waves and the higher the pressurized amplitude to the unburned gas on the right wall caused by pressure waves will be. The growth rate of the pressure is also higher, while the time of auto-ignition occurrence is slightly shortened, so the total increase in pressure will increase. And initial pressure is also higher. So, the pressure of the end gas before auto-ignition will increase which leads to a decrease in the ignition temperature. The higher the initial temperature, the higher the pressurized amplitude of pressure waves. The growth rate of the pressure is higher. However, the time of auto-ignition occurrence is significantly shortened and the highest pressurized amplitude is lower which makes the total increase in pressure lower, so the pressure of the end gas before auto-ignition decreases which leads to the increase in ignition temperature, but the time of auto-ignition occurrence is significantly shortened.
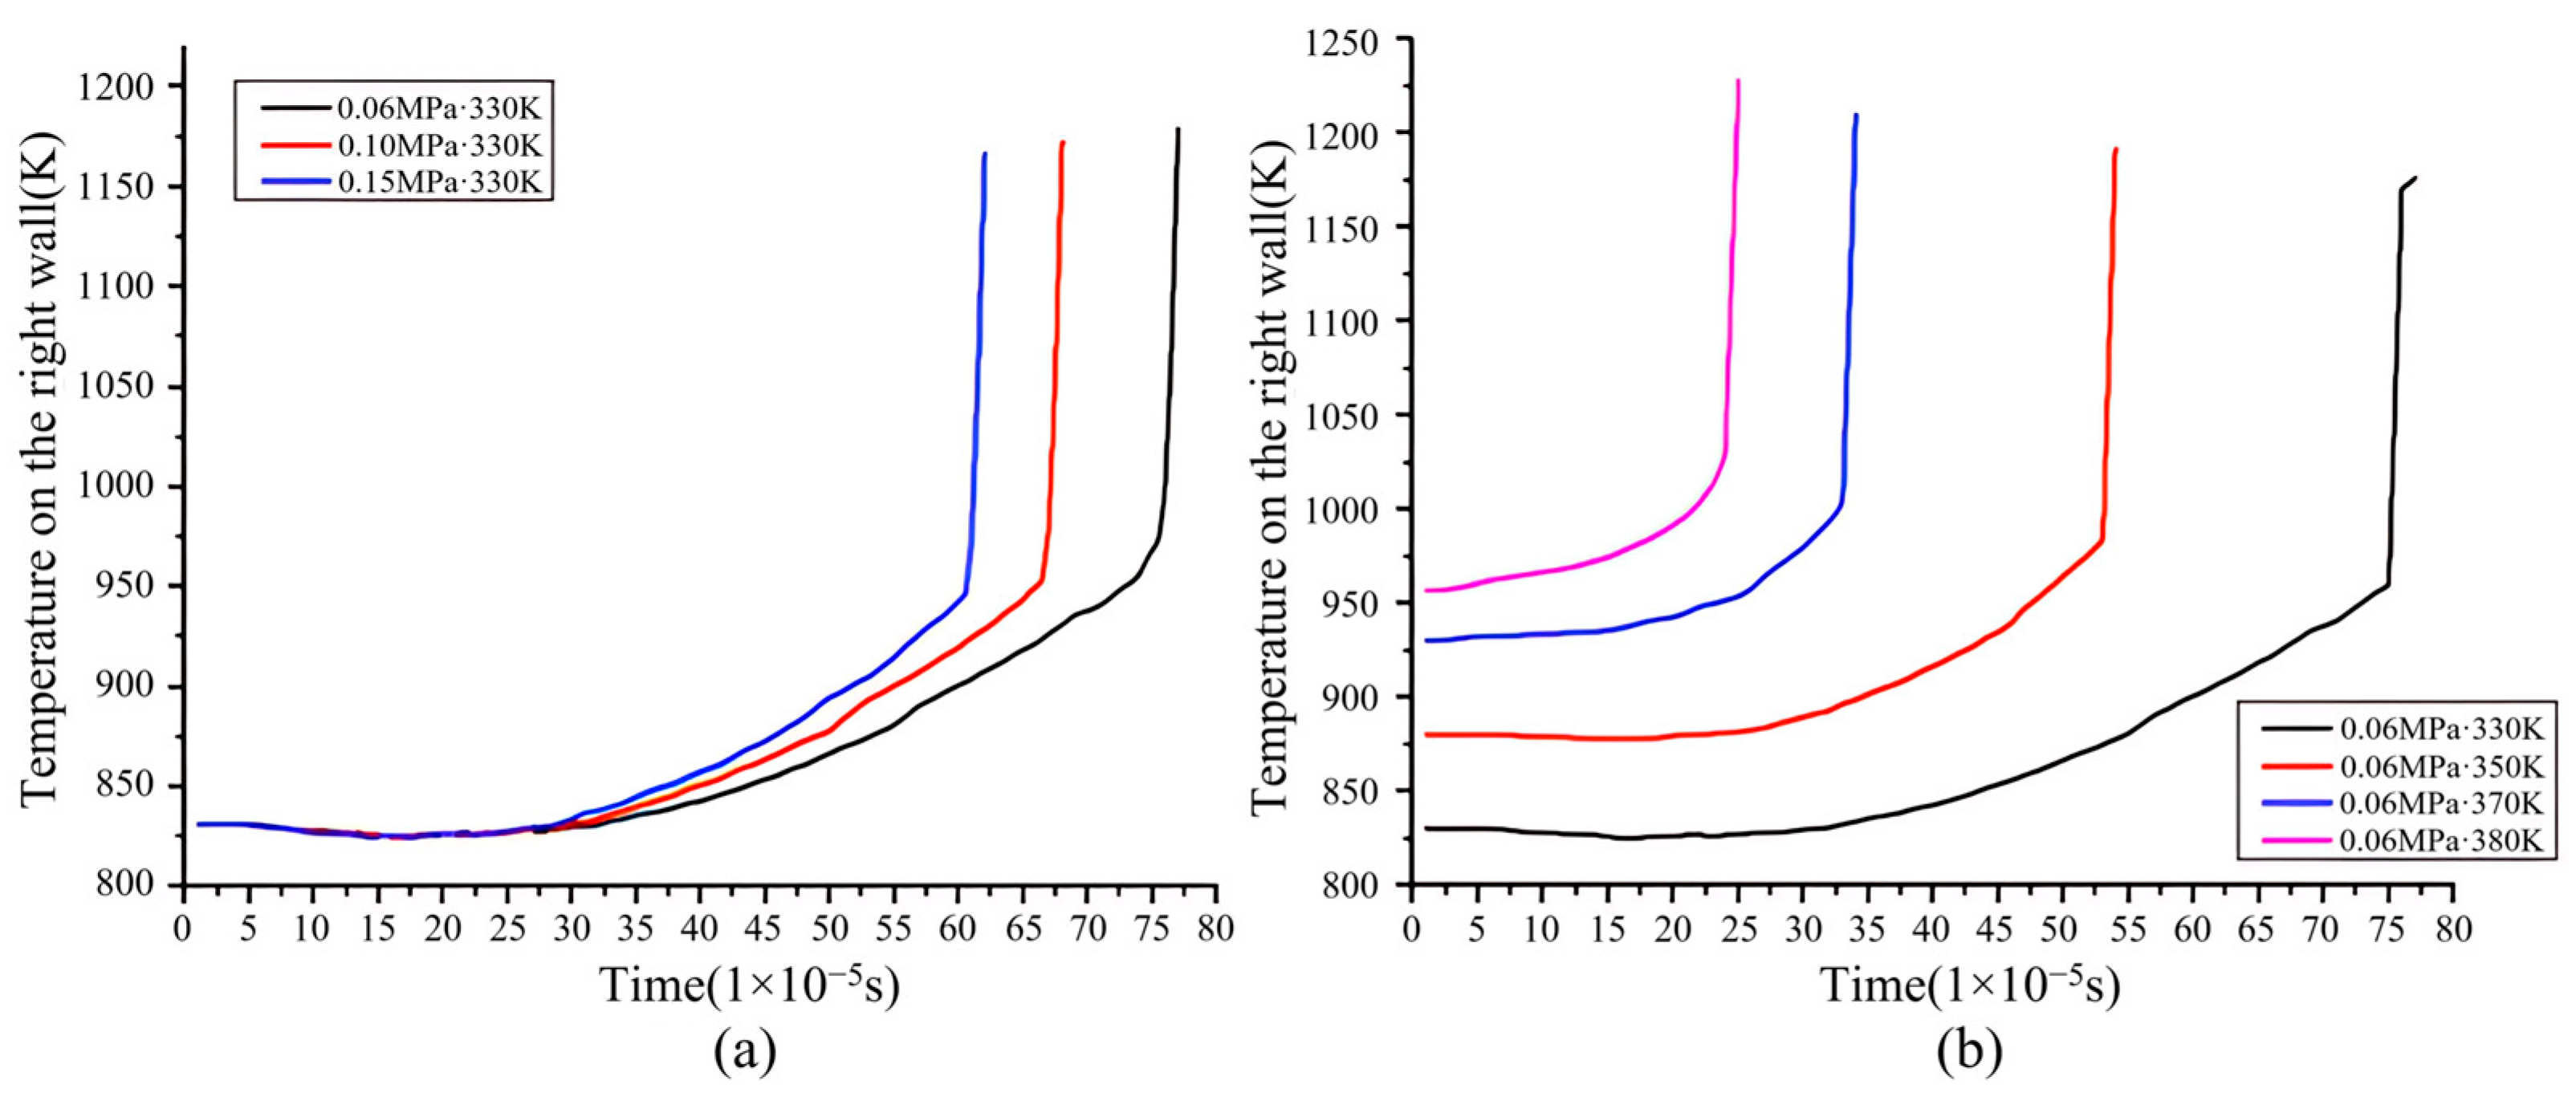
Figure 9 shows graphs of temperature on the right wall before auto-ignition occurs at part of initial conditions, starting from the moment of ignition and ending to the moment before the area of auto-ignition reaction occurs. The higher initial pressure is, the higher the strength of pressure waves is. The effect of compression and heating for the unburned gas is also greater, so the growth rate of temperature is higher. At the same time, pressure of the end gas before auto-ignition increases which leads to the decrease in ignition temperature, so the total increase in temperature is lower, but the time of auto-ignition occurrence is slightly shortened. The main reason is that the strength of pressure waves is limited at very low level by short burning time. The increase in growth rate of temperature is not significant, and the decrease in ignition temperature caused by the increase in pressure of the end gas is also not significant, so the time of auto-ignition occurrence is slightly shortened. The higher initial temperature is, the higher the strength of pressure waves is. The effect of compression and heating for unburned gas is also greater, so the growth rate of temperature is higher. Due to the time of auto-ignition occurrence is significantly shortened, the total increase in temperature decreases significantly. But the decrease in pressure of the end gas makes ignition temperature increase. So the main cause why auto-ignition occurs earlier is not the increase in the strength of pressure waves, but the decrease in the required increase in temperature to attain ignition temperature caused by the increase in initial temperature.

3.5. The Influence of Initial Conditions on Combustion Characteristic Parameters

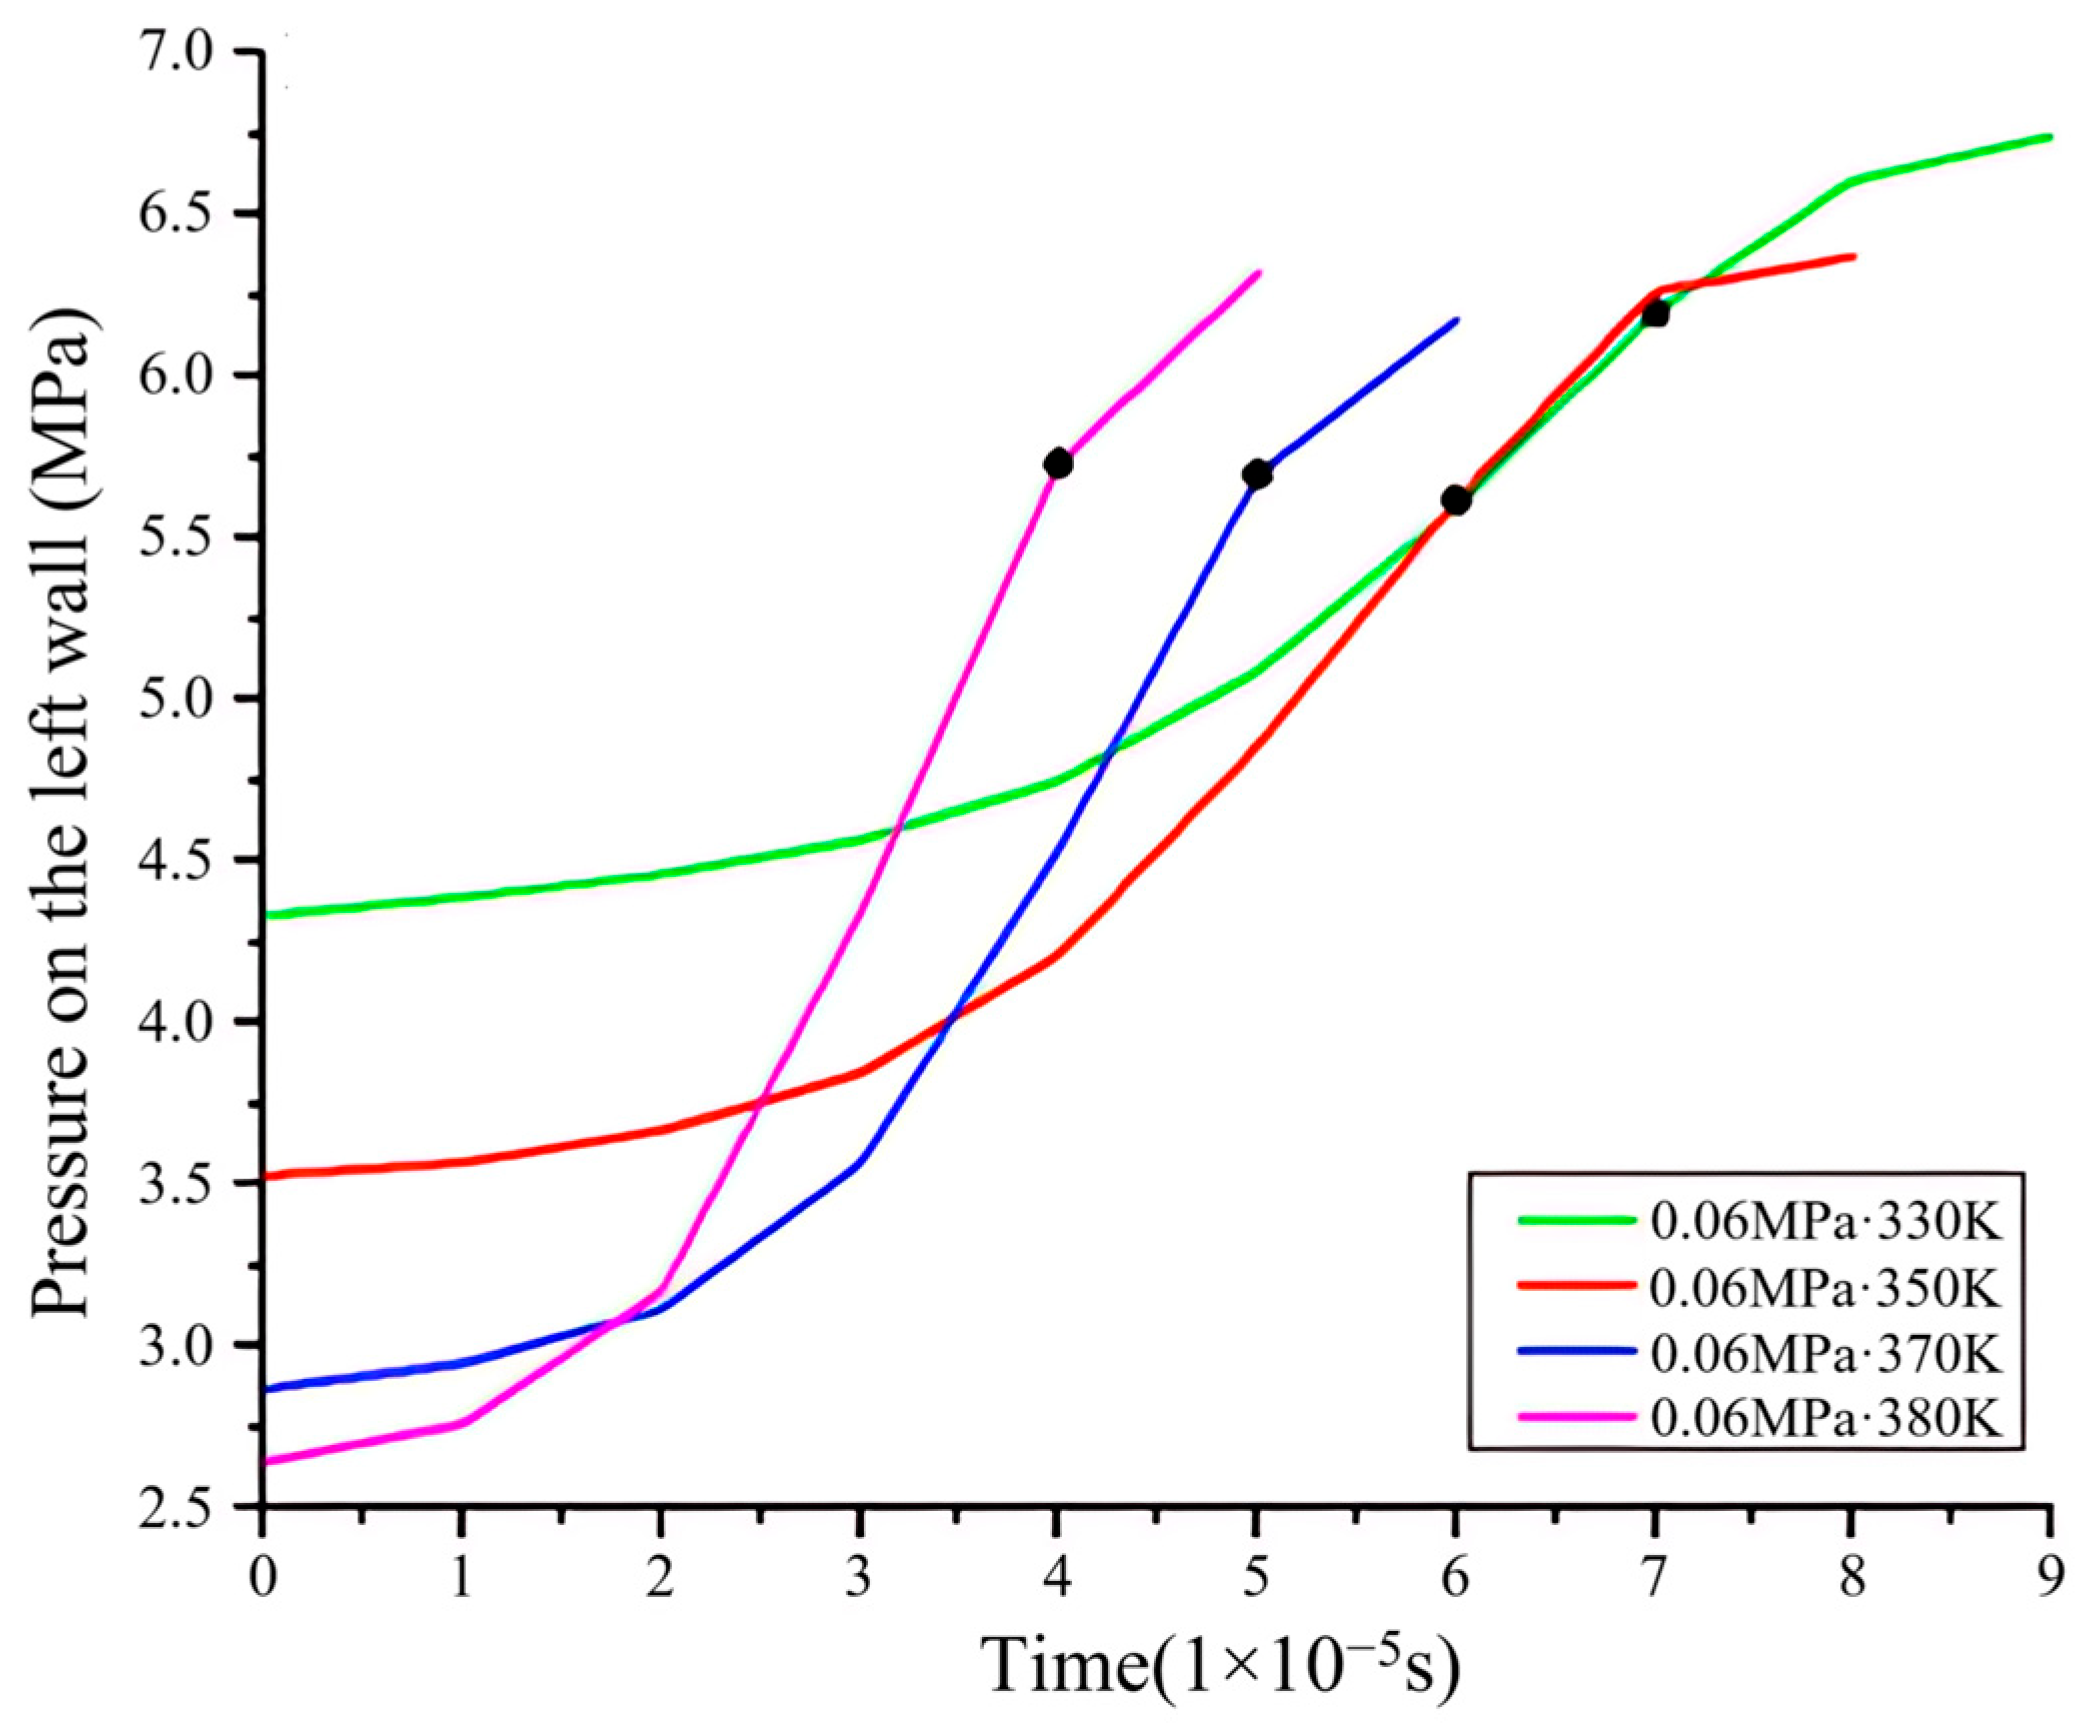
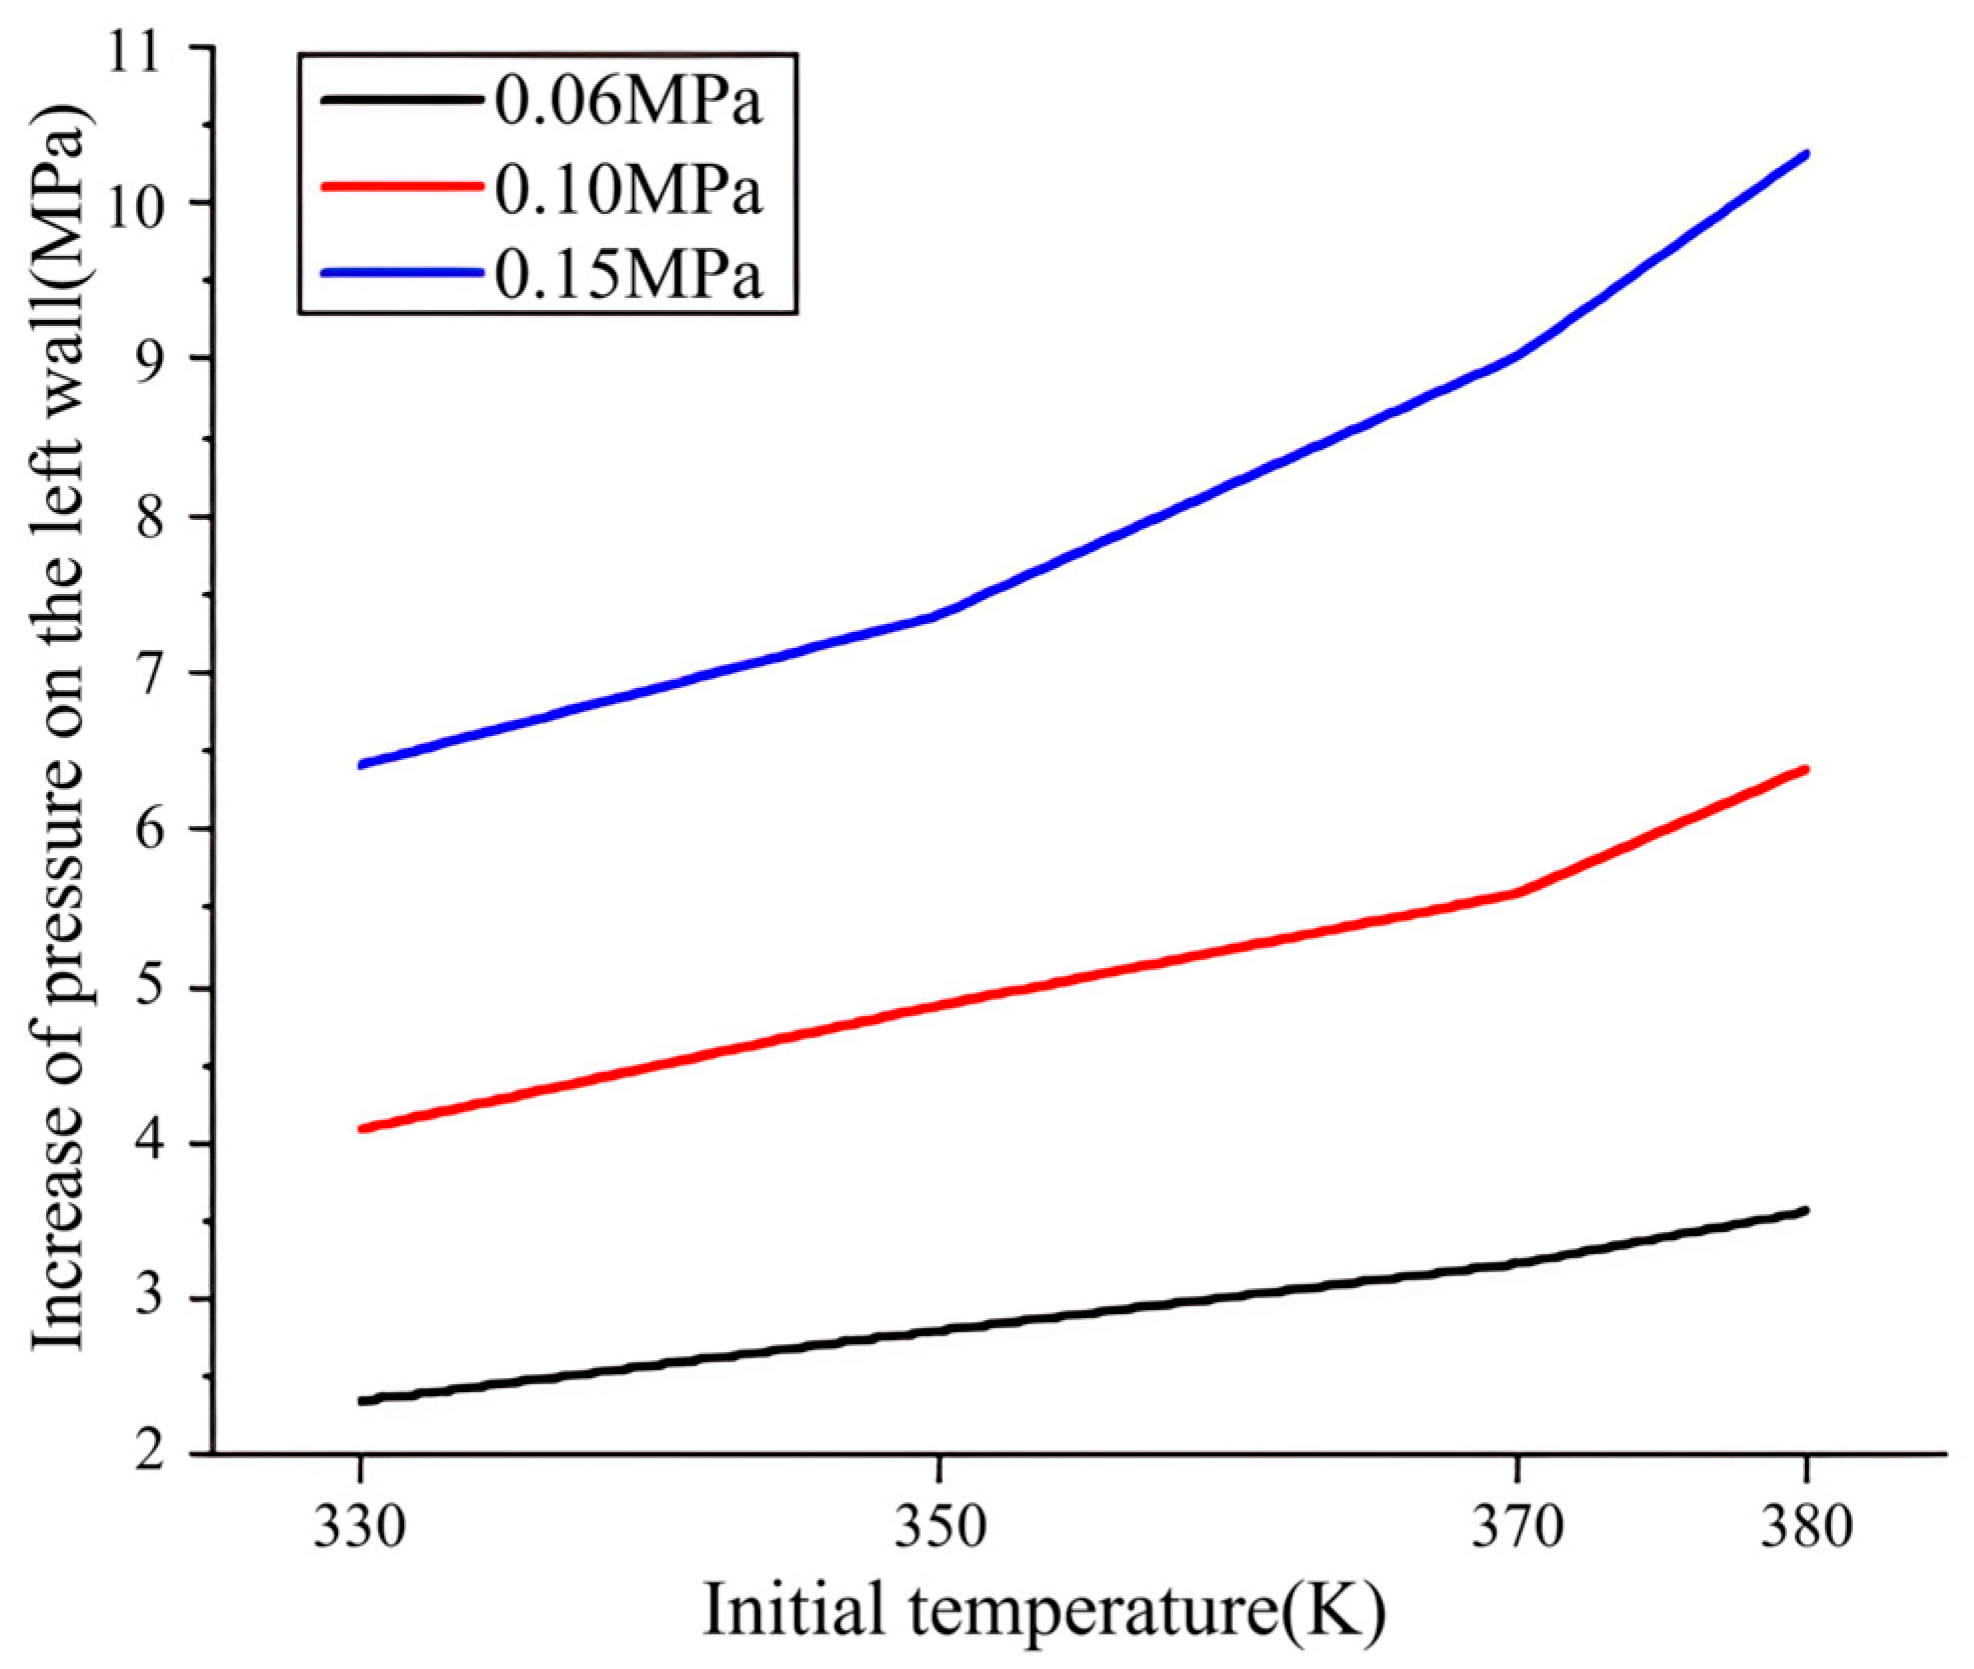
Figure 10 shows the graph of pressure on the left wall after auto-ignition occurs at initial conditions of 0.06 MPa, part of the initial temperatures. The starting moment is before auto-ignition occurs, and the ending moment is when the peak pressure occurs because the pressure waves hit the left wall. The pressure when the strong pressure wave hits the left wall is marked in black. The peak pressure appears on the left wall under all of the initial conditions under the initial temperature of 380 K. The peak pressure is determined by the initial pressure on the left wall before auto-ignition and the increase in pressure on the left wall. The pressure oscillation amplitude is positively correlated to the inhomogeneity of the pressure in the cylinder. The increase in pressure on the left wall is caused by pressure waves generated by the expansion of combustion products. The higher the decrease in pressure on the right wall, the higher the strength of pressure waves can be generated and the higher the increase in pressure on the left wall. So the inhomogeneity of pressure in the cylinder is higher and the pressure oscillation amplitude is also higher. Figure 10 shows the graph of the increase in pressure on the left wall after auto-ignition occurs as part of the initial conditions.
As shown in Figure 10 and Figure 11, the higher the initial temperature, the lower the initial pressure on the left wall before auto-ignition, and the higher the pressurized amplitude of pressure waves generated by auto-ignition, so the higher the increase in pressure on the left wall is can lead to an increase in the pressure oscillation amplitude. At a low initial temperature, the increase in pressure on the left wall is low. With the increase in the initial temperature, the increase in pressure on the left wall is higher but cannot offset the decrease in the initial pressure on the left wall before auto-ignition, so the peak pressure decreases. When the initial temperature increases from medium to high, the increase in pressure on the left wall is higher and it can offset the decrease in the initial pressure on the left wall before auto-ignition, so the peak pressure will increase. The higher the initial pressure, the higher the strength of the pressure waves. The increase in pressure on the left wall is higher which leads to the increase in pressure oscillation amplitude. And pressure on the left wall before auto-ignition is also higher. Both reasons lead to the increase in the peak pressure. At different initial pressure conditions, the effect degree of the initial temperature on the initial pressure on the left wall before auto-ignition and the increase in the pressure on the left wall is different, resulting in the temperatures at the inflection points being different.

3.6. Analyses of Combustion Characteristic Parameters at High Initial Temperature

3.6.1. Analyses of the Peak Pressure

At a high initial temperature, a large area of uniformly high pressure appears in the pressure cloud picture where constant volume combustion occurs at certain initial pressure conditions. Constant volume combustion produces a very high increase in pressure at the right conditions. Because the area of auto-ignition is very large, the increase in pressure is very uniform which makes the decrease in pressure in the burned area significantly lower, so the strength of the pressure waves also decreases significantly. The increase in pressure on the left wall caused by pressure waves is particularly low. Therefore, the peak pressure will occur in the burned area where constant volume combustion occurs, and is no longer produced by the increase in pressure on the left wall caused by the pressure waves. Figure 12a describes the maximum pressure in the cylinder after auto-ignition occurs as part of the initial conditions which include the following processes, the process of producing the auto-ignition reaction area in the 0–1 period, the process of igniting the unburned gas around the auto-ignition reaction area in the 1–2 period and at this time the strong pressure wave has not been produced, the process of producing the strong pressure wave by the expansion of the combustion products in the 2–3 period, the process of the strong pressure wave propagating and pressure on the strong pressure wave increasing in the third period, as marked by the black dot, and the process of the pressure on the left wall increases due to weak pressure waves after the strong pressure wave reaches the left wall at the moment of the black dot mark ends the moment. In each period, weak pressure waves are produced and propagate to the left wall all the time.
Figure 12b describes the pressure on the right wall after auto-ignition occurs as part of the initial conditions. Below the initial temperature of 380 K, sequential auto-ignition occurs and produces a local area of high pressure. With the increase in initial temperature, the increase in pressure produced by the unburned gas ignited by the auto-ignition reaction area is higher and the effect of the expansion of the combustion products is stronger, so the decrease in pressure on the right wall is also higher. As shown Figure 12a, the pressure curves on the right wall are roughly the same as the curves of the maximum pressure in the cylinder before the third moment, because the strong pressure wave has not been produced before this moment and the maximum pressure in the cylinder appears near the right wall. The higher the decrease in pressure on the right wall, the higher the increase in the maximum pressure in the cylinder and the higher the difference in pressure between the two curves is after the third moment. This is because the higher the decrease in pressure on the right wall, the higher the strength of the strong and weak pressure waves. The flow field is pressurized by weak pressure waves in advance. Then, the strong pressure wave flows through the same flow field, so the pressure on the strong pressure wave increases continuously on the basis of the previous pressure of the flow field. After the strong pressure wave hits the left wall, the weak pressure waves still hit the left wall constantly until the maximum pressure occurs on the left wall. So the higher the strength of pressure waves, the higher the increase in the maximum pressure is after the third moment.
As shown in Figure 12, when the initial temperature increases to 390 K and 400 K, the increase in pressure is abnormally lower and the decrease in pressure is greatly lower in both of two curves, because constant volume combustion occurs at both of two initial temperatures. The increase in pressure produced by constant volume combustion is related to the temperature and energy density of the unburned gas. At the initial pressure of 0.1 MPa, the increase in pressure produced by constant volume combustion at 390 K is lower than that at 380 K, indicating that the decrease in energy density makes the increase in pressure lower. However, when the initial temperature increases to 400 K, the increase in pressure is higher, indicating that the increase in the initial temperature makes the increase in pressure higher. And the effect is higher than the increase in pressure decreased by the decrease in the energy density because of the increase in the initial temperature. But it is still slightly lower than that at 380 K. The constant volume combustion may produce a high increase in pressure, but a low decrease in pressure. At the initial temperature of 380 K, constant volume combustion does not occur. The increase in pressure produced by unburned gas ignited by auto-ignition reaction area is the highest, resulting in a local high pressure, and the strength of the strong pressure wave is the highest generated by the dramatic expansion of the combustion products which leads to the highest decrease in pressure. At the initial temperature of 390 K, constant volume combustion occurs. The increase in pressure produced by constant volume combustion is the lowest and very uniform at the same time, so the expansion ability of the combustion products is very weak. The decrease in pressure is the lowest. At the initial temperature of 400 K, constant volume combustion also occurs. The increase in pressure is higher, but is still a little lower than that at 380 K. The pressure in the area of constant volume combustion increases which makes the inhomogeneity of pressure in the cylinder increase. The expansion ability is stronger and the decrease in pressure is higher than that at 390 K. But because the increase in pressure produced by constant volume combustion is more uniform, the decrease in pressure does not increase significantly and it is still very low. Even if constant volume combustion occurs, as long as the increase in pressure produced by the combustion products is higher, then the decrease in pressure is higher, so the strength of the strong and weak pressure waves is also higher. Therefore, after the third moment, the decrease in pressure on the right wall is higher and the increase in maximum pressure in the cylinder is also higher.
At initial conditions of 0.1 MPa, 390 K, and 400 K, constant volume combustion occurs. However, only at the initial temperature of 400 K does the peak pressure appear in the burned area, instead of the left wall. At the initial temperature of 400 K, the increase in pressure produced by constant volume combustion is higher and the expansion ability is very weak. The decrease in pressure is very low, so the increase in pressure relies on weak pressure waves after the third moment is very low. The peak pressure just can appear in the burned area before the third moment and it is higher than that at 390 K. But at the initial temperature of 390 K, because the increase in pressure produced by constant volume combustion is very low, the peak pressure still appears on the left wall after weak pressure waves continue to increase the maximum pressure. Due to the expansion ability of the combustion products being very weak, the increase in pressure after the third moment is also very low, so the peak pressure is the lowest. The peak pressure is determined by the increase and decrease in pressure in each period and the initial pressure before auto-ignition in the maximum pressure curves. Because the different initial temperatures under different initial pressures have different influences on the constant volume combustion, it results in a complex law of the peak pressure as the initial temperature increases and a different law of the peak pressure at different initial pressures.

3.6.2. Analyses of the Pressure Oscillation Amplitude

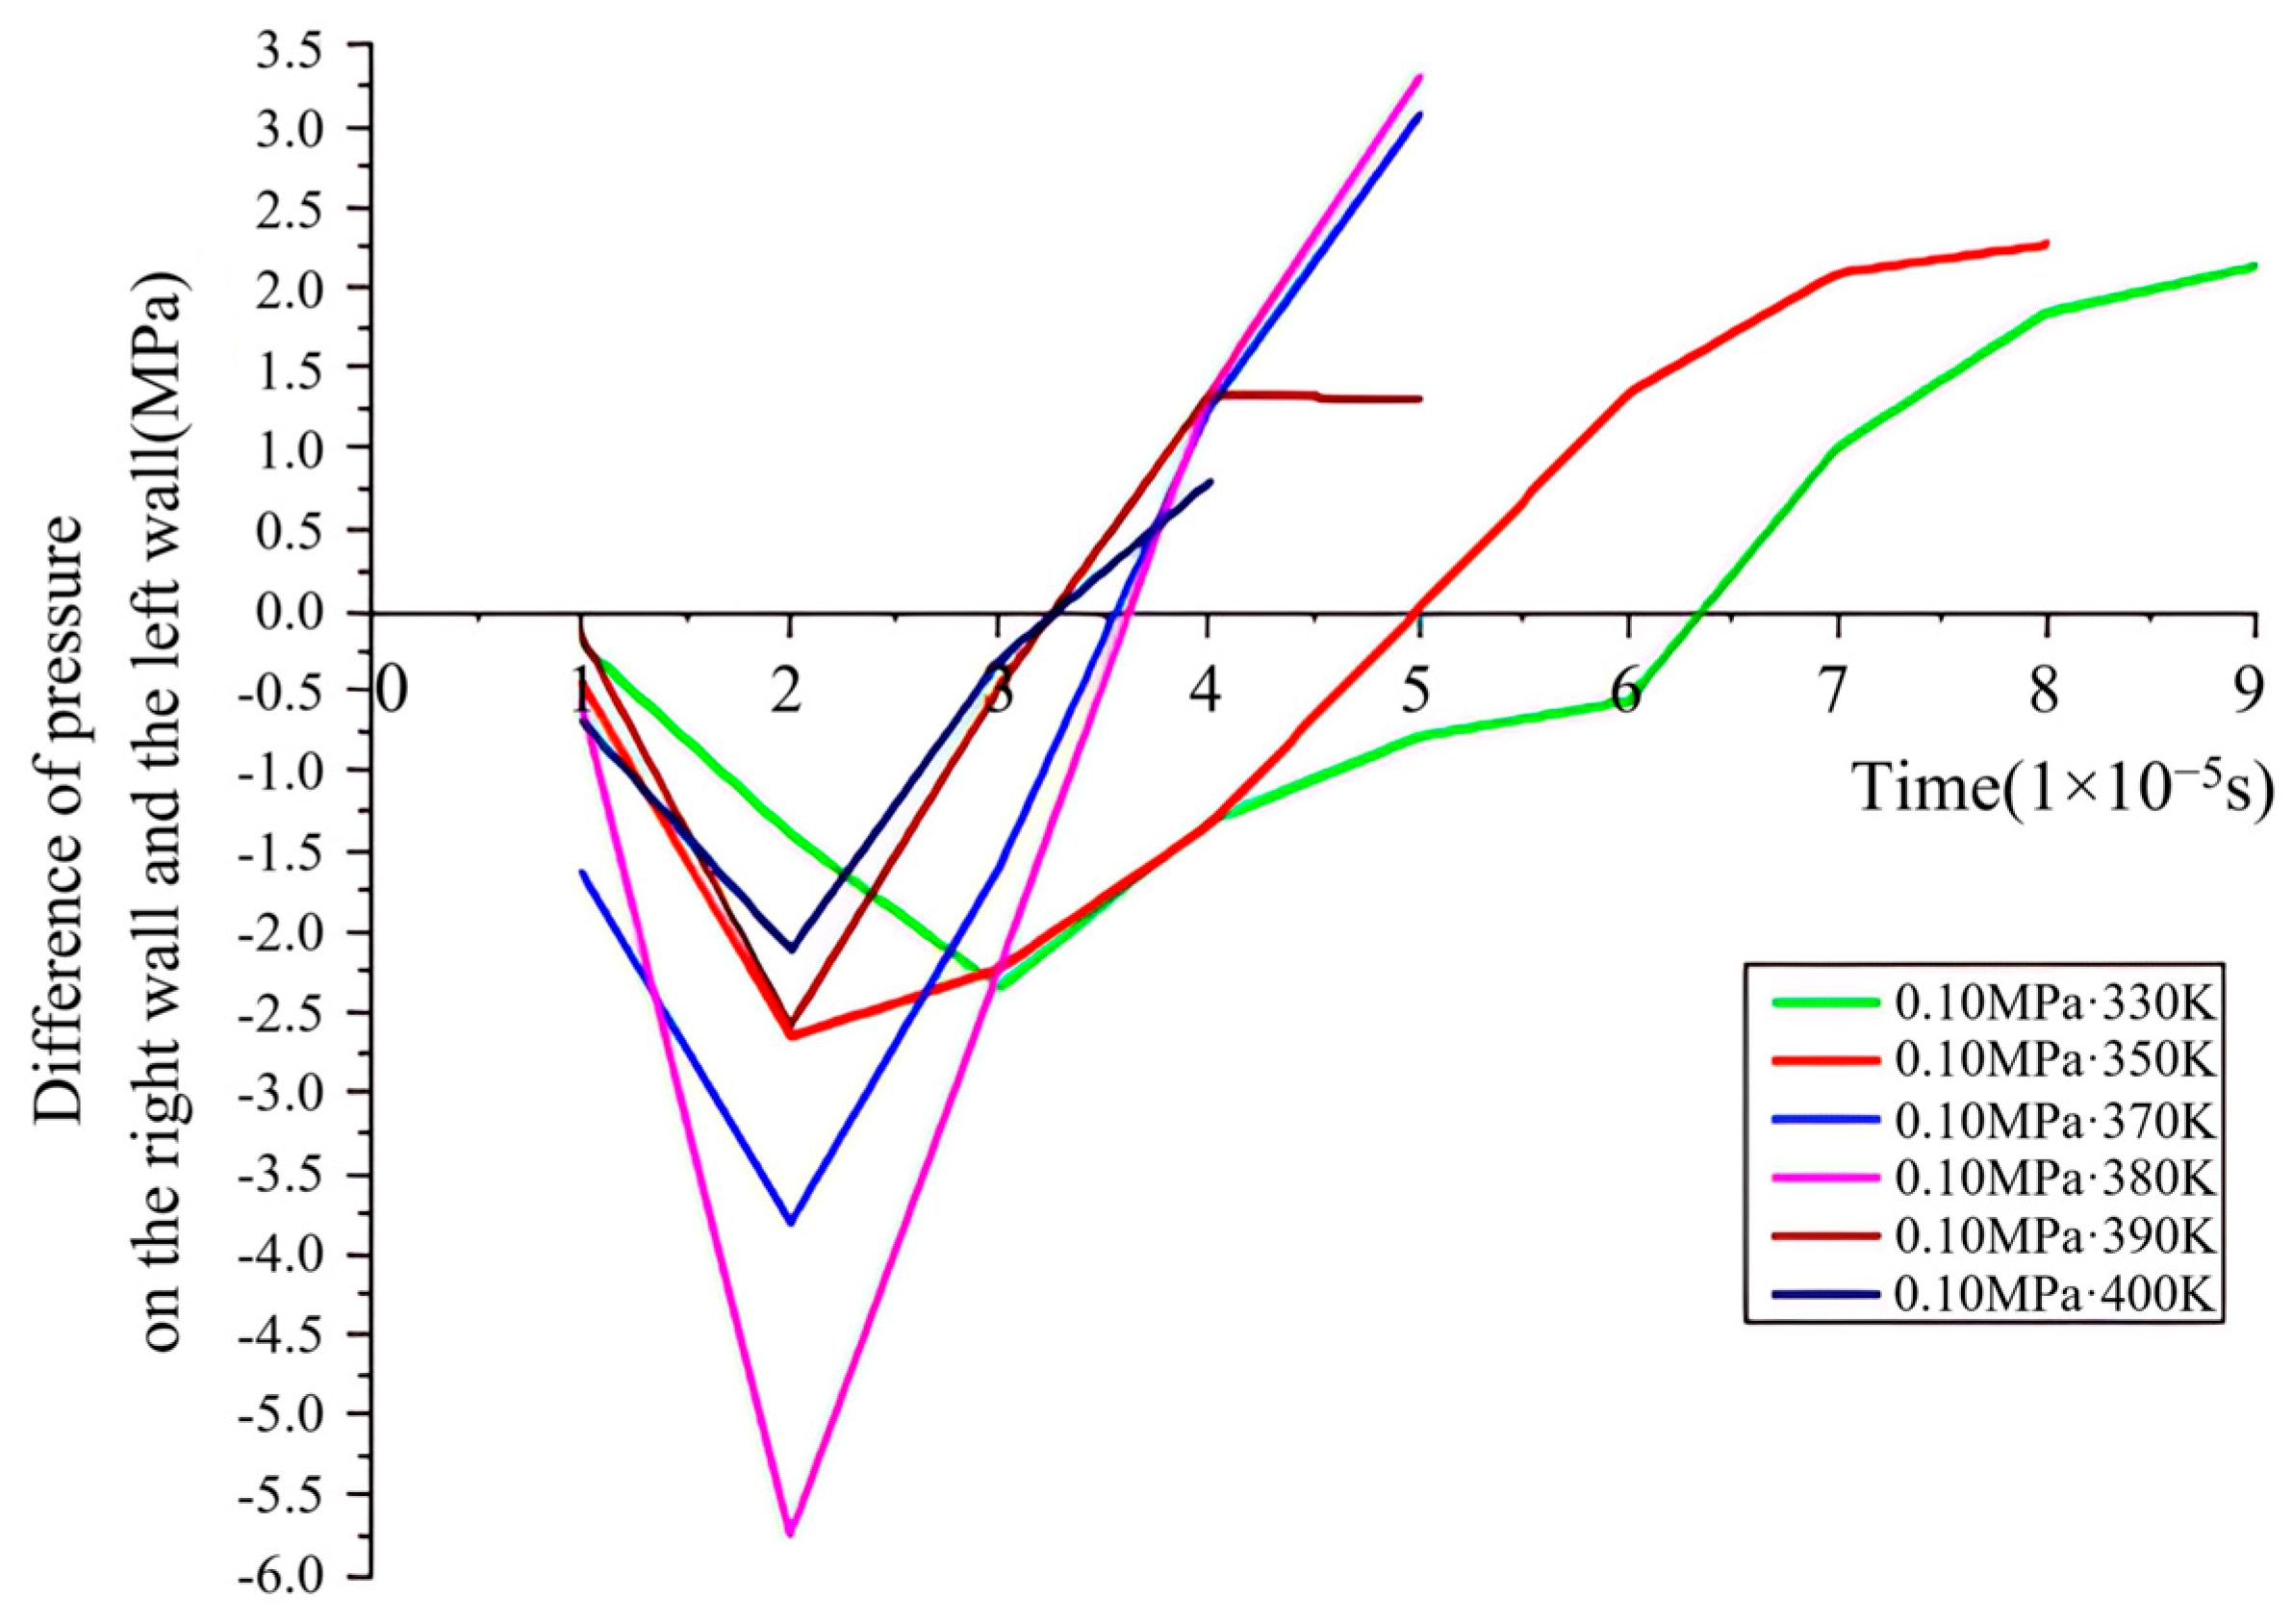
When constant volume combustion occurs, because of its large auto-ignition area, the combustion area is closer to the left wall, so the left wall is highly pressurized during the process of constant volume combustion. Because the increase in pressure produced by constant volume combustion is more uniform, the decrease in pressure on the right wall is significantly lower, so the strength of pressure waves is also significantly lower. The effect of pressurization by the pressure waves on the left wall is very weak, so the relationship between the increase in pressure on the left wall and the decrease in pressure on the right wall is not tight. The maximum difference in pressure on the right wall and the left wall decreases, so the pressure oscillation amplitude decreases.
The inhomogeneity of the pressure in the cylinder can be analyzed from the graphs of the difference in pressure on the right wall and the left wall, as shown in Figure 13. At the initial temperature of 380 K, auto-ignition occurs on the right wall and the increase and decrease in pressure are very large and concentrated, so the difference in pressure in the range of positive and negative values is all very high and the pressure oscillation amplitude is also high. At the initial temperature of 390 K, constant volume combustion occurs. Due to the increase in pressure produced by constant volume combustion it is significantly lower because of the decrease in energy density and is also more uniform, the expansion ability of the combustion products is very weak, so the decrease in pressure on the right wall and the strength of pressure waves is lower. The increase in pressure on the left wall is also lower. So the difference in pressure in the range of positive and negative values is all lower and the pressure oscillation amplitude is also lower. At the initial temperature of 400 K, the increase in pressure produced by constant volume combustion is higher due to the increase in the initial temperature. The area of constant volume combustion is very large, so the increase in pressure is very uniform which makes the expansion ability still very weak. The decrease in pressure on the right wall and the strength of pressure waves also increase slightly. And due to the area of constant volume combustion being larger, the pressure on the left wall is significantly increased during the process of combustion which makes the increase in pressure on the left wall higher. But because the increase in pressure increases significantly and the decrease in pressure increases slightly on the right wall, the difference in pressure in the range of positive and negative values is still lower and the pressure oscillation amplitude is lower.

4. Conclusions

This study contributes to the advancement of green shipping technologies by elucidating the knock mechanisms in marine natural gas engines, which are pivotal for the integration of clean and renewable energy in maritime power systems. Fluent simulation software is used to research the methane equivalent ratio combustion knock mechanism in an RCM. The conclusions are as follows:
  • Natural gas knock is still caused by the end-gas auto-ignition. The increase in the initial temperature will lead to the transformation of auto-ignition modes and combustion modes, and the increase in the unburned area is the main reason for the transformation. But the initial pressure has little effect on the size of the unburned area, auto-ignition modes, and combustion modes.
  • The increase in the initial pressure and temperature will increase the pressurized amplitude of the pressure waves. But the increase in the initial temperature will decrease the highest strength of the pressure waves. The increase in the initial pressure will increase the highest strength of the pressure waves, but the time of combustion is very short, so the strength of pressure waves cannot increase high enough to make auto-ignition occur in front of the flame.
  • With the increase in the initial pressure, the pressure of the end gas before auto-ignition increases which leads to the decrease in ignition temperature and the growth rate of temperature also increases, but the time of auto-ignition occurrence is slightly shortened. With the increase in the initial temperature, the pressure of the end gas before auto-ignition decreases which leads to the increase in the ignition temperature and the growth rate of temperature increases. The time of auto-ignition occurrence is significantly shortened. The main cause why auto-ignition occurs earlier is not the increase in the strength of pressure waves, but the decrease in the required increase in temperature to attain ignition temperature caused by the increase in initial temperature.
  • Below the initial temperature of 380 K, the peak pressure is determined by the initial pressure on the left wall before auto-ignition and the increase in pressure on the left wall. The increase in the initial temperature can not only decrease the pressure on the left wall before auto-ignition, but also increases the pressure on the left wall to a greater extent. There is a competitive relationship between the two factors, leading to the trend of the peak pressure decreasing first and then increasing. The increase in the initial pressure can make the pressure of the end gas before auto-ignition and the increase in pressure on the left wall higher, so the peak pressure increases. The pressure oscillation amplitude is positively correlated to the increase in pressure on the left wall which is also positively correlated to initial temperature and pressure.
  • Above the initial temperature of 380 K, constant volume combustion will occur as part of the initial pressure which makes the increase and decrease in pressure more uniform, so the pressure oscillation amplitude decreases. And the peak pressure sometimes appears in the constant volume combustion area. The competitive relationship between initial temperature and energy density makes constant volume combustion produce different increases in pressure at different initial conditions. Constant volume combustion will produce a high increase in pressure at the right initial conditions and the strength of pressure waves is very low, so the peak pressure will occur in the combustion area.

Author Contributions

Conceptualization, Q.Z.; methodology, B.Y. and X.L.; software, Z.L.; data curation, Y.X. and G.Z.; writing—original draft preparation, Q.Z.; writing—review and editing, X.L.; visualization, Z.L. and Y.X.; supervision, B.Y. and Z.L.; project administration, Q.Z. All authors have read and agreed to the published version of the manuscript.

Funding

This research received no external funding.

Institutional Review Board Statement

Not applicable.

Informed Consent Statement

Not applicable.

Data Availability Statement

Data are contained within the article.

Acknowledgments

Special thanks are given to those who participated in the writing of this paper.

Conflicts of Interest

The authors declare no conflicts of interest.

References

  1. Mueller, N.; Westerby, M.; Nieuwenhuijsen, M. Health impact assessments of shipping and port-sourced air pollution on a global scale: A scoping literature review. Environ. Res. 2023, 216, 114460. [Google Scholar]
  2. Deng, J.; Wang, X.; Wei, Z.; Wang, L.; Wang, C.; Chen, Z. A review of NOx and SOx emission reduction technologies for marine diesel engines and the potential evaluation of liquefied natural gas fuelled vessels. Sci. Total Environ. 2021, 766, 144319. [Google Scholar]
  3. International Maritime Organization (IMO). Greenhouse Gas Emissions; International Maritime Organization: London, UK, 2018. [Google Scholar]
  4. Ricardo, H.R. The High-Speed Internal-Combustion Engine; Blockne & Sons Ltd.: Glasgow, UK; London, UK, 1922. [Google Scholar]
  5. Miller, C.D.; Olsen, H.L.; Logan, W.O.; Osterstrom, G.E., Jr. Analysis of spark-ignition engine knock as seen in photographs taken at 200,000 frames per second. Natl. Advis. Comm. Aeronaut. 1946, TR857, 363–373. [Google Scholar]
  6. Male, T. Photographs at 500,000 frames per second of combustion and detonation in a reciprocating engine. Symp. Combust. Flame Explos. Phenom. 1948, 3, 721–726. [Google Scholar]
  7. Curry, S. A Three-Dimensional Study of Flame Propagation in a Spark Ignition Engine; SAE Paper: London, UK, 1963; pp. 628–650. [Google Scholar]
  8. Chen, R.; Zhang, P.; Pan, J.; Wei, H.; Shang, Y. Experimental study on the characteristics of auto-ignition of propane and the knock mechanism of propane. J. Tianjin Univ. 2018, 51, 1218–1222. [Google Scholar]
  9. Chen, L.; Zhang, R.; Wei, H.; Pan, J. Effect of flame speed on knocking characteristics for SI engine under critical knocking conditions. Fuel 2020, 282, 118846. [Google Scholar]
  10. Wu, Y.; Liu, L.; Liu, B.; Cao, E.; Xiong, Q. Investigation of rapid flame front controlled knock combustion and its suppression in natural gas dual-fuel marine engine. Energy 2023, 279, 128078. [Google Scholar]
  11. Zhang, Q.; Song, G.; Wang, X.; Li, M. Effects of injection strategy on the knocking behavior of a pilot ignited direct injection natural gas engine. Fuel 2022, 308, 121920. [Google Scholar] [CrossRef]
  12. Xu, H.; Ni, X.; Su, X.; Weng, C.; Yao, C. The effect of ignition intensity and in-cylinder pressure on the knock intensity and detonation formation in internal combustion engines. Appl. Therm. Eng. 2022, 200, 117690. [Google Scholar]
  13. Xian, K. A Study on the Knock Characteristics of Natural Gas Engine. Master’s Thesis, Shandong University, Jinan, China, 2015. [Google Scholar]
  14. Wu, C. A Study on the Knock of Natural Gas Engine with High Compression Ratio. Master’s Thesis, Hunan University, Changsha, China, 2017. [Google Scholar]
  15. Gao, D. A Study on the Flame-Shock Wave Interaction in Enclosed Space and Its Effect on Combustion Modes. Ph.D. Thesis, Tianjin University, Tianjin, China, 2017. [Google Scholar]
  16. Tao, K. Accelerated Flame Propagation in Constant Volume Combustion and Its Effects on End Gas Auto-Ignition. Master’s Thesis, Tianjin University, Tianjin, China, 2015. [Google Scholar]
  17. Ultiew, P.A.; Oppenheim, A.K. Experimental Observations of the Transition to Detonation in an Explosive Gas. Proc. R. Soc. Lond. 1966, A295, 13–28. [Google Scholar]
  18. Wei, H.; Qi, J.; Zhou, L.; Zhao, W.; Shu, G. Ignition characteristics of methane/n-heptane fuel blends under engine-like conditions. Energy Fuels 2018, 32, 6264–6277. [Google Scholar]
  19. Zou, F.; Zeng, H.; Wang, H.; Wang, X.X.; Xu, Z.X. Implementation and parameter analysis of the knock phenomenon of a marine dual-fuel engine based on a two-zone combustion model. Processes 2021, 9, 602. [Google Scholar] [CrossRef]
  20. Montoya, J.; Andrés AArrieta, A. Effect of the turbulence intensity on knocking tendency in a SI engine with high compression ratio using biogas and blends with natural gas, propane and hydrogen. Int. J. Hydrogen Energy 2022, 44, 18532–18544. [Google Scholar]
  21. Xiang, L.; Theotokatos, G.; Cui, H.; Xu, K.; Ben, H.; Ding, Y. Parametric Knocking Performance Investigation of Spark Ignition Natural Gas Engines and Dual Fuel Engines. J. Mar. Sci. Eng. 2020, 8, 459. [Google Scholar] [CrossRef]
  22. Zhou, W.; Xi, H.; Zhou, S.; Zhang, Z.; Shreka, M. Numerical study on knock characteristics and mechanism of a heavy duty natural gas/diesel RCCI engine. Int. J. Hydrogen Energy 2022, 47, 37072–37089. [Google Scholar]
  23. Guo, H.; Zhou, S.; Zou, J.; Shreka, M. A Numerical Study on the Pilot Injection Conditions of a Marine 2-Stroke Lean-Burn Dual Fuel Engine. Processes 2020, 8, 1396. [Google Scholar] [CrossRef]
  24. Kangbainietz, A.C. The Principle of Knock; Higher Education Press: Beijing, China, 1956; pp. 147–163. [Google Scholar]
  25. Lee, J.H.S.; Knystautas, R.; Yoshikawa, N. Photochemical initiation and gaseous detonations. Astronaut. Acta 1978, 5, 971–972. [Google Scholar] [CrossRef]
  26. Bradley, D.; Kalghatgi, G.T. Influence of auto-ignition delay time characteristics of different fuels on pressure waves and knock in reciprocating engines. Combust. Flame 2009, 156, 2307–2318. [Google Scholar] [CrossRef]
  27. ZelDovich, Y.B. Regime classification of an exothermic reaction with nonuniform initial conditions. Combust. Flame 1980, 39, 211–214. [Google Scholar] [CrossRef]
  28. Liu, H. Design and Experimental Research of Rapid Compression Machine. Master’s Thesis, Beijing University of Technology, Beijing, China, 2015. [Google Scholar]
  29. Zhang, H.; Shi, Z.; Lu, H.; Liu, H. A study on the ignition delay of methane based on the rapid compression machine. J. Beijing Univ. Technol. 2016, 42, 577–584. [Google Scholar]
  30. Zeldovich, Y.B.; Librovich, V.B.; Makhviladze, G.M.; Sivashinsky, G.I. On the development of detonation in a nonuniformly preheated gas. Astron Acta 1970, 15, 313. [Google Scholar]
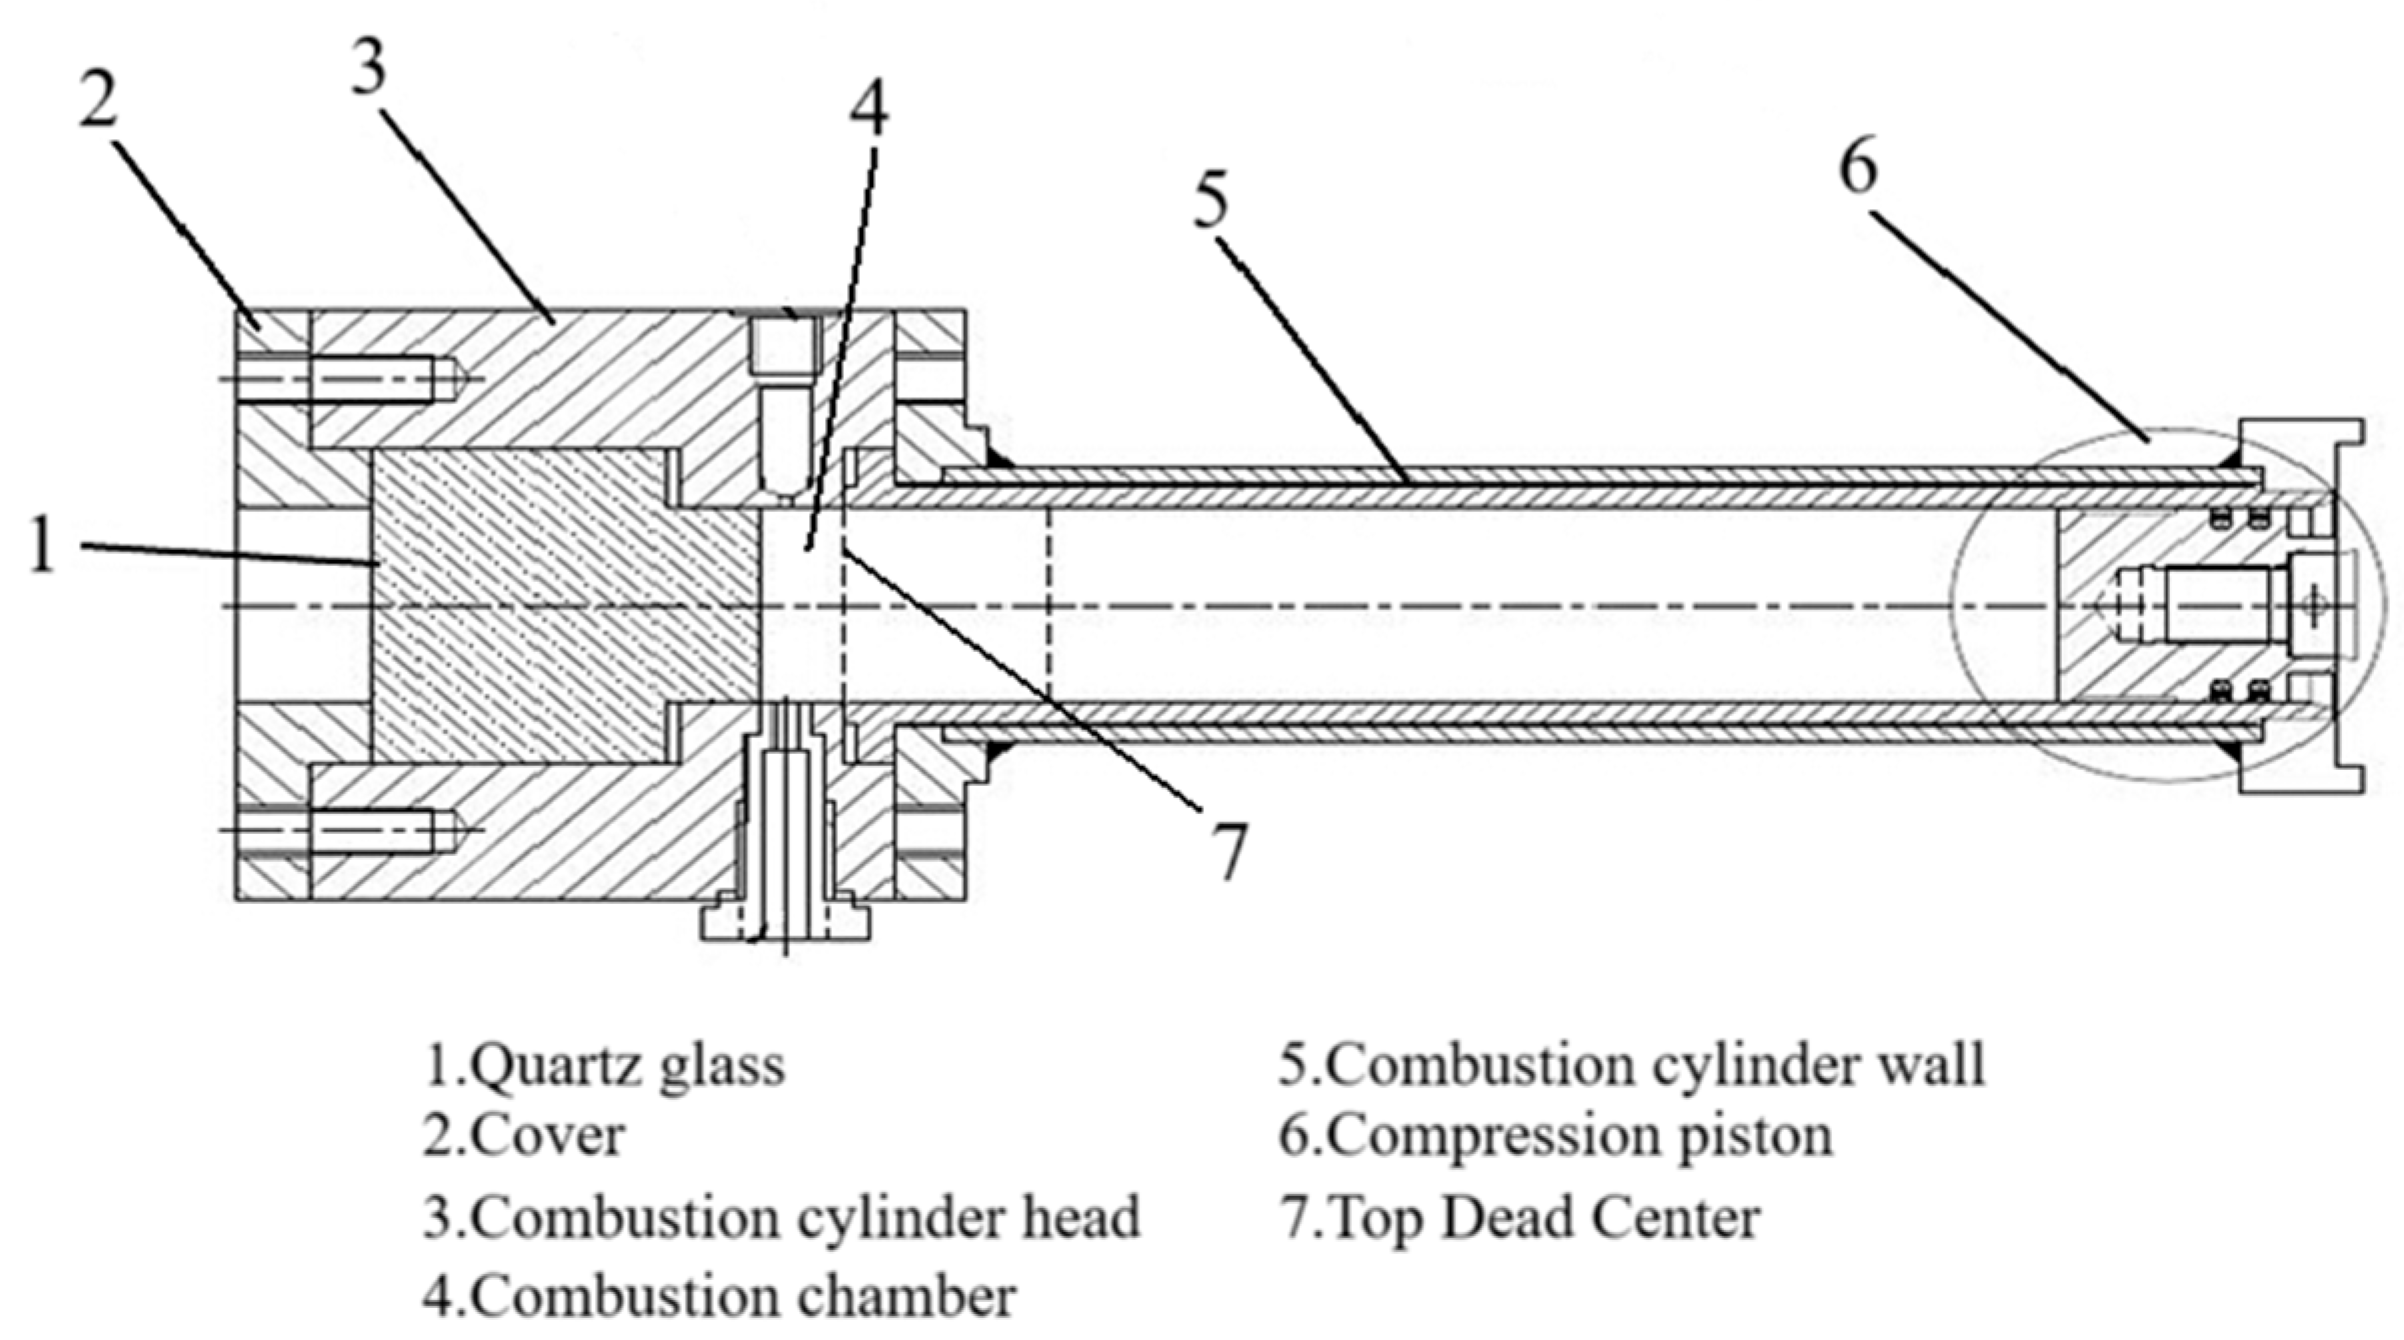
Figure 1. The schematic diagram of the combustion chamber.
Sustainability 17 03274 g001
Figure 2. Schematic diagram of ignition position and measurement position.
Sustainability 17 03274 g002
Figure 3. Graphs of the peak pressure and the pressure oscillation amplitude at each initial condition. (a) Peak pressure curve; (b) Pressure oscillation amplitude curve.
Sustainability 17 03274 g003
Figure 4. The temperature cloud pictures when the end-gas auto-ignition at initial temperature of 300 K.
Sustainability 17 03274 g004
Figure 5. The temperature cloud pictures when the end-gas auto-ignition at initial temperature of 350 K.
Sustainability 17 03274 g005
Figure 6. The temperature and pressure cloud pictures when the end-gas auto-ignition at initial temperature of 400 K. (a) Temperature cloud picture; (b) Pressure cloud picture.
Sustainability 17 03274 g006
Figure 7. Graphs of the pressurized amplitude of pressure waves before auto-ignition occurs. (a) Pressurized amplitude of pressure waves at different initial temperatures; (b) Pressurized amplitude of pressure waves at different initial pressures.
Sustainability 17 03274 g007
Figure 8. Graphs of the pressure on the right wall before auto-ignition occurs. (a) Pressure variation curve on the right wall at different initial temperatures; (b) Pressure variation curve on the right wall under different initial pressures.
Sustainability 17 03274 g008
Figure 9. Graphs of the temperature on the right wall before auto-ignition occurs. (a) Temperature variation curve on the right wall at different initial temperatures; (b) Temperature variation curve on the right wall at different initial temperatures.
Sustainability 17 03274 g009
Figure 10. Graph of the pressure on the left wall after auto-ignition occurs at initial conditions of 0.06 MPa, part of the initial temperatures.
Sustainability 17 03274 g010
Figure 11. Graph of the increase in pressure on the left wall after auto-ignition occurs as part of the initial conditions.
Sustainability 17 03274 g011
Figure 12. Graphs of the maximum pressure in the cylinder and pressure on the right wall after auto-ignition occurs. (a) Maximum in-cylinder pressure curve; (b) Right wall surface pressure curve.
Sustainability 17 03274 g012
Figure 13. Graph of the difference in pressure on the right wall and the left wall at initial conditions of 0.1 MPa, part of the initial temperatures.
Sustainability 17 03274 g013
Table 1. Combustion modes, the moment of auto-ignition occurrence and the position of the flame at part of initial conditions.
Initial ConditionsAbnormal Combustion ModesThe Moment of Auto-Ignition Occurrence (1 × 10⁻⁵ s)/The Position of the Flame
(m)
The Flame Propagation Velocity Generated by Auto-Ignition
(m/s)
Pressure
(MPa)
Temperature
(K)
0.06300Subsonic deflagration128/0.024050
330Subsonic deflagration79/0.0115180
350Subsonic deflagration56/0.0060500
390Supersonic deflagration18/−0.00802400
400Supersonic deflagration–Constant volume combustion13/−0.01203000
0.10300Subsonic deflagration112/0.0205125
330Subsonic deflagration70/0.0120200–350
350Subsonic deflagration48/0.0050500–700
390Supersonic deflagration13/−0.01052700
400Supersonic deflagration–Constant volume combustion10/−0.01253650
Disclaimer/Publisher’s Note: The statements, opinions and data contained in all publications are solely those of the individual author(s) and contributor(s) and not of MDPI and/or the editor(s). MDPI and/or the editor(s) disclaim responsibility for any injury to people or property resulting from any ideas, methods, instructions or products referred to in the content.