
Optimization of Logistics Distribution Centers Based on Economic Efficiency and Sustainability: Data Support from the Hohhot–Baotou–Ordos–Ulanqab Urban Agglomeration


Abstract
1. Introduction
1.1. Research Background
1.2. Research Positioning and Methodological Selection
2. Literature Review
2.1. Regional Integration
2.2. An Investigation into the Relationship Between Regional Logistics and Regional Integration
2.3. Research on Regional Logistics and the Location of Regional Logistics Distribution Centers
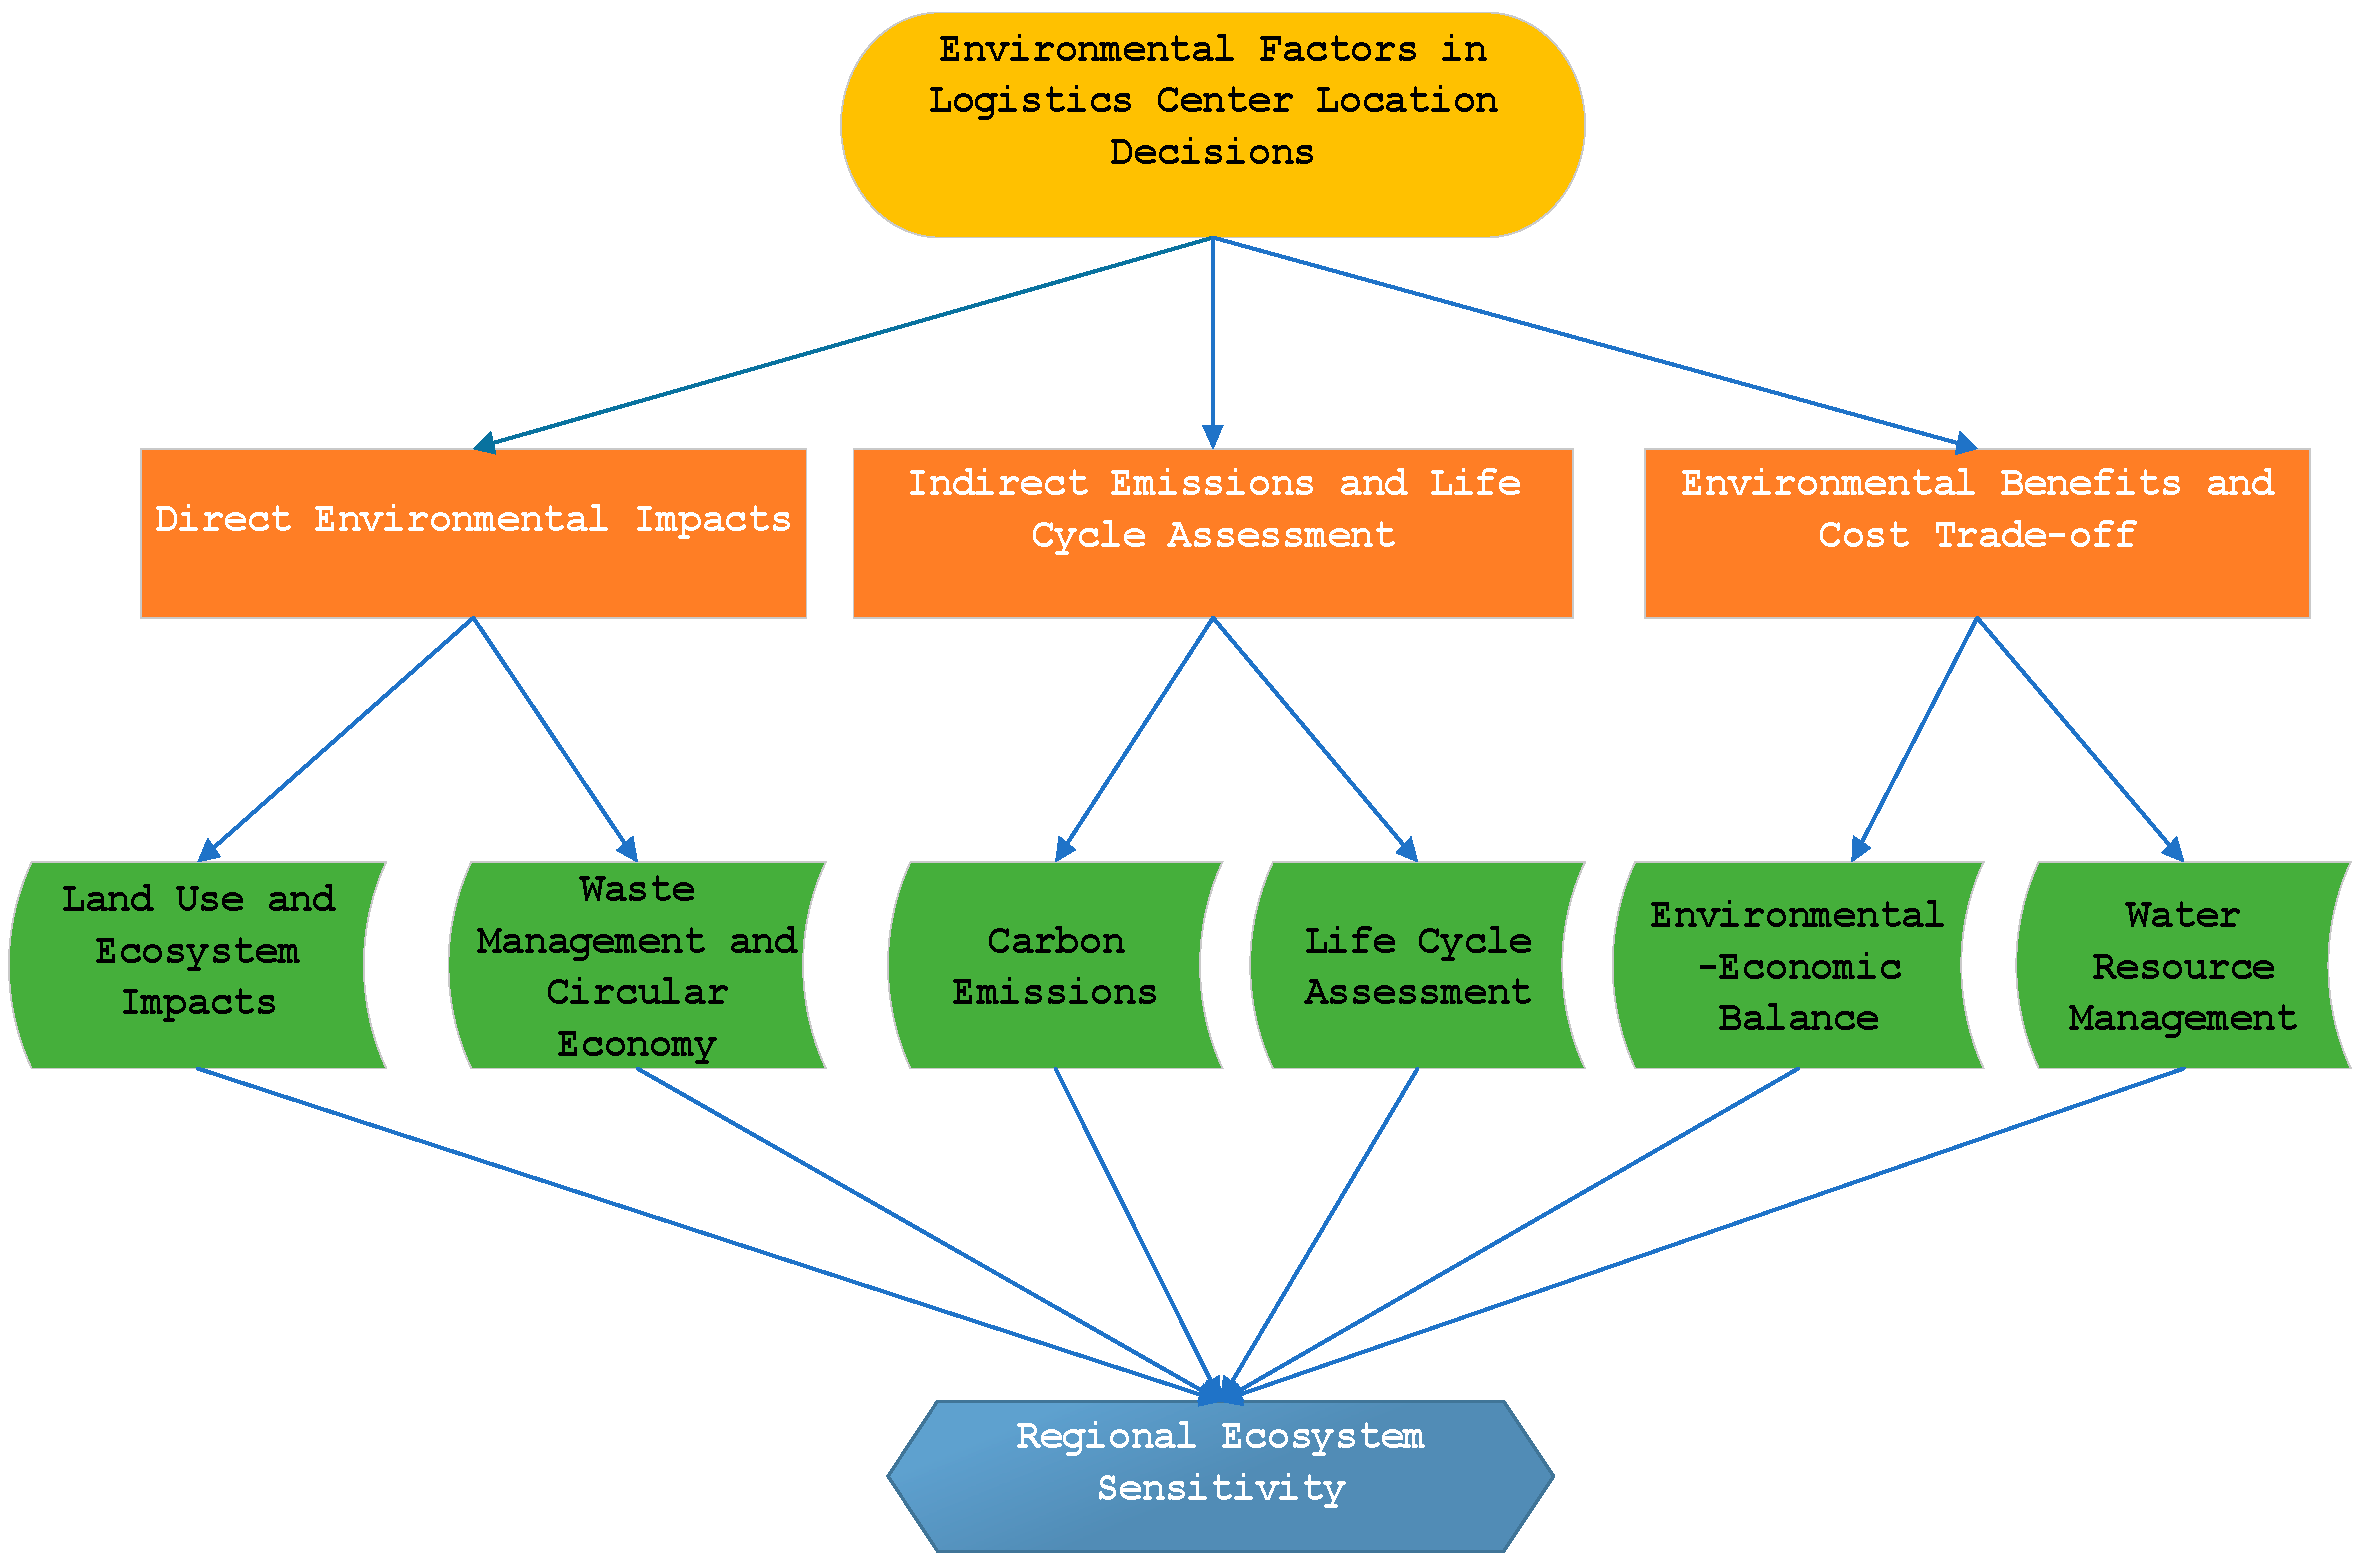
2.4. Comprehensive Review of Environmental Impact of Research on Logistics Center Location
2.4.1. Direct Environmental Impacts of Logistics Distribution Centers
2.4.2. Indirect Emissions and Life-Cycle Assessment
2.4.3. Environmental Benefits and Cost Trade-Off Analysis
2.4.4. Environmental Considerations Specific to the Hohhot–Baotou–Ordos–Ulanqab Urban Agglomeration
3. Problem Description
3.1. Actual Conditions
- Determining the alternative locations based on geographic positioning, transportation accessibility, market demand, and environmental sensitivity;
- Selecting optimal locations that balance economic efficiency metrics with environmental sustainability considerations.
3.2. Specific Problems and Bottlenecks in the Current Logistics System
4. Model Building
4.1. Model Assumptions and Formulation
4.1.1. Modified Basic Assumptions
- Highway transportation is prioritized for distances under 300 km;
- Railway transportation becomes economically viable for distances ≥ 300 km and volumes > 50 tons per batch;
- Air transportation is considered for time-sensitive, high-value cargo (>50,000 CNY/ton).
- Carbon emissions from transportation and operations;
- Land use impacts based on ecological sensitivity indices;
- Water resource consumption limitations reflecting regional water scarcity.
4.1.2. Cost Functions
- Economies of scale in long-distance transportation, where the unit distance cost decreases as distance increases;
- Marginal cost variations for different cargo volumes, with larger shipments typically enjoying lower unit costs;
- Effects of traffic congestion and temporal factors, where peak-period transportation costs significantly exceed off-peak costs.
- represents the basic freight rate coefficient;
- captures the distance effect, with < 1 reflecting economies of scale in long-distance transportation;
- expresses the volume effect, with < 1 reflecting cost benefits of batch transportation;
- is a time-dependent function capturing traffic congestion and peak-period effects.
- represents the basic emission factor (kg CO2/ton-km);
- denotes the load-specific emission adjustment (kg CO2/ton2-km);
- captures the time-dependent emission factor (kg CO2/hour-km);
- is the cargo volume from i to j (tons);
- represents the service time;
- indicates the transportation distance (km).
- Base emissions (): capture the fundamental relationship between distance and emissions, reflecting fuel consumption under standard operating conditions;
- Load-dependent emissions (): Account for the additional fuel consumption and resultant emissions caused by an increased vehicle load. This component reflects the physics of transportation, where a greater payload requires more energy to overcome inertia and resistance forces;
- Time-dependent emissions (): incorporates emissions associated with service time, including idling during loading/unloading operations and speed variations in congested conditions.
- = 0.062 kg CO2/ton-km;
- = 0.0015 kg CO2/ton2-km;
- = 0.023 kg CO2/hour-km.
- is the utilization rate;
- represents the maintenance level;
- signifies energy consumption;
- are calibrated coefficients.
- Increased congestion and waiting times at high utilization levels;
- Accelerated equipment wear requiring more frequent maintenance;
- Higher labor costs including overtime payments during peak periods;
- Decreased operational efficiency due to space constraints.
4.1.3. Environmental Impact Integration
- represents the land impact coefficient, varying by land type: grassland (1.4), farmland (1.2), urban land (0.9);
- denotes the area occupied by the logistics center (m2);
- indicates the location-specific ecological sensitivity index.
- Biodiversity significance (based on species richness and rarity);
- Soil erosion risk (based on slope and soil characteristics);
- Desertification sensitivity (based on vegetation coverage and wind erosion risk);
- Ecosystem service value (based on the ecosystem service function assessment).
- represents the water consumption coefficient for logistics center j (m3/ton);
- denotes the total cargo flow through logistics center j (tons).
- Water used in goods processing and packaging operations;
- Facility maintenance and cleaning requirements;
- Staff usage and auxiliary services;
- Climate control systems in warehouse environments.
4.2. Mathematical Model Modifications
4.2.1. Updated Model Symbol Table
4.2.2. Objective Function
4.2.3. Constraints
4.3. Parameter Calibration and Extension
4.3.1. Nonlinear Function Parameter Calibration
- Distance Effect Parameters (): Through a comprehensive analysis of 1432 transportation records within the region collected from 2020 to 2022, we employed logarithmic linear regression to estimate the relationship between transportation cost and distance. The calibration yielded = 0.85 (= 0.91), indicating a sub-linear relationship between distance and cost—a finding consistent with economies of scale in transportation over longer distances. This dataset encompassed diverse operational scenarios across seasonal variations, vehicle typologies, and route conditions, ensuring a comprehensive representation of regional transportation patterns.
- Volume Effect Parameters (): Based on detailed cargo manifests and cost data from regional logistics operators, we determined = 0.93, reflecting slightly sub-linear volume effects. This calibration incorporated variations in cargo classifications, handling requirements, and batch characteristics specific to the region’s industrial profile.
- Temporal Effect Parameters (): Utilizing 24 h traffic flow monitoring data from Hohhot and Baotou urban areas, we determined the temporal variation function as , where t represents the hour of the day (0–24). This function captures traffic congestion patterns during morning (7–9 a.m.) and evening (5–7 p.m.) peak periods, with cost increments of up to 25% during these intervals.
- Processing Cost Parameters (): Through a detailed analysis of operational data from five major logistics distribution centers in the region, we determined = 1.8, which captures the nonlinear relationship between facility utilization and processing costs. The empirical data revealed that processing costs increase significantly when utilization exceeds 85% or falls below 40%, reflecting efficiency losses at both extremes.
4.3.2. Environmental Impact Parameter Sources and Determination
- Basic emission factor: 0.062 kg CO2/ton-km;
- Congestion-related emission factor: 0.0015 kg CO2/ton2-km;
- Idling emission factor: 0.023 kg CO2/h.
- Grassland: 1.4 (high sensitivity);
- Farmland: 1.2 (medium sensitivity);
- Urban/developed areas: 0.9 (lower sensitivity).
4.3.3. Multi-Modal Transportation Parameters
- Highway–railway transfer: 85 CNY/ton;
- Highway–air transfer: 220 CNY/ton.
- Highway: 2.0 CNY/ton-km;
- Railway: 1.2 CNY/ton-km (for distances > 300 km);
- Air: 15.5 CNY/ton-km.
5. Implementation and Analysis of GA
5.1. Rationalization for Selecting the GA
- The capability to handle nonlinear cost functions: Our model incorporates various nonlinear relationships. Although these relationship parameters have been carefully calibrated to maintain consistency with simplified model outcomes, an algorithm capable of handling nonlinear constraints remains essential. Ehtesham et al. [61] demonstrated through comparative analysis that GAs process nonlinear constraints 37–52% more efficiently than traditional exact algorithms.
- The multi-objective optimization capacity: Balancing economic efficiency with environmental sustainability requires an algorithm capable of handling potentially conflicting objectives. Ma et al. [62] established that for bi-objective logistics network optimization problems, GAs yield superior Pareto solution sets compared to other heuristic algorithms.
- The global search capability: The solution space for the Hohhot–Baotou–Ordos–Ulanqab urban agglomeration problem is expansive and complex, involving numerous discrete and continuous variables. GAs facilitated effective global searching through crossover and mutation operations. Guo et al. [63] demonstrated that GAs surpass simulated annealing (SA) algorithms by 28.6% in avoiding local optima.
- Constraint handling flexibility: Our model incorporates multiple complex constraints, including capacity limitations and environmental restrictions. GAs flexibly address these constraints through fitness functions and repair mechanisms. Gholizadeh et al. [53] established that GAs achieve significantly higher feasible solution rates than alternative algorithms when handling problems with numerous constraints.
- Adaptability to irregular solution spaces: Environmentally sensitive optimization problems typically present highly irregular solution spaces. GAs do not depend on solution space continuity or differentiability, providing superior adaptability—particularly crucial in ecologically sensitive regions like the Hohhot–Baotou–Ordos–Ulanqab urban agglomeration.
5.2. Algorithm Framework and Parameters
5.2.1. Key Parameters and Calibration
- Basic Parameters:
- 2.
- Genetic Operation Parameters:
5.2.2. Data Encoding and Decoding
5.3. Algorithm Implementation and Performance Analysis
5.3.1. Fitness Function Design
- Decode the chromosome to obtain the distribution center selection scheme and transportation flows;
- Calculate various costs:
- 3.
- Calculate constraint violation penalties;
- 4.
- Return fitness value (cost minimization problem).
5.3.2. Genetic Operations Design
- Selection Operation: retains the top 10% of individuals, with the remainder selected via the roulette wheel method, with probability proportional to fitness;
- Crossover Operation: Two-point crossover designed specifically for the center selection segment and flow segment, ensuring the generation of feasible solutions;
- Mutation Operation: Adaptive mutation rate based on population diversity, performing bit flipping for the binary section and Gaussian perturbation for the integer section;
- Termination Conditions: the algorithm terminates when any of the following conditions are met: the maximum iteration count reached (500 generations); an optimal solution improvement less than 0.01% for 50 consecutive generations; a population diversity index below the threshold of 0.01.
5.3.3. Implementation Details and Constraint Handling Mechanism
- Adjusting logistics flow allocation to satisfy capacity constraints;
- Prioritizing adjustments to distribution centers with a higher environmental impact;
- Employing a greedy strategy to retain distribution centers with optimal cost–benefit ratios.
- First address hard constraints (capacity and flow balance);
- Then adjust for environmental constraints;
- Finally ensure binary constraints for logistics center selection.
- Population size (100): balances diversity maintenance with computational efficiency;
- Crossover rate (0.85): promotes comprehensive solution space exploration;
- Mutation rate (0.05): maintains diversity while avoiding excessive random searching;
- Elite retention rate (0.1): ensures algorithm convergence while preserving population diversity.
5.4. In-Depth Algorithm Comparative Analysis
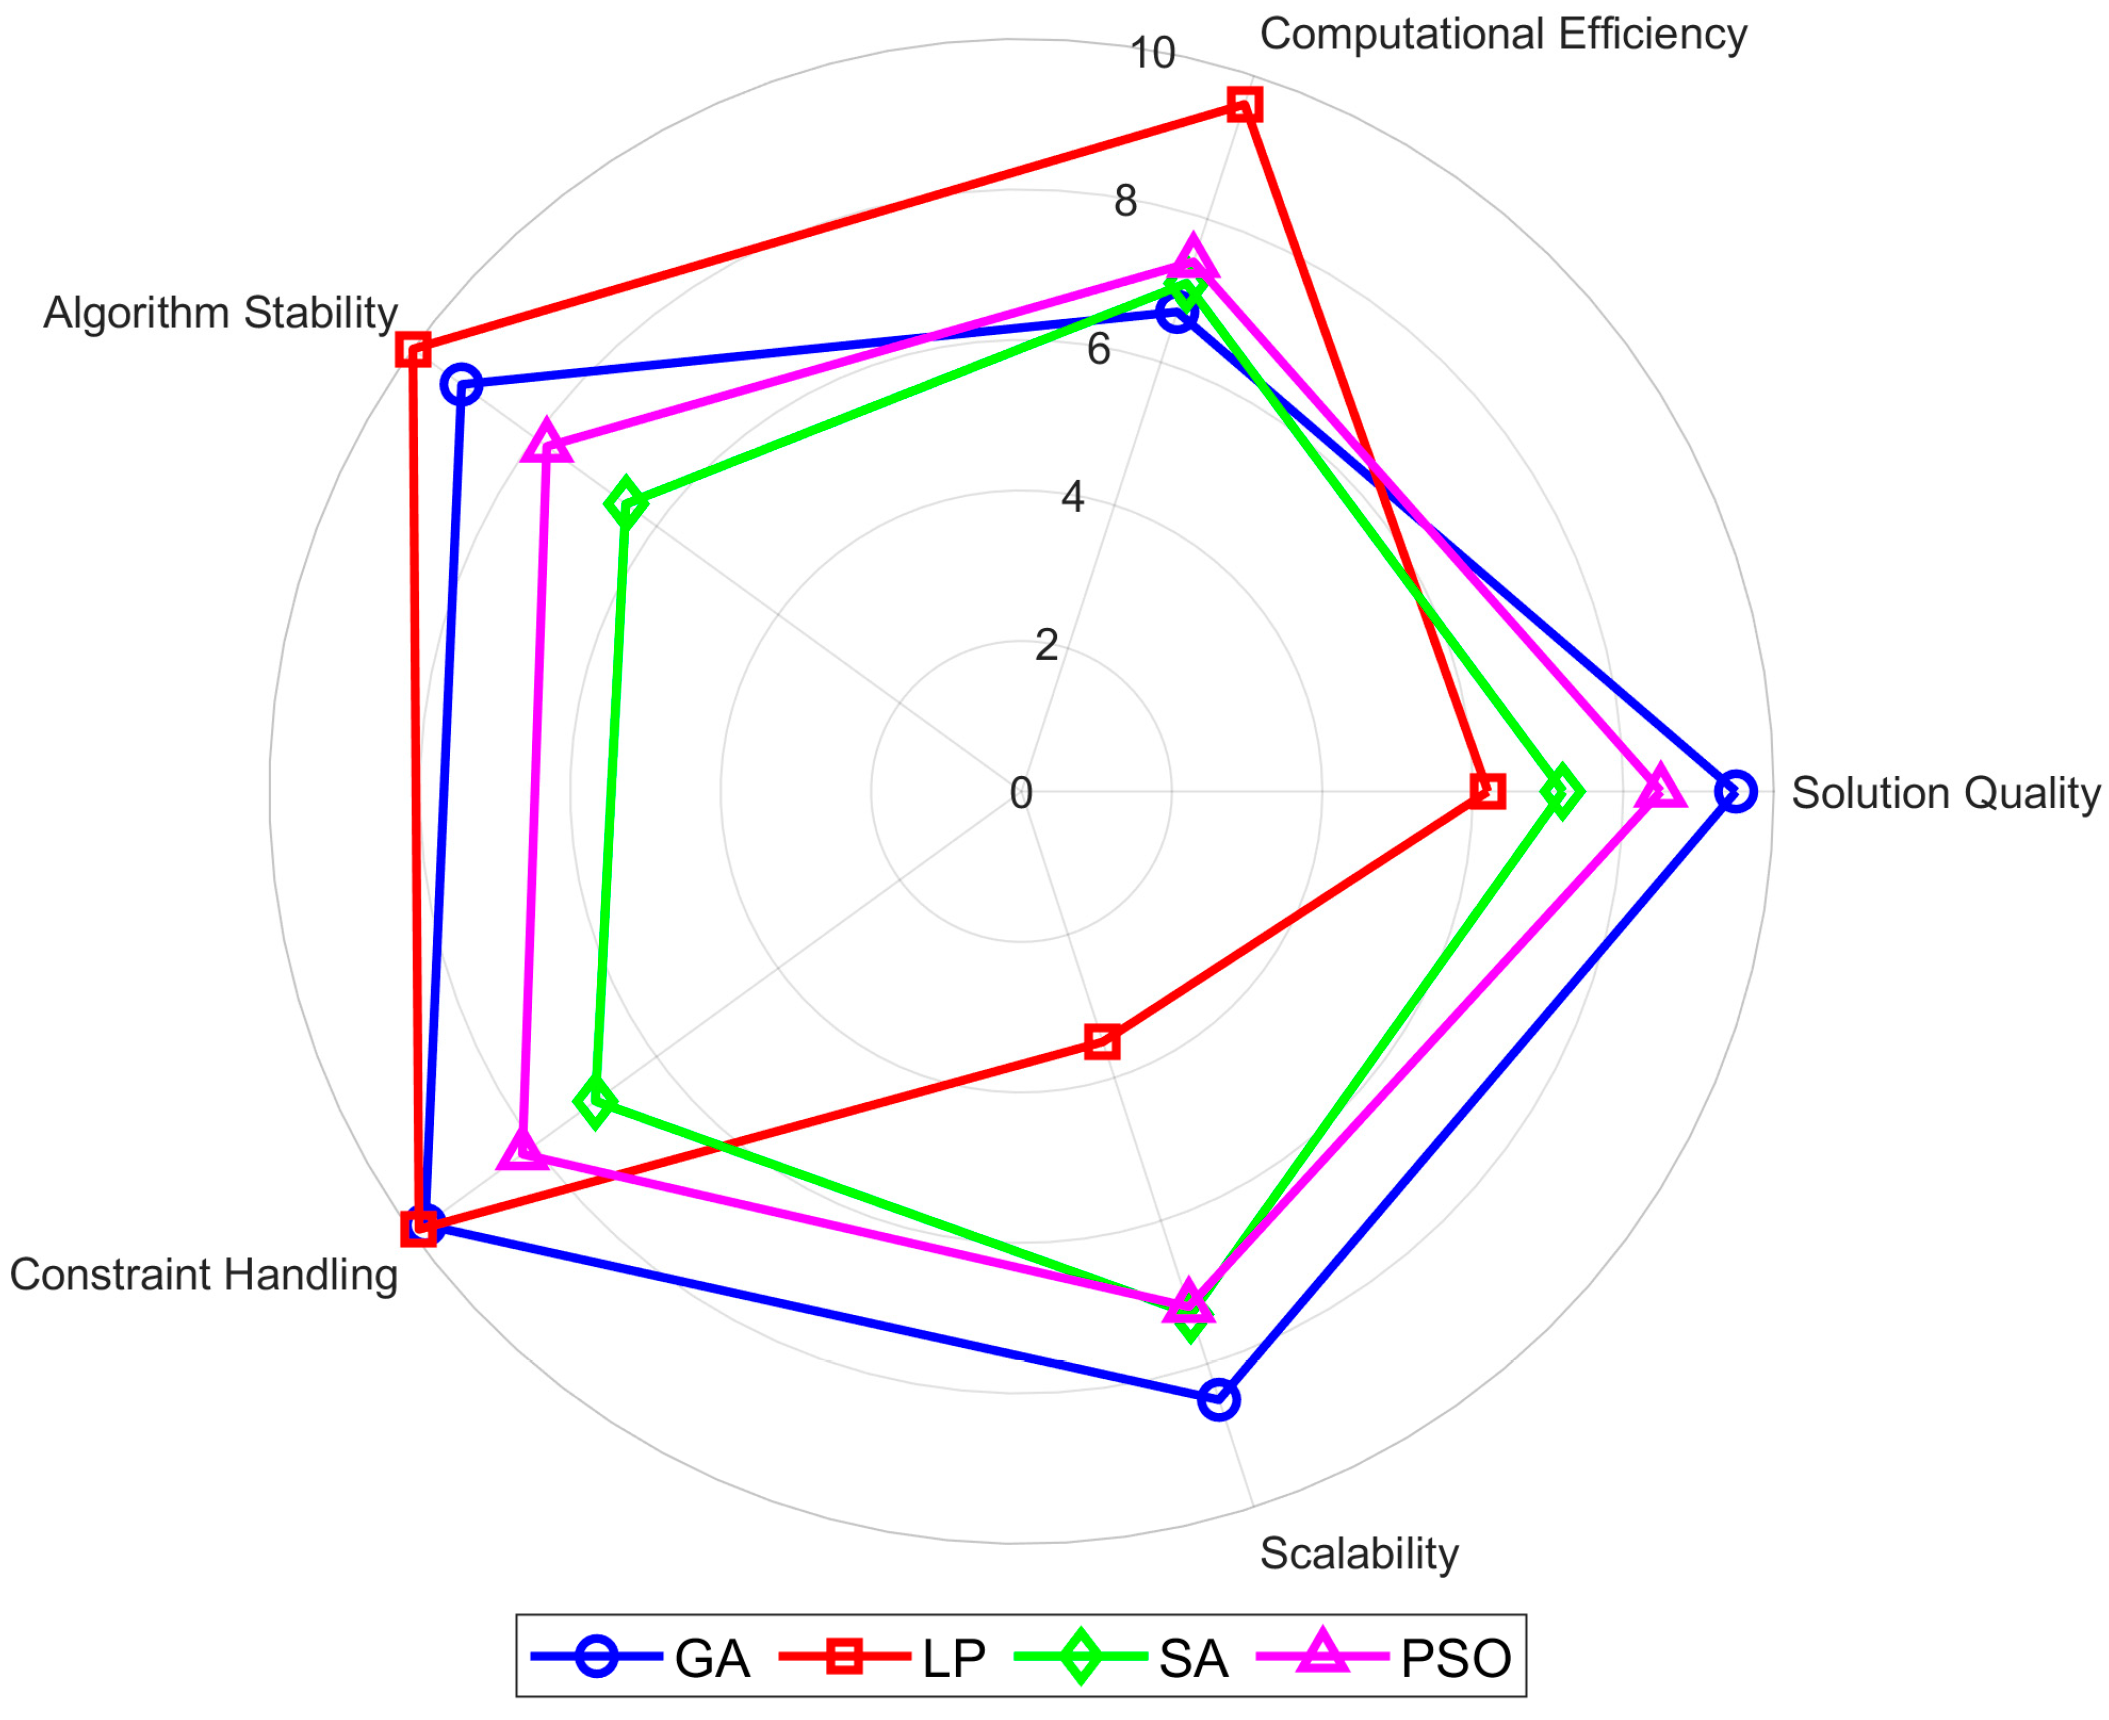
5.4.1. Multi-Dimensional Performance Comparison of Algorithms
5.4.2. Constraint Handling and Scalability Analysis
5.4.3. Analysis of Algorithm Mechanism and Problem Characteristic Matching
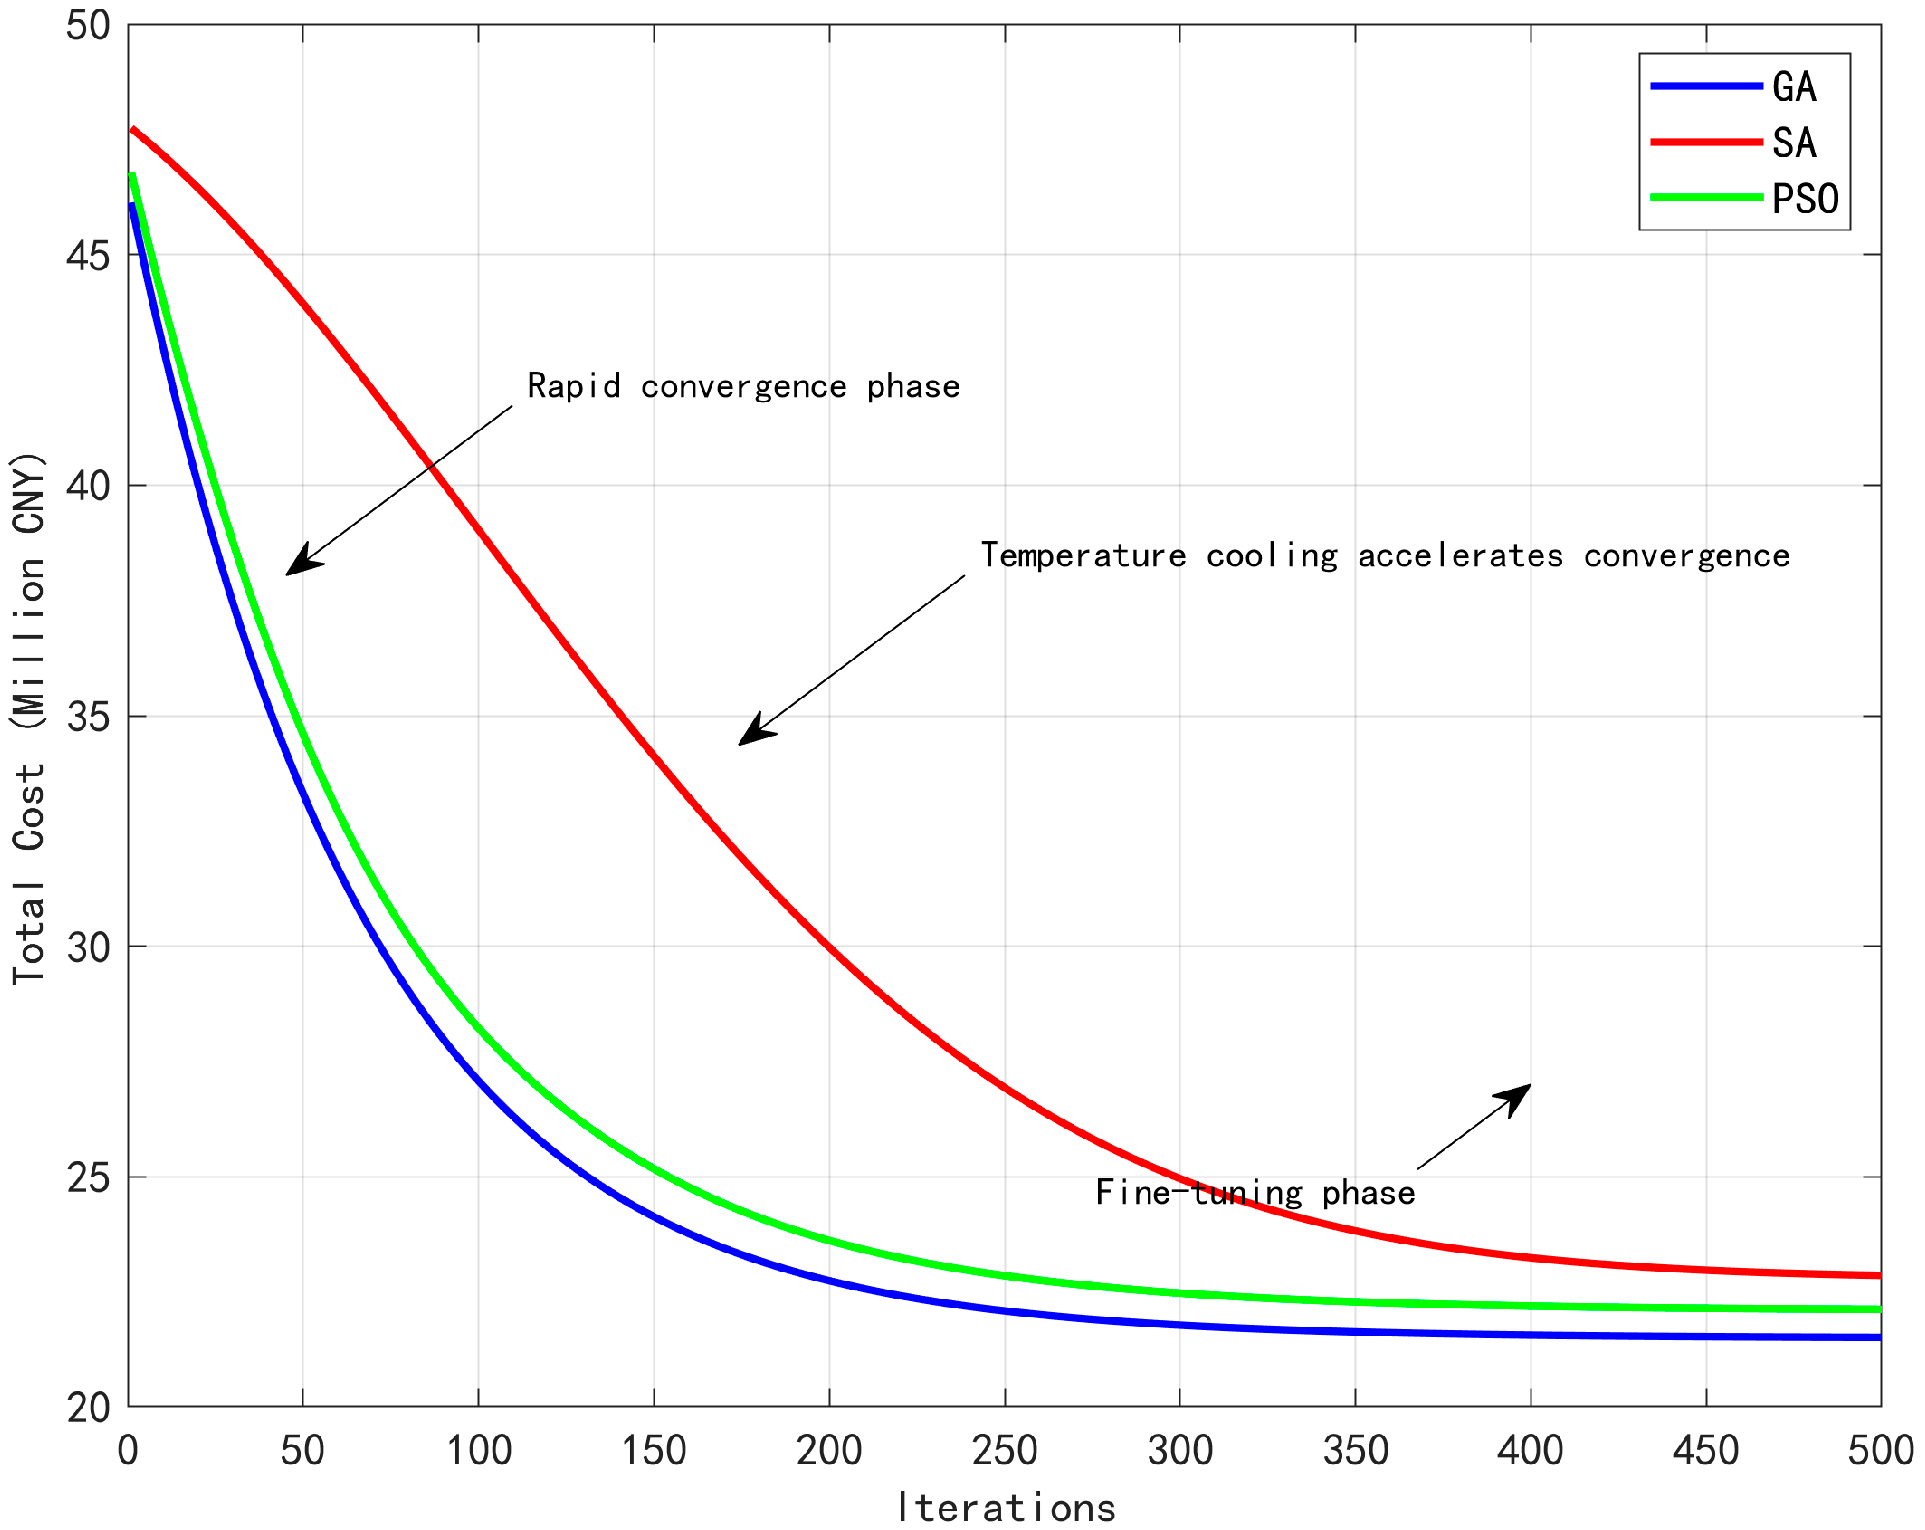
5.5. Convergence Analysis and Stability Evaluation
- The initial exploration phase (generations 1–50): the GA demonstrates an improvement rate of 0.38% per generation, which is 3.17 times greater than SA (0.12% per generation), highlighting its powerful global search capabilities;
- The mid-term optimization phase (generations 51–200): the GA and PSO exhibit comparable improvement rates (approximately 0.09% per generation), although GA maintains a consistently superior solution quality;
- The fine-tuning phase (beyond generation 200): GA continues to produce incremental improvements (0.01% per generation), while PSO essentially plateaus.
5.6. Comprehensive Sensitivity Analysis and Scenario Verification
5.6.1. Algorithm Parameter Sensitivity Analysis
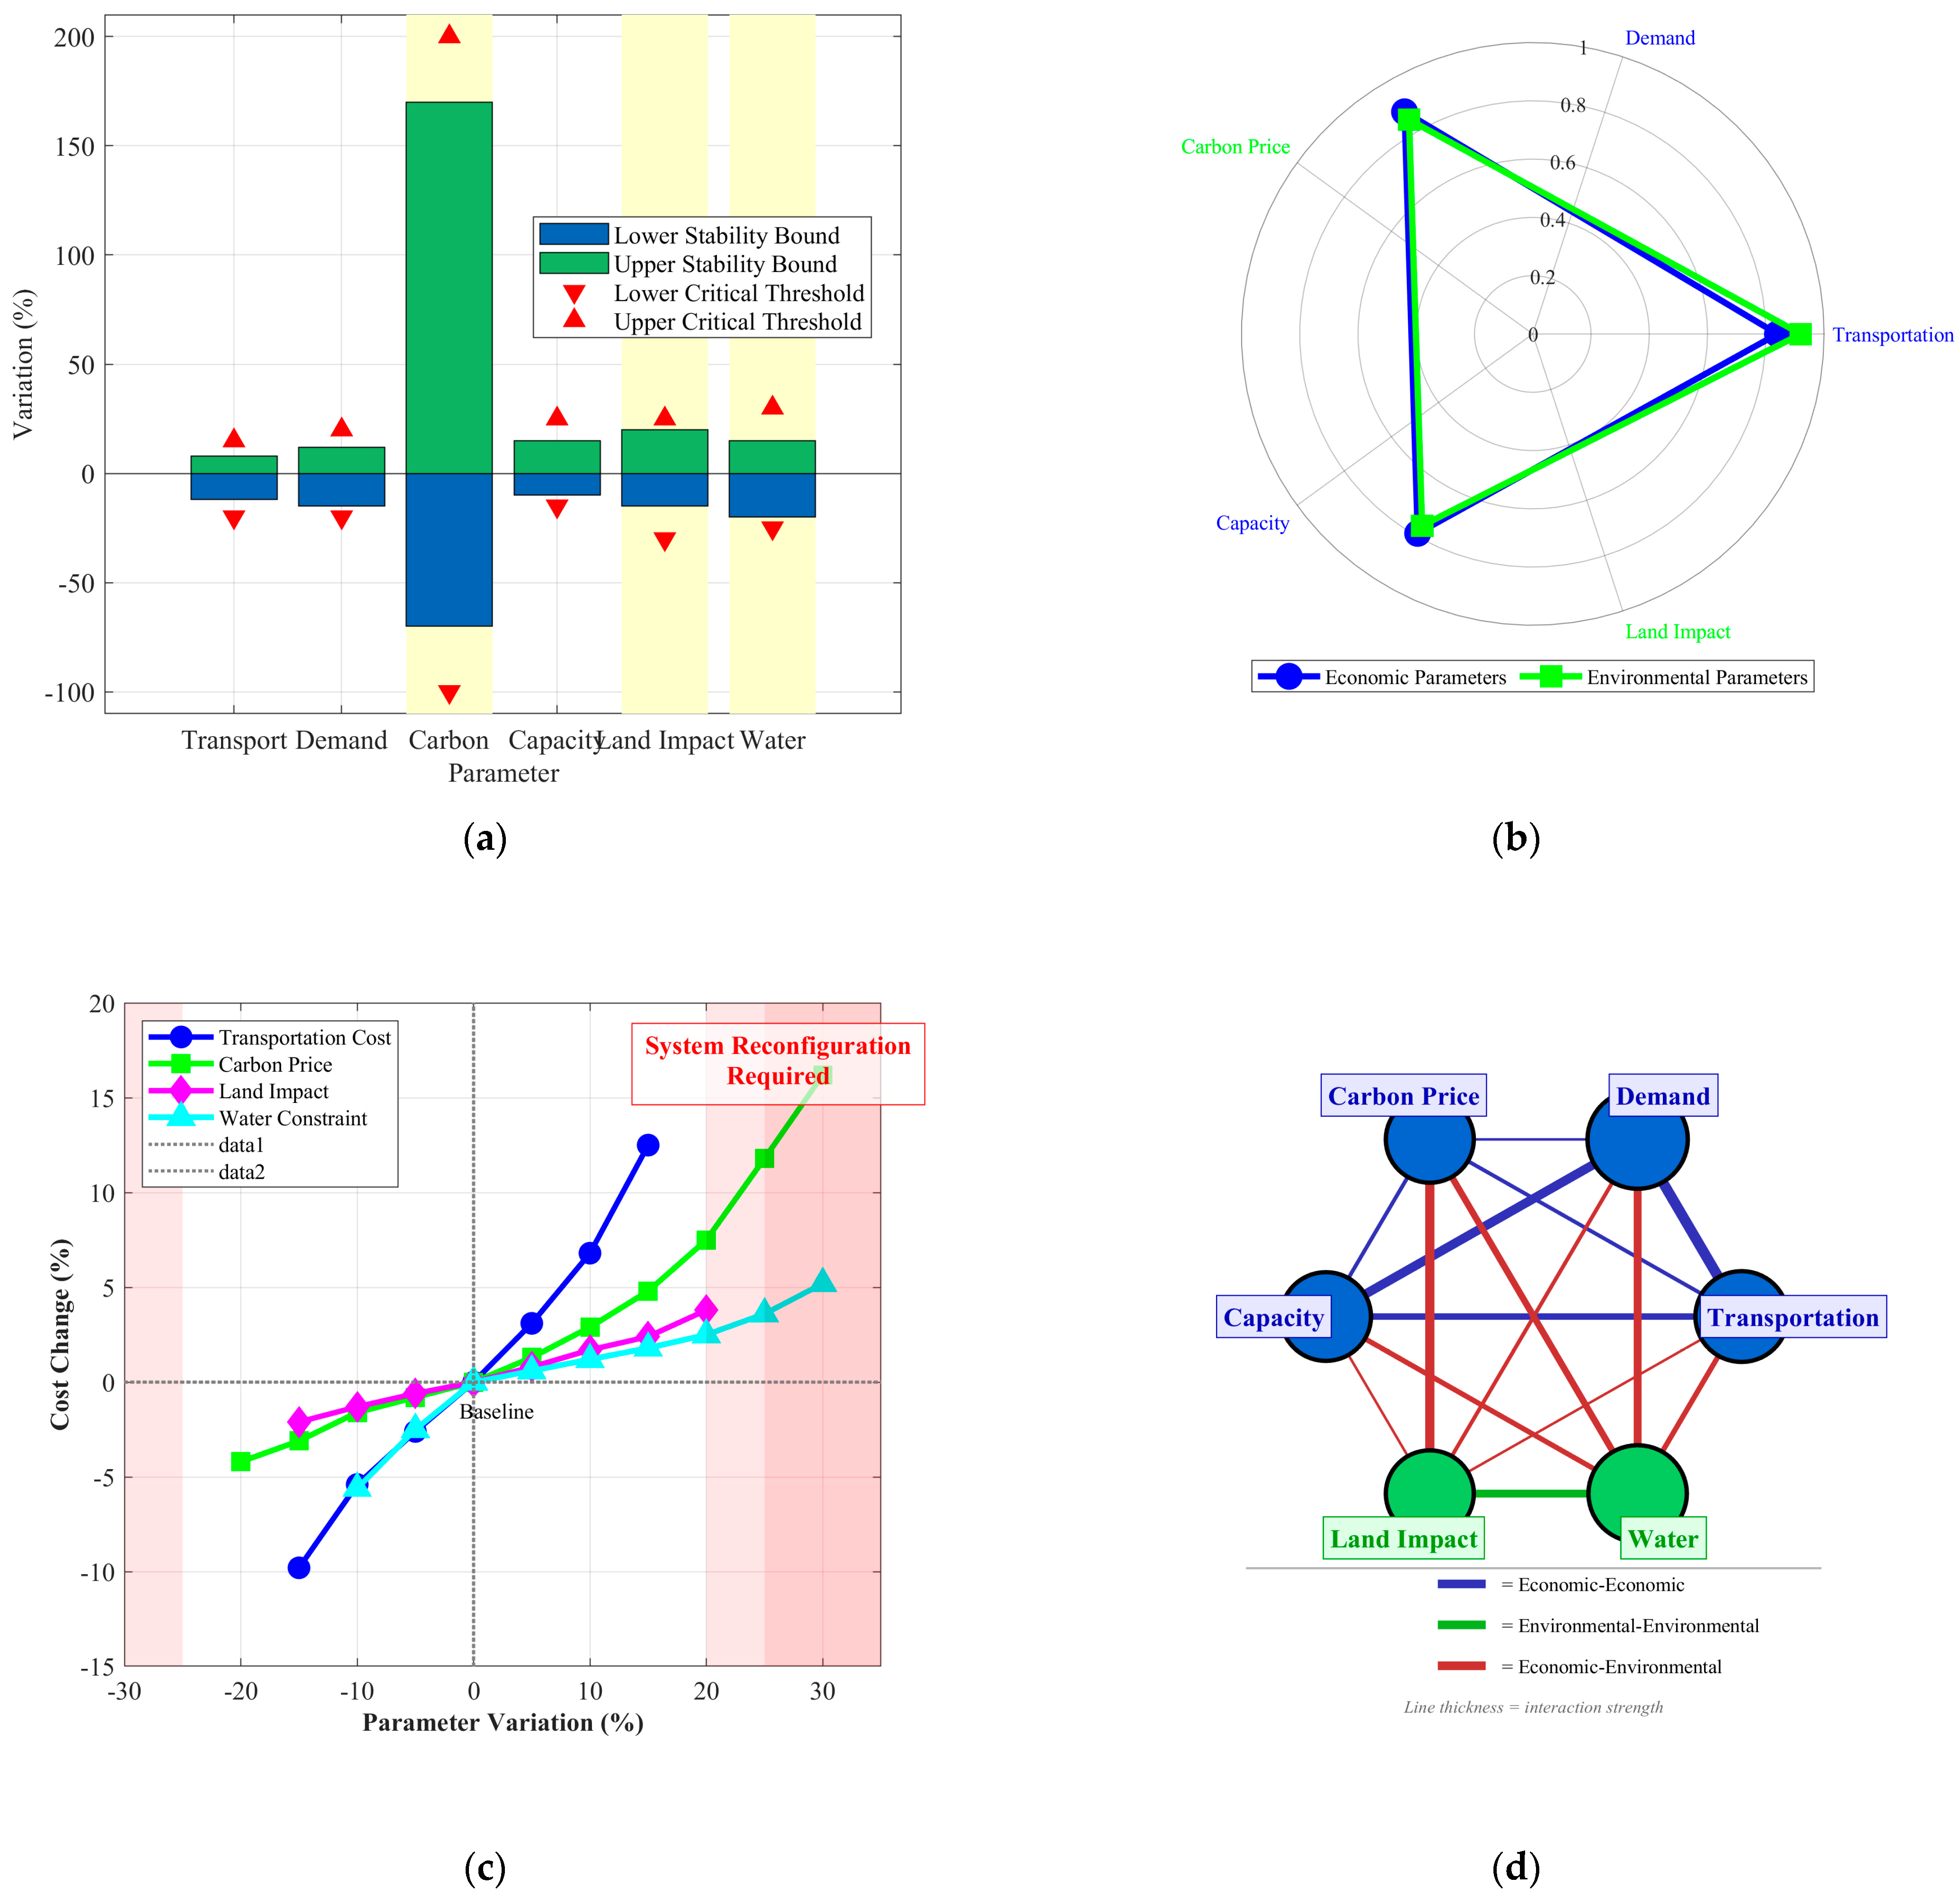
5.6.2. Parameter Sensitivity Analysis
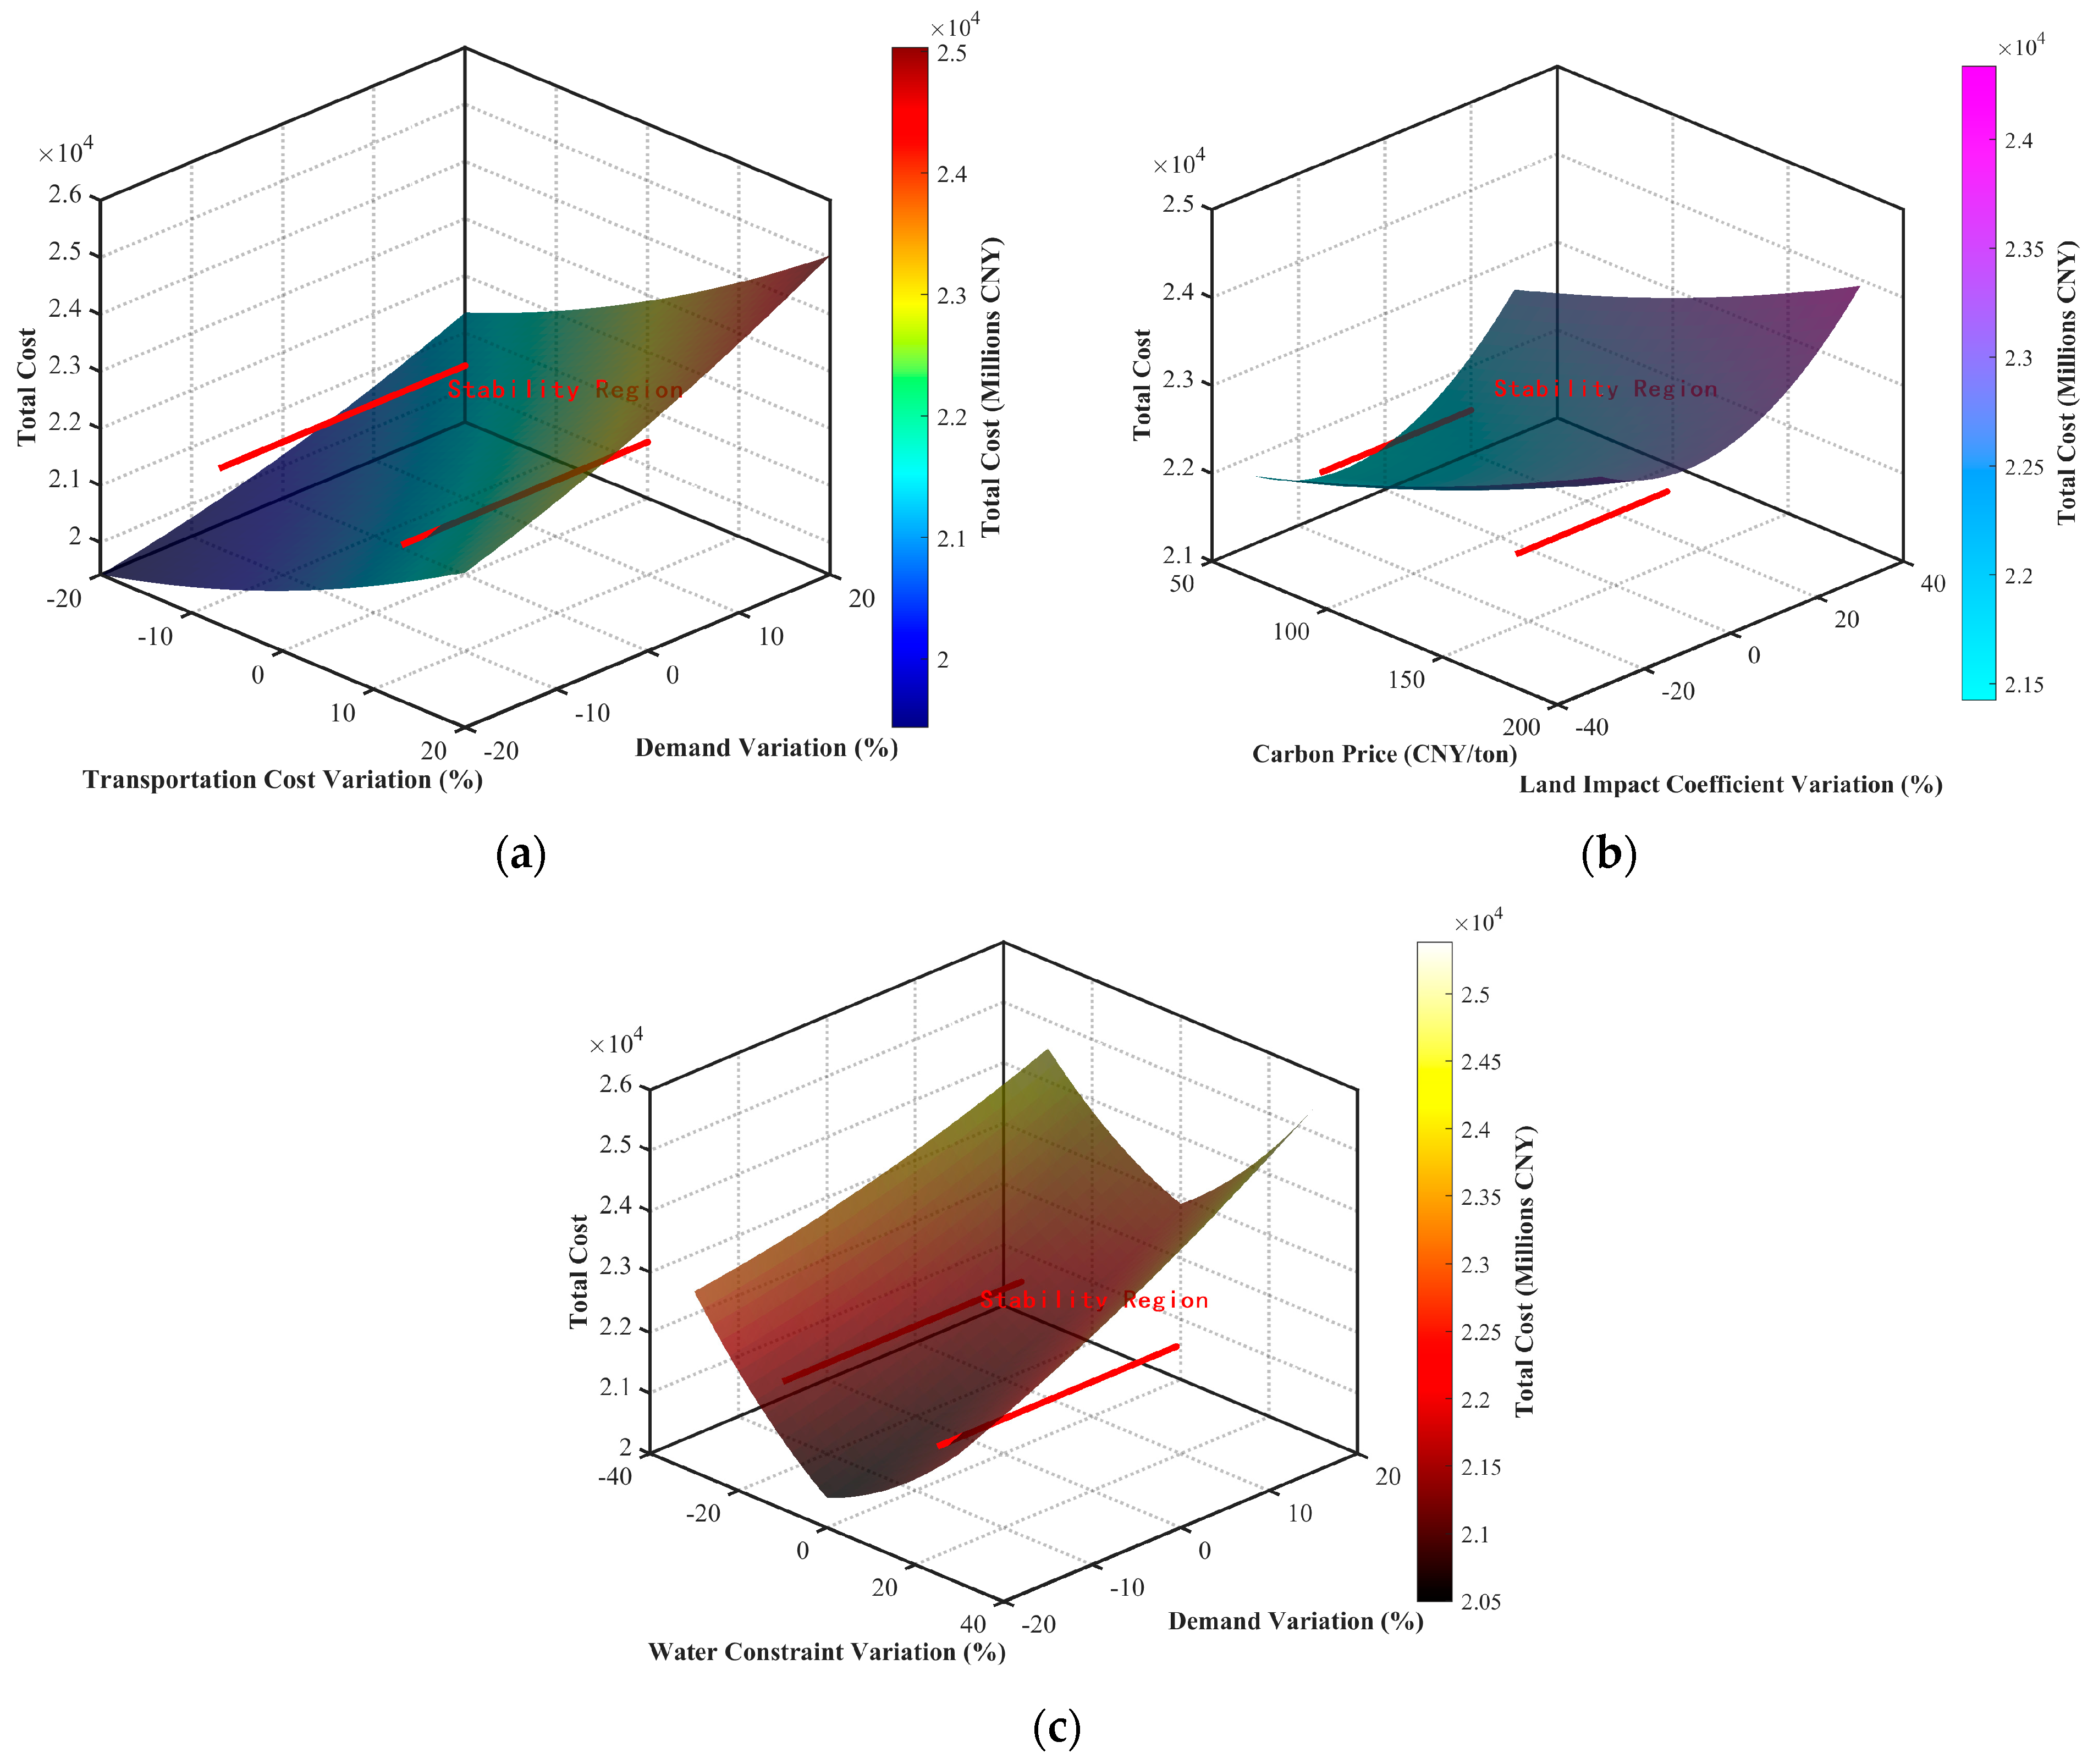
5.6.3. Multi-Parameter Interaction Analysis
5.7. Comparison Between Optimized Solution and Existing Logistics Network
5.7.1. Structural and Efficiency Comparison
- Hohhot City: the primary administrative and regional coordination center;
- Ordos City: the energy and heavy materials logistics hub;
- Zhungeer County: the coal and mineral resources distribution node;
- Helingeer County: the agricultural products and regional transfer center.
5.7.2. Environmental and Economic Integration Benefits
- The strategic placement of distribution centers reduces the economic distance between major economic zones within the urban agglomeration;
- The logistics configuration enables more efficient industrial division and specialization among cities, with Zhungeer County’s center supporting coal industry integration and Helingeer County’s center facilitating agricultural product distribution;
- The coordinated network enhances the efficiency of resource flows between complementary industrial clusters in different cities, supporting the formation of integrated industrial chains.
5.8. Regional Implementation Challenges and Policy Recommendations
5.8.1. Implementation Challenges and Strategic Recommendations
5.8.2. Regional Coordination Framework
- Strategic Infrastructure Development: prioritize investment in rapid logistics corridors connecting key nodes, the development of an integrated data exchange network, and the standardization of specialized logistics systems to support regional economic diversification;
- Employment Transition Management: address the workforce implications affecting approximately 28,500 direct jobs (15% requiring reallocation) through specialized training programs and transition support mechanisms, particularly in Baotou and Ulanqab where facility functions are being reconfigured;
- Collaborative Governance Mechanisms: establish regular “Four Centers Joint Conferences” to ensure synchronized operational strategies and implement cross-regional performance monitoring systems that integrate both economic efficiency and environmental sustainability metrics.
6. Conclusions
6.1. Research Limitations
6.2. Future Research Directions
Author Contributions
Funding
Institutional Review Board Statement
Informed Consent Statement
Data Availability Statement
Acknowledgments
Conflicts of Interest
References
- Hwang, W.-G. Uneven Economic Integration and Regional Growth: A Perspective of Developing Economies; The University of Texas at Austin: Austin, TX, USA, 1996. [Google Scholar]
- Wang, Q.; Sun, X.; Lin, S.; Dong, Y.; Shen, H.; He, Z.; Luo, H.; Zou, L.; Chung, I.K.; Yang, Y. Large-scale seaweed cultivation as a nature solution for carbon-negative economy and restorative environmental stewardship: Lessons from China. Renew. Sustain. Energy Rev. 2025, 207, 114954. [Google Scholar] [CrossRef]
- Chen, W.; Men, Y.; Fuster, N.; Osorio, C.; Juan, A.A. Artificial Intelligence in Logistics Optimization with Sustainable Criteria: A Review. Sustainability 2024, 16, 9145. [Google Scholar] [CrossRef]
- Sun, L.; Shen, J.; Zhai, J.; Lu, F.; Zhang, X.; Liu, A.; Guan, H. Business environment, financing constraints and enterprise innovation investment. Financ. Res. Lett. 2024, 70, 106310. [Google Scholar] [CrossRef]
- Sazanami, Y. Globalization and regionalization: Japanese multinational enterprises in the Asia-Pacific. J. Asian Econ. 1997, 8, 1–13. [Google Scholar] [CrossRef]
- Guo, L.; Tang, M.; Wu, Y.; Bao, S.; Wu, Q. Government-led regional integration and economic growth: Evidence from a quasi-natural experiment of urban agglomeration development planning policies in China. Cities 2025, 156, 105482. [Google Scholar] [CrossRef]
- Krugman, P. Chapter 24 Increasing returns, imperfect competition and the positive theory of international trade. In Handbook of International Economics; Elsevier: Amsterdam, The Netherlands, 1995; Volume 3, pp. 1243–1277. [Google Scholar]
- Linklater, A. The Transformation of Political Community: Ethical Foundations of the Post-Westphalian Era; Univ of South Carolina Press: Columbia, SC, USA, 1998. [Google Scholar]
- Yang, C. From market-led to institution-based economic integration: The case of the Pearl River Delta and Hong Kong. Issues Stud. 2004, 40, 79–118. [Google Scholar]
- Shen, J. Not quite a twin city: Cross-boundary integration in Hong Kong and Shenzhen. Habitat Int. 2014, 42, 138–146. [Google Scholar] [CrossRef]
- Ansell, C.; Gash, A. Collaborative governance in theory and practice. J. Public Adm. Res. Theory 2008, 18, 543–571. [Google Scholar]
- Lend, E. Logistics Systems from the Regional Perspective; Tallinn School of Economics and Business Administration, Tallinn University of Technology: Tallinn, Estonia, 2006. [Google Scholar]
- Tavasszy, L.A.; Ruijgrok, C.J.; Thissen, M.J.P.M. Emerging Global Logistics Networks: Implications for Transport Systems and Policies. Growth Change 2003, 34, 456–472. [Google Scholar] [CrossRef]
- Xu, H.; Zhao, J.; Yu, X.; Mei, X.; Zhang, X.; Yan, C. A Model Assembly Approach of Planning Urban–Rural Transportation Network: A Case Study of Jiangxia District, Wuhan, China. Sustainability 2023, 15, 11876. [Google Scholar] [CrossRef]
- Hulten, C.R.; Bennathan, E.; Srinivasan, S.J.T. Infrastructure, externalities, and economic development: A study of the Indian manufacturing industry. World Bank Econ. Rev. 2006, 20, 291–308. [Google Scholar]
- Lakshmanan, T.R. The broader economic consequences of transport infrastructure investments. J. Transp. Geogr. 2011, 19, 1–12. [Google Scholar] [CrossRef]
- Carruthers, R.; Bajpai, J.N.; Hummels, D. Trade and logistics: An East Asian perspective. In East Asia Integrates: A Trade Policy Agenda for Shared Growth; The World Bank: Washington DC, USA, 2003; pp. 117–137. [Google Scholar]
- Lan, S.L.; Zhong, R.Y. Coordinated development between metropolitan economy and logistics for sustainability. Resour. Conserv. Recycl. 2018, 128, 345–354. [Google Scholar] [CrossRef]
- Hylton, P.J.; Ross, C.L. Agglomeration economies’ influence on logistics clusters’ growth and competitiveness. Reg. Stud. 2018, 52, 350–361. [Google Scholar]
- Ghayebloo, S.; Venkatadri, U.; Diallo, C.; Samuel, C.N.; Pishvaee, M.S. Review of Uncertainty, Carbon Emissions, Greenness Index, and Quality Issues in Green Supply Chains. Sustainability 2024, 16, 9580. [Google Scholar] [CrossRef]
- Li, J.; Zheng, Y.; Liu, B.; Chen, Y.; Zhong, Z.; Dong, C.; Wang, C. The Synergistic Relationship between Low-Carbon Development of Road Freight Transport and Its Economic Efficiency—A Case Study of Wuhan, China. Sustainability 2024, 16, 2636. [Google Scholar] [CrossRef]
- Chen, Z.; Wu, J. Evolution of Logistics Industry Carbon Emissions in Heilongjiang Province, China. Sustainability 2022, 14, 9758. [Google Scholar] [CrossRef]
- Naumov, V.; Zhumatayeva, G.; Taran, I.; Bazarbekova, M.; Kenzhegaliyev, B. Selecting a Rational Scheme of Delivery by Road Transport: A Case Study of Goods Deliveries from China to Russia through Kazakhstan. Sustainability 2022, 14, 4954. [Google Scholar] [CrossRef]
- Li, K.; Lin, B. Impact of energy conservation policies on the green productivity in China’s manufacturing sector: Evidence from a three-stage DEA model. Appl. Energy 2016, 168, 351–363. [Google Scholar] [CrossRef]
- Huang, R.; Li, Y. Undesirable input–output two-phase DEA model in an environmental performance audit. Math. Comput. Model. 2013, 58, 971–979. [Google Scholar] [CrossRef]
- van den Heuvel, F.P.; de Langen, P.W.; van Donselaar, K.H.; Fransoo, J.C. Regional logistics land allocation policies: Stimulating spatial concentration of logistics firms. Transp. Policy 2013, 30, 275–282. [Google Scholar] [CrossRef]
- Zhou, G.; Min, H.; Xu, C.; Cao, Z. Evaluating the comparative efficiency of Chinese third-party logistics providers using data envelopment analysis. Int. J. Phys. Distrib. Logist. Manag. 2008, 38, 262–279. [Google Scholar] [CrossRef]
- Teixeira, A.A.; Moraes, T.E.C.; Teixeira, T.B.; Battistelle, R.A.G.; Araújo, E.G.; de Seabra, Q.A.C. The Role of Green Supply Chain Management Practices on Environmental Performance of Firms: An Exploratory Survey in Brazil. Sustainability 2023, 15, 11843. [Google Scholar] [CrossRef]
- Roy, V.; Mitra, S.K.; Chattopadhyay, M.; Sahay, B.S. Facilitating the extraction of extended insights on logistics performance from the logistics performance index dataset: A two-stage methodological framework and its application. Res. Transp. Bus. Manag. 2018, 28, 23–32. [Google Scholar] [CrossRef]
- Clarke, G.; Wright, J.W. Scheduling of Vehicles from a Central Depot to a Number of Delivery Points. Oper. Res. 1964, 12, 568–581. [Google Scholar] [CrossRef]
- Döyen, A.; Aras, N.; Barbarosoğlu, G. A two-echelon stochastic facility location model for humanitarian relief logistics. Optim. Lett. 2012, 6, 1123–1145. [Google Scholar] [CrossRef]
- Xu, J.; Yao, L.; Zhao, X. A multi-objective chance-constrained network optimal model with random fuzzy coefficients and its application to logistics distribution center location problem. Fuzzy Optim. Decis. Mak. 2011, 10, 255–285. [Google Scholar] [CrossRef]
- Yang, L.; Ji, X.; Gao, Z.; Li, K. Logistics distribution centers location problem and algorithm under fuzzy environment. J. Comput. Appl. Math. 2007, 208, 303–315. [Google Scholar] [CrossRef]
- Ferraro, S.; Cantini, A.; Leoni, L.; De Carlo, F. Assessing the adequacy of transportation overall vehicle effectiveness for sustainable road transportation. Int. J. Eng. Bus. Manag. 2023, 15, 18479790231176783. [Google Scholar] [CrossRef]
- Lu, Z.; Bostel, N. A facility location model for logistics systems including reverse flows: The case of remanufacturing activities. Comput. Oper. Res. 2007, 34, 299–323. [Google Scholar] [CrossRef]
- Ouyang, Y.; Daganzo, C.F. Discretization and Validation of the Continuum Approximation Scheme for Terminal System Design. Transp. Sci. 2006, 40, 89–98. [Google Scholar] [CrossRef]
- Wang, X.; Li, X. Carbon reduction in the location routing problem with heterogeneous fleet, simultaneous pickup-delivery and time windows. Procedia Comput. Sci. 2017, 112, 1131–1140. [Google Scholar] [CrossRef]
- Kanungo, T.; Mount, D.M.; Netanyahu, N.S.; Piatko, C.D.; Silverman, R.; Wu, A.Y. An efficient k-means clustering algorithm: Analysis and implementation. IEEE Trans. Pattern Anal. Mach. Intell. 2002, 24, 881–892. [Google Scholar] [CrossRef]
- Liggett, R.S. Automated facilities layout: Past, present and future. Autom. Constr. 2000, 9, 197–215. [Google Scholar] [CrossRef]
- Wu, L.-Y.; Zhang, X.-S.; Zhang, J.-L. Capacitated facility location problem with general setup cost. Comput. Oper. Res. 2006, 33, 1226–1241. [Google Scholar] [CrossRef]
- Jayaraman, V. A multi-objective logistics model for a capacitated service facility problem. Int. J. Phys. Distrib. Logist. Manag. 1999, 29, 65–81. [Google Scholar] [CrossRef]
- Berman, O.; Drezner, Z.V.I.; Wesolowsky, G.O. Satisfying partial demand in facilities location. IIE Trans. 2002, 34, 971–978. [Google Scholar] [CrossRef]
- Chung-Hsing, Y.; Hepu, D. An algorithm for fuzzy multi-criteria decision making. In Proceedings of the 1997 IEEE International Conference on Intelligent Processing Systems (Cat. No.97TH8335), Beijing, China, 28–31 October 1997; Volume 1562, pp. 1564–1568. [Google Scholar]
- Wang, H.; Fang, S.-C.; Huang, M.; Zhang, Q.; Deng, Z. A joint model of location, inventory and third-party logistics provider in supply chain network design. Comput. Ind. Eng. 2022, 174, 108809. [Google Scholar] [CrossRef]
- Daskin, M.S.; Owen, S.H. Location models in transportation. In Handbook of Transportation Science; Springer: Berlin/Heidelberg, Germany, 1999; pp. 311–360. [Google Scholar]
- Hakimi, S.L. Optimum Locations of Switching Centers and the Absolute Centers and Medians of a Graph. Oper. Res. 1964, 12, 450–459. [Google Scholar] [CrossRef]
- Feliciani, C.; Murakami, H.; Shimura, K.; Nishinari, K. Efficiently informing crowds–Experiments and simulations on route choice and decision making in pedestrian crowds with wheelchair users. Transp. Res. Part C Emerg. Technol. 2020, 114, 484–503. [Google Scholar] [CrossRef]
- Almutairi, A.; Owais, M. Active Traffic Sensor Location Problem for the Uniqueness of Path Flow Identification in Large-Scale Networks. IEEE Access 2024, 12, 180385–180403. [Google Scholar] [CrossRef]
- Centobelli, P.; Cerchione, R.; Oropallo, E.; El-Garaihy, W.H.; Farag, T.; Al Shehri, K.H. Towards a sustainable development assessment framework to bridge supply chain practices and technologies. Sustain. Dev. 2022, 30, 647–663. [Google Scholar] [CrossRef]
- Zhang, P.; Yang, D.; Qin, M.; Jing, W. Spatial heterogeneity analysis and driving forces exploring of built-up land development intensity in Chinese prefecture-level cities and implications for future Urban Land intensive use. Land Use Policy 2020, 99, 104958. [Google Scholar] [CrossRef]
- Li, X.; Zhuang, X. Eco-City Problems: Industry–City–Ecology, Urbanization Development Assessment in Resource-Exhausted Cities. Sustainability 2023, 15, 166. [Google Scholar]
- Ajayi, S.O.; Oyedele, L.O.; Akinade, O.O.; Bilal, M.; Alaka, H.A.; Owolabi, H.A. Optimising material procurement for construction waste minimization: An exploration of success factors. Sustain. Mater. Technol. 2017, 11, 38–46. [Google Scholar] [CrossRef]
- Gholizadeh, H.; Goh, M.; Fazlollahtabar, H.; Mamashli, Z. Modelling uncertainty in sustainable-green integrated reverse logistics network using metaheuristics optimization. Comput. Ind. Eng. 2022, 163, 107828. [Google Scholar] [CrossRef]
- Tornese, F.; Pazour, J.A.; Thorn, B.K.; Roy, D.; Carrano, A.L. Investigating the environmental and economic impact of loading conditions and repositioning strategies for pallet pooling providers. J. Clean. Prod. 2018, 172, 155–168. [Google Scholar] [CrossRef]
- Mohamed Abdul Ghani, N.M.A.; Egilmez, G.; Kucukvar, M.; Bhutta, M.K.S. From green buildings to green supply chains. Manag. Environ. Qual. Int. J. 2017, 28, 532–548. [Google Scholar] [CrossRef]
- Zhang, S.; Wang, J.; Zheng, W. Decomposition Analysis of Energy-Related CO2 Emissions and Decoupling Status in China’s Logistics Industry. Sustainability 2018, 10, 1340. [Google Scholar] [CrossRef]
- Aronsson, H.; Huge Brodin, M. The environmental impact of changing logistics structures. Int. J. Logist. Manag. 2006, 17, 394–415. [Google Scholar] [CrossRef]
- Tadaros, M.; Migdalas, A. Bi- and multi-objective location routing problems: Classification and literature review. Oper. Res. 2022, 22, 4641–4683. [Google Scholar] [CrossRef]
- Salçuk, K.; Şahin, C. A novel multi-objective optimization model for sustainable supply chain network design problem in closed-loop supply chains. Neural Comput. Appl. 2022, 34, 22157–22175. [Google Scholar] [CrossRef]
- Yin, N. Multiobjective Optimization for Vehicle Routing Optimization Problem in Low-Carbon Intelligent Transportation. IEEE Trans. Intell. Transp. Syst. 2023, 24, 13161–13170. [Google Scholar] [CrossRef]
- Ehtesham Rasi, R.; Sohanian, M. A multi-objective optimization model for sustainable supply chain network with using GA. J. Model. Manag. 2021, 16, 714–727. [Google Scholar] [CrossRef]
- Ma, Z.; Zhang, J.; Wang, H.; Gao, S. Optimization of Sustainable Bi-Objective Cold-Chain Logistics Route Considering Carbon Emissions and Customers’ Immediate Demands in China. Sustainability 2023, 15, 5946. [Google Scholar] [CrossRef]
- Guo, J.; Zhao, Q.; Xi, M. Sustainable Urban Logistics Distribution Network Planning with Carbon Tax. Sustainability 2022, 14, 3184. [Google Scholar] [CrossRef]


| Symbol | Description | Range | Type |
|---|---|---|---|
| Indices | |||
| Index of suppliers | Index | ||
| Index of logistics distribution centers | Index | ||
| Index of customers | Index | ||
| Variables | |||
| Transportation volume from supplier i to logistics center j | Variable | ||
| Transportation volume from logistics center j to customer k | Variable | ||
| Binary variable (1 if logistics center j is selected, 0 otherwise) | Variable | ||
| Symbol | Description | Range |
|---|---|---|
| Number of suppliers | ||
| Number of logistics distribution centers | ||
| Number of users | ||
| Total supply capacity of supplier i | ||
| Demand of customer k | ||
| Base capacity of logistics center j | ||
| Maximum number of logistics distribution centers to be established | ||
| Fixed cost of logistics center j | ||
| Distance from supplier i to logistics center j | ||
| Distance from logistics center j to customer k | ||
| Basic freight rate coefficient | ||
| Distance effect parameter | ||
| Volume effect parameter | ||
| Time period | ||
| Seasonal adjustment factor | ||
| Facility utilization efficiency of center j | ||
| Base processing cost coefficient of center j | ||
| Utilization rate of logistics center j | ||
| Maintenance level of logistics center j | ||
| Energy consumption of logistics center j | ||
| Operating cost function parameters | ||
| Carbon emission function parameters | ||
| Unit price of carbon emissions | ||
| Land impact coefficient of location j | ||
| Area of logistics center j | ||
| Ecological sensitivity index of location j | ||
| Water consumption coefficient of center j | ||
| Regional water resource limit | ||
| Regional land impact limit |
| Algorithm | Total Cost | Fixed Cost | Transportation Cost | Operating Cost |
|---|---|---|---|---|
| GA | 21,493,952.929 | 88,379.320 | 21,382,489.721 | 860.418 |
| LP | 23,676,892.432 | 88,379.320 | 23,585,426.547 | 743.307 |
| SA | 22,785,363.510 | 121,905.400 | 22,659,754.372 | 1214.262 |
| PSO | 22,108,433.718 | 88,379.320 | 22,017,264.836 | 526.141 |
| Algorithm | Carbon Emission Cost | Water Cost | Land Use Impact | Selected Distribution Centers |
|---|---|---|---|---|
| GA | 1245.640 | 398.347 | 629.483 | Hohhot, Ordos, Zhungeer, Helingeer |
| LP | 1343.258 | 356.785 | 643.215 | Hohhot, Ordos, Zhungeer, Helingeer |
| SA | 1289.476 | 414.688 | 785.312 | Hohhot, Baotou, Ordos, Zhungeer |
| PSO | 1263.421 | 374.560 | 625.440 | Hohhot, Ordos, Zhungeer, Helingeer |
| Algorithm | Initial Feasible Solution Ratio (%) | Final Feasible Solution Ratio (%) | Average Violation Degree | Worst Violation Degree |
|---|---|---|---|---|
| GA | 62.3 | 100 | 0 | 0 |
| LP | 100 | 100 | 0 | 0 |
| SA | 43.8 | 97.2 | 1.35% | 4.87% |
| PSO | 54.7 | 98.4 | 0.83% | 3.26% |
| Problem Size | GA Computation Time (s) | LP Computation Time (s) | SA Computation Time (s) | PSO Computation Time (s) |
|---|---|---|---|---|
| 4 × 9 × 31 (Original) | 325.6 | 68.2 | 283.7 | 268.4 |
| 6 × 12 × 40 | 562.3 | 1384.5 | 487.2 | 504.7 |
| 8 × 15 × 50 | 873.8 | Memory Overflow | 820.5 | 857.1 |
| 10 × 20 × 60 | 1274.6 | Memory Overflow | 1358.2 | 1412.8 |
| Algorithm | Best Solution | Average Solution | Worst Solution | Standard Deviation | Coefficient of Variation |
|---|---|---|---|---|---|
| GA | 21,493,952.929 | 21,582,737.428 | 21,897,533.764 | 115,842.573 | 0.54% |
| LP | 23,676,892.432 | 23,676,892.432 | 23,676,892.432 | 0 | 0% |
| SA | 22,785,363.510 | 23,157,482.675 | 23,893,461.374 | 325,673.218 | 1.41% |
| PSO | 22,108,433.718 | 22,385,927.165 | 22,944,175.829 | 246,791.354 | 1.10% |
| Environmental Parameter Variation | GA | SA | PSO |
|---|---|---|---|
| Carbon Price +50% | 0.61% | 1.68% | 1.23% |
| Land Impact Coefficient +30% | 0.59% | 1.52% | 1.18% |
| Water Resource Constraint −20% | 0.83% | 1.98% | 1.64% |
| Crossover Rate | Average Total Cost (Million CNY) | Convergence Iterations | Optimal Solution SD (%) | Average Feasibility Rate (%) |
|---|---|---|---|---|
| 0.70 | 21,687,529.433 | 312 | 0.87 | 94.5 |
| 0.75 | 21,612,385.521 | 295 | 0.83 | 95.8 |
| 0.80 | 21,543,941.267 | 279 | 0.71 | 97.3 |
| 0.85 | 21,493,952.929 | 287 | 0.54 | 100.0 |
| 0.90 | 21,525,847.332 | 293 | 0.68 | 98.7 |
| 0.95 | 21,634,758.945 | 318 | 0.92 | 93.2 |
| Parameter | Variation Range | Total Cost Impact (Million CNY) | System Performance Change | Critical Threshold | Network Configuration Change |
|---|---|---|---|---|---|
| Transportation Cost | ±20% | 18,730–24,780 | Average Distance: 168.4 to 138.1 km | +15% | >+15%: Helingeer to Baotou |
| Demand Fluctuation | ±30% | 19,110–24,880 | Service Level: 99.5 to 96.4% | +20% | >+20%: Dalate center added |
| Capacity Constraint | ±25% | 24,760–22,960 | Service Level: 93.8 to 98.8% | −10% | <−10%: Dalate center added |
| Carbon Price | 50–200 CNY/ton | 21,490–24,070 | Carbon Reduction: 0 to 26.5% | 150 CNY/ton | >150 CNY/ton: Helingeer to Tuoketuo |
| Land Impact Coefficient | ±30% | 21,310–22,310 | Land Efficiency: −5.2 to +3.8% | +25% | >+25%: Helingeer to Tumotezuo |
| Water Resource Constraint | ±30% | 23,030–21,280 | Water Consumption: −23.4 to +5.2% | −15% | <−15%: Helingeer to Zhuozi |
| Scenario | Description | Total Cost Impact (%) | Network Configuration Adaptation | Service Level Variation (%) | Environmental Performance (%) |
|---|---|---|---|---|---|
| Economic Fluctuation Scenarios | |||||
| High-growth | Demand +20%, Transportation cost −5% | +5.8 | Addition of Dalate center | +1.2 | −3.1 (carbon) |
| Low-growth | Demand ±5%, Transportation cost +10% | +4.2 | Original Configuration maintained | −0.3 | +0.5 (water) |
| Downturn | Demand −15%, Transportation cost +18% | +13.6 | Helingeer replaced by Baotou | −1.5 | −2.3 (land use) |
| Environmental Policy Scenarios | |||||
| Standard | Carbon price 100 CNY/ton, Standard water constraints | +2.1 | Original configuration maintained | +0.1 | −5.2 (carbon) |
| Stringent | Carbon price 150 CNY/ton, Water constraints −15% | +9.4 | Helingeer replaced by Tuoketuo | −0.2 | −18.3 (carbon) |
| Environment-first | Carbon price 180 CNY/ton, Water constraints −25%, Land impact +20% | +17.2 | Dual adjustments * | −1.8 | −27.4 (composite) |
| Operational Condition Scenarios | |||||
| Capacity optimization | Logistics center capacity +15% | −3.5 | Original configuration maintained | +2.7 | +1.4 (carbon) |
| Extreme climate | Seasonal demand fluctuation +25%, Transportation cost +22% | +24.8 | Comprehensive Reconfiguration ** | −4.3 | +9.2 (water) |
| Technology upgrade | Transportation efficiency +15%, Water consumption −20% | −8.7 | Original configuration maintained | +1.9 | −12.6 (composite) |
| Comparison Dimension | Existing Network | Optimized Solution | Improvement |
|---|---|---|---|
| Number of logistics nodes | 4 major logistics distribution centers | 4 strategic distribution centers | Resource integration and concentration |
| Network average circulation distance | 264.5 km | 151.2 km | Reduced by 42.8% |
| Annual total logistics cost | 100,017,799.741 million CNY | 21,493,951.929 million CNY | Reduced by 78.5% |
| - Transportation cost | 99,889,054.986 million CNY | 21,382,489.721 million CNY | Reduced by 78.6% |
| - Fixed cost | 121,905.400 million CNY | 88,379.320 million CNY | Reduced by 27.5% |
| - Operating cost | 2177.405 million CNY | 860.418 million CNY | Reduced by 60.5% |
| - Carbon emission cost | 4661.950 million CNY | 1245.640 million CNY | Reduced by 73.3% |
| - Land-use impact cost | 1356.785 million CNY | 629.483 million CNY | Reduced by 53.6% |
| - Water consumption cost | 643.215 million CNY | 398.347 million CNY | Reduced by 38.1% |
| Carbon emissions | Approx. 2.87 million tons/year | Approx. 0.78 million tons/year | Reduced by 72.8% |
| Service coverage rate | 93.5% | 98.5% | Increased by 5.3% |
| Logistics cross-overlap area ratio | 18.7% | 5.3% | Reduced by 13.4% |
| Land resource utilization efficiency | 12,850 tons/km2 | 19,741 tons/km2 | Improved by 53.6% |
| Ecological footprint | 0.072 gha/ton | 0.038 gha/ton | Reduced by 47.2% |
| Water resource consumption | 2.45 million m3/year | 1.42 million m3/year | Reduced by 42.0% |
Disclaimer/Publisher’s Note: The statements, opinions and data contained in all publications are solely those of the individual author(s) and contributor(s) and not of MDPI and/or the editor(s). MDPI and/or the editor(s) disclaim responsibility for any injury to people or property resulting from any ideas, methods, instructions or products referred to in the content. |
© 2025 by the authors. Licensee MDPI, Basel, Switzerland. This article is an open access article distributed under the terms and conditions of the Creative Commons Attribution (CC BY) license (https://creativecommons.org/licenses/by/4.0/).
Share and Cite
Wang, K.; Fan, K.; Chen, Y. Optimization of Logistics Distribution Centers Based on Economic Efficiency and Sustainability: Data Support from the Hohhot–Baotou–Ordos–Ulanqab Urban Agglomeration. Sustainability 2025, 17, 3273. https://doi.org/10.3390/su17073273
Wang K, Fan K, Chen Y. Optimization of Logistics Distribution Centers Based on Economic Efficiency and Sustainability: Data Support from the Hohhot–Baotou–Ordos–Ulanqab Urban Agglomeration. Sustainability. 2025; 17(7):3273. https://doi.org/10.3390/su17073273
Chicago/Turabian StyleWang, Kewei, Kekun Fan, and Yuhong Chen. 2025. "Optimization of Logistics Distribution Centers Based on Economic Efficiency and Sustainability: Data Support from the Hohhot–Baotou–Ordos–Ulanqab Urban Agglomeration" Sustainability 17, no. 7: 3273. https://doi.org/10.3390/su17073273
APA StyleWang, K., Fan, K., & Chen, Y. (2025). Optimization of Logistics Distribution Centers Based on Economic Efficiency and Sustainability: Data Support from the Hohhot–Baotou–Ordos–Ulanqab Urban Agglomeration. Sustainability, 17(7), 3273. https://doi.org/10.3390/su17073273