Systematic Review

Global Greenhouse Gas Emissions and Land Use Impacts of Soybean Production: Systematic Review and Analysis

MARETEC, LARSyS, Instituto Superior Técnico, Universidade de Lisboa, Avenida Rovisco Pais 1, 1049-001 Lisbon, Portugal
*
Author to whom correspondence should be addressed.
Sustainability 2025, 17(8), 3396; https://doi.org/10.3390/su17083396
Submission received: 17 February 2025 / Revised: 31 March 2025 / Accepted: 3 April 2025 / Published: 11 April 2025
(This article belongs to the Special Issue Ecology and Environmental Science in Sustainable Agriculture)

Abstract

:
Soybean is a major vegetable protein crop often considered to be a sustainable alternative to animal products. Assessments of soybean sustainability often resort to Life Cycle Assessments (LCAs), which are difficult to compare due to methodological inconsistencies. This study carried out an innovative method for harmonized comparisons of soybean production between farms assessed in different studies. Rather than collecting LCA results, we collected Life Cycle Inventories (LCIs) and then calculated the global warming potential (GWP) and land use impacts of each farm. For this, we carried out a systematic review following the PRISMA methodology to collect LCI data from 19 studies representing 126 farms in six countries. A comparable analysis of the farms showed a higher variability in GWP (0.27–1.53 kg CO2e/kg of soybean) than previous reviews, but within a range similar to the results of original studies. As the same LCA method and data were used for all cases, this range can be explained by differences between production systems and locations, with a minimum contribution from methodological variability. Farms in Iran and the United States exhibited the highest emissions, primarily driven by synthetic fertilizer use, irrigation, and energy use. Using results from original studies, farms in Iran showed a substantially lower GWP. Farms in Brazil showed lower non-biogenic greenhouse gas emissions but the highest soil biotic capacity loss due to land occupation, while Italian farms demonstrated minimal land use impacts. These findings underscore the need for region-specific mitigation strategies, despite being limited by data gaps on residue management, the global representativity of the sample of farms, and a lack of detail in fertilizer and irrigation data. There is a pressing need for more complete reporting of LCA study results.

1. Introduction

The global food system is one of the largest contributors to climate change, with agricultural activities accounting for up to 30% of global greenhouse gas (GHG) emissions [1,2]. These emissions stem from various processes, including deforestation, soil management, fertilizer use, and livestock production, all of which intensify climate change and threaten food security [3,4,5]. A rapidly growing global population, projected to reach 9.7 billion by 2050, only amplifies the need for more efficient and sustainable food systems [6]. This increasing demand for food, coupled with dietary patterns shifting towards resource-intensive animal products, puts additional pressure on the environment [7,8].
Land Use (LU) and Land Use Change (LUC) are key contributors to these pressures, as they transform ecosystems, reducing their capacity to store carbon and support biodiversity. LU and LUC, often associated with agricultural expansion, lead to soil organic carbon (SOC) depletion, a critical indicator of soil health and ecosystem services, and, thus, the loss of soil biotic production capacity. For instance, the conversion of forests and grasslands into croplands often significantly decreases SOC stocks, thereby increasing the environmental footprint of agricultural activities [9]. Furthermore, these changes exacerbate land degradation, intensify the release of greenhouse gases, and disrupt the natural carbon cycle, making LU/LUC a pivotal factor in addressing the environmental impacts of food systems [10].
Agriculture contributes to approximately 50% of global methane (CH₄) and nitrous oxide (N2O) emissions, gases with significantly higher global warming potentials than CO2 [11]. Nitrogen fertilizer use and its subsequent soil emissions are key contributors to N2O emissions, while enteric fermentation and manure management in livestock are the main contributors to CH₄ emissions. Moreover, unsustainable agricultural practices accelerate land degradation, biodiversity loss, and water resource depletion [12]. Given the critical role that agriculture plays in climate change, addressing its environmental impacts is a priority in order to meet the Paris Agreement’s goal of limiting global warming to 1.5 °C [13]. This is particularly important for vegetable protein crops, as they are often mentioned as more sustainable alternatives to animal products whose production is responsible for much lower GHG emissions [14]. Transformations of food systems away from meat and other animal products will surely require increased production of vegetable proteins, for which reason it is critical to measure, understand, and mitigate their production impacts, ensuring that future area expansions are sustainably farmed.
Soybean (Glycine max) is one of the world’s most important vegetable protein crops, widely cultivated for its high protein and oil content. It plays a central role in global food and feed systems, especially as a major component of animal feed and biofuel production [15]. The main soybean producers globally include Brazil, the United States, Argentina, China, and India, with Brazil recently surpassing the U.S. as the top producer [16]. Soybean is grown across a wide range of agro-ecological zones, from temperate to tropical climates, under both rainfed and irrigated conditions. This variability results in significant differences in input requirements, yields, and environmental impacts. Understanding these regional and production system differences is essential for designing sustainable strategies for soybean expansion and intensification [17].
To better understand the environmental impacts of soybean and other agri-food products, Life Cycle Assessment (LCA) has emerged as a key tool. LCA provides a comprehensive approach to evaluating the environmental effects of products and processes by analyzing inputs and outputs across the entire life cycle—from raw material extraction to disposal [18]. In agriculture, LCA is critical for identifying the key drivers of GHG emissions and guiding the development of more sustainable practices [19]. Reviews of LCA studies are essential to understand regional differences in production systems, soil types, and climatic conditions, which are critical in determining the true environmental impacts of crops. However, meta-analyses often rely directly on the results reported in the original sources, which may use varying methodologies and system boundaries, making it difficult to perform accurate comparisons [20].
One of the most influential studies utilizing LCA to assess agricultural impacts is Poore and Nemeček’s [14] meta-analysis, which reviewed data from over 38,000 farms in 119 countries. Their findings underscored the large variability in the environmental impacts of different food products, including soybeans [14]. For each food product, they provided the average impacts for each life cycle stage. Given how sensitive environmental performance is to changes in farming practices, climate, and land use policies, region-specific LCAs are required to accurately reflect the environmental impact of soybean production, rather than relying solely on global averages. Without systematically accounting for such variability, LCA review studies risk oversimplifying the complex relationships between agricultural practices and environmental outcomes [21] and fail to fully capture the potential differences in emissions due to farming practices, climate, and geography.
In this study, our objective is to develop a standardized and comparative Life Cycle Assessment (LCA) framework that accounts for methodological inconsistencies across existing studies. Specifically, we aim to enable rigorous cross-regional comparisons of soybean production by using individual LCA studies solely as sources of inventory data. Rather than relying on the reported impact results—which often vary due to incompatible methodological choices—we systematically extract the original inventory data and recalculate these impacts using a unified Life Cycle Impact Assessment (LCIA) method. To demonstrate this approach, we conduct a case study on soybean production across five countries. By applying a consistent analytical framework, we generate region-specific environmental impact profiles, allowing for a more accurate and harmonized comparison of production systems.

2. Materials and Methods
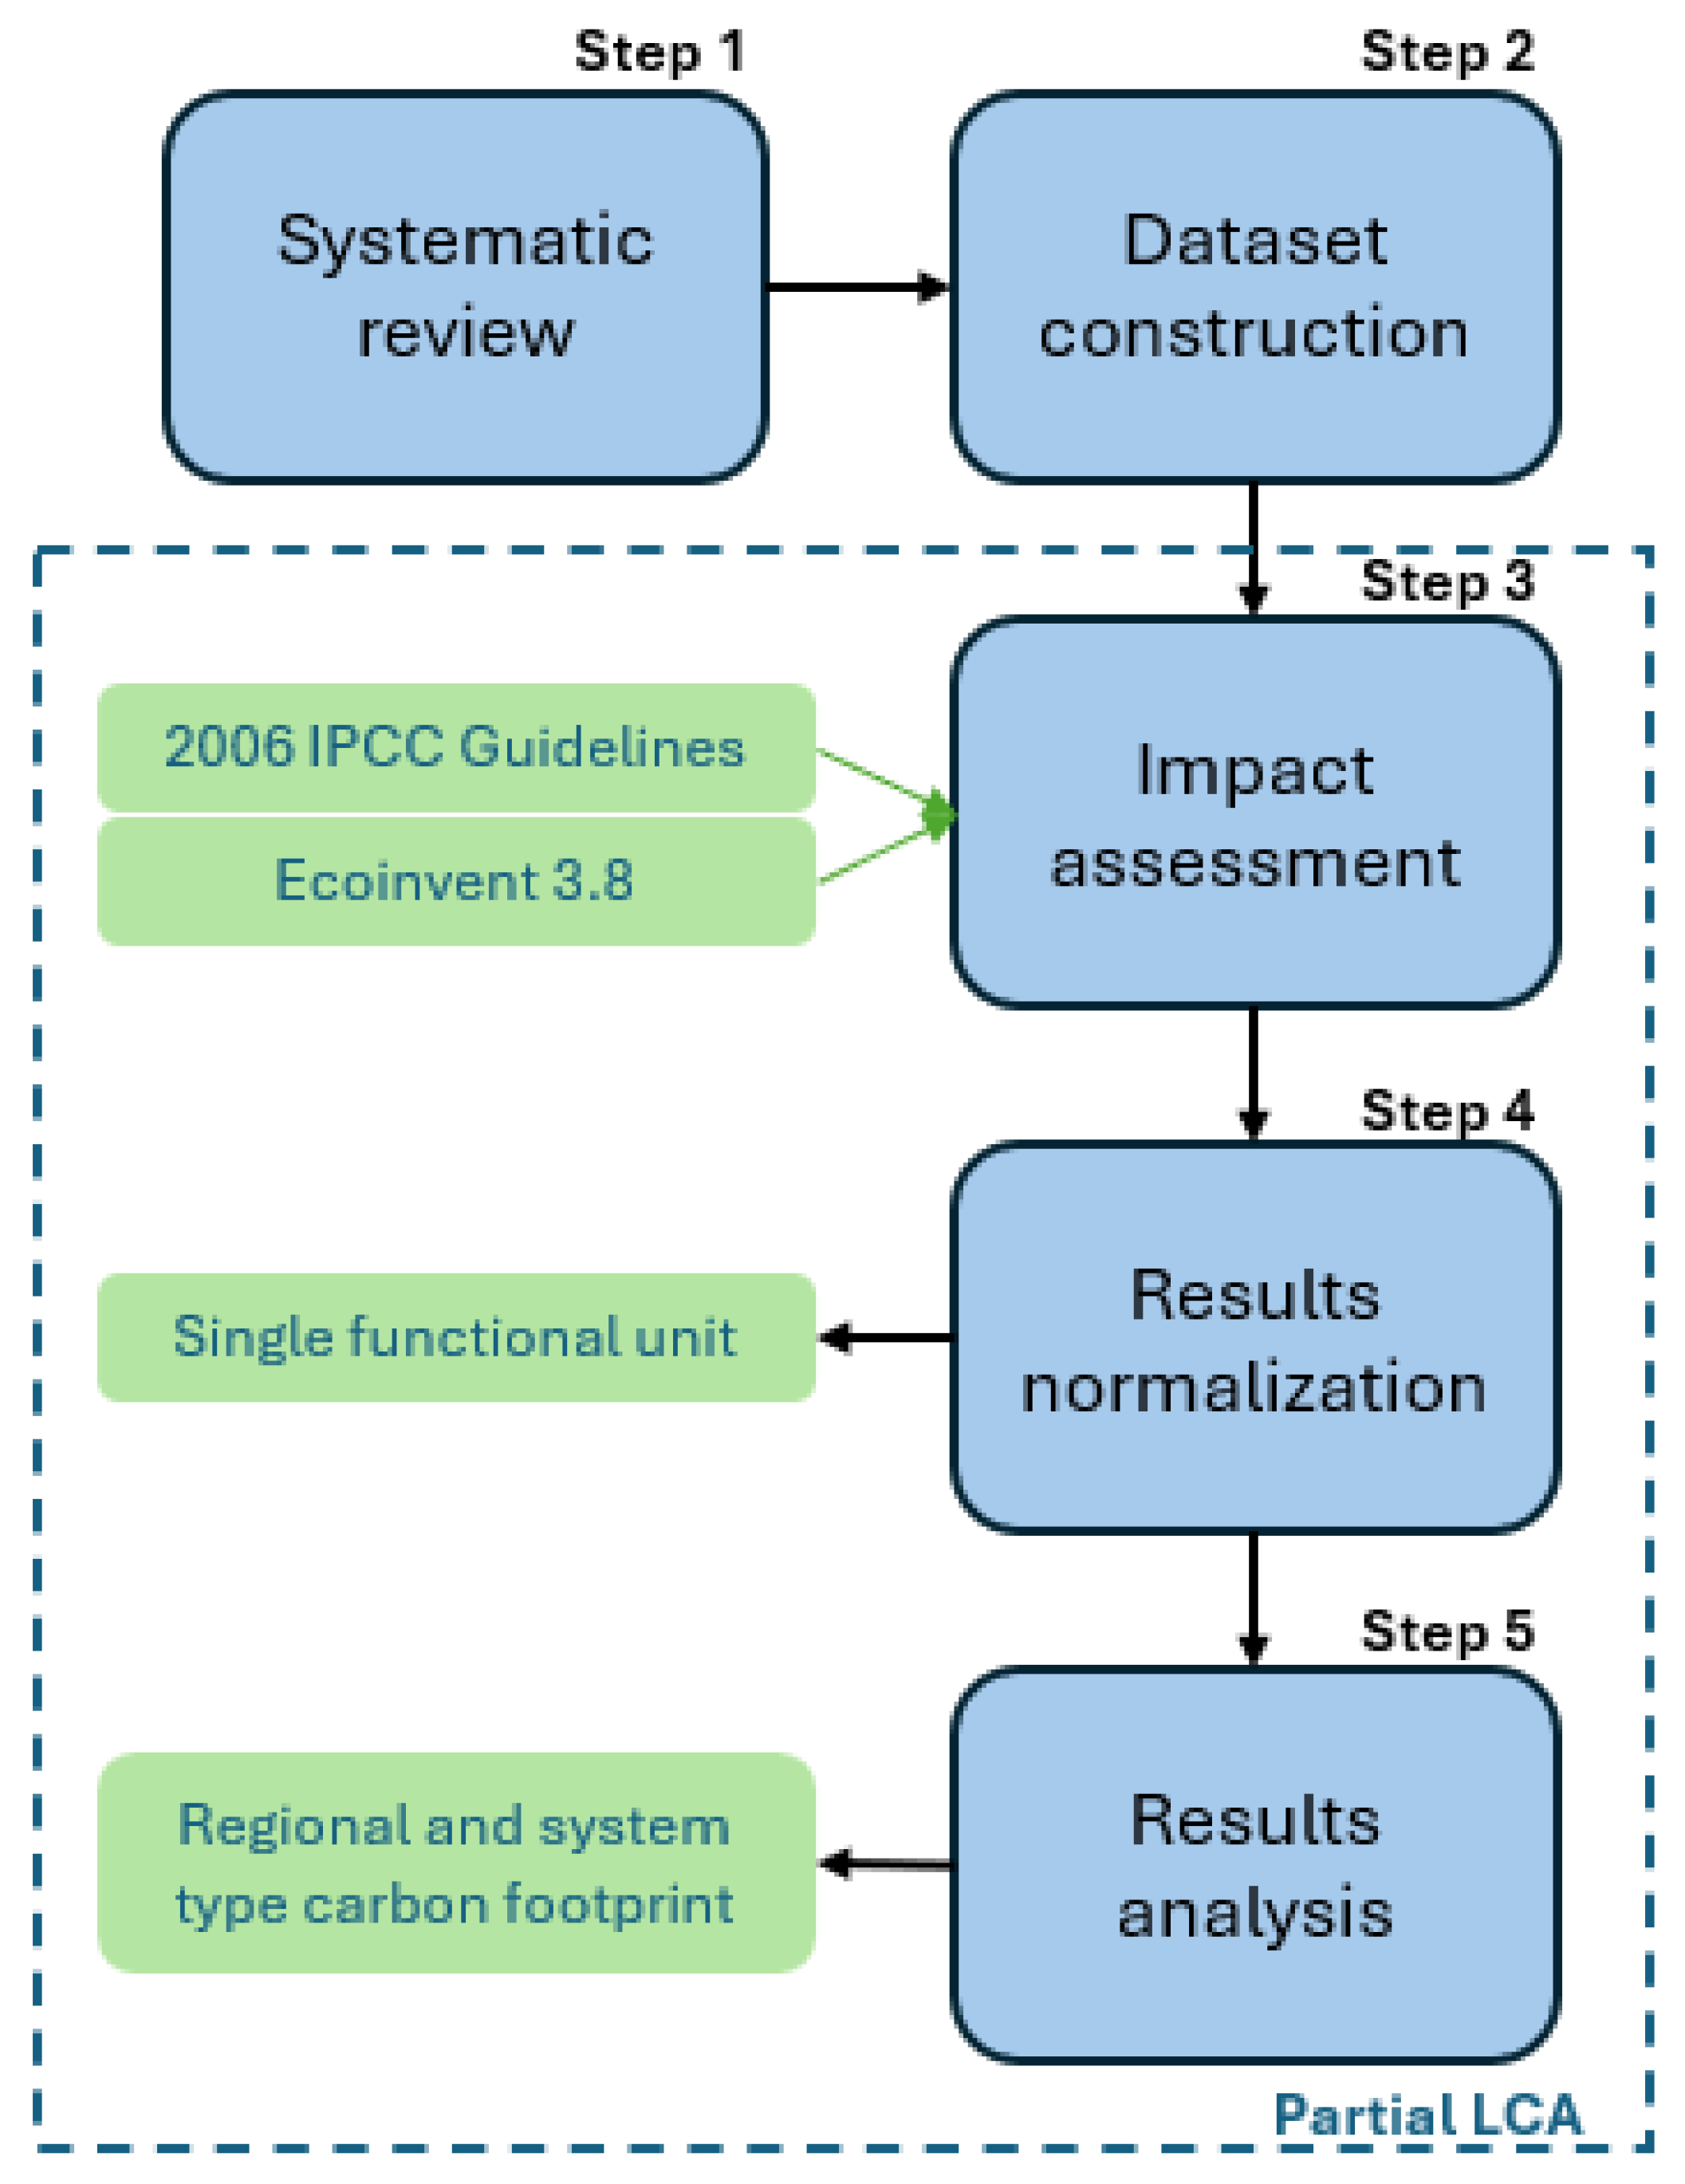
2.1. Study Design

This study followed a structured workflow (Figure 1) with a systematic review of LCA studies on soybean production. A comprehensive database was built using literature-sourced data on emissions, farming practices, and environmental indicators. The following two impact indicators were assessed: non-biogenic GHG emissions (GWP) and LU/LUC impacts (soil biogenic capacity loss). All systems were analyzed under consistent boundaries and a common functional unit. The analysis included descriptive statistics, comparative assessments, and spatial mapping to identify key trends. The findings were then used to generate sustainability recommendations and were compared with previous reviews to highlight new methodological insights.

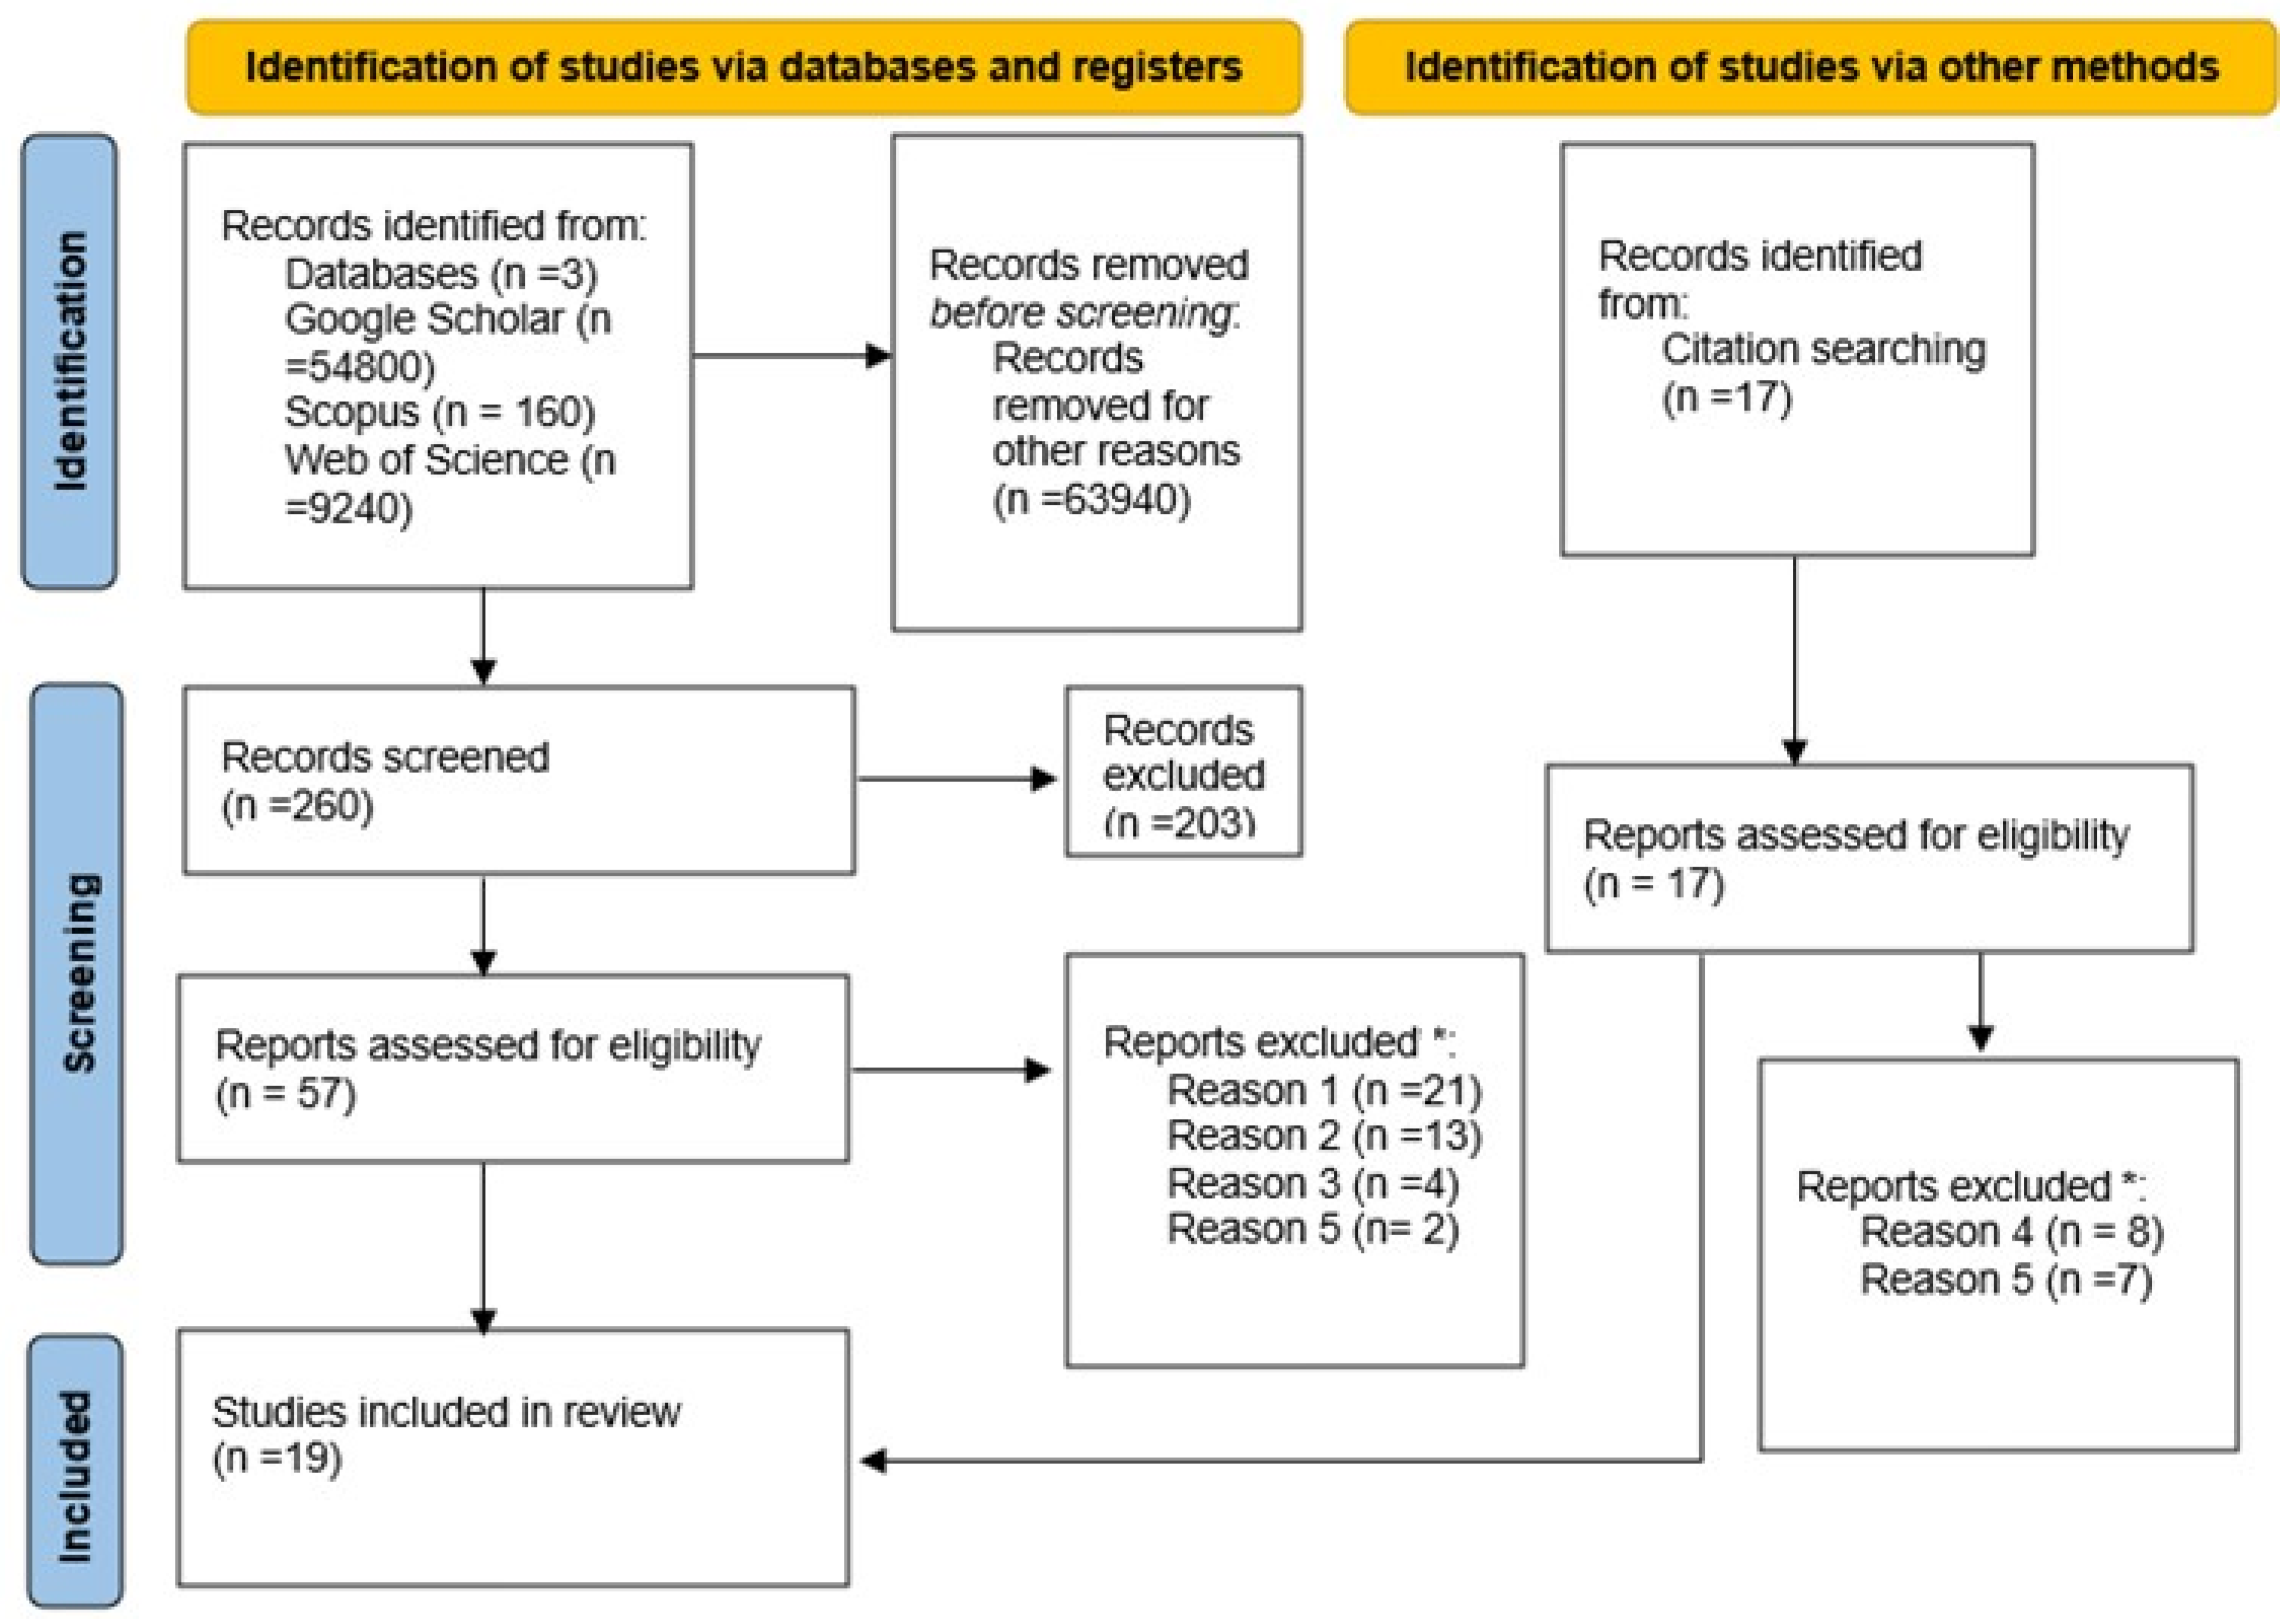
2.2. Systematic Review

The first step of the work was a systematic review following the PRISMA (Preferred Reporting Items for Systematic Reviews and Meta-Analyses) method [22]. This was an intermediary step towards the goal of the paper. The protocol for the review was published with the number osf.io/rjh95 [23]. The PRISMA methodology was applied as follows:
Objectives of the systematic review: We compiled a list of Life Cycle Inventory (LCI) data for soybean production systems across the globe.
Eligibility criteria: The literature search focused exclusively on peer-reviewed LCA studies that assess the environmental impacts of soybean production and report original and complete LCI data. Original LCI data have not been published in another study, and complete LCI data have to include, at minimum, inputs (fertilizers, energy, and irrigation) and outputs (yields) with farm-gate system boundaries.
Information sources: We carried out a systematic search in Web of Science, Scopus, and ScienceDirect using a combination of a set of keywords related to the method, namely “LCA”, “Life Cycle Assessment”, “Environmental footprint”, “Carbon footprint”, and a set of keywords related to the product, namely “Soy”, “Soybean”, “Tofu”, “Soy cultivation”, “Soy farming”, and “Soy production.” Boolean operators were applied to ensure that the papers referred to at least one of the terms in the two groups (with an AND), but any term would suffice within each of the groups (hence, the terms were separated with an OR). To complete the search and further minimize the risk of omitting relevant studies, citation tracking was performed using past reviews, including Poore and Nemeček [14], to identify additional sources. Additionally, reference lists of selected articles were screened, but no new studies met the inclusion criteria. Studies meeting these criteria were downloaded between 5 March and 30 May 2024.
Inclusion criteria. Studies were included based on the following criteria:
(a)
Publication in refereed academic journals, ensuring data quality, transparency, and methodological rigor;
(b)
Publication between 2010 and 2024, reflecting recent production systems;
(c)
Inclusion of LCA data with quantified inventories of farm operations and material/energy use;
(d)
Data specifically for soybean production.
Risk of bias: Although no formal risk of bias tool was applied, study quality was ensured by restricting inclusion to peer-reviewed journal articles, verifying consistency in reported inventory data, and standardizing system boundaries where applicable. Additionally, studies without full inventory data were excluded, and recalculated emissions were compared with original study values.
Exclusion criteria: In cases where studies did not report specific variables, data were either excluded from analysis or supplemented using regional estimates when available to maintain consistency. Differences in system boundaries and allocation methods were adjusted where necessary to ensure comparability across studies. If key data such as energy use or irrigation were missing, these studies were not included in sub-analyses requiring those parameters but were retained for broader comparisons where relevant.

2.3. Inventory Database Construction

The selected articles were systematically reviewed, and the relevant data were extracted into a comprehensive Excel table. The data were organized under the following five main categories:
  • Process Information: Included the country, climate, cultivation area, operations, crop rotation, or secondary crop information.
  • LCA Methods: Covered the standardization methodologies, system boundaries (cradle-to-gate), functional units, allocation methods, and modeling approaches used in each study.
  • LCI Input Data: Included fertilizers (nitrogen, phosphorus, and potassium), herbicides, insecticides, energy consumption (diesel and electricity), agrochemical use, and crop residue management.
  • LCI Output Data: Focused on GHG emissions flows (CO2 and N2O), land, energy outputs, and yields.
  • Results: Included the environmental indicators used in each study, such as GWP, water use (blue, green, and grey water), and depletion of fossil resources.
Each article was treated as a separate data point, and in cases where multiple farming systems or multiple farms/regions were described within the same study, these systems were treated independently as observations. The metrics were normalized to a common functional unit to facilitate cross-study comparisons. The functional unit used was 1 kg of soybeans produced in a given year and at the farm gate.

2.4. Impact Assessment

LCA analysis followed a cradle-to-farm gate system boundary, covering all stages from raw material extraction to the product leaving the farm. To ensure consistency and reliability in assessing environmental impacts, it adhered to the ISO 14040 and ISO 14044 standards [24,25]. Environmental impacts were assessed using the following two main indicators: global warming potential (GWP) and land use impacts (LU and LUC). The method was structured into the following four components: recalculation of farm-level emissions (Section 2.4.1), LCIA modeling (Section 2.4.2), assessment of indirect emissions from field operations (Section 2.4.3), and land use impact estimation (Section 2.4.4).

2.4.1. Farm-Level Emissions

To ensure consistency between studies, we modeled the emissions of N2O and non-biogenic CO2 at the farm level. Emissions were a function of nitrogen inputs and soil management practices. We used the 2006 IPCC Guidelines for National Greenhouse Gas Inventories, ensuring consistency and comparability with established international standards. As per the 2006 IPCC Guidelines [13], biological nitrogen fixation was not included in the sources of N2O emissions due to the lack of evidence that it contributes significantly to soil N2O emissions. Therefore, emissions were modeled solely based on reported nitrogen inputs such as synthetic and organic fertilizers. The selection of the appropriate tier method and the detailed methodology and equations used for estimating direct N2O emissions, indirect N2O emissions, and CO2 emissions from soil management are presented in Supplementary Data File S2 of this study. The approach is briefly outlined next.

N2O Emissions from Managed Soils

N2O emissions from managed soils were assessed following the [24,25] methodology, based on nitrogen additions and transformations. Emissions were categorized as direct, resulting from nitrification and denitrification processes in soils with added nitrogen, and indirect, arising from nitrogen volatilization, deposition, leaching, and runoff. Direct emissions were calculated from synthetic fertilizers (FSN), organic nitrogen inputs (FON) such as manure, compost, and sewage sludge, and nitrogen excreted by grazing animals on pastures (FPRP). Indirect emissions were attributed to atmospheric transport and the water-mediated redistribution of nitrogen compounds (e.g., NH3, NOx, and NO3), which are later converted to N2O by the microbial activity in receiving environments.
To estimate these emissions, we applied the Tier 1 approach using default emission factors (EFs) recommended by the IPCC. Direct emissions were modeled using EF1 (for N additions), EF2 (for managed organic soils), and EF3 (for grazing deposition), while indirect emissions considered volatilization and the leaching pathways associated with nitrogen inputs. All activity data and nitrogen input values were sourced from the original studies included in the review.
A full breakdown of the emission factors used, nitrogen source classifications, and all equations applied can be found in Supplementary Materials File S2, along with a transparent overview of how the farm-level emissions were calculated across systems.

CO2 Emissions from Soil Management

Non-biogenic CO2 emissions from agricultural practices were analyzed for liming and urea fertilization. Liming is widely used to manage soil acidity and enhance crop productivity, but it leads to CO2 emissions through the decomposition of carbonate compounds such as calcic limestone (CaCO3) and dolomite (CaMg(CO3)2). The Tier 1 approach was applied using EFs of 0.12 for calcic limestone and 0.13 for dolomite, as recommended by the IPCC. These emissions occur as bicarbonate ions (HCO3⁻) and decompose into CO2 and water. Urea fertilization also contributes to CO2 emissions, as the bicarbonate formed during its hydrolysis in soils evolves into CO2. The Tier 1 methodology was used with a default EF of 0.20.
Methane (CH4) emissions from manure were not calculated in this study because the IPCC (2006) guidelines [13] do not consider manure as a significant emission source for croplands. Manure, if used as a fertilizer in soybean farming, is typically applied in solid form or incorporated into the soil, where conditions are predominantly aerobic, minimizing CH4 production. N2O is the main GHG stemming from the use of organic nitrogen inputs in cropping systems.

2.4.2. Impact Assessment Model

For LCIA, the IPCC 2013 [26] GWP 100a method was selected because it is the most widely used global warming metric in LCA and stems from the IPCC guidelines. GWP expresses the relative contribution of each GHG emissions flow to global warming over a 100-year time horizon, providing consistency with previous LCA-based environmental assessments. The characterization factor for CO2 was 1 and for N2O it was 265 [13]. These factors, sourced from the IPCC Fifth Assessment Report (AR5), incorporate radiative forcing and the atmospheric lifetime of each gas without feedback and are widely applied in LCA studies.

2.4.3. Indirect Emissions from Field Operations

In addition to direct soil emissions, this study assessed indirect emissions arising from field operations such as fuel combustion, transportation, and other energy-intensive processes. These emissions were modeled using OpenLCA 1.10 with the Ecoinvent 3.8 database, applying emission factors (EFs) consistent with the LCIA method used for farm-level flows. This modeling accounted for the upstream impacts of fertilizer production and transport, as well as those of on-farm diesel use. For manure, Ecoinvent’s aggregated EFs include CH4 emissions from storage and treatment (using a characterization factor of 28), ensuring the comprehensive inclusion of indirect impacts. A complete list of the materials, processes, and EFs used in this stage is available in Supplementary Materials File S2.

2.4.4. Assessment of Land Use Impacts

LU/LUC impacts were incorporated into the analysis to account for soil carbon losses, which are not captured in the GWP indicator. Biogenic carbon remains a debated issue in LCA, as standard GWP metrics struggle to incorporate carbon flows that may be temporary [27]. To ensure that the assessment reflects long-term soil carbon stock changes without distorting GWP calculations, LU/LUC characterization factors calculated from soil carbon changes were applied instead.
To achieve this, we used regionalized characterization factors for land occupation and transformation obtained for most countries worldwide by Teixeira et al. [28]. This impact indicator models LU impact pathways as a loss of the soil’s biological capacity to support production, measured as soil carbon loss relative to potential renaturalization. Unlike fossil carbon emissions, these soil carbon losses represent a potential impact rather than direct GHG emissions, requiring a separate and complementary indicator from the GWP calculations.
We selected the characterization factors for occupation and transformation based on the country where each system in the review was located. The factors used are detailed in the Supplementary Materials File S3. These factors were multiplied by the land use flows of area occupied (m2·a) and transformed (m2), which were calculated based on the inverse of the yield for the functional unit of 1 kg of soybean.

2.5. Data Analysis

To assess soybean farming systems across different countries, we conducted a statistical summary of key metrics to evaluate emission variability and distribution. This analysis included farm-level, indirect, and total GWPs based on input data extracted from original studies. Python 3.8 and its libraries were utilized to perform the analysis and visualization. All technical details, including the specific Python libraries (pandas, seaborn, and others), code snippets, and steps for data preparation and plotting, are comprehensively described in Supplementary Document File S2. The recalculated emissions served as the basis for subsequent comparisons.
A correlation analysis was conducted to explore the relationships between key agricultural inputs and their associated GWPs. The analysis aimed to identify the roles of key inputs such as fertilizer usage, manure application, farm area, yield, and energy use (fuel and electricity) in the results. These specific inputs were chosen due to their critical influences on emissions, as highlighted in prior research [29,30] and supported by this study’s findings. Justifications for the variable selection are included in the supplementary document. To visualize the results, we produced a heatmap using the seaborn library. The heatmap employs a gradient color scheme from blue (negative correlations) to red (positive correlations) to represent the strength and direction of relationships. Annotated correlation values on the heatmap facilitate interpretation. The Pearson correlation coefficient was used, as the data approximately followed a normal distribution.
Then, a country-level analysis was conducted by aggregating and comparing the average greenhouse gas (GHG) emissions (kg CO2e/kg soybeans) reported for the farms within each country included in the study. These averages were plotted using country-level mapping to visualize the spatial variability in emissions. No sub-national (e.g., pixel-based or regional GIS) spatial analysis was performed due to the fact that the scale of the data reported in the original papers was variable, ranging from individual farms to regional averages.
To identify the best practices for sustainable soybean farming, a narrative benchmarking analysis was conducted, focusing on the impacts of agricultural inputs and field operations, excluding land use changes. Farming systems from each country were evaluated for their environmental efficiency, with the lowest-emitting farms per kilogram of soybeans benchmarked against the averages in the same and other countries. Key emission drivers—such as fertilizer use, irrigation, and energy inputs—were analyzed, and yield data were considered to evaluate the trade-offs between productivity and environmental performance. The results are presented separately for GWP and LU/LUC indicators.
Finally, to assess the consistency between the recalculated emissions and original study findings, a comparative analysis was performed. The final results from this study were plotted against the original reported values, with each point representing a system included in the review. An identity line (y = x) was added to show perfect agreement, while a regression line was fitted to observe general trends and detect systematic deviations. This allowed for a visual and statistical evaluation of potential bias or differences between the original and harmonized estimates.

3. Results and Discussion

3.1. PRISMA Systematic Review

The systematic review began with the initial identification of studies from the following three databases: Google Scholar (54,800 studies), Scopus (160 studies), and Web of Science (9240 studies), resulting in a total of 64,200 records. After removing 63,940 based on the criteria mentioned in Chapter 2.2 during the initial screening of titles and abstracts, 260 records remained for further review. Of these, 203 were excluded after screening based on the following five reasons: insufficient data, irrelevance to LCA, inaccessible data, being outside of the time scope, and being duplicates of previous studies. This left 57 studies for eligibility assessment. Additional records were identified through citation searching (17 studies), of which 9 were excluded during the eligibility assessment process for not meeting the inclusion criteria. Ultimately, 19 studies were included in the final review, as presented in Figure 2.

3.2. Inventory Database

The final database of inventories for soy production included 126 rows, detailing process and environmental data for farms across six countries. The majority of entries were from Iran (97 farms), with additional data from Brazil (16 farms), Italy (1), China (5 farms), the USA (3 farms), and Argentina (4 farms). This distribution reflects a significant mismatch with the global soybean production landscape, where countries like Brazil, the USA, and Argentina are among the top producers. As such, the findings of this study should be interpreted with caution when generalizing the results to national or global production systems. Brazil, the USA, and Argentina account for approximately 80% of the world’s soybean production [32]. Over the past two decades, soybean farmland has expanded significantly in Brazil, the USA, and Argentina, while China remains a major importer of soybeans from these regions [33].
Each entry followed a cradle-to-gate system boundary, with ISO 14040 or ISO 14044 standards [24,25]. The functional units were predominantly mass-based (1 kg or 1 ton of soybean), with a single instance of an area-based unit (1 acre, USA). Key climate conditions represented in the data included savannah, continental dry, warm and dry, tropical and moist, Mediterranean, humid, and subtropical. Common secondary crops farmed between soybean seasons varied by region, as follows: maize (China and Brazil) and wheat or canola (Iran). Cultivation periods were consistent across entries, with a one-year duration. The inputs documented in the dataset included fertilizers (N-P-K and organic amendments), energy consumption, and agrochemicals (e.g., urea, dolomite, and limestone), while outputs covered CO2 and N2O emissions. Most studies reported LCIA results for GWP and resource use (water and fossil fuel depletion). A comprehensive list of inputs, outputs, and methodological details can be found in Supplementary Materials File S1.

3.3. Data Analysis Results

3.3.1. Emissions Overview

The average total emissions, considering all individual farms, amounted to 1.27 kg CO2e per kilogram of product. This included 0.39 kg CO2e/kg from farm-level emissions and 0.87 kg CO2e/kg from other indirect sources. This average was calculated across all 126 systems included in the study. However, it should be noted that for some studies—particularly one contributing 94 systems—only the aggregated average was reported by the authors, not the values for each individual farm. In contrast, other studies provided disaggregated data per farm. This methodological difference may have contributed to a slightly higher overall average compared to the country-specific averages presented in the conclusion and later. These results highlight the key contributions of both on-farm activities and upstream processes, such as fertilizer production and fuel use, to the total GHG emissions associated with soybean cultivation. The values reported serve as a basis for identifying emission hotspots and informing targeted mitigation strategies in soybean farming systems.

3.3.2. Correlation Analysis

The correlation analysis between key inputs—fertilizers, diesel, manure, and field operations—and emissions highlights significant relationships across the dataset, as shown in Figure 3.
Manure usage demonstrates a nearly perfect positive correlation with farm-level emissions (r = 0.98, p ≤ 0.01), as well as a very strong correlation with total emissions (r = 0.95, p ≤ 0.01). These relationships underscore the role of manure as a primary contributor to GHG emissions. These emissions can be attributed to N2O release during manure decomposition and the energy-intensive operations required for its storage and handling [29]. Additionally, manure shows a strong positive correlation with emissions from field operations (r = 0.88, p ≤ 0.01), suggesting that its application and incorporation into the soil, which involve mechanized activities, further amplify its impact [34]. Diesel oil usage, however, does not show statistically significant correlations with emissions or other inputs. This aligns with findings that diesel oil, as a direct fuel input, contributes only marginally to overall GHG emissions. Its role is primarily confined to powering machinery and equipment, which constitutes a small proportion of the total agricultural emissions [35].
Water usage exhibits a moderate positive correlation with emissions from field operations (r = 0.45, p ≤ 0.05). This relationship can be explained by the contribution of moisture to N2O emissions and by the energy-intensive nature of irrigation systems, particularly those reliant on electrically or fuel-powered pumps.

3.3.3. Differences Between Farms in Each Country

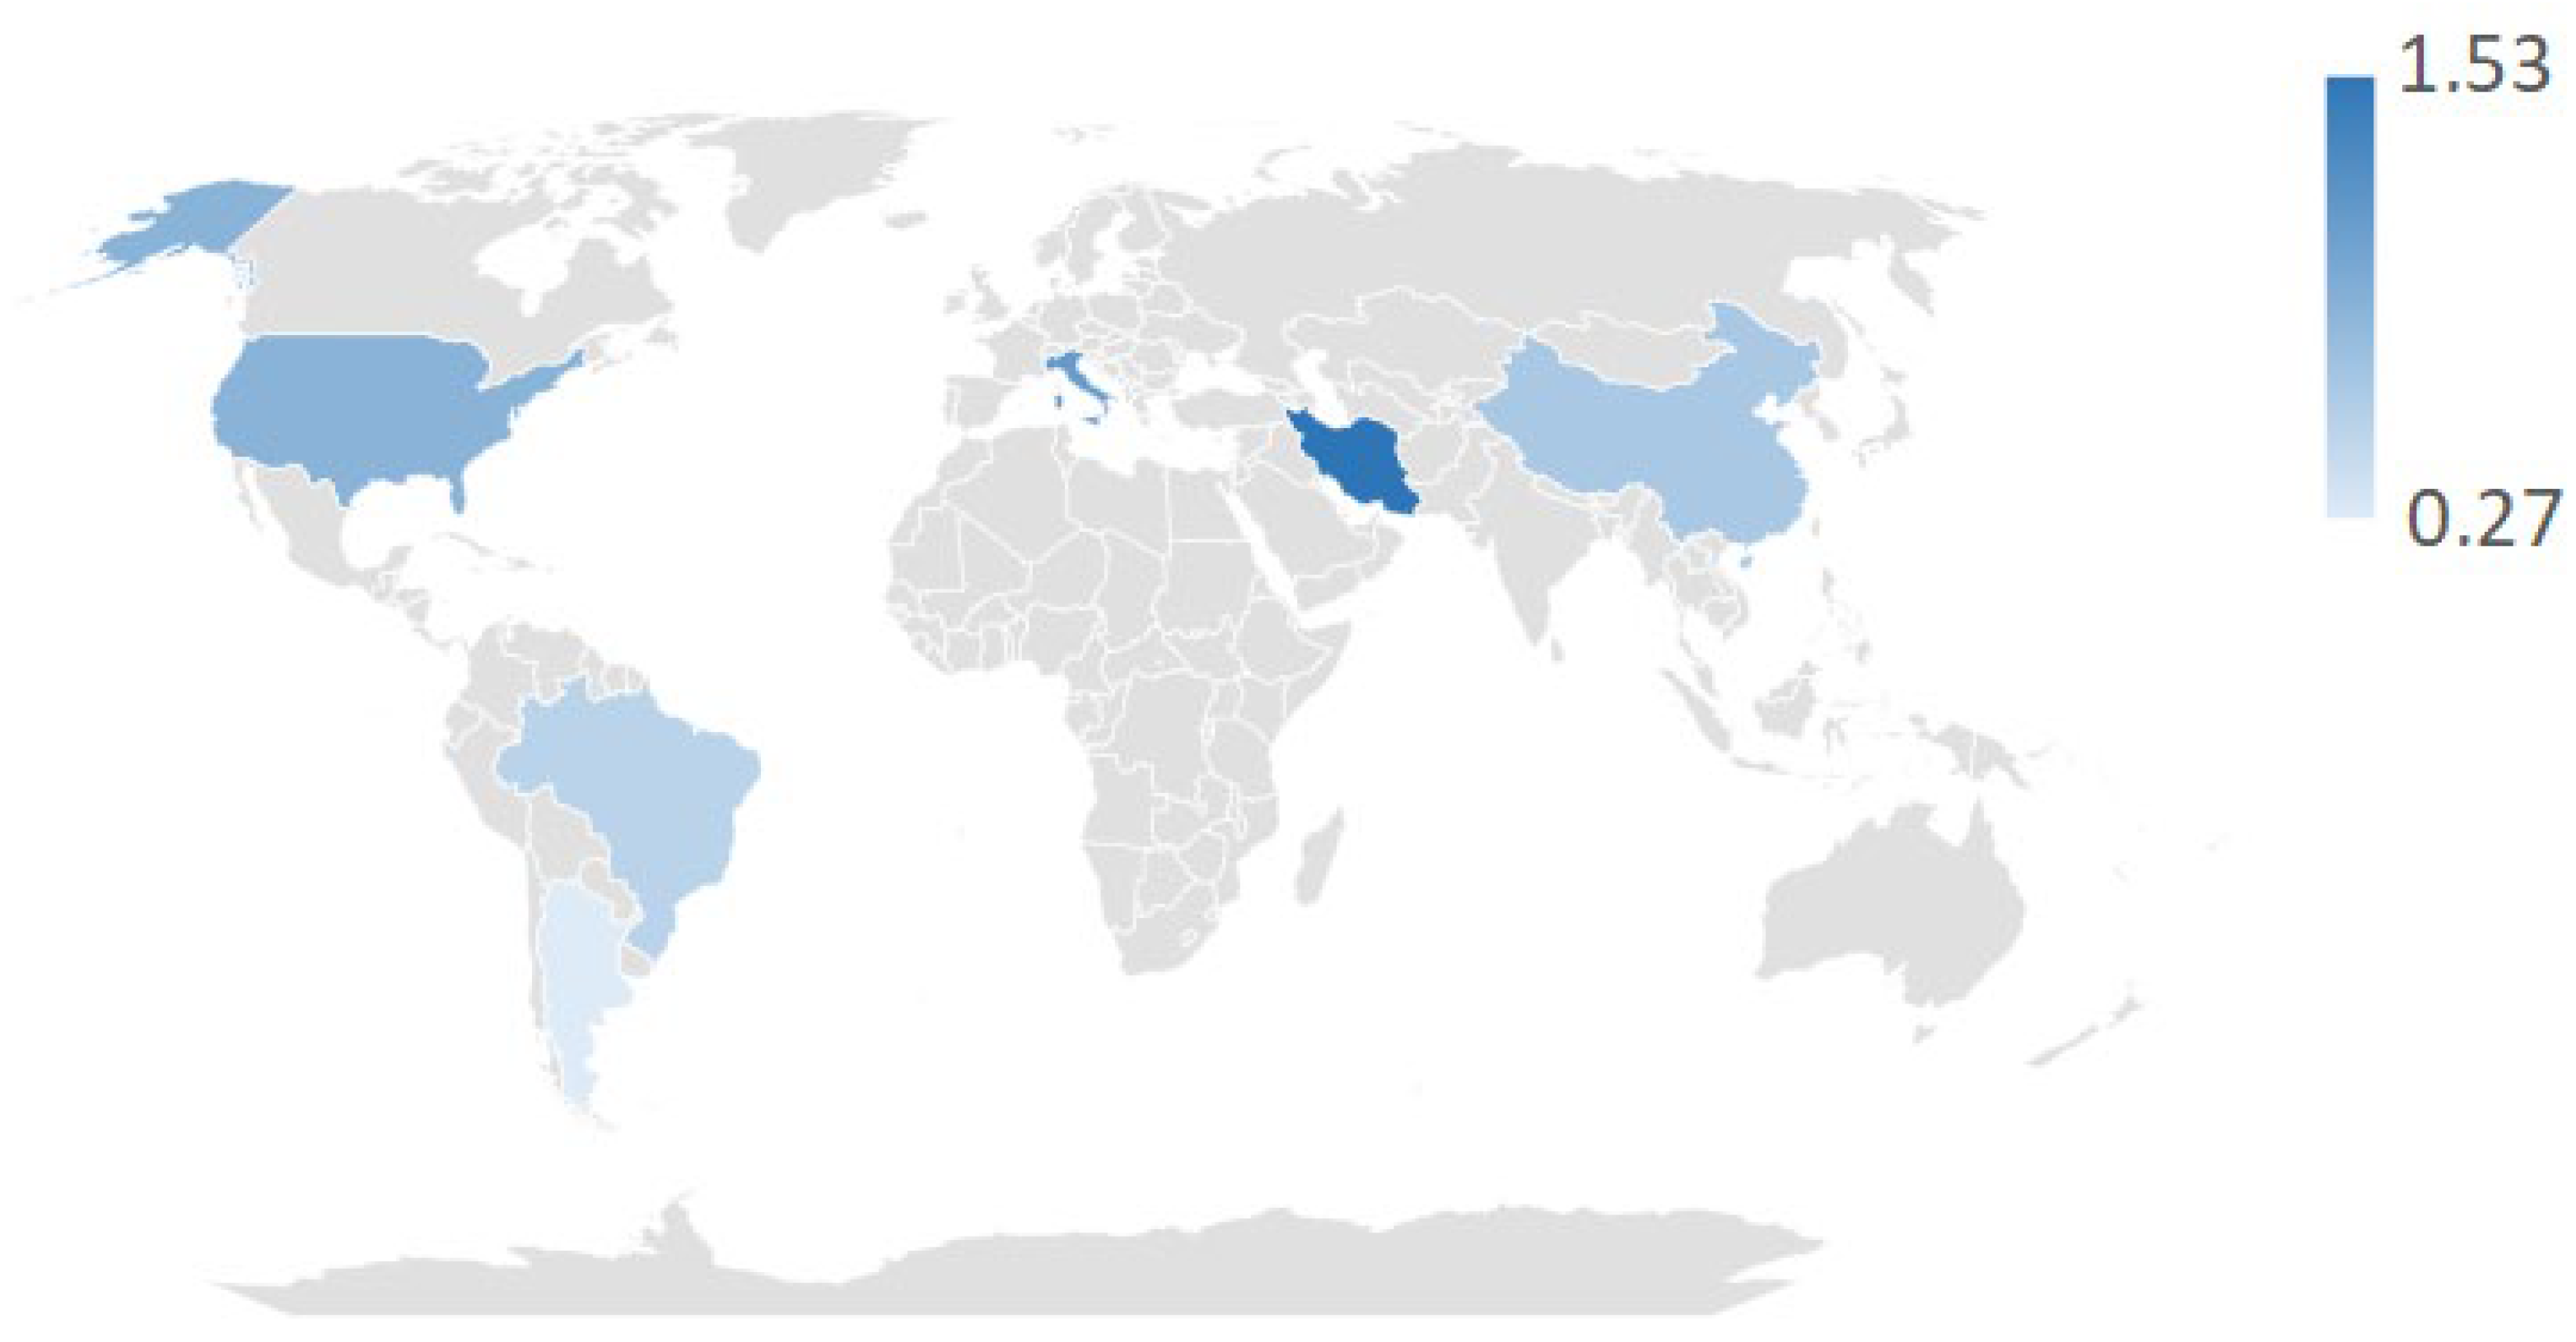
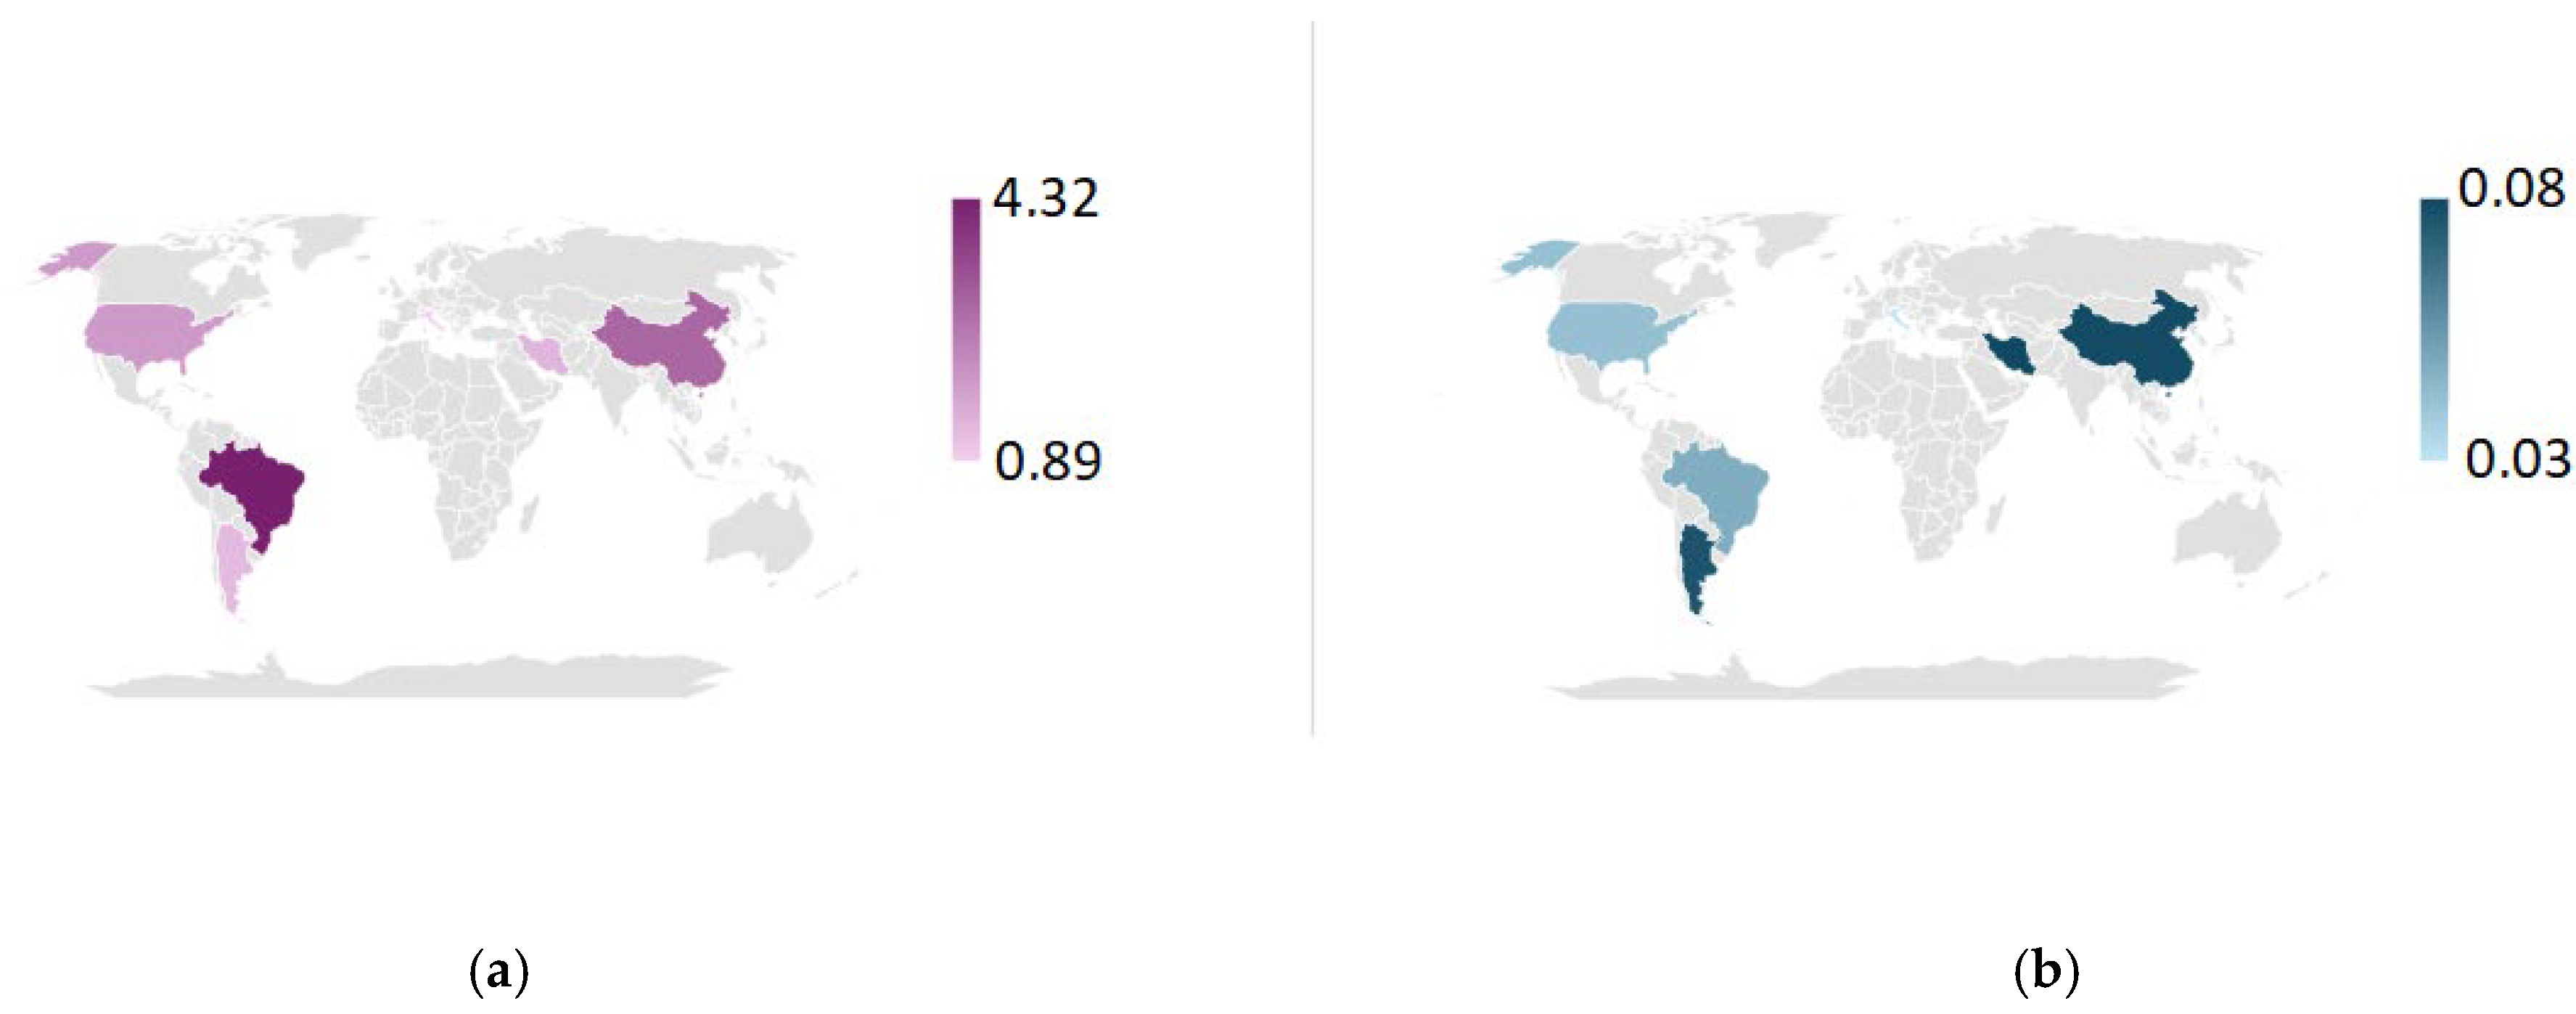
Emissions Distribution by Country

Figure 4 illustrates the average country-level GWP from soybean farming in the sample, with averages ranging from 0.27 to 0.94 kg CO2e/kg. The map highlights notable differences in the average GWP across key soy-producing countries. The average GWP for farms in Argentina was 0.27 kg CO2e/kg, for Brazil was 0.53 kg CO2e/kg, for China was 0.64 kg CO2e/kg, for the United States was 0.87 kg CO2e/kg, for Italy was 1.13 kg CO2e/kg, and for Iran was 1.53 kg CO2e/kg. These differences in emissions can be attributed to several key factors, including local climatic conditions, the intensity of input use, the scale of farming operations, technological efficiency, and the adoption of sustainable agricultural practices, as analyzed next in detail.

Countries with High-GWP Farms: Iran, Italy, and the United States

The higher emissions observed for farms in these countries are primarily driven by intensive input use, particularly the extensive application of synthetic nitrogen fertilizers, which significantly increases the carbon footprint of soybean farming [36]. Farms in Italy and the United States rely on large-scale agricultural systems that depend on high fertilizer inputs, with nitrogen-based fertilizers being a dominant source of greenhouse gas emissions, particularly through N2O release [37]. While mechanization plays a role in energy consumption, its contribution to overall emissions is minor compared to fertilizer use, which is the primary driver of agricultural GHG emissions in these systems [38].
Although soybeans, as legumes frequently inoculated with nitrogen-fixing microorganisms, reduce the need for synthetic nitrogen fertilizers, emissions from irrigation and associated machinery can still be significant contributors to carbon footprint in the Italian context [39].
In the United States, the large-scale operations for farms in the sample also rely on mechanization and high input use, which contribute to elevated emissions [40]. Most farms in Iran present a unique case, where high emissions are primarily driven by the extensive use of energy-intensive irrigation systems in arid climates, which contribute both to energy consumption [41,42] and N2O emissions (from irrigation-induced soil processes).

Countries with Low-GWP Farms: Argentina and Brazil

In contrast, farms in Argentina and Brazil exhibit the lowest emissions, with averages of 0.27 and 0.53 kg CO2e/kg, respectively. Several sustainable agricultural practices and favorable environmental conditions may contribute to these lower emissions. The farms in Argentina present in our sample have relatively low emissions due to the widespread adoption of no-till farming, which minimizes fuel emissions from mechanization by reducing the frequency of field operations, such as plowing and tilling, which are otherwise energy-intensive processes [43]. Additionally, the studies analyzed in this research indicate that these Argentinian farms minimize the use of fertilizers, relying primarily on P2O5 (phosphate fertilizers) while avoiding nitrogen and potassium fertilizers. It is unclear what role the use of biological nitrogen fixation plays due to a lack of data in the original papers. This selective approach reduces the overall carbon footprint of soybean production, as nitrogen fertilizers are a major source of N2O emissions in intensive production systems such as those in U.S. farms, where the application of nitrogen fertilizers significantly contributes to greenhouse gas footprint [44]. The Brazilian farms in the sample also display several sustainable farming practices, including precision agriculture and integrated crop–livestock–forestry systems, which enhance productivity while reducing environmental impacts [45]. Those farms also optimize their consumption of inputs such as fertilizers through precision agriculture, conservation tillage, and integrated agricultural systems [46]. Additionally, the country’s reliance on renewable energy sources, including biofuels from sugarcane and soybean residues and solar energy in rural areas, helps to minimize the carbon intensity of production [47].

Climate, Technical, and Policy Conditions

Two key explanatory factors for the performance of farms across countries are geography and climate, which play crucial roles in shaping emissions profiles. Regions with favorable climates, such as Argentina and Brazil, naturally achieve higher yields, with fewer inputs like water and synthetic fertilizers due to advantageous environmental conditions [41]. These environmental benefits, combined with soil conservation practices, contribute to the reduced GWP of soybean production in these countries [42]. Conversely, farms in countries like Iran must battle against an arid climate using extensive irrigation, which increases energy consumption and GHG emissions [48].
This regional variability in soybean production emissions highlights the importance of tailoring mitigation strategies to local conditions. For instance, regions with favorable climates inherently possess environmental advantages that lower input requirements, while others must rely on technological innovations and policy-driven incentives to achieve sustainable production. The policy environment also plays a significant role, as seen in Brazil, where environmental regulations and incentives for sustainable farming have driven progress in reducing agricultural emissions [49]. Best practices should, therefore, be identified by benchmarking with the lowest-GWP farms within each region rather than globally.

3.3.4. Identifying Best Practices

Soybean farms in Argentina have some of the most environmentally efficient practices in the sample for both no-tillage and tillage farming systems [50]. For no-tillage farming, diesel usage is 35 L per hectare, fertilizer application is 38 kg of P2O5 per hectare, and yield is 2630 kg/ha, with no irrigation reported. In contrast, tillage farming uses 62 L of diesel per hectare, 5.2 kg of fertilizer per hectare, and achieves a lower yield of 2248 kg/ha, also with no irrigation. These minimal input levels, especially in the no-tillage system, contribute to Argentinian farms having a lower overall GWP compared to input-intensive systems. Although irrigation energy contributes to total inputs in some cases, no data on irrigation are reported for farms in Argentina. Thus, while soybean farming in Argentina achieves a moderate productivity, its selective approach to inputs and reliance on natural rainfall [51] help to reduce emissions, particularly in the no-tillage system.
In Brazilian farms, soybean production studies report a yield of 3422 kg/ha, with inputs of 7.46 kg of N, 74.6 kg of P2O5, 186.5 kg of K2O, 98 L of diesel per hectare, and 18.2 m3 of irrigation water per hectare [52]. Other studies document a yield of 3157 kg/ha, using 6 kg of N, 81 kg of P2O5, 87 kg of K2O, and 33 L of diesel per hectare, with no irrigation [53]. Another assessment records a yield of 2969.65 kg/ha, with inputs of 11.16 kg of fertilizer, 75.73 L of diesel per hectare, and no irrigation, relying on the rainy season [54]. Among these, the study with no irrigation and moderate fertilizer use was environmentally optimal, achieving a balance between productivity and low resource use [53].
For farms in Iran, data collected for the Mazandaran province show a yield of 2295.91 kg/ha, with inputs of 47.67 kg of N, 27.03 kg of P2O5, and 18.71 kg of K2O per hectare, alongside 136.73 L of diesel per hectare and irrigation of 1739.42 m3 per hectare [20]. In Golestan province, yields are higher, reaching 3846 kg/ha, with 115 kg of P2O5 per hectare, no nitrogen or potassium fertilizers, 109 L of diesel per hectare, and significantly higher irrigation of 4838 m3 per hectare [29]. These differences reflect the high irrigation needs characteristic of Iran, where low rainfall and high evapotranspiration rates necessitate irrigation to sustain crop yields. Traditional irrigation methods, such as flood irrigation, further contribute to high water use compared to more efficient systems like drip irrigation [20]. Additionally, groundwater extraction plays a crucial role in meeting agricultural demands, particularly in Golestan, where reliance on groundwater is essential for maintaining a higher productivity [29].
In China, soybean farming practices vary significantly across studies, highlighting differences in inputs and productivity. Conventional systems in the Jilin Province use 47 kg of N, 14 kg of P2O5, and 28 L of diesel per hectare, achieving a yield of 3083 kg/ha [55]. Another study in China reports irrigation of 966 m3 per hectare, which aligns with the provincial average, and input levels of 20 kg of N, 100 kg of P2O5, 200 kg of K2O, and 124 L of diesel per hectare, producing a yield of 2030 kg/ha [56].
This analysis shows that best practices can only be defined in relation to the location of production. In Argentina, no-tillage farms stand out, with a lower consumption of inputs and less irrigation, probably due to the reliance on natural rainfall. The Brazilian farms with the best performance, compared to farms in other countries, tend to show moderate fertilizer use, low diesel consumption, and reliance on seasonal rainfall rather than irrigation [52].

3.3.5. Land Use Impact

Figure 5a illustrates the regional variation in occupation (t C·year/kg) and Figure 5b in transformation (t C/kg) land use impacts on the soil biotic production potential associated with soybean farming. Occupation impacts represent the yearly potential soil carbon loss due to sustained land occupation with soybean rather than a potential naturalized ecosystem, and transformation impacts represent the potential carbon lost during land transformation only from a naturalized ecosystem state.
Occupation impacts show significant differences between farms in each country. Brazilian farms exhibit the highest impact at 4.32 t C·year/kg, reflecting the occupation of land with a high natural carbon sequestration potential, particularly in regions like the Amazon and Cerrado. Even in long-established agricultural areas, the environmental cost is modeled relative to the land’s natural baseline state, as occupation impacts account for foregone carbon sequestration over time [53,57]
Chinese farms follow with an occupation impact of 2.92 t C·year/kg, driven by the relatively high carbon in potential natural grassland ecosystems being used as croplands to meet the country’s growing food demands [58]. American farms show an intermediate occupational impact of 1.92 t C·year/kg, reflecting the carbon potential of historical prairie ecosystems converted into farmland and the relatively stable agricultural landscapes in the region [59]. Farms in Iran and Argentina have lower occupation impacts at 1.41 t C·year/kg and 1.31 t C·year/kg, respectively. In Iran, the semi-arid and arid conditions naturally limit the extent of carbon-rich natural ecosystems, while Argentina benefits from the slower conversion of natural land and the use of existing agricultural areas [60]. Italy has the lowest occupation impact at 0.89 t C·year/kg, attributed to its reliance on established agricultural lands with low-carbon naturalized ecosystems [61]
For the transformation of land use, Iranian farms exhibits the highest impact at 0.08 t C/kg, which reflects recent land use transformations to expand cropland [62]. Farms in China and Argentina both show an impact of 0.07 t C/kg, highlighting similar patterns of land use changes and their associated carbon losses [63]. Brazilian farms have a transformation impact of 0.05 t C/kg, which is relatively lower than their occupation impact. This result reflects quicker ecosystem transformation, a parameter that is used for the calculation of the characterization factors. The literature also supports that the ongoing agricultural activities in Brazil are primarily responsible for long-term carbon losses rather than immediate transformation [64]. Farms in the U.S. have a transformation impact of 0.04 t C/kg, stemming from historical land use changes, while Italy again demonstrates the lowest transformation impact at 0.03 t C/kg, showcasing the advantages of maintaining established agricultural areas in low-natural-value ecosystems [65].
Brazil’s leading occupation impact highlights the need for sustainable land management to reduce long-term carbon losses, while its lower transformation impact suggests quicker adjustment times than, for example, in Argentina. Iran and China show relatively high transformation impacts, while Italy’s consistently low impacts across both indicators exemplify the environmental benefits of utilizing established agricultural land in comparably low-natural-value land.

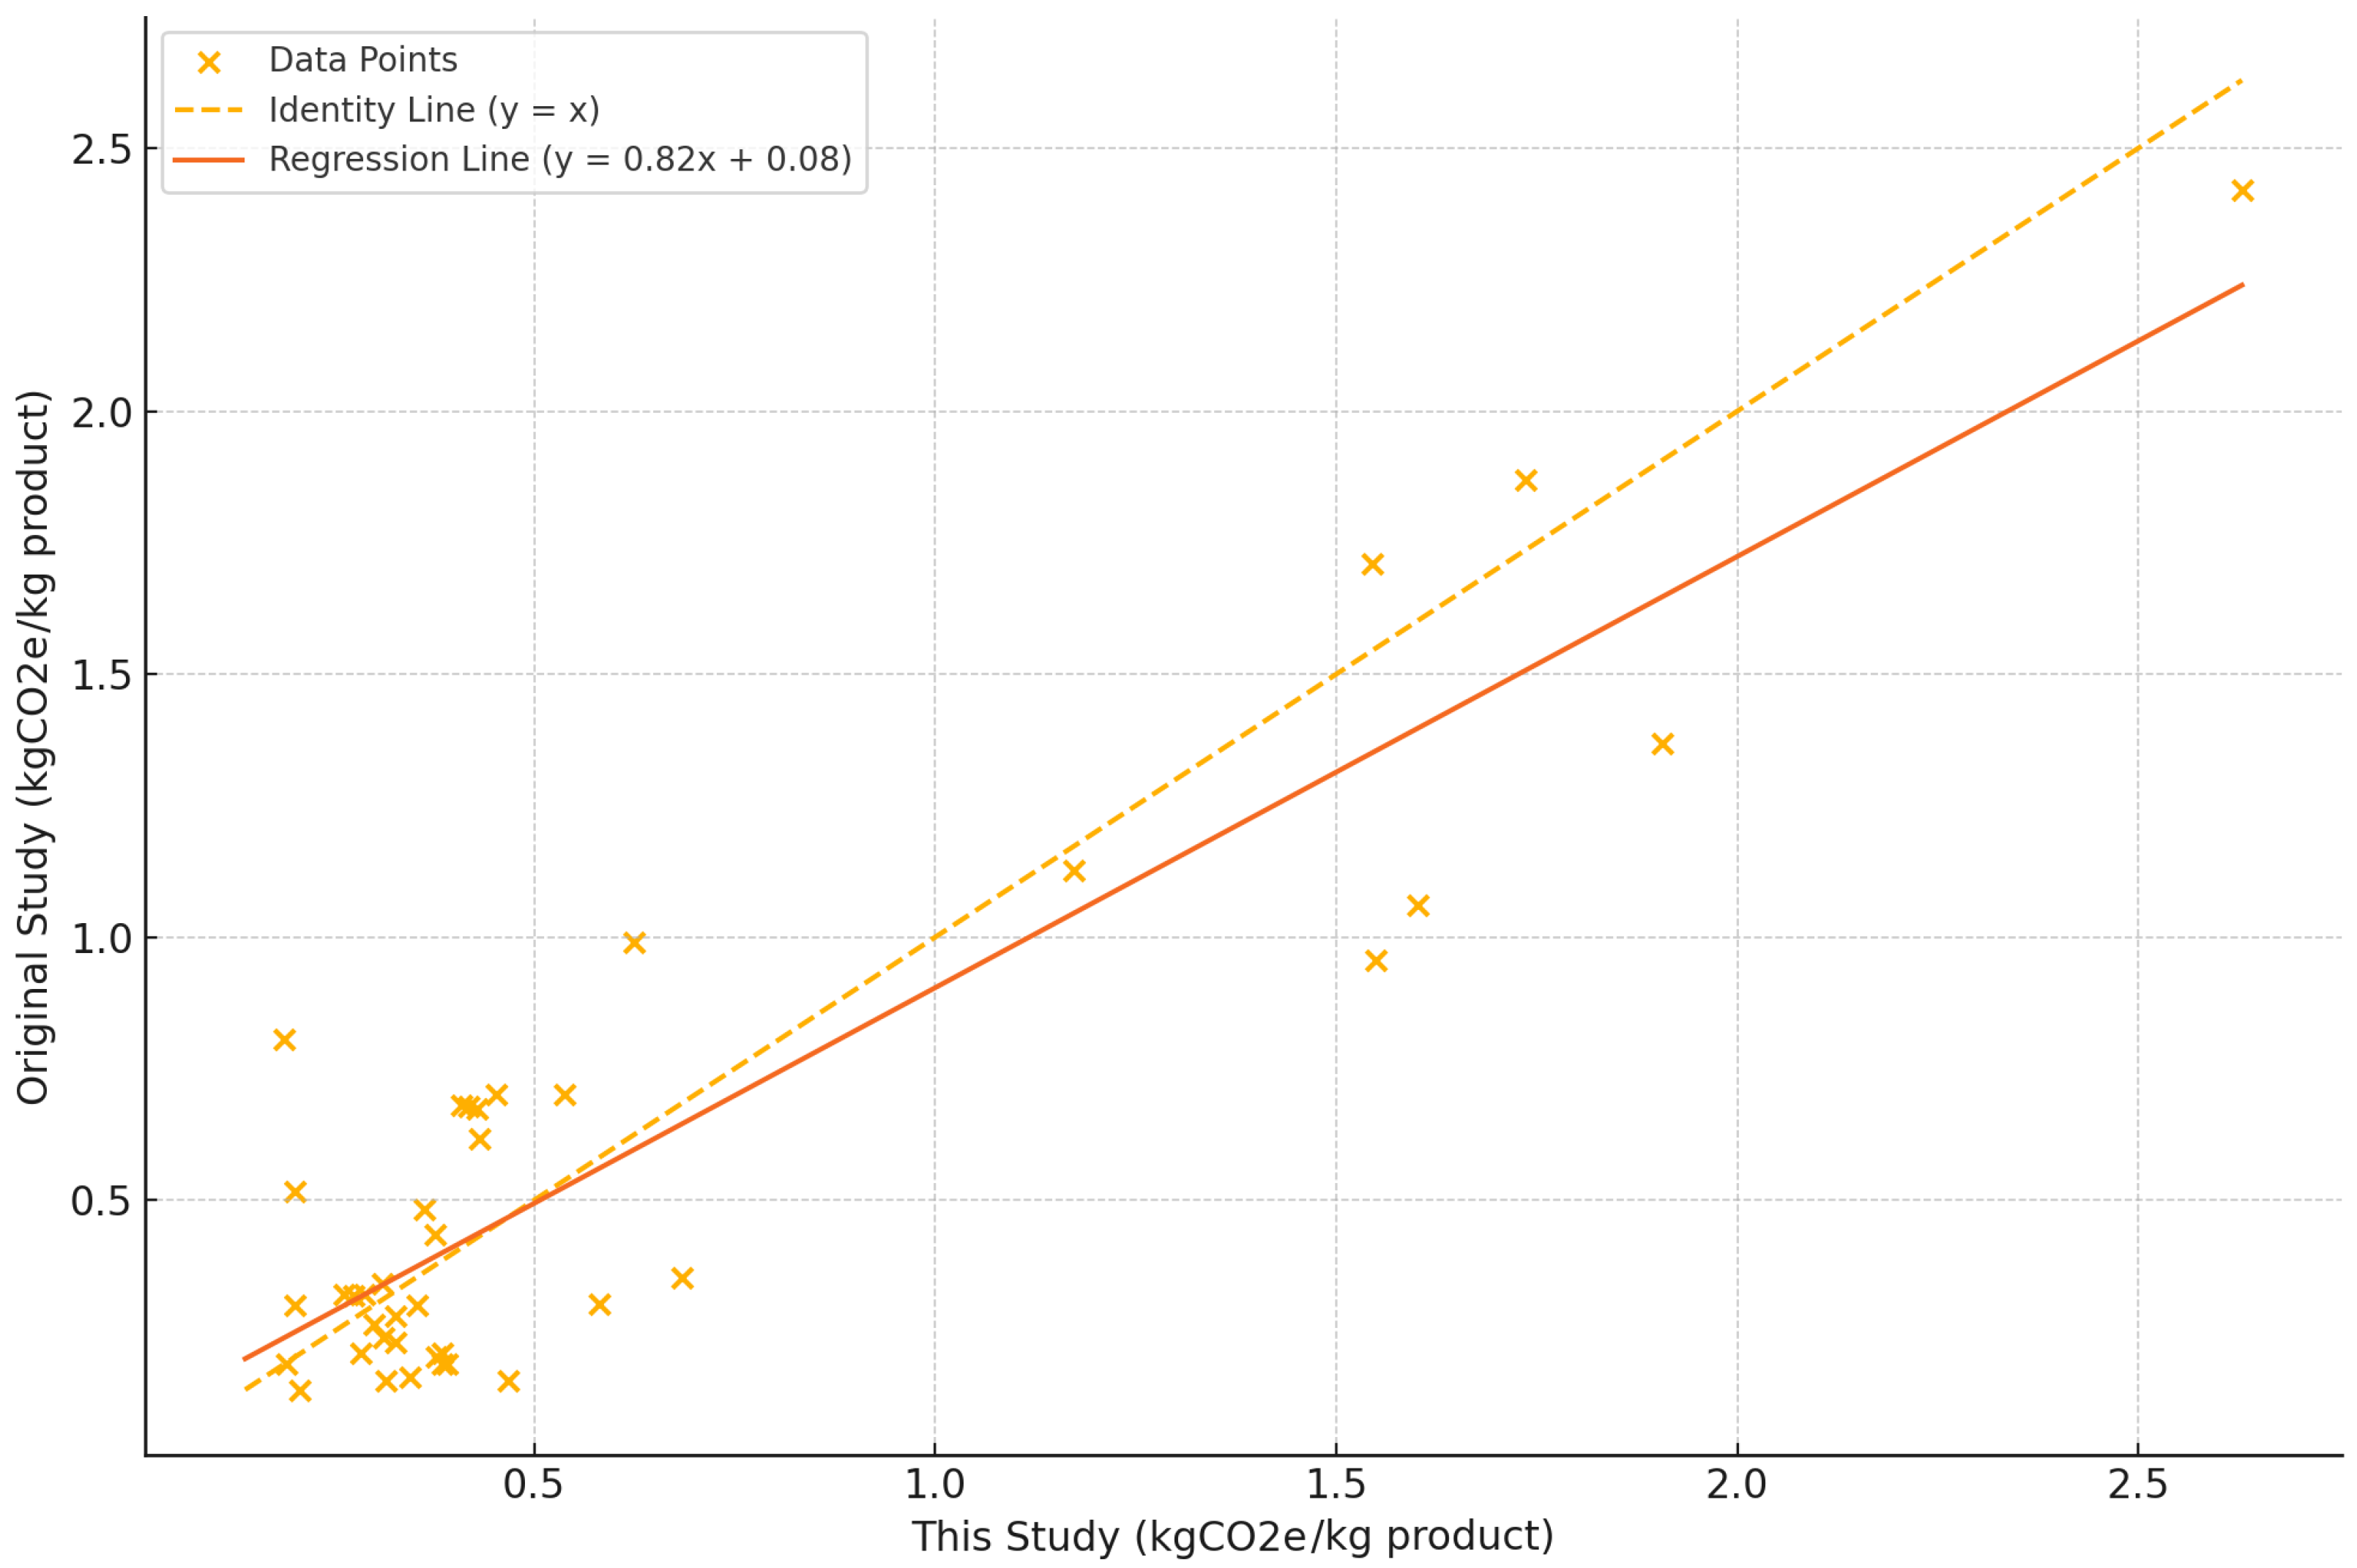
3.4. Comparison with the Literature

Figure 6 presents a point cloud comparing the results of this study with the results from the original studies. The slope of the regression line (0.82) is close to 1 and the intercept (0.037) is close to 0.08, indicating that the results from this study closely follow the trend of the original studies. However, the results of each study do not exactly match, as there is dispersion along the trendline.
To further explore these differences, we compared the average GHG emissions per country obtained from this study’s standardized calculations with the average values reported in the original studies. For Brazil, this study calculated an average of 0.53 kg CO2e/kg, compared to 0.56 kg CO2e/kg in the original studies. In Iran, the average was 1.53 kg CO2e/kg in this study and 0.54 kg CO2e/kg in the original data. The United States showed 0.87 kg CO2e/kg in this study and 1.11 kg CO2e/kg originally. For China, the recalculated average was 0.64 kg CO2e/kg, while the original was 0.53 kg CO2e/kg. In Italy, this study estimated 1.13 kg CO2e/kg compared to 1.06 kg CO2e/kg in the original sources. Argentina had the smallest difference, with 0.27 kg CO2e/kg in this study and 0.29 kg CO2e/kg in the original studies. These differences highlight the added value of using a harmonized LCA methodology, which helps to reduce inconsistencies caused by methodological heterogeneity across studies.
The numbers found here can also be put into the context of Poore and Nemeček’s [14] study. For soybean, they utilized only 47 global observations, estimating farm-stage GHG emissions to range between 0.36 and 0.54 kg CO2e per kilogram of soybean. However, they did not distinguish between specific production systems or regional practices. In contrast, this study captures a much wider variability in emission values aggregated by country, ranging from 0.27 to 1.53 kg CO2e/kg, reflecting the influence of region-specific practices, input use, and environmental conditions. This broader range underscores the importance of using regionally differentiated data and harmonized methodologies to better represent the real-world variability in agricultural emissions. The lower emissions reported by Poore and Nemeček may reflect the dilution of intensive farming impacts due to their reliance on a global dataset. Additionally, the median reference year of 2010 for their dataset may not fully capture recent trends in intensified farming practices, such as increased fertilizer application, expanded irrigation, and deforestation-driven soybean expansion in some regions. By focusing on more recent research and applying a standardized approach, this study provides a more nuanced and updated perspective on soybean production’s environmental impact.

3.5. Assumptions and Limitations

3.5.1. Lack of Detailed Information on Crop Residue Management

One significant limitation of this study is the lack of comprehensive data regarding crop residue management practices, a factor that can substantially influence CO2 emissions. Crop residues, depending on whether they are burned, left on the field, or removed for other purposes, contribute differently to the carbon footprints of agricultural systems. While it is known that the handling of crop residues plays a critical role in determining GHG emissions [66], many studies provide only vague descriptions of these practices or omit them altogether. In fact, only 3 out of 19 studies (15.8%)—Eranki et al. (2019), Knudsen et al. (2022), and Petersen et al. (2020) [30,55,67]—presented specific information about the fate of crop residues in their analyses.
This omission represents a gap in our LCA and contributes to uncertainties in the calculated emissions. The inability to account for residue management practices in detail limits the accuracy of the overall environmental impact assessment, as these practices can significantly alter the carbon sequestration potential of soils and influence CO2 emissions through decomposition processes. Future studies must focus on collecting region-specific data on residue management to improve the reliability of LCA outcomes and guide more effective mitigation strategies.

3.5.2. Absence of Climate, Soil Type, and Geographical Data

Climate, soil type, and geographical location are critical factors that influence crop yields, farming practices, and emission profiles [68]. However, in the original studies, detailed data regarding these factors were often missing, limiting the ability to perform a more comprehensive geospatial analysis through the application of Tier 2 modeling. Climate and soil conditions play important roles in determining fertilizer needs, water use, and energy inputs, which, in turn, affect emissions from agricultural operations [68]. Without accounting for these factors, the analysis may lack the depth necessary to provide tailored recommendations for different regions.
The absence of these data restricts the study’s ability to assess the impacts of environmental conditions on farming practices, thus limiting its capacity to develop region-specific strategies for reducing GHG emissions. This lack of granularity also poses challenges for applying the findings universally, as the results may not accurately reflect the environmental impact of farms operating under different climatic and soil conditions.

3.5.3. Limited Sample Size for Organic Farming Systems

A major limitation encountered in the reviewed literature is that only three studies reported complete LCA inventories for organic soybean farms. Due to this limited sample and lack of statistical representativeness, this study did not include a comparative analysis between organic and conventional systems. As a result, any interpretation of organic production impacts remains outside the scope of this study. Nonetheless, the existence of a few detailed LCA reports on organic soybean farms indicates that this is a relevant area of future research. This could be achieved by including high-quality studies beyond peer-reviewed sources or by encouraging more organic LCA studies.

3.5.4. Gaps in Input Data and Variability in Data Quality

Several gaps were also encountered in this study regarding the consumption of materials and energy. Missing or incomplete data related to fertilizer use, irrigation, and energy consumption introduced uncertainty into the emissions calculations. For instance, 8 out of 19 studies (42.1%) did not provide information about specific fertilizer inputs, 11 (57.9%) lacked details on irrigation, 15 (78.9%) omitted data on electricity use, and 10 (52.6%) did not report fuel usage. The absence of detailed information directly impacts the accuracy of N2O emissions estimates and adds uncertainty to the overall analysis.
To address these challenges, there is a pressing need for more systematic and standardized reporting of critical data in LCA studies. Academic journals and editors should establish and enforce clear guidelines that ensure the inclusion of essential information in all published studies. Systematic reporting practices would enhance transparency, comparability, and replicability in LCA research, allowing for more robust analyses and informed decision making. Such standards could include the adoption of reporting templates, mandatory data appendices, and peer review processes that emphasize data completeness. By prioritizing standardized data reporting, the academic community can significantly improve the quality and reliability of emissions assessments and contribute to more impactful sustainability research.

3.5.5. Limitation in Regional Representation

One limitation of this study is the unbalanced representation of countries, with most farms concentrated in Iran (97), while countries that stand out in global soybean production volume, such as Brazil (16), China (3), the USA (3), and Argentina (4), are represented by far fewer farms. Several of these countries have continental dimensions and very different cultivation systems between regions. Therefore, depending on where the farms were located, the results may not correctly represent the systems used across the entire country. This imbalance stems from the limited availability of LCA studies reporting detailed inventory data. While the current dataset offers valuable insights, it should be interpreted with caution, and future studies should strive to include a more balanced and regionally diverse sample to improve the representativeness and robustness of the findings.

3.5.6. Potential Gaps in Literature Coverage

While this systematic approach aimed to capture all relevant studies, some references may have been unintentionally omitted due to database indexing limitations, variations in keyword use across studies, or language constraints. Despite efforts to supplement the search with citation tracking, the potential for missing relevant publications is a common challenge in systematic reviews. Expanding search strategies, including additional languages, and incorporating alternative keyword formulations could help to improve coverage in future research.

3.6. Methodological Framework Strengths

Despite the limitations discussed, this study provides a novel contribution by systematically assessing the environmental impacts of soybean farming using a standardized LCA approach as an alternative to conventional meta-analyses. Unlike previous studies that primarily focus on global averages, this research highlights the importance of region-specific conditions and methodological harmonization in determining environmental performance, adding value to the ongoing discourse on sustainable agriculture.
The findings emphasize the necessity of regionally tailored agricultural management strategies to maximize environmental benefits. Some systems demonstrate lower GHG emissions per unit of output, particularly those that exhibit a high nitrogen fertilizer efficiency, precision irrigation, and optimized pesticide application—practices that contribute to higher yields and reduced land use pressure. The use of reduced tillage practices is also present in low-GWP farms. Reduced tillage can also enhance soil carbon sequestration, partially offsetting emissions from synthetic inputs [69] (an effect that was not taken into account here). In addition to the practices identified in this study, the use of slow-release nitrogen fertilizers and nitrification inhibitors can also significantly reduce N2O emissions, while advanced irrigation techniques such as drip irrigation can lower water consumption and related energy use [70,71].
These results underscore the importance of optimizing farming practices based on local climate, soil conditions, and input efficiency, rather than relying on generalized global averages or review approaches that overlook methodological inconsistencies between studies.

3.7. Policy Implications

From a policy perspective, supporting sustainable soybean production requires adaptive measures that align with regional characteristics. Policies that promote precision agriculture, efficient nitrogen management, and sustainable land use practices can mitigate emissions from conventional farming. Stricter regulations on land use conversion can help to prevent deforestation-related emissions, which remain a critical concern in soybean-producing regions [72]. Addressing these aspects in future research will further strengthen the applicability of LCA in guiding sustainable agricultural decision making.
One key aspect of improving agricultural sustainability is the integration of renewable energy sources into soybean farming systems. The transition to renewable energy in soybean production faces several obstacles, including high initial investment costs, a lack of infrastructure, and limited technical knowledge. In many soybean-producing regions, the adoption of solar-powered irrigation systems and biofuel-powered agricultural machinery is constrained by financial barriers and policy inconsistencies. For example, while countries such as Brazil and the USA have introduced incentives for renewable energy in agriculture, small- and medium-scale farmers often lack access to financing mechanisms that would enable them to transition away from conventional energy sources [73,74,75].
Additionally, the energy intensity of soybean production varies by region, with mechanized large-scale farms in Argentina, Brazil, and the USA requiring higher energy inputs than smaller-scale operations in China or India [32]. This further influences the feasibility of renewable energy integration, as highly mechanized farms depend heavily on diesel-powered equipment, which currently has limited commercially viable alternatives [76].
To accelerate the adoption of renewable energy in soybean farming, targeted policy interventions and economic incentives are necessary. Subsidies for solar and wind energy systems, tax incentives for renewable-powered agricultural equipment, and low-interest loans for farmers have already proven successful in Europe and parts of South America, providing models that could be adapted for broader application in soybean-producing regions [77,78]. Additionally, developing decentralized energy grids in remote agricultural areas would reduce dependence on fossil fuel-based electricity, improving access to sustainable energy solutions [79].
Beyond direct subsidies, investments in bioenergy production from soybean residues could provide a dual benefit—generating renewable energy while improving waste management practices in farming systems. Such circular approaches would increase energy self-sufficiency within soybean farms and reduce overall environmental impacts [80]. However, the effectiveness of renewable energy adoption in soybean production will ultimately depend on regional economic conditions, government commitment, and ongoing technological advancements that enhance the affordability and efficiency of sustainable energy solutions in agriculture.

4. Conclusions

Even in a field as standardized as LCA, individual studies apply methods tailored to specific case studies. This variability complicates cross-regional comparisons using results from different studies. While meta-analyses help to mitigate inconsistencies, they do not fully resolve methodological differences. To address this, we extracted LCI data from the literature and recalculated impacts using a consistent method.
This enabled the analysis of 126 soybean farming systems across six countries. Compared to the original study results, there were no major systematic differences, but substantial variation was observed between farms and while aggregating farms in each country. The recalculated emissions ranged from 0.27 to 1.53 kg CO2e/kg compared to the narrower interval of Poore and Nemeček’s review of 0.36–0.54 kg CO2e/kg. Farms in Iran, which, in our systematic recalculation of emissions, had some of the highest GWPs, would have had some of the lowest if we had used the results from the original studies. This wider variability underscores the added value of harmonizing LCA methods, offering a more realistic and differentiated view of emissions performance.
A lower non-biogenic GWP was found in systems from Argentina and Brazil, often due to favorable input–yield ratios and practices such as no-till. Higher emissions were observed in Europe and the Middle East, driven by irrigation and input use. LU/LUC impacts were the highest in Brazil due to cultivation in high-natural-value ecosystems, while Italy and Argentina showed the lowest LU/LUC impacts, linked to long-established farmland. These findings support the need for locally adapted mitigation strategies. Optimizing resource use and adopting appropriate techniques will depend heavily on regional conditions.
This approach is limited by the quality and completeness of original data. Missing details on residue management, input use, and energy limited more advanced modeling. Better reporting standards would improve the reliability of future assessments. Nonetheless, the consistent application of LCA across systems enabled clearer comparisons and may improve how synthesis studies are conducted going forward.

Supplementary Materials

The following supporting information can be downloaded at: https://www.mdpi.com/article/10.3390/su17083396/s1, File S1: Final Inventory Table; File S2: Emissions from Field Operations and Farm Level Emissions and Visualization of Results; File S3: LUC Calculations, File S4: PRISMA abstract shortlist, File S5: PRISMA checklist.

Author Contributions

Conceptualization, R.F.M.T. and T.D.; methodology, R.F.M.T., A.C., and M.R.; software, R.L.; formal analysis, R.L.; data curation, R.L.; writing—original draft preparation, R.L.; writing—review and editing, R.F.M.T., T.D., A.C., and M.R.; visualization, R.L.; supervision, R.F.M.T.; project administration, T.D.; funding acquisition, T.D. All authors have read and agreed to the published version of the manuscript.

Funding

This work was financially supported by Project “Blockchain.PT—Decentralize Portugal with Blockchain Agenda” (Project no. 51), funded by the Portuguese Recovery and Resilience Program (PPR), The Portuguese Republic and The European Union (EU) under the framework of Next Generation EU Program; by Project “Step Up—Sustainable Livestock Systems Transition and Evidence Platform for Upgrading Policies”, funded by Horizon Europe (101136785); by grant 2024.06215.BDANA (to Alina C.) and CEECIND/00365/2018 (to Ricardo T.), funded by Fundação para a Ciência e Tecnologia; and by FCT/MCTES (PIDDAC) through projects UIDB/50009/2025, UIDP/50009/2025, and LA/P/0083/2020.

Institutional Review Board Statement

Not applicable.

Informed Consent Statement

Not applicable.

Data Availability Statement

The original contributions presented in this study are included in the article/Supplementary Material. Further inquiries can be directed to the corresponding author(s).

Conflicts of Interest

The authors declare no conflict of interest.

Abbreviations

The following abbreviations are used in this manuscript:
LCALife Cycle Assessment
GHGGreenhouse Gas
IPCCIntergovernmental Panel on Climate Change
PRISMAPreferred Reporting Items for Systematic Reviews and Meta-Analyses
LULand Use
LUCLand Use Change

References

  1. Vermeulen, S.J.; Campbell, B.M.; Ingram, J.S.I. Climate Change and Food Systems. Annu. Rev. Environ. Resour. 2012, 37, 195–222. [Google Scholar] [CrossRef]
  2. Fanzo, J.; Miachon, L. Harnessing the Connectivity of Climate Change, Food Systems and Diets: Taking Action to Improve Human and Planetary Health. Anthropocene 2023, 42, 100381. [Google Scholar] [CrossRef]
  3. Foley, J.A.; Ramankutty, N.; Brauman, K.A.; Cassidy, E.S.; Gerber, J.S.; Johnston, M.; Mueller, N.D.; O’Connell, C.; Ray, D.K.; West, P.C.; et al. Solutions for a Cultivated Planet. Nature 2011, 478, 337–342. [Google Scholar] [CrossRef]
  4. Tilman, D.; Balzer, C.; Hill, J.; Befort, B.L. Global Food Demand and the Sustainable Intensification of Agriculture. Proc. Natl. Acad. Sci. USA 2011, 108, 20260–20264. [Google Scholar] [CrossRef]
  5. Monteiro, A.; Barreto-Mendes, L.; Fanchone, A.; Morgavi, D.P.; Pedreira, B.C.; Magalhães, C.A.S.; Abdalla, A.L.; Eugène, M. Crop-Livestock-Forestry Systems as a Strategy for Mitigating Greenhouse Gas Emissions and Enhancing the Sustainability of Forage-Based Livestock Systems in the Amazon Biome. Sci. Total Environ. 2024, 906, 167396. [Google Scholar] [CrossRef] [PubMed]
  6. Godfray, H.C.J.; Beddington, J.R.; Crute, I.R.; Haddad, L.; Lawrence, D.; Muir, J.F.; Pretty, J.; Robinson, S.; Thomas, S.M.; Toulmin, C. Food Security: The Challenge of Feeding 9 Billion People. Science 2010, 327, 812–818. [Google Scholar] [CrossRef]
  7. Tilman, D.; Clark, M. Global Diets Link Environmental Sustainability and Human Health. Nature 2014, 515, 518–522. [Google Scholar] [CrossRef]
  8. Conrad, Z.; Drewnowski, A.; Belury, M.A.; Love, D.C. Greenhouse Gas Emissions, Cost, and Diet Quality of Specific Diet Patterns in the United States. Am. J. Clin. Nutr. 2023, 117, 1186–1194. [Google Scholar] [CrossRef]
  9. Morais, T.G.; Teixeira, R.F.M.; Domingos, T. Detailed Global Modelling of Soil Organic Carbon in Cropland, Grassland and Forest Soils. PLoS ONE 2019, 14, e0222604. [Google Scholar] [CrossRef]
  10. Morim, A.C.; Santos, M.; Tarelho, L.A.C.; Silva, F.C. Short-Term Impacts on Soil Biological Properties After Amendment with Biochar from Residual Forestry Biomass. Agriculture 2024, 14, 2206. [Google Scholar] [CrossRef]
  11. Smith, K.A. Changing Views of Nitrous Oxide Emissions from Agricultural Soil: Key Controlling Processes and Assessment at Different Spatial Scales. Eur. J. Soil Sci. 2017, 68, 137–155. [Google Scholar] [CrossRef]
  12. Rockström, J.; Steffen, W.; Noone, K.; Persson, Å.; Chapin, F.S.; Lambin, E.F.; Lenton, T.M.; Scheffer, M.; Folke, C.; Schellnhuber, H.J.; et al. A Safe Operating Space for Humanity. Nature 2009, 461, 472–475. [Google Scholar] [CrossRef]
  13. Publications—IPCC-TFI. Available online: https://www.ipcc-nggip.iges.or.jp/public/2006gl/ (accessed on 12 February 2025).
  14. Poore, J.; Nemecek, T. Reducing Food’s Environmental Impacts through Producers and Consumers. Science 2018, 360, 987–992. [Google Scholar] [CrossRef]
  15. Hartman, G.L.; West, E.D.; Herman, T.K. Crops That Feed the World 2. Soybean—Worldwide Production, Use, and Constraints Caused by Pathogens and Pests. Food Sec. 2011, 3, 5–17. [Google Scholar] [CrossRef]
  16. Oilseeds: World Markets and Trade; United States Department of Agriculture, Foreign Agricultural Service: Washington, DC, USA, 2025.
  17. Boerema, A.; Peeters, A.; Swolfs, S.; Vandevenne, F.; Jacobs, S.; Staes, J.; Meire, P. Soybean Trade: Balancing Environmental and Socio-Economic Impacts of an Intercontinental Market. PLoS ONE 2016, 11, e0155222. [Google Scholar] [CrossRef]
  18. Bayram, A.; Marvuglia, A.; Gutierrez, T.N.; Weis, J.-P.; Conter, G.; Zimmer, S. Sustainable Farming Strategies for Mixed Crop-Livestock Farms in Luxembourg Simulated with a Hybrid Agent-Based and Life-Cycle Assessment Model. J. Clean. Prod. 2023, 386, 135759. [Google Scholar] [CrossRef]
  19. Khalaj, M.; Gholami Parashkoohi, M.; Mohammad Zamani, D. Use of Life Cycle Assessment and Modeling Techniques for Prediction of Energy-Environmental Indicators in Different Wheat Production Systems. Environ. Sustain. Indic. 2023, 18, 100237. [Google Scholar] [CrossRef]
  20. Mohammadi Kashka, F.; Tahmasebi Sarvestani, Z.; Pirdashti, H.; Motevali, A.; Nadi, M.; Valipour, M. Sustainable Systems Engineering Using Life Cycle Assessment: Application of Artificial Intelligence for Predicting Agro-Environmental Footprint. Sustainability 2023, 15, 6326. [Google Scholar] [CrossRef]
  21. Roland, W.; Scholz, O.T. Embedded Case Study Methods: Integrating Quantitative and Qualitative Knowledge; Sage Publications, Inc.: Thousand Oaks, CA, USA, 2002; ISBN 0-7619-1945-7. [Google Scholar]
  22. PRISMA Statement. Available online: https://www.prisma-statement.org (accessed on 12 February 2025).
  23. Lucić, R.; Raposto, M.; Chervinska, A.; Domingos, T.; Teixeira, R.F.M. Regionalised Environmental Impacts of Soybean Production: System. Available online: https://osf.io/rjh95 (accessed on 1 March 2025).
  24. ISO 14040:2006. Available online: https://www.iso.org/standard/37456.html (accessed on 6 April 2025).
  25. ISO 14044:2006. Available online: https://www.iso.org/standard/38498.html (accessed on 6 April 2025).
  26. Climate Change 2013: The Physical Science Basis: Summary for Policymakers, a Report of Working Group I of the IPCC: Technical Summary, a Report Accepted by Working Group I of the IPCC but Not Approved in Detail: And Frequently Asked Questions: Part of the Working Group I Contribution to the Fifth Assessment Report of the Intergovernmental Panel on Climate Change; Stocker, T., Qin, D., Eds.; Intergovernmental Panel on Climate Change: Geneva, Switzerland, 2013; ISBN 978-92-9169-138-8. [Google Scholar]
  27. Bishop, G.; Styles, D.; Lens, P.N.L. Environmental Performance Comparison of Bioplastics and Petrochemical Plastics: A Review of Life Cycle Assessment (LCA) Methodological Decisions. Resour. Conserv. Recycl. 2021, 168, 105451. [Google Scholar] [CrossRef]
  28. Teixeira, R.F.M.; Morais, T.G.; Domingos, T. Global Process-Based Characterization Factors of Soil Carbon Depletion for Life Cycle Impact Assessment. Sci. Data 2021, 8, 237. [Google Scholar] [CrossRef]
  29. Mohammadi, A.; Rafiee, S.; Jafari, A.; Dalgaard, T.; Knudsen, M.T.; Keyhani, A.; Mousavi-Avval, S.H.; Hermansen, J.E. Potential Greenhouse Gas Emission Reductions in Soybean Farming: A Combined Use of Life Cycle Assessment and Data Envelopment Analysis. J. Clean. Prod. 2013, 54, 89–100. [Google Scholar] [CrossRef]
  30. Eranki, P.L.; Devkota, J.; Landis, A.E. Carbon Footprint of Corn-Soy-Oats Rotations in the US Midwest Using Data from Real Biological Farm Management Practices. J. Clean. Prod. 2019, 210, 170–180. [Google Scholar] [CrossRef]
  31. Page, M.J.; McKenzie, J.E.; Bossuyt, P.M.; Boutron, I.; Hoffmann, T.C.; Mulrow, C.D.; Shamseer, L.; Tetzlaff, J.M.; Akl, E.A.; Brennan, S.E.; et al. The PRISMA 2020 Statement: An Updated Guideline for Reporting Systematic Reviews. BMJ 2021, n71. [Google Scholar] [CrossRef]
  32. Voora, V.A.; Larrea, C.; Bermudez, S. Global Market Report: Soybean; JSTOR: New York, NY, USA, 2024. [Google Scholar]
  33. De Maria, M.; Robinson, E.; Kangile, J.R.; Kadigi, R.M.; Dreoni, I.; Couto, M.; Howai, N.; Peci, J.; Fiennes, S. Global Soybean Trade—The Geopolitics of a Bean; UN Environment Programme World Conservation Monitoring Centre (UNEP-WCMC): Cambridge, UK, 2020. [Google Scholar]
  34. Albrektsen, R.; Mikkelsen, M.H.; Gyldenk, S. Danish Emission Inventories for Agriculture; Inventories 1985–2018; Aarhus University: Aarhus Centrum, Denmark, 2021. [Google Scholar]
  35. Dyer, J.A.; Vergé, X.P.C.; Desjardins, R.L.; Worth, D.E.; McConkey, B.G. The Impact of Increased Biodiesel Production on the Greenhouse Gas Emissions from Field Crops in Canada. Energy Sustain. Dev. 2010, 14, 73–82. [Google Scholar] [CrossRef]
  36. Basosi, R.; Spinelli, D.; Fierro, A.; Jez, S. Mineral Nitrogen Fertilizers: Environmental Impact of Production and Use; In ResearchGate (Chapter); Nova Science Publishers: Hauppauge, New York, NY, USA, 2014. [Google Scholar]
  37. Lesschen, J.P.; Van Den Berg, M.; Westhoek, H.J.; Witzke, H.P.; Oenema, O. Greenhouse Gas Emission Profiles of European Livestock Sectors. Anim. Feed Sci. Technol. 2011, 166–167, 16–28. [Google Scholar] [CrossRef]
  38. Della Chiesa, T.; Northrup, D.; Miguez, F.E.; Archontoulis, S.V.; Baum, M.E.; Venterea, R.T.; Emmett, B.D.; Malone, R.W.; Iqbal, J.; Necpalova, M.; et al. Reducing Greenhouse Gas Emissions from North American Soybean Production. Nat. Sustain. 2024, 7, 1608–1615. [Google Scholar] [CrossRef]
  39. Timpanaro, G. Vera Teresa Foti Recovery and Resilience of Rural Farms in Sicily (Italy): The COVID-19 Pandemic and the Russia-Ukraine Conflict. J. Rural Stud. 2024, 112, 103485. [Google Scholar] [CrossRef]
  40. Woodhouse, P. Beyond Industrial Agriculture? Some Questions about Farm Size, Productivity and Sustainability. J. Agrar. Change 2010, 10, 437–453. [Google Scholar] [CrossRef]
  41. Leguizamón, Y.; Goldenberg, M.G.; Jobbágy, E.; Seppelt, R.; Garibaldi, L.A. Environmental Potential for Crop Production and Tenure Regime Influence Fertilizer Application and Soil Nutrient Mining in Soybean and Maize Crops. Agric. Syst. 2023, 210, 103690. [Google Scholar] [CrossRef]
  42. Cerri, C.C.; Bernoux, M.; Maia, S.M.F.; Cerri, C.E.P.; Costa Junior, C.; Feigl, B.J.; Frazão, L.A.; de Castro Mello, F.F.; Galdos, M.V.; Moreira, C.S.; et al. Greenhouse Gas Mitigation Options in Brazil for Land-Use Change, Livestock and Agriculture. Sci. Agric. 2010, 67, 102–116. [Google Scholar] [CrossRef]
  43. Calegari, A.; de Araujo, A.G.; Tiecher, T.; Bartz, M.L.C.; Lanillo, R.F.; dos Santos, D.R.; Capandeguy, F.; Zamora, J.H.; Jump, J.R.B.; Moriya, K.; et al. No-Till Farming Systems for Sustainable Agriculture in South America. In No-Till Farming Systems for Sustainable Agriculture: Challenges and Opportunities; Dang, Y.P., Dalal, R.C., Menzies, N.W., Eds.; Springer: Cham, Switzerland, 2020; pp. 533–565. ISBN 978-3-030-46409-7. [Google Scholar]
  44. World Bank Group. International Development, Poverty and Sustainability. Available online: https://www.worldbank.org/ext/en/home (accessed on 12 February 2025).
  45. Gil, J.; Siebold, M.; Berger, T. Adoption and Development of Integrated Crop–Livestock–Forestry Systems in Mato Grosso, Brazil. Agric. Ecosyst. Environ. 2015, 199, 394–406. [Google Scholar] [CrossRef]
  46. Leite-Moraes, A.E.; Rossato, F.G.; Susaeta, A.; Binotto, E.; Malafaia, G.C.; De Azevedo, D.B. Environmental Impacts in Integrated Production Systems: An Overview. J. Clean. Prod. 2023, 420, 138400. [Google Scholar] [CrossRef]
  47. Canabarro, N.I.; Silva-Ortiz, P.; Nogueira, L.A.H.; Cantarella, H.; Maciel-Filho, R.; Souza, G.M. Sustainability Assessment of Ethanol and Biodiesel Production in Argentina, Brazil, Colombia, and Guatemala. Renew. Sustain. Energy Rev. 2023, 171, 113019. [Google Scholar] [CrossRef]
  48. Fathian, M.; Bazrafshan, O.; Jamshidi, S.; Jafari, L. Impacts of Climate Change on Water Footprint Components of Rainfed and Irrigated Wheat in a Semi-Arid Environment. Environ. Monit. Assess. 2023, 195, 324. [Google Scholar] [CrossRef] [PubMed]
  49. Lucchesi, A.; Khanna, M.; Pereda, P.C.; Ussami, K.A.; Ruggiero, P.G.C.; Dornelas, V.S.; Lallement, T. Araguaia Biodiversity Corridor Cost Benefit Analysis: Large Scale Restoration and Sustainable Agribusiness in Amazon and Cerrado. Land Use Policy 2024, 141, 107122. [Google Scholar] [CrossRef]
  50. Castanheira, É.G.; Grisoli, R.; Coelho, S.; Anderi Da Silva, G.; Freire, F. Life-Cycle Assessment of Soybean-Based Biodiesel in Europe: Comparing Grain, Oil and Biodiesel Import from Brazil. J. Clean. Prod. 2015, 102, 188–201. [Google Scholar] [CrossRef]
  51. Botta, G.F.; Antille, D.L.; Nardon, G.F.; Rivero, D.; Bienvenido, F.; Contessotto, E.E.; Ezquerra-Canalejo, A.; Ressia, J.M. Zero and Controlled Traffic Improved Soil Physical Conditions and Soybean Yield under No-Tillage. Soil Tillage Res. 2022, 215, 105235. [Google Scholar] [CrossRef]
  52. Giusti, G.; Galo, N.R.; Tóffano Pereira, R.P.; Lopes Silva, D.A.; Filimonau, V. Assessing the Impact of Drought on Carbon Footprint of Soybean Production from the Life Cycle Perspective. J. Clean. Prod. 2023, 425, 138843. [Google Scholar] [CrossRef]
  53. Raucci, G.S.; Moreira, C.S.; Alves, P.A.; Mello, F.F.C.; Frazão, L.D.A.; Cerri, C.E.P.; Cerri, C.C. Greenhouse Gas Assessment of Brazilian Soybean Production: A Case Study of Mato Grosso State. J. Clean. Prod. 2015, 96, 418–425. [Google Scholar] [CrossRef]
  54. Maciel, V.G.; Zortea, R.B.; Menezes Da Silva, W.; Cybis, L.F.D.A.; Einloft, S.; Seferin, M. Life Cycle Inventory for the Agricultural Stages of Soybean Production in the State of Rio Grande Do Sul, Brazil. J. Clean. Prod. 2015, 93, 65–74. [Google Scholar] [CrossRef]
  55. Knudsen, M.T.; Yu-Hui, Q.; Yan, L.; Halberg, N. Environmental Assessment of Organic Soybean (Glycine Max.) Imported from China to Denmark: A Case Study. J. Clean. Prod. 2010, 18, 1431–1439. [Google Scholar] [CrossRef]
  56. Zhang, Q.; Hong, J.; Zhang, T.; Tian, X.; Geng, Y.; Chen, W.; Zhai, Y.; Liu, W.; Shen, X.; Bai, Y. Environmental Footprints of Soybean Production in China. Environ. Dev. Sustain. 2023, 25, 9047–9065. [Google Scholar] [CrossRef]
  57. Castanheira, É.G.; Freire, F. Greenhouse Gas Assessment of Soybean Production: Implications of Land Use Change and Different Cultivation Systems. J. Clean. Prod. 2013, 54, 49–60. [Google Scholar] [CrossRef]
  58. Feng, Z.; Zhou, L.; Zhou, G.; Wang, Y.; Zhou, H.; Lv, X.; Liu, L. Variation in and Regulation of Carbon Use Efficiency of Grassland Ecosystem in Northern China. Atmosphere 2024, 15, 678. [Google Scholar] [CrossRef]
  59. Booker, K.; Huntsinger, L.; Bartolome, J.W.; Sayre, N.F.; Stewart, W. What Can Ecological Science Tell Us about Opportunities for Carbon Sequestration on Arid Rangelands in the United States? Global Environmental Change 2013, 23, 240–251. [Google Scholar] [CrossRef]
  60. Mohammad Gheitury, Contribution of Soil Organic Carbon Levels, Different Grazing and Converted Rangeland on Aggregates Size Distribution in the Rangelands of Kermanshah Province, Iran. Afr. J. Agric. Res. 2012, 7. [CrossRef]
  61. Cammarata, M.; Tadiello, T.; Scuderi, A.; Millar, N.; Basso, B. Regenerative Practices Can Lead to Carbon-Negative Orange Groves in Sicily. J. Agric. Food Res. 2025, 19, 101615. [Google Scholar] [CrossRef]
  62. Rahmati, F.; Hojati, ُs.; Rngzan, K.; Landi, A. Modelling and Digitally Mapping of Surface Soil Organic Carbon in Semirom County Employing Several Machine Learning Algorithms. Agric. Eng. 2024, 47, 585–605. [Google Scholar] [CrossRef]
  63. Lv, J.; Song, C.; Gao, Y.; Ye, S.; Gao, P. Simulation and Analysis of the Long-Term Impacts of 1.5°C Global Climate Pledges on China’s Land Systems. Sci. China Earth Sci. 2025, 68, 457–472. [Google Scholar] [CrossRef]
  64. Fiorini, A.C.O.; Angelkorte, G.; Bakman, T.; Baptista, L.B.; Cruz, T.; Diuana, F.A.; Morais, T.N.; Rathmann, R.; Da Silva, F.T.F.; Tagomori, I.; et al. How Climate Change Is Impacting the Brazilian Agricultural Sector: Evidence from a Systematic Literature Review. Environ. Res. Lett. 2024, 19, 083001. [Google Scholar] [CrossRef]
  65. Longo, M.; Dal Ferro, N.; Lazzaro, B.; Morari, F. Trade-Offs among Ecosystem Services Advance the Case for Improved Spatial Targeting of Agri-Environmental Measures. J. Environ. Manag. 2021, 285, 112131. [Google Scholar] [CrossRef] [PubMed]
  66. Abalos, D.; Recous, S.; Butterbach-Bahl, K.; De Notaris, C.; Rittl, T.F.; Topp, C.F.E.; Petersen, S.O.; Hansen, S.; Bleken, M.A.; Rees, R.M.; et al. A Review and Meta-Analysis of Mitigation Measures for Nitrous Oxide Emissions from Crop Residues. Sci. Total Environ. 2022, 828, 154388. [Google Scholar] [CrossRef]
  67. Petersen, B.M.; Knudsen, M.T.; Hermansen, J.E.; Halberg, N. An Approach to Include Soil Carbon Changes in Life Cycle Assessments. J. Clean. Prod. 2013, 52, 217–224. [Google Scholar] [CrossRef]
  68. Zhao, J.; Yang, J.; Xie, H.; Qin, X.; Huang, R. Sustainable Management Strategies for Balancing Crop Yield, Water Use Efficiency and Greenhouse Gas Emissions. Agric. Syst. 2024, 217, 103944. [Google Scholar] [CrossRef]
  69. Lal, R. Enhancing Ecosystem Services with No-Till. Renew. Agric. Food Syst. 2013, 28, 102–114. [Google Scholar] [CrossRef]
  70. Sunling, Y.; Shahzad, A.; Wang, M.; Xi, Y.; Shaik, M.R.; Khan, M. Urease and Nitrification Inhibitors with Drip Fertigation Strategies to Mitigate Global Warming Potential and Improve Water-Nitrogen Efficiency of Maize under Semi-Arid Regions. Agric. Water Manag. 2024, 295, 108750. [Google Scholar] [CrossRef]
  71. Manco, A.; Giaccone, M.; Zenone, T.; Onofri, A.; Tei, F.; Farneselli, M.; Gabbrielli, M.; Allegrezza, M.; Perego, A.; Magliulo, V.; et al. An Overview of N2O Emissions from Cropping Systems and Current Strategies to Improve Nitrogen Use Efficiency. Horticulturae 2024, 10, 754. [Google Scholar] [CrossRef]
  72. Ziegert, R.F.; Sotirov, M. Regulatory Politics and Hybrid Governance: The Case of Brazil’s Amazon Soy Moratorium. Glob. Environ. Chang. 2024, 88, 102916. [Google Scholar] [CrossRef]
  73. Rocha-Meneses, L.; Luna-delRisco, M.; González, C.A.; Moncada, S.V.; Moreno, A.; Sierra-Del Rio, J.; Castillo-Meza, L.E. An Overview of the Socio-Economic, Technological, and Environmental Opportunities and Challenges for Renewable Energy Generation from Residual Biomass: A Case Study of Biogas Production in Colombia. Energies 2023, 16, 5901. [Google Scholar] [CrossRef]
  74. Majeed, Y.; Khan, M.U.; Waseem, M.; Zahid, U.; Mahmood, F.; Majeed, F.; Sultan, M.; Raza, A. Renewable Energy as an Alternative Source for Energy Management in Agriculture. Energy Rep. 2023, 10, 344–359. [Google Scholar] [CrossRef]
  75. Wang, Y.; Wright, L.A. A Comparative Review of Alternative Fuels for the Maritime Sector: Economic, Technology, and Policy Challenges for Clean Energy Implementation. World 2021, 2, 456–481. [Google Scholar] [CrossRef]
  76. Guareschi, R.F.; Martins, M.D.R.; Sarkis, L.F.; Alves, B.J.R. Energy Use Efficiency in Soybean Crops in Different Regions of Brazil. Semina: Ciênc. Agrár. 2020, 41, 2991–3010. [Google Scholar] [CrossRef]
  77. Bellmann, C. Subsidies and Sustainable Agriculture: Mapping the Policy Landscape; Chatham House: London, UK, 2019. [Google Scholar]
  78. Iskandarova, M.; Dembek, A.; Fraaije, M.; Matthews, W.; Stasik, A.; Wittmayer, J.M.; Sovacool, B.K. Who Finances Renewable Energy in Europe? Examining Temporality, Authority and Contestation in Solar and Wind Subsidies in Poland, the Netherlands and the United Kingdom. Energy Strategy Rev. 2021, 38, 100730. [Google Scholar] [CrossRef]
  79. Meir, Y.B.; Opfer, K.; Hernandez, E. Decentralized Renewable Energies and the Water-Energy-Food Nexus in Rural Morocco. Environ. Chall. 2022, 6, 100432. [Google Scholar] [CrossRef]
  80. Goel, S.; Thapliyal, D.; Arya, R.K. Renewable Energy Production Using Crop Waste. In From Waste to Wealth; Arya, R.K., Verros, G.D., Verma, O.P., Hussain, C.M., Eds.; Springer: Singapore, 2024; pp. 281–311. ISBN 978-981-99-7552-5. [Google Scholar]
Figure 1. Workflow used for the methos applied in this article. IPCC—Intergovernmnental Panel on Climate Change; LCA—Life Cycle Assessment.
Sustainability 17 03396 g001
Figure 2. PRISMA flow diagram for systematic reviews. Adapted from Page et al. [31]; * Reason 1: Insufficient data; Reason 2: Irrelevance to LCA; Reason 3: Inaccessible data; Reason 4: Outside of time scope; and Reason 5: Duplicates.
Sustainability 17 03396 g002
Figure 3. Correlation matrix between selected inputs and emissions, *—significant at the 5% level and **—significant at the 1% level; correlations without asterisks are not statistically significant.
Sustainability 17 03396 g003
Figure 4. Average global warming potential (GWP) of soybean production in the sample farms (kg CO2e/kg soybean). The darker tone of the shading is proportional to the average GWP of the farms within the country. Note: coloring of entire countries does not imply that soybean is cultivated throughout the entire territory and only has the purpose of showing country borders.
Sustainability 17 03396 g004
Figure 5. Land use impact measured in terms of loss of soil biotic potential in tons of carbon lost. (a) Occupation impacts (t C·year/kg) and (b) transformation impacts (t C/kg). The darker tone of the shading is proportional to the average impacts of the farms within the country. Note: coloring of entire countries does not imply that soybean is cultivated throughout the entire territory and only has the purpose of showing country borders.
Sustainability 17 03396 g005
Figure 6. Comparison: results of this study vs. results from original studies.
Sustainability 17 03396 g006
Disclaimer/Publisher’s Note: The statements, opinions and data contained in all publications are solely those of the individual author(s) and contributor(s) and not of MDPI and/or the editor(s). MDPI and/or the editor(s) disclaim responsibility for any injury to people or property resulting from any ideas, methods, instructions or products referred to in the content.

