
The Impact of Last-Mile Delivery Fleet Electrification on Emissions, Dispersion, and Health: An Environmental Justice Analysis Based on Dallas County, Texas


Abstract
1. Introduction
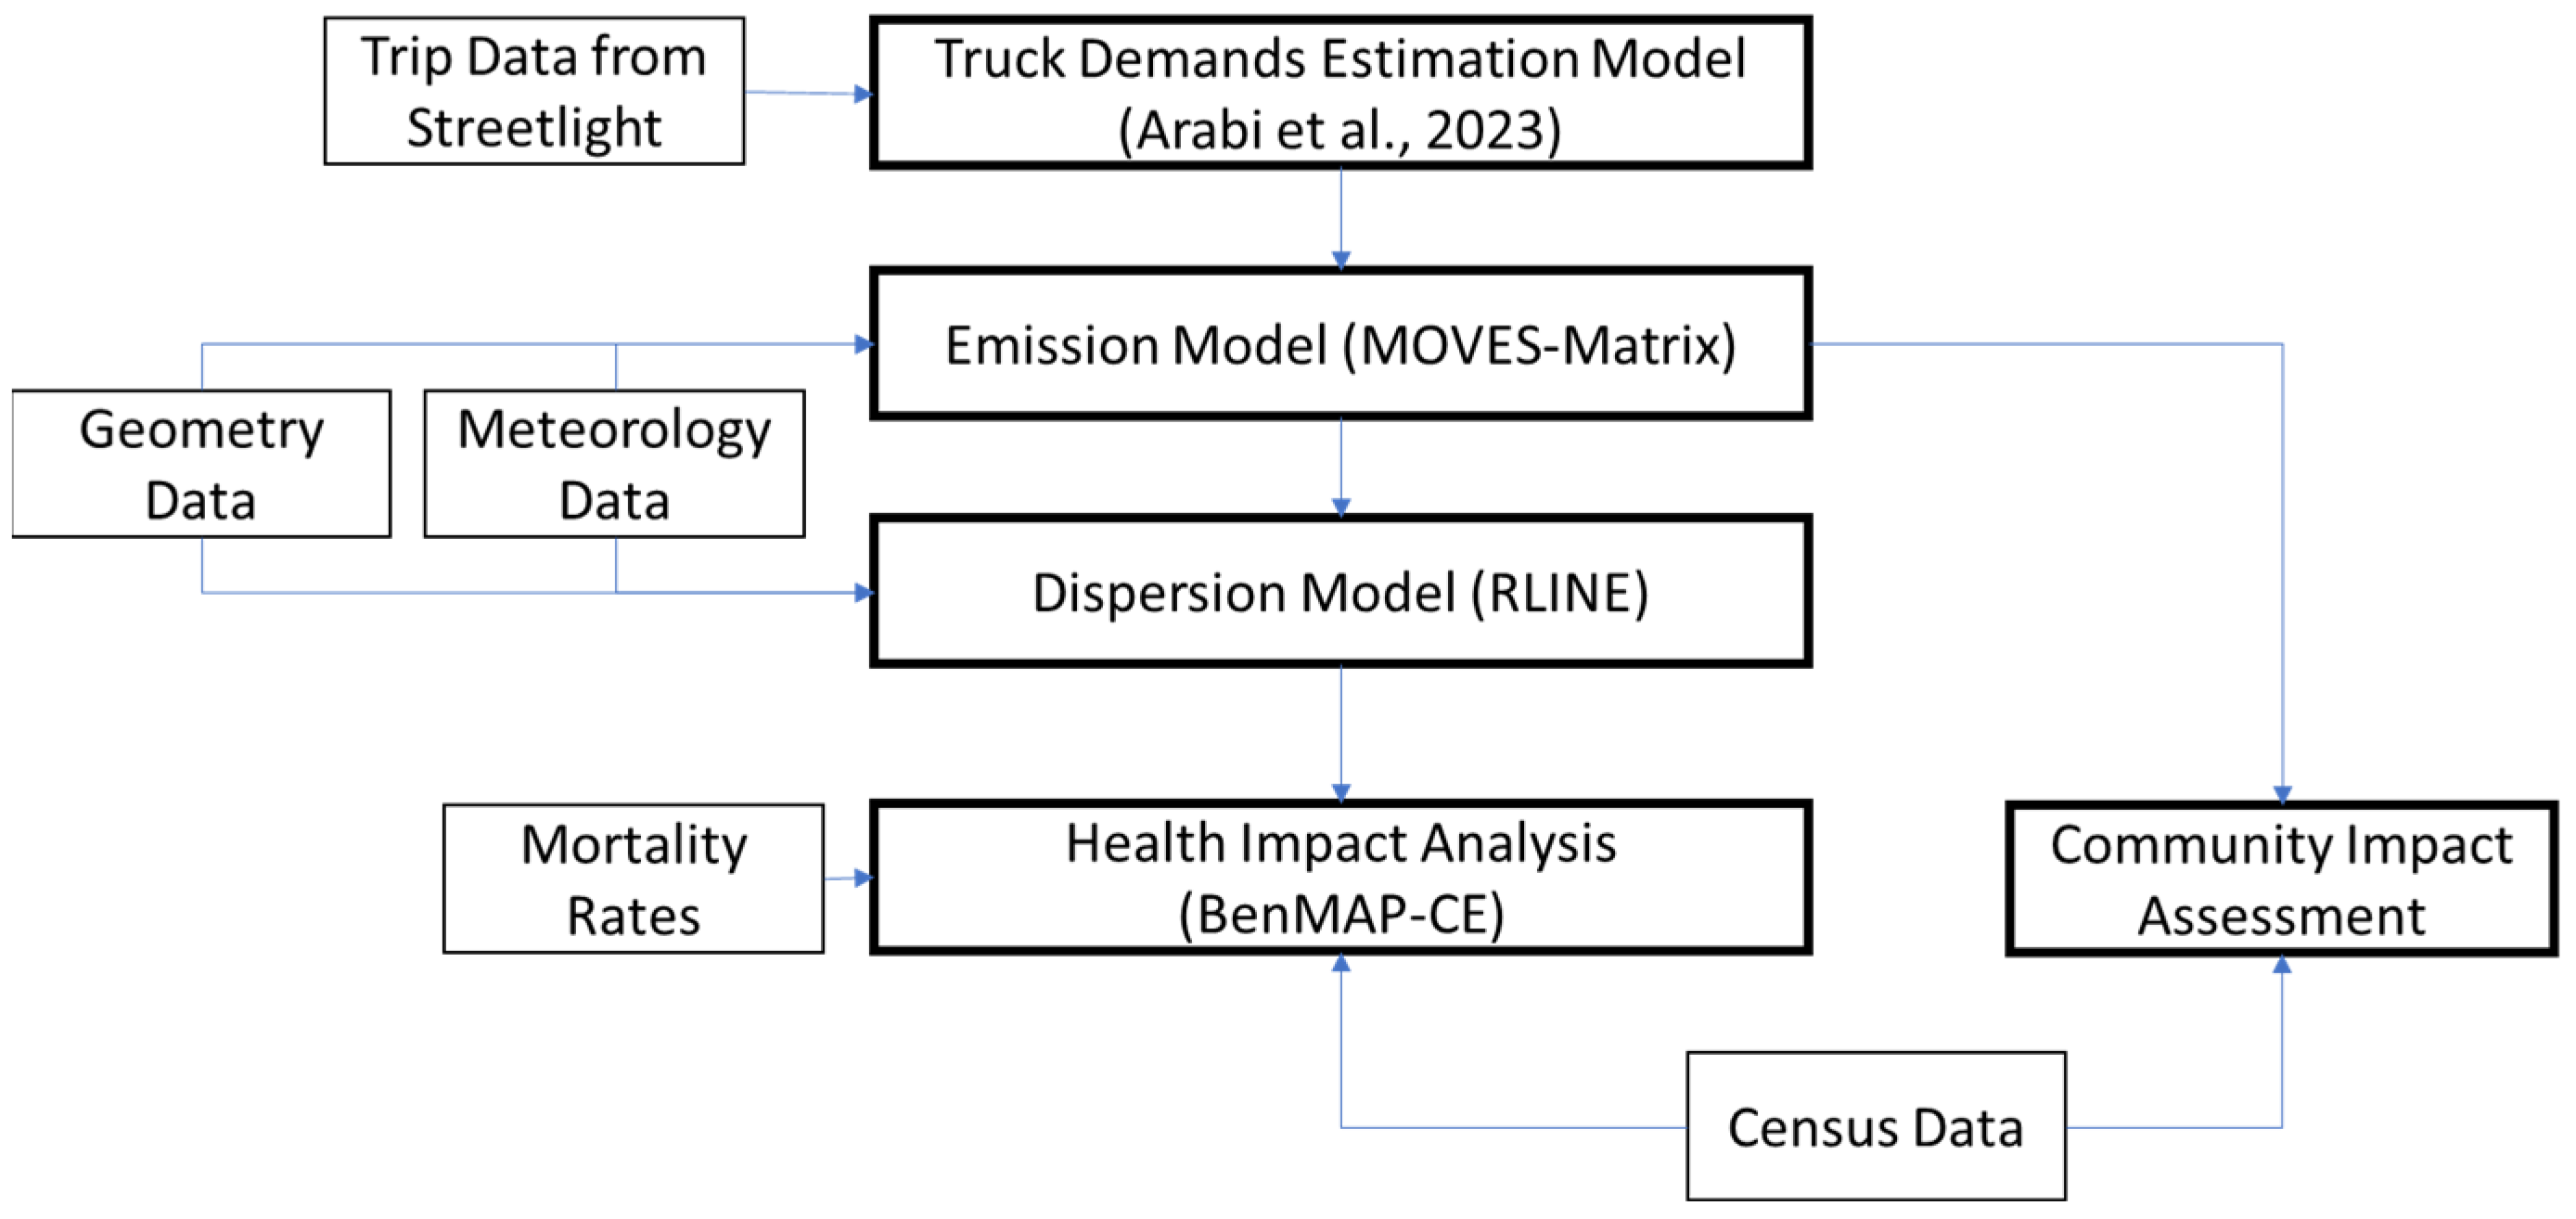
2. Methods
2.1. Step 1: Truck Demands Estimation Model
2.2. Step 2: MOVES-Matrix 2.0
2.3. Step 3: Dispersion Model
2.4. Step 4: BenMAP-CE v 1.5.8
2.5. Step 5: Community Impact Assessment
- Age: seniors (aged 65+) and children (aged 17 years old or less) represent social minorities.
- Race: non-whites represent racial minorities.
- Economic measures using median household income, the percentage of no vehicles, unemployed, and households under poverty levels characterize economic minorities.
3. Data
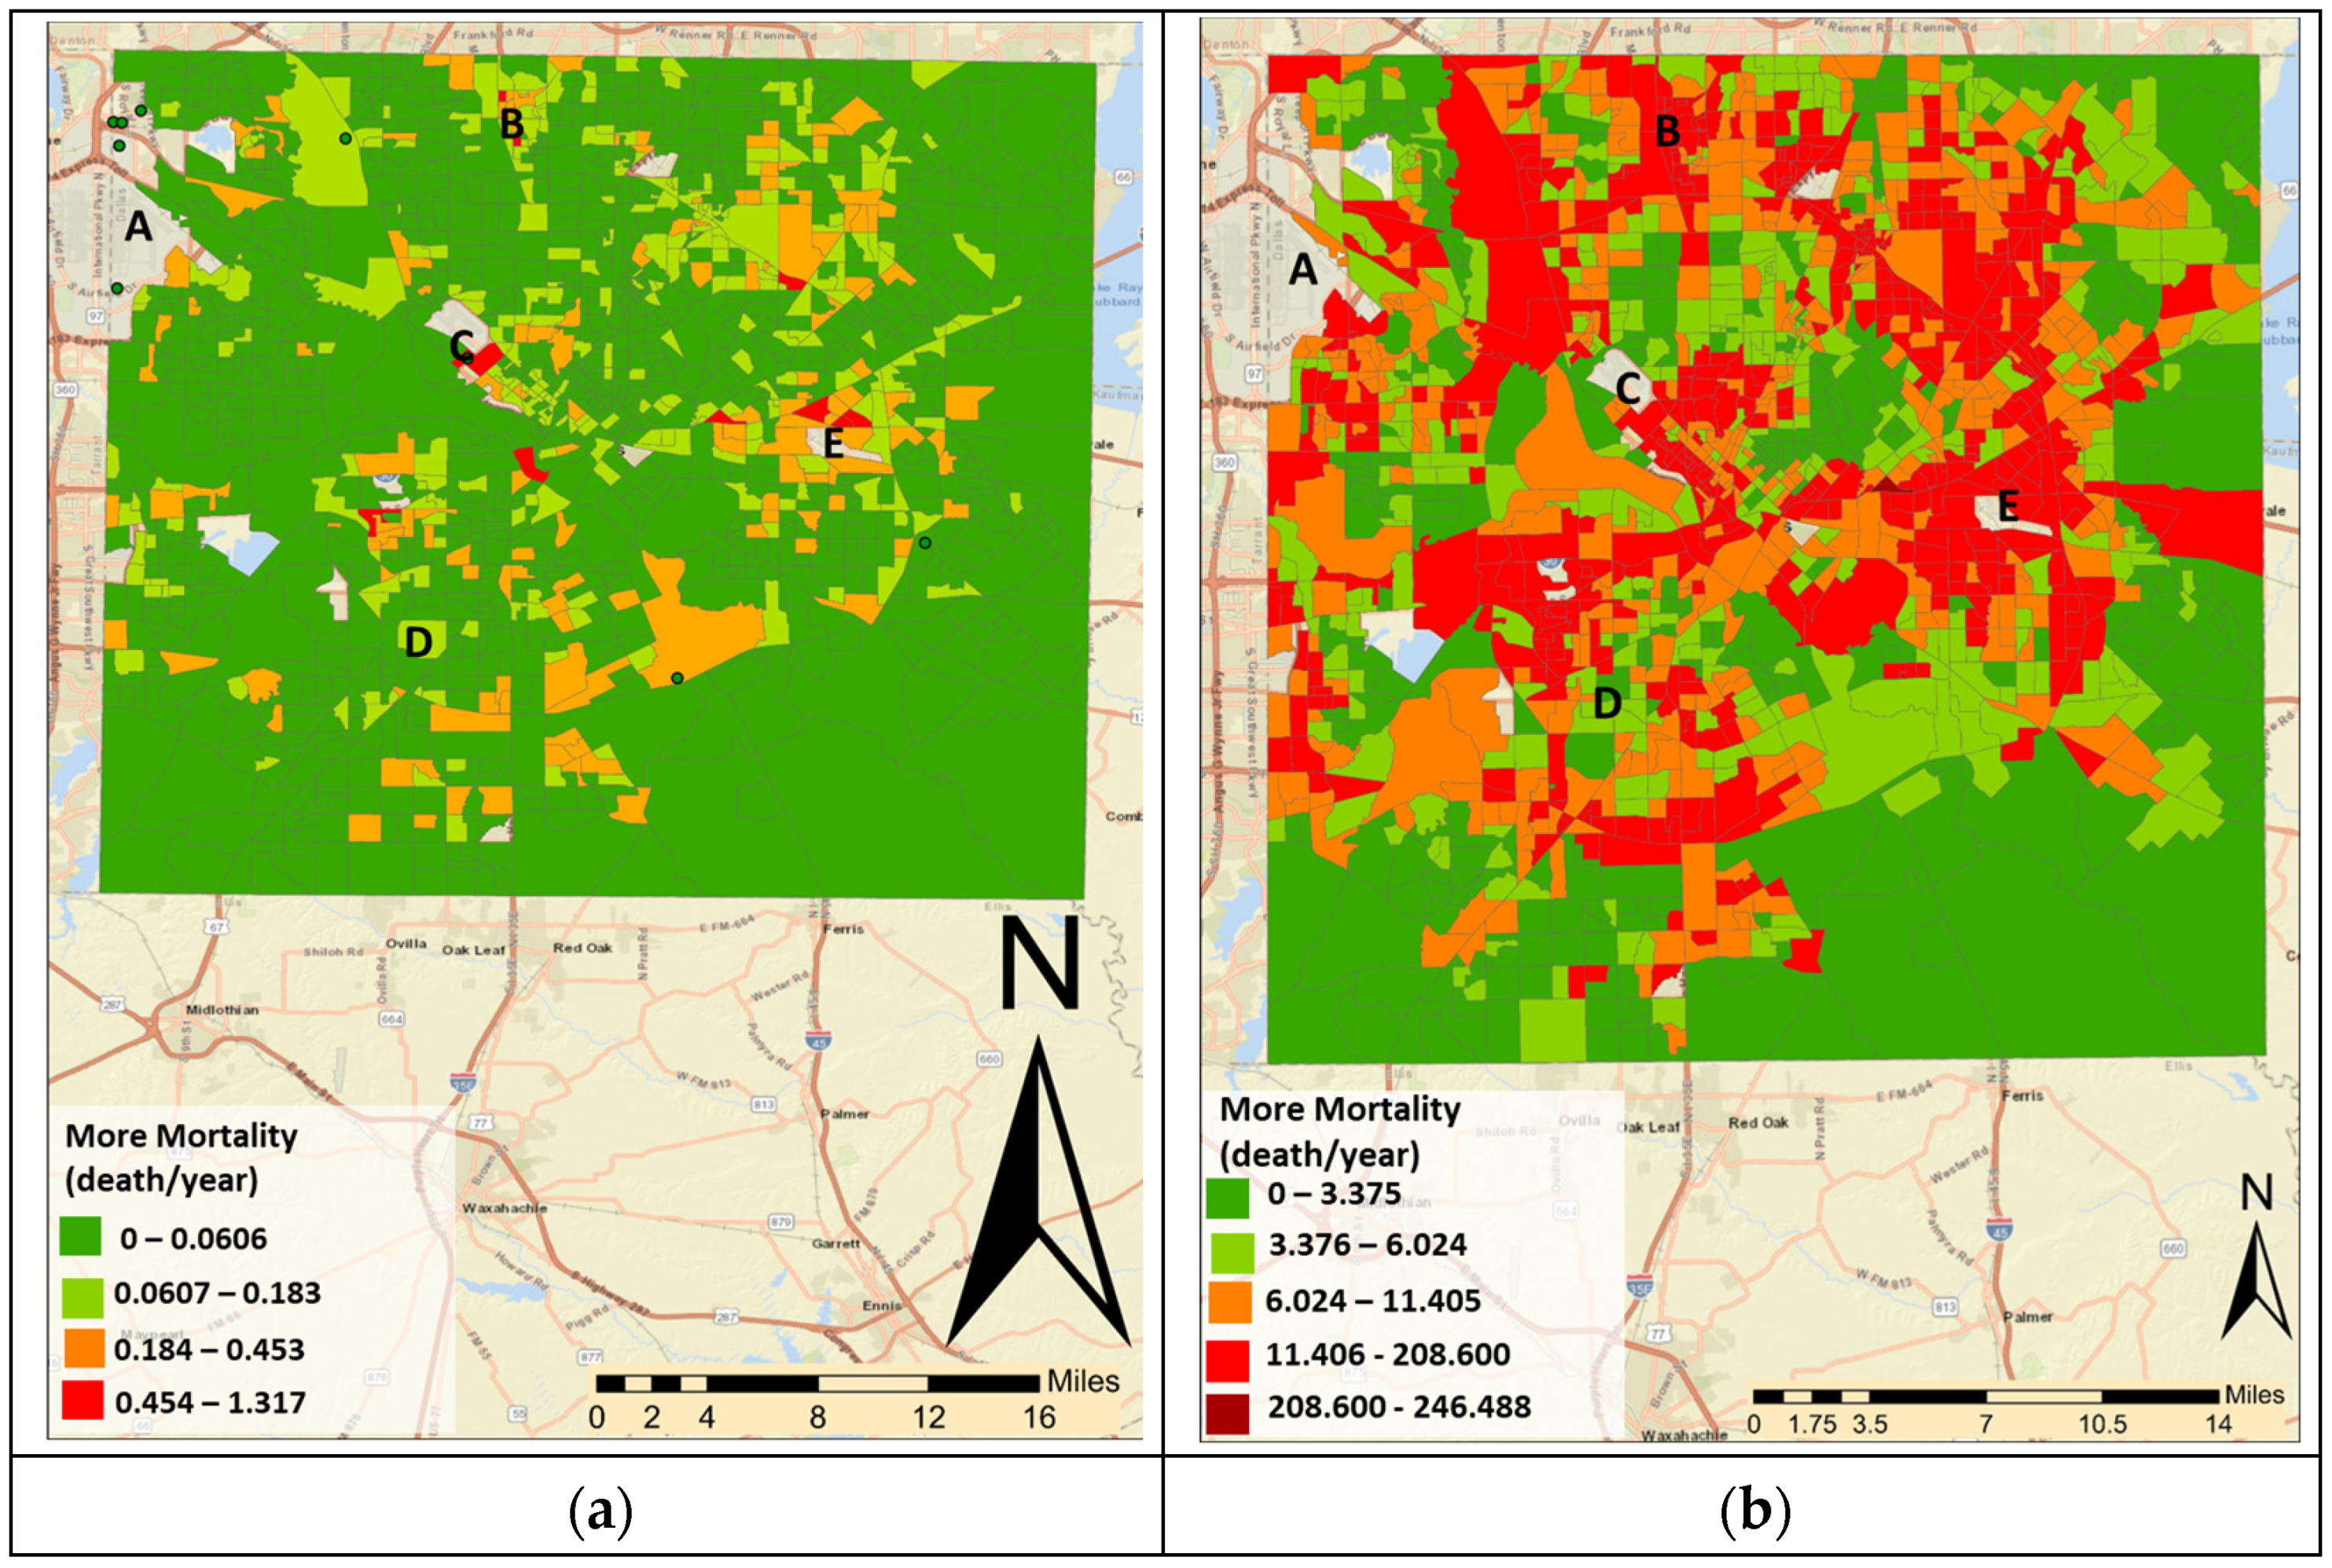
3.1. Study Area
3.2. Truck Demands Data and Geometry Data
3.3. Meteorological Data
4. Results
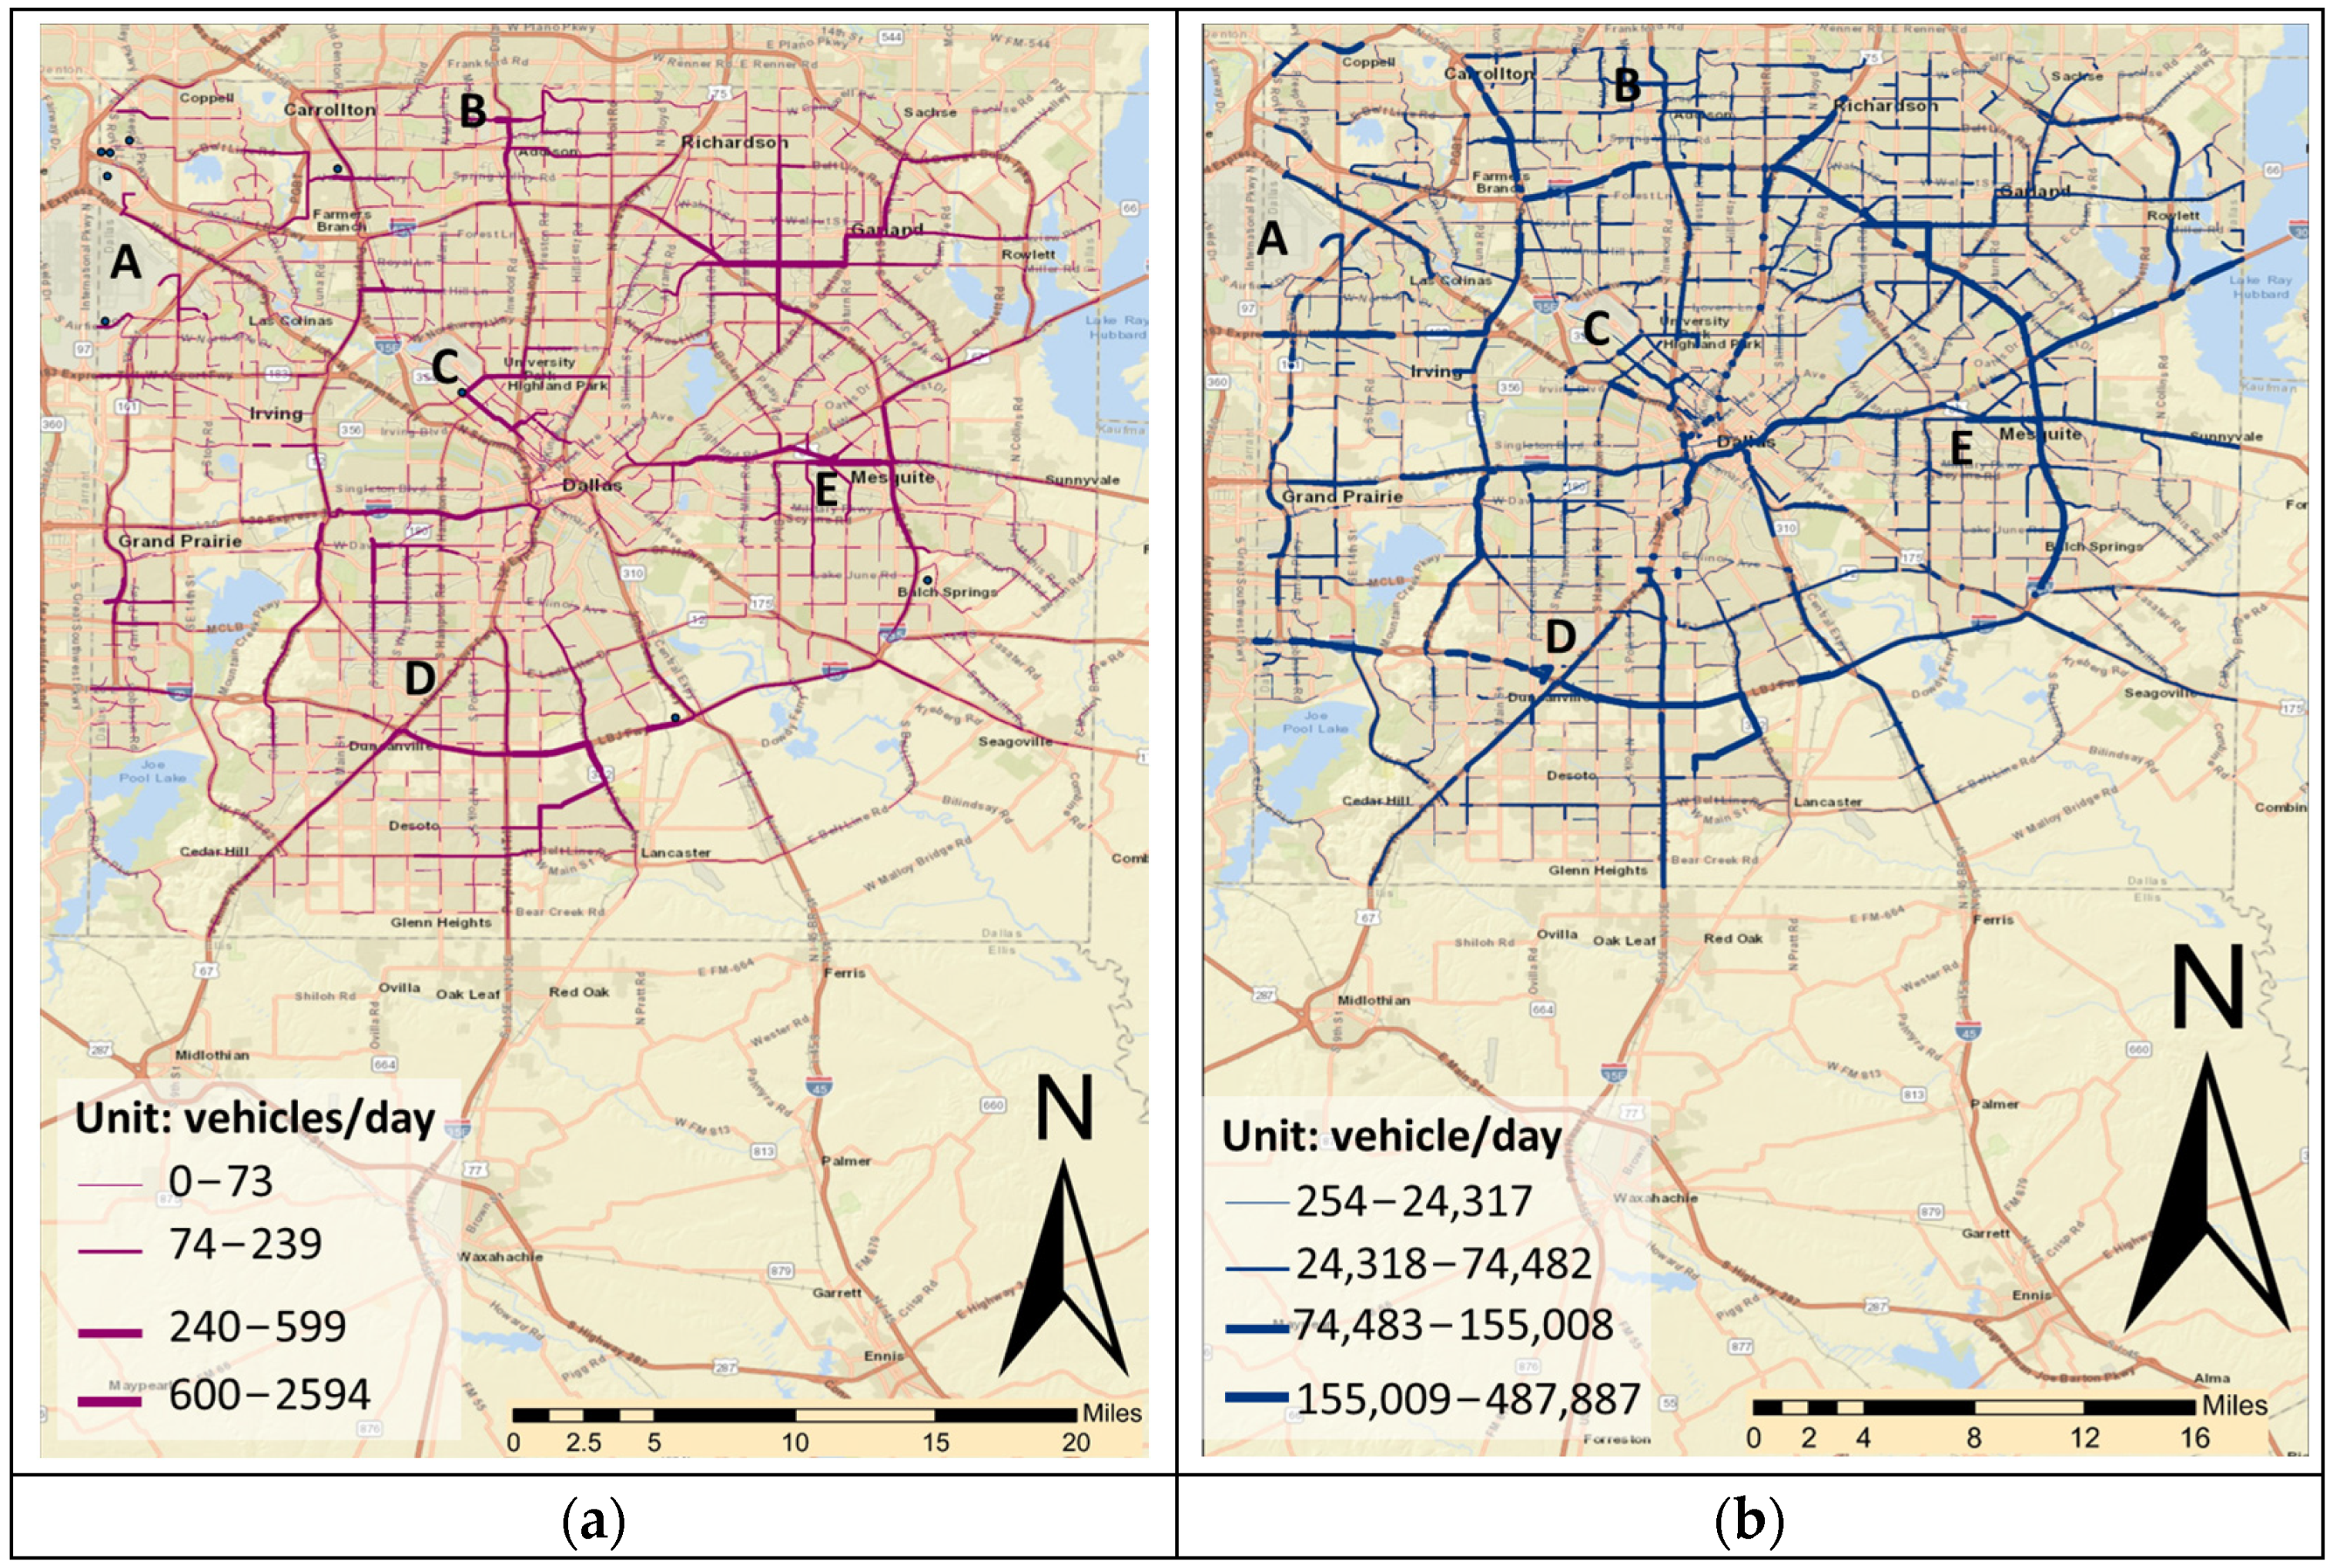
4.1. Last-Mile Delivery Daily Truck Demands and Daily General Traffic in Dallas County
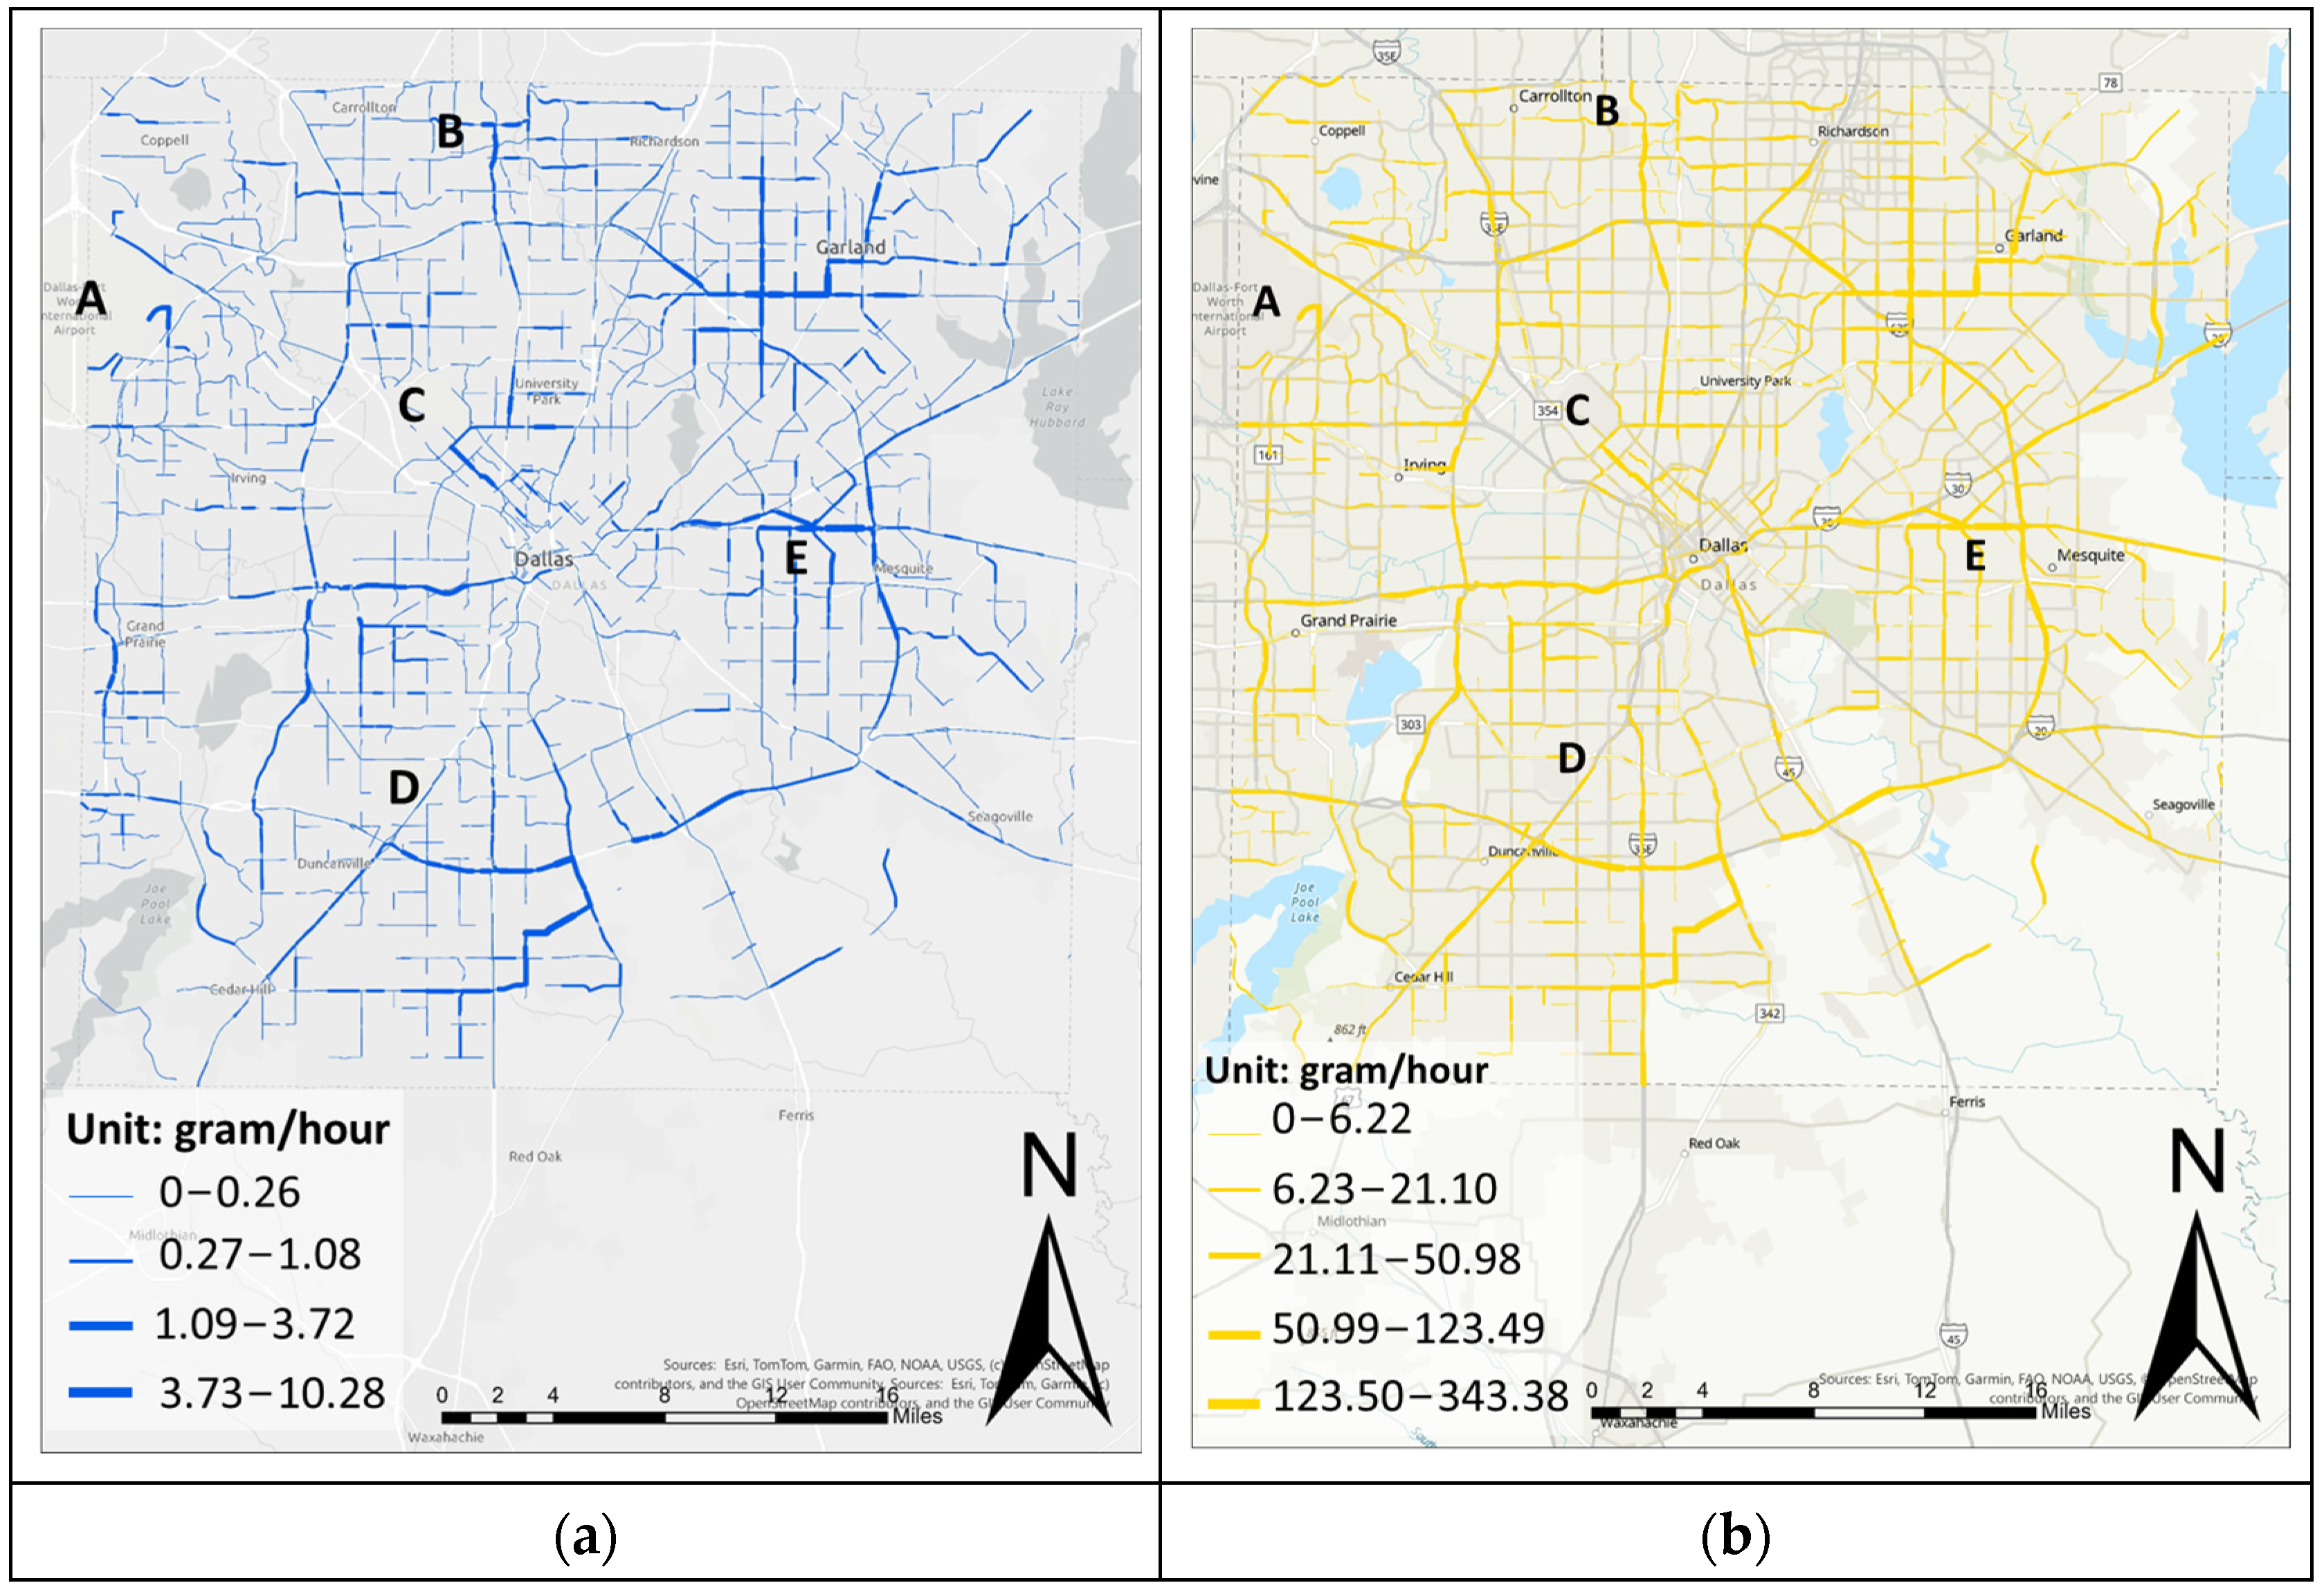
4.2. Last-Mile Truck Traffic and General Traffic Emissions
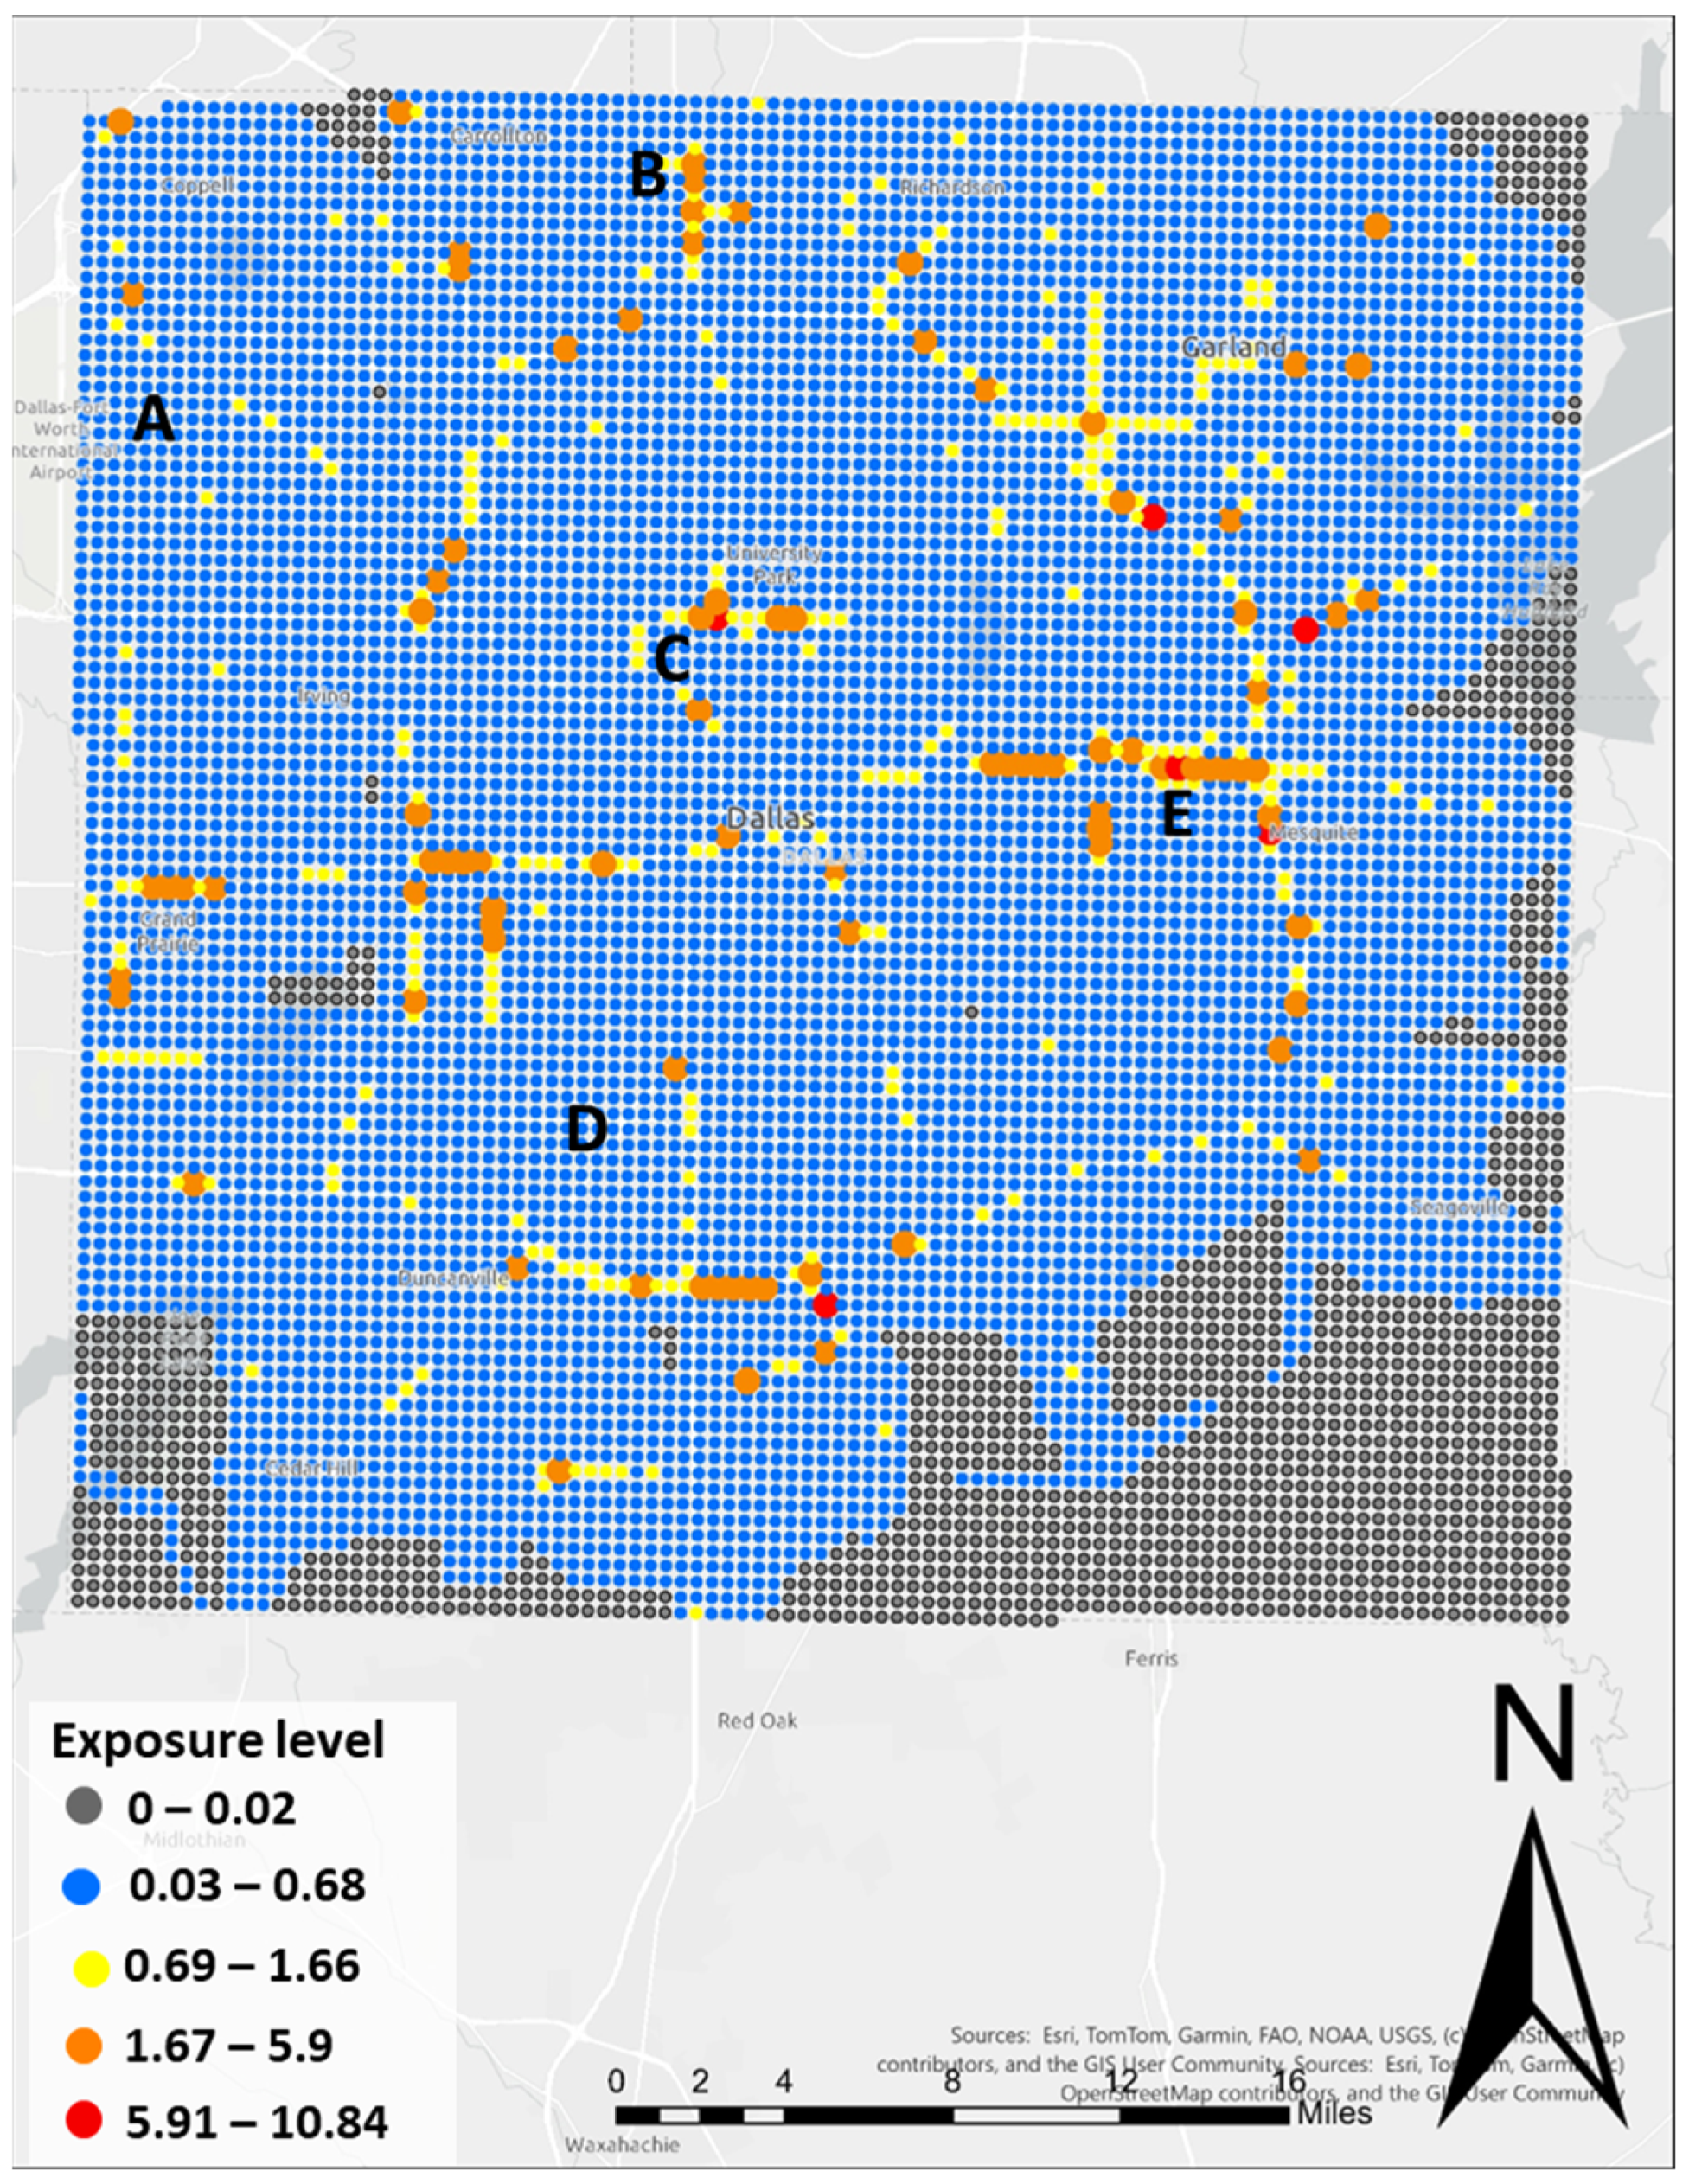
4.3. Emission Exposure Assessments
4.4. Health Impacts
4.5. Electrification Impact on Health and Sensitivity Analysis
5. Discussions and Conclusions
5.1. Discussions
5.2. Future Study
5.3. Limitation
Author Contributions
Funding
Institutional Review Board Statement
Informed Consent Statement
Data Availability Statement
Conflicts of Interest
References
- United States Census Bureau. Annual Retail Trade Survey: 2022. Available online: https://www.census.gov/data/tables/2022/econ/arts/annual-report.html (accessed on 23 April 2024).
- World Economic Forum. Pandemic, Parcels and Public Vaccination Envisioning the Next Normal for the Last-Mile Ecosystem; World Economic Forum: Cologny/Geneva, Switzerland, 2021. [Google Scholar]
- Allied Market Research. Last Mile Delivery Market by Service Type, by Vehicle Type, by Mode of Operation, by Delivery Mode, by Application, by Destination: Global Opportunity Analysis and Industry Forecast, 2021–2031; Allied Market Research: Pune, India, 2022. [Google Scholar]
- United States Environmental Protection Agency. Smog, Soot, and Other Air Pollution from Transportation. Available online: https://www.epa.gov/transportation-air-pollution-and-climate-change/smog-soot-and-other-air-pollution-transportation#:~:text=Air%20pollution%20emitted%20from%20transportation,volatile%20organic%20compounds%20(VOCs) (accessed on 3 September 2023).
- Li, C.; Managi, S. Contribution of On-Road Transportation to PM2.5. Sci. Rep. 2021, 11, 21320. [Google Scholar] [CrossRef] [PubMed]
- National Toxicology Program. NTP Monograph: Systematic Review of Traffic-Related Air Pollution and Hypertensive Disorders of Pregnancy; National Toxicology Program: Research Triangle Park, NC, USA, 2019. [Google Scholar]
- World Health Organization. WHO Global Air Quality Guidelines. Particulate Matter (PM2.5 and PM10), Ozone, Nitrogen Dioxide, Sulfur Dioxide and Carbon Monoxide; World Health Organization: Geneva, Switzerland, 2021. [Google Scholar]
- Lawton, G. The Environmental Challenges of Last-Mile Delivery. Available online: https://www.techtarget.com/searcherp/feature/The-environmental-challenges-of-last-mile-delivery#:~:text=Supply%20chain%20emissions%20make%20up%20typically%2090%25%20of,Neutral%2C%20a%20nonprofit%20organization%20located%20in%20San%20Francisco (accessed on 16 April 2023).
- Tonachel, L. Study: Electric Vehicles Can Dramatically Reduce Carbon Pollution from Transportation, and Improve Air Quality. Available online: https://www.nrdc.org/bio/luke-tonachel/study-electric-vehicles-can-dramatically-reduce-carbon-pollution-transportation#:~:text=As%20shown%20below%2C%20a%20PEV,the%20electricity%20grid%20carbon%20intensity (accessed on 7 June 2024).
- Peng, L.; Liu, F.; Zhou, M.; Li, M.; Zhang, Q.; Mauzerall, D.L. Alternative-Energy-Vehicles Deployment Delivers Climate, Air Quality, and Health Co-Benefits When Coupled with Decarbonizing Power Generation in China. One Earth 2021, 4, 1127–1140. [Google Scholar] [CrossRef]
- Grant, M.; D’ignazio, J.; Ang-Olson, J.; Chavis, A.; Gallivan, F.; Harris, M.; Rooney, K.; Silla, T.; Wallis, E.; Siwek, S. Assessing Mechanisms for Integrating Transportation-Related Greenhouse Gas Reduction Objectives into Transportation Decision Making; The National Academies Press: Washington, DC, USA, 2010. [Google Scholar]
- Yavari, A.; Bagha, H.; Korala, H.; Mirza, I.; Dia, H.; Scifleet, P.; Sargent, J.; Shafiei, M. ParcEMon: IoT Platform for Real-Time Parcel Level Last-Mile Delivery Greenhouse Gas Emissions Reporting and Management. Sensors 2022, 22, 7380. [Google Scholar] [CrossRef]
- Shahmohammadi, S.; Steinmann, Z.J.N.; Tambjerg, L.; Van Loon, P.; King, J.M.H.; Huijbregts, M.A.J. Comparative Greenhouse Gas Footprinting of Online versus Traditional Shopping for Fast-Moving Consumer Goods: A Stochastic Approach. Environ. Sci. Technol. 2020, 54, 3499–3509. [Google Scholar] [CrossRef]
- Lee, G.; You, S.I.; Ritchie, S.G.; Saphores, J.D.; Jayakrishnan, R.; Ogunseitan, O. Assessing Air Quality and Health Benefits of the Clean Truck Program in the Alameda Corridor, CA. Transp. Res. Part A Policy Pract. 2012, 46, 1177–1193. [Google Scholar] [CrossRef]
- Liu, H.; Xu, X.; Rodgers, M.O.; Xu, Y.A.; Guensler, R.L. MOVES-Matrix and Distributed Computing for Microscale Line Source Dispersion Analysis. J. Air Waste Manage Assoc. 2017, 67, 763–775. [Google Scholar] [CrossRef] [PubMed]
- Xu, Y.A.; Liu, H.; Rodgers, M.O.; Guin, A.; Hunter, M.; Sheikh, A.; Guensler, R. Understanding the Emission Impacts of High-Occupancy Vehicle (HOV) to High-Occupancy Toll (HOT) Lane Conversions: Experience from Atlanta, Georgia. J. Air Waste Manag. Assoc. 2017, 67, 910–922. [Google Scholar] [CrossRef] [PubMed]
- Li, L. Life Cycle Greenhouse Gas Emissions for Last-Mile Parcel Delivery by Automated Vehicles and Robots. Master’s Thesis, University of Michigan, Ann Arbor, MI, USA, 2021. [Google Scholar]
- Xu, X.; Liu, H.; Anderson, J.M.; Xu, Y.; Hunter, M.P.; Rodgers, M.O.; Guensler, R.L. Estimating Project-Level Vehicle Emissions with Vissim and MOVES-Matrix. Transp. Res. Rec. 2016, 2570, 107–117. [Google Scholar] [CrossRef]
- Tomar, G.; Nagpure, A.S.; Jain, Y.; Kumar, V. High-Resolution PM2.5 Emissions and Associated Health Impact Inequalities in an Indian District. Environ. Sci. Technol. 2023, 57, 2310–2321. [Google Scholar] [CrossRef]
- Chi, Y.; Zhang, Y.; Zhang, X.; Liu, B. Potential and Health Impact Assessment of Air Pollutant Emission Reduction: A Case Study of China. Clean Technol. Environ. Policy 2024, 27, 1053–1066. [Google Scholar] [CrossRef]
- Wangsa, I.D.; Wee, H.M.; Hsiao, Y.L.; Rizky, N. Identifying an Effective Last-Mile Customer Delivery Option with an Integrated Eco-Friendly Inventory Model. INFOR Inf. Syst. Oper. Res. 2022, 60, 165–200. [Google Scholar] [CrossRef]
- Fajardo-Calderin, J.; Masegosa, A.D.; Elejoste, M.P.; Moreno-Emborujo, A.; Cantero-Lopez, X.; Angulo, I. An Artificial Intelligence-Based Software Module for the Optimization of Collaborative Delivery in Last-Mile Logistics. In Proceedings of the 9th International Physical Internet Conference, Athens, Greece, 13–15 June 2023. [Google Scholar]
- Garus, A.; Alonso, B.; Raposo, M.A.; Grosso, M.; Krause, J.; Mourtzouchou, A.; Ciuffo, B. Last-Mile Delivery by Automated Droids. Sustainability Assessment on a Real-World Case Study. Sustain. Cities Soc. 2022, 79, 103728. [Google Scholar] [CrossRef]
- McLeod, F.N.; Cherrett, T.J.; Bektas, T.; Allen, J.; Martinez-Sykora, A.; Lamas-Fernandez, C.; Bates, O.; Cheliotis, K.; Friday, A.; Piecyk, M.; et al. Quantifying Environmental and Financial Benefits of Using Porters and Cycle Couriers for Last-Mile Parcel Delivery. Transp. Res. D Transp. Environ. 2020, 82, 102311. [Google Scholar] [CrossRef]
- Bienzeisler, L.; Wage, O.; Friedrich, B. Cutting Redundancy, Slashing Emissions: The Role of Consolidation for a Sustainable Last-Mile Delivery. In Proceedings of the FISTS 2024: 4th Forum for Innovative Sustainable Transportation Systems, Riverside, CA, USA, 26–28 February 2024; Institute of Electrical and Electronics Engineers Inc.: New York, NY, USA, 2024. [Google Scholar]
- Dong, B.; Hovi, I.B.; Pinchasik, D.R. Analysis of Service Efficiency of Parcel Locker in Last-Mile: A Case Study in Norway. Transp. Res. Procedia 2023, 69, 918–925. [Google Scholar] [CrossRef]
- Peppel, M.; Spinler, S.; Winkenbach, M. Integrating Mobile Parcel Lockers into Last-Mile Delivery Networks: An Operational Design for Home Delivery, Stationary, and Mobile Parcel Lockers. Int. J. Phys. Distrib. Logist. Manag. 2024, 54, 418–447. [Google Scholar] [CrossRef]
- Pennington, A.F.; Cornwell, C.R.; Sircar, K.D.; Mirabelli, M.C. Electric Vehicles and Health: A Scoping Review. Environ. Res. 2024, 251, 118697. [Google Scholar] [CrossRef]
- Calatayud, V.; Diéguez, J.J.; Agathokleous, E.; Sicard, P. Machine Learning Model to Predict Vehicle Electrification Impacts on Urban Air Quality and Related Human Health Effects. Environ. Res. 2023, 228, 115835. [Google Scholar] [CrossRef]
- Cárdenas, I.; Beckers, J.; Vanelslander, T. E-Commerce Last-Mile in Belgium: Developing an External Cost Delivery Index. Res. Transp. Bus. Manag. 2017, 24, 123–129. [Google Scholar] [CrossRef]
- Choma, E.F.; Evans, J.S.; Hammitt, J.K.; Gómez-Ibáñez, J.A.; Spengler, J.D. Assessing the Health Impacts of Electric Vehicles through Air Pollution in the United States. Environ. Int. 2020, 144, 106015. [Google Scholar] [CrossRef]
- Filigrana, P.; Levy, J.I.; Gauthier, J.; Batterman, S.; Adar, S.D. Health Benefits from Cleaner Vehicles and Increased Active Transportation in Seattle, Washington. J. Expo. Sci. Environ. Epidemiol. 2022, 32, 538–544. [Google Scholar] [CrossRef]
- Ma, C.; Madaniyazi, L.; Xie, Y. Impact of the Electric Vehicle Policies on Environment and Health in the Beijing–Tianjin–Hebei Region. Int. J. Environ. Res. Public Health 2021, 18, 623. [Google Scholar] [CrossRef] [PubMed]
- Pan, S.; Yu, W.; Fulton, L.M.; Jung, J.; Choi, Y.; Gao, H.O. Impacts of the Large-Scale Use of Passenger Electric Vehicles on Public Health in 30 US. Metropolitan Areas. Renew. Sustain. Energy Rev. 2023, 173, 113100. [Google Scholar] [CrossRef]
- Hennessy, E.M.; Scown, C.D.; Azevedo, I.M.L. The Health, Climate, and Equity Benefits of Freight Truck Electrification in the United States. Environ. Res. Lett. 2024, 19, 104069. [Google Scholar] [CrossRef]
- Cai, X.; Zheng, S.; Zhang, X.; Ye, Z.; Liu, C.; Tan, Z. The Impact of CO2 Emission Synergy on PM2.5 Emissions and a Dynamic Analysis of Health and Economic Benefits: A Case Study of China’s Transportation Industry. J. Clean. Prod. 2024, 471, 143405. [Google Scholar] [CrossRef]
- Figliozzi, M.; Unnikrishnan, A. Home-Deliveries before-during COVID-19 Lockdown: Accessibility, Environmental Justice, Equity, and Policy Implications. Transp. Res. D Transp. Environ. 2021, 93, 102760. [Google Scholar] [CrossRef]
- Wang, X.C.; Zhou, Y. Deliveries to Residential Units: A Rising Form of Freight Transportation in the U.S. Transp. Res. Part C Emerg. Technol. 2015, 58, 46–55. [Google Scholar] [CrossRef]
- Pratt, G.C.; Vadali, M.L.; Kvale, D.L.; Ellickson, K.M. Traffic, Air Pollution, Minority and Socio-Economic Status: Addressing Inequities in Exposure and Risk. Int. J. Environ. Res. Public Health 2015, 12, 5355–5372. [Google Scholar] [CrossRef]
- Houston, D.; Li, W.; Wu, J. Disparities in Exposure to Automobile and Truck Traffic and Vehicle Emissions near the Los Angeles-Long Beach Port Complex. Am. J. Public Health 2014, 104, 156–164. [Google Scholar] [CrossRef]
- Demetillo, M.A.G.; Navarro, A.; Knowles, K.K.; Fields, K.P.; Geddes, J.A.; Nowlan, C.R.; Janz, S.J.; Judd, L.M.; Al-Saadi, J.; Sun, K.; et al. Observing Nitrogen Dioxide Air Pollution Inequality Using High-Spatial-Resolution Remote Sensing Measurements in Houston, Texas. Environ. Sci. Technol. 2020, 54, 9882–9895. [Google Scholar] [CrossRef]
- Kane, E.J. Evaluating Equity in Transportation Greenhouse Gas Emission Reduction Strategies in Local Climate Action Planning in Oakland, California. Master’s Thesis, University of San Francisco, San Francisco, CA, USA, 2022. [Google Scholar]
- Arabi, M.; Hyun, K.; Mattingly, S.P.; Imran, M.A. Post-Pandemic Last-Mile and Shopping Center Trip Estimations Using Scenario Analysis. In Proceedings of the Transportation Research Board Annual Meeting, Washington, DC, USA, 8–12 January 2023. [Google Scholar]
- StreetLight Data, Inc. StreetLight InSight® Metrics: Methodology and Data Sources; StreetLight Data, Inc.: San Francisco, CA, USA, 2018. [Google Scholar]
- Texas Department of Transportation 2019 Roadway Inventory. Available online: https://www.txdot.gov/inside-txdot/division/transportation-planning/roadway-inventory.html (accessed on 28 July 2023).
- Ramirez-Sanchez, E.; Tang, C.; Xu, Y.; Renganathan, N.; Jayawardana, V.; He, Z.; Wu, C. NeuralMOVES: A Lightweight and Microscopic Vehicle Emission Estimation Model Based on Reverse Engineering and Surrogate Learning. arXiv 2025, arXiv:2502.04417. [Google Scholar]
- Zhao, Y.; Sadeka, A.W. Computationally-Efficient Approaches to Integrating the MOVES Emissions Model with Traffic Simulators. In Proceedings of the Procedia Computer Science, Barcelona, Spain, 5–7 June 2013; Elsevier, B.V.: Amsterdam, The Netherlands, 2013; Volume 19, pp. 882–887. [Google Scholar]
- Guensler, A.; Liu, R.; Xu, H. MOVES-Matrix for High-Performance Emission Rate Model Applications; National Center for Sustainable Transportation: Davis, CA, USA, 2018. [Google Scholar]
- United States Environmental Protection Agency. MOVES2014a User Guide; United States Environmental Protection Agency: Washington, DC, USA, 2015.
- Texas Commission on Environmental Quality. Air Quality Modeling Guidelines; Texas Commission on Environmental Quality: Austin, TX, USA, 2019.
- United States Environmental Protection Agency. User’s Guide for the AERMOD Meteorological Preprocessor (AERMET); United States Environmental Protection Agency: Washington, DC, USA, 2022.
- Kim, D.; Liu, H.; Rodgers, M.O.; Guensler, R. Development of Roadway Link Screening Model for Regional-Level near-Road Air Quality Analysis: A Case Study for Particulate Matter. Atmos. Environ. 2020, 237, 117677. [Google Scholar] [CrossRef]
- Kim, D.; Liu, H.; Xu, X.; Lu, H.; Wayson, R.; Rodgers, M.O.; Guensler, R. Distributed Computing for Region-Wide Line Source Dispersion Modeling. Comput.-Aided Civ. Infrastruct. Eng. 2021, 36, 331–345. [Google Scholar] [CrossRef]
- Zou, B.; Wilson, J.G.; Zhan, F.B.; Zeng, Y. An Emission-Weighted Proximity Model for Air Pollution Exposure Assessment. Sci. Total Environ. 2009, 407, 4939–4945. [Google Scholar] [CrossRef]
- United States Environmental Protection Agency. Environmental Benefits Mapping and Analysis Program-Community Edition User’s Manual; United States Environmental Protection Agency: Washington, DC, USA, 2022.
- Barua, L.; Zou, B.; Zhou, Y.; Liu, Y. Modeling Household Online Shopping Demand in the U.S.: A Machine Learning Approach and Comparative Investigation between 2009 and 2017. Transportation 2023, 50, 437–476. [Google Scholar] [CrossRef]
- Giuliano, G. The Challenges of Freight Transport in Cities. In Handbook on City Logistics and Urban Freight; Edward Elgar Publishing: Cheltenham, UK, 2023. [Google Scholar]
- Krishnamurthy, S.; Suppiah, S. A Study to Explore Behavioral Dynamics and Expectations of the Elderly People from Last Mile Delivery Services. In HCI International 2021—Posters, Proceedings of the 23rd HCI International Conference, Virtual, 24–29 July 2021; Filipe, J., Ghosh, A., Prates, R.O., Zhou, L., Eds.; Springer International Publishing: Cham, Switzerland, 2021. [Google Scholar]
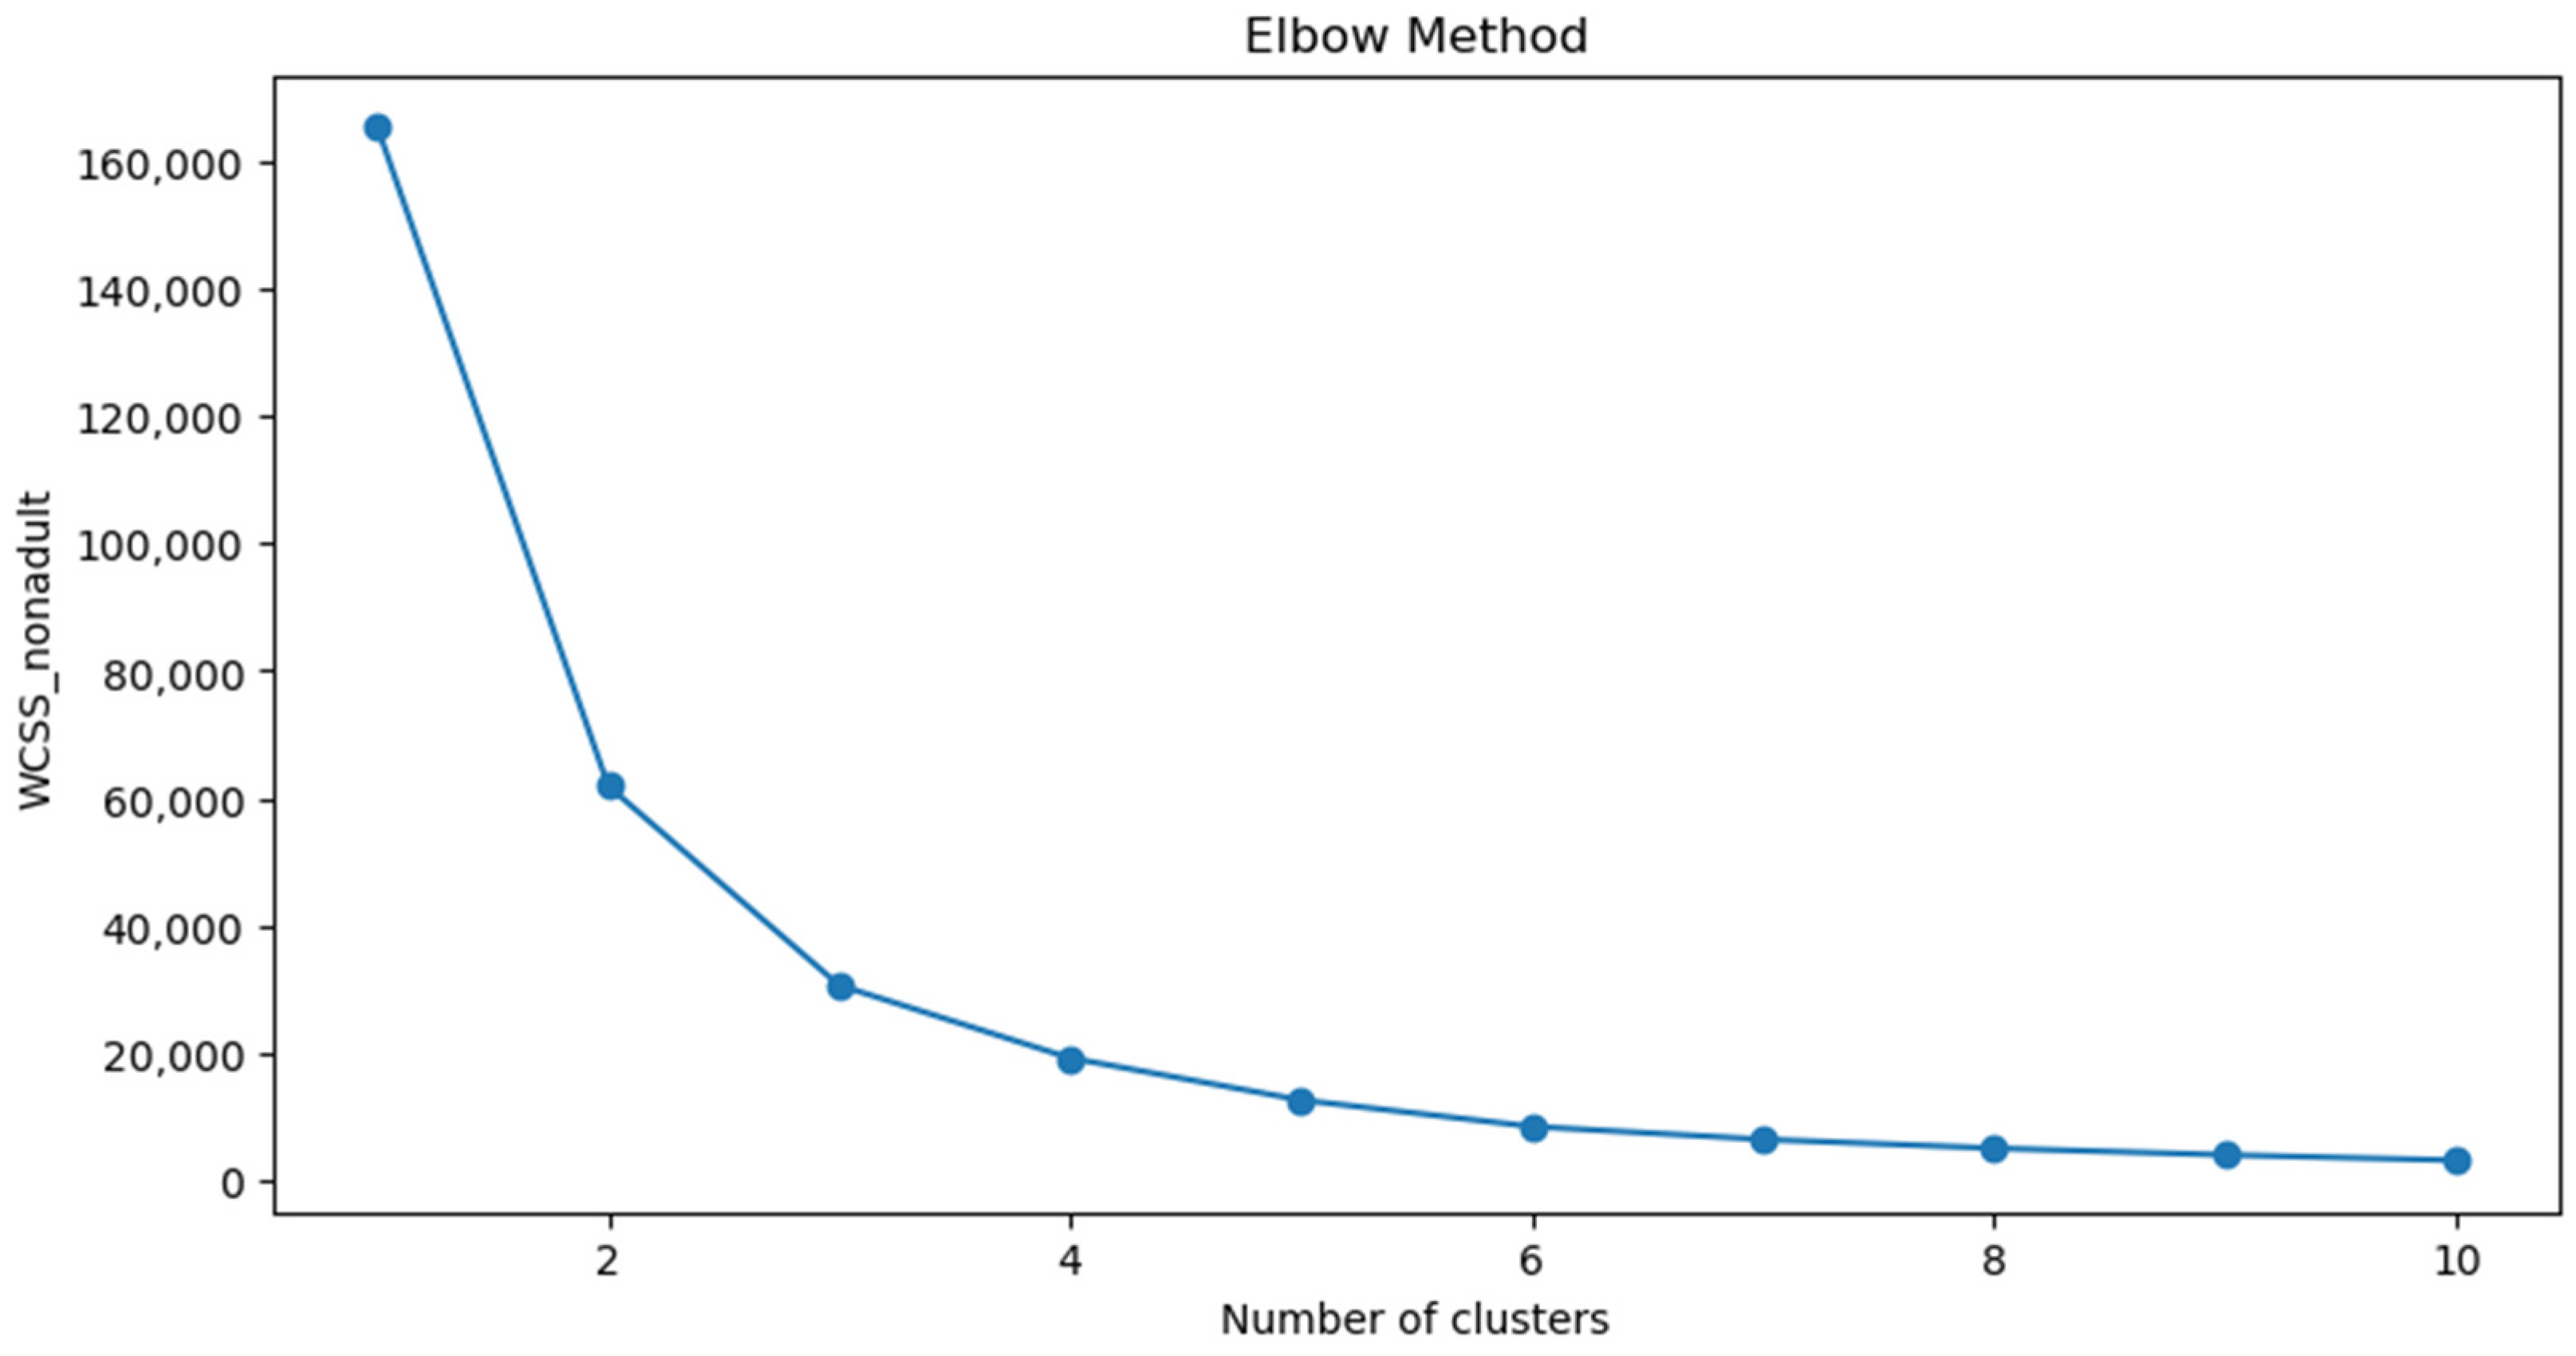
- Syakur, M.A.; Khotimah, B.K.; Rochman, E.M.S.; Satoto, B.D. Integration K-Means Clustering Method and Elbow Method for Identification of the Best Customer Profile Cluster. In Proceedings of the IOP Conference Series: Materials Science and Engineering, Bali, Indonesia, 16–17 April 2018; Institute of Physics Publishing: Bristol, UK, 2018; Volume 336. [Google Scholar]
- Texas Department of Transportation. The Statewide Long-Range Transportation Plan 2035; Texas Department of Transportation: Austin, TX, USA, 2010.
- Texas Commission on Environmental Quality. Meteorological Data for Refined Screening with AERMOD. Available online: https://www.tceq.texas.gov/permitting/air/modeling/aermod-datasets.html (accessed on 16 April 2023).
- Ledley, T.S. Energy Balance Model, Surface. Encycl. Atmos. Sci. 2003, 747–754. [Google Scholar]
- Center for Multiscale Modeling of Atmospheric Processes. Climate. Available online: https://hogback.atmos.colostate.edu/cmmap/learn/climate/energy4.html#:~:text=So%2C%20a%20positive%20latent%20heat,the%20atmosphere%20to%20the%20surface (accessed on 24 February 2024).
- Garimella, S. Condensation in Minichannels and Microchannels. In Heat Transfer and Fluid Flow in Minichannels and Microchannels; Elsevier Science: Amsterdam, The Netherlands, 2014. [Google Scholar]
- National Weather Service. Pressure Definitions; National Weather Service: Silver Spring, MD, USA, 2023. [Google Scholar]
- Cui, M. Introduction to the K-Means Clustering Algorithm Based on the Elbow Method. Account. Audit. Financ. 2020, 1, 5–8. [Google Scholar] [CrossRef]
- Reiffer, A.; Kübler, J.; Briem, L.; Kagerbauer, M.; Vortisch, P. Analysing Long-Term Effects of the COVID-19 Pandemic on Last-Mile Delivery Traffic Using an Agent-Based Travel Demand Model. In Proceedings of the 12th International Scientific Conference on Mobility and Transport, Singapore, 5–7 April 2022; Antoniou, C., Rau, A., Busch, F., Hariharan, M., Eds.; Springer: Berlin/Heidelberg, Germany, 2023. [Google Scholar]
- Miller, A.; Wang, M.; Fulton, Q. Spatial Scenarios for Market Penetration of Plug-in Battery Electric Trucks; National Renewable Energy Laboratory: Golden, CO, USA, 2022.
- United States Department of Transportation. Departmental Guidance on Valuation of a Statistical Life in Economic Analysis. Available online: https://www.transportation.gov/office-policy/transportation-policy/revised-departmental-guidance-on-valuation-of-a-statistical-life-in-economic-analysis (accessed on 27 March 2025).
- Giuliano, G.; Fang, J.; Binder, R.B.; Ha, J.; Holmes, A. Travel Behavior in E-Commerce: Shopping, Purchasing, and Receiving; METRANS Transportation Center (Calif.): Los Angeles, CA, USA; National Center for Sustainable Transportation (NCST) (UTC): Davis, CA, USA, 2022. [Google Scholar] [CrossRef]
- PYMNTS. High-Income Consumers Shop Online 40% More Than Low-Income. Available online: https://www.pymnts.com/news/ecommerce/2024/high-income-consumers-shop-online-40percent-more-than-low/#:~:text=High%2DIncome%20Consumers%20Shop%20Online%2040%%20More%20Than%20Low%2DIncome.&text=Additionally%2C%20the%20study%20%E2%80%9CThe%20Online%20Features%20Driving,to%20want%20to%20buy%20directly%20from%20brands (accessed on 25 March 2025).
- Feger, A. Discover In-Store, Buy Online: How High-Income Consumers Shop. Available online: https://www.emarketer.com/content/discover-in-store--buy-online--how-high-income-consumers-shop (accessed on 24 March 2025).
- Rincon-Garcia, N.; Waterson, B.; Cherrett, T.J.; Salazar-Arrieta, F. A Metaheuristic for the Time-Dependent Vehicle Routing Problem Considering Driving Hours Regulations—An Application in City Logistics. Transp. Res. Part A Policy Pract. 2020, 137, 429–446. [Google Scholar] [CrossRef]
- Bonomi, V.; Mansini, R.; Zanotti, R. Last Mile Delivery with Parcel Lockers: Evaluating the Environmental Impact of Eco-Conscious Consumer Behavior. IFAC-PapersOnLine 2022, 55, 72–77. [Google Scholar] [CrossRef]
- Trott, M.; Baur, N.F.; Auf der Landwehr, M.; Rieck, J.; von Viebahn, C. Evaluating the Role of Commercial Parking Bays for Urban Stakeholders on Last-Mile Deliveries—A Consideration of Various Sustainability Aspects. J. Clean. Prod. 2021, 312, 127462. [Google Scholar] [CrossRef]
- Bányai, T. Impact of the Integration of First-Mile and Last-Mile Drone-Based Operations from Trucks on Energy Efficiency and the Environment. Drones 2022, 6, 249. [Google Scholar] [CrossRef]
- Nguyen, Q.T.; Patrix, J.; Oulmakki, O.; Ramirez-Rios, D.G.; Verny, J. Estimating Costs and CO2 Emissions for Last Mile Delivery of Groceries in Paris Using Alternative Modes and Routing Strategies. Int. J. Logist. Res. Appl. 2023, 27, 2325–2350. [Google Scholar] [CrossRef]
- Institute for Health Metrics and Evaluation. US Health Map. Available online: https://vizhub.healthdata.org/subnational/usa (accessed on 24 April 2023).


| Type | Input Data | Description |
|---|---|---|
| Vehicle Characteristics | Vehicle classification (vehicle composition) | Passenger cars, trucks, buses Rolling resistance |
| Fuel type | Gasoline, diesel, electric, alternative fuels | |
| Vehicle age distribution | Engine wear, technology types | |
| Driving Behavior (operating mode distribution) | Speed, acceleration | Second-by-second speed, acceleration profiles |
| Regional type | Urban, rural | |
| Restricted or unrestricted | Stop-and-go (unrestricted), highway cruising (restricted) | |
| Geometry Information | Slope | Road gradient |
| Meteorology and Time | Temperature and relative humidity, hour and month | Air conditioning usage |
| Type | Input Data | Description |
|---|---|---|
| Link source | Emissions rates on a link | Emissions |
| Coordinates of starting and ending points, number of lanes, geometry information, average vertical dispersion | Link information (location, roadway geometry, average height of vehicles’ tailpipes) | |
| Meteorological source | Wind speed, wind direction, temperature, precipitation amount, precipitation type, relative humidity, station pressure | Output from the AERMOD Meteorological Preprocessor (AERMET) |
| Receptor source | Receptor coordinates | X coordinate, Y coordinate, Z coordinate |
| Type | Input Data | Description |
|---|---|---|
| Incidence/prevalence rate | Incidence rates | Morbidity rates or mortality rates |
| Population | Population | Number of racial populations |
| Health impact function | Incidence function | Incidence (i.e., diseases) function |
| Air quality | Exposure levels | Exposure levels |
| Description | Min | Max | Mean | Standard Deviation |
|---|---|---|---|---|
| Hourly temperature (K) | 269.2 | 313.1 | 292.71 | 9.19 |
| Hourly relative humidity (%) | 13 | 100 | 65.65 | 21.21 |
| Sensible heat flux (W/m2) | −64 | 61.7 | −11.00 | 38.09 |
| Surface friction velocity (m/s) | 0.09 | 2.07 | 0.70 | 0.30 |
| Wind speed (m/s) | 0.69 | 14.08 | 4.99 | 2.14 |
| Wind direction (degrees) | 1 | 360 | 169.08 | 96.67 |
| Station pressure (mb) | 977 | 1019 | 994.66 | 6.06 |
| Variable | Socio-Economic Variable Range | Average Emissions (g/hour/Block Group) | Sample Size | ||
|---|---|---|---|---|---|
| Minimum | Maximum | ||||
| Seniors (%) | Low | 0 | 11.62 | 43.66 | 408 |
| Medium | 11.65 | 26.2 | 43.28 | 620 | |
| High | 26.31 | 62.57 | 39.79 | 457 | |
| Nonadults (%) | Low | 0.46 | 17.85 | 39.27 | 851 |
| Medium | 17.87 | 31.11 | 44.60 | 485 | |
| High | 31.13 | 59.43 | 44.69 | 149 | |
| Non-white (%) | Low | 0 | 35.95 | 46.18 | 408 |
| Medium | 36.08 | 65.32 | 60.09 | 620 | |
| High | 65.42 | 100 | 68.84 | 457 | |
| No vehicles (%) | Low | 0 | 6.88 | 43.00 | 1025 |
| Medium | 6.94 | 20.57 | 43.05 | 344 | |
| High | 20.66 | 70.38 | 46.21 | 116 | |
| No employment (%) | Low | 0 | 17.44 | 61.18 | 577 |
| Medium | 17.48 | 31.68 | 59.32 | 664 | |
| High | 31.79 | 76.69 | 57.05 | 244 | |
| Median household income (USD) | Low | 0 | 75,865 | 44.69 | 851 |
| Medium | 76,153 | 149,432 | 43.11 | 485 | |
| High | 150,408 | 250,001 | 35.58 | 149 | |
| Electrified Scenario | Last-Mile Delivery Trucks (Percent) | All Trucks | General Traffic |
|---|---|---|---|
| 2% | 11 (0.71%) | 229 (14.76%) | 1236 (79.69%) |
| 10% | 44 (2.84%) | 812 (52.35%) | 1533 (98.84%) |
| 30% | 152 (9.8%) | 1504 (96.97%) | 1549 (99.87%) |
Disclaimer/Publisher’s Note: The statements, opinions and data contained in all publications are solely those of the individual author(s) and contributor(s) and not of MDPI and/or the editor(s). MDPI and/or the editor(s) disclaim responsibility for any injury to people or property resulting from any ideas, methods, instructions or products referred to in the content. |
© 2025 by the authors. Licensee MDPI, Basel, Switzerland. This article is an open access article distributed under the terms and conditions of the Creative Commons Attribution (CC BY) license (https://creativecommons.org/licenses/by/4.0/).
Share and Cite
Choi, J.; Hyun, K. The Impact of Last-Mile Delivery Fleet Electrification on Emissions, Dispersion, and Health: An Environmental Justice Analysis Based on Dallas County, Texas. Sustainability 2025, 17, 3718. https://doi.org/10.3390/su17083718
Choi J, Hyun K. The Impact of Last-Mile Delivery Fleet Electrification on Emissions, Dispersion, and Health: An Environmental Justice Analysis Based on Dallas County, Texas. Sustainability. 2025; 17(8):3718. https://doi.org/10.3390/su17083718
Chicago/Turabian StyleChoi, Jaesik, and Kate Hyun. 2025. "The Impact of Last-Mile Delivery Fleet Electrification on Emissions, Dispersion, and Health: An Environmental Justice Analysis Based on Dallas County, Texas" Sustainability 17, no. 8: 3718. https://doi.org/10.3390/su17083718
APA StyleChoi, J., & Hyun, K. (2025). The Impact of Last-Mile Delivery Fleet Electrification on Emissions, Dispersion, and Health: An Environmental Justice Analysis Based on Dallas County, Texas. Sustainability, 17(8), 3718. https://doi.org/10.3390/su17083718