Abstract
This study examined the effect of effluent recirculation on the performance of an anaerobic baffled reactor (ABR) in treating municipal wastewater under mesophilic steady-state conditions. Although effluent recirculation is proposed to enhance ABRs’ performance, its benefits remain inconclusive, highly dependent on wastewater characteristics, and inadequately understood during steady-state conditions. Utilizing the GPS-X computer application, an innovative modeling and simulation approach was employed to evaluate an ABR’s performance in removing chemical oxygen demand (COD) and total suspended solids (TSS). Sensitivity analysis was utilized to refine critical stoichiometric, kinetic, and operational parameters for precise model calibration and validation, thus enhancing the model accuracy. The average absolute relative error (ARE) and Thiel inequality coefficient (TIC) were employed for model calibration and validation. The effect of effluent recirculation on the treatment behavior of the reactor was investigated through model predictions, considering recirculation ratios of 10%, 20%, and 30%. The results showed that effluent recirculation had a limited effect on ABR performance at HRTs of 24, 18, and 12 h, with COD removal efficiency (RE) improving by up to 2.1%, and TSS RE by up to 5.7%. However, at an HRT of 8 h, COD RE declined from 65% (no recirculation) to 61.6% at a 30% recirculation ratio, while TSS RE slightly improved at 10% but decreased by 4.1% at 30%. This study concluded that, under mesophilic conditions, effluent recirculation may not be an effective strategy for improving ABR performance in municipal wastewater treatment, potentially increasing operational costs due to an increase in energy consumption for effluent recirculation.
1. Introduction
Municipal wastewater generation exceeds 400 billion cubic meters annually, with 171 billion cubic meters being discharged untreated, particularly in low-income countries, posing severe environmental and public health risks [1,2,3]. Conventional centralized treatment systems, although effective, are often impractical due to high costs and infrastructure demands [4,5]. Decentralized treatment solutions offer a more viable alternative, with anaerobic baffled reactors (ABRs) emerging as a cost-effective, low-energy option for municipal wastewater treatment [6,7]. ABRs enhance biodegradation efficiency while minimizing sludge production and operational complexity [8,9]. An important consideration of sludge blanket reactors is the potential to segregate the solids retention time from the hydraulic retention time, which can influence the system stability and overall treatment performance. However, their effluent quality often falls short of discharge standards, necessitating further research to optimize performance and improve treatment effectiveness [10].
Effluent recirculation is considered to be an effective strategy to improve the treatment efficiency of ABRs [11]. Aris et al. (2016) [12] investigated the influence of effluent circulation on the treatment efficacy of a modified anaerobic baffled reactor (MABR) during the start-up phase. Their findings revealed that effluent recirculation significantly enhanced the treatment performance of the reactor, achieving a COD removal efficiency of 95.7% at a circulation ratio of 2.0. This study signified the effect of effluent recirculation on the treatment performance of the MABR during the start-up phase; however, the effect of effluent recirculation on ABR performance during steady-state conditions is inadequately understood [12]. The benefits of effluent recirculation in baffled reactors are inconclusive and highly dependent on the specific characteristics of the wastewater being treated [13]. These effects are complex due to the complicated biochemical processes involving distinct microbial communities at various stages, such as hydrolysis, acidogenesis, acetogenesis, and methanogenesis [14]. The phase separation characteristics of ABRs enable these microorganisms to develop under optimal conditions along the length of the reactor [15]. However, effluent recirculation can disrupt this phase separation, with its impact being influenced by wastewater characteristics such as pH, total suspended solids (TSS), and COD. Variations in these parameters can alter microbial activity, affect substrate availability, and modify the reactor’s performance, thereby complicating the assessment of ABR treatment efficiency. As a result, the overall performance of ABR systems is influenced by substantial uncertainties, particularly regarding the effect of effluent recirculation under varying operational conditions. This highlights a critical research gap requiring further investigation to elucidate the effect of recirculation on treatment efficiency and process stability, particularly during steady-state operation at reduced HRTs.
To address these uncertainties, model simulations offer effective tools to optimize complex treatment processes involving biological mechanisms, thereby reducing the experimental requirements, cost, time, and associated risks [16,17]. Recently, machine learning and artificial neural networks have been employed to predict the performance of various full-scale wastewater treatment plants [18,19]. While these approaches can effectively identify patterns in historical data, they often function as black-box models, meaning that their internal decision-making processes are not easily interpretable. In contrast, process-based modeling applications such as BioWin, GPS-X, and STOAT provide a mechanistic understanding of wastewater treatment processes by utilizing fundamental biochemical and physical equations [16].
These computer applications are widely used because they are user-friendly, offering graphical interfaces, predefined process units, and built-in simulation tools that allow users to easily modify system parameters, visualize treatment performance, and analyze different operational scenarios. Unlike machine learning models, which require extensive data processing, algorithm selection, and complex training processes, process-based models allow for the direct input of known treatment parameters, making them more accessible to wastewater engineers and operators. Their ease of use and their ability to perform scenario-based simulations make these computer applications a more practical choice for wastewater treatment optimization and control.
The practicality of these process-based modeling applications is further demonstrated in previous studies. For instance, Li et al. (2016) [20] employed the BioWin computer application to model and simulate a modified anaerobic baffled reactor (MABR). The study aimed to identify the optimal HRT to enhance the reactor’s hydraulic performance, considering factors such as mixing patterns and dead spaces. This highlights the capability of such modeling tools to provide valuable insights for system optimization, reinforcing their applicability in wastewater treatment studies.
Recently, GPS-X has gained substantial significance due to its diverse default treatment process units, user-friendly interface, and extensive availability of training materials. Its advanced modeling capabilities allow for the simulation of complex biological, chemical, and physical processes, making it a powerful tool for evaluating and optimizing wastewater treatment systems. The selection of GPS-X for this study was driven by its ability to accurately simulate anaerobic treatment processes, including those occurring in ABRs, which are inherently dynamic and influenced by multiple interacting factors, including sludge retention, hydraulic retention time (HRT), and microbial activity [21]. For instance, Nasr et al. (2011) [22] simulated a sequencing batch reactor (SBR) with six scenarios using GPS-X, highlighting its ability to assess system performance under varying operational conditions in real-scale wastewater treatment systems. The simulation successfully lowered the effluent TN concentration from 13.04 to 8.27 mg/L without any significant effects on the COD, TP, and ammonia nitrogen removal performance of the reactor. Likewise, Mu’azu et al. (2020) [23] utilized GPS-X to model the activated sludge process for optimizing sludge management. Their findings indicated that waste activated sludge (WAS) had a greater influence on effluent quality compared to recycled activated sludge (RAS). Notable performance enhancement was achieved by increasing the WAS from 3000 to 9000 m3/day.
While GPS-X has been crucial for simulating and optimizing full-scale wastewater treatment systems, there remains a gap in utilizing the existing computational software to simulate COD and TSS removal in ABRs for municipal wastewater under steady-state mesophilic conditions, especially at HRTs ranging from 24 to 8 h. In particular, the effect of effluent recirculation on the treatment performance of ABRs at these HRTs has not been thoroughly explored. Developing reliable models to simulate this effect is crucial for optimizing reactor performance, predicting treatment efficiency, and enhancing the practical applicability of ABRs in real-world wastewater treatment scenarios.
In this study, the GPS-X software application (version 8.0) was employed to model and simulate ABR performance for COD and TSS removal under steady-state flow conditions. A comprehensive 240-day bench-scale experimental study was conducted to evaluate the model’s accuracy and reliability. The experimental results were compared with simulated outcomes, and the calibrated model was subsequently used to predict the impact of effluent recirculation on ABR treatment performance. This approach advances predictive modeling in wastewater treatment by addressing the knowledge gap regarding the effect of effluent recirculation. The novelty of this study is in its unique and precise modeling and simulation, offering insights into COD and TSS removal efficiency. The key objectives were (i) to evaluate the ABR’s performance under mesophilic steady-state conditions through experimentation, (ii) to model and simulate COD and TSS removal at 35 °C, and (iii) to predict the effect of effluent recirculation on ABR treatment efficiency at different recirculation ratios (10%, 20%, and 30%).
2. Materials and Methods
2.1. Apparatus
The ABR used in this study was made of an 8 mm thick acrylic sheet with six equal sequential compartments, with a total working volume of 24 L. The ABR had a rectangular configuration with six equally sized compartments. Each upflow chamber measured 75 mm in width. For downward flow within each compartment, three parallel high-density polyethylene (HDPE) pipes, each with a 25 mm diameter, were installed. The outlets of these pipes were positioned 75 mm above the reactor’s base. The ABR’s inlet and outlet were set at heights of 305 mm and 280 mm from the bottom, respectively. Sampling ports were placed 200 mm above the base in each compartment, while two ports were designated for biogas collection. Water jacketing, along with a heating control system, was provided around the reactor to maintain mesophilic conditions (35 ± 1 °C) within the reactor. A peristaltic pump was used to feed synthetic wastewater to the reactor, with organic loading rates (OLRs) corresponding to HRTs of 24, 18, 12 and 8 h. A schematic diagram of the experimental setup is presented in Figure 1.
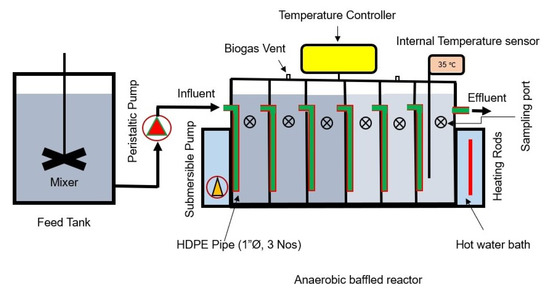
Figure 1.
Schematic diagram of experimental setup.
2.2. Wastewater Composition
The synthetic wastewater used in this experiment had a COD concentration of 414.5 ± 36.5 mg/L [24]. It exhibited a low concentration of solids, with TSS of 50 ± 3.1 mg/L, inorganic suspended solids at 40.4 ± 2 mg/L, and volatile suspended solids (VSS) at 10.2 ± 1 mg/L. The VSS to TSS ratio was 0.20.
2.3. Inoculum and Seeding
The inoculum was prepared by thoroughly blending equal parts of sludge and fresh cow dung. The sludge was sourced from a wetland located at the NUST main campus in Islamabad, Pakistan, which functions as a municipal wastewater treatment facility for the campus and its associated residential areas [25]. Fresh cow dung was obtained from the H-13 sector in Islamabad. Following proper mixing, the inoculum was used to fill 30% of the reactor’s volume to promote a diverse microbial community essential for ABR start-up. The remaining volume was then filled with synthetic wastewater.
2.4. Sampling and Analysis
The influent and effluent samples were taken twice a week and analyzed for various parameters, including volatile fatty acids (VFAs), alkalinity, COD, TSS, oxidation–reduction potential (ORP), and pH, in accordance with standard methods [26]. Alkalinity and VFAs were determined via standard titration techniques. COD and TSS were assessed using the closed reflux and gravimetric methods, respectively. ORP and pH were measured with a multimeter (HANNA, model-8521, Woonsocket, RI, USA).
2.5. Operation of the ABR
Operation of ABR was carried out in two phases, i.e., a start-up phase and a continuous-flow phase, as depicted in Table 1.

Table 1.
Operational conditions of the ABR.
The start-up phase was conducted in batch mode for 90 days to allow for microbial acclimatization and the development of pollutant removal conditions in the shortest possible time [27]. A water jacket was used to maintain mesophilic conditions. After adding the inoculum and wastewater, the reactors remained undisturbed for 15 days to allow for sludge adaptation. To regulate the pH within acceptable limits, the reactor contents were recirculated once a week using a peristaltic pump, with a volume equal to that of the reactor. Key parameters such as COD, pH, and oxidation–reduction potential (ORP) were routinely monitored.
Following a 90-day start-up phase, during which the microbial communities in the reactor acclimatized, the reactor was switched to continuous-flow mode and operated successively at HRTs of 24, 18, 12, and 8 h. The influent flow rate varied from 1.0 L per hour to 3.0 L per hour in changing the HRT from 24 h to 8 h. The operation times at these HRTs were 46, 37, 32, and 32 days, respectively. At each HRT, the reactor was operated until steady-state conditions were attained, characterized by a variation in COD RE within the range of 3% over a continuous period of 10 days [28]. The reactor was then shifted to the next lower HRT. The ABR was operated without effluent recirculation.
2.6. Modeling
Initially, modeling of the ABR was carried out to depict the actual experimental conditions under steady-state conditions with effluent recirculation. Upon successful model calibration and validation, the model was then run with effluent recirculation ratios (RRs) of 10%, 20%, and 30% to predict the effect of effluent recirculation on the treatment performance of the ABR in terms of COD and TSS removal. The methodology used for modeling is discussed in the following paragraphs.
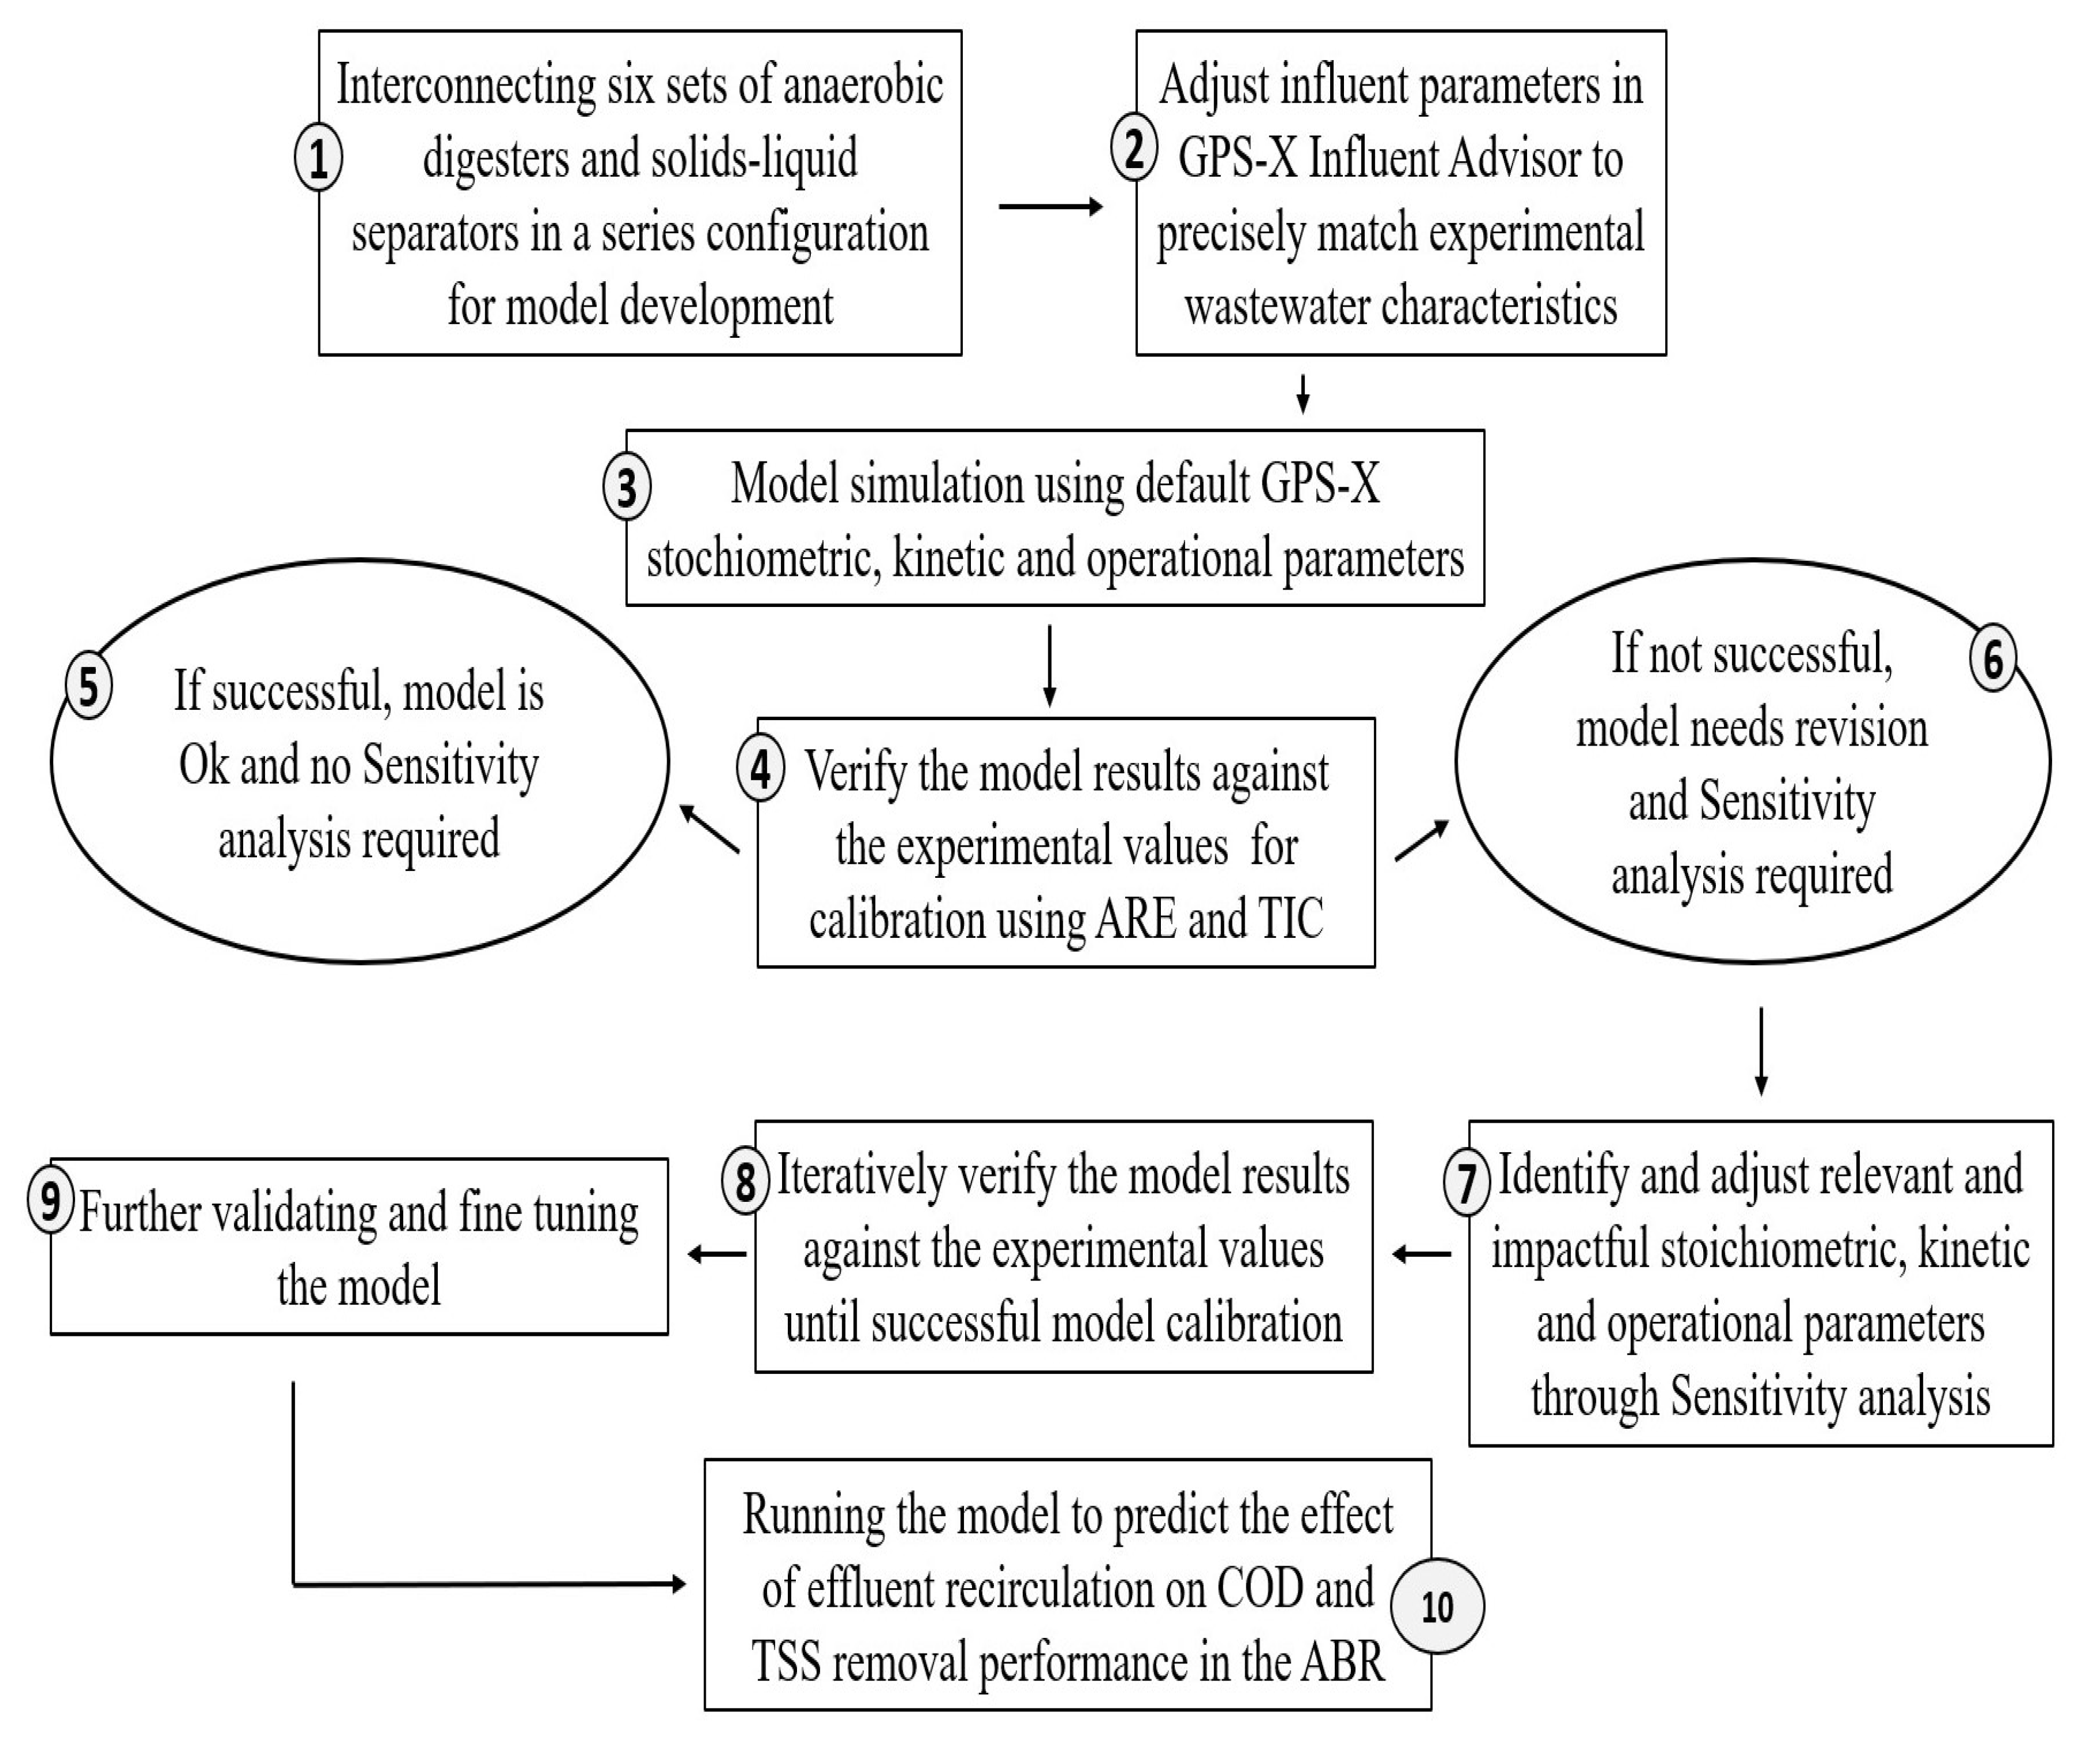
The modeling involved a structured process encompassing multiple stages, as depicted in Figure 2 [16], which are detailed in the following paragraphs.
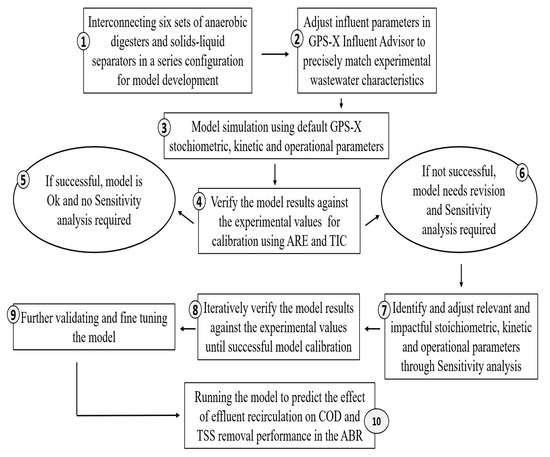
Figure 2.
Flowchart for the model development, simulation, calibration, validation, and predictions. ARE: average absolute relative error; TIC: Thiel inequality coefficient.
2.6.1. Model Development
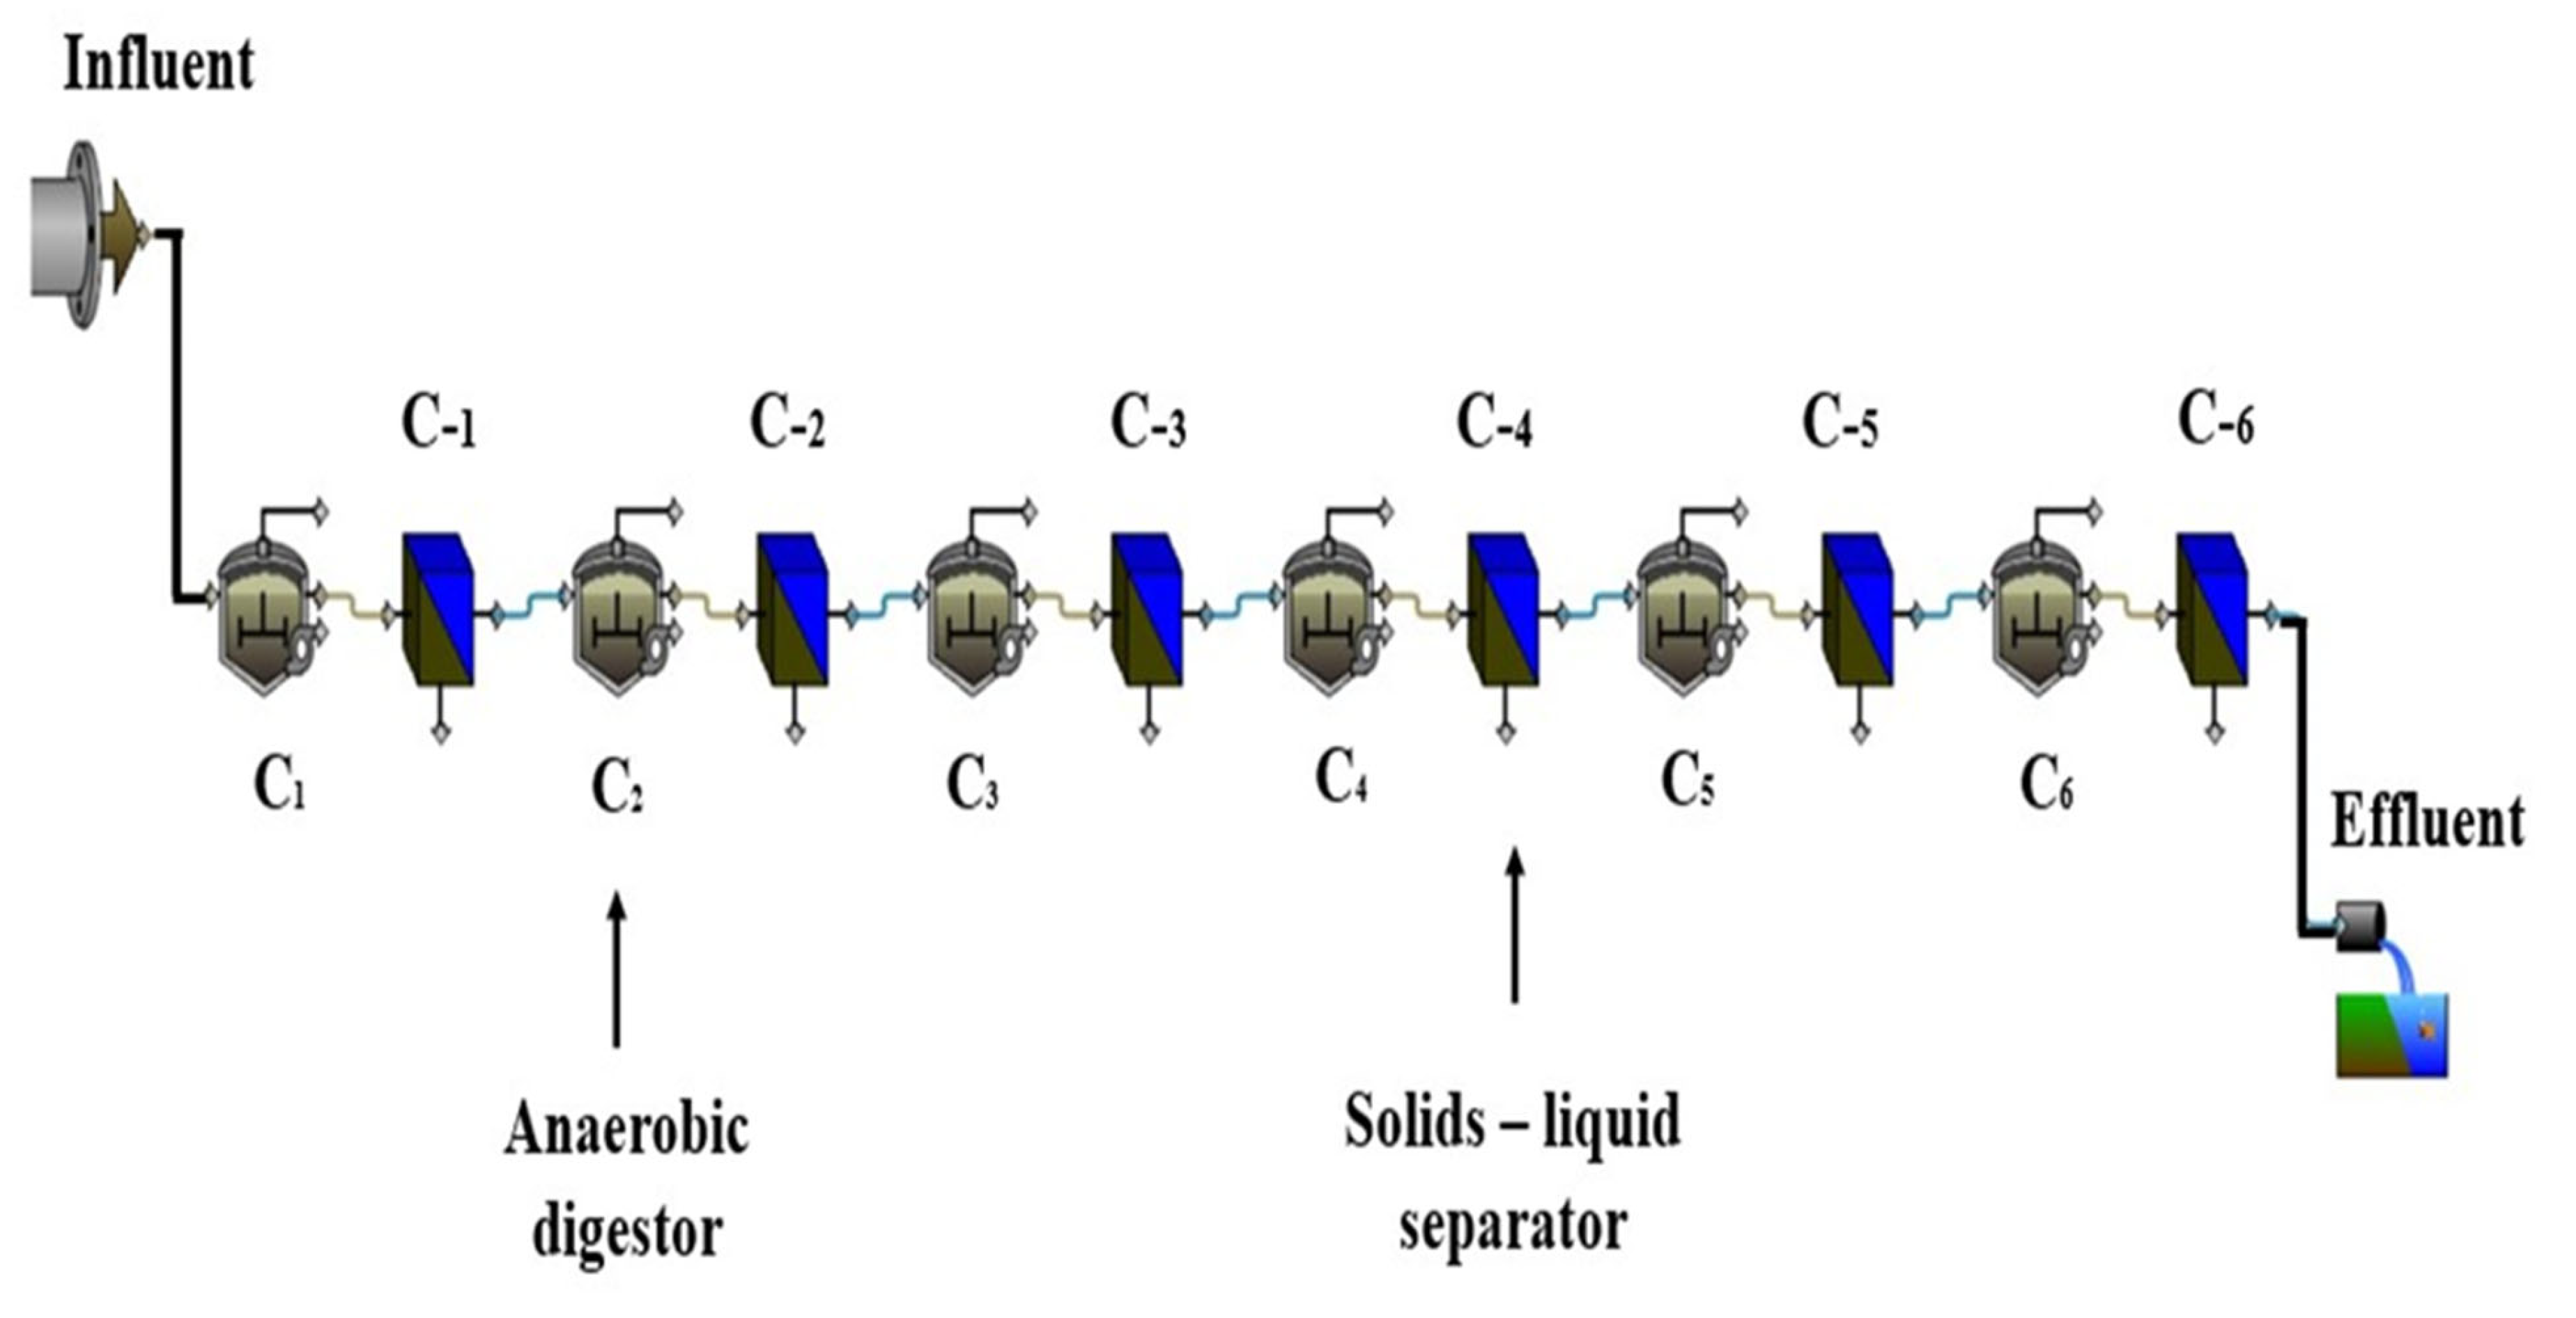
The behavior of the ABR under study was analyzed using GPS-X version 8.0, developed by Hydromantis Environmental Software Solutions Inc. As the default GPS-X library does not include an ABR process unit, the ABR model was developed by integrating two distinct process units: an anaerobic digester, and a solids-liquid separator [20]. Each compartment of the ABR was represented by one anaerobic digester coupled with one solids-liquid separator arranged in series. The ABR with six compartments was structured by interconnecting six sets of anaerobic digesters and solids-liquid separators in a series configuration. Each anaerobic digester represented various anaerobic biological processes, and the solids-liquid separators represented the physical removal of TSS in each compartment. Figure 3 illustrates the ABR configuration as displayed in the GPS-X interface window.
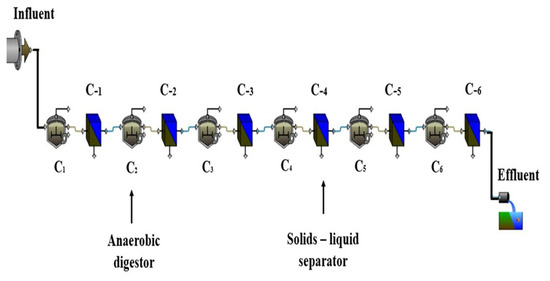
Figure 3.
Configuration of anaerobic baffled reactor (ABR) in GPS-X.
The volume of each anaerobic digester was adjusted to match the volume of each compartment. The solids-liquid separators were zero-volume units with no hydraulic mixing and hydraulic lag. Everything that went in immediately went out, with no effect on the hydraulic retention time of the reactor. These units only represented the TSS removal in each compartment. Anaerobic degradation processes in GPS-X are based on the “four population” framework (heterotrophs, acetogens, acetoclastic methanogenesis, and hydrogenotrophic methanogenesis) [29]. The Mantis2lib library (comprehensive—carbon, nitrogen, phosphorous, and pH) was used for this study. The model was comprised of 35 stoichiometric and 25 kinetic input parameters [30]. These stoichiometric and kinetic parameters are important input data for model development and accuracy. The software comprised two functional modules: the steady-state module, and the dynamic simulator. For this study, emphasis was on the steady-state module to showcase the reactor’s treatment performance under steady-state operation.
2.6.2. Influent Data Adjustment
The Influent Advisor tool was used to characterize the influent data, as influent characterization is the key to good calibration. It has three columns, representing inputs data, state variables, and composite variables. Changes can only be made to the input data column if they impact relevant state and composite variables, as these columns are interconnected. The input data column is an input data source to characterize the influent to be used in the modeling. State variables are fundamental variables that are continuously integrated within the model over time and are generally difficult to measure or interpret directly [29]. Composite variables, on the other hand, are derived from state variables and are typically measurable, including parameters like TSS, COD, TKN, TP, etc.
The equations utilized by GPS-X for the computation of influent COD, TSS, and the VSS/TSS ratio are specified as follows [29]:
where cod represents the influent’s total COD, scod denotes the corresponding soluble cod, and xcod signifies the corresponding particulate COD.
where x represents the influent’s total suspended solids, vss represents the corresponding volatile suspended solids, and xiss represents the corresponding total inorganic suspended solids.
where ivt represents the ratio of influent volatile suspended solids and the corresponding total suspended solids
cod = scod + xcod (g/m3)
x = vss + xiss (g/m3)
ivt = vss/x (gVSS/gTSS)
The input data affect composite variable data through relevant state variables. Although the input data, state variables, and composite variables had default values, the input data were carefully adjusted so that the relevant composite variables values matched the same relevant measured values to better represent the influent composition. The influent data were adjusted into the Influent Advisor tool to characterize the wastewater used in the experimentation, as discussed in Section 2.2. The summarized influent adjustment data are presented in Table 2.
Table 2.
Influent data adjustment.
2.6.3. Model Operating Conditions
Table 3 summarizes the initial operational parameters of the ABR at varying HRTs without recirculation. Steady-state conditions were achieved at different periods during the operational phases: between days 127 and 136 at 24 h HRT, days 162 and 173 at 18 h HRT, days 197 and 207 at 12 h HRT, and days 231 to 241 at 8 h HRT. The influent COD concentrations fluctuated within specific ranges corresponding to each HRT: 386–432 mg/L at 24 h HRT, 387–418 mg/L at 18 h HRT, 396–451 mg/L at 12 h HRT, and 378–412 mg/L at 8 h HRT. Additionally, the influent flow rates varied from 1.0 L/h to 3.0 L/h in shortening the HRT from 24 to 8 h.
Table 3.
Model operating conditions at various hydraulic retention times (HRTs) under steady-state operation.
2.6.4. Sensitivity Analysis
Sensitivity analysis was conducted to identify and adjust the values of relevant and impactful stoichiometric, kinetic, and operational parameters, ensuring that the simulated values closely matched the corresponding measured experimental data [16]. Initially, various parameters were manually selected based on their potential influence on treatment performance. The parameters prioritized for analysis included the following:
- i.
- Anoxic heterotrophic yield on soluble substrate (yhanocon);
- ii.
- Maximum specific growth rate of heterotrophic biomass on substrate (μhcon);
- iii.
- Anaerobic reduction factor for decay rate of heterotrophic biomass (nanaerxbhcon);
- iv.
- Maximum fermentation rate (qfecon).
These parameters were evaluated across various chambers to assess their influence on the model’s performance. They were iteratively adjusted through sensitivity analysis to optimize the alignment between the simulated and experimental values. Adjustments were validated through model calibration and validation, ensuring consistency between the simulated and experimental data. The modifications were carried out to achieve an optimal fit between the experimental results and the model predictions, thereby improving the ability of the model to represent the physical operation of the ABR during experimentation.
It is important to note that some of the adjustments were relatively large compared to the model’s default values. This is because GPS-X’s default parameters are calibrated for 20 °C, whereas the ABR in this study operated at 35 °C. The higher temperature likely led to increased reaction kinetics and microbial activity, necessitating these adjustments to accurately reflect real-world system behavior. These modifications were not arbitrarily chosen but were required to enhance the predictive capabilities of the model.
2.6.5. Model Simulation
The simulation of wastewater treatment processes involves two critical phases: calibration and validation [31]. The prevalent method for model calibration involves utilizing operational data to iteratively adjust the values of sensitive parameters so that the simulated values match the experimental results and minimize the error between the two datasets [32,33]. After the successful calibration of the model, the subsequent phase entails model validation. This process encompasses the verification of the alignment between the model-simulated values for a distinct dataset and the corresponding measured values. Model validation is important to determine the confidence behind the model and reflect the model’s authenticity and applicability [34]. For model calibration and validation, the average absolute relative error (ARE) [31] and Thiel inequality coefficient (TIC) [35] were used to evaluate the simulation results and attain the best possible agreement between the observed values and corresponding simulated values generated by the model; they are defined as follows:
where mi is the measured value, pi is the simulated value, and N represents the number of data points.
where yi is the measured value and ym,i is the simulated value.
2.6.6. Model-Based Predictions of COD and TSS Removal Across Various Effluent RRs
Following the model evaluation phase without effluent recirculation, the model was operated with effluent recirculation at ratios of 10%, 20%, and 30% at each HRT (24, 18, 12, and 8 h). This investigation aimed to assess how different levels of effluent recirculation affect the reactor treatment performance for COD and TSS under steady-state conditions, relative to the control scenario without effluent recirculation. Figure 4 displays the model incorporating effluent recirculation that was used for the predictions.
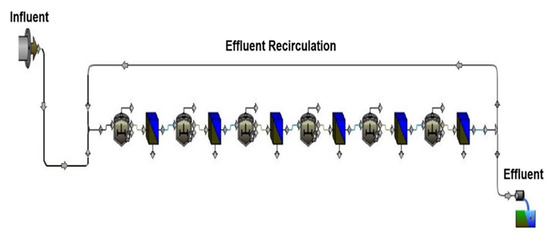
Figure 4.
ABR model depicting effluent recirculation.
All parameters of the reactor remained consistent with the control scenario, except for the introduction of effluent recirculation. Specifically, effluent recirculation was introduced from the sixth compartment back to the first compartment. Across all RRs, the reactor was operated at HRTs of 24, 18, 12, and 8 h. The effluent recirculation ratio (RR) is defined as follows [36]:
3. Results and Discussion
3.1. Effluent-Measured COD and TSS Concentrations at Steady-State Operation
The removal efficiencies of COD and TSS in the ABR were determined through experimental runs conducted under steady-state conditions at different HRTs of 24, 18, 12, and 8 h, as presented in Figure 5.
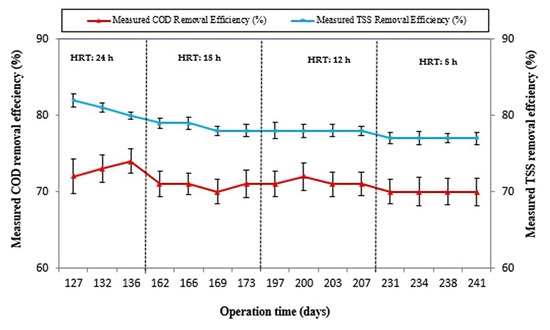
Figure 5.
Measured COD removal efficiency and measured total suspended solids removal efficiency under steady-state operation at HRTs of 24, 18, 12, and 8 h.
At an HRT of 24 h, the efficiency of COD removal fluctuated between 71.5 and 73.8% under steady-state operation. In a related study, Zha et al., (2019) [27] reported 75 + 3.56% efficiency in COD removal using a modified ABR for pretreating black water at a temperature of 36 ± 1 °C at this HRT. During the second experimental phase, while the reactor was operating at an 18 h HRT, the COD RE fluctuated between 68.9% and 72.2% under conditions of steady-state operation. Similarly, in the third run, the reactor was operated at a 12 h HRT. The reactor showed COD RE ranging between 70.5 and 72.2% under steady-state operation. Likewise, in the fourth operational phase, the reactor was operated at an HRT of 8 h. The reactor COD RE varied between 67.5 and 68.9% under steady-state behavior of the reactor. Our observations revealed that the reactor exhibited consistent COD removal behavior under steady-state conditions. Altering the HRT from 24 to 8 h did not notably diminish the COD removal performance of the reactor, with the COD RE ranging between 73.8% and 67.5%.
In a similar study conducted by Nasr et al. (2009) [37], variations in COD RE were noted, ranging from 85% to 67% as the HRT was shortened from 24 to 8 h during the treatment of domestic wastewater with an average influent COD concentration of 680 mg/L, under mesophilic conditions. The lower COD RE observed with the 24 h HRT in the present study, where the influent’s average COD concentration was around 400 mg/L, suggests that the influent COD concentration plays a crucial role in treatment performance. The higher influent COD concentration in the study of Nasr et al. (2009) [37] might have contributed to the higher observed COD RE compared to the present study, highlighting the impact of influent characteristics on treatment outcomes. This signifies the importance of influent characterization while assessing and comparing treatment performance in different studies.
The substantial reduction in HRT from 24 to 8 h did not result in a significant decrease in the treatment performance of the ABR. Throughout the adjustment, the reactor maintained its COD RE with little variation, ranging from 67.5% to 73.8%. The rationale behind better RE when switching from 24 to 8 h HRT can be attributed to improved acclimatization, biomass retention, and proliferation capacity of the ABR. This facilitated higher levels of biomass within the reactor, leading to increased substrate utilization by the microorganisms for their metabolic processes and new cell synthesis. Furthermore, the reactor consistently upheld better TSS removal efficiency, ranging from 82.2 to 75.2%, when shortening the HRT from 24 to 8 h. In a comparable study conducted by Mahdi et al. (2022) [38], regarding TSS RE using an ABR, the authors reported a change in TSS RE from 78% to 67% when shortening the HRT from 24 to 6 h during the treatment of domestic wastewater in Iraq at ambient air temperature. This indicates that the observed TSS RE in our study is closely aligned with the findings reported in the prior study, demonstrating the consistency of TSS removal performance under real-world wastewater treatment conditions.
The observed upper limit for removal efficiency in ABR systems may be attributed to factors such as sludge washout, limited microbial retention, and operational constraints. While the system demonstrated stable COD and TSS removal efficiencies despite HRT reduction, further improvement is constrained by the inherent design parameters of ABRs. Typically, ABR systems are designed with inflow rates ranging from 2 to 200 m3 per day, an HRT of 48 to 72 h, and an upflow velocity below 0.6 m/h to ensure effective treatment [39]. The number of upflow chambers varies between 3 and 6, with each chamber supporting different anaerobic digestion phases, including hydrolysis, acidogenesis, acetogenesis, and methanogenesis. If additional chambers are needed beyond this range, multiple ABRs in parallel are recommended.
To optimize microbial interaction and flow distribution, wastewater passes through vertical pipes or baffles, ensuring intensive contact with the sludge. Baffle spacing, typically between 0.3 and 1.0 m, plays a crucial role in maintaining process stability by promoting even flow distribution and increasing the contact time between organic matter and active biomass. Additionally, to avoid process disturbances under high hydraulic loads, the upflow velocity should not exceed 2.0 m/h [40].
3.2. Model Calibration
3.2.1. Adjustment of Input Parameters
While using default input parameter values, variance was found between the measured and simulated results; thus, model calibration was necessary to achieve the best fit of the data, so that the model could precisely represent the experimental setup [41]. The sensitivity analysis helped to identify and optimize the stoichiometric, kinetic, and operational parameters that exert the greatest influence on the performance of the model [16]. Through model calibration, the identified stoichiometric and kinetic parameters were adjusted by the model to achieve the best fit between the experimental results and the corresponding simulated values. The model default and adjusted values of the main stoichiometric and kinetic parameters affecting the performance of anaerobic digesters are tabulated in Table 4.
Table 4.
Default and adjusted values of main parameters affecting the performance of anaerobic digesters.
The anoxic heterotrophic yield on soluble substrate (yhanocon) in the first compartment (C1) was adjusted to 0.55 against the default value of 0.533 (gCOD/gCOD). The slight variation in this stoichiometric parameter might have been caused by the microbial community composition, availability of nutrients, and substrate utilization efficiency by the microbial population within the first compartment (C1). Similarly, the maximum specific growth rate of heterotrophic biomass on substrate (μhcon) within C1 was adjusted to 13.5 (1/d), surpassing the default value of 3.2 (1/d), based on the operational conditions. The reactor operating temperature of 35 °C was considered optimal for microbial growth, in comparison with the GPS-X default temperature of 20 °C. This temperature might have enhanced the growth of heterotrophic bacteria by enhancing the substrate affinity for organic compounds, particularly under increased organic loading rates (OLRs) resulting from shortening the HRT from 24 to 8 h. The adjusted value of μhcon in C1 signified the peak growth rate of heterotrophic bacteria, reflecting the highest level of microbial activity within this compartment [42].
Furthermore, μhcon demonstrated a decreasing trend along the reactor compartments, decreasing from 3.7 in the second compartment (C2) to 1.97 in the sixth compartment (C6). This reduction in growth rate can be correlated with the diminishing availability of organic substrate along the reactor’s flow path. The diminishing organic substrate concentrations resulted in lower rates of heterotrophic biomass growth along the reactor’s length. Similarly, the anaerobic reduction factor affecting the decay rate of heterotrophic biomass (nanaerxbhcon) was uniformly adjusted to 41% across all compartments, compared to the default value of 60%. This adjustment reflected the influence of operating conditions such as substrate characteristics, organic loading rate, and reactor temperature on this specific decay rate.
The value of the maximum fermentation rate (qfecon) in C1 was adjusted to 12.0 against the default value of 3.0. This parameter gradually reduced along the flow and was adjusted to a value of 2.40 in C6. The higher value of qfecon in C1 might signify optimal conditions for microbial fermentation, supported by the reactor’s operating parameters. The gradual reduction in qfecon along the reactor’s length demonstrated the decreasing availability of fermentable substrates, which influenced the microbial activities and fermentation rates within different compartments of the reactor.
Similarly, the TSS removal efficiency for each compartment was adjusted through sensitivity analysis for all six solid–liquid separation units, resulting in the following values: Compartment 1 (C-1), 38%; Compartment 2 (C-2), 59%; Compartment 3 (C-3), 35%; Compartment 4 (C-4), 20%; Compartment 5 (C-5), 10%; and Compartment 6 (C-6), 25%. In each solids-liquid separation unit, TSS settled down at the bottom but were intentionally retained in the system, mirroring the actual experimental conditions, where no desludging occurred throughout the operation. The adjustments of these stoichiometric, kinetic, and operational parameters through sensitivity analysis improved the model’s performance by aligning the simulated outputs with experimental results and optimizing the model’s predictive capabilities under diverse operational conditions.
3.2.2. Calibration Results
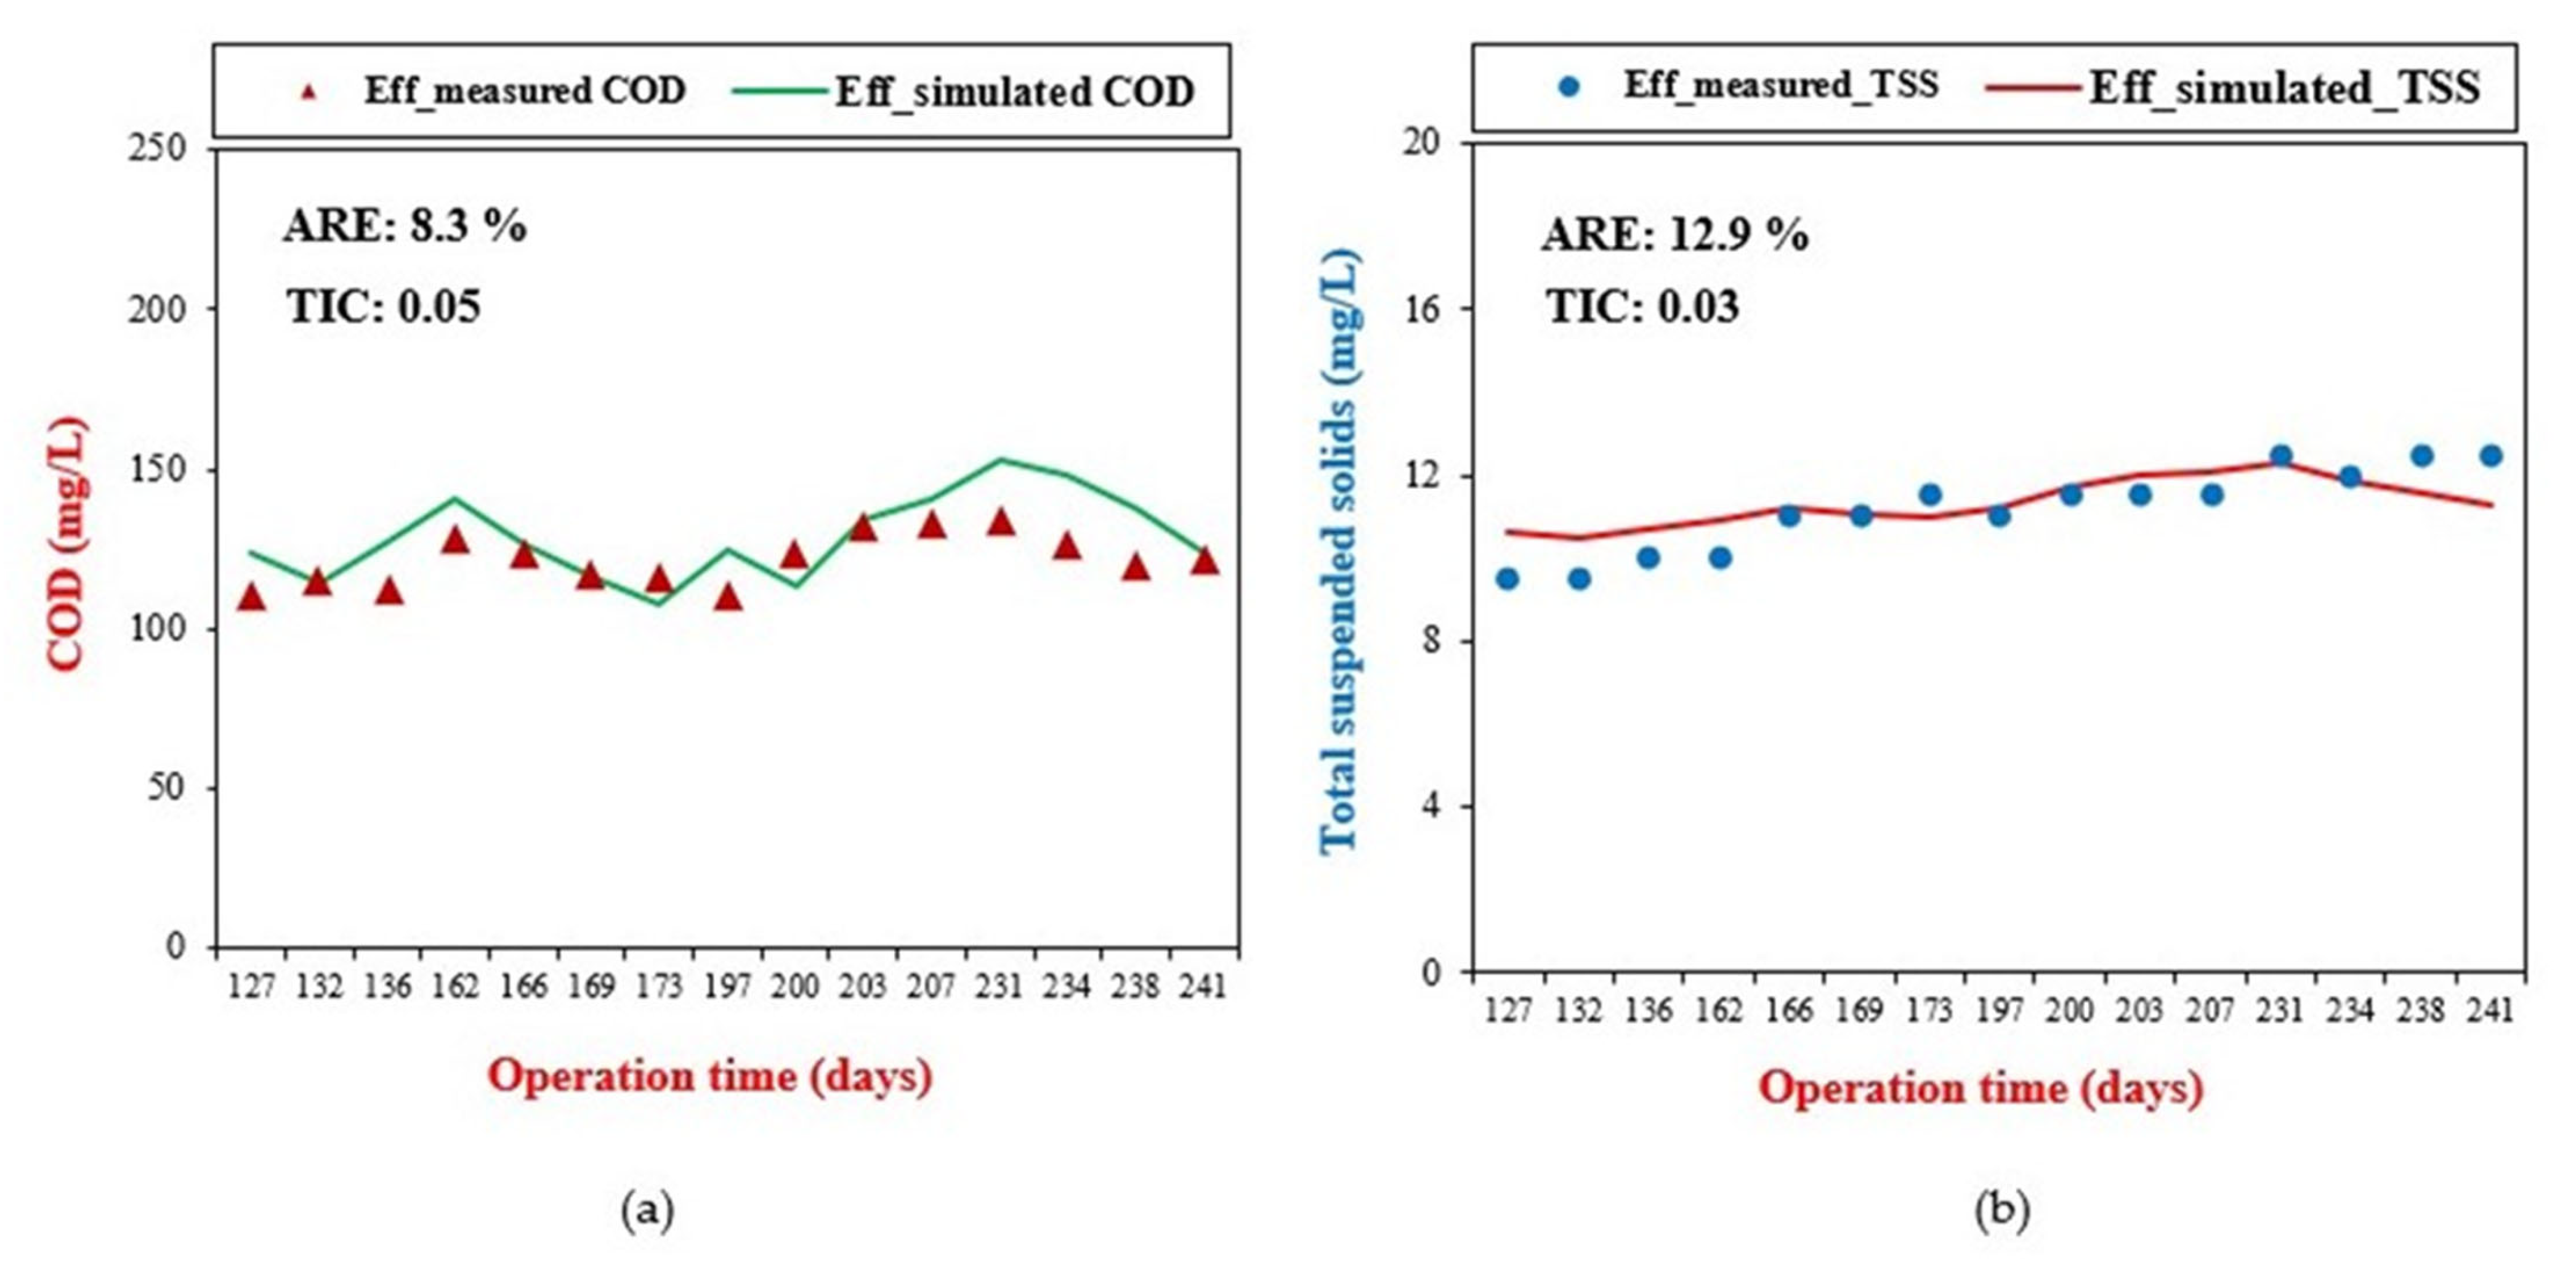
The calibration of the model involved a comparison between the measured effluent COD values and the corresponding simulated values, as shown in Figure 6a, using the ARE and TIC. This comparison was conducted across various HRTs of 24, 18, 12, and 8 h for COD removal. The values of ARE and TIC were 8.3% and 0.05, respectively. Li et al. (2016) [20] reported an ARE of 9.2% while calibrating the effluent COD concentration in modeling a modified anaerobic baffled reactor. Liwarska-Bizukojc et al. (2011) [43] reported an ARE value between 7 and 15% as sufficient for model evaluation. Similarly, Cao et al. (2021) [35] reported a TIC value of 0.08 for COD removal during model validation using the GPS-X computer application. Likewise, Elawwad et al. (2019) [44] mentioned that the relative errors for simulation should be less than 15%. The obtained ARE and TIC values for COD removal fell within the acceptable range, indicating successful model calibration.

Figure 6.
(a) Effluent-measured and simulated COD values for model calibration. (b) Effluent-measured and simulated TSS concentrations for model validation.
3.3. Model Validation
The model validation involved assessing the correlation between effluent-measured TSS values and their corresponding simulated values, determining the level of agreement between the respective datasets, as shown in Figure 6b. Again, the ARE and TIC calculated at HRTs of 24, 18, 12, and 8 h for TSS removal were 12.9% and 0.03, respectively. These ARE and TIC values were in the acceptable range of 15%, demonstrating a good match between the measured and simulated values for the removal of TSS, thereby affirming the validity of the model [44]. The calibration and validation results indicated that the model effectively represented the practical operation of the ABR during the experimental phase. This signified that the model can reliably predict the performance of the ABR in removing COD and TSS under various operating conditions.
3.4. Model Compartment-Level COD Concentrations
The model was simulated to determine the compartment-level COD removal, as shown in Figure 7. The influent average COD concentration was in the range of 410 mg/L. The first compartment showed 46% COD removal, while the second and third compartments removed 15% and 4% of the influent COD, respectively. Manariotis and Grigoropoulos (2002) [45] reported COD removal of 56, 22, and 5% in the first, second and third compartment of an ABR treating low-strength wastewater, respectively. In a similar study, Krishna et al. (2009) [46] reported that most of the COD was removed in the first two compartments of the ABR. Likewise, Yenjiet al. (2021) [47] observed that substantial COD removal occurred within compartments C1 to C3, while minimal COD removal was noted from C3 to C6. This demonstrated that the model-simulated results were consistent with the previous experimental studies.
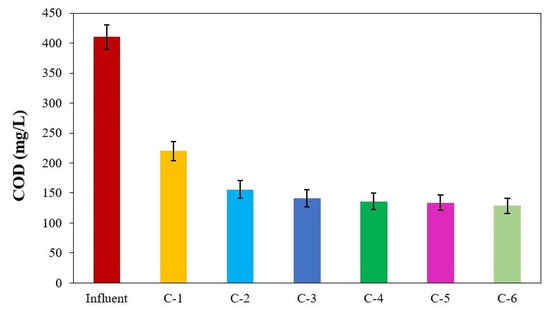
Figure 7.
Influent COD and compartment-level effluent COD concentration.
The significant removal of COD in the initial compartments signified the proactive involvement of microbial communities. These microorganisms can effectively decompose organic matter, adapt to the available substrate, and promptly utilize the available organics to support their metabolism and growth. As the substrate underwent utilization, there was a reduction in the RE of COD in the subsequent compartments.
3.5. Effect of Effluent Recirculation on COD and TSS Removal Performance
The model was employed to predict the COD and TSS removal performance of the reactor in response to variations in effluent recirculation, as detailed in the following discussion.
3.5.1. Effect on COD Removal Performance
The model was operated to predict variations in the COD removal efficiency (RE) of the reactor corresponding to effluent recirculation ratios (RR) of 10%, 20%, and 30%. The outcomes of these model-based predictions are illustrated in Figure 8, where COD_RE represents the COD removal efficiency at any particular HRT and ΔCOD_RE indicates the change in COD removal efficiency with respect to effluent recirculation, relative to the baseline condition of no effluent recirculation at that specific HRT. A positive ΔCOD_RE value indicates an increase in COD removal efficiency, and a negative value represents a decrease in COD removal efficiency.
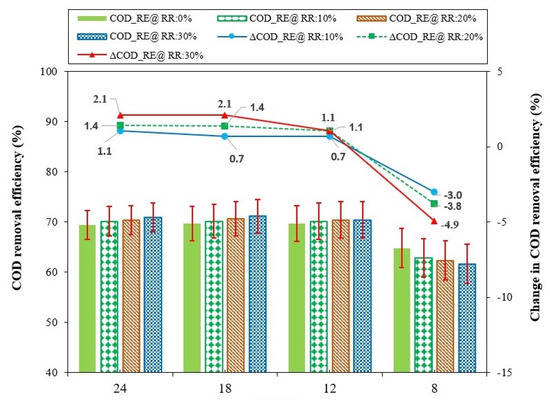
Figure 8.
Effect of effluent recirculation ratio on COD removal efficiency at HRTs of 24, 18, 12, and 8 h.
For each HRT, the baseline COD removal efficiency was the value observed at that specific HRT without effluent recirculation. At an HRT of 24 h without effluent recirculation, the ABR demonstrated an average COD RE of 69%. Introducing effluent recirculation at an RR of 10% led to a marginal increase in COD removal efficiency, rising to 70.2%. Further increases in RR to 20% and 30% corresponded to COD removal efficiencies of 70.4% and 70.9%, respectively.
Variance in COD removal efficiency, ranging from 1.1% to 2.1%, was observed when adjusting the effluent recirculation ratio from 10% to 30%, in comparison to the baseline condition of no recirculation. The results from the model simulations demonstrated that variations in effluent recirculation had no appreciable effect on the COD_RE of the ABR at a 24 h HRT. These results are consistent with the conclusions of Aqaneghad and Moussavi (2016) [48], who reported that effluent recirculation has no significant impact on ABR treatment efficiency for municipal wastewater at this specific HRT.
Likewise, the COD_RE of the ABR demonstrated a marginal increase from 70% to 70.7% when the HRT was set at 18 h, accompanied by a variation in effluent RR from 0.0 to 20%. However, subsequent adjustment of the effluent RR to 30% resulted in a further increase in the COD_RE of the reactor to 71.1%. The reactor COD_RE exhibited a marginal improvement, increasing by 0.7%, 1.4%, and 2.1% at RRs of 10%, 20%, and 30%, respectively, compared to the baseline condition of no recirculation. Similarly, the reactor exhibited COD RE of 70% when operated without effluent recirculation at an initial HRT of 12 h. This efficiency increased slightly, to 70.2%, with an effluent RR of 10%. The reactor maintained COD_RE of 70.4% at RRs of 20% and 30%. The COD_RE marginally improved by 0.7% to 1.1% when changing the effluent RR from 10% to 30%, respectively. Subsequently, when the HRT was reduced to 8 h, the implementation of effluent recirculation negatively affected the reactor performance, with COD_RE decreasing from 65% without recirculation to 61.6% at an RR of 30%. The COD_RE declined by 3.0%, 3.8%, and 4.9% at effluent RRs of 10%, 20%, and 30%, respectively.
The slight increase in COD_RE at HRTs of 24, 18, and 12 h might be attributable to the enhanced interaction between pollutants and active biomass, facilitated by effluent recirculation [36]. The implementation of effluent recirculation likely contributed to increased upflow velocity and improved hydraulic mixing, both of which enhanced the biomass–substrate contact and minimized dead zones within the anaerobic digestion process [49,50]. Moreover, it likely improved bacterial nutrient acquisition and ensured uniform feed distribution within the reactor, contributing to the overall COD removal performance of the system [51]. However, the slight improvement in COD removal efficiency at HRTs of 24, 18, and 12 h with effluent recirculation indicates that the system might have been operating close to its optimal capacity before recirculation, thereby limiting significant improvement in the treatment performance of the reactor.
At an 8 h HRT, the initial setup likely facilitated optimal mixing between the substrate and the active biomass, ensuring effective substrate–microbe contact. However, the introduction of effluent recirculation at this reduced HRT might have altered the hydraulic mixing dynamics and increased the upflow velocity, causing the reactor to operate as a completely mixed system [52]. This modification might potentially have undermined the benefits associated with phase separation [53]. Excessive mixing might have disrupted the biofilm and increased the formation of dead zones within the reactor [54]. Additionally, this modification might have disrupted the biomass proximity, adversely affecting the anaerobic digestion process and leading to a decline in the COD removal performance of the reactor [55]. Furthermore, effluent recirculation increased the organic loading rate (OLR) of the reactor, which might have caused shock loading [56]. Effluent recirculation might also have elevated the flow rate into the reactor beyond the optimal performance threshold, resulting in dead zones due to a channeling effect [57]. Consequently, the combined effect of shock loading and channeling might have contributed to a decrease in the COD removal efficiency of the reactor.
The results obtained from this predictive analysis indicated that the introduction of effluent recirculation did not lead to significant improvements in the COD removal performance of the ABR at HRTs 24, 18, and 12 h. These findings are aligned with the conclusions drawn by Vuitik et al. (2019) [13], who similarly investigated the effect of effluent recirculation on COD removal efficiency in ABR systems treating highly concentrated wastewater across various HRTs, ranging from 2 to 10 days. Additionally, this study found that the COD removal efficiency of the reactor exhibited a decline at a shorter HRT of 8 h.
3.5.2. Effect on TSS Removal Performance
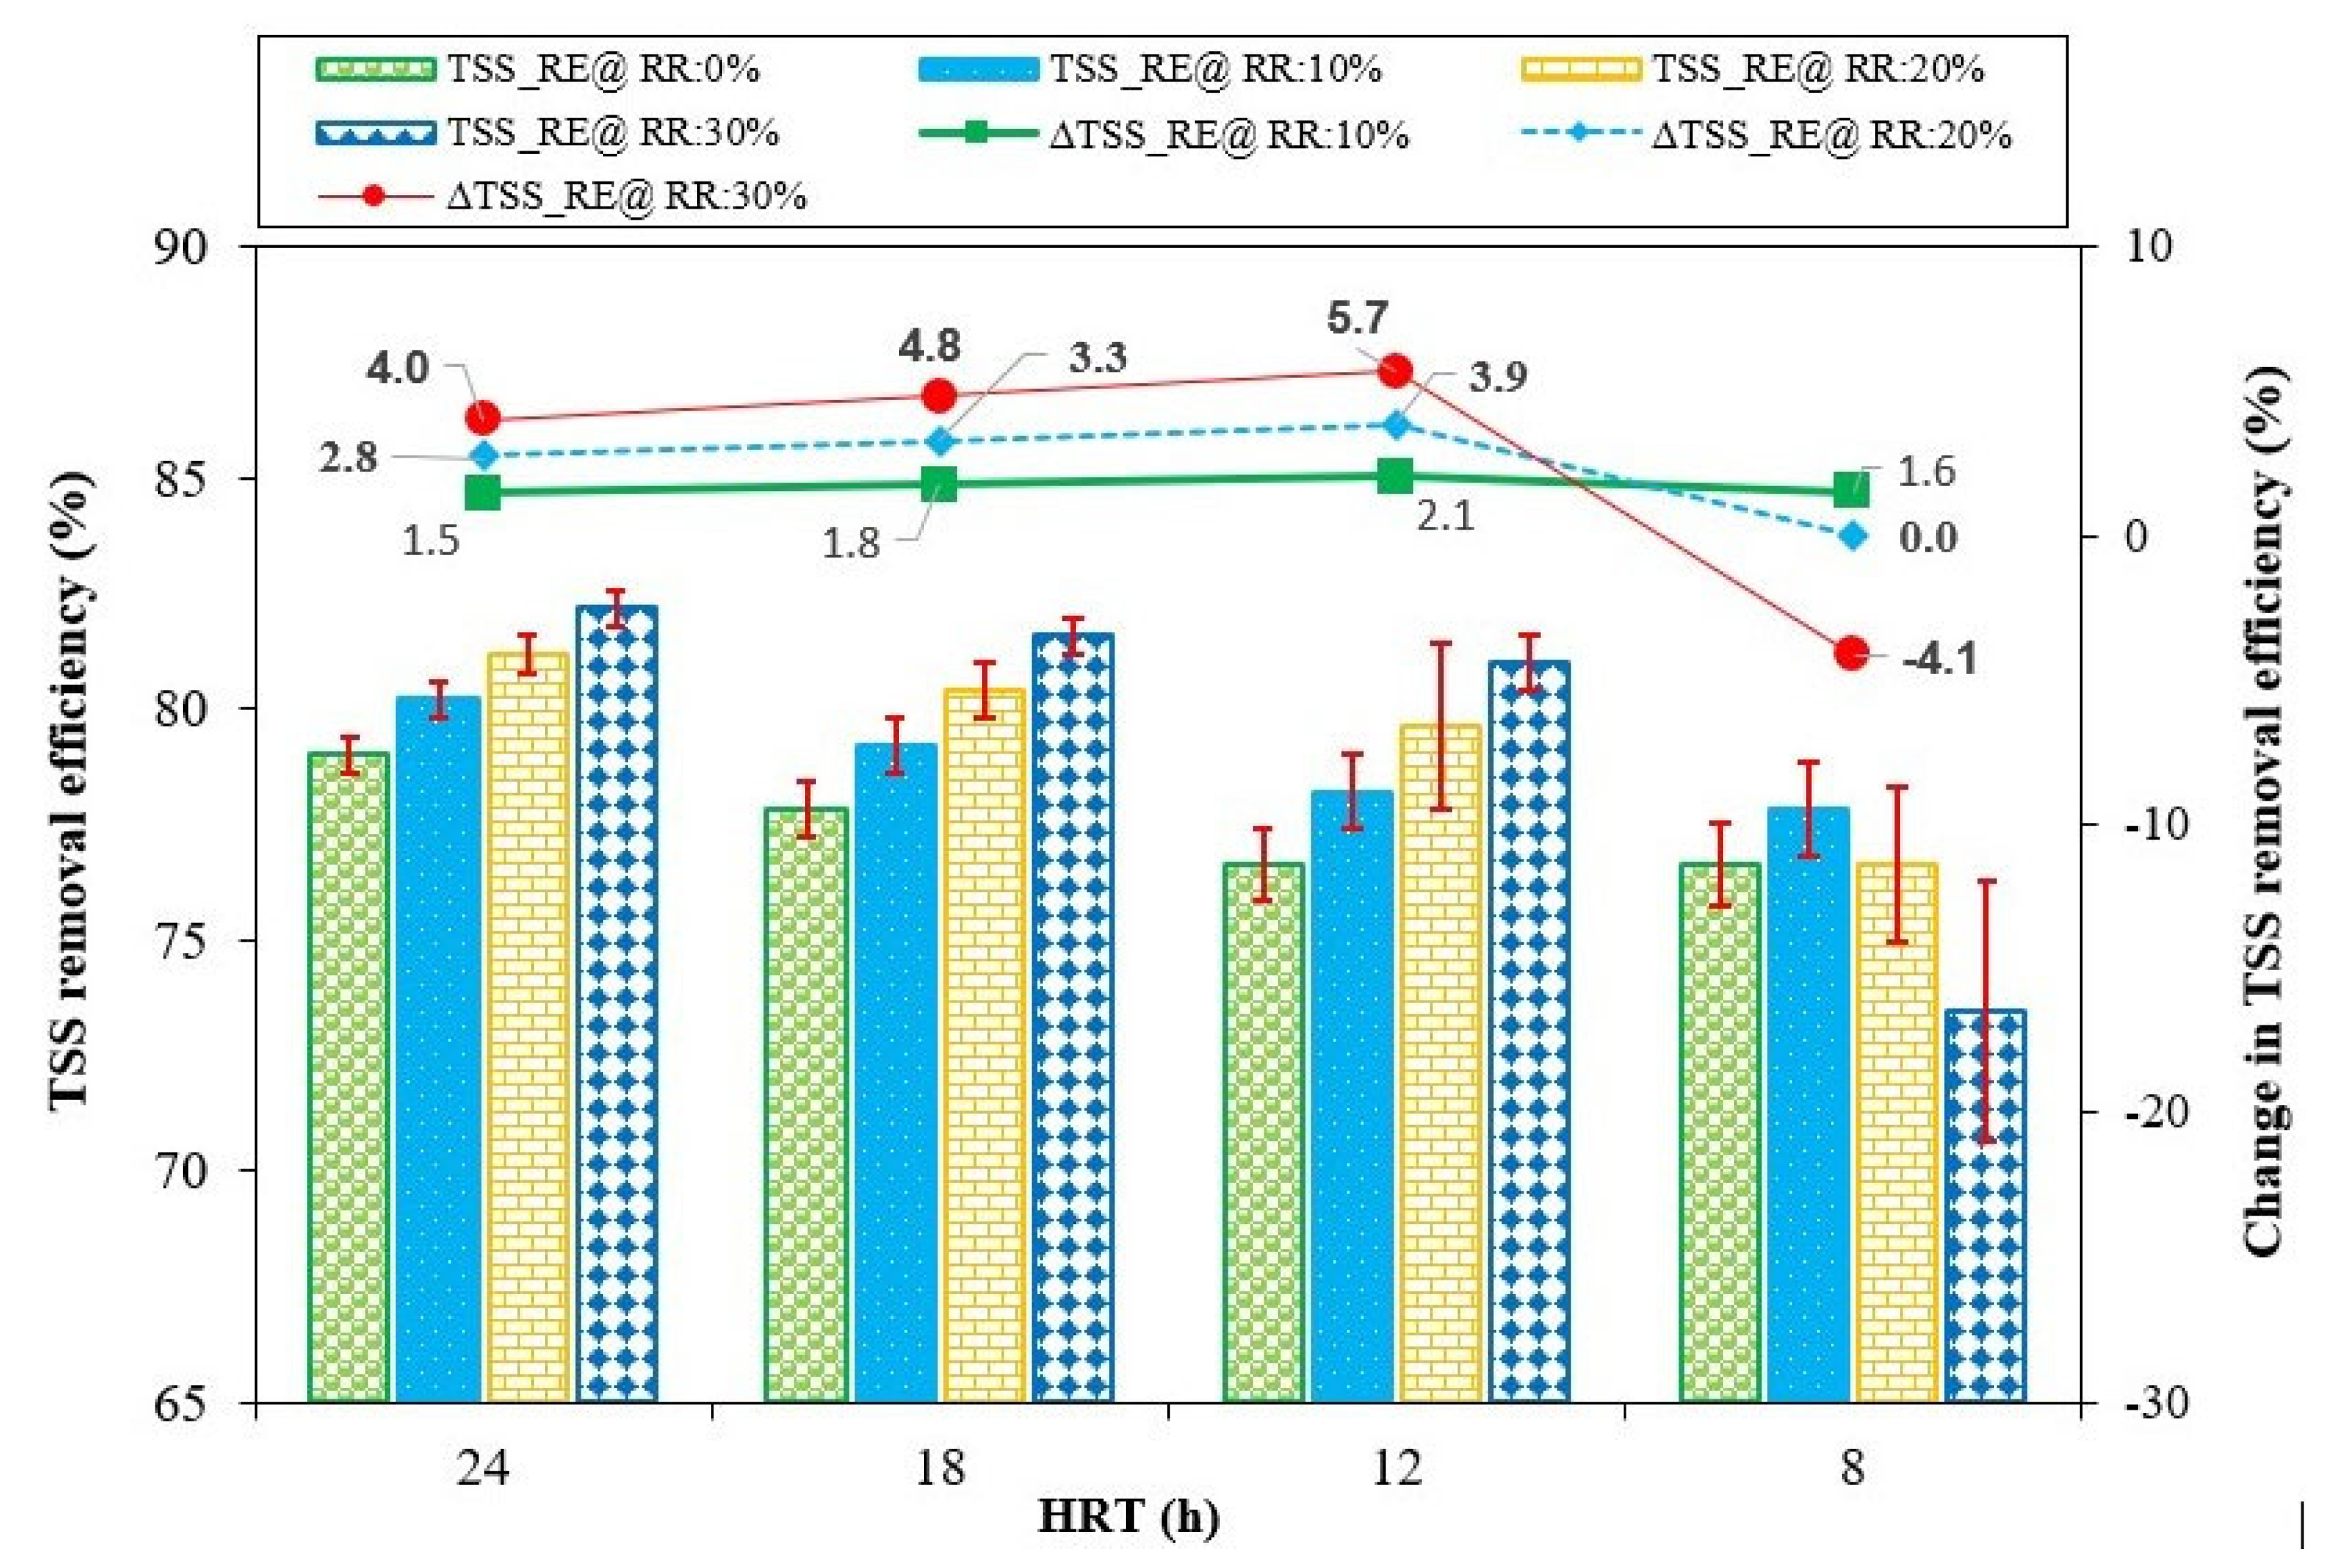
The ABR’s TSS removal performance with varying effluent RRs at different HRTs was examined, as illustrated in Figure 9, where TSS_RE represents the total suspended solids removal efficiency at any particular HRT, and ΔTSS_RE indicates the change in TSS removal efficiency with respect to effluent recirculation, relative to the baseline condition of no effluent recirculation at that specific HRT. A positive ΔTSS_RE value indicates an increase in TSS removal efficiency, and a negative value represents a decrease in TSS removal efficiency.

Figure 9.
Effect of effluent recirculation ratio on total suspended solids removal efficiency at HRTs of 24, 18, 12, and 8 h.
At an HRT of 24 h without effluent recirculation, the TSS removal efficiency (RE) was 79%, increasing to 82% with a 30% effluent RR. The TSS RE improved by 1.5%, 2.8%, and 4% at RRs of 10%, 20%, and 30%, respectively. Similar TSS removal trends were observed at HRTs of 18 and 12 h. Initially, without effluent recirculation, the TSS removal efficiencies were 78% and 77%, which increased to 82% and 81% with a 30% effluent RR, at HRTs of 18 and 12 h, respectively.
At an HRT of 18 h, the TSS_RE improved by 1.8%, 3.3%, and 4.8% at effluent RRs of 10%, 20%, and 30%, respectively. Similarly, at a 12 h HRT, TSS_RE improved by 2.1%, 3.9%, and 5.7% with effluent RRs of 10%, 20%, and 30%, respectively.
At an HRT of 8 h, the ABR exhibited some different behavior in TSS removal as compared to the previous HRTs. Initially, without effluent recirculation, the TSS RE was 77%, which marginally increased to 78% with a 10% effluent RR. However, further increasing the effluent RR to 20% and 30% resulted in a decrease in TSS RE to 77% and 73%, respectively. At this HRT, the reactor’s TSS RE improved slightly (by 1.6%) at a 10% effluent RR. However, increasing the effluent RR to 20% and 30% resulted in no change and a decrease of 4.1% in TSS RE, respectively.
The observed improvement in TSS removal performance with recirculation at HRTs of 24, 18, and 12 h might be attributable to improved solid retention time (SRT) in the ABR system [49]. As SRT can notably influence the microbial community, it likely influenced the biodegradation process [58], so the extended contact between the microbial biomass and suspended solids likely facilitated more efficient degradation and removal of the solids. Additionally, the effluent recirculation might have improved the mixing dynamics and reduced the number of dead zones, optimizing microbial activity for solid waste degradation. Furthermore, the effluent recirculation might have promoted the aggregation of suspended solids into settleable flocs, enhancing settling under gravity at the bottom of the ABR. Collectively, these phenomena might have contributed to the increased TSS RE associated with effluent recirculation in the reactor. Conversely, at an 8 h HRT, the decrease in TSS RE at an RR of 30% might be attributable to potential fluctuations in settling dynamics and shock loading within the system due to a substantial increase in upflow velocity [56]. The corresponding mixing at this effluent RR might have caused intensive solid losses, resulting in a decrease in the TSS RE of the reactor [54].
3.6. Comparison of COD Removal Efficiency and the Influence of Influent COD and HRT
A comparison of COD removal efficiency across various ABR studies is presented in Table 5. These studies vary in terms of influent COD concentration, HRT, and wastewater type, all of which influence the treatment performance. The comparison highlights how ABR performance is affected by operational conditions and influent characteristics, particularly COD concentration and HRT.
Table 5.
ABR performance in treating municipal/domestic wastewater with mesophilic conditions.
The present study, with an influent COD of 410 mg/L and an HRT of 8–12 h, achieved COD removal efficiencies of 65–70%. These values are within the range reported in previous studies. For instance, Nasr et al. (2009) [37] observed COD removal efficiencies of 67–85% with an influent COD of 680 mg/L and an HRT of 8–24 h. The higher COD removal in that study may be attributable to the higher influent COD concentration, which can enhance biodegradation rates by providing more readily available organic matter for microbial metabolism.
To further assess this relationship, COD removal efficiencies from different studies were normalized by considering the ratio of influent COD to HRT. This normalization provides a more direct comparison of treatment performance under different conditions and suggests a potential correlation with first-order kinetics. For example, Chen and Shen (2006) [60] reported an influent COD of 500 mg/L with an HRT range of 3–12 h, achieving removal efficiencies between 85 and 90%, indicating that high influent COD concentrations can support high removal rates even at lower HRTs. Conversely, studies with lower influent COD or longer HRTs do not necessarily show proportional increases in removal efficiency. Munavalli et al. (2022) [63] reported an influent COD of 403–424 mg/L with an HRT of 24–55 h but achieved significantly lower removal efficiencies (29–39%). Similarly, Reynaud (2015) [62] observed only 43% removal at an influent COD of 224 mg/L and an HRT of 49 h, suggesting that, at lower influent COD concentrations, microbial activity may be limited, leading to lower treatment efficiency.
Overall, the comparison indicates that the modeling performed in this study is representative of ABR systems treating synthetic wastewater, with the results falling within the range observed in previous studies. The analysis further highlights that the influent COD concentration plays a significant role in ABR performance, with higher COD concentrations generally leading to greater removal efficiencies, consistent with first-order kinetics behavior. However, differences in wastewater composition, reactor design, and microbial community dynamics can influence these trends. Therefore, while the findings of this study align with the existing literature, variations in operational conditions should always be considered when extrapolating these results to other ABR applications. Future modeling efforts should incorporate COD/HRT normalization across different studies to improve comparability and enhance ABR performance predictions.
4. Conclusions
This study employed GPS-X software to model and simulate the behavior of an ABR in removing TSS and COD from municipal wastewater. Predictive modeling provided a comprehensive assessment of the effect of effluent recirculation on ABR treatment efficiency, thereby eliminating the need for extensive laboratory experiments and conserving both time and resources. The findings indicated that, at longer HRTs of 24, 18, and 12 h, effluent recirculation did not notably enhance the removal efficiencies of COD and TSS with the increase in RR. On the contrary, at an 8 h HRT, effluent recirculation is likely to negatively affect the treatment performance along with an increase in RR. Additionally, implementing effluent recirculation could elevate operational costs due to the associated energy consumption for pumping. The results of this study suggest that, under mesophilic conditions, effluent recirculation may not be an effective strategy for improving ABR performance in municipal wastewater treatment. Future research should focus on modeling the effects of effluent recirculation on ABR performance in real municipal wastewater, specifically in removing COD, TSS, and nutrients under varying conditions.
Author Contributions
Conceptualization, N.U. and Z.S.; Methodology, N.U., Z.S. and M.K.; Software, N.U., Z.S., M.K. and A.A.; Validation, N.U. and Z.S.; Formal analysis, N.U., Z.S., M.K. and A.A.; Investigation, N.U. and A.A.; Resources, N.U., Z.S. and S.B.A.; Writing—original draft, N.U.; Writing—review & editing, Z.S. and M.K.; Visualization, N.U., S.B.A. and A.A.; Supervision, Z.S., S.B.A. and M.K.; Funding acquisition, S.B.A. All authors have read and agreed to the published version of the manuscript.
Funding
This research was funded by Princess Nourah bint Abdulrahman University Researchers Supporting Project number (PNURSP2025R583), Princess Nourah bint Abdulrahman University, Riyadh, Saudi Arabia.
Institutional Review Board Statement
Not applicable.
Informed Consent Statement
Not applicable.
Data Availability Statement
The original contributions presented in this study are included in the article. Further inquiries can be directed to the corresponding author.
Conflicts of Interest
The authors declare no conflict of interest.
References
- Ungureanu, N.; Vlăduț, V.; Voicu, G. Water Scarcity and Wastewater Reuse in Crop Irrigation. Sustainability 2020, 12, 9055. [Google Scholar] [CrossRef]
- Jones, E.R.; Van Vliet, M.T.H.; Qadir, M.; Bierkens, M.F.P. Spatially-explicit estimates of global wastewater production, collection, treatment and re-use. Earth Syst. Sci. Data Discuss. 2020. [Google Scholar] [CrossRef]
- Cossio, C.; Norrman, J.; McConville, J.; Mercado, A.; Rauch, S. Indicators for sustainability assessment of small-scale wastewater treatment plants in low and lower-middle income countries. Environ. Sustain. Indic. 2020, 6, 100028. [Google Scholar] [CrossRef]
- Oliveira, G.A.; Colares, G.S.; Lutterbeck, C.A.; Dell’Osbel, N.; Machado, Ê.L.; Rodrigues, L.R. Floating treatment wetlands in domestic wastewater treatment as a decentralized sanitation alternative. Sci. Total. Environ. 2021, 773, 145609. [Google Scholar] [CrossRef]
- Chowdhury, S.D.; Bhunia, P.; Surampalli, R.Y. Sustainability assessment of vermifiltration technology for treating domestic sewage: A review. J. Water Process. Eng. 2022, 50, 103266. [Google Scholar] [CrossRef]
- del Castillo, A.F.; Garibay, M.V.; Senés-Guerrero, C.; Orozco-Nunnelly, D.A.; de Anda, J.; Gradilla-Hernández, M.S. A review of the sustainability of anaerobic reactors combined with constructed wetlands for decentralized wastewater treatment. J. Clean. Prod. 2022, 371, 133428. [Google Scholar] [CrossRef]
- Lourenço, N.; Nunes, L.M. Review of Dry and Wet Decentralized Sanitation Technologies for Rural Areas: Applicability, Challenges and Opportunities. Environ. Manage 2020, 65, 642–664. [Google Scholar] [CrossRef]
- Atanasova, N.; Castellar, J.A.; Pineda-Martos, R.; Nika, C.E.; Katsou, E.; Istenič, D.; Pucher, B.; Andreucci, M.B.; Langergraber, G. Nature-Based Solutions and Circularity in Cities. Circ. Econ. Sustain. 2021, 1, 319–332. [Google Scholar] [CrossRef]
- Daee, M.; Gholipour, A.; Stefanakis, A.I. Performance of pilot Horizontal Roughing Filter as polishing stage of waste stabilization ponds in developing regions and modelling verification. Ecol. Eng. 2019, 138, 8–18. [Google Scholar] [CrossRef]
- Sayedin, F.; Kermanshahi-pour, A.; He, Q.S. Evaluating the potential of a novel anaerobic baffled reactor for anaerobic digestion of thin stillage: Effect of organic loading rate, hydraulic retention time and recycle ratio. Renew. Energy 2019, 135, 975–983. [Google Scholar] [CrossRef]
- Lau, P.L.; Trzcinski, A.P. A review of modified and hybrid anaerobic baffled reactors for municipal wastewater treatment with a focus on emerging contaminants. Environ. Sci. 2024, 10, 1335–1354. [Google Scholar] [CrossRef]
- Aris, M.A.M.; Chelliapan, S.; Din, M.F.M.; Anwar, A.N.; Shahperi, R.; Selvam, S.B. Effect of effluent circulation and hydraulic retention time (HRT) on the performance of a modified anaerobic baffled reactor (MABR) during start-up period. Desalination Water Treat. 2016, 57, 18597–18605. [Google Scholar] [CrossRef]
- Vuitik, G.A.; Fuess, L.T.; Del Nery, V.; Bañares-Alcántara, R.; Pires, E.C. Effects of recirculation in anaerobic baffled reactors. J. Water Process Eng. 2019, 28, 36–44. [Google Scholar] [CrossRef]
- Nabaterega, R.; Kumar, V.; Khoei, S.; Eskicioglu, C. A review on two-stage anaerobic digestion options for optimizing municipal wastewater sludge treatment process. J. Environ. Chem. Eng. 2021, 9, 105502. [Google Scholar] [CrossRef]
- Ban, Q.; Li, J.; Zhang, L.; Jha, A.K.; Nies, L. Linking Performance with Microbial Community Characteristics in an Anaerobic Baffled Reactor. Appl. Biochem. Biotechnol. 2013, 169, 1822–1836. [Google Scholar] [CrossRef]
- Srivastava, S.; Brar, S.K.; Rao, S.; Kumar, P. Assessing operational issues in a modular sewage treatment plant and providing remedies via comprehensive modeling and simulation through GPS-X. J. Water Process Eng. 2024, 57, 104678. [Google Scholar] [CrossRef]
- Cruz, I.A.; Chuenchart, W.; Long, F.; Surendra, K.; Andrade, L.R.S.; Bilal, M.; Liu, H.; Figueiredo, R.T.; Khanal, S.K.; Ferreira, L.F.R. Application of machine learning in anaerobic digestion: Perspectives and challenges. Bioresour. Technol. 2022, 345, 126433. [Google Scholar] [CrossRef]
- Xie, Y.; Chen, Y.; Lian, Q.; Yin, H.; Peng, J.; Sheng, M.; Wang, Y. Enhancing Real-Time Prediction of Effluent Water Quality of Wastewater Treatment Plant Based on Improved Feedforward Neural Network Coupled with Optimization Algorithm. Water 2022, 14, 1053. [Google Scholar] [CrossRef]
- Golzar, F.; Nilsson, D.; Martin, V. Forecasting Wastewater Temperature Based on Artificial Neural Network (ANN) Technique and Monte Carlo Sensitivity Analysis. Sustainability 2020, 12, 6386. [Google Scholar] [CrossRef]
- Li, S.; Nan, J.; Gao, F. Hydraulic characteristics and performance modeling of a modified anaerobic baffled reactor (MABR). Chem. Eng. J. 2016, 284, 85–92. [Google Scholar] [CrossRef]
- Jasim, N.A. The design for wastewater treatment plant (WWTP) with GPS-X modelling. Cogent Eng. 2020, 7, 1723782. [Google Scholar] [CrossRef]
- Nasr, M.S.; Moustafa, M.A.E.; Seif, H.A.E.; El Kobrosy, G. Modelling and simulation of German BIOGEST/EL-AGAMY wastewater treatment plants—Egypt using GPS-X simulator. Alex. Eng. J. 2011, 50, 351–357. [Google Scholar] [CrossRef]
- Mu’azu, N.D.; Alagha, O.; Anil, I. Systematic Modeling of Municipal Wastewater Activated Sludge Process and Treatment Plant Capacity Analysis Using GPS-X. Sustainability 2020, 12, 8182. [Google Scholar] [CrossRef]
- Ullah, N.; Sheikh, Z.; Badshah, M. Municipal wastewater treatment with corrugated PVC carrier anaerobic baffled reactor. Water Sci. Technol. 2023, 87, 660–671. [Google Scholar] [CrossRef]
- Maryam, A.; Zeshan; Badshah, M.; Sabeeh, M.; Khan, S.J. Enhancing methane production from dewatered waste activated sludge through alkaline and photocatalytic pretreatment. Bioresour. Technol. 2021, 325, 124677. [Google Scholar] [CrossRef]
- APHA. Standard Methods for the Examination of Water and Wastewater, 23rd ed.; American Public Health Association: Washington, DC, USA, 2017. [Google Scholar]
- Zha, X.; Ma, J.; Tsapekos, P.; Lu, X. Evaluation of an anaerobic baffled reactor for pretreating black water: Potential application in rural China. J. Environ. Manage 2019, 251, 109599. [Google Scholar] [CrossRef]
- Aqanaghad, M.; Mousavi, G.; Ghanbari, R. Anaerobic Baffled Reactor and Hybrid Anaerobic Baffled Reactor Performances Evaluation in Municipal Wastewater Treatment. Iran. J. Health Saf. Environ. 2018, 5, 1027–1034. [Google Scholar]
- Hydromantis. 2019. Available online: https://www.hydromantis.com/help/GPS-X/docs/8.0/Technical/index.html (accessed on 20 December 2024).
- Faris, A.M.; Zwain, H.M.; Hosseinzadeh, M.; Majdi, H.S.; Siadatmousavi, S.M. Start-up and operation of novel EN-MBBR system for sidestreams treatment and sensitivity analysis modeling using GPS-X simulation. Alex. Eng. J. 2022, 61, 10805–10818. [Google Scholar] [CrossRef]
- Moghaddam, S.S.; Pirali, M. Modeling and calibration of a full-scale wastewater treatment plant using GPS-X model (A case study of Tehran). Numer. Methods Civ. Eng. 2021, 5, 67–76. [Google Scholar] [CrossRef]
- Ji, X.; Liu, Y.; Zhang, J.; Huang, D.; Zhou, P.; Zheng, Z. Development of model simulation based on BioWin and dynamic analyses on advanced nitrate nitrogen removal in deep bed denitrification filter. Bioprocess Biosyst. Eng. 2019, 42, 199–212. [Google Scholar] [CrossRef]
- Hellal, M.S.; Abou-Elela, S.I. Simulation of a passively aerated biological filter (PABF) immobilized with non-woven polyester fabric (NWPF) for wastewater treatment using GPS-X. Water Environ. J. 2021, 35, 1192–1203. [Google Scholar] [CrossRef]
- Donoso-Bravo, A.; Mailier, J.; Martin, C.; Rodríguez, J.; Aceves-Lara, C.A.; Wouwer, A.V. Model selection, identification and validation in anaerobic digestion: A review. Water Res. 2011, 45, 5347–5364. [Google Scholar] [CrossRef] [PubMed]
- Cao, J.; Yang, E.; Xu, C.; Zhang, T.; Xu, R.; Fu, B.; Feng, Q.; Fang, F.; Luo, J. Model-based strategy for nitrogen removal enhancement in full-scale wastewater treatment plants by GPS-X integrated with response surface methodology. Sci. Total Environ. 2021, 769, 144851. [Google Scholar] [CrossRef] [PubMed]
- Herrera-Melián, J.A.; Guedes-Alonso, R.; Tite-Lezcano, J.C.; Santiago, D.E.; Ranieri, E.; Alonso-Bilbao, I. The Effect of Effluent Recirculation in a Full-Scale Constructed Wetland System. Sustainability 2023, 15, 4310. [Google Scholar] [CrossRef]
- Nasr, F.A.; Doma, H.S.; Nassar, H.F. Treatment of domestic wastewater using an anaerobic baffled reactor followed by a duckweed pond for agricultural purposes. Environmentalist 2009, 29, 270–279. [Google Scholar] [CrossRef]
- Mahdi, F.K.; Abu-Alhail, S.; Dawood, A.S. Performance of the anaerobic baffled reactor for primary treatment of rural domestic wastewater in Iraq. Open Eng. 2022, 12, 859–865. [Google Scholar] [CrossRef]
- Tilley, E.A.; Ulrich, L.; Luthi, C.; Reymond, P. Compendium of Sanitation Systems and Technologies. 2014. Available online: https://www.researchgate.net/publication/283072433 (accessed on 6 February 2025).
- Morel, A.; Diener, S. Greywater Management in Low and Middle-Income Countries: Review of Different Treatment Systems for Households or Neighbourhoods. Swiss Federal Institute of Aquatic Science and Technology: Duebendorf, Switzerland, 2006; Available online: https://www.susana.org/en/knowledge-hub/resources-and-publications/library/details/947 (accessed on 6 March 2025).
- Liwarska-Bizukojc, E.; Biernacki, R. Identification of the most sensitive parameters in the activated sludge model implemented in BioWin software. Bioresour. Technol. 2010, 101, 7278–7285. [Google Scholar] [CrossRef]
- Reynaud, N.; Buckley, C.A. The anaerobic baffled reactor (ABR) treating communal wastewater under mesophilic conditions: A review. Water Sci. Technol. 2016, 73, 463–478. [Google Scholar] [CrossRef]
- Liwarska-Bizukojc, E.; Olejnik, D.; Biernacki, R.; Ledakowicz, S. Calibration of a complex activated sludge model for the full-scale wastewater treatment plant. Bioprocess Biosyst. Eng. 2011, 34, 659–670. [Google Scholar] [CrossRef]
- Elawwad, A.; Matta, M.; Abo-Zaid, M.; Abdel-Halim, H. Plant-wide modeling and optimization of a large-scale WWTP using BioWin’s ASDM model. J. Water Process Eng. 2019, 31, 100819. [Google Scholar] [CrossRef]
- Manariotis, I.D.; Grigoropoulos, S.G. Low-Strength Wastewater Treatment Using an Anaerobic Baffled Reactor. Water Environ. Res. 2002, 74, 170–176. [Google Scholar] [CrossRef] [PubMed]
- Krishna, G.V.T.G.; Kumar, P.; Kumar, P. Treatment of low-strength soluble wastewater using an anaerobic baffled reactor (ABR). J. Environ. Manage 2009, 90, 166–176. [Google Scholar] [CrossRef] [PubMed]
- Yenji, S.S.; Munavalli, G.R.; Koli, M.M. Field-scale anaerobic baffled reactor for domestic wastewater treatment: Effect of dynamic operating conditions. Water Pract. Technol. 2021, 16, 42–58. [Google Scholar] [CrossRef]
- Aqaneghad, M.; Moussavi, G. Electrochemically enhancement of the anaerobic baffled reactor performance as an appropriate technology for treatment of municipal wastewater in developing countries. Sustain. Environ. Res. 2016, 26, 203–208. [Google Scholar] [CrossRef]
- Sun, H.; Yu, N.; Mou, A.; Yang, X.; Liu, Y. Effluent recirculation weakens the hydrolysis of high-solid content feeds in upflow anaerobic sludge blanket reactors. J. Environ. Chem. Eng. 2022, 10, 107913. [Google Scholar] [CrossRef]
- Zhang, L.; Guo, B.; Mou, A.; Li, R.; Liu, Y. Blackwater biomethane recovery using a thermophilic upflow anaerobic sludge blanket reactor: Impacts of effluent recirculation on reactor performance. J. Environ. Manage 2020, 274, 111157. [Google Scholar] [CrossRef]
- Chow, W.L.; Chong, S.; Lim, J.W.; Chan, Y.J.; Chong, M.F.; Tiong, T.J.; Chin, J.K.; Pan, G.-T. Anaerobic Co-Digestion of Wastewater Sludge: A Review of Potential Co-Substrates and Operating Factors for Improved Methane Yield. Processes 2020, 8, 39. [Google Scholar] [CrossRef]
- Sarathai, Y.; Koottatep, T.; Morel, A. Hydraulic characteristics of an anaerobic baffled reactor as onsite wastewater treatment system. J. Environ. Sci. 2010, 22, 1319–1326. [Google Scholar] [CrossRef]
- Zhu, G.-F.; Li, J.-Z.; Wu, P.; Jin, H.-Z.; Wang, Z. The performance and phase separated characteristics of an anaerobic baffled reactor treating soybean protein processing wastewater. Bioresour. Technol. 2008, 99, 8027–8033. [Google Scholar] [CrossRef]
- Grobicki, A.; Stuckey, D.C. Hydrodynamic characteristics of the anaerobic baffled reactor. Water Res. 1992, 26, 371–378. [Google Scholar] [CrossRef]
- Kariyama, I.D.; Zhai, X.; Wu, B. Influence of mixing on anaerobic digestion efficiency in stirred tank digesters: A review. Water Res. 2018, 143, 503–517. [Google Scholar] [CrossRef] [PubMed]
- Santos, F.S.; Ricci, B.C.; Neta, L.S.F.; Amaral, M.C.S. Sugarcane vinasse treatment by two-stage anaerobic membrane bioreactor: Effect of hydraulic retention time on changes in efficiency, biogas production and membrane fouling. Bioresour. Technol. 2017, 245, 342–350. [Google Scholar] [CrossRef] [PubMed]
- Dharsika, N.; Raj, S.A.; Mohan, S.M. Hydrodynamic behaviour and treatment performance of the hybrid anaerobic baffled reactor. Desalination Water Treat. 2022, 268, 1–11. [Google Scholar] [CrossRef]
- Yurtsever, A.; Calimlioglu, B.; Sahinkaya, E. Impact of SRT on the efficiency and microbial community of sequential anaerobic and aerobic membrane bioreactors for the treatment of textile industry wastewater. Chem. Eng. J. 2017, 314, 378–387. [Google Scholar] [CrossRef]
- Nguyen; Ha, T.D.; Morel, A.; Moura, M. Decentralised wastewater treatment—New concepts and technologies for Vietnamese conditions. In Proceedings of the 2nd International Symposium on Ecological Sanitation, Lübeck, Germany, 7–11 April 2003. [Google Scholar]
- Chen, Y.; Shen, Y. Operational characteristics of anaerobic baffled reactor treating low strength wastewater. J. Univ. Sci. Technol. Suzhou (Eng. Technol.) 2006, 19, 35–38. [Google Scholar]
- Foxon, K.M. Analysis of a Pilot-Scale Anaerobic Baffled Reactor Treating Domestic Wastewater. Ph.D. Thesis, University of KwaZulu-Natal, Durban, South Africa, 2009. [Google Scholar]
- Reynaud, N. Operation of Decentralised Wastewater Treatment Systems (DEWATS) Under Tropical Field Conditions. Ph.D. Thesis, Technical University Dresden, Dresden, South Africa, 2015. [Google Scholar]
- Munavalli, G.R.; Sonavane, P.G.; Koli, M.M.; Dhamangaokar, B.S. Field-scale decentralized domestic wastewater treatment system: Effect of dynamic loading conditions on the removal of organic carbon and nitrogen. J. Environ. Manage 2022, 302, 114014. [Google Scholar] [CrossRef]


Disclaimer/Publisher’s Note: The statements, opinions and data contained in all publications are solely those of the individual author(s) and contributor(s) and not of MDPI and/or the editor(s). MDPI and/or the editor(s) disclaim responsibility for any injury to people or property resulting from any ideas, methods, instructions or products referred to in the content. |
© 2025 by the authors. Licensee MDPI, Basel, Switzerland. This article is an open access article distributed under the terms and conditions of the Creative Commons Attribution (CC BY) license (https://creativecommons.org/licenses/by/4.0/).