Article

Plant Growth Regulators and Short-Term Irrigation for Berry Maturation Homogeneity and Increased Coffea arabica Bean Quality

by
Miroslava Rakočević
1,*,
Eunice Reis Batista
1,
Fabio Takeshi Matsunaga
2 and
Maria Brígida dos Santos Scholz
3
1
Embrapa Meio Ambiente, Jaguariúna 13820–000, SP, Brazil
2
Campus Londrina, UniSENAI PR, Londrina 86062-030, PR, Brazil
3
Instituto Agronômico do Paraná, Londrina 86047–902, PR, Brazil
*
Author to whom correspondence should be addressed.
Sustainability 2025, 17(9), 3803; https://doi.org/10.3390/su17093803
Submission received: 6 March 2025 / Revised: 24 March 2025 / Accepted: 11 April 2025 / Published: 23 April 2025

Abstract

:
Gibberellic acid (GA3) may help to synchronize coffee flowering, whilst ethylene (in the form of Ethephon) may assist in advancing coffee berry maturation even when applied in the pre-flowering stage of phenophase. Functional–structural plant modeling (FSPM) can be used to help understand whole-plant responses, such as plant-scale photosynthesis. FSPM has never been used to investigate the response of coffee plants to external plant growth regulator (PGR) applications. We hypothesized that treatment with PGRs at the beginning of berry maturation (BM) during phenophase could (1) influence plant leaf area and plant photosynthesis at the end of BM and (2) assist in the uniformity of the berry maturation of seven-year-old coffee plants. Additionally, we assumed that (3) the distribution of berries over the vertical plant profile could be related to the coffee beans’ chemical quality, and that irrigated plants would have delayed maturation, but a higher yield than non-irrigated (NI) plants. To test these hypotheses, a short sustainable period of irrigation was applied six weeks before harvest. Irrigated plants were treated with GA3 or Ethephon. A combination of field measurements (leaf gas exchanges, berry collection and bean chemical analyses in relation to vertical plant strata) and computer modeling were used. At the beginning or the end of BM, coffee trees were coded using the VPlants modeling platform and reconstructed using CoffePlant3D software to compute the plant leaf area and plant photosynthesis. The greatest number of second-order red berries were found in the upper stratum, S3 (>160 cm), while slightly fewer were found in S2 (80–160 cm) belonging to the third-order axes, and the lowest number was found in S1 (<80 cm). Green berries were more representative in S2, with the greatest number belonging to the third-order axes. The participation of third-order axes in berry yield was up to approximately 37% for red berries and 25% for green berries. The greatest separation between PGRs could be seen in S2, where more berries in the Ethephon-treated plants were found than in the GA3 treated ones, while the dry mass (DM) percentage was higher in GA3 than in the Ethephon treatment. The percentage of DM in fresh mass was 17–28% in the green berries and 28–36% in the red berries. PGRs were important for homogenous berry maturity, especially GA3, which also showed the lowest total chlorogenic acid content. The NI plants showed reduced red and total berry production when compared to irrigated ones, indicating this horticultural measure is important, even during a sustainably reduced six-week period, due to preserved leaf area and plant photosynthesis, and it also increased the lipid and kahweol contents of irrigated plants when compared to NI plants, despite the maturation delay.

Graphical Abstract

1. Introduction

The flowering of Coffea arabica L. (Arabica coffee) in the regions of Central and South Brazil usually occurs with two to four flowering flushes per crop [1,2]. Various flowering periods induce asynchronization in coffee fruit ripening, which results in chemical modifications of coffee beans [2,3] and beverage quality [4], even when manually collecting the berries over various harvest periods. Additionally, when the coffee berries are mechanically harvested [5], the unripe berries lead to an astringent, grassy, hay-like, barn-like, or pea-like beverage taste, which negatively impacts coffee type classification [6].
Understanding which factors influence the plants’ physiological processes is crucial for developing strategies to improve berry maturation and overall coffee quality. The flower differentiation in serial buds in Arabica coffee is related to short day length, and this species is highly sensitive to changes of 30 min [7], as detected by several components of the circadian clock, which transform inductive photoperiodic signals into chemical and molecular signals that are directly associated with gene expression regulation related to flowering [8]. The period of floral development is different for cultivars of different maturation types, and lasts for three months in early cultivars and five months in late cultivars [9]. A long dry period occurring during the coffee-flowering stage in phenophase seems to help the coffee flower buds become sensitive to, and respond to, environmental stimuli [10,11]. After the coffee plants’ anthesis, the phenophases of leaf area and berry expansion occur [12], followed by the phenophase of berry maturation, during which berries are suitable for harvest [9,13]. In coffee plant physiology, the berries become a sink during all these phenophases, but interestingly, a decreased leaf photosynthesis rate (A) is observed in half-crop-load and full-leaf-area trees, meaning that a decreased A in coffee trees with a reduced load is independent of carbon metabolism, and, coupled with the decreased CO2 availability inside leaves, is regulated by stomatal conductance (gs) [14]. The coffee berry load increases with age, being higher in the second harvest when compared to the first, and shows a positive and significant effect on the A that is not expected for the leaf-to-fruit ratios obtained previously [15]. This result suggests that the source–sink relationship may vary with crop age and phenological phase, and it is not entirely dependent on the leaf-to-fruit ratio [16]. Therefore, the environmental variations, agricultural management [17], plant age [15] and genetic structure [18] will determine the final yield and quality of coffee plants.
Coffee maturity is most easily classified by berry color. The ripening stage with a purple/red color is known to be the optimal time for harvesting, characterized by predominantly glycoside and flavonoid synthesis, which differs from previous stages of green or orange/red berries [19]. Uniform Arabica coffee maturation is found to increase in orchards planted at altitudes greater than 900 m [20]. Growing coffee in 45% shade positively affects bean size and composition (with lower sucrose, chlorogenic acid and trigonelline content), as well as beverage quality, which is due to the delay in berry ripening by up to one month [21]. Coffee bean chemical composition is also impacted by light availability along the plant strata, with proteins that decrease from the bottom (shaded) to the upper strata (highly exposed to light) [22].
In climates characterized by one long and very dry period, coffee plants grown under rainfed conditions can completely fail to produce flowers or fruit in some years [23]. On the other hand, withholding irrigation in the pre-flowering stage contributes to uniform fruit maturation in Arabica coffee, even though the flowering does not occur within one single moment [24]. Uninterrupted irrigation induces non-uniform blossom, leading to uneven berry ripening and impaired harvesting efficiency [25]. An adequate water deficit in this flowering phenophase will induce more uniform coffee flowering, but irrigation is needed posteriorly to assure good floral initiation, positively impacting the final yield [26]. Controlled irrigation during the dry period associated with adequate NPK fertilization will increase berry yield and promote the formation of chemical components such as lipids, chlorogenic acids and caffeine [23]. The berry yield increases up to the 5–6th years of plant age, maintaining similar production up to the 7–8th years, and after that, there is a rapid decrease in productivity [27].
Coffee berry maturity can be promoted by the external application of plant growth regulators (PGR) and synthetic phytohormones, such is gibberellic acid (GA3), which may help to synchronize coffee flowering, whilst ethylene (in the form of Ethephon) may assist in advancing coffee berry ripening even in the pre-flowering stage [28]. Ethylene is a plant hormone that can stimulate or inhibit cell growth, induce flowering and sprouting, and promote the senescence of tissues and organs, the ripening of fruits, and the abscission of fruits and leaves [29]. Ethylene synthesis occurs in all plant parts, while its translocation is carried out by diffusion throughout the tissues, as a gas or dissolved in the xylem sap. Its synthesis may be stimulated by synthetic products, such as Ethephon, found in liquid form in commercial formulations [29]. Phytohormones act as key signal molecules that regulate various physiological and biochemical processes under normal and stressful conditions [30]. PGRs have great potential to improve agricultural yield and soil health, with low dependence on synthetic fertilizers and pesticides, making them an important option for farmers and growers looking to increase productivity and profitability in a sustainable manner [31]. For example, the commercial mixture of gibberellic acid, auxin and cytokinin zeatin applied in various phenophases can improve the productivity of Arabica coffee up to 46.9% [32].
Under water stress conditions, coffee leaf gas exchanges (A, gs, and transpiration –E) generally decrease due to stomata closing in order to reduce transpiration [33,34,35]. Under drought conditions, carbon fixation will be reduced in coffee leaves, negatively affecting the production of the photosynthates needed for both vegetative and reproductive growth [12,22,36]. Functional–structural plant modeling (FSPM), using 3D virtual coffee trees, can help integrate leaf A when considering whole-plant photosynthesis (Ap″) and helps in the understanding of whole plant responses to drought among genotypes and over time [35]. After four drought events that coffee plants experienced in the field, the A, gs, E, and carboxylation efficiency were found to be similar when comparing irrigated and rainfed conditions, suggesting the acclimation of leaf gas exchange to the environment, while Ap″ is always benefited by irrigation, due to increased plant leaf area [35].
FSPM has rarely been developed or adapted to evaluate the action of hormones and PGR in plants, as the software package was originally based on the VirtualLeaf framework, enabling the reuse of existing models and sub-model, permitting simulations of PGR inter-organ transport [37], or in a 3D model unifying auxin transport mechanisms [38]. As FSPM has never been used to investigate the response of coffee plants to external hormonal applications, here, we hypothesize that the external application of PGR (GA3 and Ethephon) at the beginning of BM would (1) have an impact on plant leaf area and Ap″ at the end of BM, and (2) assist in the uniformity of berry maturation of seven-year-old coffee plants. Additionally, we assumed (3) that the distribution of berries throughout the vertical plant profile could be related to coffee bean chemical quality, and that sustainably irrigated (IRR) plants (short-term irrigation during the BM) could delay maturation but result in higher yields than in not-irrigated (NI) plants. To test those hypotheses, leaf A was integrated at the plant scale through FSPM and the distribution of berries over the plant vertical profile was analyzed, together with the berry yield and chemical composition of coffee beans.

2. Materials and Methods

2.1. Field Conditions and Plant Material

The experiment was carried out at the Embrapa Environment Research Station (22°43′ S, 47°01′ W, 570 m a.s.l.), Jaguariúna–SP, Brazil. The climate is tropical, of Cwa type according to the Köppen classification, with hot rainy summers and dry winters [39]. The limiting factor for Arabica coffee vegetative growth in this climate is defined by low autumn and winter precipitations, which occurred in the period of coffee cultivation for the 2018 harvest, when a dry period was observed from April to May 2018 (Figure S1).
Seedlings with three to four pairs of leaves from one common cultivar, ‘Catuaí Vermelho IAC 144’, were transplanted to the field in March 2011, in a planting design of 3.5 m between rows and 0.6 m between plants in the row (~4700 plants ha−1). The soil in the experimental area is an alic, dark red latosol [40]. Two plots were selected, each of 25 m in length, containing four lines in a north–south orientation, one for short–term irrigation (IRR) and the other for rainfed (NI) conditions. In March of 2018, representative and similar seven-year-old plants were tagged in the central two lines of each of two experimental plots, twelve under IRR (because of PGR applications) and four under NI conditions, with heights of approximately 2–2.3 m.
The hoses for drip-irrigation were installed next to coffee tree trunks. Irrigation was applied only from April to May 2018 (start of the dry season/autumn), from the beginning to the end of the BM phenophase, based on a soil-water balance method, aiming at restoring the soil water field capacity [41]. NPK fertilization was performed by applications of 1000 kg ha−1 year−1 (20:5:15 NPK formulation, 210 g plant−1) split into three applications (350/350/300 kg ha−1) during the period of active vegetative growth (from October to March). These high doses were necessary for seven-year-old plants [23,42].

2.2. Treatment with Plant Growth Regulators (PGRs)

In this experiment, GA3 and Ethephon were applied only to irrigated plots, using four plants per treatment. For the preparation of GA3, a stock solution was prepared using 1 g of GA3 (C19H22O6, Sigma-Aldrich, Darmstadt, Germany) dissolved in 10 mL of pure ethanol and then diluted in 1 L of distilled water to obtain a concentration of 1000 ppm. To prepare the application solution, 25 mL of the GA3 stock solution were diluted in 500 mL of distilled water to obtain a GA3 concentration of 50 ppm with a drop of Tween™ 20 (Sigma-Aldrich, Darmstadt, Germany). For Ethephon preparation, a stock solution was also used, composed of 0.1 g (100 mg) of pure Ethephon (2–chloroethyl phosphonic acid, 96%, Sigma-Aldrich, Darmstadt, Germany) diluted in 100 mL of distilled water to obtain a concentration of 1000 ppm. For the application solution, 25 mL of the Ethephon stock solution was diluted in 500 mL of distilled water to obtain a concentration of 50 ppm with a drop of Tween™ 20.
GA3, Ethephon, and distilled water (control) applications, in a quantity of 125 mL per plant, were performed on 12 April 2018 when all berries were expanded and green. These applications were performed from the tops to the bottoms of plants and were done until the liquid dripped off the berries, even if leaves and branches were also attained.

2.3. Leaf Gas Exchange Measurements and Photosynthetic Capacity Modeling

The field measurements of leaf CO2 assimilation (A) versus CO2 inside the leaf (Ci)–A/Ci curve measurements were performed on fully expanded leaves in the middle (S2: 81–160 cm) and upper (S3 > 160 cm) strata of the canopy and in fully expanded leaves of 2nd-order axes, six weeks after the IRR piloting and PGR treatments. S1 (<80 cm) was not considered, because of the low number of leaves and the absence of a live terminal apex at the 2nd-order axes. Detailed C. arabica architecture descriptions and quantifications by strata were carried out in relation to plant density, genotype, water regime or external CO2 concentrations [2,12,16,22,40,43]. A/Ci curve measurements were performed using an infrared gas analyzer LICOR 6400 (LICOR, Lincoln, NE, USA) with a 6400–02B light source (blue and red diodes) on sunny days between 8:00 and 11:30 a.m. The leaf chamber conditions were set to a photosynthetic photon flux density (PPFD) of 800 µmol m−2 s−1, humidity 50–60%, leaf temperature of 25–30 °C and an air flow of 400 μmol s−1, while the external CO2 was set at the following steps: 400, 300, 200, 100, 0, 100, 200, 400, 600, 800, 1000, 1200 ppm. For each step, we allowed 2 min of stabilization time.
Five key parameters were modeled from the A/Ci curves: Vcmax (the maximum carboxylation rate of RuBisCO), Jcmax (maximum rate of electron transport for the given light intensity), TPU (maximum rate of triose phosphate use), Rd (daily dark respiration), and gm (mesophyll conductance) adjusted for a temperature of 25 °C (thus removing any stomatal influence). The AC3 photosynthesis model [44] was used as a base to fit the Anet/Ci data, along with using a provided spreadsheet [45].
Before each A/Ci curve was recorded, one instantaneous record of A, gs, E, Ci and leaf-to-air vapor pressure deficit (VPDleaf–air) was effectuated for each measured leaf at 400 ppm of CO2, and those field-measured values were used to calculate leaf gas exchange traits.

2.4. Plant Coding, 3D Reconstructions and Plant Photosynthesis Computing

The coffee plant structure was encoded in multiscale tree graphs (MTGs) [46] using three scales of decomposition—plant, axes and metamers. This was carried out on two dates in 2018: (1) before the start of irrigation (March), at the end of the berry expansion phenophase (BE), and (2) in BM when berry collection was carried out (May). The first date served to confirm the similarity among the chosen plants based on total plant area. Due to the long time periods necessary for MTG coding, about two to three days per coffee plant when carried out by two people, only two plants per treatment were considered, as was the case in previous studies [47,48]. The topological and geometric coffee traits were the same as in [12]. 3D reconstructions and visualizations were performed using CoffePlant3D software [49], which integrates a series of mathematical, computational and statistical methods to accurately reconstruct coffee plants in 3D, whatever the level of details available. The 3D reconstructed plants were rendered and visualized using PlantGLViewer [50], and exported to VegeSTAR, a software that allows the calculation of plant leaf area (LA), PPFD interception, and Ap″ based on light distribution among the organs of the plant canopy or plants [51]. The calculation of Ap″ using VegeSTAR requires information about sun azimuth and height, global radiation, diffuse radiation, air temperature and CO2. Detailed daily physical and meteorological parameters, such as daily variation in PPFD and temperature, were measured during a previous experiment [40], while other parameters were calculated using VegeSTAR (Sun azimuth and height). For the Ap″ computing, the modeled Vcmax, Jmax, and Rd were used to differentiate each plant and strata (see Section 2.3).
The validation of architectural modeling was performed using two approaches. The first was undertaken at the plant scale by comparing measured and reconstructed LA. The measurements based on leaf area index (LAI) of four treatments at two phenophases (BE and BM) were performed using an LAI-2000 plant canopy analyzer (LICOR, Lincoln, NE, USA). The procedure comprised a set of ten readings: the first was taken above the coffee plants, and the next eight below the tops of the plants at 0.1 m and at 0.35 m from the trunk oriented to the four cardinal points; the tenth reading was taken again above the coffee plants [46].
The second validation included measured (see Section 2.3) and estimated leaf photosynthesis. The last was performed for leaves reconstructed with 16 triangles [49], used to estimate single-leaf photosynthesis (A′, µmol m−2 s−1) [35]. The estimated values (A′) were extracted from VegeSTAR outputs, where the position of the leaf at which A was measured was considered. Finally, the A′ values were compared to A values. Mean diurnal plant photosynthesis (Ap″) was obtained by the integration of the mean diurnal leaf photosynthesis of a plant (Ap′) and the LA of a plant in m2; this factor was also estimated via 3D reconstruction [35,43].
The MTGs, resulting from field coding, were used to determine and quantify the distribution of berries and the distribution of their ripeness in the Z dimension. In March 2018, all of the berries were at the end of expansion, and all were green. The quantification of the remaining number of berries and their qualifications (red, green) took place before harvest, and their positions differed between the second and fifth branching order axes in BM. The berries derived from different branching orders were uploaded into the analysis of irrigation efficiency and the effect of PGR on berry maturation. As a difference in berry number in BM and BE, the % of berry lost (shut) was calculated for each treatment.

2.5. Berry Harvest

Coffee berries were harvested from four plants in each treatment over the three strata of the vertical plant profile, S1–S3. Berry collection was carried out between 23 and 25 May, 2018. After the harvest, berries were separated into red (mature) and green (not mature), and their fresh masses (FMs) were weighed separately. Those berries were dried separately in an airstream in the shade, and weighed when they had attained a stable dry mass (DM). The ratio of red to green berries in DM was calculated, as was the percentage of DM in the FM of red and green berries.

2.6. Coffee Bean Chemical Analysis

The dried red berries were separated from the berry husks and impurities, resulting in representative coffee beans. Defective beans were excluded prior to grinding. As the quantity of beans from the S1 was very low, the analyses were performed only on beans originating from S2 and S3. The processed beans were stored in a dry area in paper bags. The coffee beans from each PGR-treated plant, each stratum and each water availability area were frozen with liquid nitrogen at −196 °C and then ground in a laboratory disk mill (Perten 3600, Kungens Kurva, Sweden) to a particle size of 0.5 mm, packed in plastic bottles, and kept at −18 °C until analysis. The determination of caffeine (CAF), lipids (LIP), protein (PRO), sucrose (SUC), total sugar (TS), total chlorogenic acid (CGA), kahweol (KAH) and cafestol (CFT) in coffee beans was performed using a near-infrared spectroscopy technique (NIR, SYSTEM 6500 spectrophotometer, Foss–Perstorp employing ISIscan software, Foss, Silver Spring, MD, USA). The ISIscan software package (Foss) was used to control the recorder, to collect the spectra, and to import and analyze the data. The NIR reflectance spectra were collected at 2 nm intervals from 1100 to 2500 nm using a rectangular cell containing 6 g of ground coffee beans, and all data were saved as the average of 32 scans. Two replicates of the NIR spectra were collected for each coffee sample (four for each stratum per plant) and averaged. The concentration of each compound was calculated using a prediction model [52,53].

2.7. Statistical Analysis

The ‘R’ [54] libraries and functions were used for statistical analyses. The experimental design was completely randomized, with plant or stratum as statistical units, and two or four repetitions carried out. Data were subjected to analyses of variance (ANOVA), after testing the hypothesis of variance homogeneity. Two-way ANOVA considered a mixed linear model (‘nlme’ package) and maximum likelihood was used to test for significant differences among the effects of plant growth-regulators (GA3, Ethephon and control), plant strata or water regimes (IRR and NI) and plant strata on coffee berry mass and green bean chemical composition. If no significant interaction was found, the model reduction was applied and fitted again. A one-way ANOVA was also applied to estimate the effects of PGR or water regimes on leaf gas exchanges, A/Ci curve parameters, photosynthesis at the plant scale, or percentage of berries or leaf area over different order branches. In comparison, among the averages estimated by the ANOVA models, the Tukey HSD test with a significance of 0.05 was used, supported by ‘lsmeans’ (for least-squares mean calculation) and ‘multcompView’ (for visualization of pairwise comparisons in ANOVA statistical analysis) packages. The accuracy of modeling was estimated through linear regressions comparing measured (A) and estimated (A′) leaf photosynthesis or measured and estimated LAI, considering root mean squared error (RMSE), R2, and bias (package ‘qpcR’).

3. Results

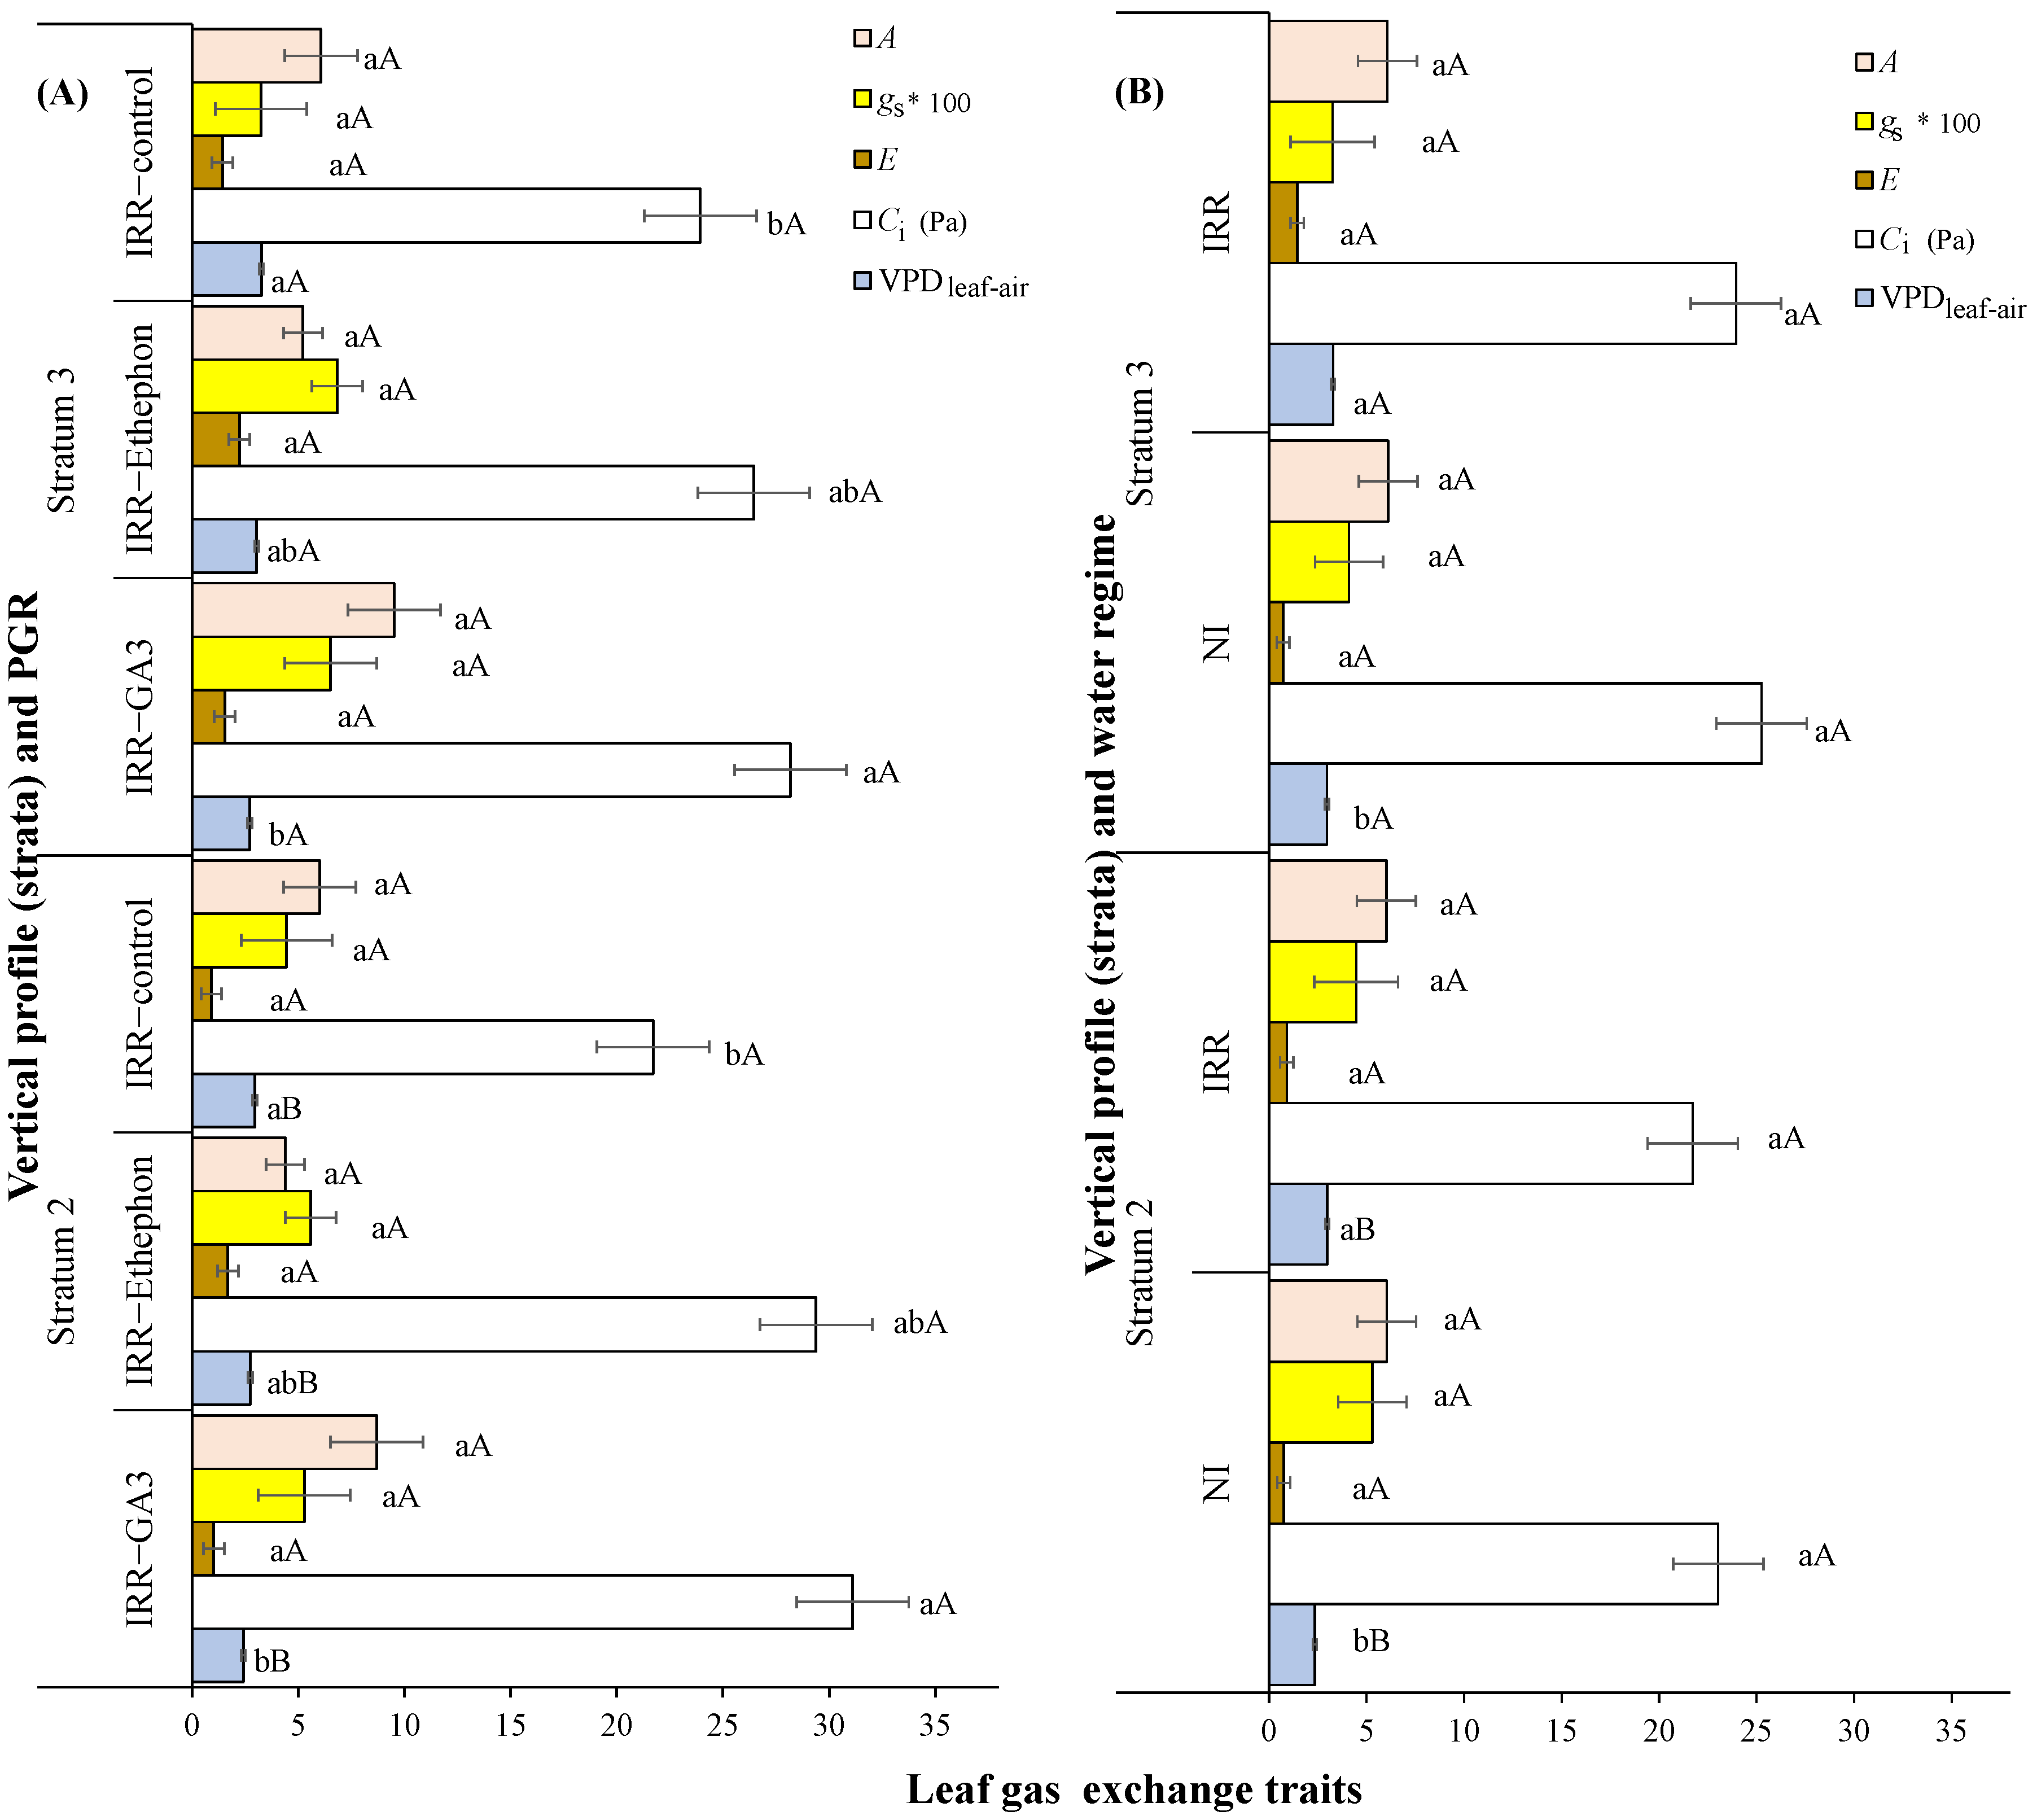
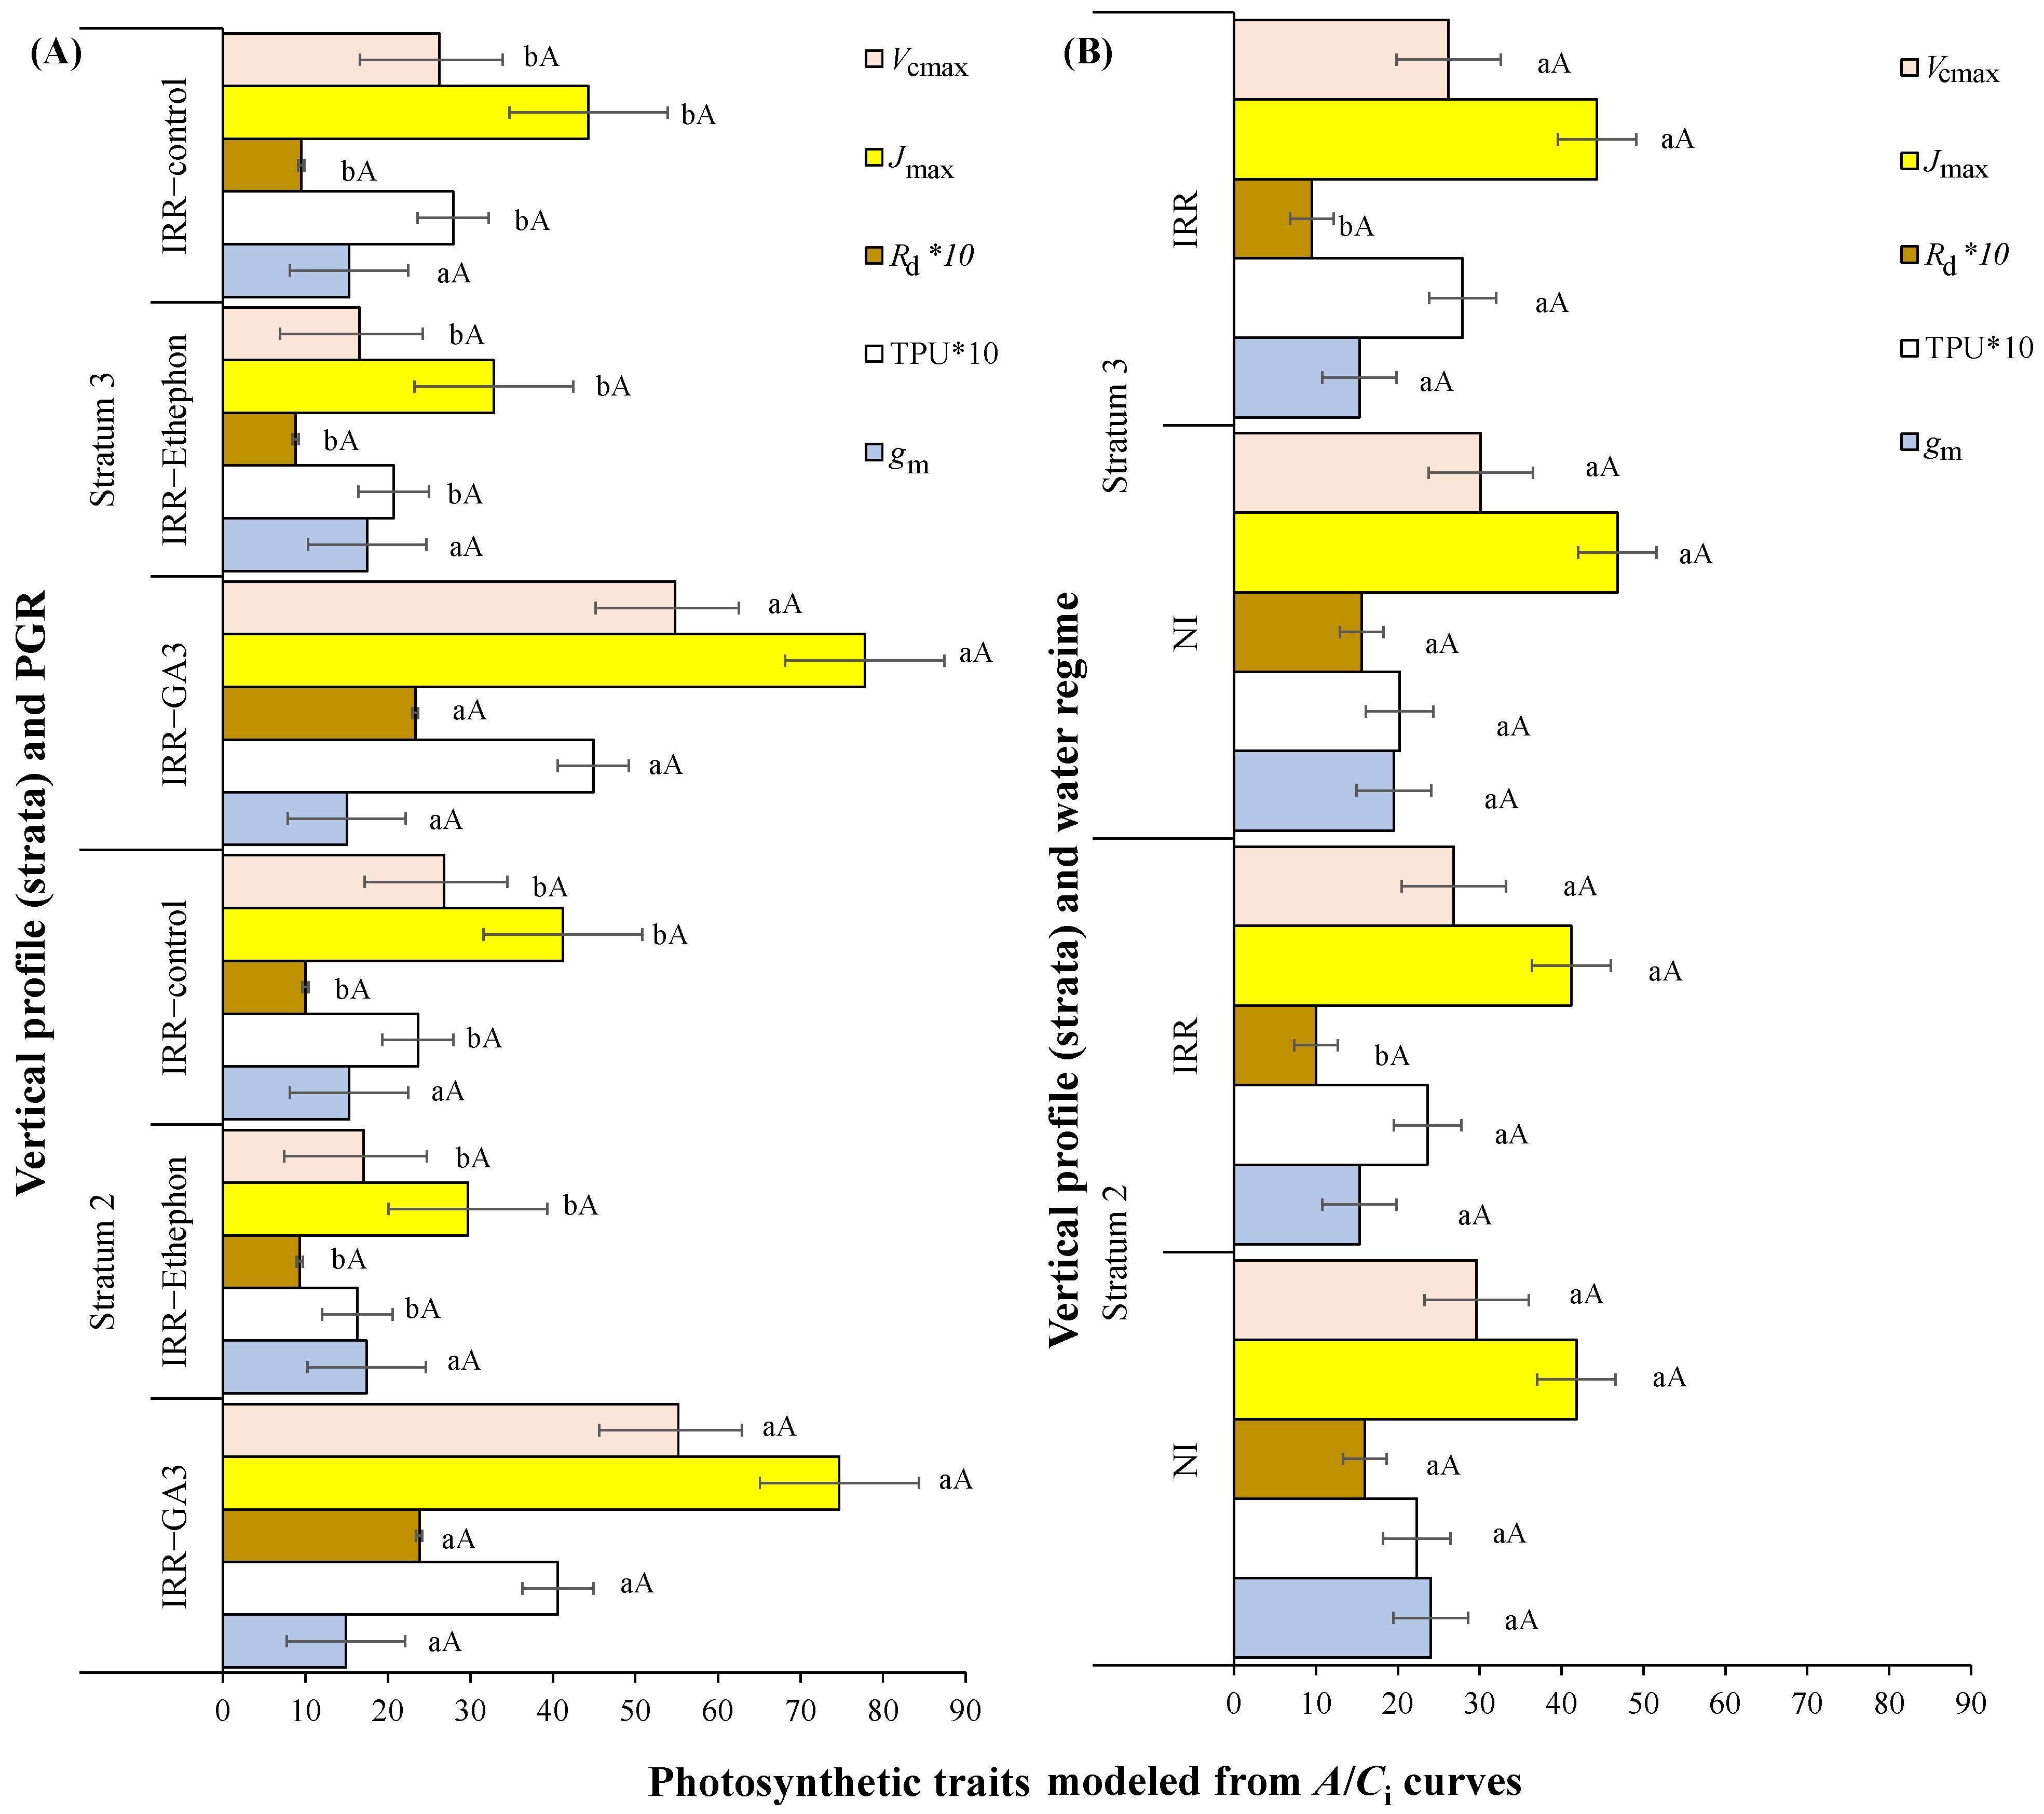
3.1. Leaf Gas Exchanges over the Plant Vertical Profile in Relation to PGRs or Water Regime

Among the leaf gas exchanges, A, gs and E did not vary with applications of PGR or water regime modifications (Figure 1). Ci increased after GA3 application compared to the control, while the opposite was observed for the VPDleaf–air response, with higher VPDleaf–air values in the control than in GA3 plants (Figure 1A). Also, very slight modifications of leaf gas exchanges were observed due to the effect of vertical leaf position. Only VPDleaf–air was higher in the upper S3 than in middle shaded S2 in both observed situations for PGR application (Figure 1A) and the two water regimes (Figure 1B). Interestingly, VPDleaf–air was higher in irrigated plants than in NI plants (Figure 1B).
The most intensive Vcmax, Jmax, TPU and Rd were observed in plants treated with GA3, while Ethephon and control plants showed lower values that were similar between the two last treatments (Figure 2A). The irrigated plants had lower Rd than NI plants, as expected (Figure 2B). gm did not vary with PGR applications, water regime or plant stratum. The photosynthetic traits calculated from the A/Ci curves showed similar values for the two distinct strata (Figure 2).

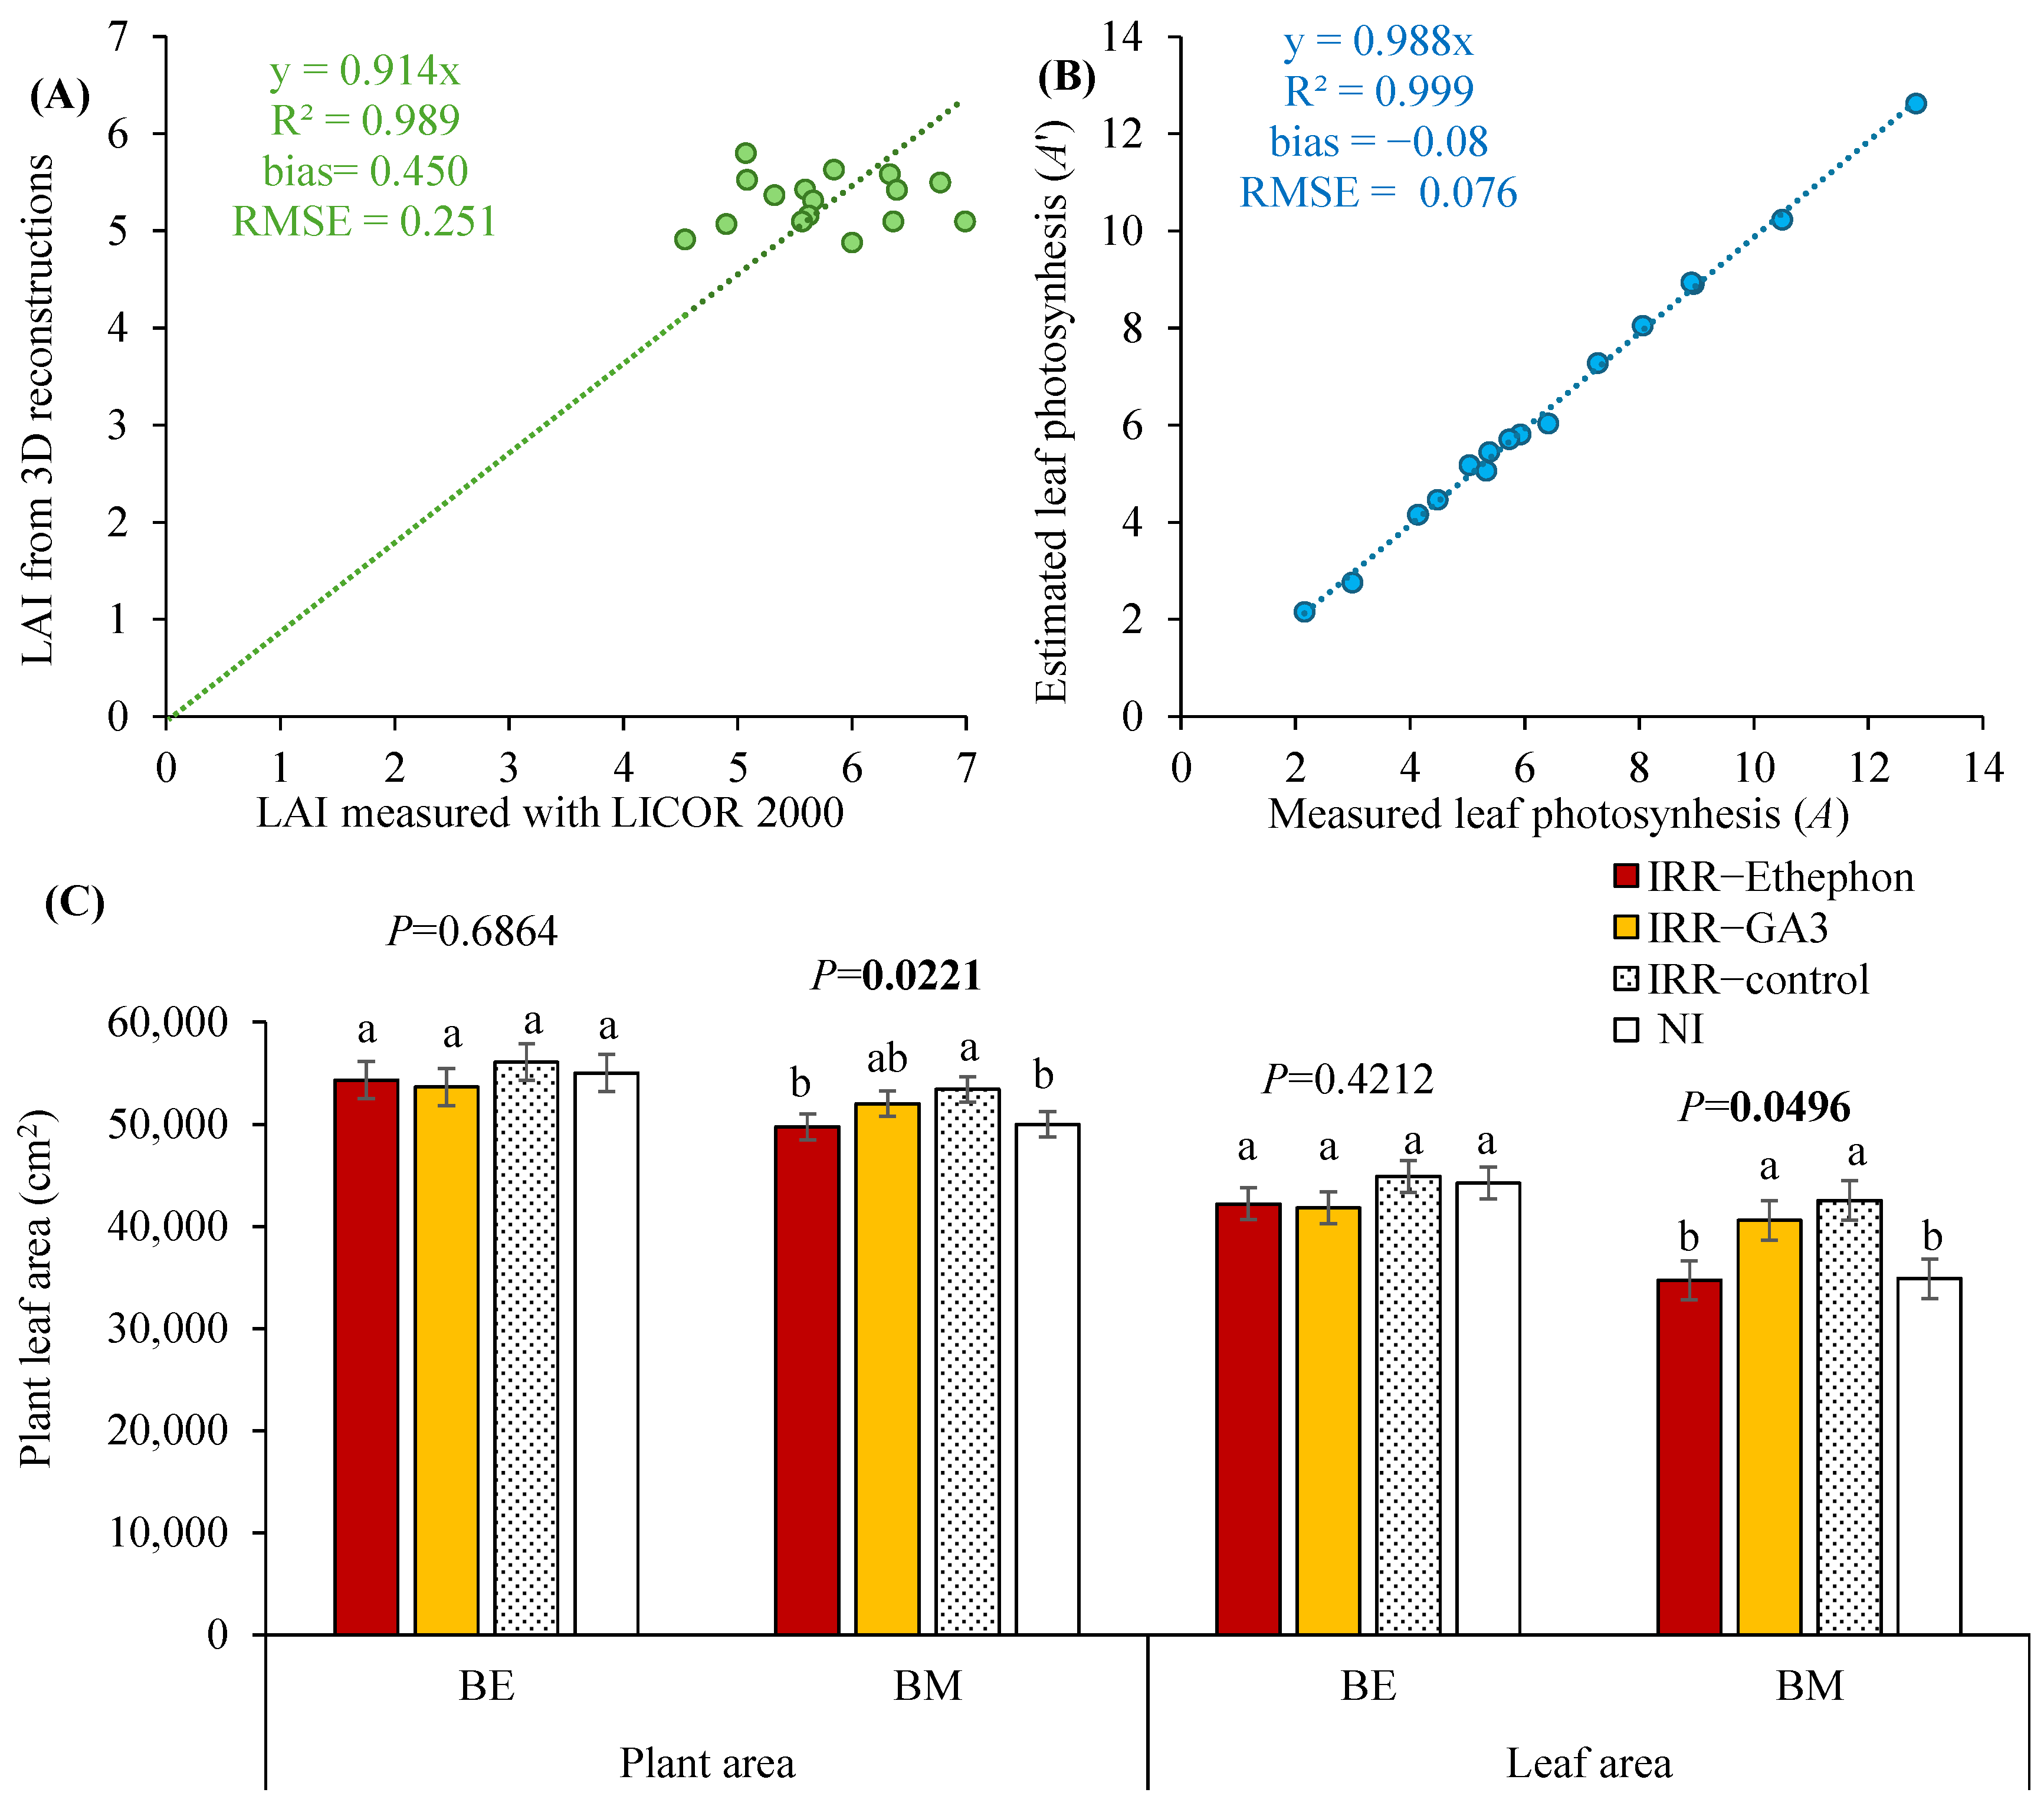
3.2. Validation of 3D Plant Reconstructions, Estimations of Leaf Area and Plant Scale Photosynthesis in Relation to PGRs or Water Regime

The measured and estimated values of LAI were well adjusted when considering the measured and reconstructed values, having a high R2 of 0.989, bias of 0.45 and RMSE of 0.251 for LAI of ~7 m2 m−2 (Figure 3A). Such an elevated LAI was related to the advanced coffee age. We selected plants of similar sizes, and the LAI did not vary significantly.
The measured and estimated A values over two plant strata showed high adjustment, expressed in elevated R2 (0.999), and very low bias (−0.08) and RMSE (0.076). The A varied, because of the two strata wherein it was measured (one light-exposed and the second shaded), which significantly impacted A intensity (from 2 to 14 μmol CO2 m−2 s−1) (Figure 3B).
Plant LA was similar between the reconstructed plants in the BE phenophase, before the application of PGR or irrigation (Figure 3C), which validates the good experimental procedure. In the BM phenophase, after receiving PGR and water regime treatments, the highest plant LA was observed in control (irrigated) plants, while it was the lowest in NI plants and in plants that received Ethephon.
The LA values of representative virtual plants of the two PGR treatments and the two water regime treatments are shown (Figure 4A). Using such 3D reconstructions, the Ap′ (Figure 4B) and Ap″ (Figure 4C) were computed. Similar to the A (Figure 1), the Ap′ did not differ among the PGR treatments (Figure 4B) or between the two water regimes (Figure 4C). On the other hand, the Ap″ was similar among the PGR treatments (Figure 4D), despite a lower LA in the Ethephon treatment (Figure 3C), but it significantly differed between the irrigated and NI plants (Figure 4E), being 32% lower under the NI conditions due to the reduced LA (Figure 3C).

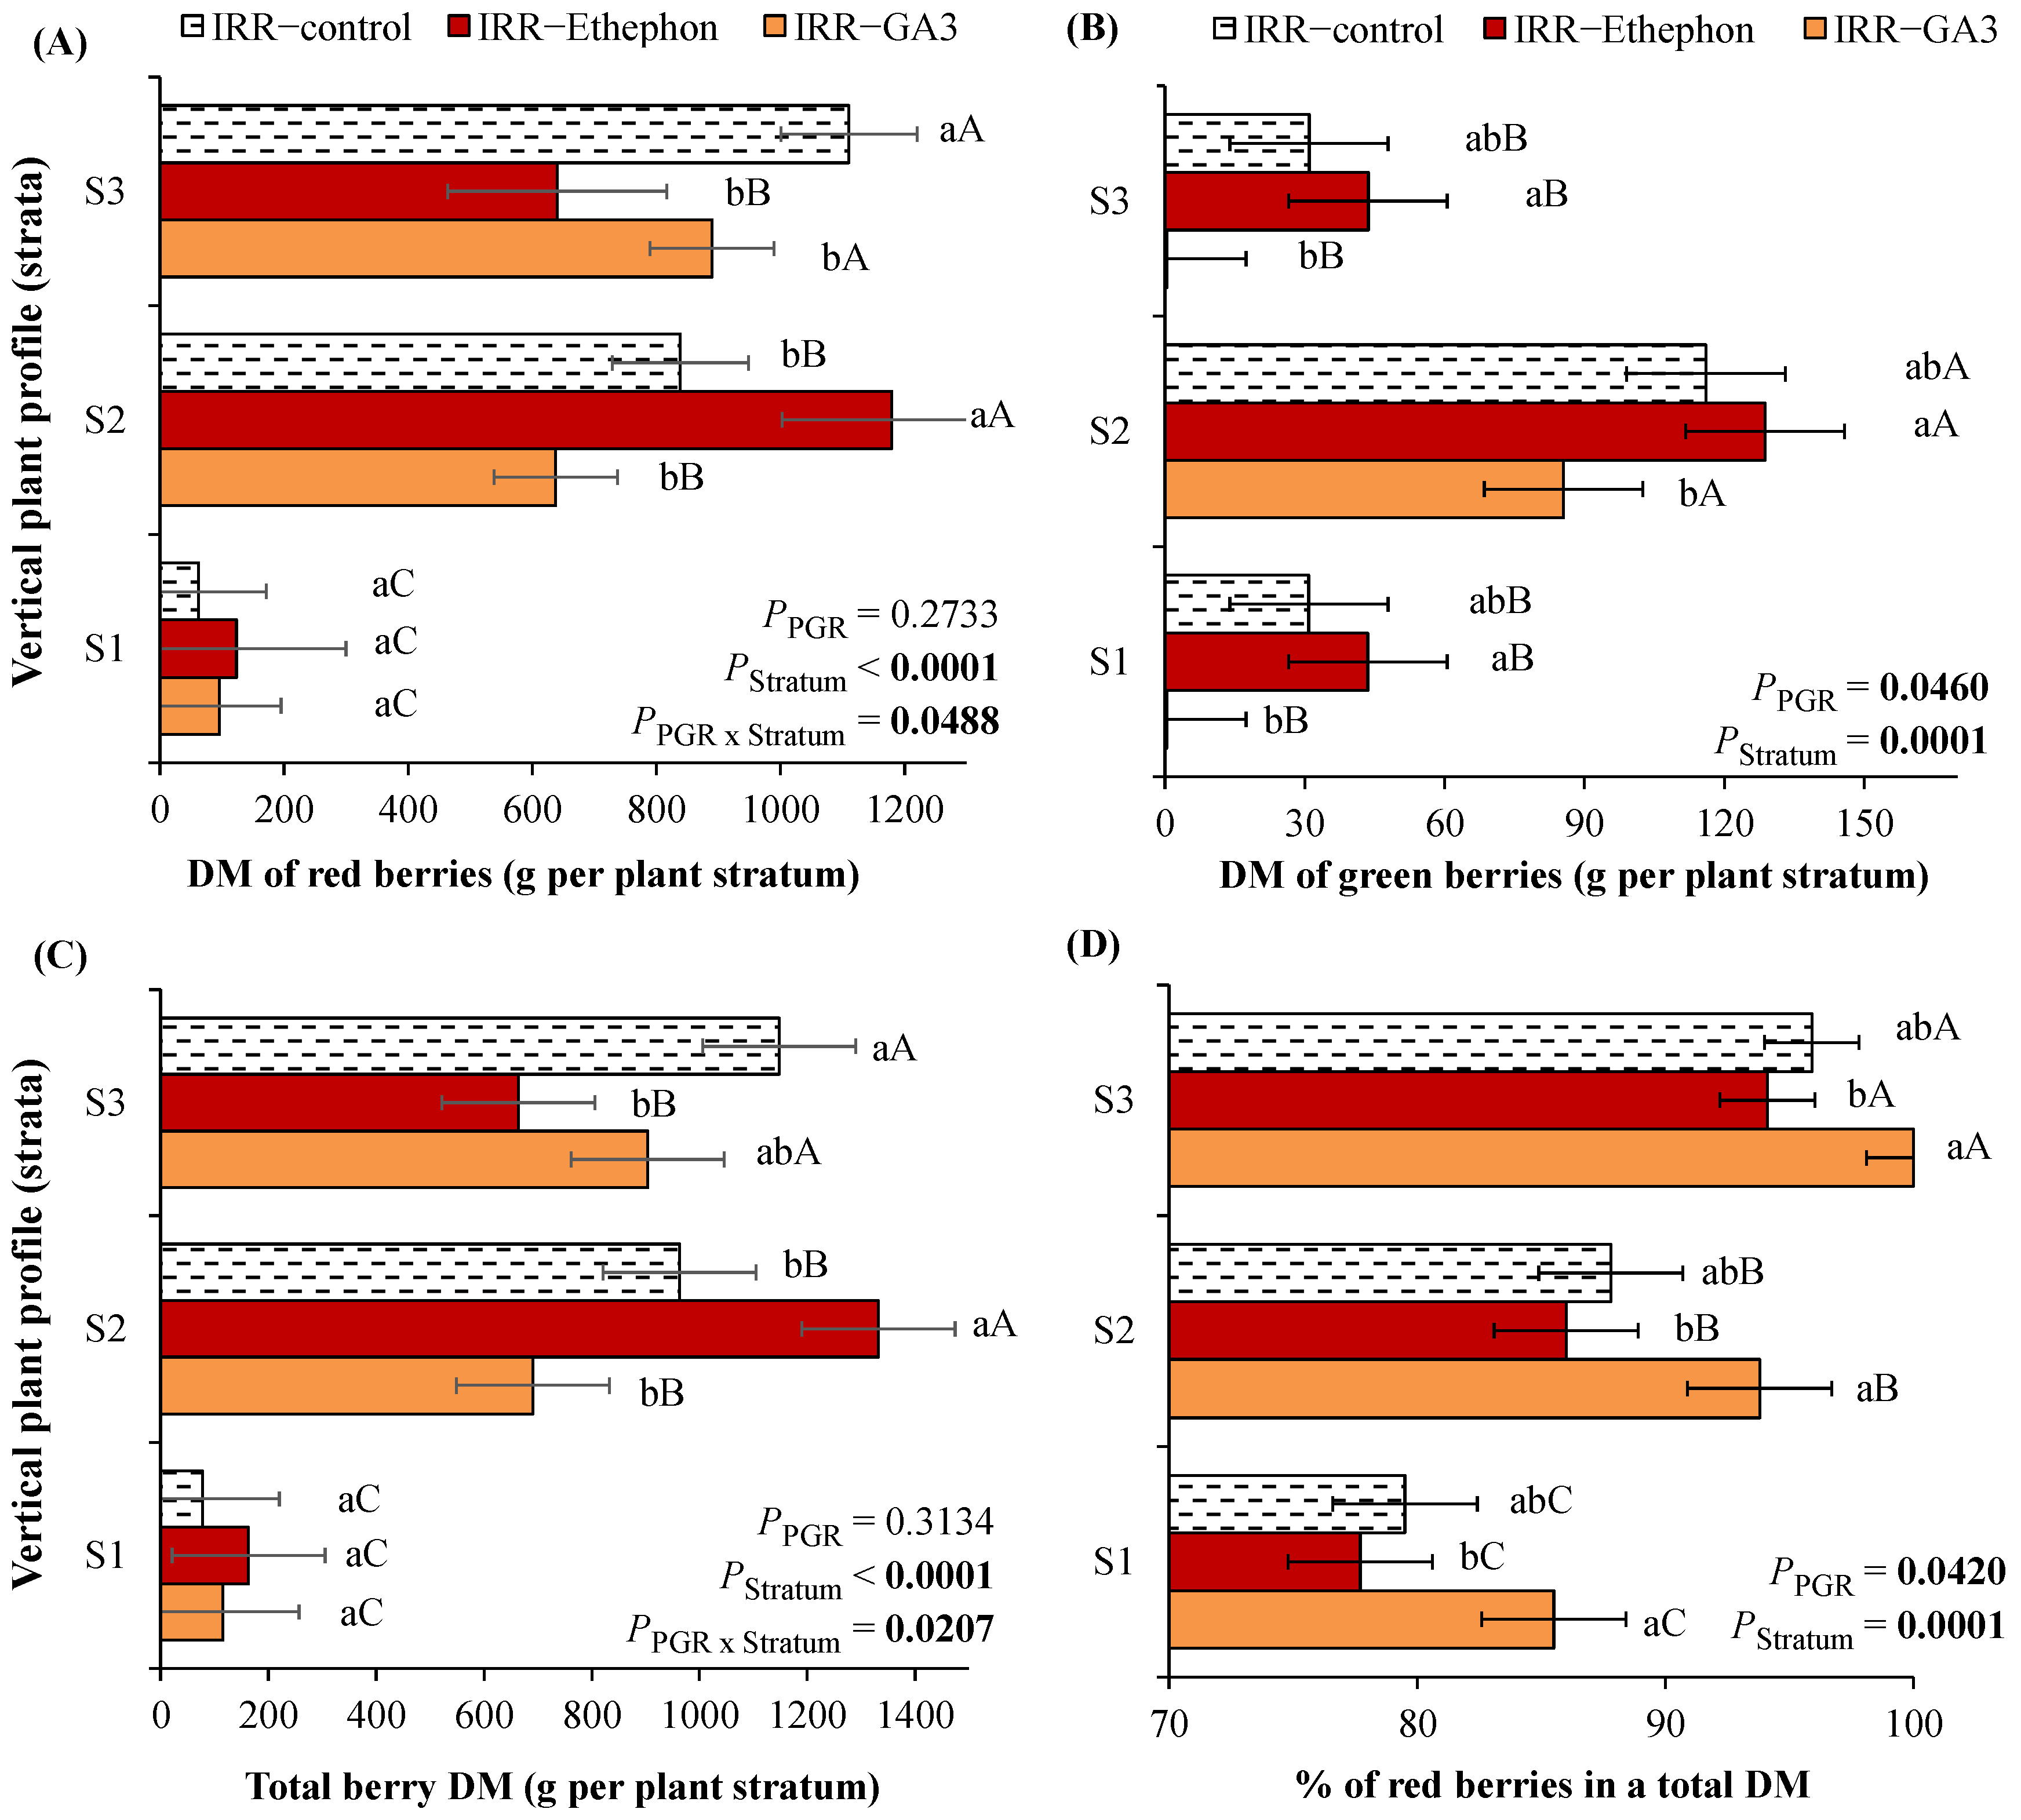
3.3. The Distribution of Red and Green Berries over Branching Orders as Dependent on PGRs or Water Regime

PGR application modified the participation of third-order red berries and the participation of the second-order green berries in the total number of berries harvested (Figure 5A). The highest participation of third-order red berries was found after Ethephon application, while the lowest was seen after GA3 application. A lower participation of second-order green berries was determined following Ethephon or GA3 applications when compared to control. Similarly, under NI conditions, the participation of green second-order berries was reduced, while the participation of the third-order red berries increased in comparison to irrigated plants (Figure 5B).
The participation of fourth- and fifth-order berries in production was very low (0–13.2%). It is worth considering the importance of third-order branching in berry production, as it was slightly lower than or equal to second-order branch production, for both red and green berries (Figure 5A,B). Following PGR application (Figure 5A), or under irrigation (Figure 5B), the third-order green berries were even more numerous than the second-order ones, due to the positions of the former ones (more shaded, demanding longer maturation).
The percentage of berries lost was calculated from the moment of PGR application and from the beginning of irrigation up until harvest time (from the end of BE to the end of the BM phenophase). Losses were 5.5 to 6.0%, and this was not impacted by PGR application (PPGR = 0.996). Under the rainfed conditions, the loss was about 10.3%, significantly higher than under irrigated conditions (PWater = 0.047).

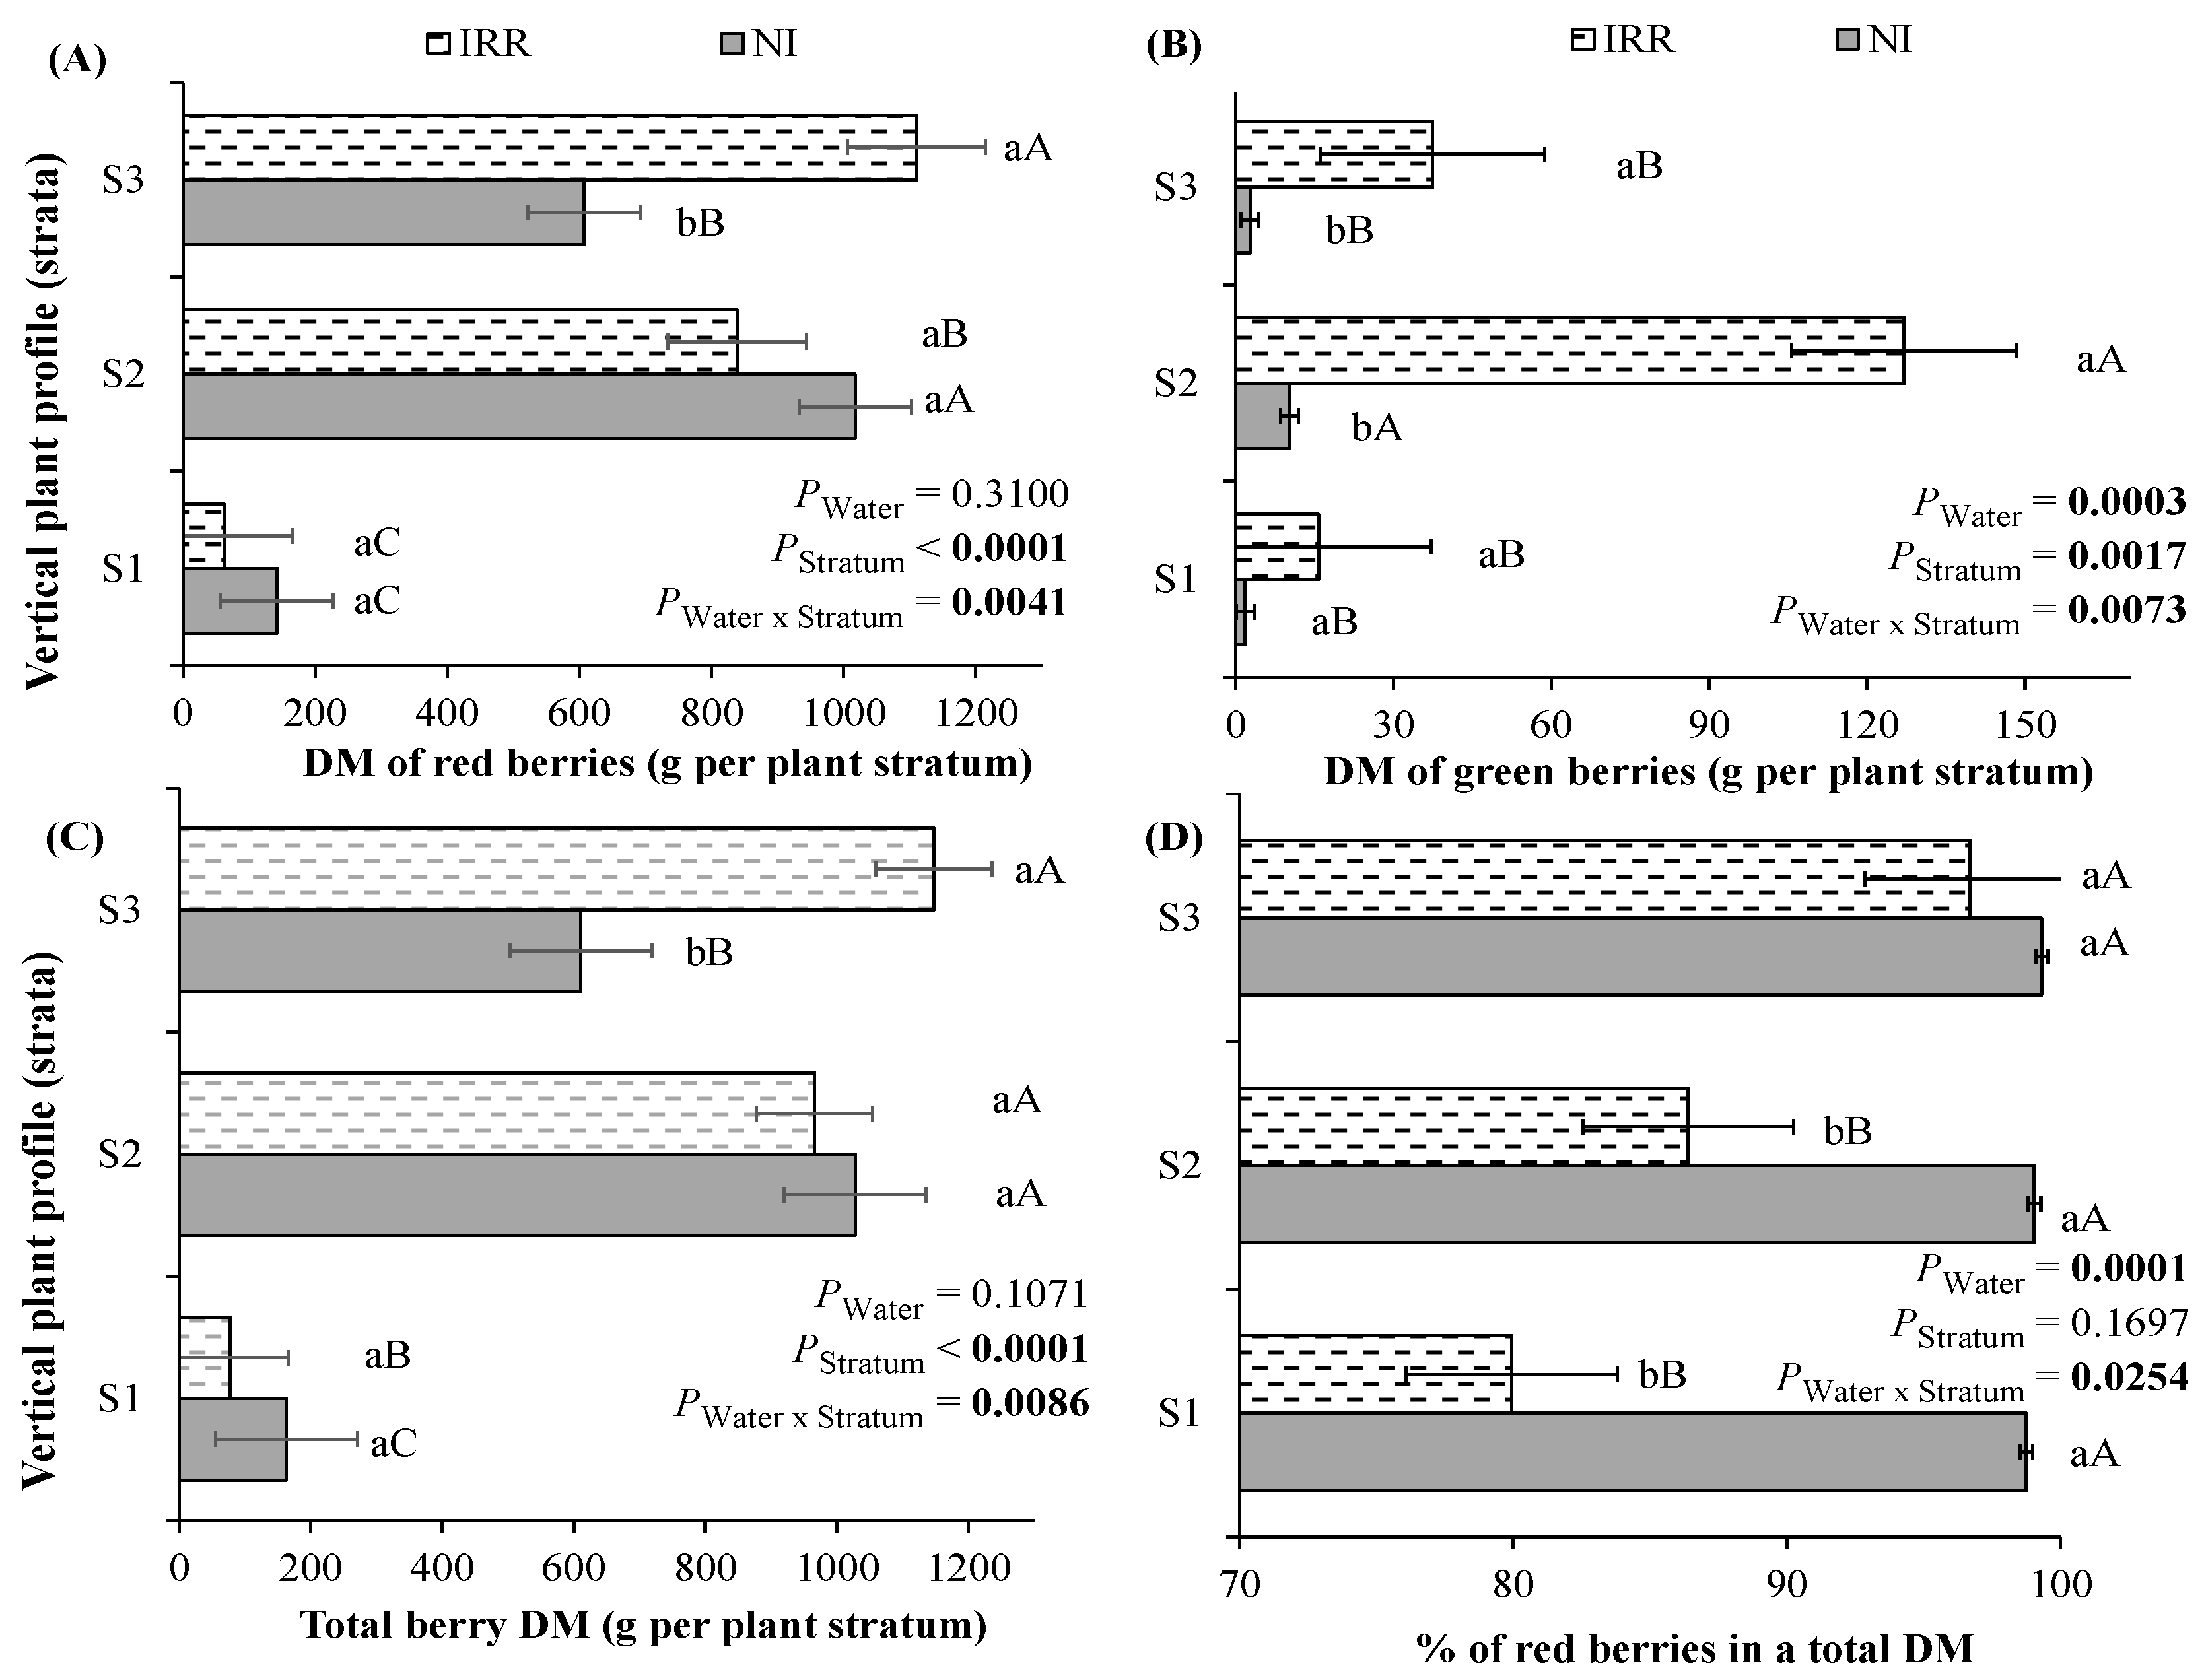
3.4. The Fresh and Dry Mass of Red and Green Berries over the Plant Vertical Profile as Dependent on PGRs or Water Regime

The lowest production of FM and DM of red and total berries was observed in the lowest plant stratum, S1, irrespective of the application of PGR (Figure S2A,C and Figure 6A,C, respectively) or the water regime (Figure S3A,C and Figure 6A,C, respectively). Green berry FM (Figure S2B) and DM (Figure 6B) did not differ between S1 and S3, and was highest in S2. The total berry and red berry DMs of control or GA3 plants were the most abundant in the highest S3 stratum, while in plants with Ethephon application, the highest production was seen in S2 (Figure 6A and Figure 6C respectively). The participation of red berries in total FM and DM over the three strata was as follows: S3 > S2 > S1 (Figure 6D).
We wanted to determine whether coffee plants respond positively to PGR application, increasing berry maturation as judged by DM and FM. The FM of red and total berries did not differ among the two PGR treatments over three strata (Figure S2A,C). On the other hand, lower FM and DM values of green berries were observed in the GA3 compared to the Ethephon treatment (Figure S2A,B and Figure 6A,B, respectively), while higher percentages of red berry FM and DM in total berry biomass were found in GA3 when compared to Ethephon (Figure S2D and Figure 6D, respectively), indicating GA3 as the PGR with the highest positive effect on berry maturation.
We also sought the response of FM and DM distribution to irrigation. The FM and DM of red berries were lower under NI conditions only in S3, while no difference was observed in S2 or S1 (Figure S3A,C and Figure 7A,C respectively). The FM and DM of green berries were lower under NI than under irrigation (Figure S3B and Figure 7B), suggesting delayed maturation under irrigation. Finally, the percentage of red berries in total FM or DM was not affected by water regime (Figure S3D and Figure 7D, respectively). The irrigated plants had a lower percentage of red berries in S2 and S1 (shaded strata) than plants grown under NI conditions.
The percentage of accumulated DM in the FM of red and green berries was the highest in S3, which consistently differed from S1 (Figure 8). PGR applications had no effect on the percentage of DM in red berries (Figure 8A), nor the water regime (Figure 8C). In contrast, the lowest percentage of DM in green berries was observed in the GA3 treatment, differing from Ethephon and the control (Figure 8B), suggesting that GA3 can delay DM accumulation in green berries at harvest time, in compensation for increased DM accumulation in red berries, which can compete for assimilates with the green ones on the same plant. No effect of water regime was observed on the percentage of DM of green berries (Figure 8D). The percentage of DM was 17–28% in the FM of green berries and 28–36% in the FM of red berries.

3.5. The Chemical Composition of Coffee Beans over the Plant Vertical Profile Is Dependent on PGRs or Water Regime

The PRO, LIP and CAF contents and the PC in coffee beans varied over the vertical plant profile (Figure 9). PRO, CAF, and PC had lower concentrations in the upper well-lit S3 than in S2, which contrasts the finding for LIP, which was more abundant in the upper than in the middle canopy stratum. Coffee beans issued from plants treated with the two PGRs, GA3 and Ethephon, showed lower LIP contents than the control (Figure 9A). The CGA content in coffee beans was lower when plants were treated with GA3 than when they were treated with Ethephon or in control plants. The PC content showed the following order: control > Ethephon > GA3.
Under the NI condition, the LIP and kahweol contents were reduced when compared to irrigated conditions (Figure 9B). The contents of sucrose, total soluble sugars and cafestol did not vary over the vertical plant profile with PGR applications (Figure 9A) or under two water regimes (Figure 9B).

4. Discussion

4.1. The Use of Architectural Analysis in Determination of PGR or Water Regime Impacts on Entire Plant Photosynthesis, Plant Leaf Area and Berry Distribution over Branching Orders

The novelty of this experiment is related to the use of architectural analyses of berry distribution along the second- to fifth-order axes (Figure 5) and Ap″ (Figure 4 and Figure 5) in determination of responses to PGRs and irrigation during the BM phenophase. The architectural analysis showed significantly higher values of leaf and berry drop in NI and Ethephon plants than in irrigated ones during the BM phenophase (Figure 3C), but Ap″ did not differ among the PGRs (Figure 4C), while it was lower under NI conditions than under irrigation (Figure 4D) due to the reduced LA. Ethephon is a known bioregulator that promotes leaf senescence and leaf drop, as seen in a cluster zone of grapevines during the maturation phenophase [55]. This leaf drop does not interfere with other vegetative and productive parameters, but improves the nitrogen use efficiency of vines, ensuring a balanced nitrogen nutrition [56]. Such ratiocination can explain the Ap″ of coffee plants treated with Ethephon, which, despite the reduced LA, did not differ from the results in control or GA3-treated plants (Figure 4C). the FSPM application executed herein suggested that drought had the greatest negative impact on CO2 assimilation at the plant scale, indicating the necessity of crop irrigation in the BM phenophase.
The architectural analysis of fruit distribution by branching orders and vertical profile suggests the importance of knowledge and experimentation that deals with other axis orders, not just the second order in the middle third of the plants, as is normally conceptualized in experiments with coffee plants [57]. The participation of the third order axes in berry yield was up to 37% for red and 25% for green berries (Figure 5). After the application of the two PGRs (GA3 and Ethephon), the percentage of third-order green berries was reduced when compared to IRR (control), while under GA3 treatment, the third-order red berry percentage was the lowest. Such distribution in GA3 plants can be explained by an elevated percentage of second-order berries, and because GA3 application synchronizes [58] and advances coffee berry ripening [28] even when applied during the pre-flowering phenophase. There was an increased percentage of third-order green berries under irrigation compared with NI conditions (Figure 5), indicating that the irrigated plants had delayed maturation, as previously described under conditions of dense coffee plantation irrigation [59]. The increased participation of green berries in third-order axes also indicates that a great number of the third-order berries were issued following flowering that occurred after the flowering of the second-order axes. This should be further investigated in future studies.

4.2. The Use of PGGs to Increase Uniformity of Berry Maturation over the Vertical Plant Profile—Relations to Bean Chemical Quality

When applied, liquid Ethephon decomposes to gaseous ethylene, which is promptly absorbed by the plant tissues, stimulating the plant to produce more ethylene in a positive feedback loop, which can be applied in various fruit phenophases, resulting in the benefit of uniform maturation and the anticipation of the harvest [60], but without effects on the final yield in the case of plums [61]. In grapevines, Ethephon application improves technological and phenolic grape maturation parameters, such as pH, total polyphenols and anthocyanin, and reduces the total soluble solids [55]. Similarly, this was also observed in our experiments, where Ethephon increased total coffee bean polyphenols (Figure 9A), impacted red berry FM and DM in the second stratum (Figure S2A and Figure 6A), and led to higher total berry mass (Figure S2C and Figure 6C), and a higher percentage of red berries of the third-order axes than in control plants (Figure 5A). GA3 application can help to synchronize and advance coffee berry ripening when applied during the pre–flowering phenophase [28,58], while GA3 application induces the greatest metabolic differentiation when compared to Ethephon and control treatments, with a possible influence on PC [62].
In the current study, CGA content was lower when the plants were treated with GA3 when compared to Ethephon treatment or control. The total coffee bean phenolic compound contents showed the following order: control > Ethephon > GA3. This is in accordance with a previous study [62]. In summary, both Ethephon and GA3 applications are important for sustainable berry production, aiding bean homogeneity and quality.

4.3. The Use of Irrigation Increases Coffee Yield but Delays Berry Maturation—Relations to Bean Chemical Quality

The coffee pericarp (also called the husk) comprises the exocarp, mesocarp and endocarp (also called skin, pulp, and parchment, respectively). The most abundant of these three tissues is the pulp, comprising 30–40% of the whole fruit’s dry weight at maturity [63]. During coffee berry processing, the pericarp must first be removed using a dry, wet, or semi-dry process, resulting in 50–80% of initial mass losses [64]. The ripe coffee berries are more easily detached than the green ones, because the green berries are characterized by a higher berry detachment strength than the ripe ones [65,66], indicating that lower injuries and losses are expected to occur in red than in green berries during the harvest.
A green berry count of up to 20% in the harvest is considered tolerable, because higher percentages can reduce coffee quality [67]. The quality of the green coffee berries collected can be improved by immediate post-harvest peeling, which reduces acidity, and chlorogenic acid content, and increases total sugar content and beverage quality [68]. In mechanized harvesting, the participation of unripe (green) berries can surpass 20%, and the participation of overripe berries can surpass 80%, even in densely planted orchards [69]. In our experiments, a limit of 20% of green berries was respected, while only the control plants surpassed this limit in some samples, especially on third-order axes (Figure 5). In any case, chemical quality was modified in different maturity groups, including CGA acid and LIP fractions (Figure 9). In a previous paper, the metabolomic analysis of the plants treated with PGRs showed that berries harvested from a highly shaded S1 are different to those harvested at higher S2 and S3, in relation to CAF, LIP, sugars, and diterpenes [62]. In the current study, CAF, protein and the total polyphenol contents had lower concentrations in S3 than in S2, which is the opposite to LIP, this being more abundant in S3 than in S2 (Figure 9), in accordance with a previous study [62]. Higher sucrose, chlorogenic acid and trigonelline contents in sun-grown coffee beans indicate incomplete bean maturation [21], but such differences were not observed here, indicating the good maturation of collected beans.
Judging by the total berry production, plants grown under NI conditions (exposed to drought) showed reduced red and total berry production compared to irrigated plants (Figure S3C and Figure 7C), despite the finding that irrigation delayed maturation (Figure S3D and Figure 7D). Therefore, the question arises as to whether it is worth irrigating coffee plants in the last months before the harvest. The answer is yes, it is valuable to sustainably irrigate the coffee plants during the dry six-week period to preserve plant structure (Figure 3C), Ap″ (Figure 4E), even if this measure could provoke a maturation delay (Figure 5B and Figure 7B,D), and it increases the LIP and kahweol contents when compared to NI conditions (Figure 9B).

5. Conclusions

The novelty of this work is related to the architectural analysis of fruit distribution along the second to fifth branching order axes and on entire plant photosynthesis based on FSPM in the determination of responses to PGRs and sustainable short-term irrigation during the phenophase of berry maturation. We are able to respond affirmatively to the imposed hypotheses—PGRs had a positive impact on the uniformity of berry maturation in seven-year-old coffee plants, especially in the case of GA3. Judging by the total berry production, plants grown under rainfed conditions and exposed to drought during berry maturation showed reduced LA and plant photosynthesis, red and total berry production and lipid and kahweol contents. As a general conclusion, during dry periods, which occur in many coffee growth regions in the world, short-term sustainable irrigation applied during six weeks of berry maturation is important, despite causing delayed maturation when compared to rainfed conditions, with the possibility that one term of additional application of PGRs that could increase the uniformity of berry maturation.

Supplementary Materials

The following supporting information can be downloaded at: https://www.mdpi.com/article/10.3390/su17093803/s1, Figure S1: Daily maximum (Tair_max) and minimum (Tair_min) air temperatures and rainfall (Rain) during the period from Arabica coffee flowering to harvest and indication of the dry period (tagged with black oval) when the irrigation was conducted; Figure S2: Fresh mass (FM) of (A) red, (B) green, and (C) total berries, and (D) % of red berries in the total FM after the external application of plant growth regulators (PGRs) (gibberellic acid—GA3, ethylene—Ethephon or water—IRR) over the plant strata (S1, <80 cm; S2, 81–160 cm; S3, >160 cm). Mean values ± SE and p-values (marked in bold when significant) are shown (n = 4). Inside each figure, different lowercase letters indicate significant difference among PGRs for each stratum, while different uppercase letters indicate significant differences among strata for each PGR; Figure S3: Fresh mass (FM) of (A) red, (B) green, and (C) total berries and (D) % of red berries in the total FM dependent on water regime (irrigated—IRR or rainfed—NI) over plant strata (S1, <80 cm; S2, 81–160 cm; S3, >160 cm). Mean values ± SE and p-values (marked in bold when significant) are shown (n = 4). Inside each figure, different lowercase letters indicate significant differences between water regimes for each stratum, while different uppercase letters indicate significant differences among strata for each water regime.

Author Contributions

Conceptualization, M.R.; methodology, M.R., E.R.B., F.T.M. and M.B.d.S.S.; validation, all authors; formal analysis, M.R.; investigation, M.R., E.R.B., F.T.M. and M.B.d.S.S.; resources, M.R.; data curation, M.R.; writing—original draft preparation, M.R.; writing—review and editing, M.R., E.R.B., F.T.M. and M.B.d.S.S.; visualization, all authors; supervision, M.R.; project administration, M.R.; funding acquisition, M.R. All authors have read and agreed to the published version of the manuscript.

Funding

The research work was carried out with the support of the Consórcio Pesquisa Café (Brazil) project (02.13.02.042.00.00) and the Fundação Carlos Chagas Filho de Amparo à Pesquisa do Estado do Rio de Janeiro (FAPERJ, Brazil) for awarding a Visiting Researcher Fellowship to M.R. (204.636/2024).

Institutional Review Board Statement

Not applicable.

Informed Consent Statement

Not applicable.

Data Availability Statement

The raw data supporting the conclusions of this article will be made available by the authors on request.

Conflicts of Interest

The authors declare no conflicts of interest.

Abbreviations

The following abbreviations are used in this manuscript:
ALeaf photosynthesis rate
A/Ci curvesCurves of leaf photosynthesis rate (A) versus CO2 inside the leaf (Ci)
ApMean diurnal leaf photosynthesis of a plant
ApWhole plant photosynthesis
BEBerry expansion phenophase
BMBerry maturation phenophase
CAFCaffeine
CFTCafestol
CGATotal chlorogenic acid content
DMDry mass
ELeaf transpiration
FMFresh mass
FSPMFunctional–structural plant modeling
GA3Gibberellic acid, C19H22O6
gmMesophyll conductance
gsStomatal conductance
IRRIrrigated conditions or control plants
JcmaxMaximum rate of electron transport for the given light intensity
KAHKahweol
LAPlant leaf area
LAILeaf area index
LIPLipids
MTGsMultiscale tree graphs
NINot irrigated, rainfed conditions
PGRPlant growth regulator(s)
PPFDPhotosynthetic photon flux density
PROProtein
RdDaily dark respiration
S1, S2, S3Stratum 1, Stratum 2, Stratum 3
SUCSucrose
TPUMaximum rate of triose phosphate use
TSTotal sugar content
VcmaxMaximum carboxylation rate of RuBisCO
VPDleaf–airLeaf-to-air vapor pressure deficit

References

  1. Rena, A.B.; Barros, R.S. Critical aspects in the study of coffee flowering. In Efeitos da Irrigação Sobre a Qualidade e Produtividade do Café; Zambolim, L., Ed.; Universidade Federal de Viçosa: Viçosa, Brazil, 2004; pp. 149–172. [Google Scholar]
  2. Rakočević, M.; Scholz, M.B.S.; Good Kitzberger, C.S. Berry distributions on coffee trees cultivated under high densities modulate the chemical composition of respective coffee beans during one biannual cycle. Int. J. Fruit Sci. 2018, 18, 117–137. [Google Scholar] [CrossRef]
  3. Silva, F.B.; Tormena, C.D.; Pauli, E.D.; Almeida, A.G.; Berg, A.B.C.; Rakočević, M.; Bruns, R.E.; Scarminio, I.S.; Marcheafave, G.G. Time dependent berry maturation for planting density levels in Coffea arabica L. beans: Mixture design–fingerprinting using near–infrared transmittance spectroscopy. J. Food Compos. Anal. 2021, 97, 103795. [Google Scholar] [CrossRef]
  4. dos Santos Scholz, M.B.; Good Kitzberger, C.S.; Durand, N.; Rakočević, M. From the field to coffee cup: Impact of planting design on chlorogenic acid isomers and other compounds in coffee beans and sensory attributes of coffee beverage. Eur. Food Res. Technol. 2018, 244, 1793–1802. [Google Scholar] [CrossRef]
  5. Kazama, E.H.; da Silva, R.P.; Tavares, T.D.O.; Correa, L.N.; de Lima Estevam, F.N.; Nicolau, F.E.D.A.; Maldonado Júnior, W. Methodology for selective coffee harvesting in management zones of yield and maturation. Precis. Agric. 2020, 22, 711–733. [Google Scholar] [CrossRef]
  6. Bártholo, G.F.; Guimarães, P.T.G. Cuidados na colheita e preparo do café. Inf. Agropecu. 1997, 18, 33–42. [Google Scholar]
  7. Peña Quiñones, A.J.; Ramírez Builes, V.H.; Jaramillo Robledo, A.; Rendón Sáenz, J.R.; Arcila Pulgarín, J. Effects of daylength and soil humidity on the flowering of Coffee Coffea arabica L. in Colombia. Rev. Fac. Nac. Agron. Medellín 2011, 64, 5745–5754. [Google Scholar]
  8. Andrés, F.; Coupland, G. The genetic basis of flowering responses to seasonal cues. Nat. Rev. Genet. 2012, 13, 627–639. [Google Scholar] [CrossRef]
  9. López, M.E.; Santos, I.S.; de Oliveira, R.R.; Lima, A.A.; Cardon, C.H.; Chalfun–Junior, A. An overview of the endogenous and environmental factors related to the Coffea arabica flowering process. BPR Res. 2021, 1, 13. [Google Scholar] [CrossRef]
  10. Drinnan, J.E.; Menzel, C.M. Synchronization of anthesis and enhancement of vegetative growth in coffee (Coffea arabica L.) following water stress during floral initiation. J. Hortic. Sci. 1994, 69, 841–849. [Google Scholar] [CrossRef]
  11. Vicente, M.R.; Mantovani, E.C.; Fernandes, A.L.T.; Neves, J.C.L.; Delazari, F.T.; Figueredo, E.M. Effects of irrigation on the production and development of coffee in the West region of Bahia. Coffee Sci. 2017, 12, 544–551. [Google Scholar] [CrossRef]
  12. Rakočević, M.; Matsunaga, F.T.; Pazianotto, R.A.A.; Ramalho, J.C.; Costes, E.; Ribeiro, R.V. Drought responses in Coffea arabica as affected by genotype and phenophase. I—Leaf distribution and branching. Exp. Agric. 2024, 60, e7. [Google Scholar] [CrossRef]
  13. Camargo, A.P.; Camargo, M.B.P. Definição e esquematização das fases fenológicas do cafeeiro arábica nas condições tropicais do Brasil. Bragantia 2001, 60, 65–68. [Google Scholar] [CrossRef]
  14. DaMatta, F.M.; Cunha, R.L.; Antunes, W.C.; Martins, S.C.V.; Araujo, W.L.; Fernie, A.R.; Moraes, G.A.B.K. In field–grown coffee trees source–sink manipulation alters photosynthetic rates, independently of carbon metabolism, via alterations in stomatal function. New Phytol. 2008, 178, 348–357. [Google Scholar] [CrossRef] [PubMed]
  15. Unigarro Muñoz, C.A.; Díaz Bejarano, L.M.; Acuña, J.R. Effect of fruit load of the first coffee harvests on leaf gas exchange. Pesq. Agropec. Trop. 2021, 51, e69865. [Google Scholar] [CrossRef]
  16. Rakočević, M.; Matsunaga, F.T.; Baroni, D.F.; Campostrini, E.; Costes, E. Multiscale analyses of growth and berry distributions along four branching orders and vertical profile of Coffea arabica L. cultivated under high–density planting systems. Sci. Hortic. 2021, 281, 109934. [Google Scholar] [CrossRef]
  17. Bote, A.D.; Vos, J. Tree management and environmental conditions affect coffee (Coffea arabica L.) bean quality. NJAS—Wagening. J. Life Sci. 2017, 83, 39–46. [Google Scholar] [CrossRef]
  18. Leroy, T.; Ribeyre, F.; Bertrand, B.; Charmetant, P.; Dufour, M.; Montagnon, C.; Marraccini, P.; Pot, D. Genetics of coffee quality. Braz. J. Plant Physiol. 2006, 18, 229–242. [Google Scholar] [CrossRef]
  19. Bi, X.; Yu, H.; Hu, F.; Fu, X.; Li, Y.; Li, Y.; Yang, Y.; Liu, D.; Li, G.; Shi, R.; et al. A systematic analysis of the correlation between flavor active differential metabolites and multiple bean ripening stages of Coffea arabica L. Molecules 2024, 29, 180. [Google Scholar] [CrossRef] [PubMed]
  20. Tolessa, K.; D’heer, J.; Duchateau, L.; Boeckx, P. Influence of growing altitude, shade and harvest period on quality and biochemical composition of Ethiopian specialty coffee. J. Sci. Food Agric. 2016, 97, 2849–2857. [Google Scholar] [CrossRef] [PubMed]
  21. Vaast, P.; Bertrand, B.; Perriot, J.-J.; Guyot, B.; Génard, M. Fruit thinning and shade improve bean characteristics and beverage quality of coffee (Coffea arabica L.) under optimal conditions. J. Sci. Food Agric. 2006, 86, 197–204. [Google Scholar] [CrossRef]
  22. Rakočević, M.; Scholz, M.B.S.; Pazianotto, R.A.A.; Matsunaga, F.T.; Ramalho, J.C. Variation in yield, berry distribution and chemical attributes of Coffea arabica beans among the canopy strata of four genotypes cultivated under contrasted water regimes. Horticulturae 2023, 9, 215. [Google Scholar] [CrossRef]
  23. Vinecky, F.; Davrieux, F.; Mera, A.C.; Alves, G.S.C.; Lavagnini, G.; Leroy, T.; Bonnot, F.; Rocha, O.C.; Bartholo, G.F.; Guerra, A.F.; et al. Controlled irrigation and nitrogen, phosphorous and potassium fertilization affect the biochemical composition and quality of Arabica coffee beans. J. Agricul. Sci. 2017, 155, 902–918. [Google Scholar] [CrossRef]
  24. Miranda, F.R.; Drumond, L.C.D.; Ronchi, C.P. Synchronizing coffee blossoming and fruit ripening in irrigated crops of the Brazilian Cerrado Mineiro Region. Aust. J. Crop Sci. 2020, 14, 605–613. [Google Scholar] [CrossRef]
  25. Mesquita, C.M.; Rezende, J.E.; Carvalho, J.S.; Fabri Júnior, M.A.; Moraes, N.C.; Dias, P.T.; Carvalho, R.M.; Araújo, W.G. Manual do café: Colheita e Preparo (Coffea arabica L.); EMATER–MG: Belo Horizonte, Brazil, 2016; 50p. [Google Scholar]
  26. Silva, E.A.; Brunini, O.; Sakai, E.; Arruda, F.B.; Pires, R.C. Influence of controlled water deficits on flowering synchronization and yield of coffee under three distinct edapho–climatic conditions of São Paulo State, Brazil. Bragantia 2009, 68, 493–501. [Google Scholar] [CrossRef]
  27. Somarriba, E.; Quesada, F. Modeling age and yield dynamics in Coffea arabica pruning systems. Agric. Syst. 2022, 201, 103450. [Google Scholar] [CrossRef]
  28. Masarirambi, M.T.; Shongwe, V.D.; Chingwara, V. The effect of GA3 and Ethephon on synchronization of coffee (Coffea arabica L.) flowering and berry ripening. Acta Hortic. 2010, 884, 573–580. [Google Scholar] [CrossRef]
  29. Rademacher, W. Plant growth regulators: Backgrounds and uses in plant production. J. Plant Growth Regul. 2015, 34, 845–872. [Google Scholar] [CrossRef]
  30. Masondo, N.A.; Gupta, S.; Moyo, M.; Aremu, A.O. Editorial: The application of phytohormones in plant biotechnology for sustainable agriculture. Front. Plant Sci. 2024, 15, 1382055. [Google Scholar] [CrossRef]
  31. Gupta, S.; Bhattacharyya, P.; Kulkarni, M.G.; Doležal, K. Editorial: Growth regulators and biostimulants: Upcoming opportunities. Front. Plant Sci. 2023, 14, 1209499. [Google Scholar] [CrossRef]
  32. Bacilieri, F.S.; DE Lima, L.C.; Lana, R.M.Q.; Guimarães, D.S.N.; Clemente, M.A. Efficacy of a plant growth regulator in the culture of coffee. Biosci. J. 2016, 32, 346–353. [Google Scholar] [CrossRef]
  33. DaMatta, F.M.; Ramalho, J.D.C. Impacts of drought and temperature stress on coffee physiology and production: A review. Braz. J. Plant Physiol. 2006, 18, 55–81. [Google Scholar] [CrossRef]
  34. Silva, P.C.; Junior, W.Q.R.; Ramos, M.L.G.; Rocha, O.C.; Veiga, A.D.; Silva, N.H.; Brasileiro, L.O.; Santana, C.C.; Soares, G.F.; Malaquias, J.V.; et al. Physiological changes of arabica coffee under different intensities and durations of water stress in the Brazilian Cerrado. Plants 2022, 11, 2198. [Google Scholar] [CrossRef] [PubMed]
  35. Rakočević, M.; Costes, E.; Campostrini, E.; Ramalho, J.C.; Ribeiro, R.V. Drought responses in Coffea arabica as affected by genotype and phenophase. I—photosynthesis at leaf and plant scales. Exp. Agric. 2024, 60, e22. [Google Scholar]
  36. Deuner, S.; Alves, J.D.; Zanandrea, I.; Goulart, P.F.P.; Silveira, N.M.; Henrique, P.C.; Mesquita, A.C. Stomatal behavior and components of the antioxidative system in coffee plants under water stress. Sci. Agric. 2011, 68, 7–85. [Google Scholar] [CrossRef]
  37. De Vos, D.; Dzhurakhalov, A.; Stijven, S.; Klosiewicz, P.; Beemster, G.T.S.; Broeckhove, J. Virtual plant tissue: Building blocks for next–generation plant growth simulation. Front. Plant Sci. 2017, 8, 686. [Google Scholar] [CrossRef] [PubMed]
  38. Hartmann, F.P.; Barbier de Reuille, P.; Kuhlemeier, C. Toward a 3D model of phyllotaxis based on a biochemically plausible auxin–transport mechanism. PLoS Comput. Biol. 2019, 15, e1006896. [Google Scholar] [CrossRef]
  39. Aparecido, L.E.O.; Rolim, G.S.; Richetti, J.; Souza, P.S.; Johann, J.A. Köppen, Thornthwaite and Camargo climate classifications for climatic zoning in the State of Paraná, Brazil. Ciênc. Agrotec. 2016, 40, 405–417. [Google Scholar] [CrossRef]
  40. Rakočević, M.; Batista, E.R.; Pazianotto, R.A.A.; Scholz, M.B.S.; Souza, G.A.R.; Campostrini, E.; Ramalho, J.C. Leaf gas exchange and bean quality fluctuations over the whole canopy vertical profile of Arabic coffee cultivated under elevated CO2. Funct. Plant Biol. 2021, 48, 469–482. [Google Scholar] [CrossRef]
  41. Cesanelli, A.; Guarracino, L. Numerical modeling of actual evapotranspiration of a coffee crop. Sci. Agric. 2011, 68, 395–399. [Google Scholar] [CrossRef]
  42. Torres, J.D.; Espindula, M.C.; Araújo, L.F.B.D.; Marcolan, A.L.; Rocha, R.B. Grain yield of coffee plants fertilized with different doses of 20-00-20 NPK formulation under rainfed conditions. Rev. Caatinga 2021, 34, 486–493. [Google Scholar] [CrossRef]
  43. Rakočević, M. Coffee plant architecture. In Coffee—A Glimpse into the Future; DaMatta, F.M., Ramalho, J.C., Eds.; Elsevier: London, UK, 2025; pp. 29–62. [Google Scholar]
  44. Farquhar, G.D.; von Caemmerer, S.; Berry, J.A. A biochemical model of photosynthetic CO2 assimilation in leaves of C3 species. Planta 1980, 149, 78–90. [Google Scholar] [CrossRef]
  45. Sharkey, T.D. What gas exchange data can tell us about photosynthesis? Plant Cell Environ. 2016, 39, 1161–1163. [Google Scholar] [CrossRef] [PubMed]
  46. Godin, C.; Caraglio, Y. A multiscale model of plant topological structures. J. Theor. Biol. 1998, 191, 1–46. [Google Scholar] [CrossRef] [PubMed]
  47. Godin, C.; Costes, E.; Sinoquet, H. A method for describing plant architecture which integrates topology and geometry. Ann. Bot. 1999, 84, 343–357. [Google Scholar] [CrossRef]
  48. Rakočević, M.; Costes, E.; Assad, E.D. Structural and physiological sexual dimorphism estimated from three dimensional virtual trees of yerba–mate (Ilex paraguariensis) is modified by cultivation environment. Ann. Appl. Biol. 2011, 159, 178–191. [Google Scholar] [CrossRef]
  49. Matsunaga, F.T.; Tosti, J.B.; Androcioli-Filho, A.; Brancher, J.D.; Costes, E.; Rakočević, M. Strategies to reconstruct 3D Coffea arabica L. plant structure. SpringerPlus 2016, 5, 2075. [Google Scholar] [CrossRef]
  50. Pradal, C.; Boudon, F.; Nouguier, C.; Chopard, J.; Godin, C. PlantGL: A Python–based geometric library for 3D plant modelling at different scales. Graph. Models 2009, 71, 1–21. [Google Scholar] [CrossRef]
  51. Adam, B.; Dones, N.; Sinoquet, H. VegeSTAR, Version 3.2; Software qui Calcule L’interception Lumineuse et la Photosynthèse; INRA: Paris, France, 2006; Available online: https://eng-piaf.clermont.hub.inrae.fr/methods-and-models/vegestar (accessed on 25 January 2025).
  52. Scholz, M.B.S.; Kitzberger, C.S.G.; Pereira, L.F.P.; Davrieux, F.; Pot, D.; Charmetant, P.; Leroy, T. Application of near infrared spectroscopy for green coffee biochemical phenotyping. J. Near Infrared Spectrosc. 2014, 22, 411–421. [Google Scholar] [CrossRef]
  53. Scholz, M.B.S.; Pagiatto, N.F.; Kitzberger, C.S.G.; Pereira, L.F.P.; Davrieux, F.; Charmetant, P.; Leroy, T. Validation of near–infrared spectroscopy for the quantification of cafestol and kahweol in green coffee. Food Res. Int. 2014, 61, 176–182. [Google Scholar] [CrossRef]
  54. R Core Team. 2022. Available online: https://www.r–project.org// (accessed on 1 December 2024).
  55. Furini, G.; Anese, R.D.O.; Reinehr, J.; da Silva, F.N.; Casa, R.T.; Rufato, L.; Rufato, D.P.; Bogo, A. Ethephon effect on defoliation of cluster zone, Botrytis bunch rot, and viticultural performance of ‘Cabernet Sauvignon’ grapevine in highland region of southern Brazil. Cienc. Rural 2024, 54, e20230207. [Google Scholar] [CrossRef]
  56. Hendgen, M.; Schubert, S.; Löhnertz, O. Ethephon–induced leaf senescence increases the concentration of yeast–assimilable nitrogen in grape must (Vitis vinifera cv. Riesling). Aust. J. Grape Wine Res. 2021, 27, 472–482. [Google Scholar] [CrossRef]
  57. Romano, L.S.; Filla, A.; Giomo, G.S.; Lemos, L.B. Characterization of Yellow Bourbon coffee strains for the production of differentiated specialty coffees. Bragantia 2022, 81, e2222. [Google Scholar] [CrossRef]
  58. Schuch, U.K.; Fuchigami, L.H.; Nagao, M.A. Gibberellic acid causes earlier flowering and synchronizes fruit ripening of coffee. Plant Growth Regul. 1990, 9, 59–64. [Google Scholar] [CrossRef]
  59. Scalco, M.S.; Alvarenga, L.A.; Guimarães, R.J.; Colombo, A.; Assis, G.A. Irrigated and non–irrigated coffee (Coffea arabica L.) under super dense conditions. Coffee Sci. 2012, 6, 193–202. [Google Scholar]
  60. Bisht, T.S.; Rawat, L.; Chakraborty, B.; Yadav, V. A recent advances in use of plant growth regulators (PGRs) in fruit crops—A review. Int. J. Cur. Microbiol. Appl. Sci. 2018, 7, 1307–1336. [Google Scholar] [CrossRef]
  61. Cocco, C.; Silvestre, W.P.; Schildt, G.W.; Tessaro, F.A. Effect of Ethephon application on fruit quality at harvest and post–harvest storage of Japanese plum (Prunus salicina) cv. Fortune. Braz. Arch. Biol. Technol. 2022, 65, e20210183. [Google Scholar] [CrossRef]
  62. Tormena, C.D.; Rutledge, D.N.; Rakočević, M.; Bruns, R.E.; Scarminio, I.S.; Marcheafave, G.G.; Pauli, E.D. Exogenous application of bioregulators in Coffea arabica beans during ripening: Investigation of UV–Visible and NIR mixture design–fingerprints using AComDim–ICA. Microchem. J. 2022, 181, 107702. [Google Scholar] [CrossRef]
  63. Heeger, A.; Kosińska–Cagnazzo, A.; Cantergiani, E.; Andlauer, W. Bioactives of coffee cherry pulp and its utilization for production of Cascara beverage. Food Chem. 2017, 221, 969–975. [Google Scholar] [CrossRef]
  64. Hall, R.D.; Trevisan, F.; De Vos, R.C.H. Coffee berry and green bean chemistry—Opportunities for improving cup quality and crop circularity. Food Res. Int. 2022, 151, 110825. [Google Scholar] [CrossRef] [PubMed]
  65. Coelho, A.P.F.; Silva, J.S.; Carneiro, A.P.S.; Melo, E.C.; Silva, C.S.; Lisboa, C.F. Quality of coffee beans from peeled green berries after temporary immersion in water. Rev. Bras. Eng. Agric. Ambient. 2020, 24, 713–718. [Google Scholar] [CrossRef]
  66. Barros, M.M.D.; Silva, F.M.D.; Costa, A.G.; Ferraz, G.A.E.S.; Silva, F.C.D. Use of classifier to determine coffee harvest time by detachment force. Rev. Bras. Eng. Agric. Ambient. 2018, 22, 366–370. [Google Scholar] [CrossRef]
  67. Ferrão, R.G.; Fonseca, A.F.A.; Ferrão, M.A.G.; Verdim Filho, A.C.; Volpi, P.S.; Muner, L.H.; Lani, J.A.; Prezotti, L.C.; Ventura, J.A.; Marques, E.M.G.; et al. Café conilon: Técnicas de produção com variedades melhoradas. Circ. Téc. 2012, 03–I, 74. [Google Scholar]
  68. Nobre, G.W.; Borém, F.M.; Isquierdo, E.P.; Pereira, R.G.F.A.; Oliveira, P.D. Chemical composition of unripe Arabic coffee (Coffea arabica L.) processed under dry and wet conditions. Coffee Sci. 2011, 6, 107–113. [Google Scholar]
  69. Martello, M.; Molin, J.P.; Bazame, H.C. Obtaining and validating high–density coffee yield data. Horticulturae 2022, 8, 421. [Google Scholar] [CrossRef]
Figure 1. Leaf gas exchange traits: net photosynthesis rate (A, µmol m−2 s−1), stomatal conductance (gs, mmol m−2 s−1), leaf transpiration (E, mmol m−2 s−1), intracellular CO2 concentration (Ci, Pa) leaf-to-air vapor pressure deficit (VPDleaf–air, kPa) in relation to: (A) plant growth regulators (PGR) externally applied (gibberellic acid—GA3, ethylene—Ethephon or control—IRR) or (B) water regime (irrigated—IRR or rainfed—NI) when evaluating different plant strata (S2: 81–160 cm, S3 > 160 cm). Mean values ± SE are shown (n = 2). Inside each figure, different lowercase letters indicate significant differences among PGR treatments or water regimes for each stratum, while different uppercase letters indicate significant differences among strata for each PGR or water regime. gs values were multiplied by 100, allowing al the values to be compared to other traits in the same figure.
Sustainability 17 03803 g001
Figure 2. Photosynthetic capacity traits modeled from the A/Ci curves: maximum apparent carboxylation velocity (Vcmax, µmol m−2 s−1), maximum apparent rate of electron transport (Jmax, µmol m−2 s−1), day respiration rate (Rd, µmol m−2 s−1), maximum rate of triose phosphate use (TPU, µmol m−2 s−1), mesophyll conductance (gm, μmol m−2 s−1 Pa−1) in relation to: (A) plant growth regulators (PGR) externally applied (gibberellic acid—GA3, ethylene—Ethephon or control—IRR) or (B) water regime (irrigated—IRR or rainfed—NI) when evaluating different plant strata (S2: 81–160 cm, S3 > 160 cm). Mean values ± SE are shown (n = 2). Inside each figure, different lowercase letters indicate significant differences among PGR treatments or water regimes for each stratum, while different uppercase letters indicate significant differences among strata for each PGR or water regime. Rd and TPU values were multiplied by 10, allowing all of the values to be compared to other traits in the same figure.
Sustainability 17 03803 g002
Figure 3. The 3D reconstruction manipulations using FSPM modeling: (A) validation of leaf area index (LAI, m2 m−2) measured with LICOR 2000 and reconstructed from 3D mockups in berry expansion (BE) and berry maturation (BM) phenophases; (B) validation of leaf net photosynthesis rate (µmol m−2 s−1) measured (A) with LICOR 6400 and estimated (A′) from mockups at BM phenophase. In (A,B), linear regression equations are shown together with respective R2, bias, RMSE, and 1:1 lines. (C) The plant leaf area of 3D reconstructions (cm2) was estimated before (BE) and after (BM) the application of plant growth regulators (PGR, gibberellic acid—GA3, ethylene—Ethephon or IRR—control) or the modification of water regime (irrigated, IRR—control or rainfed—NI). Mean ± SE and ANOVA p-values (marked in bold when significant) are shown (n = 2). Different lowercase letters indicate significant differences among the four treatments.
Sustainability 17 03803 g003
Figure 4. The 3D reconstruction computations of: (A) plant leaf area during the berry maturation phenophase in different plant strata (S1 < 80 cm, S2: 81–160 cm, S3 > 160 cm); (B) mean diurnal leaf photosynthesis (Ap′, µmol m−2 s−1) after the external application of plant growth regulators (PGR, gibberellic acid—GA3, ethylene—Ethephon and water—IRR); (C) Ap′ as a result of water regime (irrigated—IRR or rainfed—NI); (D) mean diurnal plant photosynthesis (Ap″, µmol plant−1 s−1) after the external application of plant growth regulators (gibberellic acid—GA3, ethylene—Ethephon, control—IRR); (E) Ap″ as a result of water regime (irrigated—IRR or rainfed—NI). Mean ± SE and ANOVA p-values (marked in bold when significant) are shown (n = 2). Different lowercase letters inside of the figures indicated significant differences among the treatments.
Sustainability 17 03803 g004
Figure 5. The percentage of red and green berries (maturation group) over 2nd to 5th branching orders (O2 to O5) of plants after the external application of (A) plant growth regulators (PGRs—gibberellic acid—GA3, ethylene—Ethephon, in control—IRR) or (B) water regime (irrigated—IRR, or rainfed—NI). Mean values ± SE are shown (n = 2). Inside each figure, the results of two-way ANOVAs with different lowercase letters indicate significant differences among PGRs or water regimes for each maturation group and branching order, while different uppercase letters indicate significant differences among branching orders for each maturation group and each PGR or water regime.
Sustainability 17 03803 g005
Figure 6. Dry mass (DM) of (A) red, (B) green, and (C) total berries, and (D) percentage of red berries in a total DM after the external application of (A) plant growth regulators (PGR) (gibberellic acid—GA3, ethylene—Ethephon or water—IRR) observed over the three plant strata (S1 < 80 cm; S2: 81–160 cm; S3 > 160 cm). Mean values ± SE and p-values (marked in bold when significant) are shown (n = 4). Inside each figure, different lowercase letters indicate significant differences among PGRs for each stratum, while different uppercase letters indicate significant differences among strata for each PGR.
Sustainability 17 03803 g006
Figure 7. Dry mass (DM) of (A) red, (B) green and (C) total berries, and (D) percentage of red berries in the total DM dependent on water regime (irrigated—IRR or rainfed—NI) over plant strata (S1 < 80 cm; S2: 81–160 cm; S3 > 160 cm). Mean values ± SE and p-values (marked in bold when significant) are shown (n = 4). Inside each figure, different lowercase letters indicate significant differences between water regimes for each stratum, while different uppercase letters indicate significant differences among strata for each water regime.
Sustainability 17 03803 g007
Figure 8. The percentage of DM in the FM of red (A,C) and green berries (B,D) in relation to externally applied plant growth regulators (PGR) (gibberellic acid—GA3, ethylene—Ethephon or water—IRR), or water regime (irrigated—IR or rainfed—NI). Mean values ± SE and p–values (marked in bold when significant) are shown (n = 4). Inside each figure, different lowercase letters indicate significant differences among PGR treatments or between water regimes for each stratum, while different uppercase letters indicate significant differences among strata for each PGR treatment or water regime.
Sustainability 17 03803 g008
Figure 9. Chemical contents (% of dry matter) of coffee beans: PRO (proteins), lipids (LIP), caffeine (CAF), SUC (sucrose), total soluble sugars (TS), total chlorogenic acids (CGA), phenolic compounds (PC), kahweol (KAH), and cafestol (CFT) in relation to (A) plant growth regulators (PGR) externally applied (gibberellic acid—GA3, ethylene—Ethephon or water—IRR) or (B) water regime (irrigated—IRR or rainfed—NI) over different plant strata (S2: 81–160 cm; S3 > 160 cm). Mean values ± SE are shown (n = 4). Inside each figure, the results of two-way ANOVAs are shown, and different lowercase letters indicate significant differences among PGR treatments or water regimes for each stratum, while different uppercase letters indicate significant differences among strata for each PGR or water regime. CAF, KAH and CFT contents were multiplied by 10, allowing representative values to be compared to those of other chemical components.
Sustainability 17 03803 g009
Disclaimer/Publisher’s Note: The statements, opinions and data contained in all publications are solely those of the individual author(s) and contributor(s) and not of MDPI and/or the editor(s). MDPI and/or the editor(s) disclaim responsibility for any injury to people or property resulting from any ideas, methods, instructions or products referred to in the content.

