Article

Advancing Sustainable Additive Manufacturing: Analyzing Parameter Influences and Machine Learning Approaches for CO2 Prediction

Institute for Information Management in Engineering, Karlsruhe Institute of Technology, 76133 Karlsruhe, Germany
*
Author to whom correspondence should be addressed.
Sustainability 2025, 17(9), 3804; https://doi.org/10.3390/su17093804
Submission received: 21 February 2025 / Revised: 20 March 2025 / Accepted: 27 March 2025 / Published: 23 April 2025

Abstract

:
The global push for sustainable production, driven by initiatives like the Paris Agreement and the European Green Deal, necessitates reducing CO2 emissions in industrial processes. Additive manufacturing (AM), with its potential for material efficiency and decentralization, offers promising opportunities for lowering carbon footprints. Due to the significant importance of enhancing the performance of AM via the fine-tuning of printing parameters, this study investigates the dual objectives of understanding parameter influences and leveraging artificial intelligence (AI) to predict CO2 emissions in fused deposition modeling (FDM) processes. A full-factorial experimental design with 81 test prints was conducted, varying four key parameters—layer height, infill density, perimeters, and nozzle temperature—at three levels (min, mid, and max). The results highlight infill density as the most influential factor, significantly impacting material usage, energy consumption, and overall CO2 emissions. Five AI algorithms were employed for predictive modeling, with XGBoost demonstrating the highest accuracy in forecasting emissions. By systematically analyzing process interdependencies and providing quantitative insights, this study advances sustainable 3D printing practices. The findings offer practical implications for optimizing AM processes, benefiting both researchers and industrial stakeholders aiming to reduce CO2 emissions without compromising product integrity.

1. Introduction and Motivation

In recent years, numerous initiatives have been implemented worldwide to promote sustainable production, as the industrial sector accounts for approximately 50% of energy-related CO2 emissions [1]. The Paris Agreement aims to limit global warming to well below 2 °C, requiring companies to adopt measures to reduce their greenhouse gas emissions [2]. In alignment with these objectives, the European Green Deal seeks to make the EU climate neutral by 2050 through measures such as the adoption of renewable energy, the improvement of energy efficiency and the initiatives of the circular economy. Companies must adapt their production processes to meet these stringent requirements; they have to progressively minimize CO2 emissions and incorporate technologies that are more environmentally sustainable [3]. Furthermore, the Corporate Sustainability Reporting Directive (CSRD) requires companies to disclose their sustainability strategies, enhancing transparency, by being required to release detailed data on their carbon footprint, and promoting sustainable corporate governance [4]. Overall, these initiatives for sustainable production seek to reduce the greenhouse gas emissions and, therefore, CO2 emissions as well, and publish these values as their carbon footprint.
The carbon footprint, mentioned in the CSRD, serves as a fundamental metric to evaluate the sustainability attributes of a product or process. It encompasses the comprehensive quantification of carbon dioxide emissions, whether released directly or indirectly, that are tied to a specific process or activity. This metric is instrumental in facilitating the comparative evaluation of the environmental impacts resulting from various production methodologies. In addition, it plays a crucial role in highlighting opportunities for improvements aimed at reducing environmental footprints. By meticulously assessing and understanding your carbon footprint, you can contribute to mitigating the effects of climate change by identifying precise interventions to reduce emissions within production processes [5]. The Greenhouse Gas (GHG) Protocol is an internationally recognized framework for calculating these carbon footprints, categorizing emissions into three scopes: direct emissions (Scope 1), indirect emissions from energy consumption (Scope 2), and other indirect emissions along the value chain (Scope 3). The GHG Protocol takes into account not only the CO2 emissions, but also other greenhouse gases, which are converted into CO2 equivalents. These include, for example, methane (CH4) and nitrous oxide (N2O). This holistic approach enables a more comprehensive assessment of the environmental impact [6].
In this context, additive manufacturing (AM) is developing into a key technology for sustainable production. The advantages of AM are manifold: material efficiency through demand-driven production, energy savings through optimized process management, and reduced transport emissions through decentralized production lead to significant improvements in the environmental footprint [7,8] especially when used for low production volumes [9]. One of the primary benefits of additive manufacturing (AM) from an environmental standpoint is its enhanced capability to use materials with greater efficiency, resulting in a notable decrease in carbon emissions when compared to conventional manufacturing techniques. Traditional manufacturing is commonly associated with significant material waste due to the removal and discarding of excess material. In contrast, AM facilitates the meticulous and requirement-specific use of materials, leading to substantial reductions in material waste and lower need for raw resources [8,10]. The benefits for the reduction in material waste are highlighted, when AM is used for small, traditionally waste intensive parts [9]. At the core of successful AM are diverse printing parameters, including but not limited to printing temperature, layer height, printing speed, and infill density. These parameters have a profound impact on the output of the printing process and are instrumental in shaping the characteristics of the final product [11]. The selection of the printing parameters is crucial because it influences the quality [11,12,13,14,15], mechanical properties [11,12], engineering precision, efficiency of material, and energy utilization of the printed product [11,13], which are crucial to its environmental performance. The initiatives listed above aim, among other things, to reduce CO2 emissions in production. CO2 emissions are calculated mainly on the basis of the energy and material consumption of a process. As described, these two factors can be varied in 3D printing using the printing parameters. Choosing the appropriate parameters requires a deep understanding of AM technology and process. From both a technological and an economic perspective, optimizing these process parameters to enhance the performance of AM components is extremely advantageous [11,16]. Therefore, forging a direct connection between the process parameters and properties of the materials and the performance results is of significant interest to researchers and engineers in the domain [11].
Artificial intelligence (AI) offers the potential to optimize these process parameters [17,18], but it is not limited to that topic and can further optimize sustainable processes in general in AM. Machine learning (ML), as part of AI, can be utilized for the preparation of part designs and files [17,19,20], material and technology selection, the enhancement of product quality [20], including defect detection [18], process guidance [19,20], and process monitoring. ML could help automate and continuously improve the printing process by analyzing data from previous printing operations and using them to adapt the process in real time. For example, artificial neural networks (ANNs) and optimization algorithms such as genetic algorithms have proven promising in this context to identify the optimal parameter settings. These algorithms can derive correlations from a large number of variables and their interactions and adapt the printing process accordingly to reduce waste and maximize energy efficiency [21]. But one of the biggest challenges in the application of machine learning in AM is data acquisition. Collecting enough data to train the ML models can be time-consuming, costly, and labor-intensive. Each printing process must be carefully monitored and recorded to obtain accurate information about the parameters and resulting properties of the printed parts. However, these data are crucial for training algorithms and allowing them to recognize patterns and correlations [22].
This paper addresses two key research objectives in the context of sustainable AM:
  • Impact of printing parameters: Analyze the influence of individual 3D printing parameters on the CO2 footprint, with a particular focus on material usage and energy consumption. The goal is to identify key parameters that serve as effective levers for reducing emissions.
  • Prediction of CO2 footprint: Evaluate the effectiveness of different machine learning algorithms in predicting the CO2 footprint during fused deposition modeling (FDM), aming to determine the models with the highest predictive accuracy while requiring small training data.
Due to the significant importance of enhancing the performance of additive manufacturing (AM) components through the fine-tuning of the printing parameters [11], this study will provide a comprehensive examination of how these parameters affect material utilization, energy consumption, and the resultant carbon dioxide emissions. Relying on the hypotheses, the CO2 emissions of the 3D printing process are dependent on not only energy consumption, but on material consumption as well, which are both influenced by the printing parameters. By conducting a systematic analysis and obtaining quantitative data, we aim to pinpoint the key printing parameters that act as pivotal levers for minimizing emissions. Such insights are crucial not only for the advancement of scientific understanding but also for the improvement of practical implementations, thereby promoting the development of more sustainable 3D printing methods.
The study investigates various AI methodologies to predict CO2 emissions, seeking to identify the algorithm with the highest accuracy using minimal datasets. Such insights are essential for proactive environmental improvements in AM by offering reliable forecasting, which is fundamental to executing sustainability strategies.
In the following section, a review of related works on two topics is given. The first subsection will highlight the impact of printing parameters on energy or material consumption and the quality of printed parts; the second subsection will focus on AI algorithms for the prediction of various metrics, such as energy demand and CO2 footprint, based on printing parameters. Although previous studies have focused mainly on energy efficiency, and a few on material efficiency, the holistic consideration of CO2 emissions, where scientific discourse on including a CO2 perspective has received little attention to date, carried out in this contribution will offer new starting points for sustainable process design in AM. Following this, the methodology section outlines the experimental framework, with the experimental setup and design, quality evaluation, and data analysis procedure, with statistical analysis and AI algorithms employed. The results section presents findings from both research areas: the sensitivity of material input, energy consumption, emissions, and quality to parameter variations and the performance of AI-driven emission predictions. These findings are further explored in the discussion, where implications for sustainable 3D printing practices are considered, and an outlook on future research directions and practical applications in sustainability-driven manufacturing is given.

2. Theoretical Foundations

Additive manufacturing (AM) research often intersects with multiple domains, requiring a robust theoretical grounding to address its environmental, computational, and operational challenges. In this work, we anchor our investigation in three fundamental principles: (i) sustainability science, which provides an integrative lens to balance ecological and socioeconomic goals; (ii) AI-driven optimization, offering powerful methodologies to navigate complex parameter spaces; and (iii) industrial engineering, ensuring a systems-level perspective on production processes. In the following subsections, we briefly introduce each principle, highlighting its relevance to AM and underscoring how these theoretical perspectives collectively shape the study’s objectives, methodology, and anticipated outcomes.

2.1. Sustainability Science

Sustainability science provides an integrative framework for analyzing the intersecting environmental, economic, and social dimensions of production technologies [23,24]. In the context of additive manufacturing (AM), this field underscores the need to balance material efficiency and energy consumption with broader objectives, such as reducing carbon emissions and responsible resource management [25]. This point of view also recognizes that minimizing waste and optimizing operational inputs can advance not only environmental performance, but also economic competitiveness. Therefore, small but systematic adjustments in manufacturing processes, in our case, particularly in terms of 3D printing parameters (e.g layer height, infill density, and print temperature) could yield reductions in carbon emissions while maintaining or enhancing mechanical properties. Consequently, sustainability science focuses on both quantitative (for example, CO2 footprints) and qualitative (e.g., product reliability) outcomes, ensuring that research considers multiple forms of value creation.

2.2. AI-Driven Optimization

AI-driven optimization leverages machine learning, evolutionary algorithms, and other computational intelligence methods to explore high-dimensional parameter spaces and identify near-optimal solutions [26,27,28]. AI-driven optimization encompasses a range of techniques, from direct black-box strategies, such as Bayesian optimization, to model-based approaches that explicitly formulate an objective function to guide parameter tuning. Both methods are well-suited to the complex interactions characteristic of AM processes, where print parameters (e.g., infill density, layer height, and nozzle temperature) exhibit nonlinear relationships influencing energy consumption, mechanical integrity, and build times. In a black-box context, the system is treated as an unknown function; methods such as Bayesian optimization sequentially propose parameter sets aimed at improving an observed metric (e.g., lower CO2 footprint). In contrast, model-based approaches first approximate the objective function, often using machine learning algorithms, and then apply optimization techniques to systematically navigate the parameter space. By accommodating non-linearities and high-dimensional data, AI-driven optimization provides a solid foundation to improve material efficiency and energy performance in AM. Recent literature underscores the significant potential of AI for advancing sustainability objectives. An analysis of current research identifies key strengths of AI, in particular, its capacity to handle large-scale environmental data, optimize resource usage, and improve predictive capabilities [29]. However, this analysis also highlights challenges, including concerns about data privacy and the need for effective interdisciplinary collaboration. Furthermore, a systematic review examining AI’s role in achieving the Sustainable Development Goals (SDGs) reveals that supervised learning methods predominate, comprising 65% of reviewed studies, followed by unsupervised (18%) and reinforcement learning (17%) techniques [30]. Given the proven effectiveness and extensive adoption of model-based approaches (primarily supervised), this research aligns accordingly, employing supervised learning models to accurately characterize the AM parameter space.

2.3. Industrial Engineering Framework

From an industrial engineering point of view, production processes are often conceptualized as interconnected subsystems, each contributing to overall throughput, quality, and resource efficiency [31,32]. The application of this framework to AM highlights the importance of reducing cycle times, stabilizing print quality, and minimizing material waste [33]. By treating AM as an integrated system, it can be diagnosed how changes in one parameter (e.g., infill density) impact not only material usage but also energy consumption and mechanical output characteristics. This system-oriented view aligns with lean methodologies, where the goal is to eliminate non-value-adding steps and streamline the entire workflow. Consequently, the examination of AM should include both localized interventions (e.g., layer height manipulation) and an overarching concern for end-to-end process efficiency. This dual focus helps ensure that any combination of ’optimal’ parameters fosters consistent quality and performance benefits while aligning with sustainability benchmarks, such as lower carbon footprints.

3. Related Works and Research Gap

Although extensive research has been dedicated to improving process control and product quality, significantly less emphasis has been allocated to improving environmental performance [34]. This lack of focus is corroborated by [35], which underscores the imperative need for a scientifically rigorous assessment of the environmental impacts associated with 3D printing technologies. The study carried out by equilibrium [36] highlights the pivotal significance of energy efficiency in achieving CO2, thus identifying energy consumption as a critical area of interest. Furthermore, according to [11], the intricate processes of modeling, forecasting, and optimizing energy usage have emerged as predominant themes within recent research endeavors. Furthermore, the work of [37] reveals that the energy and material utilization inherent to 3D printing devices serve as the primary contributor to the increasing resource demands, which subsequently results in a deficiency of collaborative efforts aimed at addressing material consumption concerns. However, a concerning issue highlighted by [38] is the scarcity of comprehensive data: Despite the necessity for accurate energy consumption metrics to perform valid life-cycle assessments, such data are frequently unavailable for fused deposition modeling (FDM) processes. These authors also highlight the pressing demand for expanded research efforts to encompass a broader spectrum of materials and printer classifications. This segment aims to render a comprehensive overview of the extant scholarly work pertinent to two principal themes, methodically partitioned into two subsections. Section 3.1 explores the impact exerted by different printing parameter configurations, whereas Section 3.2 delves into the predictive capabilities of AI algorithms in assessing environmental performance, incorporating insights related to predicting energy or material consumption and the overall CO2 emissions footprint.

3.1. Influence of Printing Parameters on Different Metrics

Different studies investigated the influence of parameter settings for AM processes, including MEX processes in general and FDM printers on the physical impact.
The investigation of the influence of printing parameters on product quality has been carried out multiple times by different researchers [12,13,14,15,39,40,41,42]. A systematic review [12] from 2022 examines key process parameters in FDM and their effects on product quality. Polylactic acid (PLA) is utilized as extrusion material. The review focuses on parameters such as layer thickness, print speed, infill density, and construction orientation, analyzing their impact on surface roughness, mechanical strength, and dimensional accuracy. The dimensional precision was also assessed with different parameters by the authors of [15]. Regarding the influences of printing parameters on the tensile strength of PLA parts, produced with FDM printers, the following insights could be found. One study revealed a moderately strong positive correlation with temperature of 0.6. However, both layer height and shell thickness maintain a weak positive correlation with tensile strength [41]. Another study observed that the raster orientation has a negative correlation coefficient of −0.41, infill density has a positive correlation of 0.31 to it, and in contrast to [41], a correlation coefficient of only 0.13 for the nozzle temperature [40]. The study of Afonso J. and Alves J. also investigated the influences of printing parameters on tensile strength, not for FDM but for fused filament fabrication, with a test set of 25 combinations of print speed and an extrusion temperature at five different levels, as well as on compressive and flexural strength [42]. According to Nikzad et al. infill density, with a correlation of 0.62, is the most effective process parameter on the elastic modulus of 3D-printed PLA parts, followed by the raster orientation, with −0.46, and nozzle temperature, with 0.24 [39].
The authors highlight the complex interrelationships among the investigated parameters and emphasize the need for optimization to achieve the desired product qualities [12,15]. They also discuss challenges in the field and suggest future research directions to enhance the performance and applicability of FDM-printed parts [12].
Investigating the influence of printing parameters on energy consumption is also a point of interest [12,13,14]. A study in 2021 by [13] investigates the influence of five critical parameters of the FDM process on energy consumption, physical properties, and mechanical performance. The experiments were carried out using samples prepared according to a tensile testing specification made of PLA. The parameters analyzed include infill density (20%, 50%, and 80%), infill pattern (linear, triangular, and hexagonal), layer thickness (0.1 mm, 0.2 mm, and 0.3 mm), print speed (40 mm/s, 60 mm/s, and 80 mm/s), and shell thickness (0.8 mm, 1.2 mm, and 1.6 mm). A Taguchi L27 orthogonal array design was employed to systematically vary these parameters and assess their impact. The study conducted a comprehensive analysis of energy consumption patterns, revealing significant insights. It was found that the density at which the material is infilled considerably affects energy usage. Specifically, higher infill densities contribute to heightened energy demands due to extended print durations and increased consumption of printing materials. Additionally, the velocity at which printing occurs significantly influences energy efficiency; slower printing speeds increase energy consumption because they prolong the operational period of the printer. Furthermore, the thickness of the printed layers is a critical determinant; printing with thinner layers requires a larger number of layers to achieve complete prints, thereby increasing the required energy consumption [13]. In a more recent investigation conducted in 2024, detailed by [14], the pivotal role of layer thickness in optimizing energy efficiency is reaffirmed, the study assigning it as the main factor to mitigate energy use. The significance of layer thickness in reducing energy expenditure is echoed in subsequent findings by [12].
In contrast to focusing solely on the printing parameters, other studies have delved into the intrinsic components of the 3D printer itself [43]. The power supply unit, the building plate and the motor responsible for the movement are revealed to contribute to 43%, 31%, and 11% of the total energy consumption, respectively. Consequently, variations in the temperature settings of the build plate and the routing path of the extruder are critical factors exerting a substantial influence on energy consumption.
The body of research that examines how printing parameters affect material consumption remains relatively sparse and has historically not been the focal point of much scientific inquiry. However, three scholars have conducted studies in this domain, as documented in [13,42,43]. In particular, the study conducted by [13] elucidated that an increase in infill density corresponds directly to an increase in material consumption, yet the study did not provide further detailed insights into other influencing factors. The study by [42] about 3D printing, but not FDM printers, revealed that extrusion temperature and print speed correlate positively to the mass of a 3D printed part.
The research emphasizes the inherent trade-offs in optimizing energy efficiency against other crucial factors such as mechanical performance and the quality of manufactured parts, as documented in various studies [12,13]. An exhaustive survey of studies examining the effects of printing parameters on various performance metrics in FDM technology is systematically presented in Table 1. Generally, these studies have concentrated on different key input variables, such as infill density, print speed, and temperature ranges. A significant portion explored the interconnections among these parameters. A consistent observation was that the analyses frequently prioritized energy consumption and quality metrics over material consumption. The role of the printing parameters in their contribution to CO2 emissions was predominantly examined through the lens of energy usage only [14]. In particular, no single study was identified that comprehensively evaluated the effects on energy, material and quality metrics, and CO2 influences concurrently. Since the presented studies did not investigate the effects of the same input parameters, the influences of one parameter on all metrics can not be quantified through them. Subsequently, this study should fill this gap, by evaluating the effects of selected parameters on all four metrics in one study, while also examining the possible interconnections among these parameters.

3.2. Prediction of Different Metrics Through AI Algorithms

In the literature, different AI algorithms used for the predictions of various metrics, such as mechanical properties, part quality, energy consumption, and CO2 footprint, could be found, while the prediction accuracy of the different ML approaches varies considerably.
The predictions of qualitative metrics in the context of AM could be found in the literature multiple times. An investigation to predict print quality in extrusion-based 3D bioprinting technology was conducted 2021. The authors developed two ML approaches: a direct classification approach, which trains a classifier to distinguish between low and high print quality, and an indirect approach, which uses a regression ML model to approximate the values of a print quality metric. Both approaches are based on random forest (RF) algorithms. The results show that ML methods are promising to reduce the number of required experiments and support the development of a recommendation system to identify suitable printing conditions [44]. Other product quality metrics such as roughness, tensile strength, and elongation were predicted through several ML regression models by other authors in 2024. Among the models, GPR demonstrated the highest prediction accuracy with R 2 values of 0.98, 0.9, and 1. The authors also incorporated the Pearson correlation coefficients, which measure the strength and direction of linear relationships between pairs of variables, such as their input and output variables. They revealed insignificant linear correlations, highlighting the limitations of using basic statistical tools to understand the underlying patterns [45]. Another study utilized multiple algorithms, such as linear regression (MLR), support vector regression (SVR), and artificial neural networks (ANN) for the prediction of the elastic modulus. The K-nearest-neighbor (KNN) model achieved the best results with an R 2 value of 0.95 [46]. Predictions of qualitative metrics in the context of FDM printers in particular could be found in the literature as well. A Taguchi-optimized tabular neural network (TabNet) was used to predicting the elastic modulus of FDM 3D-printed PLA components, as well. A dataset of 128 data points was utilized to achieve a R 2 value of 0.9685 [39]. R 2 values of 0.9977 could be achieved for the prediction of compressive strength by using an ANN utilizing only 32 samples [47]. Another ANN for the prediction of dimensional accuracy achieved an error of 0.12% using 27 samples [15]. On the subject of predicting the tensile strength of parts produced by FDM, several recent studies can be found. One study, for example, compares the performances of 5 ML algorithms (XGBoost, gradient boost, AdaBoost, random forest, and linear regression), with XGBoost performing best with an R 2 value of 0.97, which, however, drops to 0.918 on an extra test set. A sample size of 27 is used, whereby the parameters extrusion temperature, layer height, and shell thickness were varied [41]. Another study, with an even higher sample size, predicted the tensile strength with 19 different ML algorithms, while investigating six different input parameters. CatBoost performed best with an R 2 values of 0.9446, followed by XGBoost and GBM. The prediction error was between 10 and 17%. Additionally, the authors underscored the efficacy of combining multiple machine learning algorithms through an ensemble method to significantly elevate the accuracy of strength predictions [40].
An overview of the mentioned studies regarding quality predictions in AM identified results is given in Table 2. The studies contain predictions about part quality, such as compressive or tensile strength, dimensional accuracy, or roughness. The overview reveals good performances for the predictions with different AI algorithms, utilizing relatively small sample sizes, with up to only 27 experiments. No researchers incorporated additional analysis such as feature importance analysis (FIA) or SHapley Additive exPlanations (SHAP) Analysis. The interdependencies with other aspects besides quality were not assessed.
In the context of AM, two AI method appeared for the predictions of mass-related metrics. A study from [48] presents a method for predicting the mass of the parts, the required support material, and the build time in 3D printing based on a design using a deep learning (DL) algorithm. For the training, they utilized around 300 different designs, with fixed printing parameters, except the orientation. Data augmentation approaches were used to increase the size of the available dataset, with a rotational approach to increase the robustness and orientation independence of the trained network, increasing the number of available samples in the dataset to 7104 training samples. They achieved low coefficients of determination with 46.8% for the component mass, 30.1% for the support material mass, and 22.5% for the construction time. The other study utilized power regression for the prediction of the mass of an AM produced part, based on the printing speed and extrusion temperature. The authors could archive a minimum prediction error of 0.67% [42].
Regarding the prediction of the energy consumption of AM, several studies could be found. Firstly, ref. [11] demonstrates the use of a DL approach with particle swarm optimization (PSO) to optimize the energy consumption of different AM methods and emphasize its potential to support designers and process managers. NN models have been applied to formulate the mathematical relationships, which are highly nonlinear, of the linkage between different printing parameters for various AM processes.
Secondly, for FDM printers, in particular, the following studies should be highlighted. The authors of [49] applied 12 machine learning (ML) algorithms to model energy consumption in the FDM process, aiming to identify the most accurate predictive model. In particular, they predicted energy consumption based on orientation of the printing part. The research utilizes a database of 3D FDM printing of 68 different isovolumetric mechanical components with multiple orientations (total of 184 model files). The printing parameters considered are model printing orientation, stl surface area, number of facets, extrusion speed, extrusion temperature, sliced X’, sliced Y’, sliced Z’, sliced volume, sliced volume including support, total filament, percentage infill (20%), layer thickness, expected print time, and number of layers. The Gaussian process regressor model was identified as the most accurate with R 2 > 99%, EVS > 99%, MAE < 3.89, and RMSE < 5.8.
A study by [50] also used improved regularized back-propagation (BP) NNs for the prediction of the energy consumption of FDM printers. The study investigated the influence of four printing parameters, each with three different values, utilizing an orthogonal test sample data for training, leading to 27 tests. The chosen parameters were layer thickness, printing speed, sprinkler head temperature, and hot bed temperature. The improved regularization method effectively avoided overfitting, resulting in an energy consumption prediction error between 1 and 2%, compared to about 10% to 16% with the standard BP network, leading to the finding that a sufficient database for NNs is of fundamental importance for the prediction quality. The authors [51] emphasized the fundamental importance of a sufficient database for NNs, whereby both the quality and quantity of the training data significantly influence the prediction quality, too. They discussed NNs in general without focusing on a specific type.
An overview of the mentioned studies regarding AM identified results is given in Table 3. The studies contain predictions about environmental performance, with energy or material consumption, but not about CO2 emissions, since no studies could be found. As in the study of the Stduien on the theme of predicting quality, some algorithms archived high performance with low sample size, but no researchers incorporated additional analysis such as FIA or SHAP analysis. Both Table 2 and Table 3 reveal that the utilized sample size varies strongly, depending on the metric to predict and used algorithm. Various studies compared different ML approaches, coming to different best-performing approaches. The interdependencies between the environmental performance and part quality were also not assessed. This gap should be closed by this study.
The potential of AI for CO2 predictions could be seen in a study from 2024, which developed a DL model designed to estimate the carbon footprint during the design phase of manufacturing processes, but did not include AM. This model enables designers to predict and minimize environmental impacts early in product development. By analyzing the design parameters and their associated carbon emissions, the model facilitates informed decision making to enhance sustainability. The study predicted welding path, material retrieval, and CO2 footprint according to CAD-models with four different neural networks (NNs), such as DGCNN, PointNet, UVNet and a proposed NN. The accuracy of the archived prediction was between 70 and 94.5% [52]. Since the developed model does not predict the CO2 footprint for AM, this study should do so.

4. Materials and Methods

An illustration of the methodology employed in this research is presented in Figure 1. In this methodology, a CAD model is first prepared and exported as an stereolithography (STL) file. Slicing software then converts the STL into G-Code for an FDM printer. During printing, a smart power plug records real-time energy consumption, and the printer’s status is tracked via a data integration platform. The finished samples are weighed on a precision scale, and for quantification of deviations from the intended design, scanned with a 3D scanner for geometric accuracy and subjected to tensile strength testing, both part of the quality evaluation. All raw data flow into a database, where they are preprocessed and analyzed. Statistical methods assess parameter effects on energy and material consumption and the carbon footprint. Finally, machine learning algorithms utilize the aggregated data to predict the carbon footprint of the printed parts.

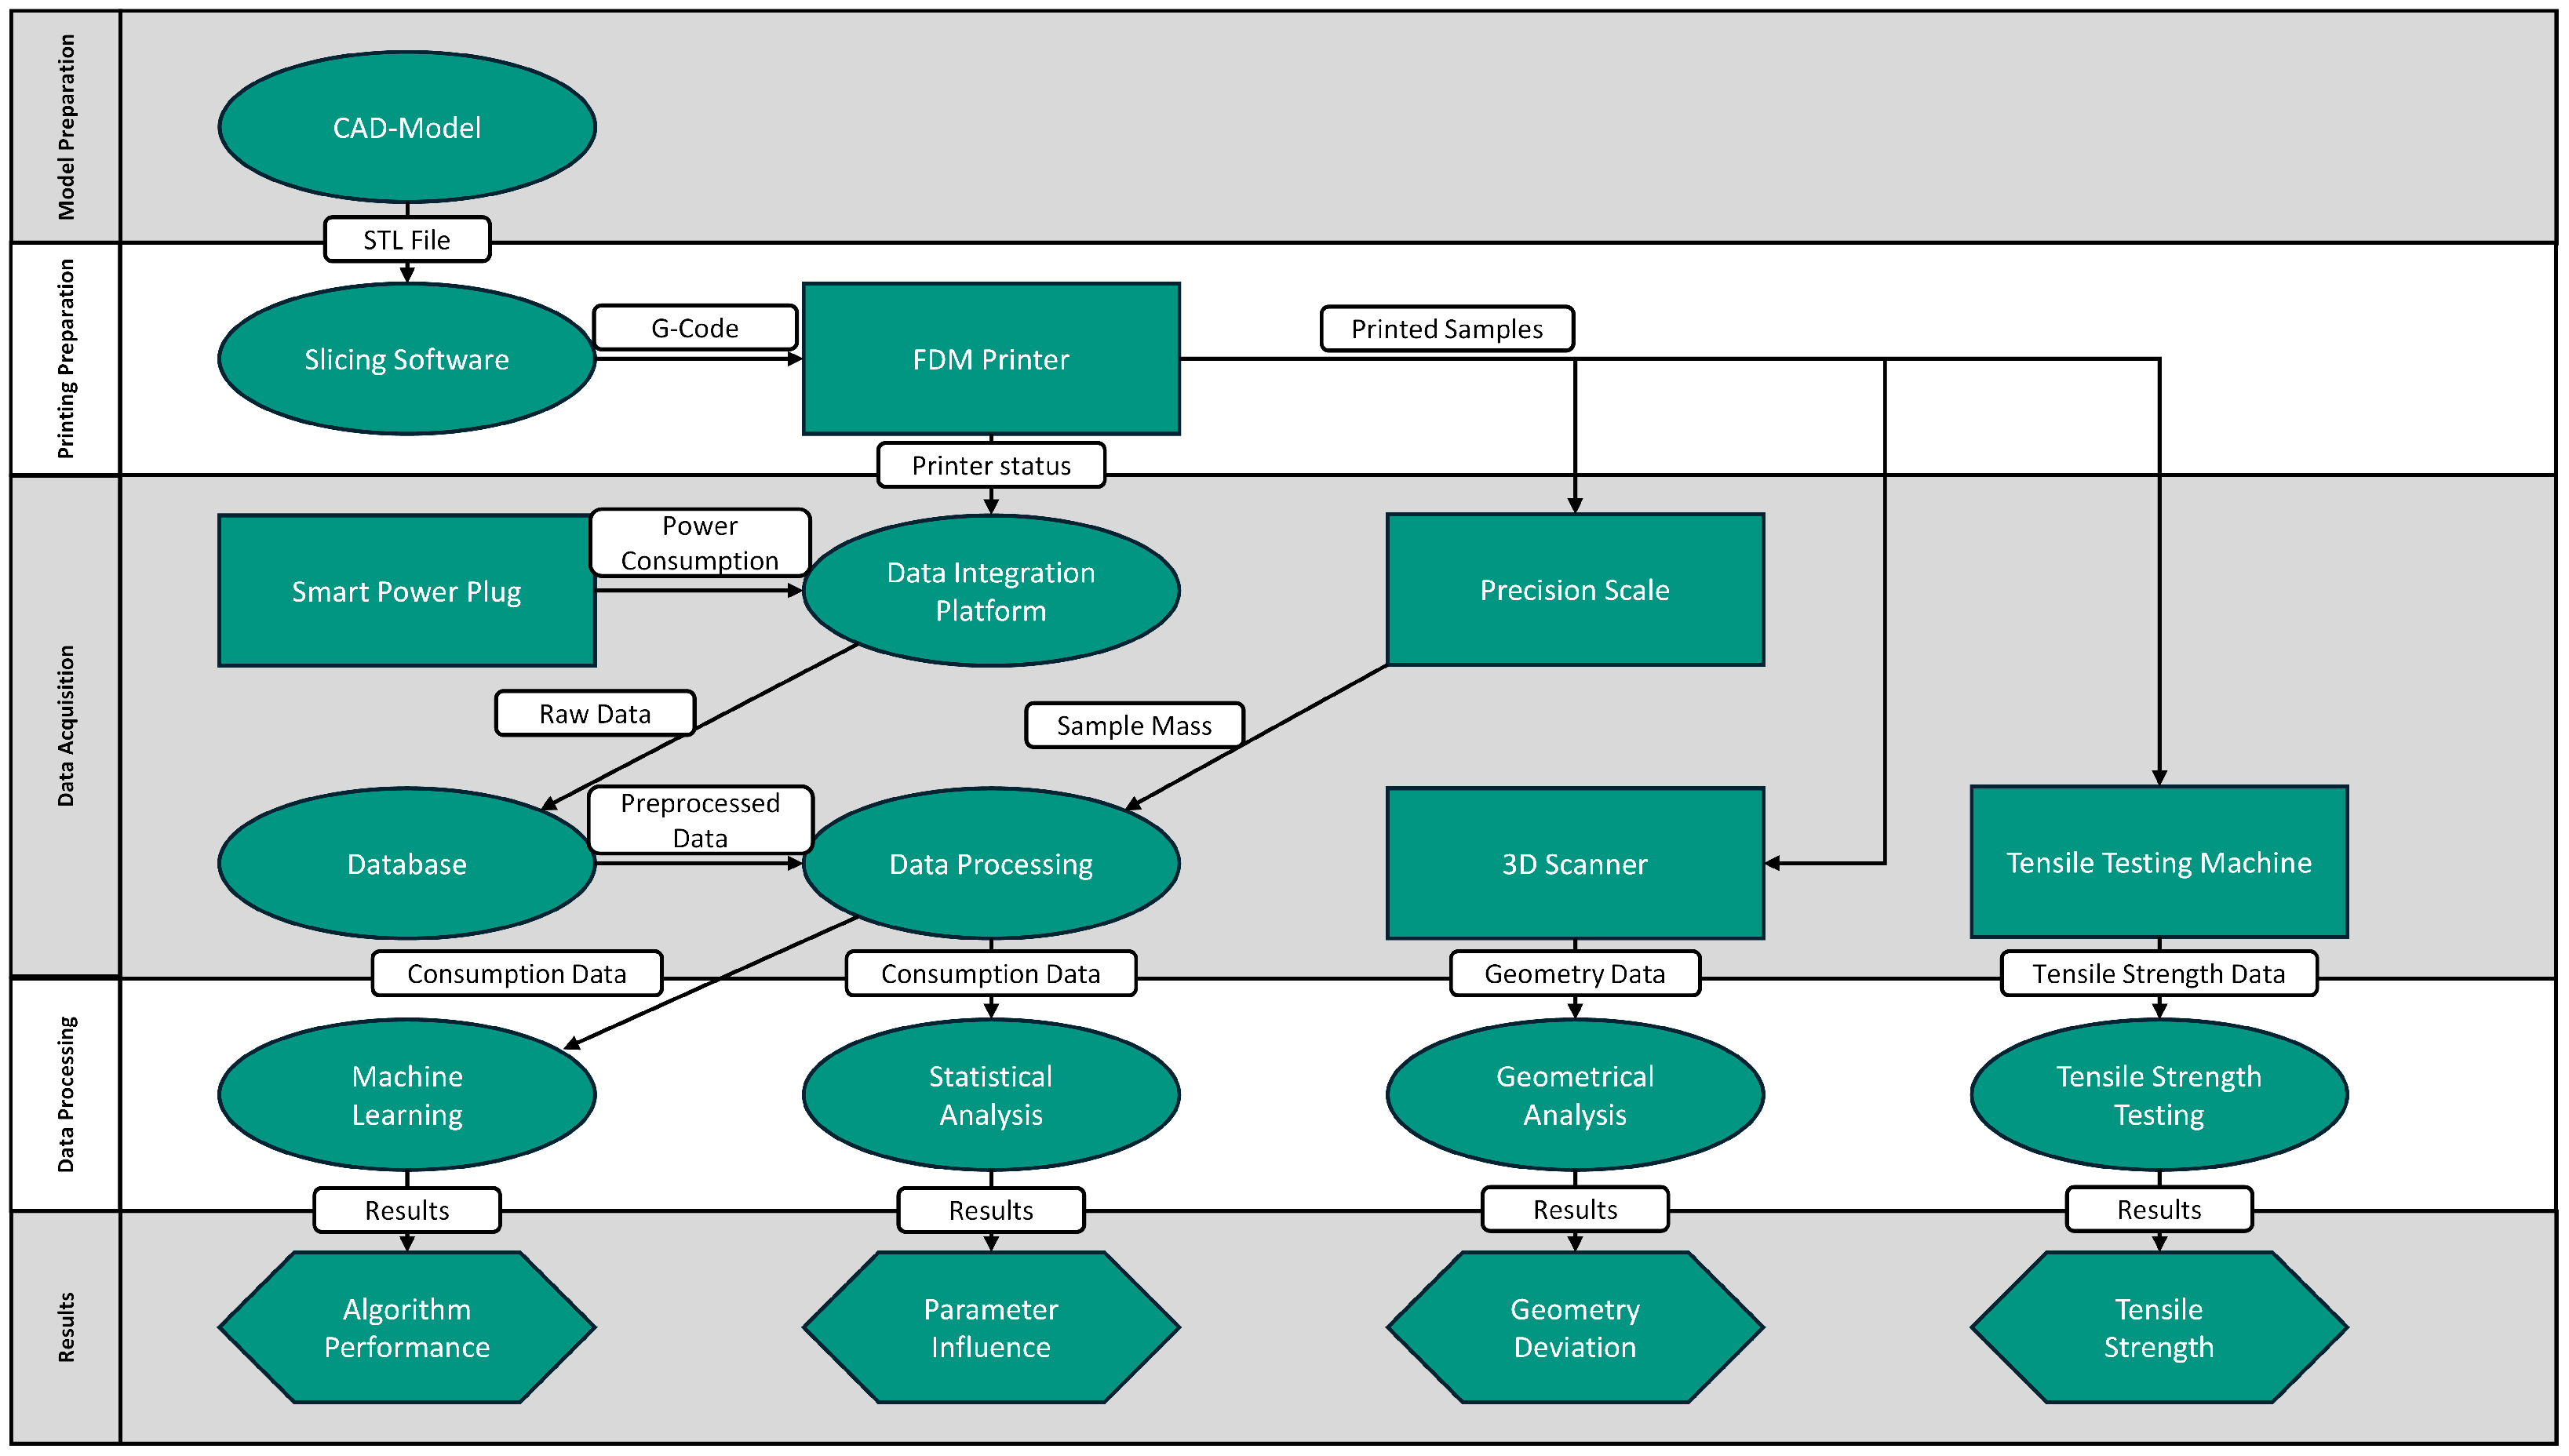
4.1. Experimental Setup and Design

The experimental setup is based on the ASTM D638 (ISO 527, GB/T 1040) [53] sample geometry referenced in the Polymaker technical datasheet. The geometry was created as a CAD model and exported in STL format for subsequent printing.
To systematically investigate the effect of certain printing parameters and create a robust dataset for ML algorithms, a full-factorial experimental design was selected. A full-factorial experimental design was chosen to provide a comprehensive analysis of both the main effects and their interactions, an aspect that is often limited in alternative methods such as Taguchi or fractional factorial approaches. Specifically, the goal was to generate a robust dataset for machine learning algorithms, which benefit from examining all combinations of parameters and their higher-order interactions. Although designs such as Taguchi or fractional factorial can be more resource-efficient, they typically restrict the number of experimental runs, thereby limiting the ability to detect nuanced or unexpected interactions. In contrast, a full-factorial design, when considered feasible in terms of time, cost, and materials, ensures that hidden interdependencies are fully explored. A full-factorial experimental design systematically examines every possible combination of selected parameters and their respective levels. When k factors are each varied at L levels, the total number of runs N can be calculated using the general form
N = j = 1 k L j
In the special case where every factor has the same number of levels L, this formula simplifies to
N = L k
In this study, four process parameters (layer height, infill density, number of perimeters, and nozzle temperature) were each varied at three discrete levels ( L = 3 ), resulting in
3 4 = 81
unique parameter combinations.
Using this design, every factor-level combination is methodically tested, thereby facilitating a comprehensive evaluation of how each parameter influences the key metrics under investigation.

4.2. Selection of Process Parameters and Sample Labeling

The choice of process parameters was guided by a systematic analysis with the aim of achieving a balanced set of influential factors, each representing different aspects of the printing process. Drawing on theoretical considerations and the literature, four parameters were selected for their primary effects on the three key aspects of this study: material consumption, energy consumption, and mechanical properties:
  • Layer Height (L): primarily affects energy consumption by altering print duration, but also influences mechanical properties via layer bonding [13,14,54,55,56];
  • Infill Density (I): drives material consumption and significantly impacts the part’s mechanical strength [13,54,55,56,57];
  • Number of Perimeters (P): determines both material usage and structural integrity [36,57];
  • Nozzle Temperature (N): primarily impacts energy consumption and interlayer adhesion, directly affecting mechanical performance [14,57,58].
A hierarchical naming scheme was employed to systematically document and identify each sample. Every sample is assigned an alphanumeric code in the format of Lxx-Ixx-Pxx-Nxx, with parameters represented by the corresponding letters.
The parameter levels are defined as follows:
  • 01: Minimum level (lowest parameter setting);
  • 02: Intermediate level (median parameter setting);
  • 03: Maximum level (highest parameter setting).
The process parameter levels were selected by first considering the maximum ranges recommended by the material supplier, then cross-referencing the operating limits of our 3D printer, and finally, confirming the permitted min–max values in the slicing software. This approach ensures that typical usage scenarios are covered while also capturing boundary conditions (extreme low and high settings) that are crucial for evaluating the robustness of the process. Consequently, the three levels (01, 02, and 03) represent the minimum, intermediate, and maximum parameter settings, respectively, as shown in Table 4.

4.3. Materials

For the experimental trials, PolyTerra PLA from Polymaker (https://polymaker.com/ (accessed on 28 February 2025)) was chosen. PLA, a bio-based thermoplastic, is known for its ease of processing and relatively low environmental impact. Polymaker provides detailed information on its PolyTerra PLA, including both life-cycle assessment data and mechanical properties determined using standardized specimen geometries.

4.4. Quality Evaluation

In order to validate the print quality, nine out of 81 samples are tested in the context of an orthogonal experimental design using a tensile testing machine, from Roell Korthaus produced in Haan, Germany, at a test speed of 5 mm/s. The specimens are clamped with specially adapted SJJ-01 jaw clamps, ensuring a uniform application of force. The use of standardized specimen geometry allows a direct comparison with the reference values provided by Polymaker. Furthermore, nine samples are digitized using a Revopoint Pop 3 3D scanner and subsequently compared to the target geometry in Fusion 360 v.16.9.1.2222 to determine their volumetric difference. This enables the quantification of any geometric deviations and provides a comprehensive assessment of the print quality.

4.5. Carbon Footprint Calculation

The carbon footprint calculation follows the guidelines of [59], adapted according to [60]. This approach links concrete activity data ( A D ) with specific emission factors ( E F ):
Emissions = A D · E F
Here, two main emission sources relevant to the FDM printing process are considered: Scope 2 emissions ( E s , i ) from energy consumption and Scope 3 emissions ( E m , i ) from material use.
For each print i, the electricity consumption leads to Scope 2 emissions ( E s , i ) calculated as follows:
E s , i = P i · E F s
where P i denotes the electrical energy consumed by print i, and E F s is the corresponding regional grid emission factor. In this study, the regional grid emission factor E F s is set at 388 g CO2-equivalents. This corresponds to the value of the German electricity mix in 2023 (without upstream chain emissions), as determined by the German Environment Agency [61]. Here, i = 1 , , 85 .
The material consumption of each print i generates Scope 3 emissions ( E m , i ), computed as
E m , i = M i · E F m
where M i is the mass of the printed component ( i = 1 , , 85 ) and E F m represents the material-specific emission factor. While the material manufacturer Polymaker reports approximately 3 kg CO2-equivalents per 1 kg of filament, this study employs the more precise value of 3.21587 kg CO2-equivalents per 1 kg of filament drawn from the EcoInvent database. The value is assessed, based on data, lastly updated in 2023, from the world largest PLA plant in Nebraska (https://v391.ecoquery.ecoinvent.org/Details/LCI/da60193c-55d8-4f99-9538-c9642dc91549/06590a66-662a-4885-8494-ad0cf410f956 (accessed on 31 March 2025)) [62].
Total emissions for each print ( E total , i ) result from the sum of Scope 2 and Scope 3 emissions:
E total , i = E m , i + E s , i

4.6. Data Analysis Procedure

4.6.1. Data Preprocessing

First, a data preprocessing step is performed to ensure consistency and quality of the dataset. In particular, individual measurements for each second of power consumption are aggregated or resampled as necessary to achieve uniform intervals. Missing data points, arising, for instance, from sensor dropouts or logging issues, are either imputed or removed based on their proportion in the dataset and the potential impact on subsequent analyses. Redundant variables or observations that do not contribute additional information are also examined and discarded if appropriate. This process helps reduce noise and better prepare the data for modeling.

4.6.2. Statistical Analysis

Subsequently, a statistical investigation is conducted to assess the normality of the distribution using Q–Q plots, histograms, and the Shapiro–Wilk test [63]. The Shapiro–Wilk test statistic W can be expressed as
W = i = 1 n a i x ( i ) 2 i = 1 n x i x ¯ 2 ,
where x ( i ) denotes the i-th order statistic of the sample, x i is the original sample value, x ¯ is the sample mean, and a i is the constant derived from the order statistics of a standard normal distribution.
Depending on whether the null hypothesis of normality is rejected or not, one of the following tests is performed:
  • Analysis of Variance (ANOVA) [64]: If normal distribution is given, a one-way ANOVA is used to compare the means of the groups. The overall F-statistic is defined as
    F = MSB MSW ,
    where MSB (mean square between) is the variance between groups and MSW (mean square within) is the variance within groups.
  • Kruskal–Wallis Test [65]: If the data are not normally distributed, the Kruskal–Wallis test is applied. Let R i be the rank sum for the i-th group and n i its sample size. The test statistic H is approximately chi-square distributed and is calculated as
    H = 12 i = 1 k R i 2 n i n ( n + 1 ) 3 ( n + 1 ) ,
    where n = i = 1 k n i is the total sample size and k is the number of groups.

4.6.3. Machine Learning Methods

In order to predict or model the response variable, multiple machine learning algorithms are considered. Below, we summarize the basic principles of each method, using an 80/20 train–test split to evaluate model performance.

Support Vector Machine (SVM)

The SVM [66] is a supervised learning algorithm used for classification and regression tasks. Given a set of training samples D = { ( x i , y i ) } i = 1 n , where x i R d are feature vectors and y i { 1 , 1 } are binary class labels, SVM aims to find a hyperplane that maximizes the margin between the two classes.
The decision boundary is defined by
f ( x ) = w x + b ,
where w R d is the weight vector and b R is the bias term. The optimal hyperplane is obtained by solving the convex optimization problem:
min w , b 1 2 w 2 s . t . y i ( w x i + b ) 1 , i .
For non-linearly separable data, SVM employs a soft-margin approach using slack variables ξ i 0 and a penalty parameter C:
min w , b , ξ 1 2 w 2 + C i = 1 n ξ i s . t . y i ( w x i + b ) 1 ξ i , i .
To handle complex decision boundaries, SVM leverages the kernel trick, mapping input data into a higher-dimensional space via a kernel function k ( x i , x j ) , such as the radial basis function (RBF) kernel:
k ( x i , x j ) = exp x i x j 2 2 σ 2 .
The decision function is then expressed in terms of support vectors:
f ( x ) = i = 1 n α i y i k ( x i , x ) + b ,
where α i are Lagrange multipliers obtained by solving the dual formulation of the optimization problem.
SVMs are widely used due to their effectiveness in high-dimensional spaces and robustness to overfitting, especially with appropriate kernel selection and regularization.

TabTransformer

The TabTransformer [67] is a DL model designed for tabular data, leveraging transformer-based attention mechanisms to encode categorical features effectively. Given an input vector x R d , consisting of both numerical and categorical features, the categorical features are first embedded into dense vectors. Let e i R k represent the embedding of the i-th categorical feature.
The model processes these embeddings through a multi-head self-attention mechanism, which can be formulated as
Attention ( Q , K , V ) = softmax Q K d k V ,
where Q = W Q E , K = W K E , and V = W V E are the query, key, and value projections of the embedding matrix E . W Q , W K , W V are learnable projection matrices, and d k is the dimensionality of the key vectors.
The outputs of the attention layers are combined with numerical features x num R m through concatenation or other fusion mechanisms. The final representation h is passed through fully connected layers:
h = σ W h att + b ,
where h att represents the attention-enhanced feature vector, and σ ( · ) is an activation function (e.g., ReLU).
The TabTransformer is trained by minimizing a task-specific loss function, such as mean squared error for regression or cross-entropy for classification. Its transformer-based structure allows for capturing complex relationships among categorical and numerical features, providing state-of-the-art performance on tabular datasets.

XGBoost (eXtreme Gradient Boosting)

XGBoost [68] is an ensemble method that combines weak learners (usually decision trees) in a sequential manner. Let y ^ ( t ) ( x ) be the prediction at iteration t. The model is updated by adding a new tree f t ( x ) to correct the residuals from the previous iteration:
y ^ ( t ) ( x ) = y ^ ( t 1 ) ( x ) + f t ( x ) .
The objective includes a loss term (e.g., squared error) plus a regularization term to penalize model complexity, ensuring a balance between bias and variance.

Random Forest (RF)

A random forest is another ensemble of decision trees, where each tree is trained on a bootstrap sample (drawn with replacement) of the original training data [69]. At each split in a tree, a random subset of features is considered to find the best split, enhancing diversity among trees. For regression tasks, the final prediction is typically the average of the individual tree predictions:
y ^ RF ( x ) = 1 T t = 1 T f t ( x ) ,
where T is the total number of trees, and f t ( x ) is the prediction of the t-th tree.

Gaussian Process Regressor (GPR)

The Gaussian process regressor (GPR) is a non-parametric Bayesian model used for regression tasks [70]. It defines a distribution over functions and provides predictions with uncertainty quantification. Given a dataset D = { ( x i , y i ) } i = 1 n , where x i R d are input features and y i R are target values, a Gaussian process assumes that any finite subset of the target values follows a multivariate normal distribution.
The predictive distribution at a new input x * is determined by the covariance function (kernel) k ( x , x ) , which encodes the similarity between inputs. The prediction is given by
μ ( x * ) = k * ( K + σ n 2 I ) 1 y , σ 2 ( x * ) = k ( x * , x * ) k * ( K + σ n 2 I ) 1 k * ,
where
  • μ ( x * ) is the mean prediction;
  • σ 2 ( x * ) is the variance (uncertainty) of the prediction;
  • K is the kernel matrix with entries k ( x i , x j ) ;
  • k * is the vector of covariances between x * and the training inputs;
  • σ n 2 is the noise variance.
The model is trained by maximizing the marginal log-likelihood:
log p ( y X ) = 1 2 y ( K + σ n 2 I ) 1 y 1 2 log | K + σ n 2 I | n 2 log ( 2 π ) .
The choice of kernel (e.g., radial basis function, Matérn) significantly impacts the model’s performance, as it defines the prior assumptions about the function being modeled. GPR is particularly effective for small to medium-sized datasets due to its computational complexity of O ( n 3 ) , which can be reduced with approximations for larger datasets.

4.6.4. Hyperparameter Optimization

For each of the above algorithms, hyperparameter optimization is carried out using Optuna [71], an automatic hyperparameter optimization framework. Optuna efficiently explores the hyperparameter space based on past evaluations using a tree-structured Parzen estimator sampler, converging on a configuration that yields the best model performance according to a predefined objective metric.

4.6.5. Model Evaluation

To compare the predictive performance of each model, a k-fold cross-validation is applied [72]. The dataset is partitioned into k folds of approximately equal size; each model is trained on k 1 folds and validated on the remaining fold. This process is repeated k times, and the results are averaged across folds. The performance metrics used include the following:
  • Coefficient of Determination ( R 2 ):
    R 2 = 1 i = 1 N y i y ^ i 2 i = 1 N y i y ¯ 2 ,
    which captures the proportion of variance in the target variable that is explained by the model;
  • Root Mean Squared Error (RMSE):
    RMSE = 1 N i = 1 N y i y ^ i 2 ,
    which quantifies the average magnitude of the errors;
  • Mean Absolute Error (MAE):
    MAE = 1 N i = 1 N y i y ^ i ,
    which measures the average absolute deviation from the actual values.

4.6.6. Model Interpretability

Finally, to gain insight into the predictive mechanisms of the best-performing model and to enhance interpretability, SHAP is employed [73]. SHAP attributes each feature’s contribution to the overall model prediction by computing Shapley values, indicating how changing a given feature, while keeping others fixed, can impact the predicted outcome. In addition, we consider feature importance plots from the models to further assess the relative influence of different variables. This information helps identify which factors most strongly influence the model decisions and provides transparency for stakeholders.

4.7. Error Analysis and Mathematical Considerations

In this section, we outline the main sources of experimental error.
All physical quantities (e.g., mass, geometry, power usage) are subject to measurement errors arising from the finite resolution and calibration of the instruments involved. Table 5 provides the list of devices used in our study along with detailed descriptions of their accuracy specifications.
The impact of measurement uncertainties on the results is minimal. The smart plug’s energy consumption error of ±0.00005 kW was compared to the average consumption (0.03 kW), resulting in a 0.16% uncertainty. The precision scale’s material consumption error (±0.01 g) relative to the average material consumption (8.57 g) led to a 0.12% uncertainty. The tensile strength testing machine, with a 1% error, introduces a slightly higher but still acceptable uncertainty. Overall, these small inaccuracies do not significantly affect the conclusions, ensuring reliable data.

5. Results

5.1. Influences of Printing Parameters

This initial subsection addresses the findings pertinent to the inaugural research objective, which involves discerning the impacts of printing parameters. The discussion is organized into two distinct topics. Initially, a detailed statistical analysis regarding the consumption of energy, material usage, and resulting CO2 emissions is presented. This is succeeded by an assessment of the quality, providing a comprehensive evaluation of the observed outcomes.

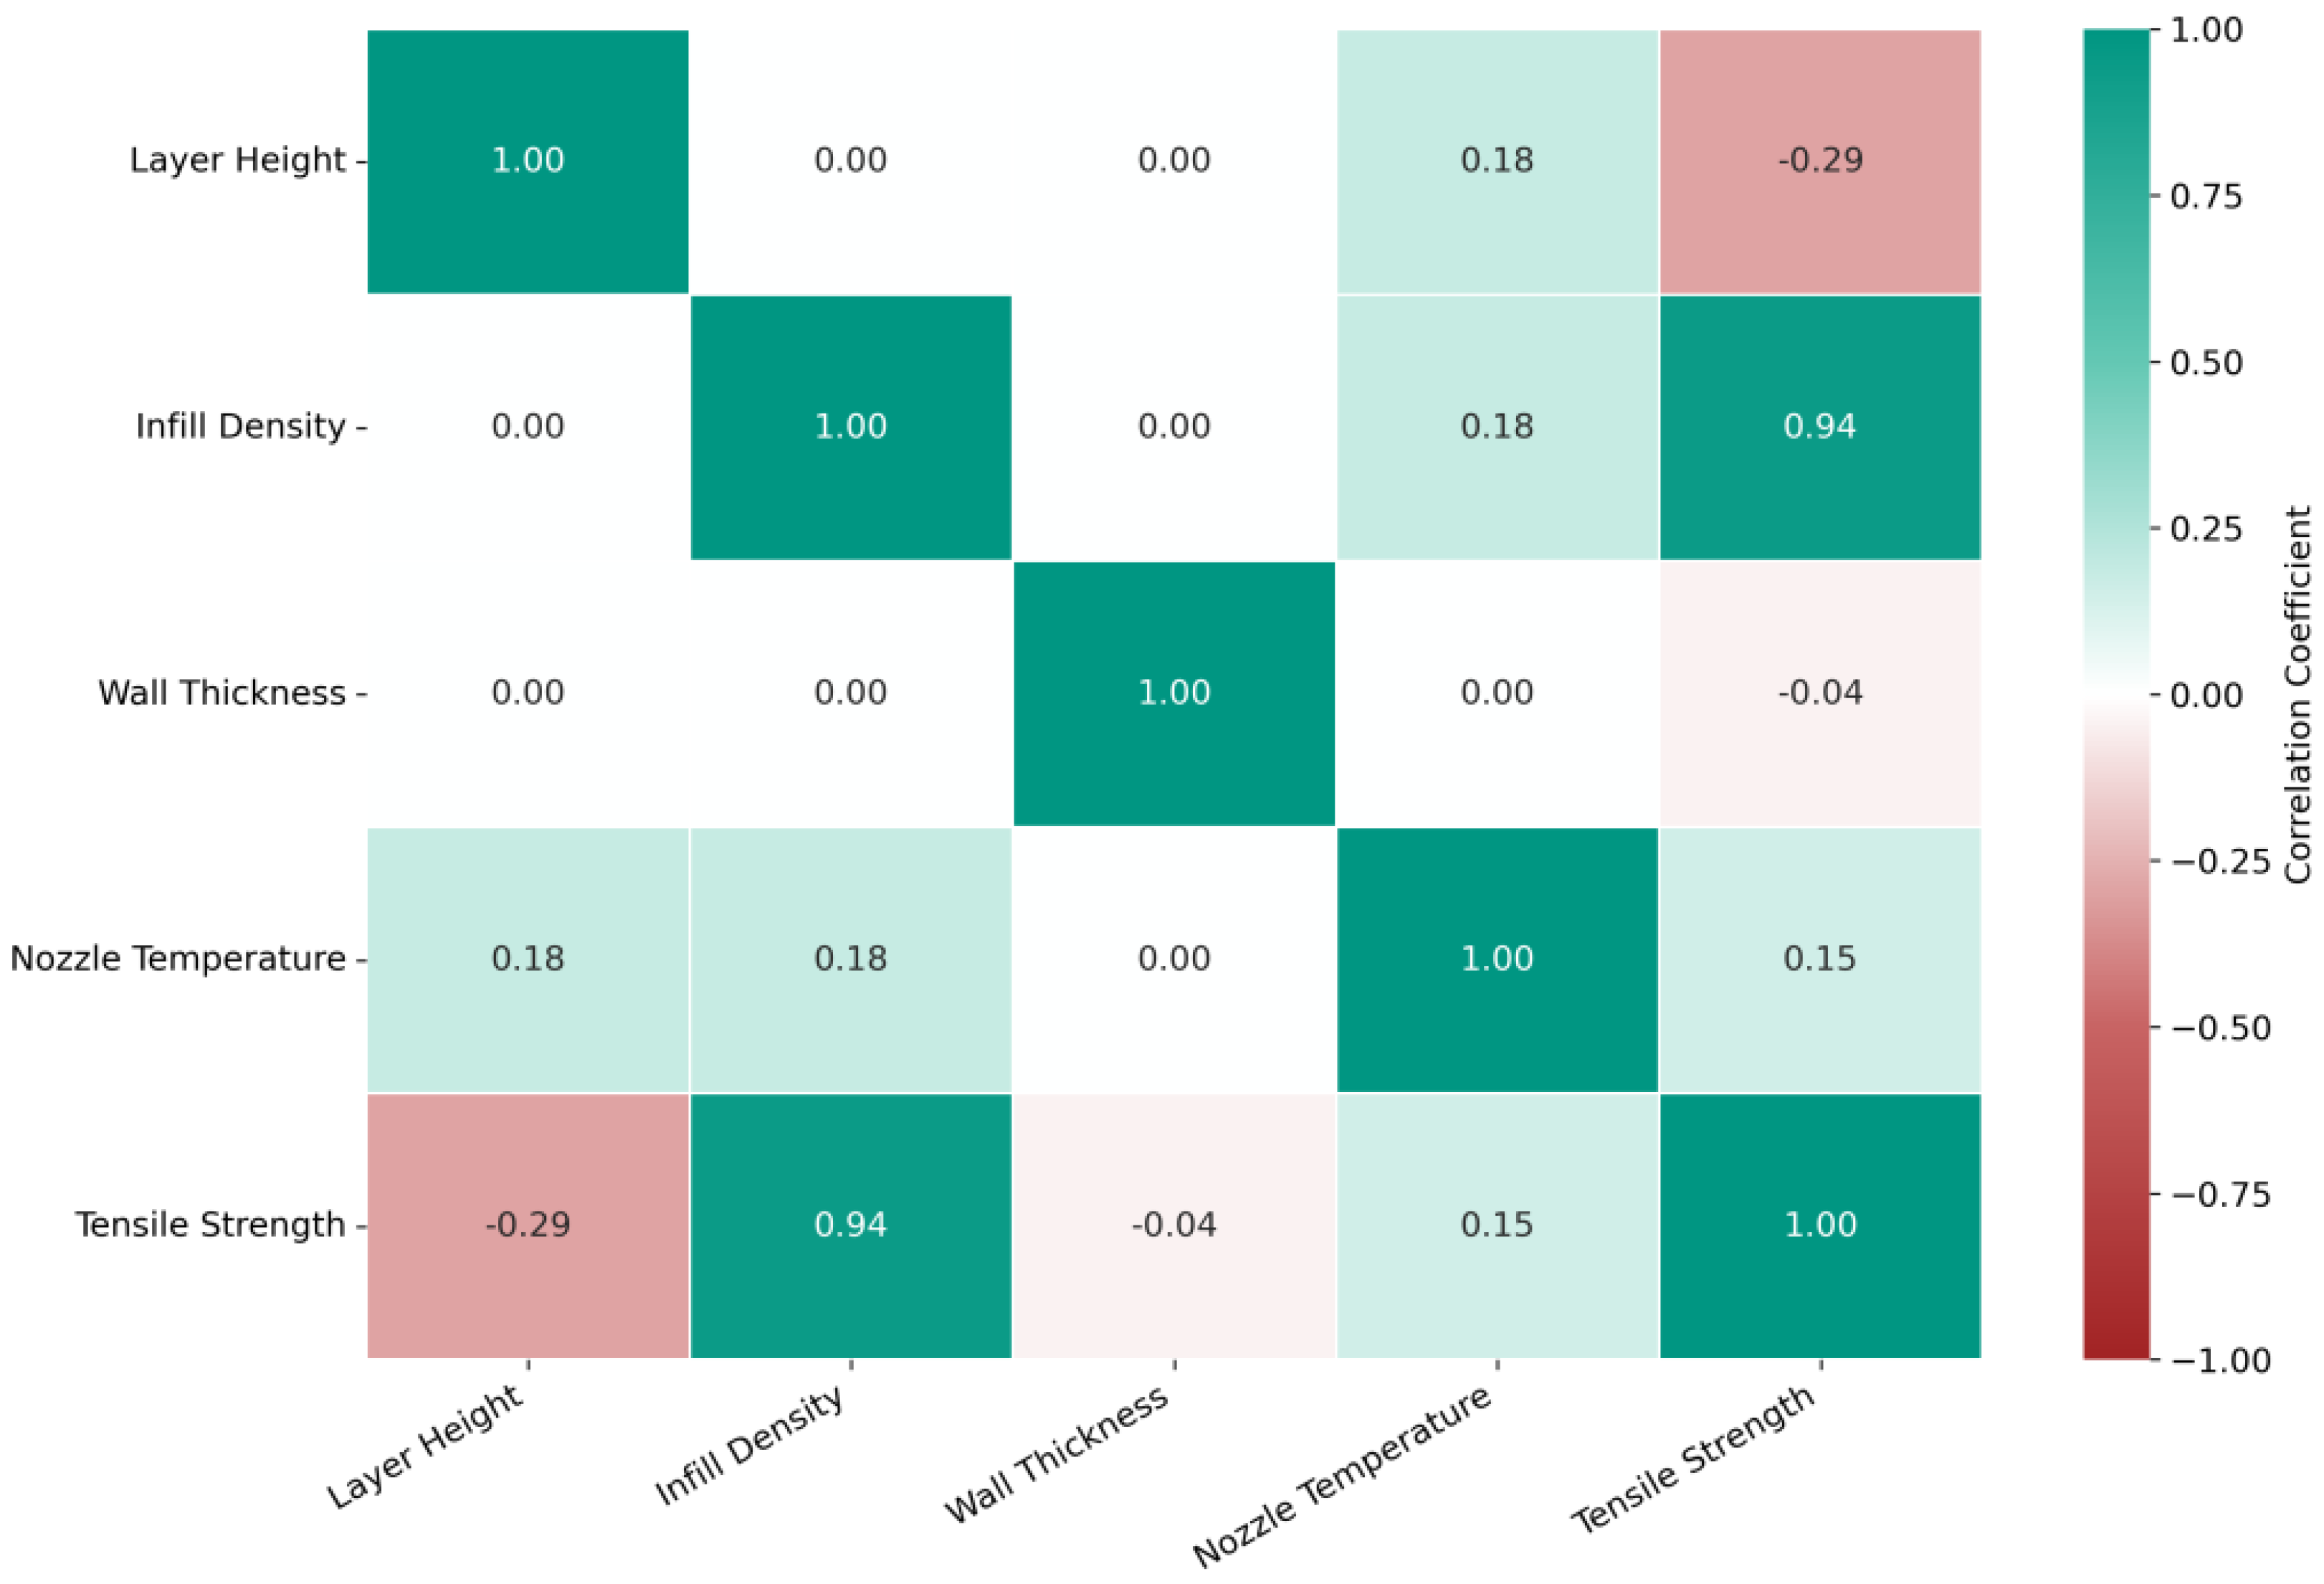
5.1.1. Statistical Analysis

The ANOVA results (Table 6) reveal significant differences in the impact of printing parameters on energy consumption. Fill density is the most influential parameter, explaining 35.2% of the variance (partial η 2 = 0.352 ) with an extremely low p-value ( 4.24 × 10 33 ). Layer height follows, accounting for 25% of the variance (p-value = 2.65 × 10 28 ). Wall count also has a statistically significant but smaller effect (p-value = 1.55 × 10 15 ). In contrast, nozzle temperature has minimal influence (p-value = 0.056). Interaction effects are negligible, with partial η 2 values below 0.004 and p-values above 0.05.
Regarding energy consumption, the analysis of the interactions between the parameters consistently reveals very weak and statistically non-significant effects. The most pronounced interaction occurs between layer height and nozzle temperature, indicated by a partial eta-squared of 0.004. The corresponding p-value of 0.097 is well above the significance level. A comparable effect size is observed for the interaction between wall count and nozzle temperature (partial eta-squared also around 0.004), but with a p-value of 0.147, it is even further from statistical significance. All other interactions exhibit even smaller effect sizes, with partial eta-squared values of up to 0.002 and p-values clearly above 0.5.
The Kruskal–Wallis test results (Table 7) indicate that fill density is the only parameter with a statistically significant impact on material consumption (H = 69.05, p-value = 1.01 × 10 15 ). Other parameters, including layer height, wall count, and nozzle temperature, show no significant effects, with p-values of 0.382, 0.168, and 0.843, respectively.
For CO2 emissions (Table 8), fill density again shows a significant effect (H = 69.13, p-value = 9.73 × 10 16 ), while other parameters, including layer height, wall count, and nozzle temperature, remain statistically insignificant.

5.1.2. Quality Evaluation

In conjunction with analyzing the data on energy usage, a comprehensive assessment of quality is conducted. This evaluation encompasses several distinct domains, including a visual inspection, an assessment of mechanical properties through tensile testing, and a detailed geometrical analysis achieved through 3D scanning techniques.

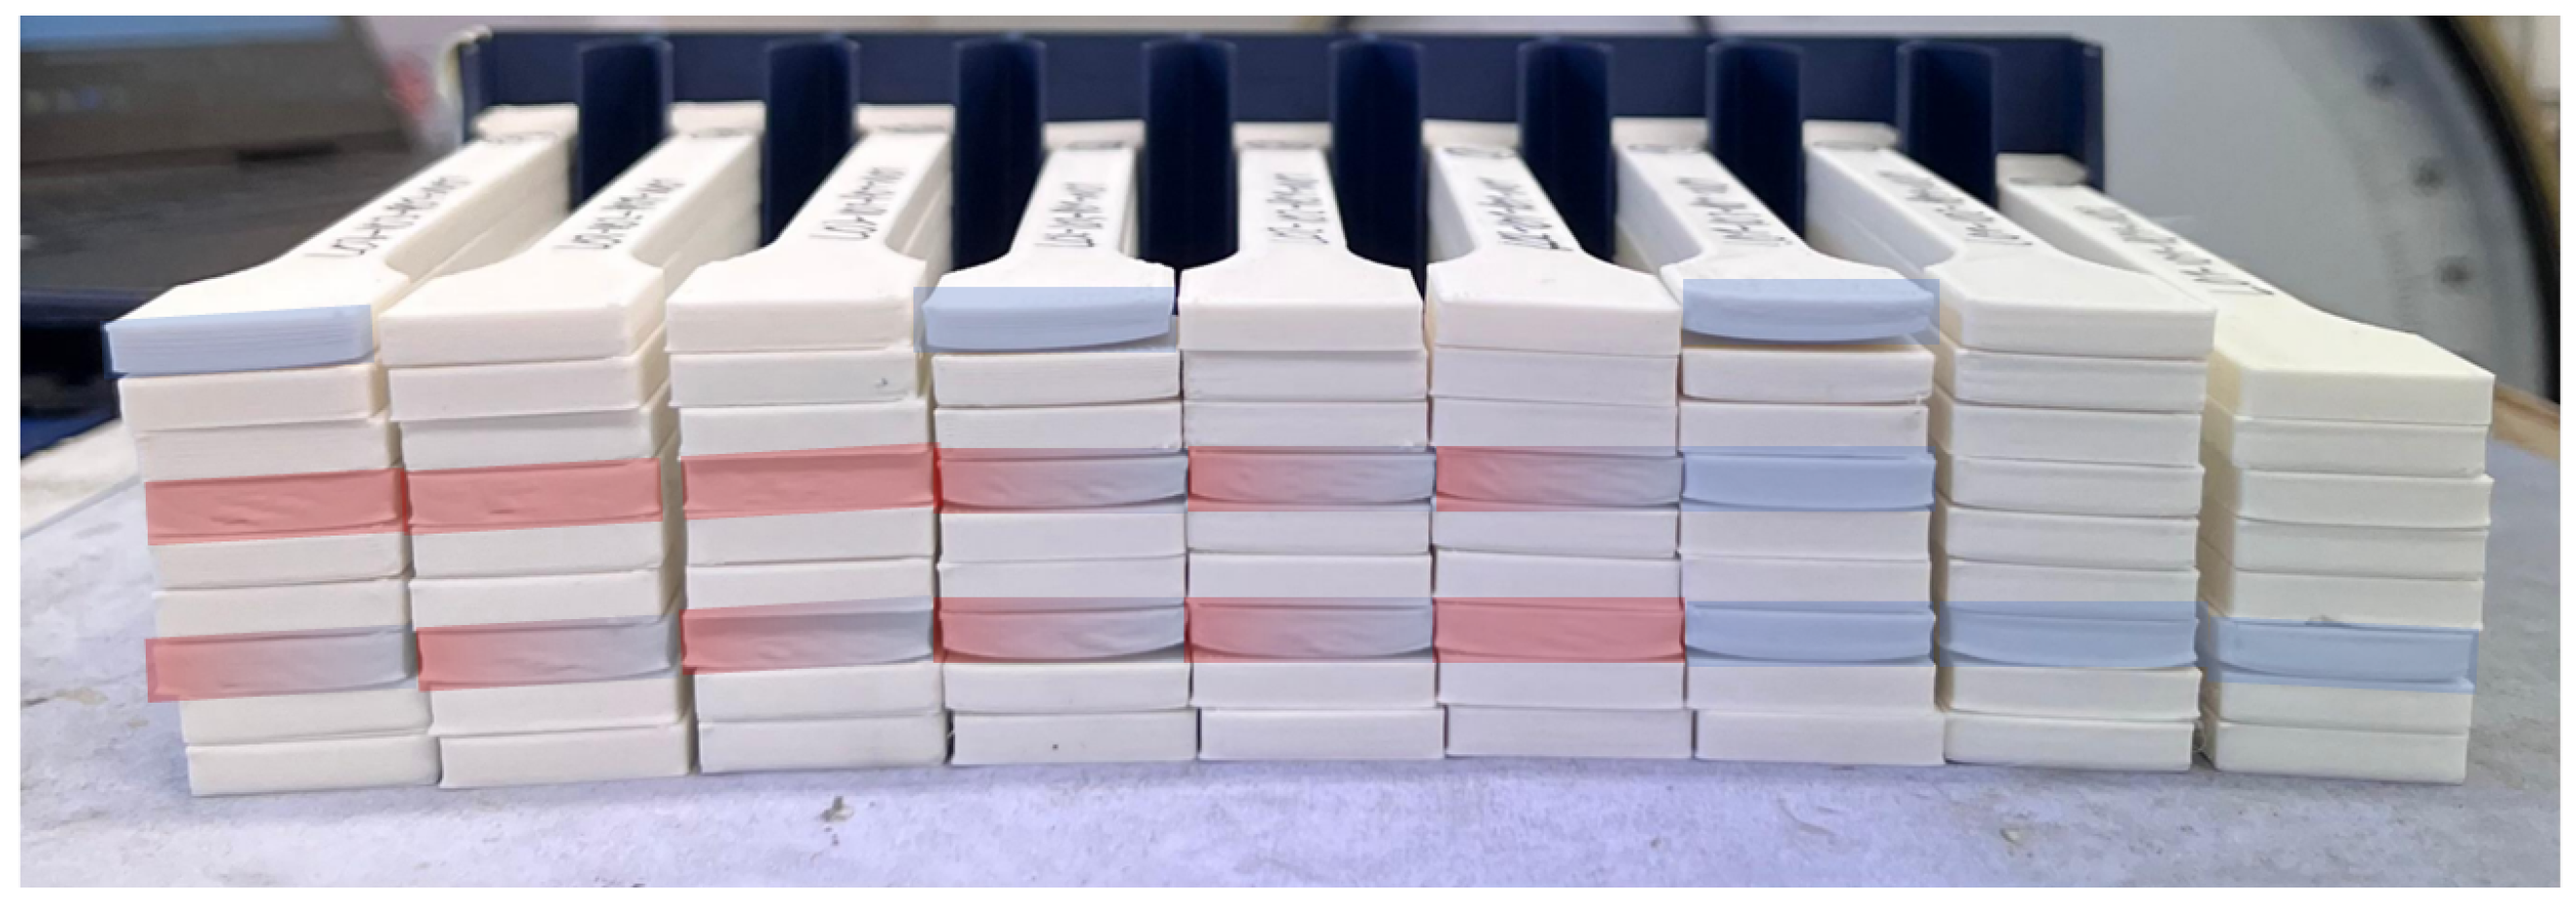
Visual Inspection of Printed Specimens

A preliminary visual inspection of the printed samples was conducted. It was observed that specimens produced using parameter combinations involving N01 exhibited noticeable extrusion issues, such as non-rectangular outer contour/curvature or irregularities in the print image itself, as shown in Figure 2.

Mechanical Characterization via Tensile Testing

To assess the mechanical performance, tensile tests were performed on the printed specimens. The tensile strengths of the nine analyzed specimens ranged from 13.18 MPa to 25.57 MPa, indicating a variation of approximately 94%. The specimen with parameters L01–I03–P03–N03 exhibited the highest tensile strength of 25.57 MPa, while the lowest value of 13.18 MPa was recorded for the specimen L03–I01–P03–N02.
Table 9 lists the tensile strengths and corresponding process parameters for each specimen. To further investigate the relationship between process parameters and tensile strength, a correlation analysis was conducted. The resulting correlation matrix is illustrated in Figure 3.
A strong positive correlation ( r = 0.94 ) was observed between the infill density and the tensile strength, indicating that increasing the infill density generally leads to a significant improvement in tensile strength. Layer height showed a moderate negative correlation ( r = 0.29 ), suggesting that decreasing the layer height yields higher tensile strength. The nozzle temperature exhibited a weak positive correlation ( r = 0.15 ), while the number of perimeters showed virtually no correlation ( r = 0.04 ).
In general, the process parameters themselves showed minimal mutual correlations, except for a weak positive correlation (0.18) between nozzle temperature and both layer height and infill density. This suggests that these parameters largely act independently in influencing the mechanical properties.

Geometrical Analysis via 3D Scanning

A 3D scan-based geometric analysis was performed to evaluate the consistency of the printed specimens with respect to the theoretical reference volume of 7811.247 mm3. All nine analyzed specimens exhibited negative volume deviations, ranging from − 0.18 % to − 1.03 % . The greatest deviation ( 1.03 % ) was observed for the specimen L02–I02–P01–N01, while the smallest deviation (− 0.18 % ) occurred for L01–I01–P03–N03.
Table 10 presents the measured volumes and corresponding deviations. Figure 4 displays the correlation matrix, emphasizing how volume deviation relates to the various process parameters.
Volume deviation correlated moderately and negatively ( r = 0.54 ) with both layer height and infill density, indicating that higher layer heights or greater infill densities tend to reduce the final volume below the target. The nozzle temperature showed a weak positive correlation ( r = 0.20 ), whereas the number of perimeters had a correlation coefficient of 0.11. Moreover, there was a strong correlation ( r = 0.92 ) between the number of perimeters and the nozzle temperature, suggesting that these two parameters may be adjusted in tandem within the specific printing setup.
Specimens with the smallest volume deviations (ranging from 0.18 % to 0.62 % ) contrast with those having larger deviations (ranging from 0.63 % to 1.03 % ). Despite the variation, all specimens showed a consistent undershooting of the reference volume, reflecting the overall influence of the chosen process parameters on material deposition.

5.2. CO2 Prediction with ML Methods

This subsection deals with the results in regard to the second research objective of predicting the CO2 footprint with various machine learning algorithms. It is divided into two topics, the evaluation of the performance of the models and the model interpretation.

5.2.1. Model Evaluation

The model evaluation results (Table 11) show that XGBoost outperforms other models with the lowest RMSE (0.4816) and MAE (0.3802) and the highest R 2 (0.9922). The TabTransformer ranks second, followed by SVM, random forest, and Gaussian process regressor.

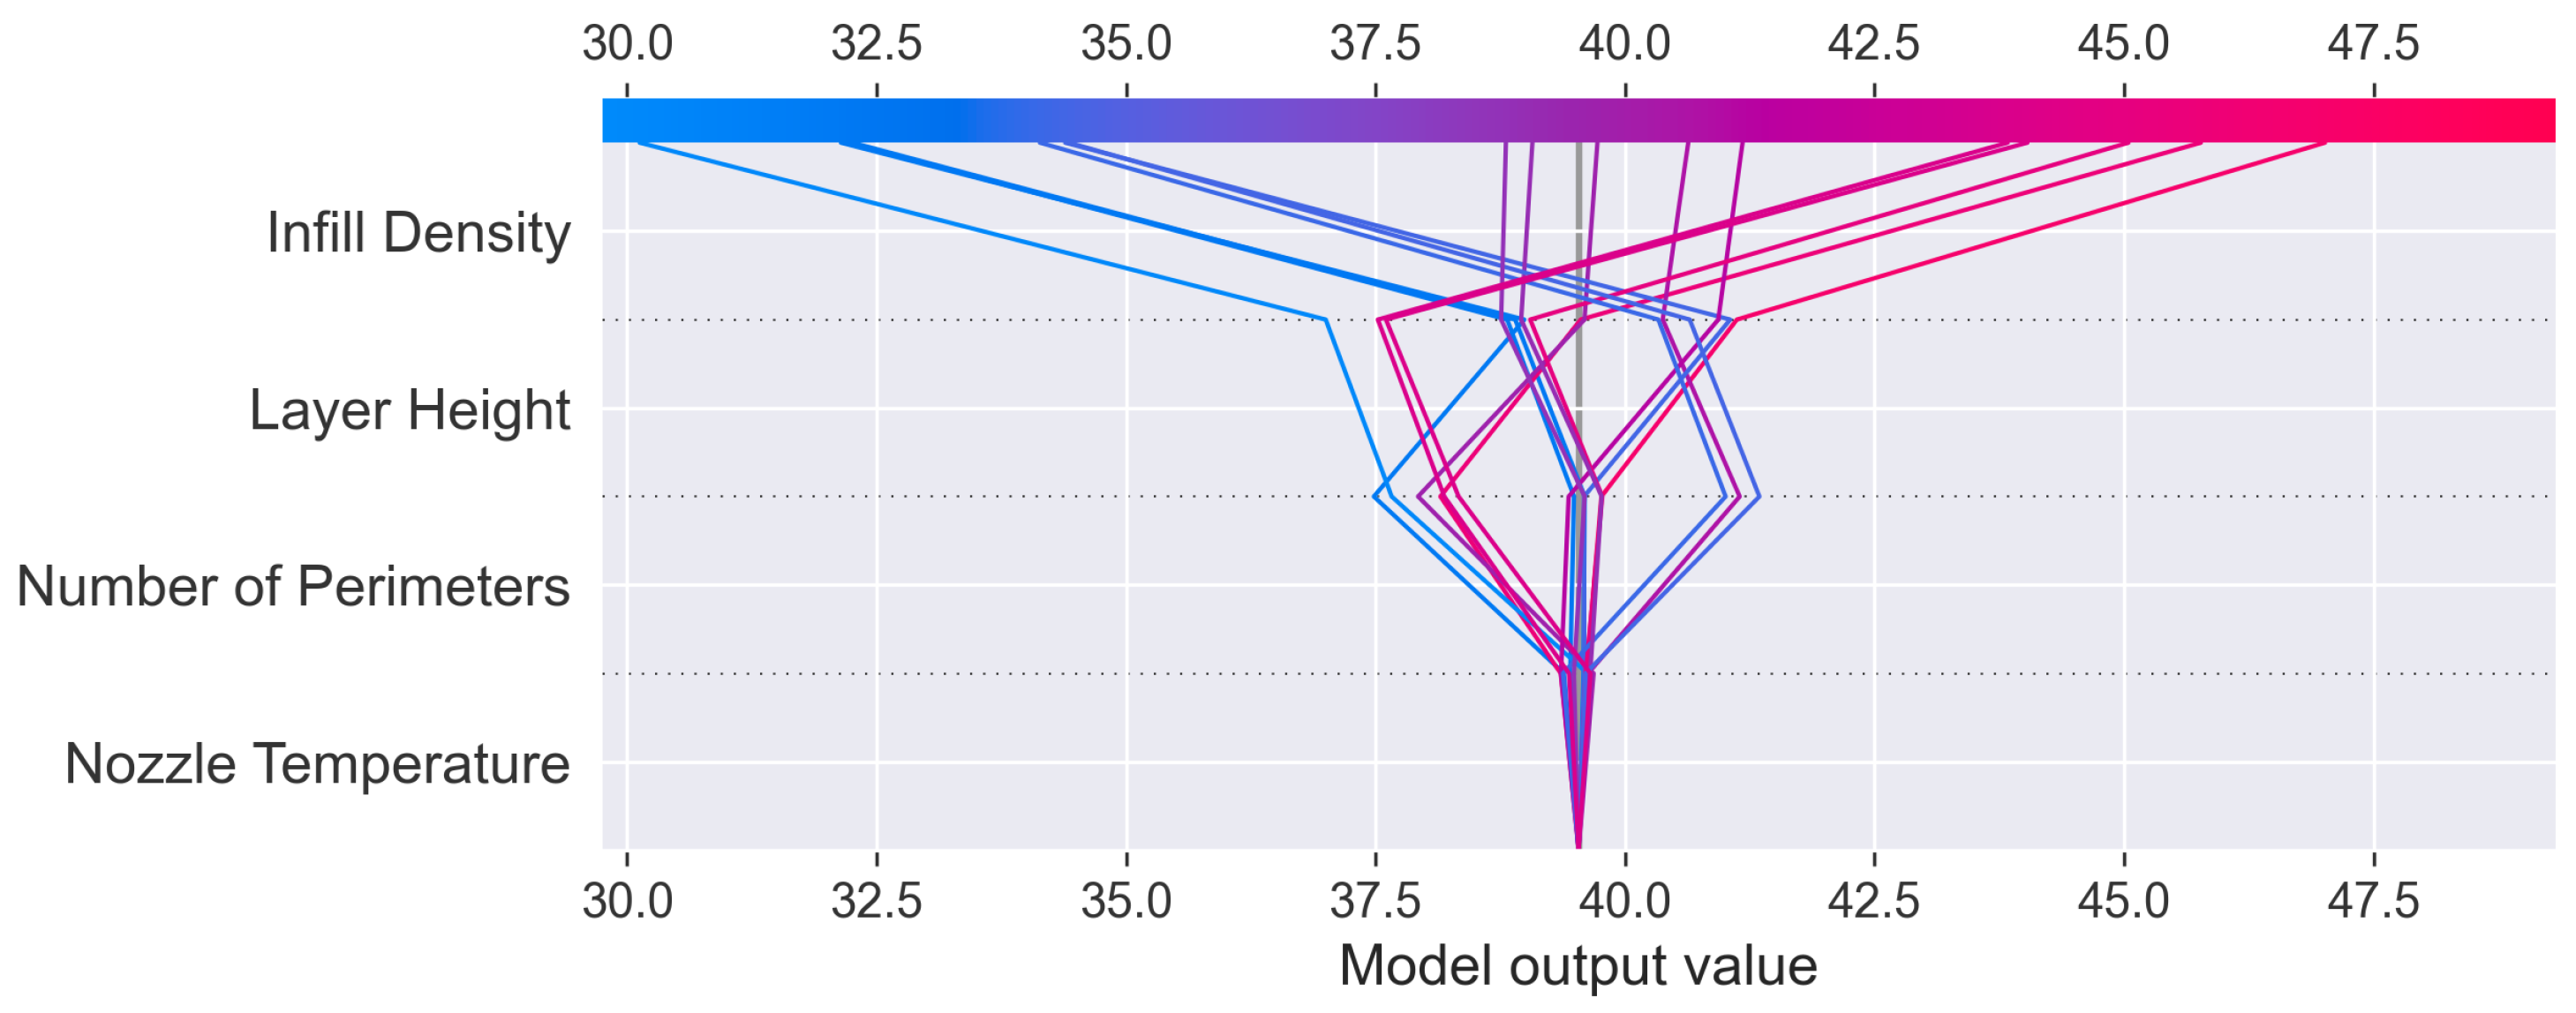
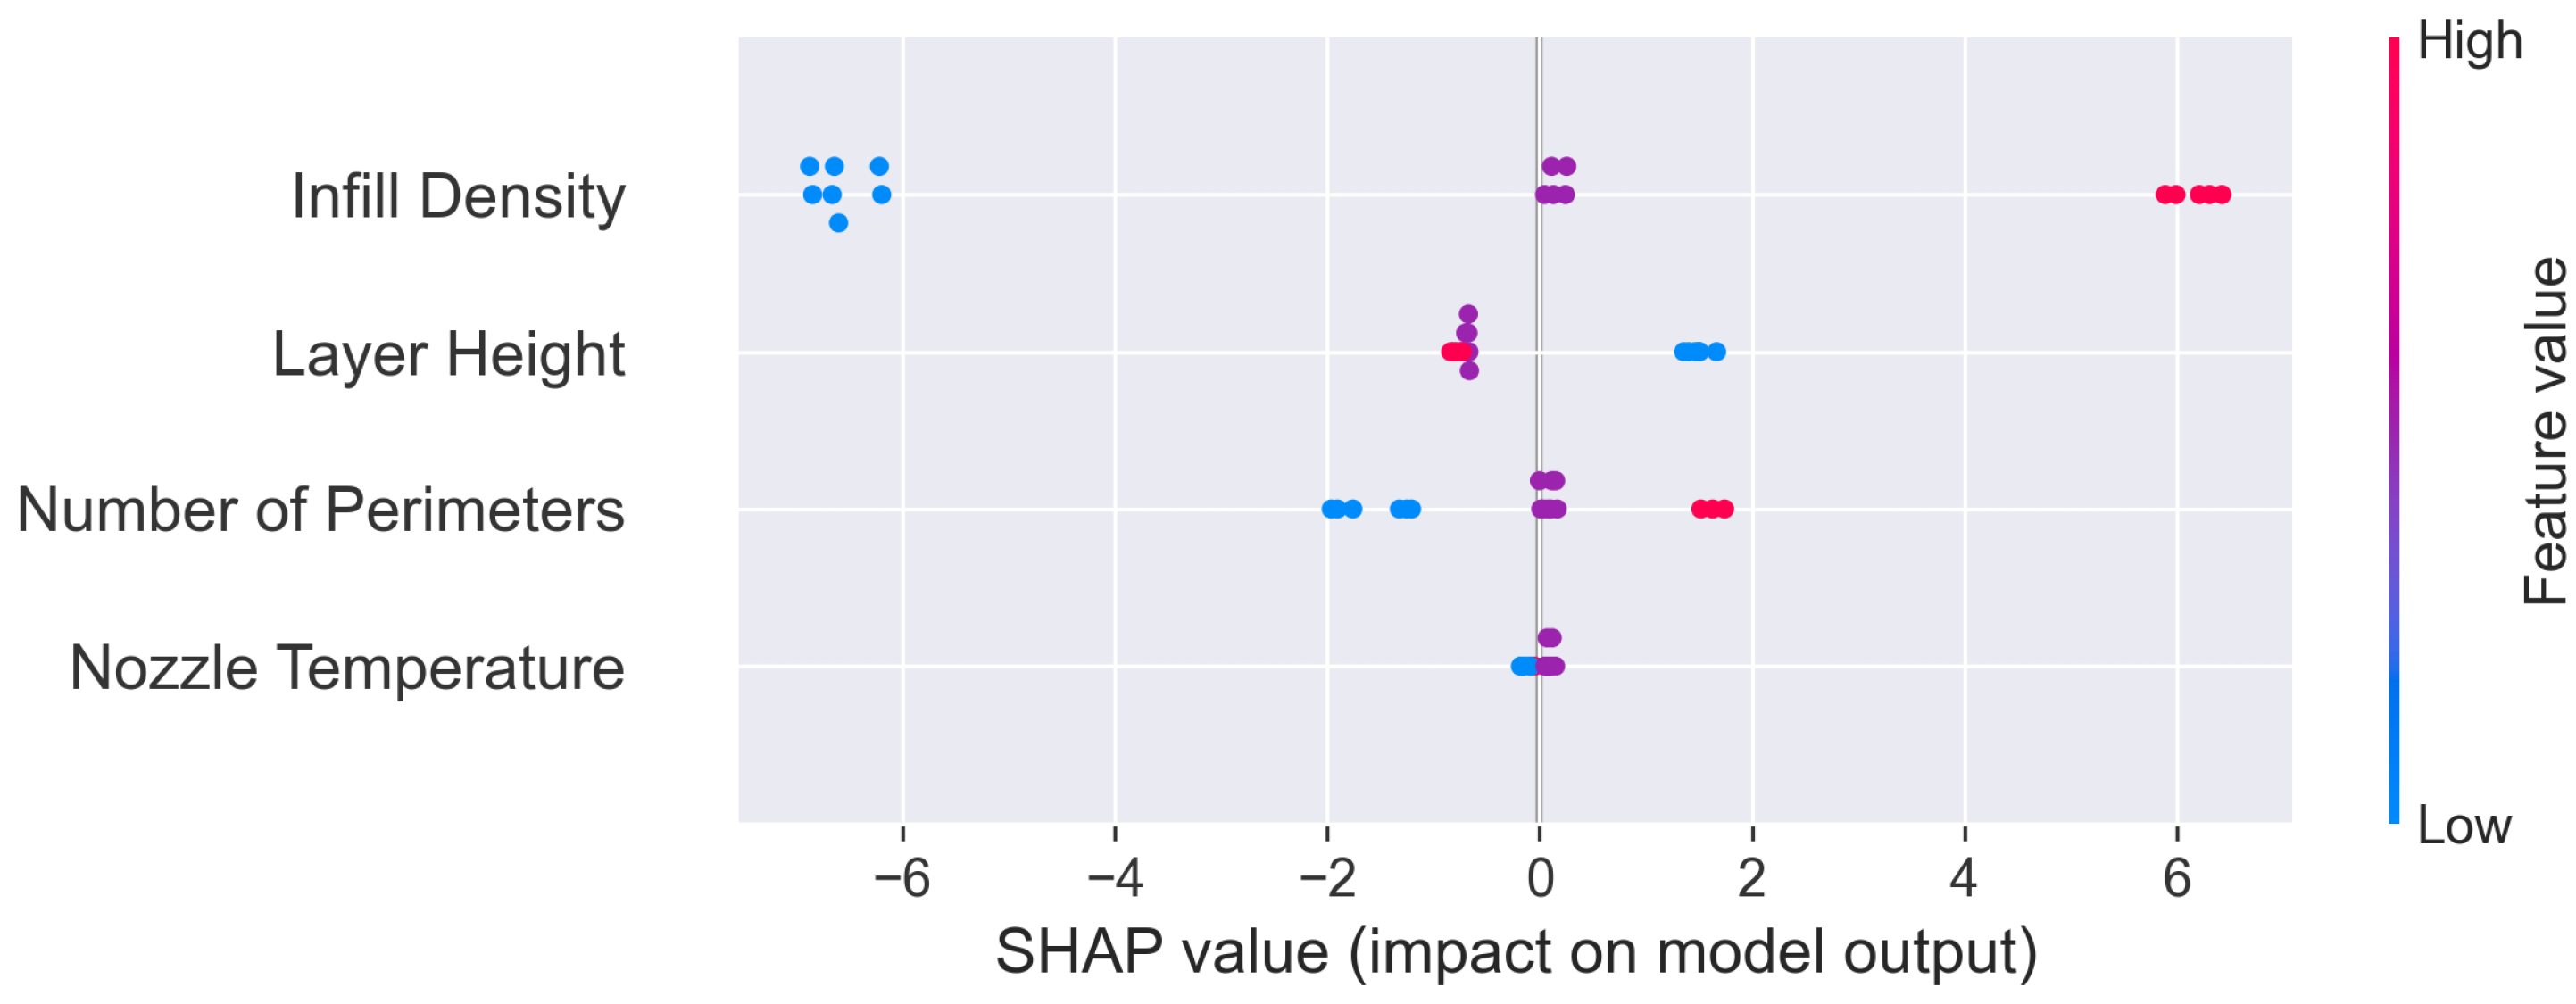
5.2.2. Model Interpretation

The feature importance plot (Figure 5) ranks the features according to their relative contribution to the performance of the model, measured by gain. In a regression setting, gain represents how much each feature reduces the model’s loss (e.g., mean squared error) on average across all splits, with a higher gain indicating a larger impact on predictive performance. Infill density emerges as the most critical feature, significantly outpacing all other parameters. Number of perimeters and layer height are identified as moderately important, while nozzle temperature has minimal influence.
The SHAP decision plot (Figure 6) visualizes how individual features contribute to the model predictions for specific instances. High-impact features, such as infill density, are shown to have strong, consistent effects across a wide range of predictions. The plot provides a clear overview of how feature values influence the model’s output, particularly highlighting the dominance of infill density in shaping predictions. This interpretation aligns with the observed ranking of the importance of features, where the infill density consistently emerges as the most influential parameter.
The SHAP summary plot (Figure 7) provides an aggregated view of feature contributions across all instances. Each point represents a single prediction, with its position on the x-axis showing the SHAP value, which quantifies the feature’s contribution to the output. The color of each point represents the feature value, with red indicating high values and blue indicating low values. Infill density demonstrates the highest impact on the model predictions, as evidenced by its wide distribution of SHAP values. In contrast, nozzle temperature exhibits minimal impact, suggesting it has a limited influence on the output. The summary plot also reveals patterns between feature values and their effects on predictions, such as the positive correlation between high infill density and higher model outputs.

5.2.3. Edge Case Analyzes

As shown in Table 12, the top five instances with the highest absolute prediction errors tend to occur at boundary conditions (i.e., minimum or maximum levels for multiple parameters).
In particular, the first row (Index 1) has all factors at their lowest levels (L = 01, I = 01, P = 01, N = 01) and shows the highest error (1.0869). Similarly, row 14 (Index 14) combines maximum values for L and N (both at level 03) with intermediate levels (02) for I and P, again producing a relatively large error (1.0587). In contrast, entries where only one or two parameters reach extremes exhibit moderately lower errors (approximately 0.48–0.50). In general, these results indicate that the model struggles slightly more when dealing with extreme configurations, suggesting that additional training data at boundary conditions or specialized modeling strategies could further improve the predictive accuracy.

6. Discussion

Since the related works did not reveal an investigation of all four metrics, including energy, material, CO2 footprint, and quality, in one study, this study represents a research highlighting the inter dependencies among the four metrics.
One key contribution of this work is the statistical analysis revealing that energy consumption is significantly influenced by the infill density, layer height, and the number of walls, while the temperature of the nozzle shows a p-value slightly above the 0.05 threshold and exerts only a minor impact on total power usage. These results align with those of multiple studies, yet also demonstrate interesting discrepancies. For example, ref. [13] confirms that layer height and infill density significantly affect energy consumption but report different effect magnitudes, likely due to variations in the parameter ranges, test geometries, or printer. Although the present study indicates that the wall number has a statistically significant effect, ref. [13] found no such significance. These differences highlight the degree to which experimental design can shape the observed parameter hierarchies.
The height of the layer emerges as a pivotal factor both for energy efficiency and surface quality. In particular, ref. [12] stresses the trade-off between energy consumption and the “stair-stepping” effect: Larger layer heights may reduce power usage but compromise the finish of the surface, most noticeably on curved or angled surfaces. In a related study, ref. [14] identified the layer height as the most crucial lever to optimize energy efficiency and presented a breakdown of emissions by components of the printer. According to their analysis, the heated build platform (49%) and the motion system (41%) account for the majority of CO2 emissions, while the nozzle contributes only around 3%. This breakdown aligns well with our finding that adjustments to the nozzle temperature have a minimal impact on total power usage, supporting its statistically insignificant role in the present study.
By applying the full factorial experimental design, it was possible to analyze the interdependencies of the parameters. However, the statistical analysis did not reveal any significant influences on the energy consumption of the printer for combinations of the four investigated parameters, layer height, filling density, number of walls, and nozzle temperature. In retrospect, a partial factorial test setup would have sufficed.
In terms of material consumption, our results also confirm and refine the existing literature, where material consumption is less investigated than energy consumption. Consistent with [13], infill density is the dominant factor with statistical significance. However, like that previous study, we did not detect a significant influence of other parameters, such as the height of the layer or the thickness of the wall on the use of the material.
In particular, the exclusive importance of the density of infill for material consumption highlighted here adds a novel dimension to the research landscape, positioning the infill density as a key parameter to consider in any material-minimization strategy.
Moreover, the same pattern extends to overall CO2 emissions. Here, infill density alone emerges as a statistically significant parameter, a result that may appear unsurprising given that it influences both energy and material usage. Approximately 30% of the emissions in this study can be attributed to energy consumption and 70% to material consumption, underscoring the dual impact of fill density on the total carbon footprint of a product. This integrated perspective builds on previous work, which has often treated energy and material efficiency separately, by emphasizing that a holistic, CO2-oriented analysis reveals additional opportunities for sustainability-focused improvements.
Regarding the quality of the printed parts, including visual appearance, volumetric undershoot, and tensile strength, the following insights could be revealed. Through the visual inspection it could be observed that specimens produced using parameter combinations involving the minium nozzle temperature exhibited noticeable extrusion issues, such as non-rectangular outer contour, curvature, or irregularities in the print image itself. A negative correlation between the nozzle temperature and the quality of the print can be assumed. Further information is obtained from the 3D-scan analyses, which consistently show a volumetric undershoot relative to the nominal target of 7811.247 mm 3 . The actual volumes ranged between 0.18 % and 1.03 % below the theoretical value, with the L01–I01–P03–N03 parameter set achieving the highest dimensional accuracy and L02–I02–P01–N01 presenting the largest deviation, which confirms the previous statement from the visual inspection. These systematic shortfalls could stem from material shrinkage during cooling or insufficient extrusion. In particular, both the layer height and the infill density exhibited moderate negative correlations ( r = 0.54 ) with volumetric deviations, indicating that larger values for these parameters may further reduce the volume of the final part. Since a lower infill density reduces energy consumption and increases volumetric accuracy, both values go hand in hand.
Likewise, mechanical testing revealed significant variations in tensile strength, ranging from 13.18 MPa to 25.57 MPa , equivalent to a spread of 94%. Infill density emerges once again as the paramount factor, showing a strong positive correlation ( r = 0.94 ) with tensile strength. Given that infill density also governs both energy consumption and overall CO2 emissions, a classical trade-off arises between mechanical performance and sustainability. The higher infill density improves the tensile strength but increases material demand and energy usage, thus increasing the CO2 footprint. These trade-offs between different metrics could also be found in related works; they revealed, e.g., trade-offs between energy efficiency and other factors such as mechanical performance and part quality [12,13]. To address the trade-offs between mechanical performance and emissions in real-world AM applications, a customized parameter selection strategy with application-specific decision-making is required, where minimal mechanical requirements must be carefully weighed against sustainability objectives. For components subjected to high mechanical loads, a higher infill density may be unavoidable, but targeted reductions in material usage, such as optimized internal structures or functionally graded infill densities, can help mitigate excessive emissions. Conversely, for non-load-bearing parts, a lower infill density should be prioritized to minimize material consumption and energy use. Hybrid strategies, where infill density is varied on the basis of localized stress distributions, could offer a practical compromise. Future work should explore computational design approaches that integrate sustainability constraints into topology optimization workflows, allowing AM practitioners to systematically balance strength, material efficiency, and CO2 footprint reduction.
Another key contribution of this work is the analysis of various ML methods for CO2 prediction, as the only found study utilizing AI algorithms for the prediction of CO2 footprint through printing parameters in the context of AM. This study revealed that the algorithm XGBoost outperforms other models with the lowest RMSE (0.4816) and MAE (0.3802) and the highest R 2 (0.9922). With an R 2 value of 0.9922, the AI algorithm in this study ranks among the three best-performing algorithms in the comparative studies with values of 0.9977 for the prediction of compressive strength through an ANN [47] and above 0.99 for the prediction of energy consumption through a GPR [49]. The XGBoost algorithm showed its potential not only in this study, but it was also presented as most efficient for the prediction of tensile strength among five algorithms, with an R 2 value of 0.97 [41], ranking, overall, in fourth place regarding R 2 values in related studies. In examining the sample size employed for predictive analysis, this investigation, which utilized a total of 81 samples, is categorized among AI algorithms that function with relatively smaller sample sizes. However, it should be noted that this study did not establish a new benchmark for the minimum sample size, as previously explored minimums in the literature, such as those of [15,41,50], which used as few as 27 samples in their neural network models. It is crucial to note that the methodologies of these referenced studies involved the application of different or less varied parameters compared to this study. Furthermore, these previous studies did not seek to explore any interconnections between the parameters considered. Nevertheless, given the relatively small dataset, there remains a risk of overfitting, particularly for complex models like XGBoost. Future work could mitigate this by employing data augmentation strategies such as synthetic data generation or targeted sampling of underrepresented parameter combinations to improve model robustness and generalization.
In our study, while the role of AI in predicting CO2 emissions in additive manufacturing has demonstrated promising precision, we acknowledge the potential ethical and computational limitations inherent in our approach. Ethical considerations include the reliance on precise measurement data from energy and material consumption, raising questions about data accuracy, completeness, and potential measurement biases. Computationally, limitations arise from the resource-intensive nature of performing full-factorial experimental designs, the complexity of capturing nuanced parameter interactions, and the challenge of ensuring sufficient data volume and variability to train robust predictive models. Recognizing these constraints is crucial to transparently interpret our findings and responsibly apply AI-driven models in sustainable manufacturing contexts.
The study by [49] presented GPR as the best algorithm for predicting electricity consumption in a comparison of 12 ML algorithms. However, in this study, the use of GPR for predicting carbon footprint is not emphasized; the Gaussian process regressor only achieved 5th place when considering the R 2 values. In addition to utilizing the best performing XGBoost algorithm, a variety of other machine learning algorithms were implemented. The TabTransformer algorithm was identified as the second most effective, with subsequent performances observed for SVM, random forest, and Gaussian process regressor, which yielded an R 2 value of 0.91. This performance discrepancy could be attributed to the use of merely 81 samples versus 184, as well as the focus on predicting the CO2 footprint rather than solely energy consumption. Furthermore, the examination of AI methodologies also provided insight into the influences of various printing parameters on both material and energy consumption, in addition to the CO2 footprint, as demonstrated by statistical analysis. The XGBoost algorithm’s feature importance analysis prominently the identified infill density as the most paramount parameter, surpassing all other variables in significance. The SHAP analysis extended this insight, establishing infill density as a high-impact feature with uniformly strong effects across diverse predictive scenarios, thus corroborating the previously mentioned parameter hierarchy. In contrast, the number of perimeters and layer height were deemed to hold moderate importance, while the nozzle temperature exhibited a negligible influence on the predictive outcomes. Moreover, discernible patterns emerged between feature values and their resultant effects on predictions, such as the observed positive correlation between higher infill density and increased prediction outcomes.

7. Conclusions

This study provides clear evidence that optimizing the printing parameters can significantly reduce the environmental impact of FDM-based additive manufacturing. Among 81 systematically varied prints, the infill density emerged as the dominant factor, exerting a marked influence on material consumption, energy use and, consequently, total CO2 emissions. Although other parameters, such as layer height and wall number, did affect the process (for example, layer height had a noticeable impact on print time and energy consumption), their overall influence on emissions remained relatively modest by comparison. In particular, nozzle temperature showed negligible effects on CO2 output, suggesting that heat settings can be fine-tuned primarily with mechanical performance in mind, without substantially increasing the carbon footprint.
In predicting CO2 emissions, XGBoost stood out as the top-performing machine learning algorithm, achieving an R 2 of 0.9922 despite a relatively small dataset. This underscores the promise of data-driven approaches for both parameter analysis and near-real-time decision support. By coupling robust predictive models with multiobjective or constrained optimization routines, future studies can derive parameter sets that reconcile competing needs: for instance, balancing mechanical robustness with ecological footprint. Further expansion of the parameter space, such as including print speed or alternative nozzle geometries, will likely yield an even richer basis for model training and optimization. In addition, feedback from quality control (for example, tensile testing or dimensional accuracy) can serve as an additional layer of constraint or objective in these optimization workflows, ensuring that sustainability gains do not come at the cost of part integrity.
Beyond its academic contributions, this study offers concrete guidance for industry professionals seeking to implement more sustainable FDM workflows. By prioritizing infill density adjustments and leveraging machine learning for emissions forecasting, companies can achieve measurable CO2 reductions without sacrificing production efficiency or part quality.
Taken as a whole, these results chart a path toward more intelligent and sustainable FDM practice, where practitioners and researchers alike can pinpoint emission-critical levers (chiefly infill density) while relying on high-fidelity ML predictions to evaluate design or operational changes. As industry and academia continue to prioritize sustainability, the findings here show how a methodical data-driven methodology can guide evidence-based decisions that reduce CO2 footprints while preserving or even improving mechanical performance.

Author Contributions

Conceptualization, S.H. and L.G.; writing—original draft preparation, S.H. and N.B.; software, L.G. and N.B.; visualization, S.H. and N.B.; writing—review and editing, S.H., L.G. and N.B.; supervision, J.O.; All authors have read and agreed to the published version of the manuscript.

Funding

The research was partially funded by the German Federal Ministry for Economic Affairs and Climate Action (BMWK) through a research project (No. 03LB3058B).

Institutional Review Board Statement

Not applicable.

Informed Consent Statement

Not applicable.

Data Availability Statement

The raw data supporting the conclusions of this article will be made available by the authors on request.

Conflicts of Interest

The authors declare no competing or financial interests.

References

  1. International Energy Agency (IEA). World Energy Outlook 2023; International Energy Agency (IEA): Paris, France, 2023. [Google Scholar]
  2. United Nations (UN). Paris Agreement; United Nations (UN): Bonn, Germany, 2015. [Google Scholar]
  3. Europäische Union (EU). Der Europäische Grüne Deal; Europäische Union (EU): Brussels, Belgium, 2019. [Google Scholar]
  4. European Union (EU). DIRECTIVE (EU) 2022/2464 OF THE EUROPEAN PARLIAMENT AND OF THE COUNCIL of 14 December 2022 Amending Regulation (EU) No 537/2014, Directive 2004/109/EC, Directive 2006/43/EC and Directive 2013/34/EU, as Regards Corporate Sustainability Reporting, 2022. Available online: https://eur-lex.europa.eu/legal-content/EN/TXT/?uri=CELEX%3A32022L2464 (accessed on 28 February 2025).
  5. Wiedmann, T.; Minx, J. A Definition of ‘Carbon Footprint’. Ecological Economics Research Trends; Nova Science Publisher: Hauppauge, NY, USA, 2008; pp. 1–11. [Google Scholar]
  6. World Resources Institute (WRI). Greenhouse Gas Protocol: A Corporate Accounting and Reporting Standard. World Resources Institute: Washington, DC, USA, 2004; Available online: https://ghgprotocol.org/corporate-standard (accessed on 28 February 2025).
  7. Ford, S.; Despeisse, M. Additive manufacturing and sustainability: An exploratory study of the advantages and challenges. J. Clean. Prod. 2016, 137, 1573–1587. [Google Scholar] [CrossRef]
  8. Mehrpouya, M.; Vosooghnia, A.; Dehghanghadikolaei, A.; Fotovvati, B. Chapter 2—The benefits of additive manufacturing for sustainable design and production. In Sustainable Manufacturing; Gupta, K., Salonitis, K., Eds.; Handbooks in Advanced Manufacturing; Elsevier: Amsterdam, The Netherlands, 2021; pp. 29–59. [Google Scholar] [CrossRef]
  9. Jung, S.; Kara, L.B.; Nie, Z.; Simpson, T.W.; Whitefoot, K.S. Is Additive Manufacturing an Environmentally and Economically Preferred Alternative for Mass Production? Environ. Sci. Technol. 2023, 57, 6373–6386. [Google Scholar] [CrossRef] [PubMed]
  10. Gebler, M.; Uiterkamp, A.J.S.; Visser, C. A global sustainability perspective on 3D printing technologies. Energy Policy 2014, 74, 158–167. [Google Scholar] [CrossRef]
  11. Qi, X.; Chen, G.; Li, Y.; Cheng, X.; Li, C. Applying Neural-Network-Based Machine Learning to Additive Manufacturing: Current Applications, Challenges, and Future Perspectives. Engineering 2019, 5, 721–729. [Google Scholar] [CrossRef]
  12. Ahmad, N.N.; Wong, Y.H.; Ghazali, N.N.N. A systematic review of fused deposition modeling process parameters. Soft Sci. 2022, 2, 11. [Google Scholar] [CrossRef]
  13. Enemuoh, E.U.; Duginski, S.; Feyen, C.; Menta, V.G. Effect of Process Parameters on Energy Consumption, Physical, and Mechanical Properties of Fused Deposition Modeling. Polymers 2021, 13, 2406. [Google Scholar] [CrossRef] [PubMed]
  14. Yu, S.; Liu, H.; Zhao, G.; Zhang, H.; Hou, F.; Xu, K. A code-based method for carbon emission prediction of 3D printing: A case study on the fused deposition modeling (FDM) 3D printing and comparison with conventional approach. J. Clean. Prod. 2024, 484, 144341. [Google Scholar] [CrossRef]
  15. Sood, A.; Ohdar, R.; Mahapatra, S. Parametric appraisal of fused deposition modelling process using the grey Taguchi method. Proc. Inst. Mech. Eng. Part B J. Eng. Manuf. 2010, 224, 135–145. [Google Scholar] [CrossRef]
  16. Chia, H.Y.; Wu, J.; Yan, W. Process parameter optimization of metal additive manufacturing: A review and outlook. J. Mater. Inform. 2022, 2, 16. [Google Scholar] [CrossRef]
  17. Sing, S.L.; Kuo, C.N.; Shih, C.T.; Ho, C.C.; Chua, C.K. Perspectives of using machine learning in laser powder bed fusion for metal additive manufacturing. Virtual Phys. Prototyp. 2021, 16, 372–386. [Google Scholar] [CrossRef]
  18. Nikooharf, M.H.; Shirinbayan, M.; Arabkoohi, M.; Bahlouli, N.; Fitoussi, J.; Benfriha, K. Machine learning in polymer additive manufacturing: A review. Int. J. Mater. Form. 2024, 17, 52. [Google Scholar] [CrossRef]
  19. Zhang, X.; Li, J.; Wang, Y.; Liu, Y.; Zhang, H. Research on the formation mechanism of surface defects in 5182 aluminum alloy strip during hot rolling. Int. J. Miner. Metall. Mater. 2024, 31, 1–12. [Google Scholar] [CrossRef]
  20. Kumar, S.; Gopi, T.; Harikeerthana, N.; Gupta, M.K.; Gaur, V.; Krolczyk, G.M.; Wu, C. Machine learning techniques in additive manufacturing: A state of the art review on design, processes and production control. J. Intell. Manuf. 2023, 34, 21–55. [Google Scholar] [CrossRef]
  21. Wohlers, T.; Campbell, I.; Diegel, O.; Huff, J.; Kowen, R. Wohlers Report 2021: 3D Printing and Additive Manufacturing: State of the Industry, 26th ed.; Wohlers Associates: Fort Collins, CO, USA, 2021. [Google Scholar]
  22. Gibson, I.; Rosen, D.; Stucker, B.; Khorasani, M. Additive Manufacturing Technologies; Springer International Publishing: Berlin/Heidelberg, Germany, 2021. [Google Scholar] [CrossRef]
  23. Elkington, J. Cannibals with Forks: The Triple Bottom Line of 21st Century Business; Capstone: Oxford, UK, 1997. [Google Scholar]
  24. Kates, R.W.; Clark, W.C.; Corell, R.; Hall, J.M.; Jaeger, C.C.; Lowe, I.; McCarthy, J.J.; Schellnhuber, H.J.; Bolin, B.; Dickson, N.M.; et al. Sustainability science. Science 2001, 292, 641–642. [Google Scholar] [CrossRef] [PubMed]
  25. Guinée, J.B.; Gorrée, M.; Heijungs, R.; Huppes, G.; Kleijn, R.; de Koning, A.; van Oers, L.; Wegener Sleeswijk, A.; Suh, S.; Udo de Haes, H.A.; et al. Life Cycle Assessment: An Operational Guide to the ISO Standards; Kluwer Academic Publishers: Dordrecht, The Netherlands, 2002. [Google Scholar]
  26. Holland, J.H. Adaptation in Natural and Artificial Systems; University of Michigan Press: Ann Arbor, MI, USA, 1975. [Google Scholar]
  27. Goodfellow, I.; Bengio, Y.; Courville, A. Deep Learning; MIT Press: Cambridge, MA, USA, 2016. [Google Scholar]
  28. Breiman, L. Random forests. Mach. Learn. 2001, 45, 5–32. [Google Scholar] [CrossRef]
  29. Greif, L.; Kimmig, A.; El Bobbou, S.; Jurisch, P.; Ovtcharova, J. Strategic view on the current role of AI in advancing environmental sustainability: A SWOT analysis. Discov. Artif. Intell. 2024, 4, 45. [Google Scholar] [CrossRef]
  30. Greif, L.; Röckel, F.; Kimmig, A.; Ovtcharova, J. A systematic review of current AI techniques used in the context of the SDGs. Int. J. Environ. Res. 2025, 19, 1. [Google Scholar] [CrossRef]
  31. Womack, J.P.; Jones, D.T. Lean Thinking: Banish Waste and Create Wealth in Your Corporation; Simon and Schuster: New York, NY, USA, 1996. [Google Scholar]
  32. Gibson, I.; Rosen, D.W.; Stucker, B. Additive Manufacturing Technologies: Rapid Prototyping to Direct Digital Manufacturing; Springer: New York, NY, USA, 2010. [Google Scholar] [CrossRef]
  33. Rother, M.; Shook, J. Learning to See: Value-Stream Mapping to Add Value and Eliminate MUDA; Lean Enterprise Institute: Cambridge, MA, USA, 2009. [Google Scholar]
  34. Peng, T. Analysis of Energy Utilization in 3D Printing Processes. Procedia CIRP 2016, 40, 62–67. [Google Scholar] [CrossRef]
  35. Liu, Z.; Jiang, Q.; Zhang, Y.; Li, T.; Zhang, H.C. Sustainability of 3D Printing: A Critical Review and Recommendations. In Proceedings of the Volume 2: Materials; Biomanufacturing; Properties, Applications and Systems; Sustainable Manufacturing. American Society of Mechanical Engineers: New York, NY, USA, 2016; p. V002T05A004. [Google Scholar] [CrossRef]
  36. Hernandez, M.E.; Albajez, J.A.; Lamban, M.P.; Royo, J.; Santolaria, J.; Ng Corrales, L.C. Fused deposition modelling process environmental performance through the carbon footprint evaluation. IOP Conf. Ser. Mater. Sci. Eng. 2021, 1193, 012127. [Google Scholar] [CrossRef]
  37. Peng, T.; Kellens, K.; Tang, R.; Chen, C.; Chen, G. Sustainability of additive manufacturing: An overview on its energy demand and environmental impact. Addit. Manuf. 2018, 21, 694–704. [Google Scholar] [CrossRef]
  38. Manford, D.; Budinoff, H.D. Predicting filament material extrusion energy consumption: A comparative study. Prog. Addit. Manuf. 2024, 10, 2653–2662. [Google Scholar] [CrossRef]
  39. Nikzad, M.H.; Heidari-Rarani, M.; Rasti, R. A novel systematically optimized tabular neural network (TabNet) algorithm for predicting the tensile modulus of additively manufactured PLA parts. Mater. Today Commun. 2024, 41, 110442. [Google Scholar] [CrossRef]
  40. Nikzad, M.H.; Heidari-Rarani, M.; Rasti, R.; Sareh, P. Machine learning-driven prediction of tensile strength in 3D-printed PLA parts. Expert Syst. Appl. 2025, 264, 125836. [Google Scholar] [CrossRef]
  41. Jayasudha, M.; Elangovan, M.; Mahdal, M.; Priyadarshini, J. Accurate Estimation of Tensile Strength of 3D Printed Parts Using Machine Learning Algorithms. Processes 2022, 10, 1158. [Google Scholar] [CrossRef]
  42. Afonso, J.A.; Alves, J.L.; Caldas, G.; Gouveia, B.P.; Santana, L.; Belinha, J. Influence of 3D printing process parameters on the mechanical properties and mass of PLA parts and predictive models. Rapid Prototyp. J. 2021, 27, 487–495. [Google Scholar] [CrossRef]
  43. Winter, S.; Osterod, J.O.; Schleich, B. Enabling Product Carbon Footprint Management in the Material Extrusion Process. Procedia CIRP 2024, 122, 31–36. [Google Scholar] [CrossRef]
  44. Yap, Y.F.; Yeong, W.Y. Machine Learning-Guided Three-Dimensional Printing of Tissue Engineering Scaffolds. Tissue Eng. Part A 2021, 27, 1168–1177. [Google Scholar] [CrossRef]
  45. Tatar, A.B. Predicting Three-Dimensional (3D) Printing Product Quality with Machine Learning-Based Regression Methods. Fırat Üniversitesi Deneysel ve Hesaplamalı Mühendislik Dergisi 2025, 4, 206–225. [Google Scholar] [CrossRef]
  46. Rooney, K.; Dong, Y.; Basak, A.K.; Pramanik, A. Prediction of Mechanical Properties of 3D Printed Particle-Reinforced Resin Composites. J. Compos. Sci. 2024, 8, 416. [Google Scholar] [CrossRef]
  47. Sood, A.K.; Ohdar, R.K.; Mahapatra, S.S. Experimental investigation and empirical modelling of FDM process for compressive strength improvement. J. Adv. Res. 2012, 3, 81–90. [Google Scholar] [CrossRef]
  48. Murphy, C.; Meisel, N.; Simpson, T.W.; McComb, C. Predicting Part Mass, Required Support Material, and Build Time via Autoencoded Voxel Patterns. Preprints 2018. Available online: https://www.researchgate.net/publication/326159629_Predicting_Part_Mass_Required_Support_Material_and_Build_Time_via_Autoencoded_Voxel_Patterns (accessed on 28 February 2025).
  49. El youbi El idrissi, M.A.; Laaouina, L.; Jeghal, A.; Tairi, H.; Zaki, M. Energy consumption prediction for fused deposition modelling 3D printing using machine learning. Appl. Syst. Innov. 2022, 5, 86. [Google Scholar] [CrossRef]
  50. Junwen, C.; Gang, Z.; Hua, Z. Energy Consumption Prediction of Fused Deposition 3D Printer Based on Improved Regularized BP Neural Network. IOP Conf. Ser. Earth Environ. Sci. 2019, 295, 032001. [Google Scholar] [CrossRef]
  51. Kiran, R. The Importance of Data Quality and Quantity in Training Neural Networks. Artif. Intell. Rev. 2021, 55, 167–182. [Google Scholar] [CrossRef]
  52. Hasebe, T.; Katayama, E.; Yoshiteru, K. Deep CAD Shape Recognition for Carbon Footprint Estimation at the Design Stage. Procedia CIRP 2024, 122, 545–550. [Google Scholar] [CrossRef]
  53. ISO/ASTM 52900:2021; Additive Fertigung—Grundlagen—Terminologie. Deutsches Institut für Normung e.V.: Berlin, Germany, 2022.
  54. Khan, S.; Joshi, K.; Deshmukh, S. A comprehensive review on effect of printing parameters on mechanical properties of FDM printed parts. Mater. Today Proc. 2022, 50, 2119–2127. [Google Scholar] [CrossRef]
  55. Solomon, I.J.; Sevvel, P.; Gunasekaran, J. A review on the various processing parameters in FDM. Mater. Today Proc. 2021, 37, 509–514. [Google Scholar] [CrossRef]
  56. Mangla, S.K.; Kazancoglu, Y.; Sezer, M.D.; Top, N.; Sahin, I. Optimizing fused deposition modelling parameters based on the design for additive manufacturing to enhance product sustainability. Comput. Ind. 2022, 145, 103833. [Google Scholar] [CrossRef]
  57. Gao, G.; Xu, F.; Xu, J.; Tang, G.; Liu, Z. A Survey of the Influence of Process Parameters on Mechanical Properties of Fused Deposition Modeling Parts. Micromachines 2022, 13, 553. [Google Scholar] [CrossRef]
  58. Camposeco-Negrete, C. Optimization of printing parameters in fused deposition modeling for improving part quality and process sustainability. Int. J. Adv. Manuf. Technol. 2020, 108, 2131–2147. [Google Scholar] [CrossRef]
  59. IPCC. 2006 IPCC Guidelines for National Greenhouse Gas Inventories; Institute for Global Environmental Strategies (IGES): Kanagawa, Japan, 2006. [Google Scholar]
  60. Yang, H.; Ding, H. Carbon Emission Model Analysis of FDM Molding Process. IOSR J. Mech. Civ. Eng. (IOSR-JMCE) 2023, 20, 30–38. [Google Scholar] [CrossRef]
  61. Icha, P.; Lauf, T. Entwicklung der Spezifischen Treibhausgas-Emissionen des Deutschen Strommix in den Jahren 1990–2023; Umweltbundesamt: Dessau-Roßlau, Germany, 2024. [Google Scholar]
  62. Ecoinvent. Ecoinvent Database v3.9. 2024. Available online: https://www.ecoinvent.org (accessed on 28 February 2025).
  63. Razali, N.M.; Wah, Y.B. Power comparisons of shapiro-wilk, kolmogorov-smirnov, lilliefors and anderson-darling tests. J. Stat. Model. Anal. 2011, 2, 21–33. [Google Scholar]
  64. St, L.; Wold, S. Analysis of variance (ANOVA). Chemom. Intell. Lab. Syst. 1989, 6, 259–272. [Google Scholar]
  65. McKight, P.E.; Najab, J. Kruskal-wallis test. In The Corsini Encyclopedia of Psychology; Wiley: Hoboken, NJ, USA, 2010; p. 1. [Google Scholar]
  66. Cortes, C.; Vapnik, V. Support-Vector Networks. Mach. Learn. 1995, 20, 273–297. [Google Scholar] [CrossRef]
  67. Huang, X.; Khetan, A.; Cvitkovic, M.; Karnin, Z. Tabtransformer: Tabular data modeling using contextual embeddings. arXiv 2020, arXiv:2012.06678. [Google Scholar] [CrossRef]
  68. Chen, T.; Guestrin, C. XGBoost: A Scalable Tree Boosting System. In Proceedings of the 22nd ACM SIGKDD International Conference on Knowledge Discovery and Data Mining, San Francisco, CA, USA, 13–17 August 2016; pp. 785–794. [Google Scholar] [CrossRef]
  69. Segal, M.R. Machine Learning Benchmarks and Random Forest Regression; Technical Report; Center for Bioinformatics and Molecular Biostatistics, University of California: San Francisco, CA, USA, 2004. [Google Scholar]
  70. Williams, C.K.I.; Rasmussen, C.E. Gaussian Processes for Regression. In Advances in Neural Information Processing Systems 8; Touretzky, D.S., Mozer, M.C., Hasselmo, M.E., Eds.; MIT Press: Cambridge, MA, USA, 1996; pp. 514–520. Available online: https://papers.nips.cc/paper/1995/file/7cce53cf90577442771720a370c3c723-Paper.pdf (accessed on 4 April 2025).
  71. Akiba, T.; Sano, S.; Yanase, T.; Ohta, T.; Koyama, M. Optuna: A next-generation hyperparameter optimization framework. In Proceedings of the 25th ACM SIGKDD International Conference on Knowledge Discovery & Data Mining, Anchorage, AK, USA, 4–8 August 2019; pp. 2623–2631. [Google Scholar]
  72. Wong, T.T.; Yeh, P.Y. Reliable accuracy estimates from k-fold cross validation. IEEE Trans. Knowl. Data Eng. 2019, 32, 1586–1594. [Google Scholar] [CrossRef]
  73. Parsa, A.B.; Movahedi, A.; Taghipour, H.; Derrible, S.; Mohammadian, A.K. Toward safer highways, application of XGBoost and SHAP for real-time accident detection and feature analysis. Accid. Anal. Prev. 2020, 136, 105405. [Google Scholar] [CrossRef]
Figure 1. Workflow of the Methodology.
Sustainability 17 03804 g001
Figure 2. Side view of all samples, highlighting extrusion defects on specimens using N01 (non-rectangular outer contour/curvature (blue) and irregularities in the print image (red)).
Sustainability 17 03804 g002
Figure 3. Correlation matrix for tensile strength.
Sustainability 17 03804 g003
Figure 4. Correlation matrix for volume deviations.
Sustainability 17 03804 g004
Figure 5. Feature importance plot for the XGBoost model based on gain.
Sustainability 17 03804 g005
Figure 6. SHAP decision plot illustrating the contribution of individual features to the model output for XGBoost.
Sustainability 17 03804 g006
Figure 7. SHAP summary plot showing the distribution of SHAP values for each feature in the XGBoost model.
Sustainability 17 03804 g007
Table 1. Overview of studies on the topic of printing parameter influences of a FDM printer on various parameters (CO2 footprint, energy and material consumption, and quality).
Experimental SettingsAnalysisInvestigated Influences on… (Yes/No; If Yes: What Is the Influence?)Source
MaterialSample
Size
Variable Printing
Parameters
Parameter
Links
CO2 FootprintEnergy
Consumption
Material
Consumption
Quality Regarding…
PLA27Extrusion temperature;
Layer height;
Shell thickness;
yesTensile strength:
pos. correlation
with temperature;
[41]
PLA329Infill density;
Raster orientation;
Nozzle temperature;
yesTensile strength:
pos. correlation with
infill density and temperature
neg. with raster orientation
[40]
PLA128Infill density;
Raster orientation;
Nozzle temperature;
yesElastic modulus: pos. correlation
with infill density and temperature,
neg. with raster orientation
Infill density greatest effect;
[39]
PLALayer thickness;
Print speed;
Infill density;
Build orientation;
yesGreater layer thickness
reduces energy
consumption
Surface roughness:
Greater layer thickness
reduces surface quality;
Mechanical strength
[12]
PLA27Infill density;
Infill pattern;
Layer thickness;
Print speed;
Shell thickness;
yesInfill density, print speed,
and layer thickness are
significant for
energy consumption
Higher infill densities
lead to higher
material consumption
Dimensional accuracy;
Hardness
[13]
Hot-bed temperature;
Nozzle temperature;
Layer thickness;
Printing speed;
Higher CO2:
Higher temperature;
Lower CO2:
Higher layer thickness
and speed;
Nozzle temperature
insignificant
Manufacturing
quality:
Only qualitative
investigations
[14]
27Layer thickness;
Orientation;
Raster angle;
Raster width;
Air gap;
yesDimensional accuracy:
For length: layer thickness,
orientation and raster
angle are significant;
For width and thickness:
Layer thickness is
most significant
[15]
Table 2. Overview of literature on the topic AI algorithms for prediction of quality metrics in AM and their performance.
Experimental SettingsPrediction with AIPerformance of AI AlgorithmAdditional AnalysisSource
Input ParametersSample SizeAI AlgorithmPrediction of… R 2 Prediction ErrorRSMEEVSFIA/SHAP
1202 ML approaches;
based on random forest
Part quality[44]
Infill density,
Nozzle temperature,
Nozzle diameter,
Layer thickness,
Raster orientation,
Printing speed
128TabNetElastic modulus0.968510%0.193[39]
Printing direction120Various ML algorithms;
KNN as most efficient
Elastic modulus0.955.2[46]
32ANNCompressive strength0.99771.2%[47]
Infill density,
Nozzle temperature,
Nozzle diameter,
Layer thickness,
Raster orientation,
Printing speed
32919 ML algorithms;
CatBoost as most efficient
Tensile strength0.944610%1.803[40]
Extrusion temperature,
Layer height,
Shell thickness
275 ML algorithms;
XGBoost as most efficient
Tensile strength0.97[41]
Layer height,
Wall thickness,
Infill density,
Infill pattern,
Nozzle temperature,
Bed temperature,
Print speed,
Fan speed
120Various ML algorithms;
GPR as most efficient
Roughness,
Tensile strength,
Elongation
1
0.9
0.98
1.354
2.833
0.104
[45]
Layer thickness27ANNDimensional accuracy0.12%[15]
Table 3. Overview of literature on the topic of AI algorithms for prediction of energy or mass consumption in AM and their performance.
Experimental SettingsPrediction with AIPerformance of AI AlgorithmAdditional
Analysis
Source
Input ParametersSample
Size
AI-AlgorithmPrediction of… R 2 Prediction
Error
RSMEEVSFIA /SHAP
Orientation7104DL algorithmPart mass,
Support material mass,
Build time
0.468
0.301
0.225
---[48]
DL algorithm
with PSO
Energy consumption[11]
Orientation18412 ML algorithms;
GPR as most efficient
Energy consumption>0.99<5.80.99[49]
Layer thickness,
Printing speed,
Head temperature,
Bed temperature
27Improved regularized
BP NNs;
Standard BP NN
Energy consumption

1–2%;

10–16%


[50]
Table 4. Selected parameter levels.
LevelLayer Height (L)Infill Density (I)Perimeters (P)Nozzle Temp. (N)
010.16 mm15%2190 °C
020.22 mm57.5%4205 °C
030.28 mm100%6220 °C
Table 5. Overview of devices and their accuracy specifications.
DeviceManufacturerModel NameError
Smart PlugTP-LinkTapo P110±0.05 W
Precision ScaleFousenukFousenuk Precision Scale±0.01 g
Tensile Strength Testing MachineRoell + KorthausUnknown1%
Table 6. ANOVA results for energy consumption with partial η 2 values.
ParameterSum of SquaresdfF-Valuep-ValuePartial η 2
Layer Height0.00042314.24 2.65 × 10 28 0.250
Fill Density0.00062511.88 4.24 × 10 33 0.352
Wall Count0.0001275.36 1.55 × 10 15 0.074
Nozzle Temperature0.000023.070.0560.003
Table 7. Kruskal–Wallis results for material consumption.
ParameterH-Statisticp-Value
Layer Height1.930.382
Fill Density69.05 1.01 × 10 15
Wall Count3.570.168
Nozzle Temperature0.340.843
Table 8. Kruskal–Wallis results for CO2 emissions.
ParameterH-Statisticp-Value
Layer Height3.560.169
Fill Density69.13 9.73 × 10 16
Wall Count4.600.100
Nozzle Temperature0.130.937
Table 9. Tensile strength values of the analyzed specimens.
Test No.Experiment No.LIPNTensile Strength [MPa]
110101010116.67
2140102020219.03
3270103030325.57
4330201020315.18
5430202030118.89
6470203010224.25
7620301030213.18
8660302010317.88
9760303020221.87
Table 10. Measured volumes and deviations from the reference volume for various parameter combinations.
Test No.Exp. No.LIPNVolume [mm3]Deviation [%]
11010101017781.722−0.38
25010102027762.317−0.63
39010103037796.831−0.18
437020201017730.939−1.03
541020202027780.962−0.39
645020203037743.460−0.87
773030301017762.873−0.62
877030302027748.044−0.81
980030303027750.204−0.78
Reference-----7811.2470.00
Table 11. Comparison of model performance metrics, highlighting the values of the best performing algorithm.
ModelRMSEMAE R 2
SVM1.02950.89020.9514
TabTransformer1.10860.84520.9606
XGBoost0.48160.38020.9922
Random Forest1.43331.21310.9311
Gaussian Process Regressor1.56401.13810.9173
Table 12. Top 5 Instances with largest absolute error (4 decimals).
IndexLIPNy_truey_predabs_error
10101010131.056332.14321.0869
140302020339.864538.80581.0587
50201010229.624930.12600.5011
130201030334.916534.42880.4877
150203010143.354543.83320.4787
Disclaimer/Publisher’s Note: The statements, opinions and data contained in all publications are solely those of the individual author(s) and contributor(s) and not of MDPI and/or the editor(s). MDPI and/or the editor(s) disclaim responsibility for any injury to people or property resulting from any ideas, methods, instructions or products referred to in the content.

