Abstract
Against the backdrop of the global digital wave and the “dual carbon” goals, the coordinated development of new-quality productivity and digital transformation has emerged as a critical engine for high-quality economic growth. This study constructs an evaluation system for new-quality productivity incorporating 20 indicators, including green innovation and digital infrastructure, and a 17-indicator system for digital transformation. Using the entropy method, modified coupling coordination model, and Dagum Gini coefficient, the spatiotemporal coupling characteristics of 31 provinces in China from 2011 to 2023 are systematically analyzed. The findings reveal a gradient distribution of coupling coordination degree, with higher levels in the East and lower in the West. The Eastern region forms a “technology-ecology” dual-driven model through digital innovation and environmental protection investment, while Central and Western regions face dual constraints of lagging digital infrastructure and insufficient pollution control capacity. Difference decomposition shows that inter-regional disparities contribute 64–70% to overall differences, with green technology innovation and digital infrastructure efficiency identified as core influencing factors. This study proposes a differentiated coordination mechanism of “eastern leadership-central rise-western revitalization”, aiming to promote a sustainable development pattern integrating digital empowerment and ecological protection through improving cross-regional digital infrastructure networks, innovating market-based factor allocation, and establishing green technology sharing platforms.
1. Introduction
In the current wave of global economic competition and rapid technological development, the transformation of productivity is becoming a key factor in promoting high-quality economic development. Since General Secretary Xi Jinping put forward the concept of “New-Quality Productivity” during his local inspection, this concept has attracted widespread attention [1]. In subsequent meetings, General Secretary Xi Jinping has also repeatedly emphasized the need to accelerate the development of new-quality productivity to promote high-quality development [2]. New-quality productivity emerges as a brand-new concept that transcends the category of traditional productivity. It embodies the core driving role of scientific and technological innovation in the development of productivity and represents a leap in productive capacity that is more innovative in essence, yields higher quality and efficiency, and is more in line with the development direction of the modern economy [3]. Looking into the future, new-quality productivity is a kind of high-level, leapfrog, revolutionary, and highly intelligent productivity that meets the requirements of Chinese high-quality development. In the emerging industry revolution, with the strategic window period of “curve overtaking” in China, accelerating the formation of new productivity supports the development of development initiatives [4,5,6]. At the same time, digital transformation sweeps through various industrial fields with great momentum, reshaping the entire process of economic activities such as production, distribution, exchange, and consumption [7]. Against the backdrop of profound adjustments in the global economic landscape and the convergence of a new wave of technological revolution, digital transformation has emerged as a pivotal force in restructuring the productivity system. The report of the 20th National Congress of the Communist Party of China explicitly emphasizes “accelerating the development of the digital economy and fostering deep integration between the digital and real economies”, signifying China’s comprehensive transition from a factor-driven to an innovation-driven growth paradigm. This strategic shift highlights the critical role of digitalization in advancing sustainable development, optimizing resource allocation, and enhancing systemic efficiency across industries. Current research underscores that digital infrastructure not only catalyzes technological innovation and industrial upgrading but also reinforces the coupling mechanisms between green transitions and productivity gains. Future policies should prioritize bridging regional disparities in digital capabilities, strengthening institutional synergies, and cultivating cross-sectoral collaboration to ensure inclusive and sustainable progress in the new-quality productive forces.
However, current academic research on the coupling coordination status and interaction mechanisms between new-quality productivity and digital transformation remains in its nascent stage. Previous research has made notable achievements in the theories of productivity development and the impacts of the digital economy. Some scholars have explored the laws of productivity development from a macroeconomic perspective, emphasizing the importance of technological innovation and factor inputs in enhancing productivity. In the field of the digital economy, studies have also examined the effects of digital technologies on industrial restructuring and economic growth. However, these theories exhibit limitations when explaining the relationship between new-quality productivity and digital transformation across Chinese provinces. On the one hand, prior research has predominantly focused on the impact of single factors on productivity or the digital economy, failing to fully account for the role of regional disparities in the coupling coordination process between new-quality productivity and digital transformation. Given China’s vast territory, provinces differ significantly in resource endowments, economic foundations, and policy environments—factors that inevitably influence their synergistic development. On the other hand, existing theories have not deeply explored the complex coupling coordination mechanisms between new-quality productivity and digital transformation, making it difficult to comprehensively explain the internal logic and external manifestations of their interactions. This research gap starkly contrasts with the critical role both elements play in actual economic development, potentially hindering the full exploitation of their synergistic effects in policymaking and corporate strategic planning, thereby impeding progress toward high-quality economic growth. Against this backdrop, marked disparities in the development levels of new-quality productivity and the progress of digital transformation across different regions not only affect coordinated regional economic development but also complicate the coupling coordination relationships between the two. In this context, an in-depth investigation into their coupling coordination dynamics and influencing factors holds critical practical significance for optimizing resource allocation, narrowing regional disparities, and driving high-quality economic development. This motivates us to conduct this research, aiming to provide theoretical support and practical guidance for addressing real-world economic development challenges. In light of this, this study aims to address the existing research void by systematically investigating the coupling coordination relationship and interaction mechanisms between new-quality productivity and digital transformation. Through the construction of a scientifically robust evaluation index system and rigorous analytical models, this study will precisely measure their coupling coordination degree and further elucidate the intrinsic logic and external manifestations of their interactions. This study focuses on the practical contexts of Chinese provinces, aiming to delve deeply into the following key research questions: First, what are the spatiotemporal distribution characteristics of the coupling coordination degree between new-quality productivity and digital transformation? Second, what core factors influence their coupled and coordinated development? Third, how can effective strategies be constructed to promote their synergistic development and drive high-quality regional economic growth?
Building on prior theories and adapting to China’s specific context, this study introduces extensions and innovations. By constructing a multi-dimensional evaluation index system encompassing green innovation, digital infrastructure, and other key dimensions and employing methodologies such as the entropy method, improved coupling coordination model, and Dagum Gini coefficient, this research conducts an in-depth analysis of the coupling coordination characteristics, influencing factors, and regional disparities between new-quality productivity and digital transformation across Chinese provinces. The goal is to fill existing research gaps, provide a new perspective for understanding their dynamic relationship, and offer a scientific basis for governments to formulate regional coordinated development policies and for enterprises to devise strategic decisions.
2. Literature Review
2.1. Research on the Connotation of New-Quality Productivity and the Measurement of Its Development Level
New-quality productive forces (NQPF), recognized as a pivotal driver of high-quality economic development, have attracted substantial scholarly attention in recent years. A precise understanding of their conceptual dimensions, accurate measurement of developmental levels, and clarification of their mechanisms are crucial for formulating evidence-based economic policies and corporate strategies. Scholars have extensively explored the conceptual framework of NQPF. Shao et al. (2024) emphasize that NQPF should be anchored in three dimensions—innovation, sustainability, and productivity—providing a foundational framework for its conceptualization. They further applied the entropy weight-TOPSIS method to analyze data from 30 Chinese provinces (2011–2021), measuring the developmental trajectory of NQPF [8]. Li and Liu (2024) expanded this perspective by integrating scientific and technological innovation, industrial upgrading, and factor transformation, offering a more comprehensive interpretation of NQPF’s essence. Their evaluation of 31 Chinese provinces (2013–2022) using entropy weighting combined with multi-period weights revealed persistent regional disparities in NQPF development, despite an overall upward trend. Notably, Eastern China exhibited higher development levels, with regional gaps gradually narrowing [9]. Regarding impact mechanisms, NQPF significantly influences industrial restructuring. Shao et al. (2024) demonstrated that NQPF negatively correlates with industrial rationalization but positively drives industrial upgrading. Environmental regulation acts as a moderator, suppressing rationalization while enhancing upgrading effects. Yao et al. (2025) highlighted the role of digital infrastructure in accelerating NQPF. Through static panel modeling and an empirical analysis of data from 276 Chinese cities (2011–2020), they found that digital infrastructure robustly promotes NQPF, with heterogeneous effects observed across cities of varying scales, administrative hierarchies, and geographic locations [10]. At the theoretical level, Gang and Hongrui (2025) explored the connotation of new-quality productivity and measured its development level. Their research offers valuable perspectives on understanding and assessing the development of new-quality productivity [11]. Conversely, Li et al. (2024) revealed that NQPF and green innovation synergistically improve corporate ESG performance. Green innovation not only directly elevates ESG outcomes but also amplifies the positive impact of NQPF, with variations observed across regions, enterprise types, and developmental stages [12].
In summary, existing research has established a robust foundation for understanding NQPF’s conceptualization, measurement, and mechanisms. However, future studies should prioritize sector-specific pathways, regional coordination strategies, and the interplay between NQPF and emerging economic paradigms to advance both theoretical frameworks and practical applications for sustainable development.
2.2. Research on Drivers and Impacts of Digital Transformation
In the contemporary digital era, digital transformation has emerged as a central theme across global industries, reshaping organizational operations and exerting profound impacts on socioeconomic development. A systematic examination of its driving factors and multifaceted effects is critical for understanding evolving trends and formulating evidence-based strategies. Technological innovation stands as a primary catalyst. Criveanu (2023) highlights that advancements in digital technologies, particularly e-commerce, have triggered transformative shifts in economies and societies, with their prominence during the pandemic significantly contributing to economic growth [13]. Emerging technologies such as artificial intelligence and big data further provide robust technical foundations for corporate digital transformation [14]. Safa et al. (2023) emphasize that the integration of cloud computing and IoT accelerates this process, enabling enterprises to enhance operational efficiency through advanced data processing and analytics [15]. Li Chong et al. (2023), through research on the text mining data of A-share listed companies, found that in the manufacturing industry, technological innovation is not only a key driving force for digital transformation but also plays an important role in the measurement and disequilibrium of the transformation. Their research further confirms the core position of technological innovation in the process of digital transformation from the micro-enterprise level, providing an empirical basis for understanding the specific paths and differences of enterprises’ digital transformation [16]. Verhoef et al. (2021), in their comprehensive exploration within the Journal of Business Research, present a multidisciplinary reflection and establish a research agenda. Their study highlights the intricate dynamics of digital transformation, offering essential understandings of its driving forces and implications [17]. Matt (2015) underscores that digital transformation is indispensable for maintaining competitive advantage in rapidly evolving markets [18]. Evolving customer demands also propel organizational digitalization. Daradkeh et al. (2023) illustrate this through the fast-food industry, where digital transformation redefines customer–restaurant interactions. To meet rising expectations for personalization and convenience, firms must enhance digital capabilities, leveraging platforms and AI-driven feedback analysis to deliver superior customer value [19]. Economic growth benefits substantially from digital transformation. Criveanu (2023) identifies a positive correlation between digital transition, e-commerce adoption, and GDP growth in EU countries, underscoring its role in sustainable economic development [13]. Concurrently, emerging digital industries inject new momentum into economic systems. Li et al. (2025), in their study on the valuation of financial data using analyst forecasts as an example, reveal the significance and unique value of financial data in the digital economic context. This finding is of critical importance for understanding transformations in the financial sector during digital transformation and how financial data drive corporate decision making and industrial development, providing new directions for research on the integration of digital transformation and the financial domain [20].
Corporate-level transformations are multifaceted. Zhang and Zhang (2025) argue that digital governance innovations facilitate smart management and internal value chain optimization, enhancing production efficiency [14]. Li et al. (2022) show that the digital economy drives enterprise digital transformation, shedding light on the drivers of digital transformation on corporate innovative capabilities [21]. Li et al. (2025) pointed out in their study that peer effects have a significant impact on reshaping China’s digital value chain. This finding provides a new perspective for understanding interfirm interactions in the process of digital transformation, indicating that when enterprises undergo digital transformation, they are not only influenced by their own technologies and strategies but also by the catalytic and demonstrative effects of peer enterprises. This further enriches the research on the influence mechanisms of digital transformation [22]. Societal implications are equally profound. Macroscopically, digital transformation narrows regional and interorganizational digital divides, fostering synergies between industrial digitization and digital industrialization. At the micro level, it revolutionizes lifestyles and consumption patterns, elevating societal efficiency and convenience [19]. In education, Mosterd et al. (2021) document how digitalization expands access to high-quality educational resources through online platforms [23]. Existing research elucidates the synergistic effects of technological, policy, and market drivers in advancing digital transformation, alongside its multidimensional impacts on economies and societies. Future studies should deepen insights into sector-specific barriers, equitable digital inclusion, and long-term sustainability outcomes to inform holistic policymaking and organizational strategies.
2.3. Research on Coupling Coordination Mechanisms
The study of coupling coordination relationships holds significant theoretical and practical value across disciplines, offering insights into the interactions and synergistic development mechanisms between systems or elements, thereby advancing sustainable development and optimized resource allocation. Dong et al. (2023) investigated the coupling coordination among environment, energy, and economic growth in China’s resource-based regions. By constructing a tri-system evaluation framework and applying entropy weighting with a coupling coordination degree model, they analyzed the spatiotemporal dynamics of 10 resource-intensive areas from 2011 to 2020, revealing systemic interdependencies and regional disparities [24]. Chang et al. (2024) evaluated urbanization quality and ecological resilience in 26 cities within the Yangtze River Delta urban agglomeration (2005–2020). Using coupling coordination models and panel Tobit regression, they identified temporal–spatial evolution patterns and key influencing factors, emphasizing the role of policy interventions in enhancing synergies [25]. At the enterprise level, Wu et al. (2024) assessed the coupling coordination between corporate ESG performance and financial outcomes using data from Chinese listed companies (2010–2022). Their findings indicate generally low coordination levels, classified as transitional, with higher performance observed in Eastern China, the Yangtze River Economic Belt, the Chengdu–Chongqing urban agglomeration, and foreign-funded enterprises. Larger, capital-intensive firms and those with stronger social responsibility commitments exhibited superior coordination [26]. Han et al. (2023) proposed an urban resilience system framework to measure subsystem interactions in the Chengdu–Chongqing urban agglomeration. Employing CRITIC-TOPSIS weighted evaluation and a modified coupling coordination method, they found most cities were in the running-in stage (break-in phase) with low coupling and bare coordination (marginal coordination), underscoring the need for integrated resilience strategies [27]. Wu et al. (2023) developed a novel socio-ecological coupling model to address challenges in balancing socioeconomic development and ecological conservation in watersheds. Within the Budyko framework, their analysis revealed spatial heterogeneity in coordination levels across basins, projecting moderate human-water relationship coordination by 2030 [28]. Collectively, these studies demonstrate the utility of coupling coordination models—such as entropy-weighted evaluation, Tobit regression, and CRITIC-TOPSIS—in unraveling spatiotemporal patterns, influencing factors, and developmental trends across diverse systems. They provide a robust foundation for understanding multi-system synergies and informing policies aimed at sustainable resource management, urban resilience, and corporate–environmental alignment. Future research should prioritize cross-sectoral coordination mechanisms, long-term dynamic monitoring, and context-specific policy frameworks to address persistent coordination gaps.
3. Materials and Methods
3.1. Construction of the Index System
3.1.1. Evaluation Index System of New-Quality Productivity
Combining the important expositions of General Secretary Xi Jinping and the actual situation of China’s current economic development, new-quality productivity takes the qualitative changes of laborers, means of labor, objects of labor, and their optimized combinations as its basic connotations. Drawing on the approach of Wang Jue and Wang Rongji [29], an index system for the development level of new-quality productivity is constructed, as shown in Table 1. The entropy method is used to determine the weights of indicators at all levels, and the development index of new-quality productivity for each province from 2011 to 2023 is calculated. All indicators are positive-oriented. Taking the A1 indicator as an example, per capita GDP, as a crucial indicator for measuring economic output, directly reflects the economic value created by workers over a specific period, embodying the economic contributions of laborers within new-type productive forces. The above 20 indicators construct an evaluation system for new-quality productivity from multiple dimensions, including laborers, objects of labor, and means of labor. Among them, indicators such as economic output and economic income reflect the economic contributions of laborers, indicators like informatization level and green ecology embody the characteristics of objects of labor, and indicators such as infrastructure and energy utilization potential measure the development degree of means of labor. Through the comprehensive consideration of these indicators, a comprehensive and accurate assessment of the development level of new-quality productivity can be achieved. All data on new-type productive forces are sourced from provincial annual statistical data and other records in the China Statistical Yearbook.

Table 1.
Evaluation index system of new-quality productivity.
3.1.2. Evaluation Index System for Digital Transformation
Digital transformation has become an inevitable choice for enterprises in the digital era [30], and it represents a “window of opportunity amid crisis” for China’s manufacturing industry in the post-pandemic era. This process is critical to China’s competitive strategy for building a “manufacturing powerhouse” under the economic paradigm shift and the high-quality development of its industries [31]. General Secretary Xi Jinping has emphasized the need to seize development trends such as digitization, develop new-quality productivity in a region-specific manner, and promote deep integration between the real economy and the digital economy. These directives provide an important strategic guide for digital transformation. In recent years, China has continuously improved its digital infrastructure, establishing mobile communication and optical fiber networks on a globally leading scale, which have laid a solid foundation for digital transformation. The vigorous development of digital industrialization has spawned numerous new industries, business formats, and models, driving the optimization and upgrading of industrial structures. In the field of industrial digitization, various industries in China have actively utilized digital technologies for comprehensive, full-chain transformation and empowerment, effectively enhancing production efficiency and quality outcomes. Taken together, digital transformation serves as the core proposition of the digital economy era. Its essence lies in the interactive and synergistic development of digital infrastructure, digital industrialization, and industrial digitization. This comprehensive manifestation not only aligns with the intrinsic requirements of China’s high-quality economic development but also represents a key strategy for seizing global digital economy leadership and fostering new development momentum and competitive advantages [32]. Therefore, this study constructs an evaluation index system for digital transformation from three dimensions: digital infrastructure, digital industrialization, and industrial digitization, comprising a total of 17 measurement indicators (see Table 2). All indicators are positive-oriented. Taking the B1 indicator as an example, a core indicator for measuring the availability and popularity of regional digital infrastructure, it directly influences the depth and breadth of digital transformation. These 17 indicators evaluate digital transformation from three dimensions: digital infrastructure, digital industrialization, and industrial digitalization. Indicators related to digital infrastructure, such as internet broadband access rate and the scale of mobile telephone facilities, reflect the foundational conditions for digital transformation. Digital industrialization indicators, including mobile phone penetration rate and the number of legal entities in information transmission, software, and information technology services, embody the development scale of digital industries. Industrial digitalization indicators, such as digital inclusive finance and e-commerce sales, measure the extent of digital transformation in traditional industries. All data related to new-type productive forces are sourced from provincial annual statistical data and other records in the China Statistical Yearbook.
Table 2.
Evaluation index system for digital transformation.
3.2. Method
3.2.1. Entropy Method
This study employs the entropy method to objectively assign weights to each indicator in the evaluation index system for new-quality productivity and digital transformation. The entropy method allocates weights based on the degree of actual differences among indicators, effectively eliminating interference from human factors [33]. Missing values in the sample data are filled using linear interpolation. The specific process is as follows:
- (1)
- Standardized processing of the original data:
- (2)
- Use the standardized data to calculate the proportion of the jth indicator in the ith year:
- (3)
- Calculate the information entropy of the indicator:
Among them, .
- (4)
- Calculate the indicator weight:
- (5)
- Calculate the comprehensive score:
The entropy method objectively assigns weights by measuring data variability through information entropy. First, standardized indicator values are converted to proportions (Formula (3)). Information entropy (Formula (4)) is then calculated to reflect data uniformity, where lower entropy indicates higher discriminative power. Indicator weights (Formula (5)) are derived by normalizing the inverse of entropy , ensuring weights sum to 1 and indicators with more dispersed data (lower entropy) carry greater importance. This data-driven approach avoids subjective bias, providing a robust framework for multi-dimensional evaluations in sustainability research.
For instance, suppose we have data [10, 20, 30] for three provinces on a certain indicator, and standardized processing is carried out according to Formula (1). For this positive indicator, first determine that the maximum value is 30 and the minimum value is 10. Take the data 10 of the first province as an example, where the standardized value is (10 − 10)/(30 − 10) × 100 = 0, the standardized value for the data 20 of the second province is (20 − 10)/(30 − 10) × 100 = 50, and the standardized value for the data 30 of the third province is (30 − 10)/(30 − 10) × 100 = 100. Subsequently, according to Formulas (3)–(6), calculate the proportion, information entropy, weight, and comprehensive score of this indicator in sequence, and apply the same logic to all indicators.
3.2.2. Coupling Coordination Degree Model
The traditional coupling coordination degree model has three prominent issues [34]. First, the connotation of coupling coordination degree in the model is unclear. The calculation method of coupling degree contains elements of coordination degree, essentially emphasizing coordination while weakening coupling. In social sciences, coupling degree generally reflects the degree of system deviation, yet the traditional model does not strictly follow this criterion. Second, the boundary value calculation of coupling degree is irrational. If any subsystem value is zero during the calculation, the final coupling degree becomes zero regardless of other systems, contradicting its definition. For example, C (1,1,1,0) and C (1,1,0,0) both yield zero coupling degrees despite differing deviation degrees, indicating no differentiation for boundary values in the traditional model. Third, the traditional model lacks discriminative power for coupling degrees. It fails to reflect differentiated development, resulting in high coupling degrees even with significant system value disparities, and has a bias toward normalized systems where all values equal 1.
However, coupling degree measures mutual dependencies and interactions between systems, integrating both “coordination” and “development” to reflect holistic synergy [35]. The coupling coordination model established in this paper is presented in Figure 1. Its indicators—“coupling degree” and “coordination degree”—respectively represent the intensity of mutual interactions (regardless of pros/cons) and the level of positive coupling in their interactions, reflecting the system’s transition from disorder to order [36]. The empirical approach of coupling comprehensively analyzes synergistic changes between variables using systems thinking, differing from traditional causal relationship analysis [37]. Given the validity biases in traditional models, scholars have proposed corrections that enhance validity in social science applications, making the calculated coordinated development degree more reasonably represent coupling coordination relationships and development levels [38].
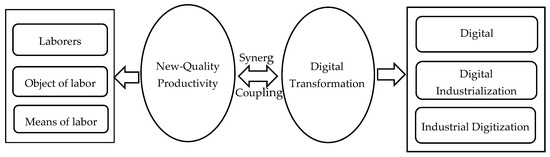
Figure 1.
The measurement logic between new-form productivity and digital transformation.
The traditional model has issues such as unclear connotation of coupling coordination degree, unreasonable calculation of boundary values, and lack of discriminative power. However, this model redefines the calculation methods of coupling degree and coordination degree, more clearly distinguishing the intensity of interactions between systems and the level of positive coupling. For example, when calculating the coupling degree, the traditional model does not strictly follow the criterion in social sciences that the coupling degree reflects system deviation. In contrast, Formula (7) of this model fully considers the degree of difference between the two subsystems and and it more accurately measures the coupling relationship between systems. In terms of coordination degree calculation, the weighting method of the traditional model is relatively simple and does not fully consider the differences in the importance of different subsystems. This study, based on the equal importance of new-quality productivity and digital transformation in the current economic development, reasonably sets α = β = 0.5, making the calculation results better reflect the actual situation.
When the comprehensive system has two subsystems, and , if is , then the expression of the modified binary coupling degree function can be obtained as follows:
Among them, and respectively, represent the comprehensive scores of new-quality productivity and digital transformation. The value of the coupling degree ranges between 0 and 1. When the coupling degree is closer to 1, it indicates that the development levels between the new-quality productivity and digital transformation in this province are closer, and resonant coupling is more likely. Generally speaking, the larger the value of , the higher the degree of coupling.
In order to accurately evaluate the overall development status of new-quality productivity and digital transformation, it is necessary to further calculate the coupling coordination degree between the two. The calculation formula of the coupling coordination degree is as follows:
Among them, T represents the comprehensive coordination index, with its calculation formula given by = + , where α and β denote the coefficients of U1 and U2, respectively. This study considers new-quality productivity and digital transformation to be of equivalent importance, thus taking = = 0.5.
The traditional grading table for coupling coordination degree generally classifies coupling coordination degrees into 10 levels [39], as detailed in Table 3. In this paper, “Coord. level” serves as the abbreviation for “Coordination level”, and “CCD” is short for “coupling coordination degree”.
Table 3.
Interval division of coupling coordination degree and development stages.
The traditional coupling coordination degree has the following issues [40]. First, its non-uniform distribution causes the use of traditional uniform grading tables to increase the probability of middle-grade assignments, leading to erroneous stability biases in dynamic analysis of coupling coordination grades. Second, as the number of subsystems increases, the probability of achieving high coupling coordination decreases—more subsystems make achieving high-level synergy increasingly difficult. Third, the distribution of coupling coordination degrees is right-skewed, with a higher likelihood of disharmony. However, this skewness diminishes with more subsystems, approaching a symmetric distribution with a mean below 0.5. When the number of subsystems becomes sufficiently large, probabilities of both high coordination and high disharmony decrease, causing coupling coordination degrees to cluster increasingly tightly.
To address these issues, this study proposes an equal-probability division method that maximizes discriminative power by dividing coupling coordination degrees into equal-proportion intervals (i.e., each 10% interval represents a grade). This article takes ABCDE as the five-level coordination code and GFHIJ as the five-level imbalance code. The 10-level standard of equal-probability division proposed in this study divides the coupling coordination degree into intervals with greater discrimination. For example, [0.631, 1] represents high-quality coordination (A), [0.534, 0.631) denotes good coordination (B), and so forth. Through this division, it can more accurately reflect the coordinated development stages of new-quality productivity and digital transformation in different regions, avoid the assignment bias in intermediate grades that traditional classification standards may generate, and better conform to the actual situation. The improved 10-grade coupling coordination degree grading table is presented in Table 4 [40].
Table 4.
The grading table of the 10-level coupling and coordination degree used in this article.
For the binary coupling coordination function, we assume that each coupling coordination degree system, U1 and U2, is uniformly distributed in the interval [0, 1] with equal weight coefficients for coordination degrees. Then, U1 and U2 take equally probable random points within the interval [0, 1], and the coupling coordination degree D is calculated. By dividing the results into 10 equal-probability segments, the interval values for each grade of coupling coordination degree can be obtained, as shown in Table 5.
Table 5.
The grading table of the 10-level binary coupling coordination degree used in this article.
3.2.3. Dagum Gini Coefficient Method
To analyze the spatial characteristics of coupling coordination degrees, this study classifies China’s 31 provinces into three major regions—Eastern, Central, and Western—and employs the Dagum Gini coefficient method to calculate differences in coupling coordination degrees at the national level, within the three regions, and between the three regions. The total difference is composed of contributions from intra-regional disparities, inter-regional disparities, and transvariational density [41]. This model can reflect internal differences within regions, differences between regions, and overlapping phenomena among regions, enabling the effective identification of the sources and issues of regional gaps. The specific calculations are as follows:
- (1)
- The overall Gini coefficient, regional Gini coefficients, and the contributions of intra-regional disparities are calculated:
- (2)
- The inter-regional Gini coefficient, contribution of inter-regional net disparities, and contribution of transvariational density are calculated:
Among them, represents the overall Gini coefficient, where a larger value indicates greater overall differences; denotes the contribution of intra-regional disparities; represents the contribution of inter-regional net disparities; and signifies the contribution of transvariational density [42].
3.2.4. Influence Degree Model
The influence degree model is a mature method used for identifying influencing factors in evaluation systems based on criterion layer and indicator layer weights after comprehensive evaluation. In this study, the influence degree model is introduced into the coupling coordination of new-quality productivity and digital transformation to explore key influencing factors and propose targeted measures, thereby enhancing the coordinated development level of the two systems. The specific formula is as follows:
Among them, Oi denotes the influence degree, reflecting the influence degree of the indicator layer on the system layer; Ij represents the indicator deviation degree, i.e., the gap between the actual value and the system development target value; Wj signifies the corresponding contribution degree [43].
3.2.5. Addressing Potential Biases
In this study, several potential biases may exist. Regarding sample selection, due to data availability, the research only incorporates data from 31 provinces in China (excluding Hong Kong, Macao, and Taiwan), which may not fully represent the overall situation in China—especially insufficiently reflecting the situations of some special regions or industries. Concerning measurement errors, the measurement of some indicators may contain inaccuracies. For instance, when measuring green innovation, the number of patent applications may not fully and accurately reflect the actual level of green innovation, as it fails to account for variations in patent quality and unpatented green innovation achievements that are not included in statistical records.
3.3. Data Source
Based on data availability, this study selects panel data from China’s 31 provinces (excluding Hong Kong, Macao, and Taiwan) from 2011 to 2023 as the research sample. Relevant data are primarily sourced from the China Statistical Yearbook, China Energy Statistical Yearbook, and provincial statistical yearbooks. Missing data are filled using interpolation methods. Data on control variables and instrumental variables are calculated from data obtained by the National Bureau of Statistics.
4. Results
China’s 31 provinces are divided into three major regions: Eastern, Central, and Western. The Eastern region includes Beijing, Tianjin, Hebei, Liaoning, Shanghai, Jiangsu, Zhejiang, Fujian, Shandong, Guangdong, and Hainan, characterized by high economic development levels, advanced industrial structures, favorable geographical locations with numerous coastal ports, and well-developed infrastructure in transportation and telecommunications. The Central region comprises Shanxi, Jilin, Heilongjiang, Anhui, Jiangxi, Henan, Hubei, and Hunan, located at the transitional zone between the East and West. It serves as a key agricultural production area with established industrial bases and significant potential for undertaking industrial transfers. The Western region covers Inner Mongolia, Guangxi, Chongqing, Sichuan, Guizhou, Yunnan, Tibet, Shaanxi, Gansu, Qinghai, Ningxia, and Xinjiang. Although economically less developed with complex geographical and natural conditions, this region is rich in natural resources and strategically prioritized for national development, experiencing gradual growth under the Western Development Strategy.
4.1. Analysis of the Measurement Results of New-Quality Productivity and Digital Transformation
4.1.1. New-Quality Productivity
As shown in Figure 2, from 2011 to 2023, the new-quality productivity levels of China, the Eastern, Central, and Western regions generally showed an upward trend. The Eastern region has maintained its leading position through continuous innovation-driven growth supported by technological advancements and policy advantages. The Central region has steadily caught up via industrial upgrading, while the Western region has achieved rapid growth in the ecological economy and clean energy sectors. Inter-regional disparities have gradually narrowed, with the national average demonstrating sustained improvement, reflecting the synergistic effects of policy guidance and differentiated development paths.
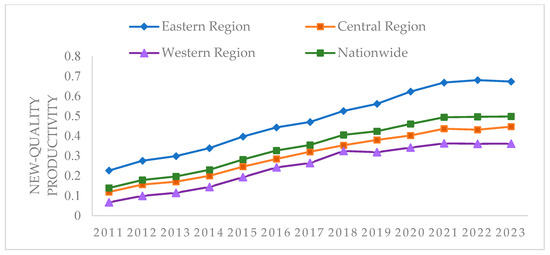
Figure 2.
New-quality productivity of the whole country and the three major regions from 2011 to 2023.
4.1.2. Digital Transformation
The changing trends of digital transformation levels in China and its three major regions (Eastern, Central, and Western) from 2011 to 2023 are presented in Figure 3. The chart demonstrates that the digital transformation index of the Eastern region remained at a high level overall, followed by the Central region, with the Western region relatively lower. However, all three regions showed a gradual upward trend, and the inter-regional gaps narrowed progressively over time. The national overall level closely followed the Eastern region’s trajectory, indicating that the digital transformation process is significantly influenced by regional economic foundations and policy resource allocation. Through hierarchical labeling and time-series comparisons, the analysis systematically reflects the characteristics of regional differentiated development and coordinated promotion under the Digital China Initiative.
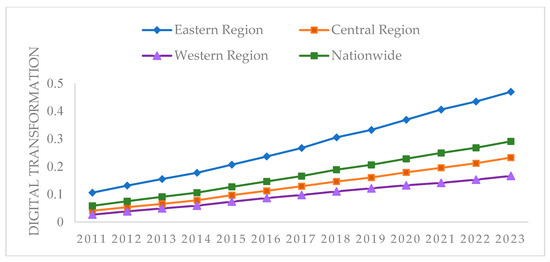
Figure 3.
The digital transformation levels of the three major regions across the country from 2011 to 2023.
4.2. Spatiotemporal Evolution Characteristics of the Coupling and Coordination Between New-Quality Productivity and Digital Transformation
4.2.1. Characteristics of Temporal Sequence Evolution
Temporal Evolution Analysis mainly compares and analyzes the changing trends of the coupling coordination degree between new-quality productivity and digital transformation from a time dimension. Using the coupling coordination degree model, this study calculates the coupling coordination degree of new-quality productivity and digital transformation from 2011 to 2023, with the specific results presented in Table 6. This article takes ABCDE as the five-level coordination code and GFHIJ as the five-level imbalance code.
Table 6.
The coupling and coordination degree between new-quality productivity and digital Transformation in 31 provinces from 2011 to 2023.
The coupling and coordination relationship between new-quality productivity and digital transformation is a critical dimension for measuring high-quality regional economic development. Based on the binary coupling coordination degree model, this study constructs a 10-grade classification standard, dividing coordination degrees into three stages, “disharmony-transition-coordination”, and further elaborates into five development phases: recession, acceptable disharmony, transition, development, and advanced development. This research reveals the following patterns:
First, the national coupling coordination degree demonstrates stepwise leaps with structural optimization in development stages. The national average increased from 0.236 (severe disharmony) in 2011 to 0.549 (good coordination) in 2023, with an average annual growth rate of 6.3%. This trend indicates progressively strengthening synergies between digital transformation and new-quality productivity. At the stage level, the coordination pattern shifted from “disharmony-dominated” to “coordination-dominated”: in 2011, 29 provinces (93.5%) were in disharmony stages, while by 2023, only six provinces, such as Tibet (0.331) and Qinghai (0.342), remained in severe or moderate disharmony. Meanwhile, 15 provinces, including Guangdong (1.000) and Jiangsu (0.860), achieved high-quality coordination, confirming deepening “technology-industry” dual-helix driving effects.
Second, regional coordination degrees exhibit significant gradient differences, characterized by Eastern leadership and Western lag. The Eastern region averaged 0.697 in 2023, reaching high-quality coordination, with Guangdong (1.000) and Shanghai (0.732) leading due to their sound digital transformation infrastructure and clustering of new-quality productivity factors forming positive feedback. Conversely, the Western region averaged only 0.437 in 2023, still in the primary coordination stage—provinces like Tibet (0.331) and Ningxia (0.382) remained below the 0.35 threshold for years due to lagging digital infrastructure and slow industrial transformation. The Central region (average 0.514) and core Western provinces such as Sichuan (0.619) and Chongqing (0.519) achieved leaps from near-disharmony to intermediate/good coordination through “digital embedding + industrial chain upgrading”, highlighting polarization and diffusion effects in unbalanced regional development. However, it is also argued that regional disparities are not absolutely fixed. From a dynamic development perspective, there may be instances where the coupled and coordinated development of new-quality productivity and digital transformation in Central and Western regions outperforms that in Eastern regions within specific fields or timeframes. For example, in emerging digital industries, some cities in Central and Western regions have achieved rapid growth by leveraging unique resource advantages and policy support. Guizhou Province, for instance, relying on abundant energy resources and the policy benefits of the National Big Data Comprehensive Pilot Zone, has made significant progress in big data storage and processing, demonstrating strong momentum in the synergistic development of digital transformation and new-quality productivity. The growth rate of its coupling coordination degree in these specific areas has even exceeded that of some Eastern cities. Additionally, some scholars propose that regional disparities may narrow due to short-term policy fluctuations or exceptional events. During the implementation of major national strategies—such as the continuous advancement of the “Western Development” strategy—substantial resources are redirected to Western regions, providing increased support for digital infrastructure construction and industrial upgrading. Such policy-driven interventions may lead to short-term changes in regional gaps, enabling provinces in Western regions with originally lower coupling coordination degrees to achieve rapid improvements.
Third, dynamic evolution paths reveal critical policy intervention nodes. Take Guangdong as an example: its coordination degree advanced from 0.462 (primary coordination) in 2011 to 1.000 (high-quality coordination) in 2023, leap four grades, primarily due to deep integration of digital technology innovation (e.g., 5G base station coverage > 90%) and advanced manufacturing clusters (e.g., the Guangdong–Hong Kong–Macao Greater Bay Area electronics industry belt). Meanwhile, provinces like Gansu (0.371) and Guizhou (0.403) improved their disharmony grades (e.g., Gansu moving from severe to moderate disharmony) but had significantly lower growth rates (4.1% annually) compared to the East (8.7%), indicating that Central and Western regions need to break through the “low-level equilibrium trap” via intensified synergy supply of digital infrastructure investment and institutional innovation.
4.2.2. Spatial Evolution Trend
The coupling coordination degree between new-quality productivity and digital transformation exhibits significant regional disparities. To visually characterize the spatial distribution of this coupling coordination, ArcGIS 10.8 was employed to map the spatial patterns across China’s 31 provinces for the years 2011, 2015, 2019, and 2023 (see Figure 4), thereby revealing its spatial heterogeneity.
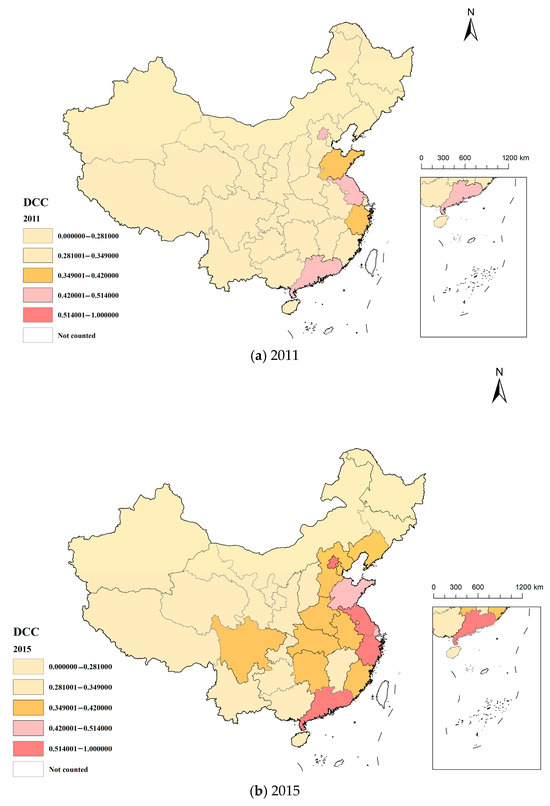
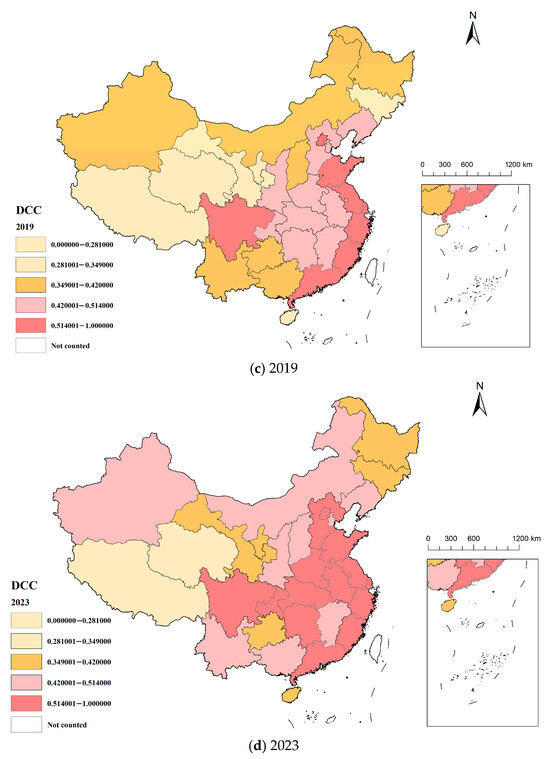
Figure 4.
Spatial distribution of the coupling and coordination degree between new-quality productivity and digital transformation in 31 provinces of China.
The coupling coordination relationship demonstrates pronounced spatial differentiation and dynamic evolution. The study reveals a gradient disparity characterized by an “east-high-west-low” pattern. Eastern coastal regions, leveraging advantages in digital innovation and factor agglomeration, formed a high-value cluster centered on the Yangtze River Delta (YRD), with a mean coordination degree of 0.697 in 2023, nearing optimal coordination. In contrast, Western regions, constrained by lagging digital infrastructure and insufficient institutional support, registered a mean coordination degree of only 0.437, with provinces like Tibet (0.331) and Qinghai (0.342) remaining in low-coordination zones. The maximum regional disparity expanded to 0.6684, underscoring imbalances stemming from inadequate synergy among technology, institutions, and factor mobility.
Temporal–spatial analysis further identifies a dual pattern of “core-periphery diffusion” and localized leapfrogging. In 2011, high-value zones were concentrated in Eastern China. By 2015, provinces like Zhejiang and Sichuan achieved secondary growth pole breakthroughs via digital technology spillovers and industrial chain upgrading. By 2023, the East formed a continuous high-coordination belt, while the West exhibited “point breakthroughs” in Chongqing (0.519) and Shaanxi (0.509), reflecting differentiated impacts of regional policies and technology diffusion. Although the overall spatial pattern exhibits an “east-high-west-low” gradient, specific scenarios should not be overlooked. Some scholars argue that within certain timeframes, regional industrial transfer and technology diffusion may enable rapid localized development in Central and Western regions, thereby narrowing the gap with the East. For example, as Eastern China undergoes industrial structure upgrading in recent years, labor-intensive and resource-dependent industries have shifted to Central and Western regions, driving digital transformation in related industries and enhancing new-quality productivity there. Take Henan Province as an illustration: by undertaking eastern industrial transfers, it has intensified digital transformation in sectors such as electronic information manufacturing and equipment manufacturing, achieving notable progress in the coupled and coordinated development of digital transformation and new-quality productivity. In some cities within the province, the coupling coordination degree has gradually approached that of cities in Eastern regions. Meanwhile, it is essential to acknowledge that different evaluation indicators and analytical methods may influence conclusions about regional disparities. A single-indicator approach could potentially exaggerate or downplay interregional gaps. For instance, measuring solely by the internet broadband access rate in digital infrastructure might overestimate Eastern advantages, as Central and Western regions may possess unique strengths in other digital transformation domains—such as the specialized development of digital industries—that are not fully captured by this metric. Therefore, when analyzing regional differences, a comprehensive consideration of multiple factors and indicators is necessary to objectively assess the coupled and coordinated development of new-quality productivity and digital transformation across regions.
Dynamic evolution analysis highlights that regional coordination improvements depend on synergistic interactions among technological innovation, institutional adaptation, and factor mobility. Eastern regions, through high R&D investment (e.g., Guangdong’s R&D intensity of 3.2%), free trade zone policies, and talent–capital agglomeration, established a “technology-industry” positive feedback loop. Central and Western regions must escape “low-level equilibrium traps” by enhancing endogenous drivers via “new infrastructure + industrial digitization”.
Policy recommendations propose a layered governance framework: Eastern regions should focus on technological convergence and institutional innovation to transcend coordination thresholds. Central and Western regions require strengthened cross-regional collaboration, optimized resource allocation through initiatives like the “East Data West Computing” project, and enhanced digital infrastructure investments coupled with market-oriented reforms to narrow spatial disparities and achieve high-quality development. These findings provide theoretical and practical insights for regional synergy in the digital economy era.
China’s coupling coordination between new-quality productivity and digital transformation displays distinct regional imbalances, with coastal areas leading, Central regions holding significant potential, and Western regions offering vast developmental space. Future policy-guided interventions are expected to enhance coordination, fostering more balanced and sustainable development aligned with national high-quality growth objectives.
4.3. Empirical Analysis
4.3.1. Analysis of the Differences in the Coupling Coordination Degree Between New-Quality Productivity and Digital Transformation
To further explore the spatial disparities in the coupling coordination degree between new-quality productivity and digital transformation, this study measures the Dagum Gini coefficient to investigate intra-regional, inter-regional differences, and their sources. Due to space constraints, the results from 2011 to 2023 are aggregated in Table 7 and analyzed as follows:
Table 7.
Gini coefficient of the coupling and coordination between new-quality productivity and digital transformation.
- (1)
- Overall and Intra-Regional Disparities
The overall Gini coefficient declined from 0.248 to 0.169, indicating a significant reduction in regional absolute disparities. This process exhibited two distinct phases: a rapid decline from 2011 to 2014 (annual average decline rate of 5.3%), driven by early-stage dividends from regional coordination policies and technology diffusion, followed by a fluctuating stabilization period post-2015, reflecting the diminishing marginal effects of policies and shifts in regional development dynamics. Notably, a slight rebound in the Gini coefficient after 2020 may correlate with exacerbated imbalances in digital resource allocation under pandemic disruptions, highlighting external risks’ destabilizing impacts on coordination progress.
- (2)
- Inter-Regional Disparities
The Gini coefficient analysis reveals a “dual divergence” pattern. Intra-regional disparities: while the Eastern region’s intra-group Gini coefficient decreased from 0.185 to 0.151, it remained significantly higher than in Central and Western regions, underscoring persistent “core-periphery” structural rigidities. Conversely, intra-group disparities expanded in Central (26.0% increase) and Western regions (U-shaped fluctuations), reflecting uneven development in digital infrastructure and industrial capacity across provinces within less-developed areas. Inter-regional disparities: hierarchical differences were pronounced. The East–West gap remained the largest (0.373→0.243), constituting the primary regional coordination challenge. The East–Central gap narrowed by 25.0%, signaling that Central regions improved industrial transfer capacity. Meanwhile, the West–Central gap fluctuated upward, revealing Western regions’ dual lag in technology adoption and institutional innovation.
- (3)
- Sources of Disparities and Contributions
Inter-group differences dominated (64–70% contribution rate), exposing structural mismatches in “policy-resource-market” triadic factors across regions. Intra-group differences contributed less than 25%, revealing shortcomings in homogeneous regional policies and a lack of tailored strategies, such as convergence in digital innovation approaches among Eastern provinces and traditional industry transformation strategies in Central/Western regions. Super-variable density contribution exceeded 10% and trended upward, suggesting emerging “de-territorialization” effects driven by digital technology penetration. Non-geographic factors like technological innovation capacity and data factor marketization are increasingly reshaping regional disparity patterns.
4.3.2. Analysis of the Factors Influencing the Coupling Coordination Degree Between New-Quality Productivity and Digital Transformation
To explore the primary drivers of the coupling coordination between new-quality productivity (NQPF) and digital transformation (DT), this study employs an entropy-weighted TOPSIS model to assign weights to the criterion and indicator layers of both systems. An impact degree model was applied to quantify the influence of individual indicators. The analysis dissects influencing factors from both NQPF and DT perspectives, with the top five factors (averaged across provinces over the sample period) summarized in Table 8. The influence of new-quality productivity and digital transformation is arranged in descending order.
Table 8.
Main factors influencing the coupling and coordination between new-quality productivity and digital transformation.
The coupling coordination is significantly shaped by the following NQPF factors: Environmental protection intensity (A9, national impact degree: 0.152)—this reflects the critical role of fiscal environmental expenditures in green production, particularly prominent in Eastern China (0.161), aligning with the region’s demand for high environmental standards amid industrial upgrading. SO2 emission intensity (A11, 0.142) and pollution control quality (A10, 0.074)—this highlights the decoupling of emissions from economic growth, underscoring green technology adoption as a pillar of high-quality development. Central/Western regions’ weaker performance in pollution control (A10: 0.07) may stem from inadequate governance technologies or funding. Patents per capita (A18, 0.103)—this demonstrates innovation capacity’s universal role in advancing NQPF, with minimal regional variation. Waste gas treatment capacity (A17, 0.067)—equally impactful in Western and national contexts but replaced by R&D human capital (A6, 0.069) in Central regions, revealing regional constraints in technological pathway selection.
Digital transformation is primarily driven by the webpage count (B5, national: 0.226): this dominates as the top factor, peaking in Eastern China (0.232), reflecting a positive feedback loop between information density and economic activity. Express delivery volume (B16, 0.123) and domestic patent applications (B9, 0.122): in Western regions, B9’s influence (0.126) surpasses that in the East (0.117), suggesting lagging regions prioritize technology catch-up and logistics infrastructure to bridge digital divides. The scale of IT/software services (B7, 0.109) and employment share in digital sectors (B8, 0.089): Western regions’ higher sensitivity to B7 (0.114) signals growth-phase reliance on sectoral expansion, while the East leverages mature industrial synergies.
Regional heterogeneity further reveals the divergence of development paths: Eastern regions promote new-quality productivity through environmental protection investment (A9) and technological emission reduction (A11) while deepening digital transformation via webpage counts (B5) and logistics efficiency (B16), forming deep integration between high-value-added industries and digital ecosystems. Central–Western regions, however, need to balance pollution governance (A10/A11) and innovation resources (A6/A18), emphasizing patent applications (B9) and service industry expansion (B7) in digital transformation, reflecting a dual-track strategy of “green transition + technology introduction”. This divergence roots in regional resource endowments and economic structures—for example, Eastern regions’ strong fiscal capacity supports environmental technology upgrading, whereas Western regions rely on external technology inputs to compensate for insufficient endogenous innovation.
From a mechanistic perspective, green technology innovation (e.g., linkages between A9/A18 and B9) and digital infrastructure penetration (e.g., synergy among B5/B16/B7) constitute dual-wheel drivers of coupling coordination. The former enhances production sustainability by reducing environmental costs, while the latter empowers industrial upgrading through information circulation efficiency. Policy design should emphasize differentiated guidance: Eastern regions should strengthen digital technology embedding in green industrial chains (e.g., using big data to optimize pollution monitoring), while Central–Western regions need increased environmental protection fiscal preferences and accelerated technology diffusion via digital infrastructure gap-filling (e.g., improving optical fiber coverage). Additionally, constructing cross-regional innovation collaboration networks—such as patent technology sharing and logistics network interconnection—can further mitigate regional development imbalances and promote upgrading of coordination across the entire region. This analytical framework not only aligns with the internal logic of empirical data but also provides multi-dimensional policy anchors for achieving high-quality development goals.
4.4. Robustness Checks
4.4.1. Robustness Test Considering the Influence of Macroeconomic Factors
To further consider the impact of macro factors on the core results of this study, a robustness test was conducted by comparing the productivity measure value calculated herein with the result after excluding China’s total factor productivity. Using Chinese total factor productivity data from 2011 to 2023 [44], and based on the evaluation system and calculation method of new-quality productivity constructed in this paper, the annual new-quality productivity measure value of each province was calculated. Subsequently, China’s total factor productivity of the corresponding year was subtracted from it so as to obtain the net measure value of new-quality productivity after excluding the influence of total factor productivity. A time-series analysis was carried out on the net measure value of new-quality productivity; its trend chart during 2011–2023 was drawn and compared with the trend chart of the original new-quality productivity measure value.
As shown in Figure 5, the time-series analysis of the net measurement value of new-quality productivity (NQPP) reveals the evolutionary trends of Eastern, Central, and Western regions and the national average during 2011–2023. The Eastern region, starting from a relatively low level in 2011, exhibits a fluctuating upward trend. Despite periodic volatility, the overall trajectory is positive, indicating that after excluding total factor productivity (TFP), new-quality productivity in the East maintains strong growth momentum. This suggests a gradual consolidation of an innovation-driven model and reduced dependence on traditional TFP. The Central region, with a lower starting point, demonstrates steady and consistent growth, reflecting its developmental robustness and ability to progress incrementally even under macroeconomic influences. The Western region shows significant fluctuations but a notable upward trend in the later period, likely associated with increased innovation investment and accelerated industrial transformation driven by policies such as the Western Development Strategy. Early-period volatility may stem from macroeconomic disturbances, while the late-period rise signals the release of new-quality productivity potential. The national average shows an overall upward trend, indicating that China’s new-quality productivity remains growth-oriented after TFP exclusion, highlighting its inherent resilience and independence from excessive TFP constraints.
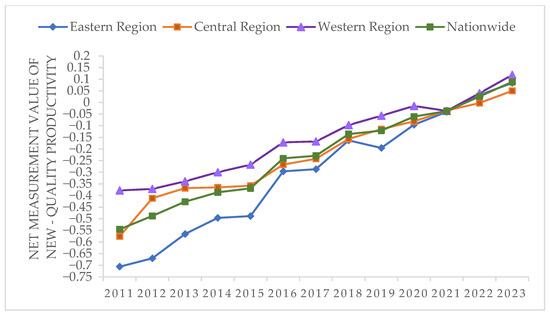
Figure 5.
Net measurement value of new−quality productivity.
Comparing with the evolutionary trends of the original NQPP measurement values—where growth may appear smoother or with different magnitudes due to TFP inclusion—the net measurement values reveal the true trajectory of new-quality productivity after macro factor exclusion. If the original measurements show more significant growth, this could be attributed to the positive contribution of TFP; by contrast, the trends in net measurement values emphasize the intrinsic development rhythm of new-quality productivity. The figure confirms that across all regions, new-quality productivity maintains a positive development trend after TFP exclusion, validating the study’s conclusion that new-quality productivity possesses developmental momentum independent of traditional TFP. This provides a purer perspective for in-depth analysis of its interaction with digital transformation.
4.4.2. Test of Sample Interval Change
To validate the sensitivity of research conclusions to the data time frame, this study conducts a robustness test by adjusting the sample interval. Specifically, the 2013–2021 data are selected to replace the original 2011–2023 sample. The entropy method is employed to recalculate the comprehensive scores of new-quality productivity and digital transformation, followed by regional disparity analysis based on the coupling coordination degree model and the Dagum Gini coefficient. The results show that the national-level coupling coordination degree increases from 0.292 in 2013 to 0.527 in 2021, with an average annual growth rate of 7.66%, continuing the overall trend of “steady improvement”. In terms of regional distribution, the Eastern region consistently maintains the highest coupling coordination degree (0.547 in 2021), followed by the Central region (0.379) and Western region (0.321), fully consistent with the “east-high-west-low” gradient pattern observed in the original sample interval. Decomposition via the Dagum Gini coefficient further reveals that the contribution rate of inter-regional differences remains stable at 44%, constituting the dominant component of overall disparities. This indicates that the differences in coupling coordination degree among the three major regions (Eastern, Central, and Western) are the primary source of national-level disparities. Further analysis demonstrates that despite changes in the macroeconomic environment during 2013–2021 (such as industrial policy adjustments and accelerated digital transformation), the core role of inter-regional differences has not significantly changed, with the super-variable density consistently approaching zero. This suggests no large-scale cross-overlapping phenomenon between regions, and the development gradient pattern remains clear. Additionally, minor fluctuations in intra-regional differences (e.g., temporary expansion in the Central region due to digital breakthroughs in individual provinces) do not substantially affect the overall conclusions. These findings indicate that research conclusions exhibit strong robustness to the selection of sample intervals. Core discoveries—such as the “east-high-west-low” gradient feature and the dominant role of inter-regional differences in overall disparities—are not significantly interfered with by short-term macroeconomic fluctuations or endpoint effects, verifying the reliability of the regional disparity analysis of coupling coordination degree.
4.4.3. Test of Key Variable Substitution
To evaluate the reliability of the indicator system, this study conducts a substitution test for the core variables in the digital transformation evaluation. The “technical market development level” (measured as “technology market turnover/regional GDP”) is selected to replace the “digital economy index (B17)” in the original digital transformation evaluation system. This indicator reflects the relationship between technology transaction activity and economic aggregate, which is closely related to the core dimensions of technology application and innovation-driven development in digital transformation. After recalculation, the trend of regional digital transformation levels remains essentially unchanged: the digital transformation level in the Eastern region increases from 0.09 in 2011 to 0.37 in 2023, while those in the Central and Western regions rise from 0.038 and 0.029 to 0.193 and 0.137, respectively. The relative differences between regions remain stable, continuing the overall trend of “steady growth”. Further analysis of the coupling coordination degree shows that the national average coupling coordination level after variable substitution maintains the same classification as the original result—“weak coordination”. The types and evolutionary paths of coupling coordination in the Eastern, Central, and Western regions are basically consistent with the original conclusions: the Eastern region exhibits “high coordination”, while the Central and Western regions show “weak coordination” and “low dissonance”, respectively. These results indicate that research conclusions demonstrate strong robustness to the selection of key variables, with core logic remaining unchanged despite indicator substitution. This effectively verifies the reliability of the research findings.
4.5. Endogeneity Test
To address potential endogeneity issues in the coupling coordination relationship between digital transformation and new-quality productivity, this study employs the Generalized Method of Moments (GMMs) [45], using “technical market development level” as the instrumental variable while controlling for multidimensional macro exogenous variables, including fiscal support intensity (W1), openness level (W2), urbanization level (W3), industrial structure (W4), innovation capacity (W5), energy structure (W6), and Theil index (W7). The first-order of the explanatory variables was incorporated with the instrumental variables for the Generalized Method of Moments (GMMs) estimation. The autocorrelation of the disturbance term is tested. The P-value of the second-order autocorrelation AR(2) is greater than 0.05, and the null hypothesis of “no autocorrelation of the disturbance term” was not rejected. In addition, the validity test of the instrumental variables was also carried out. The P-value of the Hansen statistic was greater than 0.05, and the null hypothesis was not rejected, indicating that there is no problem of over-identification of the instrumental variables. Column (1) of Table 5 shows the estimation results of the difference in GMMs, and the last two columns show the estimation results of the system GMMs. By introducing the first-lag and second-lag of the explained variable into the model, the results show that digital transformation still promotes the coupling and coordination between new-quality productivity and digital transformation. After addressing endogeneity via GMM, the relationships of core variables remain significant, demonstrating the robustness of research conclusions in complex macroeconomic environments. This effectively mitigates potential disturbances from endogeneity, providing reliable empirical evidence for revealing the coupling coordination mechanism between digital transformation and new-quality productivity. The results of the endogeneity are shown in Table 9.
Table 9.
Results of GMMs estimation.
5. Discussion
This study constructs a coupling coordination evaluation system for new-quality productivity and digital transformation, revealing the non-equilibrium characteristics and mechanisms of regional development in China. Its theoretical contributions and practical implications can be discussed in the following dimensions.
5.1. Theoretical Contributions: Expanding the Theoretical Boundaries of New-Quality Productivity
This research breaks through the traditional framework of productivity studies by integrating digital transformation into the synergy analysis of new-quality productivity, constructing a multi-dimensional evaluation system that includes green innovation and digital infrastructure. This theoretical innovation aligns with General Secretary Xi Jinping’s emphasis on the “deep integration of the digital economy and real economy”, providing a novel perspective for understanding the evolutionary connotation of new-quality productivity. The identified “technology-ecology dual-driven model” in the East and the “infrastructure-governance dual constraints” in the Central and Western regions deepen the understanding of the formation mechanism of new-quality productivity, filling gaps in existing literature on the pathways through which digital technology enables green development.
5.2. Practical Implications: Decoding the Policy Logic of Regional Coordinated Development
The revealed regional disparities (Eastern average of 0.697 vs. Western average of 0.437) provide quantitative evidence for differentiated policymaking. The Eastern region should strengthen the penetration of digital technology into green industrial chains, such as optimizing carbon trading markets using blockchain technology. Conversely, the Central and Western regions need to adopt a dual-track strategy of “digital infrastructure + technology introduction”, such as fostering data factor markets through the “East-to-West Data Transfer” project. Notably, the influence degree model highlights environmental protection intensity (A9) and webpage count (B5) as core drivers of the two systems, suggesting that policy design must balance environmental regulation and information infrastructure synergy. Zhejiang Province in the Eastern region actively promotes the integration of digital technology and green production in the textile industry. By introducing Internet of Things (IoT) technology to conduct real-time monitoring of energy consumption and pollutant emissions during the production process, and using big data analysis to optimize the production process, energy conservation and emission reduction are achieved. Meanwhile, with the aid of blockchain technology, a green supply chain traceability system is established to enhance the green added value of products. In the future, other provinces in the Eastern region can draw on Zhejiang’s experience, increase investment in the digital transformation of green industries, establish special funds to support enterprises in carrying out projects that integrate digital technology and green production, encourage collaborative research and development of related technologies between research institutions and enterprises, and promote the high-quality development of green industries. The Central and Western regions can accelerate the construction of digital infrastructure through major national projects such as the “East—West Digital Divide”. For example, the Inner Mongolia Autonomous Region, by leveraging the “East—West Digital Divide” project, constructs data center clusters to attract data storage and computing demands from the Eastern region, enhancing its own digital infrastructure level. In terms of technology introduction, the Central and Western regions can establish partnerships with universities, research institutions, and enterprises in the developed Eastern region, introducing advanced technologies through means such as technology transfer and jointly building R&D centers. It is expected that through these measures, the digital competitiveness of the Central and Western regions can be enhanced, industrial upgrading can be promoted, the gap with the Eastern region can be narrowed, and regional coordinated development can be achieved.
5.3. Methodological Innovation: Validating the Revised Coupling Model
This study employs a modified coupling coordination model, effectively overcoming boundary value defects in traditional models and making measurement results more aligned with the non-linear characteristics of real-world economic systems. The significant differentiation between high-coordination provinces (15) and maladjustment provinces (6) in 2023 confirms the model’s ability to accurately identify regional development stages. Combined with the decomposition results of the Dagum Gini coefficient (inter-regional differences contributing 64–70%), the research reveals the structural contradictions of misallocation among “policy-resource-market” elements in China, providing methodological support for the targeted optimization of regional coordination policies.
5.4. Research Limitations
5.4.1. Consideration of Macroeconomic and Political Developments
The sample period of this study spans 2011–2023, during which macroeconomic and political factors may have significantly influenced the research results. As argued by Cortes et al. (2022), since the global financial crisis, central banks in developed countries have implemented large-scale monetary expansion policies—measures that persisted through the Eurozone crisis and were further intensified amid the COVID-19 pandemic [46]. These policies facilitated capital flows to emerging market economies, providing financial support for China’s digital transformation investments and driving the development of new-quality productivity. Dantas (2021) notes that over the past two decades, ESG (Environmental, Social, and Governance)-based investment strategies have gained prominence, with the assets under management of ESG funds increasing substantially [47]. Primarily managed by large institutional investors, these funds likely allocated a significant portion of their portfolios to Chinese enterprises, serving as a key driver of international capital inflows into the country. Campello et al. (2022) observe that in the latter half of the 2010s, major geopolitical developments in advanced economies caused a sharp rise in policy uncertainty [48]. The UK Brexit referendum, for example, triggered significant misallocations of capital and labor, with capital exiting the UK and potentially flowing into emerging market economies, including China. While this study focuses on decomposing inter-group and intra-group effects (as shown in Table 6 and Table 7) and their temporal evolution, it does not control for the aforementioned macro-factors, which may constitute important drivers of new-quality productivity. This omission could affect the accuracy of the research results and impose certain limitations on the conclusions drawn.
5.4.2. Impact of the COVID-19 Pandemic
The period of 2020–2023 coincided with the COVID-19 pandemic, during which large-scale fiscal and monetary stimulus policies [46] and non-pharmaceutical interventions such as port closures and lockdowns may have significantly influenced the research results. Therefore, it is essential to explore the pandemic’s impacts on new-quality productivity and digital transformation.
On one hand, measures like port closures and lockdowns likely slowed capital formation, thereby affecting overall productivity. For example, during the pandemic, enterprises reliant on imports and exports faced shortages of raw material supplies and hindrances in product exports, constraining production scales and inhibiting the development of new-quality productivity. On the other hand, these policies may have increased the value of digital transformation projects. As the new economy relies more on intangible assets, it has fewer demands for physical interactions and production. Pandemic-driven rapid growth in digital economy models—such as remote work, online education, and e-commerce—accelerated corporate digital transformation and promoted innovation and development in new-quality productivity in digital domains.
Although this study does not directly quantify the pandemic’s impact when analyzing the coupled coordination relationship between new-quality productivity and digital transformation, future research could further investigate their dynamic changes under pandemic conditions to comprehensively understand development patterns in exceptional economic environments.
5.4.3. Limitations of the Method
Various methods used in the research related to new-quality productivity and digital transformation have their own advantages and disadvantages. Although the entropy method can objectively determine the weights of indicators and reduce human interference, it determines the weights based on the degree of data dispersion, which may lead to the neglect of the importance of the indicators themselves. For example, some indicators that are crucial for new-quality productivity and digital transformation may have low weights assigned by the entropy method due to small data fluctuations, thus affecting the accurate evaluation of the overall situation. Moreover, this method has high requirements for the integrity and accuracy of data. Missing values or outliers in the data may lead to deviations in weight calculation. It is only applicable to situations where there is a large amount of data and certain correlations exist among the indicators. In cases where the data volume is small or the indicators are highly independent, such as in emerging industries, it may be necessary to combine it with or replace it with subjective weighting methods.
The improved coupling coordination degree model has overcome some defects of the traditional model, such as clarifying the connotation of the coupling coordination degree, optimizing the calculation of boundary values, and improving the discriminative ability. However, during the calculation process, it has certain requirements for the data distribution. If the data distribution does not meet specific conditions, it will affect the accuracy of the results. The parameter settings (such as α and β) in the model need to be adjusted in different regions and industries. Currently, using fixed values may not be fully applicable. When applied in special regions such as those with a single industrial structure, it is necessary to calibrate and verify the model according to the actual situation.
The Dagum Gini coefficient method can effectively decompose regional differences and identify the sources of these differences. However, it has high requirements for the representativeness of the samples. If the sample selection is unreasonable, it will lead to biases in the estimation of regional differences. In addition, this method has certain limitations in dealing with complex geographical spatial relationships and cannot fully capture complex phenomena such as the spatial spillover effects between regions. When applied to regions or industries with different spatial characteristics, such as those with obvious agglomeration characteristics, it is necessary to fully consider their spatial characteristics and sample characteristics, and combine them with methods such as spatial autocorrelation analysis to comprehensively understand the regional differences and spatial distribution.
6. Conclusions
6.1. Conclusions
This study constructs a new-quality productivity (NQPF) evaluation system with 20 indicators and a digital transformation evaluation system with 17 indicators, based on panel data from 31 Chinese provinces during 2011–2023. Using the entropy method, the coupling coordination degree model, and the Dagum Gini coefficient, it systematically reveals the coupling coordination characteristics and interaction mechanisms between NQPF and digital transformation:
Spatiotemporal Differentiation: Gradient Distribution and Dynamic Evolution. This research identifies significant spatiotemporal disparities in the coupled and coordinated development of provincial NQPF and digital transformation in China. Temporally, the national coupling coordination degree increased from 0.236 (severe disharmony) in 2011 to 0.549 (good coordination) in 2023, with an average annual growth rate of 6.3%, reflecting the gradual strengthening of synergies between the two (Table 6). The Eastern region has consistently led, achieving an average coupling coordination degree of 0.697 in 2023 and entering the “high-quality coordination (Category A)” stage. Representatives like Guangdong (1.000) and Jiangsu (0.860) have formed a “technology-ecology” dual-drive model through the deep integration of digital innovation and ecological protection (Figure 4). Although Central and Western regions have shown catch-up trends—with the Central region rising from 0.219 in 2011 to 0.514 in 2023 and the Western region from 0.162 to 0.437—they remain in the “near-disharmony (Category F)” and “primary coordination (Category D)” stages, constrained by lagging digital infrastructure and inadequate pollution control capabilities (Figure 2 and Figure 3). Spatially, an “east-high-west-low” gradient pattern prevails. In 2023, the NQPF index (0.6728) and digital transformation index (0.4698) in the Eastern region were 1.86 and 2.82 times those of the Western region, respectively, highlighting significant regional polarization (Table 6). Spatial evolution exhibits “core-periphery diffusion”, with the Eastern coastal areas—centered on the Yangtze River Delta and Pearl River Delta—forming high-value agglomeration zones, while most Western provinces, such as Tibet (0.331) and Qinghai (0.342), remain in low-coordination intervals. This validates the significant impact of regional disparities in “policy resources-technical capabilities-industrial foundations” on coupling coordination (Figure 4).
Stage-wise Leaps and Regional Differentiation in Coupling Coordination Degree. The national coupling coordination degree has undergone a structural shift from “disharmony-dominated” to “coordination-dominated”. In 2011, 29 provinces (93.5%) were in disharmony stages (Categories G–I), whereas by 2023, only 6 Western provinces remained in disharmony, and 15 Eastern provinces achieved high-quality coordination (Category A). This reflects the gradual release of digital transformation’s enabling effects on NQPF as infrastructure improves and policies guide development (Table 6). Leveraging first-mover advantages, Eastern regions have established a “digital technology-green innovation” virtuous cycle through over 90% 5G base station coverage (e.g., Guangdong) and increased green patent intensity. Central and Western regions like Sichuan (0.619) and Chongqing (0.519) have leaped from “near-disharmony” to “intermediate coordination” via undertaking eastern industrial transfers and the “East Data West Computing” project, but overall progress is constrained by shortages of digital talent and low levels of industrial chain digitization (Table 8).
Difference Decomposition: Structural Contradictions with Inter-Regional Differences as the Dominant Factor. Dagum Gini coefficient decomposition shows that inter-regional differences were the primary source of total disparities, with contribution rates stabilizing at 64–70% during 2011–2023, significantly higher than intra-regional differences (24–25%) and hypervariable density (10–11%) (Table 7). The East–West gap was the largest, with a gap coefficient of 0.243 in 2023, reflecting imbalances in the cross-regional allocation of “digital infrastructure-green investment-institutional innovation”. Notably, regional disparities rebounded slightly after 2020, possibly due to the agglomeration of digital resources in the East during the pandemic, highlighting the potential impact of external shocks on regional coordination. The rising contribution of hypervariable density (from 10.07% to 10.61%) indicates the emerging “de-territorialization” effect of digital technologies, as non-geographical factors such as data element marketization and platform economy reshape regional competition patterns.
Core Influencing Factors: Dual-Dimensional Drivers and Regional Heterogeneity. In the NQPF system, green technological innovation and ecological governance capacity are key drivers. Environmental protection intensity (A9, influence degree 0.152) and sulfur dioxide emission intensity (A11, 0.142) affect coupling coordination through an “emission reduction-innovation” mechanism. Eastern regions achieve synergy between economic growth and ecological protection via environmental investments (e.g., Jiangsu’s environmental expenditure accounting for 12% of fiscal expenditure) and carbon emission trading market construction. In contrast, Central and Western regions face intensified environmental constraints due to lagging pollution control technologies (e.g., Gansu’s waste gas treatment capacity is only 40% of the Eastern average) (Table 8). In the digital transformation system, the information resource scale and logistics efficiency are core drivers. The number of webpages (B5, 0.226) and express delivery volume (B16, 0.123) reflect the vitality of the digital ecosystem and the efficiency of physical connections. Eastern regions leverage platform economy agglomeration to form an efficient network of “data flow-industrial collaboration”. Western regions have narrowed gaps through “Digital Silk Road” initiatives (e.g., Shaanxi’s webpage count growing 15% annually) but remain dependent on external technology input (Table 8). Regional heterogeneity suggests that the East needs to break through “technological lock-in”, while the Central and Western regions must address “infrastructure shortfalls” to achieve differentiated synergy.
6.2. Implications
To strengthen interregional coordination within the differentiated synergistic development mechanism of “Eastern Leadership–Central Rise–Western Revitalization”, practical mechanisms can be established as follows: A cross-regional coordination and management authority, led by relevant national authorities and involving provinces from Eastern, Central, and Western regions, should be established to formulate strategic plans and policy measures for interregional collaborative development. For example, in the context of the “East Data West Computing” project, this authority can coordinate data demands from the East with data center construction in the West, allocate resources rationally, and avoid duplicate construction and waste. Additionally, a special fund for regional collaborative development should be set up, raised through central fiscal transfers and local fiscal contributions, to support digital infrastructure construction and industrial upgrading projects in Central and Western regions. The use of this fund should define key supported areas and project criteria to ensure efficient utilization. Furthermore, an interregional information-sharing platform should be built to integrate industrial, technological, and talent resources across regions, facilitating information exchange and cooperation. Through this platform, Eastern enterprises can understand the industrial undertaking capacity and needs of Central and Western regions, while the latter can access advanced technologies and management experience from the East in a timely manner.
In implementing the proposed measures for digital infrastructure development, the following practical mechanisms can be adopted: First, establish unified standards and specifications for digital infrastructure construction, formulated by national standardization authorities in collaboration with relevant industry associations. This ensures compatibility in technical standards and interface specifications across regions, promoting nationwide interconnectivity of digital networks—for example, unified standards for 5G base station construction and data center design. Second, increase investment in digital infrastructure by encouraging private sector participation alongside government funding. Public–private partnership (PPP) models can attract social capital from telecom operators, internet enterprises, and other stakeholders. For instance, in high-speed broadband network projects, governments can collaborate with telecom operators through shared investment, complemented by policy incentives and subsidies. Third, strengthen talent cultivation and mobility mechanisms: universities and vocational colleges should be encouraged to offer specialized programs in digital infrastructure construction, operation, and management. Meanwhile, talent mobility policies should facilitate the flow of digital technology professionals from Eastern to Central–Western regions, leveraging technical guidance and project collaborations to enhance the construction and operational capabilities of digital infrastructure in less-developed areas.
Innovating market-oriented allocation mechanisms for production factors: To address the structural imbalances in factor distribution and enhance cross-regional synergies, this study advocates for a tripartite framework integrating data, intellectual property (IP), and talent resources. First, the establishment of standardized cross-regional data trading platforms—such as the Guiyang Big Data Exchange and Shanghai Data Exchange—should be scaled up to facilitate secure transactions of industrial, environmental, and consumer data. Tax incentives, including a 15% corporate income tax reduction for East-to-West data transfers, can incentivize data flow, leveraging Eastern dominance in the data factor market (71.2% in 2023) to bridge regional digital divides. Second, enhancing IP pledge financing requires regional IP operation centers equipped with blockchain-based transaction systems to improve transparency in patent securitization, particularly for domestic patents (indicator B9, impact degree: 0.122). Pilot projects in Chengdu have already demonstrated the model’s efficacy, enabling SMEs to secure over CNY 8.7 billion in loans through patent pledges. Finally, flexible talent mobility mechanisms, such as the “Eastern R&D–Western Commercialization” model, can be operationalized through tax breaks for dispatched researchers and dual-home employment policies, reducing talent mismatch costs by integrating Eastern innovation capacity with Western commercialization potential. These measures align with Sustainable Development Goal (SDG) 9, fostering industry, innovation, and infrastructure resilience.
Enhancing Institutional Supply Systems for Synergistic Development. Institutional reforms are critical to align policy frameworks with the dual goals of new-quality productivity and digital transformation. Enacting the new-quality productivity Promotion Law would formalize standards integration, mandating that digital technology adoption (e.g., 5G industrial networks) comply with dynamic environmental regulations like ISO 14064 [49] carbon accounting. A real-time coupling coordination early-warning system, targeting the six provinces in “discoordinated” status (Tibet, Qinghai, etc., in 2023), could trigger customized interventions—such as prioritizing satellite communication infrastructure in Tibet and green technology transfer centers in Gansu—to address regional bottlenecks in pollution control (indicators A10/A11). Fiscal policies should reorient central budget allocations to increase digital infrastructure investment in Central/Western regions from 58.7% of Eastern levels (2023) to 80% by 2027, with a specific focus on “East Data West Computing” hubs in Inner Mongolia and Yunnan. These institutional adjustments ensure policy coherence with SDG 11 (sustainable cities and communities) and SDG 13 (climate action), enhancing regional equity and ecological sustainability.
Strengthening technological innovation ecosystems: A quadruple-helix approach integrating government, industry, academia, research, and application is essential to foster innovation-driven coordination. Collaborative platforms, such as the “100 Cities, 1000 Universities, 10,000 Enterprises” initiative, can accelerate patent commercialization (indicator A18, impact degree: 0.103), with pilot hubs in Suzhou and Wuhan linking academic research to industrial applications. A “Challenge List” system for key technologies—focusing on pollution control (e.g., sulfur dioxide reduction) and digital security—can channel CNY 5 billion annually into breakthrough innovations, leveraging blockchain for supply chain traceability in rapidly growing Western e-commerce markets (20% annual growth). Complementary tax policies, including a 20% corporate income tax reduction for firms with R&D intensity exceeding 3%, would lower innovation risks, particularly for SMEs in Central regions. These measures align with SDG 9, promoting inclusive innovation and green technology adoption to drive sustainable productivity growth.
Constructing new paradigms for regional collaboration: Innovative regional collaboration models are necessary to address spatial disparities through infrastructure integration and shared prosperity. “Enclave economy” partnerships, such as the Shenzhen–Ganzhou industrial pairing, allow Eastern high-tech zones to establish R&D branches in Western regions with tax exemptions, boosting Ganzhou’s digital economy output by 30% since 2021. Cross-regional benefit-sharing mechanisms, including a 20% redistribution of digital economy tax revenue to lagging regions and linked carbon markets between Shanghai and Chongqing, ensure equitable growth while advancing climate goals. Public-private partnerships (PPPs) can bridge infrastructure gaps, aiming to increase Central/Western fiber-optic cable lengths to 90% of Eastern levels by 2025 through private capital participation (e.g., Sichuan’s “Smart Village” project). These collaborative paradigms align with SDG 10 (reduced inequalities) and SDG 17 (partnerships for the goals), fostering resilient, interconnected systems that integrate economic efficiency with ecological responsibility.
This study elucidates the coupling coordination dynamics between China’s new-quality productivity and digital transformation, offering theoretical foundations for high-quality regional development in the digital era. Future research should deepen insights into technology–institution interactions and assess the dynamic impacts of green transitions under carbon neutrality goals, providing holistic frameworks for sustainable development. This framework advances actionable strategies for achieving spatially balanced, innovation-driven, and ecologically sustainable growth.
7. Guidelines for International Application
The findings of this study hold considerable application value for other countries worldwide. For nations with economic development levels and industrial structures akin to China’s Eastern region—such as certain developed countries—they can draw on the development experience of China’s Eastern provinces, focusing on the deep integration of digital technologies in green industries, strengthening technological and institutional innovation, and further enhancing the coupling coordination degree between new-quality productivity and digital transformation. For example, in some industrialized European countries, leveraging their advanced digital technologies and well-established environmental protection industry foundations can promote green technological innovation, optimize digital infrastructure, and facilitate the profound integration of the digital economy with the real economy.
For countries with economic development levels and industrial structures similar to China’s Central and Western regions—such as certain developing nations—they may refer to the strategies adopted in China’s Central and Western regions, increasing investment in digital infrastructure and actively introducing advanced technologies and experiences. Take some Southeast Asian countries, for instance: they can introduce digital technologies through international cooperation projects, strengthen digital economic exchanges and collaborations with neighboring countries, and enhance their own digital competitiveness.
Meanwhile, when applying these insights, countries should fully consider their national conditions and development stages, making appropriate adjustments and optimizations to the evaluation index system and development strategies. This approach ensures the synergistic development of new-quality productivity and digital transformation, thereby driving sustainable economic growth.
Author Contributions
Conceptualization, D.D. and S.C.; writing—original draft, D.D., S.C. and M.Z.; writing—review and editing, D.D., S.C. and M.Z. All authors have read and agreed to the published version of the manuscript.
Funding
This work was supported by the Humanities and Social Sciences Research Planning Fund of the Ministry of Education of the People’s Republic of China (grant No. 17YJA880014).
Institutional Review Board Statement
Not applicable.
Informed Consent Statement
Not applicable.
Data Availability Statement
The dataset generated and analyzed in this study is not publicly available. The dataset is available from the corresponding author on reasonable request.
Conflicts of Interest
The authors declare no conflicts of interest.
References
- Zou, F.; Hu, Y.; Liu, F. Research on regional carbon emission policy and breakthrough green technology innovation pathways: Based on the perspective of new quality productivity. Glob. Nest J. 2024, 26, 06248. [Google Scholar]
- Shi, J.; Xu, L. Research on the Great Strategic Significance and Realization Path of Accelerating the Formation of New-Quality Productivity. Res. Financ. Econ. Issues 2024, 1, 3–12. (In Chinese) [Google Scholar] [CrossRef]
- Zhang, G.H.; Zhang, M.Y.; Zhou, W.B. Research on the Impact of the Digital Economy on Enterprises’ New-Quality Productivity. West Forum 2024, 34, 17–30. (In Chinese) [Google Scholar]
- Zheng, M.; Yan, S.; Xu, S. Digital Economy, Industry–Academia–Research Collaborative Innovation, and the Development of New-Quality Productive Forces. Sustainability 2025, 17, 318. [Google Scholar] [CrossRef]
- Wang, J.; Qiao, L.; Zhu, G.; Di, K.; Zhang, X. Research on the driving factors and impact mechanisms of green new quality productive forces in high-tech retail enterprises under China’s Dual Carbon Goals. J. Retail. Consum. Serv. 2025, 82, 104092. [Google Scholar] [CrossRef]
- Ling, X.X.; Xie, H.; Tuo, L.; Jin, Z. The Three Dimensions of New Quality Productivity: Temporal-Spatial, Structural and Technological Dimensions. J. Xinjiang Norm. Univ. 2024, 45, 67–76. (In Chinese) [Google Scholar]
- Song, H.; Zhang, X. Digital Transformation Empowering New-Quality Productivity: Mechanism, Challenges and Path Selection. J. Beijing Inst. Technol. (Soc. Sci. Ed.) 2024, 26, 41–51+73. (In Chinese) [Google Scholar]
- Shao, C.; Dong, H.; Gao, Y. New Quality Productivity and Industrial Structure in China: The Moderating Effect of Environmental Regulation. Sustainability 2024, 16, 6796. [Google Scholar] [CrossRef]
- Li, L.; Liu, Z. Sustainable Evolution of China’s Provincial New Quality Productivity Based on Three Dimensions of Multi-Period Development and Combination Weights. Sustainability 2024, 16, 11259. [Google Scholar] [CrossRef]
- Yao, L.; Li, A.; Yan, E. Research on digital infrastructure construction empowering new quality productivity. Sci. Rep. 2025, 15, 6645. [Google Scholar] [CrossRef]
- Gang, W.; Hongrui, Z. Research on the impact of cost of equity capital on firm new quality productive forces in China. Total Qual. Manag. Bus. Excell. 2025, 1–23. [Google Scholar] [CrossRef]
- Li, J.; Noorliza, K.; Zhang, X. Enhancing Environmental, Social, and Governance Performance through New Quality Productivity and Green Innovation. Sustainability 2024, 16, 4843. [Google Scholar] [CrossRef]
- Criveanu, M.M. Investigating Digital Intensity and E-Commerce as Drivers for Sustainability and Economic Growth in the EU Countries. Electronics 2023, 12, 2318. [Google Scholar] [CrossRef]
- Zhang, L.; Zhang, X.Y. Impact of digital government construction on the intelligent transformation of enterprises: Evidence from China. Technol. Forecast. Soc. Change 2025, 210, 123787. [Google Scholar] [CrossRef]
- Safa, M.; Sharma, N.; Weeks, K.; Slaydon, J. Next normal for business post pandemics: COVID-19. Int. J. Technol. Manag. Sustain. Dev. 2023, 22, 21–34. [Google Scholar] [CrossRef]
- Li, C.; Long, G.; Li, S. Research on measurement and disequilibrium of manufacturing digital transformation: Based on the text mining data of A-share listed companies. Data Sci. Financ. Econ. 2023, 3, 30–54. [Google Scholar] [CrossRef]
- Verhoef, P.C.; Broekhuizen, T.; Bart, Y.; Bhattacharya, A.; Dong, J.Q.; Fabian, N.; Haenlein, M. Digital transformation: A multidisciplinary reflection and research agenda. J. Bus. Res. 2021, 122, 889–901. [Google Scholar] [CrossRef]
- Matt, C.; Hess, T.; Benlian, A. Digital transformation strategies. Bus. Inf. Syst. Eng. 2015, 57, 339–343. [Google Scholar] [CrossRef]
- Daradkeh, F.M.; Hassan, T.H.; Palei, T.; Helal, M.Y.; Mabrouk, S.; Saleh, M.I.; Salem, A.E.; Elshawarbi, N.N. Enhancing Digital Presence for Maximizing Customer Value in Fast-Food Restaurants. Sustainability 2023, 15, 5690. [Google Scholar] [CrossRef]
- Li, Z.; Xu, Y.; Du, Z. Valuing Financial Data: The Case of Analyst Forecasts. Financ. Res. Lett. 2025, 75, 106847. [Google Scholar] [CrossRef]
- Li, R.; Rao, J.; Wan, L. The digital economy, enterprise digital transformation, and enterprise innovation. Manag. Decis. Econ. 2022, 43, 2875–2886. [Google Scholar] [CrossRef]
- Li, Z.; Guo, F.; Du, Z. Learning from Peers: How Peer Effects Reshape the Digital Value Chain in China? J. Theor. Appl. Electron. Commer. Res. 2025, 20, 41. [Google Scholar] [CrossRef]
- Mosterd, L.; Sobota, V.C.; van de Kaa, G.; Ding, A.Y.; de Reuver, M. Context dependent trade-offs around platform-to-platform openness: The case of the Internet of Things. Technovation 2021, 108, 102331. [Google Scholar] [CrossRef]
- Dong, Q.; Zhong, K.; Liao, Y.; Xiong, R.; Wang, F.; Pang, M. Coupling coordination degree of environment, energy, and economic growth in resource-based provinces of China. Resour. Policy 2023, 81, 103308. [Google Scholar] [CrossRef]
- Chang, Q.; Sha, Y.; Chen, Y. The Coupling Coordination and Influencing Factors of Urbanization and Ecological Resilience in the Yangtze River Delta Urban Agglomeration, China. Land 2024, 13, 111. [Google Scholar] [CrossRef]
- Wu, H.; Deng, H.; Gao, X. Corporate coupling coordination between ESG and financial performance: Evidence from China’s listed companies. Environ. Impact Assess. Rev. 2024, 107, 107546. [Google Scholar] [CrossRef]
- Han, S.; Wang, B.; Ao, Y.; Bahmani, H.; Chai, B. The coupling and coordination degree of urban resilience system: A case study of the Chengdu-Chongqing urban agglomeration. Environ. Impact Assess. Rev. 2023, 101, 107145. [Google Scholar] [CrossRef]
- Wu, B.; Quan, Q.; Yang, S.; Dong, Y. A social-ecological coupling model for evaluating the human-water relationship in basins within the Budyko framework. J. Hydrol. 2023, 619, 129361. [Google Scholar] [CrossRef]
- Wang, J.; Wang, R. New-Quality Productivity: Index Construction and Spatiotemporal Evolution. J. Xi’an Univ. Financ. Econ. 2024, 37, 31–47. (In Chinese) [Google Scholar]
- VIAL, G. Understanding digital transformation: A review and a research agenda. J. Strateg. Inf. Syst. 2019, 28, 118–144. [Google Scholar] [CrossRef]
- Zhuo, C.; Chen, J. Can digital transformation overcome the enterprise innovation dilemma: Effect, mechanism and effective boundary. Technol. Forecast. Soc. Change 2023, 190, 122378. [Google Scholar] [CrossRef]
- Cheng, W.; Li, C.; Zhao, T. The stages of enterprise digital transformation and its impact on internal control: Evidence from China. Int. Rev. Financ. Anal. 2024, 92, 103079. [Google Scholar] [CrossRef]
- Wang, N.; Zhang, Y. Research on evaluation of Wuhan air pollution emission level based on entropy weight method. Sci. Rep. 2024, 14, 5012. [Google Scholar] [CrossRef] [PubMed]
- Cong, X.N. Forms and Properties of the Coupling Degree Model and Its Misuses in Geography. Econ. Geogr. 2019, 39, 18–25. (In Chinese) [Google Scholar]
- Geng, Y.; Chen, L.; Li, J.; Iqbal, K. Higher education and digital Economy: Analysis of their coupling coordination with the Yangtze River economic Belt in China as the example. Ecol. Indic. 2023, 154, 110510. [Google Scholar] [CrossRef]
- Tu, D.; Cai, Y.; Liu, M. Coupling coordination analysis and spatiotemporal heterogeneity between ecosystem services and new-type urbanization: A case study of the Yangtze River Economic Belt in China. Ecol. Indic. 2023, 154, 110535. [Google Scholar] [CrossRef]
- Lu, J.; Zhou, H.M. An Empirical Analysis of the Coupling Relationship between Human Capital and Economic Growth in China’s Provinces. J. Quant. Tech. Econ. 2013, 30, 3–19+36. (In Chinese) [Google Scholar]
- Wang, S.J.; Kong, W.; Ren, L.; Zhi, D.D.; Dai, B.T. Misunderstandings and Corrections of the Coupling Coordination Degree Model in China. J. Nat. Resour. 2011, 36, 793–810. (In Chinese) [Google Scholar]
- Li, H.Y.; Xu, Y.C.; Chai, Z.M. Measurement of Modernization Development Level and Analysis of Coupling Coordination in the Yangtze River Economic Belt. Stat. Decis. 2023, 39, 74–79. (In Chinese) [Google Scholar]
- Fan, D.J.; Ke, H.; Cao, R.M. Correction and improvement of the coupling coordination degree model. Stat. Decis. 2024, 40, 41–46. (In Chinese) [Google Scholar]
- Zhong, Q.; Fu, H.; Yan, J.; Li, Z. How does energy utilization affect rural sustainability development in traditional villages? Re-examination from the coupling coordination degree of atmosphere-ecology-socioeconomics system. Build. Environ. 2024, 257, 111541. [Google Scholar] [CrossRef]
- Lu, X.; Kuang, B.; Li, J. Regional difference decomposition and policy implications of China’s urban land use efficiency under the environmental restriction. Habitat. Int. 2018, 77, 32–39. [Google Scholar] [CrossRef]
- Liu, T.; Xu, Z.Y. Coupling coordination and spatiotemporal characteristics of green finance and low-carbon economy in China. Stat. Decis. 2024, 40, 144–149. (In Chinese) [Google Scholar]
- Tian, Y.; Lu, S.; Jin, L. Methods, Data and the Differences in the Measurement of Total Factor Productivity. J. Quant. Tech. Econ. 2017, 34, 22–40. (In Chinese) [Google Scholar]
- Li, H.; Du, J. New-type Productivity Empowering the Upgrading of Industrial Structure: Influence Mechanism and Spatial Spillover Effect. J. Shanxi Univ. Financ. Econ. 2025, 47, 71–83. [Google Scholar]
- Cortes, G.S.; Gao, G.P.; Silva, F.B.; Song, Z. Unconventional Monetary Policy and Disaster Risk: Evidence from the Subprime and COVID–19 Crises. J. Int. Money Financ. 2022, 122, 102543. [Google Scholar] [CrossRef]
- Dantas, M. Are ESG Funds More Transparent? Available online: https://papers.ssrn.com/sol3/papers.cfm?abstract_id=3269939 (accessed on 20 August 2024).
- Campello, M.; Cortes, G.S.; d’Almeida, F.; Kankanhalli, G. Exporting Uncertainty: The Impact of Brexit on Corporate America. J. Financ. Quant. Anal. 2022, 57, 3178–3222. [Google Scholar] [CrossRef]
- ISO 14064; Specification with Guidance at the Organization Level for Quantification and Reporting of Greenhouse Gases. International Organization for Standardization: Geneva, Switzerland, 2018.
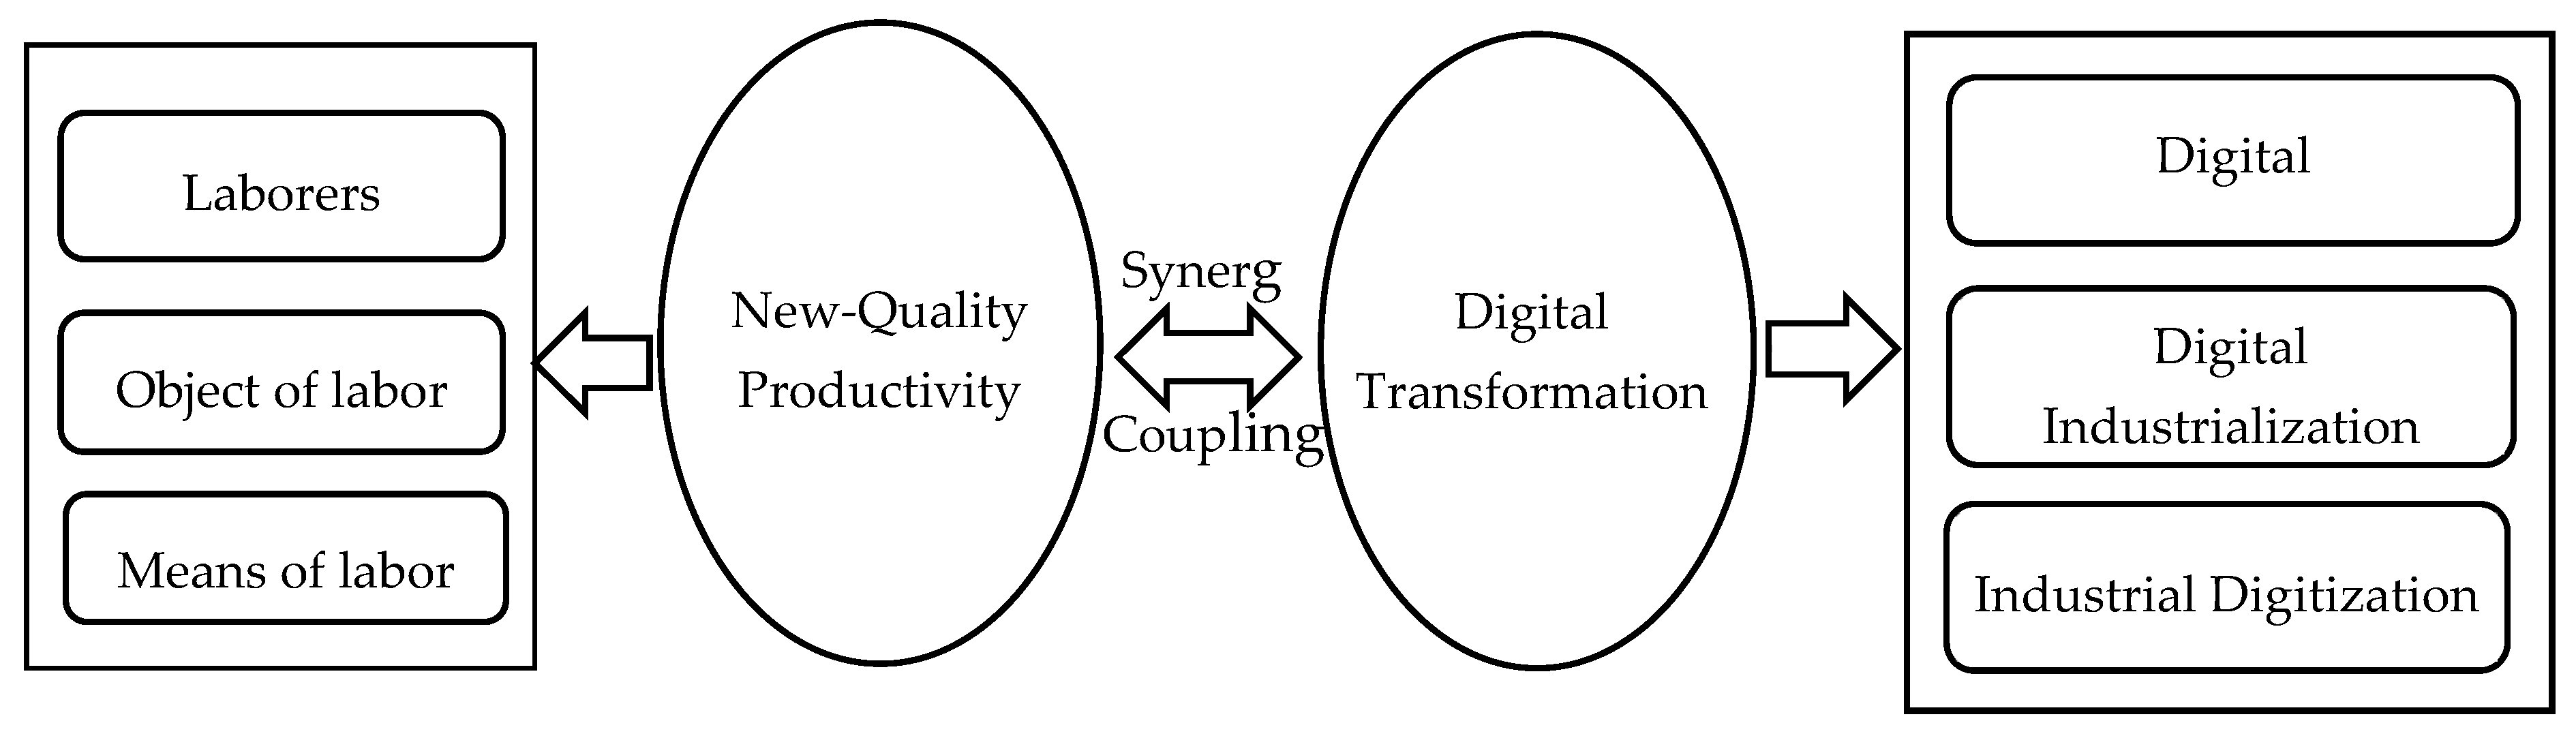
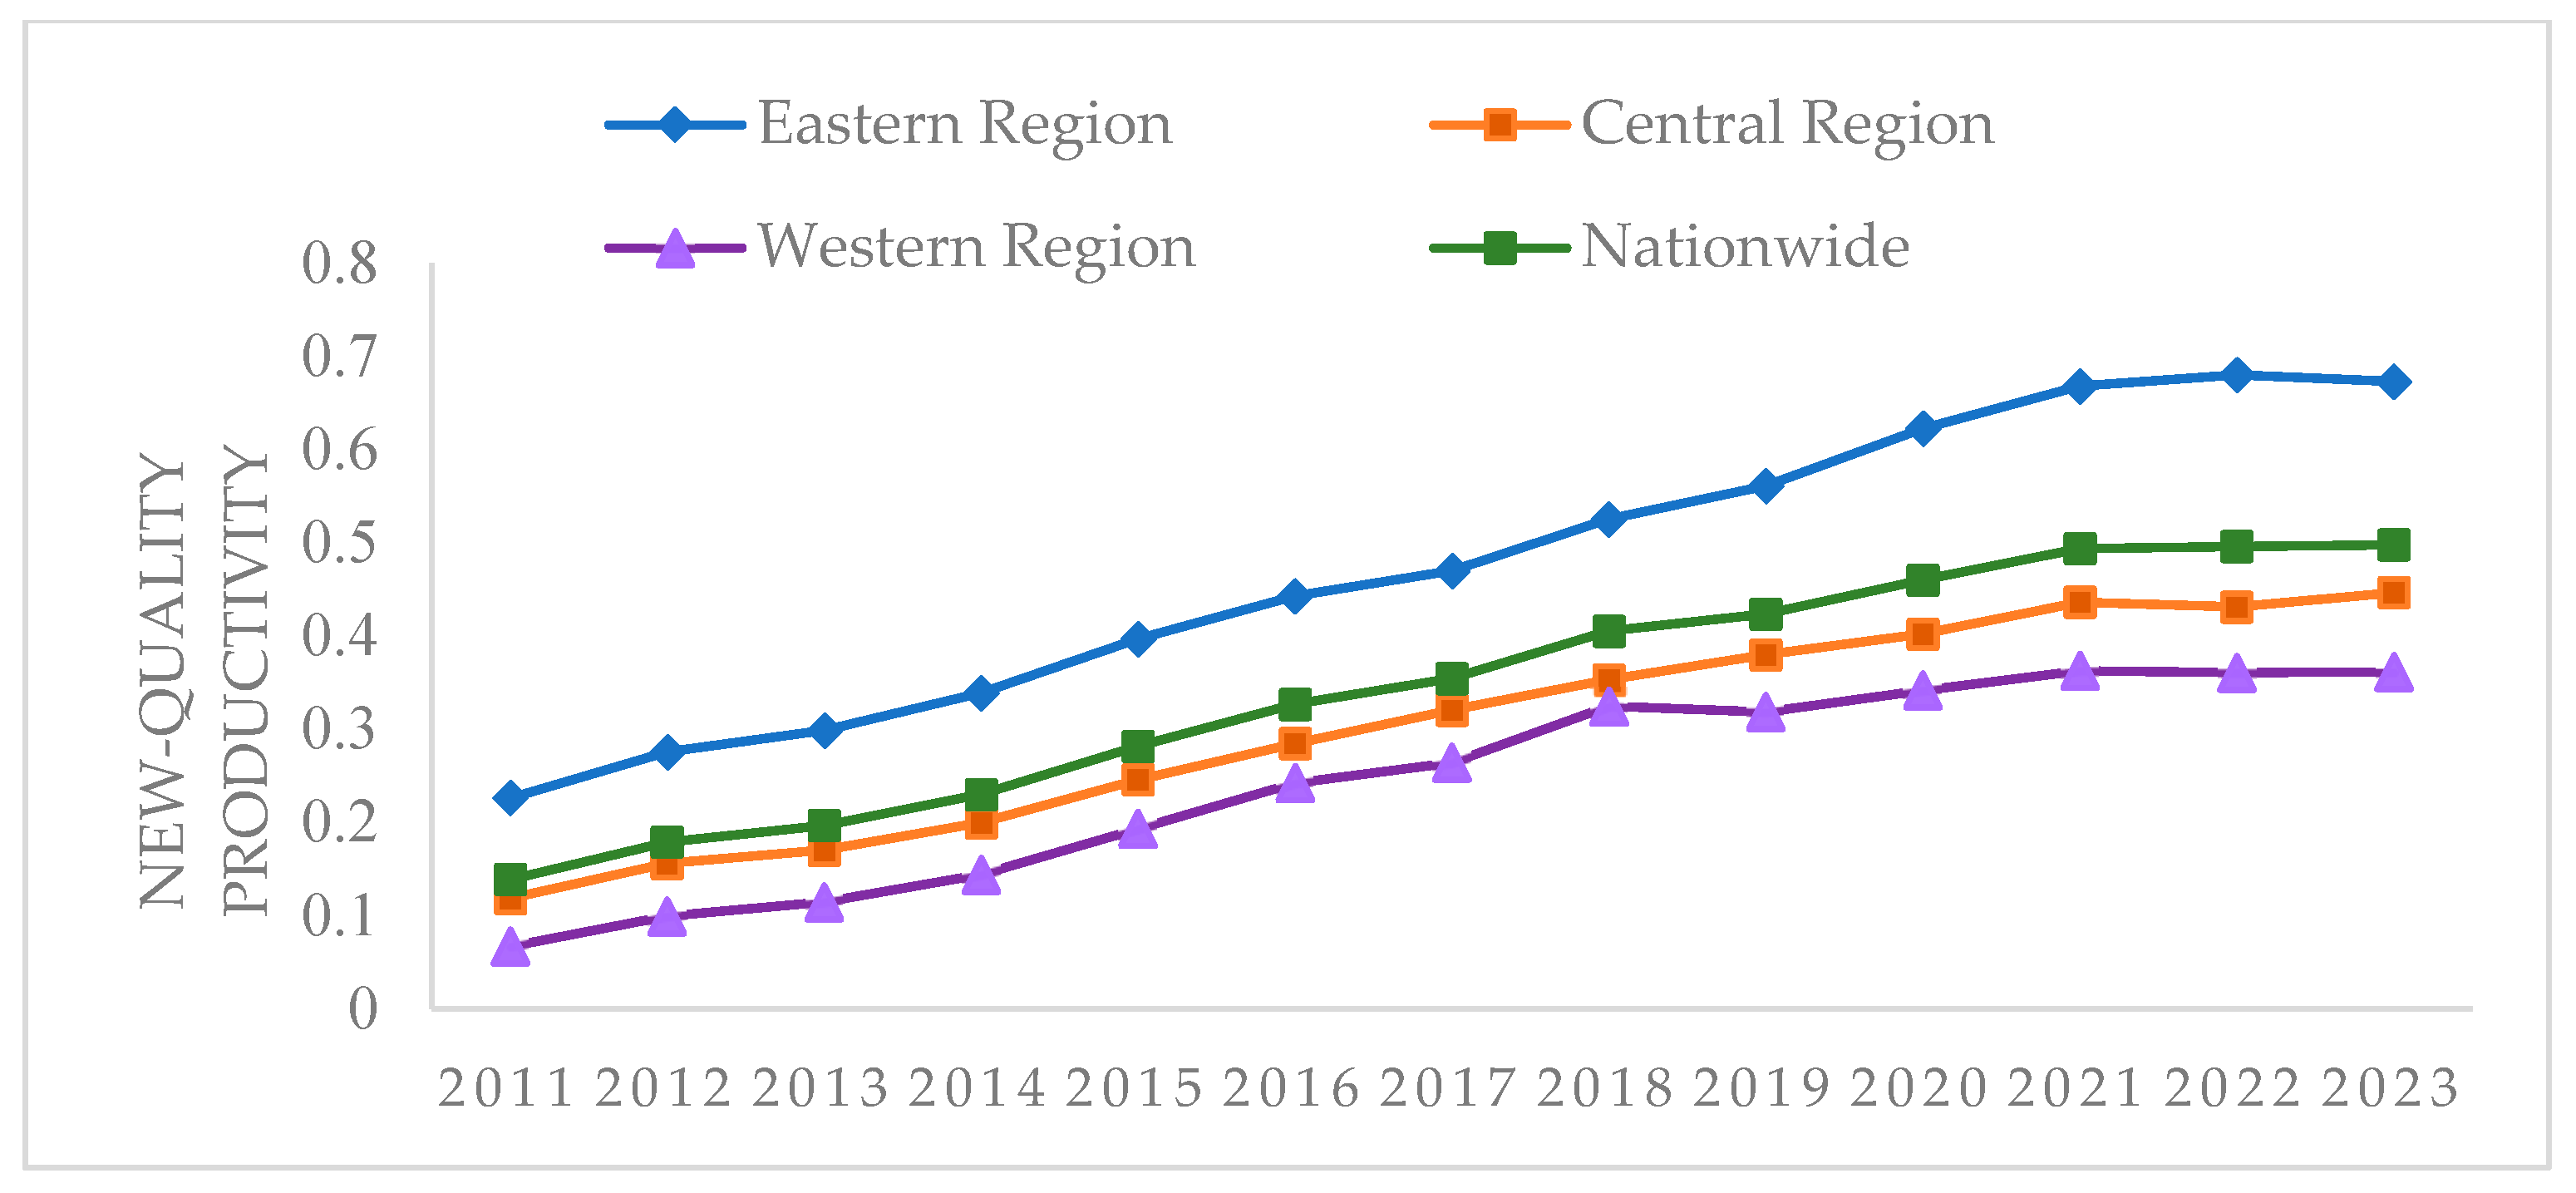
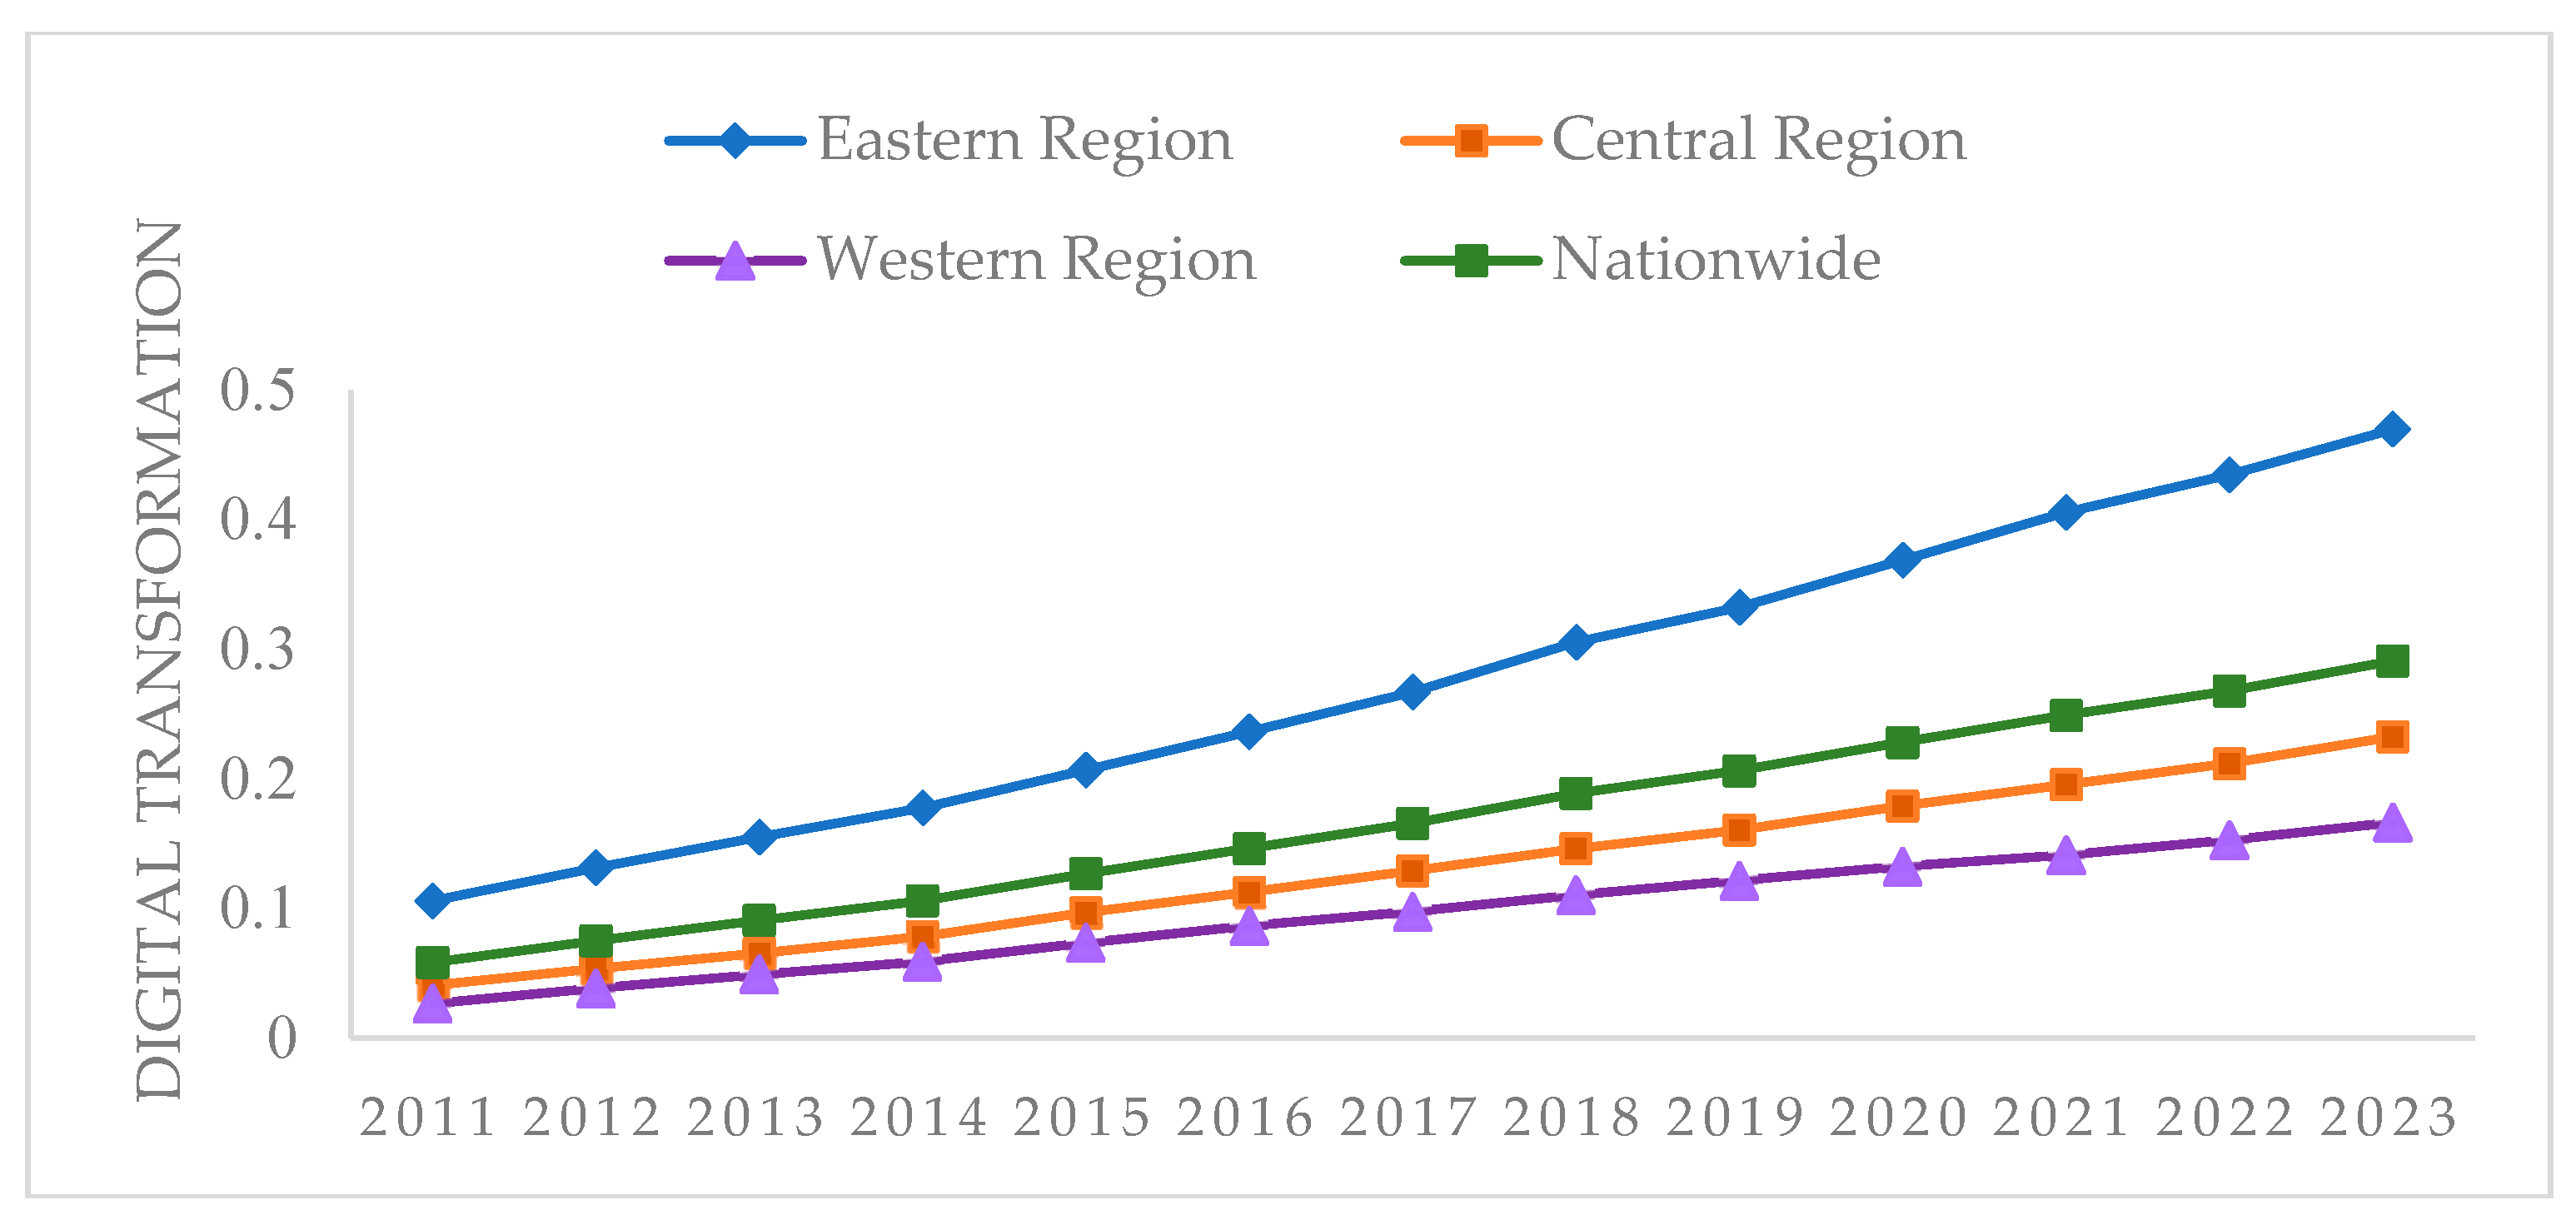
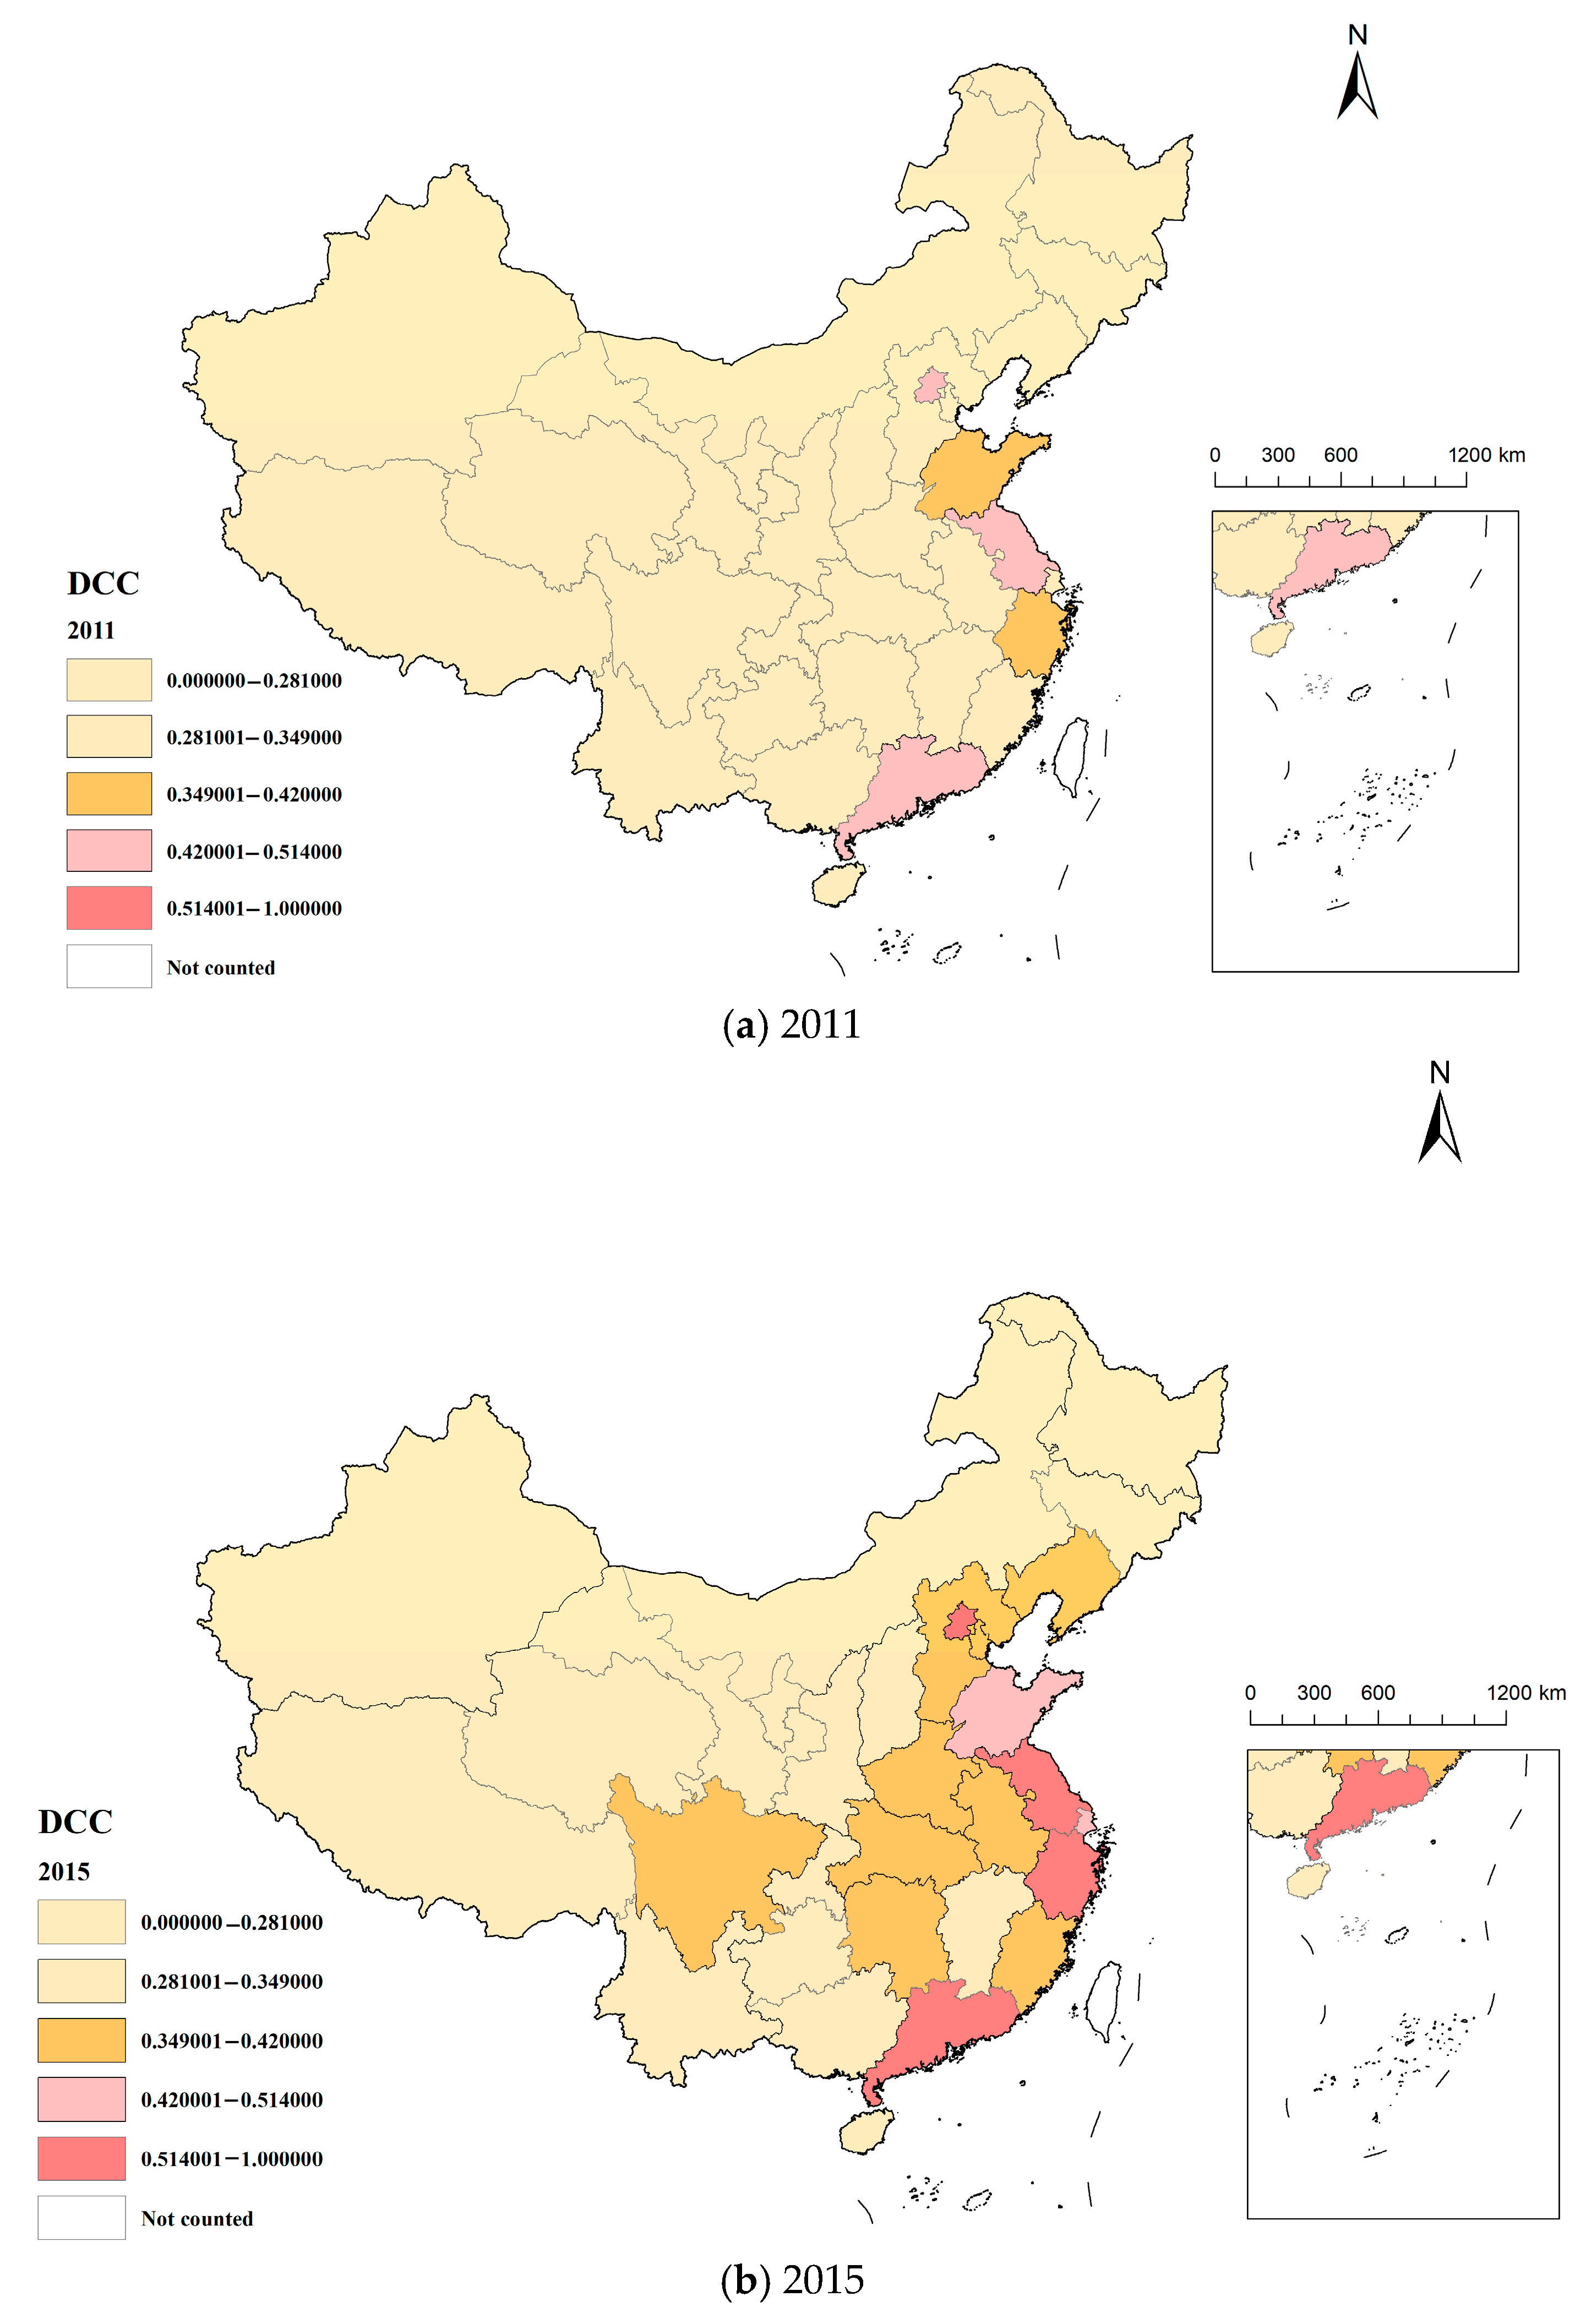
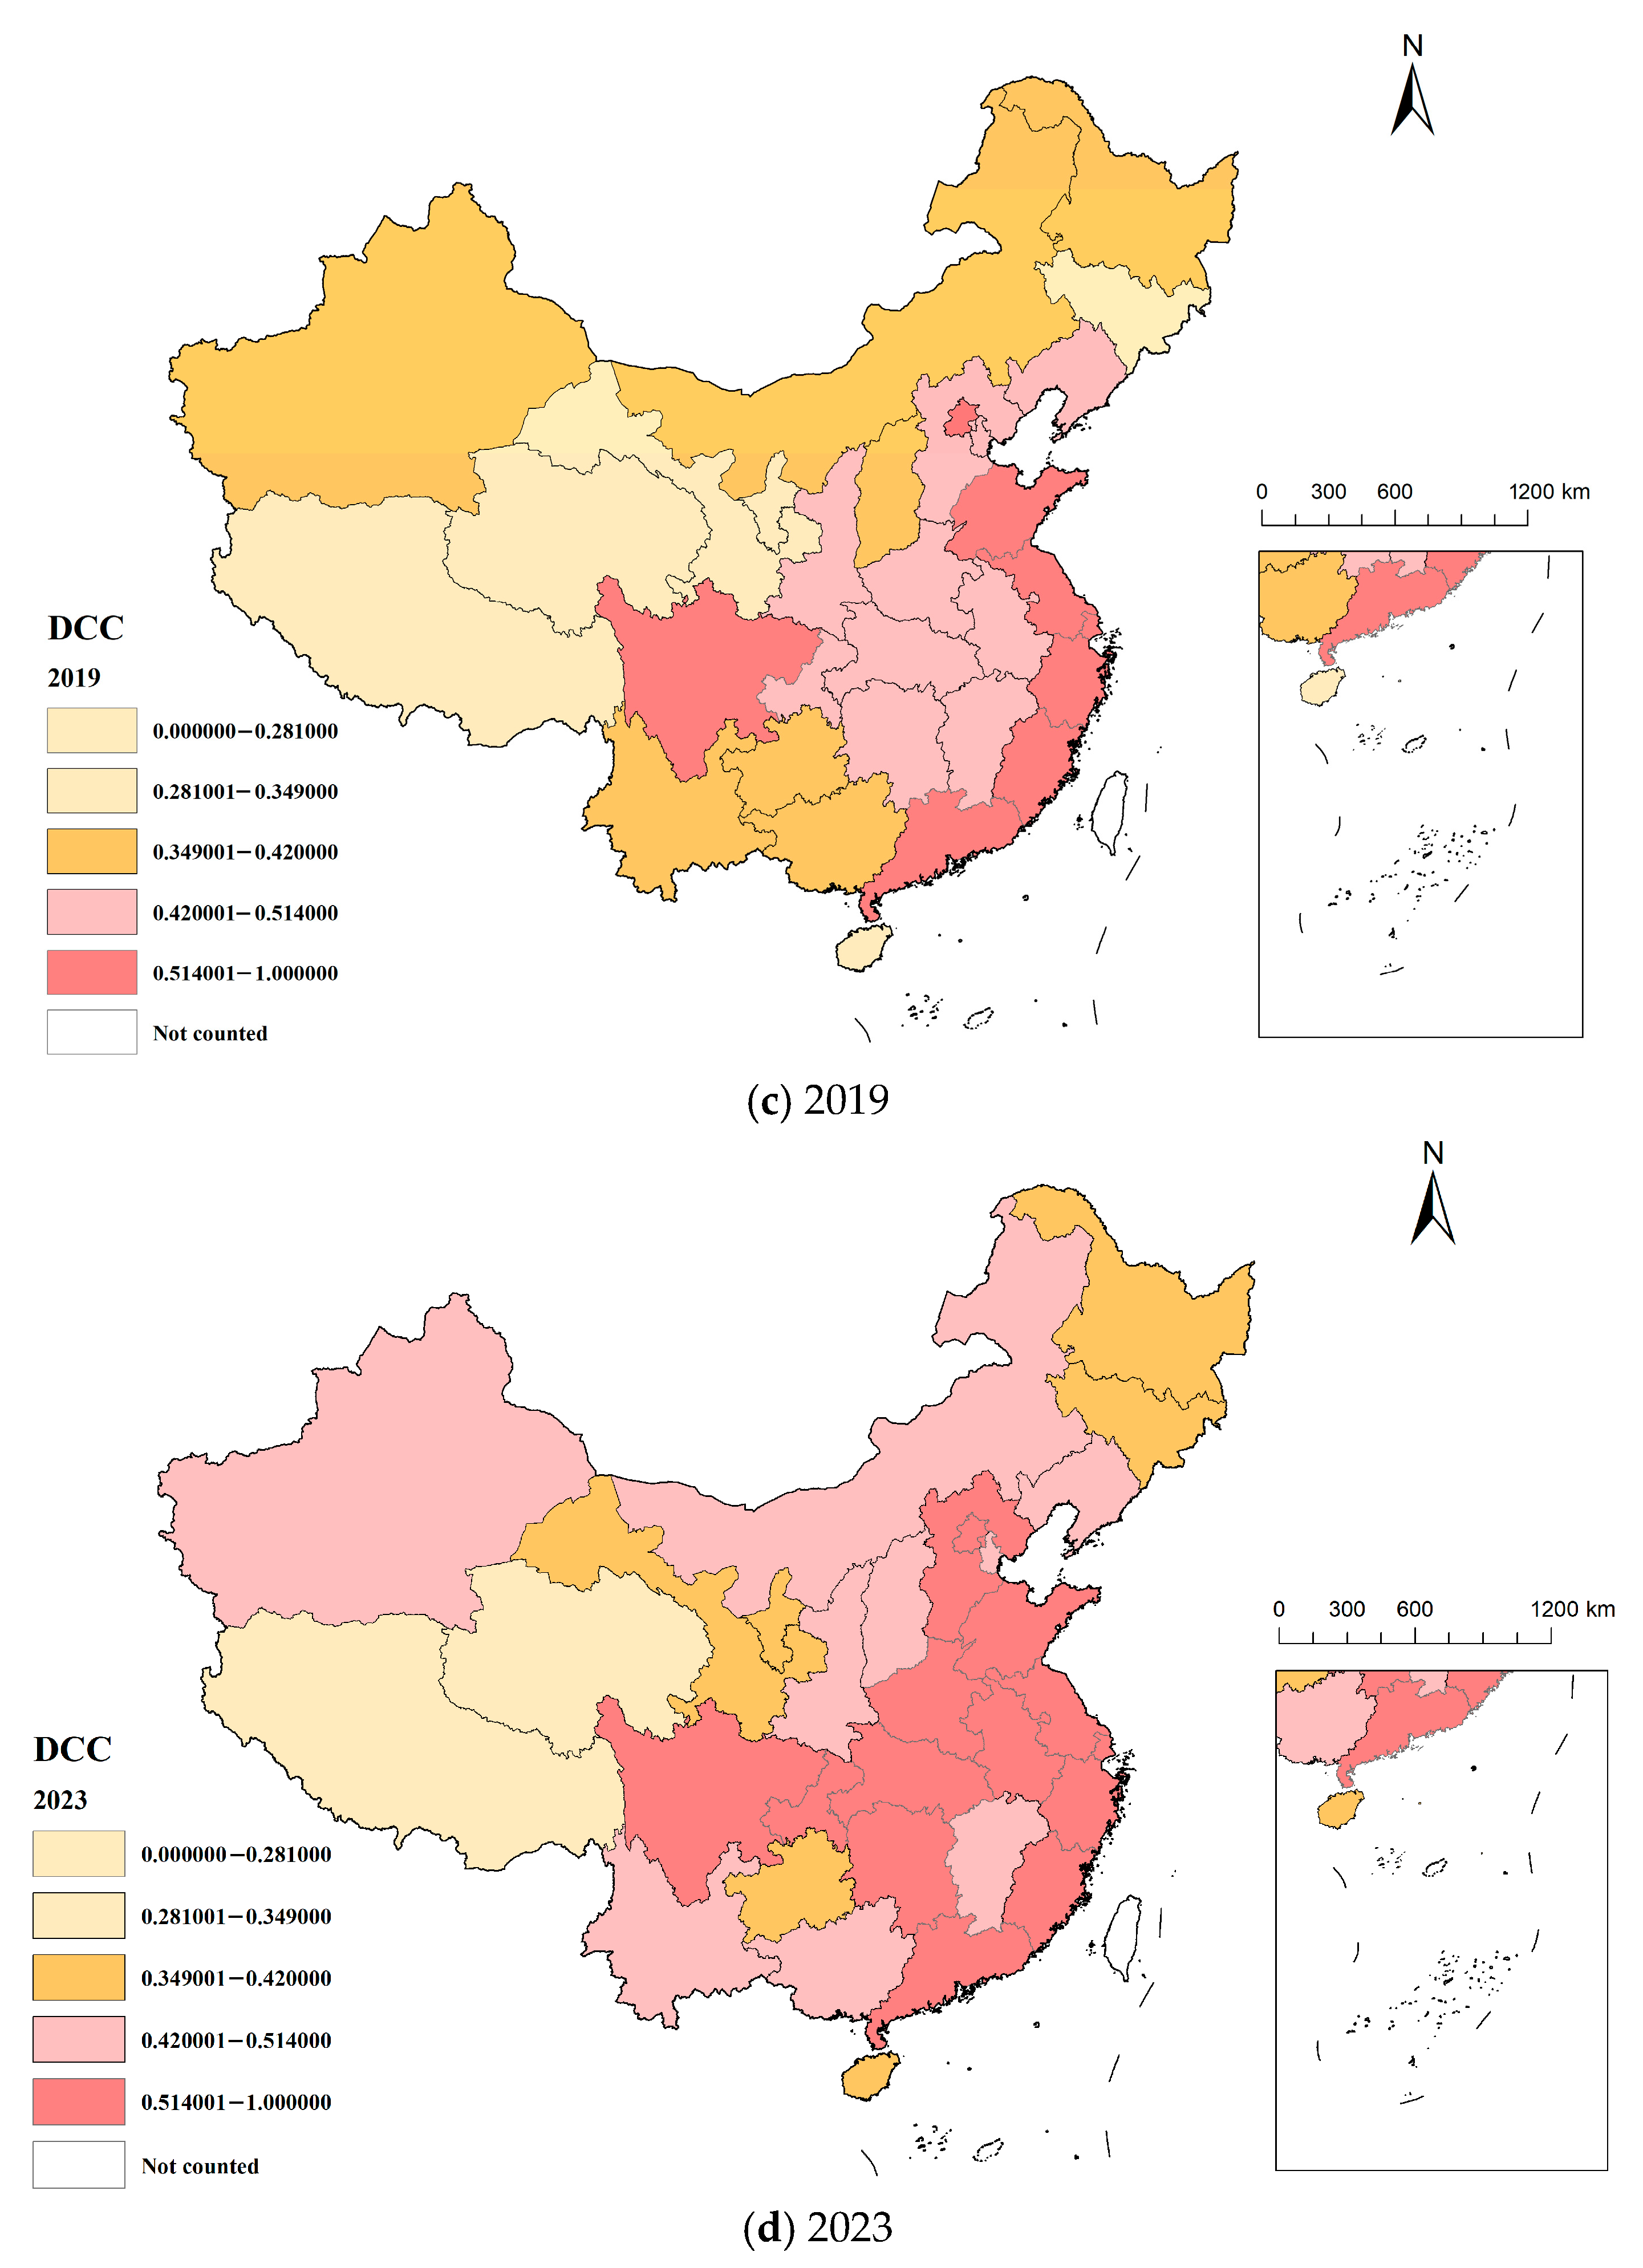
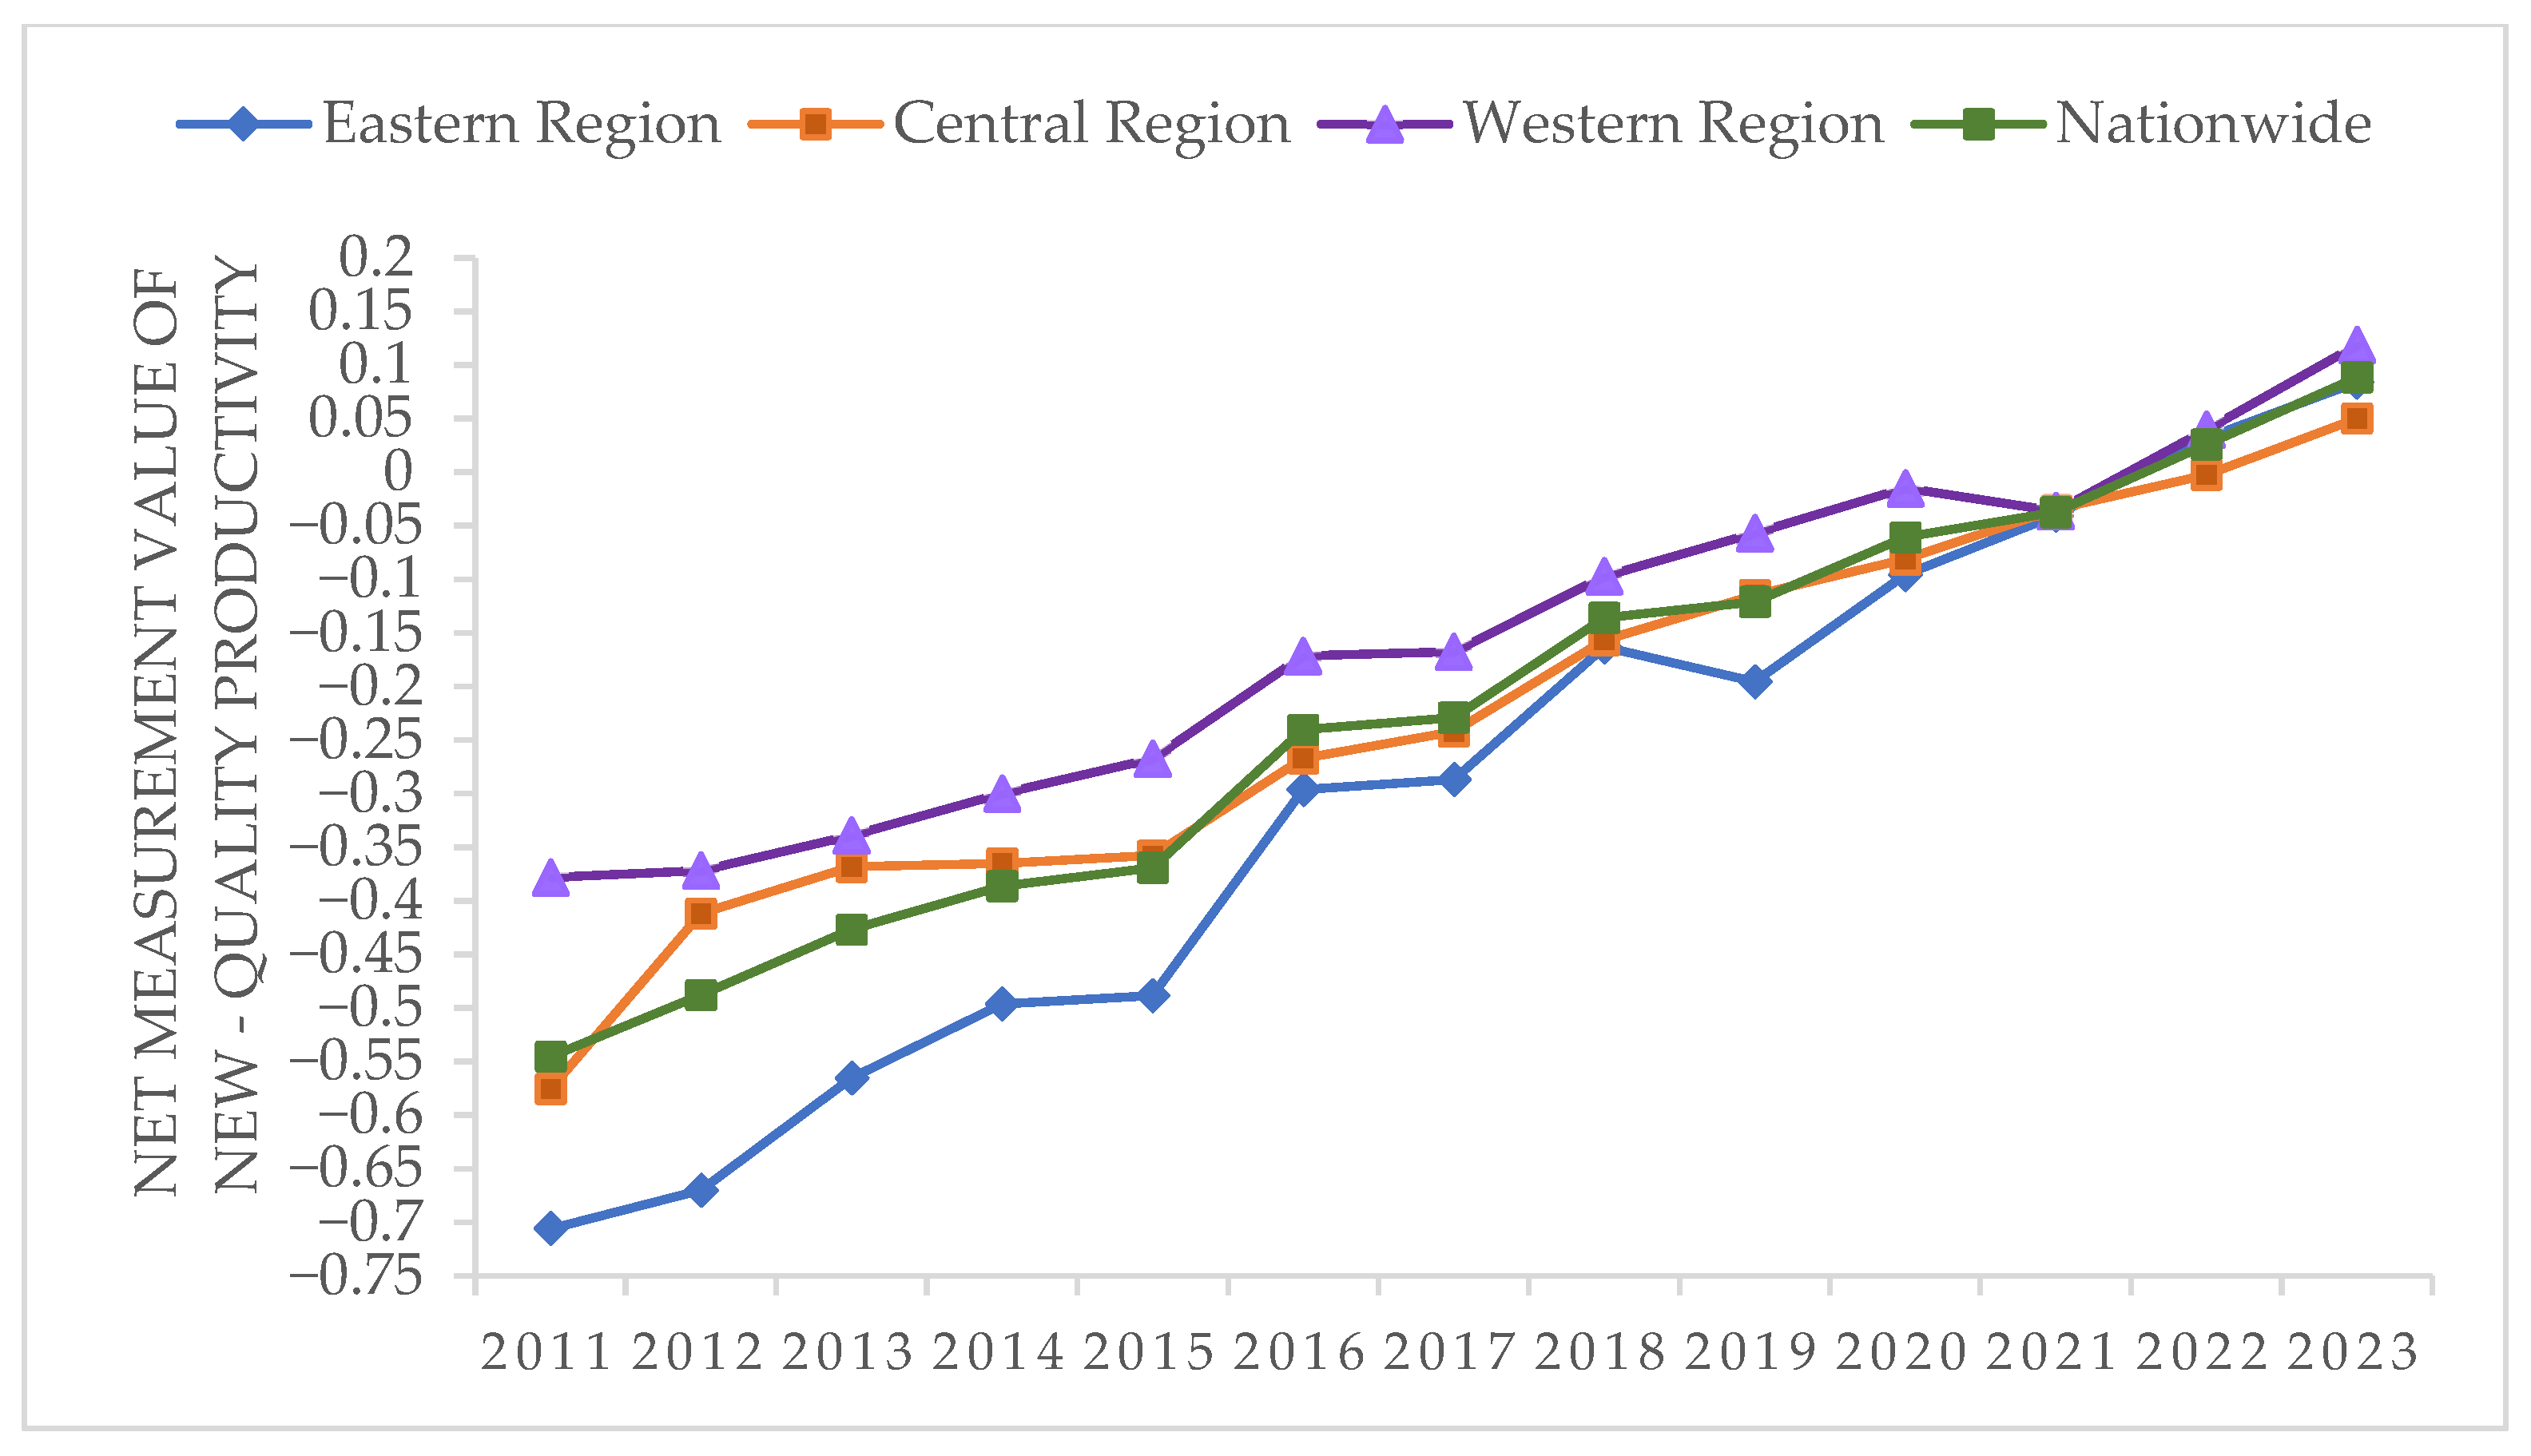
Disclaimer/Publisher’s Note: The statements, opinions and data contained in all publications are solely those of the individual author(s) and contributor(s) and not of MDPI and/or the editor(s). MDPI and/or the editor(s) disclaim responsibility for any injury to people or property resulting from any ideas, methods, instructions or products referred to in the content. |
© 2025 by the authors. Licensee MDPI, Basel, Switzerland. This article is an open access article distributed under the terms and conditions of the Creative Commons Attribution (CC BY) license (https://creativecommons.org/licenses/by/4.0/).