Article

External Resource Dependence and Implementation Efficiency of Education for Sustainable Development (ESD): A Hybrid Design Based on Data Envelopment Analysis (DEA) and Dynamic Qualitative Comparative Analysis (QCA)

Faculty of Humanities and Social Sciences, Macao Polytechnic University, Macao, China
*
Author to whom correspondence should be addressed.
Sustainability 2025, 17(9), 3809; https://doi.org/10.3390/su17093809
Submission received: 5 March 2025 / Revised: 14 April 2025 / Accepted: 16 April 2025 / Published: 23 April 2025

Abstract

:
Based on the urgency of education for sustainable development (ESD), it is crucial to explore ESD implementation efficiency. Since ESD is closely related to social resources, it is necessary to explore which resources can improve ESD implementation efficiency. This study employs dynamic qualitative comparative analysis (QCA) to explore the multiple development pathways of external resources supporting the implementation efficiency of ESD in 31 provinces of China from 2017 to 2022. The results indicate that abundant basic resource- (Type I), complementary technology–culture resource- (Type II), and culture–information technology educational resource-driven (Type III) approaches are the main pathways to achieve high ESD execution efficiency. A key contribution of this study is its emphasis on the role of modern information technology in ESD. The insights garnered from this study can guide educators in leveraging information resources effectively to optimize ESD outcomes.

1. Introduction

With the increasing prominence of environmental issues, the General Assembly of the United Nations adopted Transforming our World: The 2030 Agenda for Sustainable Development in 2015, proposing 17 Sustainable Development Goals (SDGs) to address the crisis caused by global issues. The fourth SDG, as the guiding goal of education for sustainable development (ESD), is to improve the quality of education and promote lifelong learning for all. Based on the cognitive–constructive function of education, the educational process can enable a broader population to understand the significance of sustainable development and transform current lifestyles to achieve the goal of societal sustainability [1,2]. For students, continuous learning helps stimulate their academic potential and maintain a strong intellectual curiosity. In some developing countries, the limited capacity of educators poses a barrier to cultivating well-rounded talents, which indicates that individual sustainable development cannot be achieved without the support of quality education [3]. Therefore, education plays a pivotal role in fostering sustainability at both the societal and individual levels. The implementation of the SDGs has been characterized by differences around the world, focusing on poverty, hunger, and water access in African countries, while education, industry, and innovation have been priorities in European societies [4]. At the same time, the role of interdisciplinary cooperation cannot be ignored. There is also research on the impact of urbanization on sustainable development efficiency at a local scale, which has revealed an association between the efficiency of Asian cities and the sociodemographic features of the regions to which they pertain [5]. These findings reflect the environmental and social challenges facing the current process of global urbanization. Some scholars have explored the implications of the plurality of perspectives on ESD practice, with findings highlighting the need for a nuanced approach to ESD that promotes sustainable development relevant to each community, taking into account the importance of student involvement in ESD and the limitations of current ESD programs in addressing the complexities of sustainable development [6]. Due to the connection between the utilization rate of educational resources and the quality of education, the exploration of ESD efficiency is of great significance for optimizing the use of limited resources [7]. However, not all regions have sufficient resources to support ESD. In this context, it is crucial to maximize the utilization efficiency of existing resources, especially in cases where resource ownership is limited. Furthermore, optimizing the allocation of educational resources ensures that remote areas and disadvantaged groups have access to high-quality educational resources, thereby narrowing the educational disparities between regions and genders to promote the achievement of SDG4 [8]. Recently, research on ESD implementation has widely examined perspectives such as curriculum development and collaborative multi-stakeholder initiatives [9,10]. Current research on efficiency primarily focuses on the nexus between economic development and educational assessment. For instance, network data envelopment analysis (DEA) has been employed to examine how enhancing the economic efficiency of educational systems contributes to sustainable social development [11]. There is research demonstrating that investigating open learning resources from a specific perspective can reveal their positive impact on enhancing learning experiences and improving administrative efficiency, thereby facilitating the promotion of SDG4 [12]. It is evident that there is a current lack of research exploring ESD efficiency from the perspective of resource input. Inefficiency in ESD not only poses a risk of resource wastage and exacerbates educational inequality, making it more difficult for disadvantaged groups to access high-quality ESD resources, but also delays global progress toward sustainable development. Therefore, monitoring the efficiency of the input and the output of ESD targets is important for the future optimization of resource allocation [13]. Taking China as an example, the country’s national financial investment in education has exceeded 4% of its gross domestic product (GDP) in the past ten years. This strong financial investment has achieved a more ideal popularization of compulsory education. Based on this, determining whether there is room to improve the efficiency of input and output is worthy of further study.
The implementation of ESD is dependent on multiple resources in the external environment, so SDG4 cannot be separated from the support of the social dimension. According to the resource dependence theory (RDT), there is an inevitable dependence between organizational survival and resources in the environment [14]. With its in-depth applications in various fields, information and communication technology (ICT) has a significant role in sustainable development. ICT not only drives sustainable development through technical advancements but also exerts substantial impacts across socioeconomic domains. For example, it facilitates the achievement of the SDGs by enhancing educational delivery, healthcare accessibility, and financial inclusion [15]. Empirical studies have demonstrated that the application of ICT significantly enhances teaching efficiency, increases student engagement, and facilitates personalized learning. Representative implementations include multimedia platforms and web-based educational resources, which have been shown to optimize knowledge delivery and cognitive absorption [16]. In higher education, ICT application primarily focuses on pedagogical innovation and the enhancement of student academic performance [17]. However, its role plays in ESD and whether it promotes ESD together with other resources are worthy of further study [18]. This study will take educational informatization resources as an external resources to explore the resource-dependent development mode of ESD implementation efficiency. Higher education institutions (HEIs), as key platforms for talent development, maintain the most direct circulation of talent exchange with society. HEIs play a pivotal role in advancing sustainable development by integrating sustainability principles into policy frameworks, curricular design, research agendas, and campus operations [19]. Concurrently, it is imperative to acknowledge the transformative advantages of ICT in higher education, as evidenced by enhanced administrative management systems, optimized student learning experiences, and the development of robust digital learning platforms—all of which contribute substantively to elevating educational quality [20]. However, many developing countries continue to face systemic challenges, including inadequate ICT infrastructure and acute shortages of skilled technical personnel, which hinder effective implementation [21]. Therefore, HEIs’ information construction resources should be included in research on factors affecting ESD implementation efficiency.
Given that the fundamental content of SDG4 encompasses sustainable development across multiple domains, including basic education, preschool education, and vocational education, this study specifically focuses on its sub-target, SDG4.3, to construct the research framework. Based on the existing literature and ESD development status, this study aims to explore the resource-dependent mode of ESD in China from the perspective of implementation efficiency using RDT as the theoretical foundation, which can address the lack of discussion of ESD efficiency in existing studies. By bridging macro-level resource constraints with micro-level execution strategies, this research advances the discourse on equitable and scalable ESD implementation under the SDG4 agenda. The primary objectives of this study are as follows. First, from the perspective of ESD implementation efficiency, dynamic qualitative comparative analysis (QCA) is employed for configuration analysis to address the limitation of traditional QCA in neglecting temporal dimensions. This approach aims to refine multiple pathways for efficient ESD execution and further enrich ESD theory. Second, this study seeks to fill the research gap regarding ESD implementation efficiency. Third, since the efficiency of ESD implementation depends on the supply of various social resources, different combinations of resources can achieve similarly ideal ESD implementation efficiencies. This work investigates diverse developmental pathways reliant on external resources [22].

2. Literature Review

2.1. ESD and ESD Implementation Efficiency

Since the concept of ESD was proposed, various countries and regions have formulated relevant policies to promote the realization of ESD goals, and the level of policy formulation and implementation is the main focus of existing research [9]. A study explored ESD trends and characteristics across countries through case studies to make recommendations for subsequent policy framework revisions [23]. From the perspective of policy implementation, scholars have carried out rich discussions on ESD development status at different education stages [24,25]. Research suggests that the goal of ESD in basic education should emphasize equal educational opportunities [26]. By cultivating students’ critical thinking and lifelong learning abilities, combined with traditional disciplinary knowledge, this approach enhance their awareness of the sustainable development of natural resources, thereby contributing to the achievement of the SDGs [27,28]. Simultaneously, the advancement of ESD necessitates comprehensive consideration of regional characteristics and cross-sectoral collaboration to address sustainable development challenges [29]. Current ESD implementation studies focus on micro-level outcomes, with limited attention paid to efficiency analysis.

2.2. Related Applications of RDT

RDT, a key concept in organizational theory, reveals that there is an interdependent relationship between organizational development and external resources [14]. An organization’s resource dependence is determined by resource scarcity and substitutability. This theory has been widely used in the field of management. At present, most studies take RDT as the theoretical basis to explore the relationship between organizational structure and performance [30]. In the context of sustainable development, one study has shown that resource development can curb carbon emissions in resource-based cities [31]. In countries with abundant resource, excessive resource dependence has gradually increased environmental pressure, so the proper use and efficient management of natural resources are essential for future sustainable development [22]. Deslatte and Stokan’s study examines local government economic activities within the broader realm of sustainable development. Their findings suggest that cities prioritizing job-recruitment initiatives tend to exhibit lower commitments to overall sustainability policies. These results reveal the priority hierarchies within local governance that influence sustainability efforts, offering valuable insights for urban scholars and policy makers aiming to enhance sustainable practices in cities [32]. Since ESD implementation depends on multiple resources in the external environment, the efficiency of implementation may be affected by them. Therefore, this study will take RDT as the theoretical basis to find the development model to improve the efficiency of ESD implementation.

3. Research Design

This study constructs its research framework based on RDT for the following considerations. In the implementation process of ESD policies, key connections emerge with core RDT elements, including external resources, multiple stakeholders, and the adaptability of implementing entities to their environments. ESD development inevitably requires resource support, while education maintains direct and indirect linked to various levels of society. These interrelationships create diversified resource acquisition channels for supporting ESD policy implementation. Furthermore, based on the perspective of RDT that entities controlling critical and indispensable resources possess greater influence. This study argues that when implementing bodies can flexibly adjust their strategies to manage dependencies on various resources. They are capable of addressing power distribution relationships across different sectors and adapting more efficiently to external environmental changes during implementation, thereby improving implementation effectiveness. Exploring effective models for implementing ESD policies is one of the research objectives of this study. Therefore, RDT provides theoretical support for understanding the transition single-resource dependency to multi-resource dependency.
Aligned with the research objectives, this study will be carried out in the following steps: First, the ESD implementation efficiency discussed in this study refers to the input–output ratio based on the ESD-oriented guidelines in Chinese and international policy texts. Therefore, this study uses DEA to measure ESD implementation efficiency in 31 provinces in China from 2017 to 2022. Secondly, to reveal the external resource combination mode that ESD implementation efficiency depends on, this study will use the dynamic QCA method to analyze the complex causal relationship behind it from both time and case perspectives [33]. The ESD implementation efficiency calculated by DEA will be used as the outcome variable in the subsequent dynamic QCA method, while the condition variable will be selected from the social resource level according to the existing research and policy texts. Finally, based on the obtained configuration results, this study will summarize the multiple development paths to improve ESD implementation efficiency from the perspective of resource dependence.

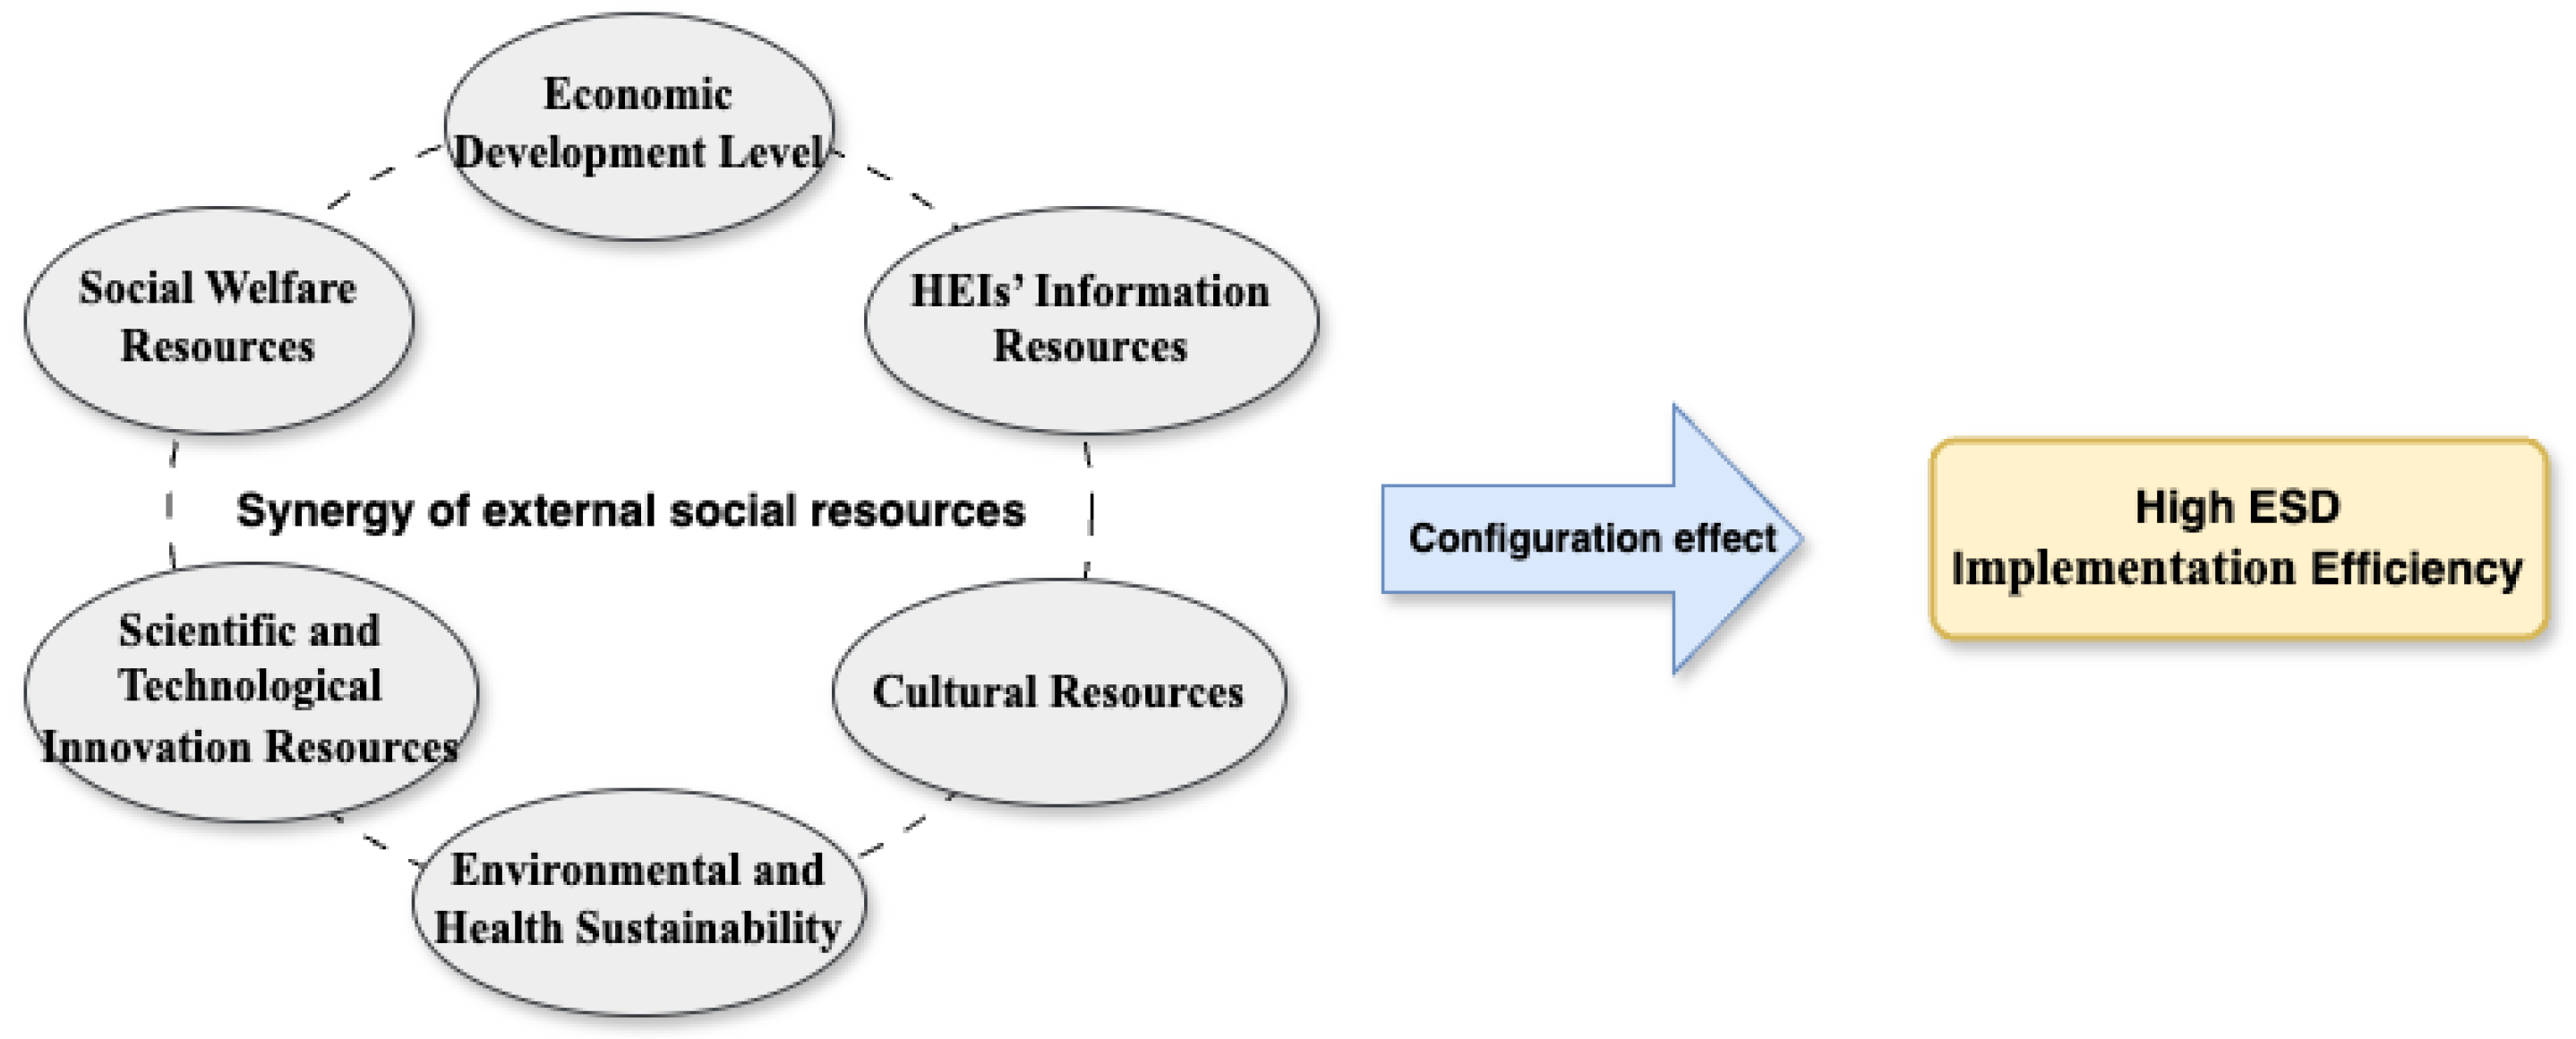
3.1. Research Framework

Due to the diversified characteristics of the subjects involved in ESD implementation, it means that the efficiency of ESD implementation may be affected by a variety of factors. In order to explore how the combination of multiple resources affects the efficiency of ESD implementation, this study selected six variables as condition variables from the social resource dimension that potentially impact on ESD implementation (Figure 1).

3.2. Variable Description: Condition Variables

RDT emphasizes establishing inter-organizational collaborative relationships. As key implementers of ESD policies, educational institutions inevitably rely on resources from the external environment. This theory facilitates close connections between educational institutions at all levels and other social organizations, such as government agencies. Therefore, RDT can provide a new perspective for the development of ESD, helping schools efficiently manage internal and external resources. Enhancing the utilization efficiency of limited resources, adjusting dependency relationships, and strengthening collaborative exchanges among organizations, it contributes to enhancing educational quality and further promotes the achievement of ESD goals. Based on this logic and existing literature, in this study, six condition variables were selected, namely economic development level (EDL), social welfare resources (SWR), scientific and technological innovation resources (STIR), environmental and health sustainability (EHS), cultural resources (CUR) and HEIs’ information resources (HIR).
As the material foundation of social modernization, economic development significantly influences the pace of educational expansion [34]. There exists a mutually reinforcing relationship between economic development and educational advancement. Economic growth provides increased public and private resource support for education, while the development of education, positively contributes to economic productivity [35]. Countries with advanced economic development can provide more extensive educational opportunities; enabling economic resources to substantially affect educational equity and resource allocation [36]. Regions with robust economic development tend to invest more for education, facilitates timely upgrades of teaching resources and campus infrastructure construction, indirectly enhancing the quality of education [37]. Based on the perspectives of Glomm and Kaganovich, there exists a complex and non-linear relationship among social security, public education, and economic growth. The allocation of government expenditures on public education and social security may influence educational outcomes and economic growth rates [38]. However, some studies suggest that social security can indirectly promote educational equity by improving people’s health conditions [39]. Therefore, this study incorporates EDL and SWR as condition variables to explore their impact on the efficiency of ESD policy implementation. Since environmental and healthcare resources provide momentum and foundational conditions for overall societal sustainable development and help citizens adopt healthy lifestyles, they offer effective support for advancing ESD [40]. Consequently, there may exist a complex and close relationship between these factors and ESD, which is fundamentally based on environmental education. Furthermore, an equitable social environment helps reduce social inequities and may potentially promote citizens’ access to fair educational opportunities, aligning with the basic connotation of ESD goals. The widespread application of artificial intelligence and other technologies in education creates new opportunities for optimizing educational resource allocation. For example, human–computer interaction can balance the allocation of educational resources and improve the quality of education [41]. Therefore, STIR and EHS were selected as condition variables. Bilgen and Sarıkaya systematically elucidated the intricate connections among environment, ecology, and sustainable development, emphasizing that optimizing energy systems and promoting renewable energy technologies can significantly advance sustainable development [42]. Cultural elements are closely related to the development of all dimensions of society, which can promote social integration and play an important role in the process of SD [43,44]. International council on monuments and sites (ICOMOS) has long highlighted the prominent role of elements such as cultural heritage in sustainable development, as they contribute to the achievement of SDG11 by enhancing community resilience and cultural diversity [45]. At the level of ESD, fostering cross-cultural communication and understanding is instrumental in cultivating a globally minded next generation [46]. Consequently, the role of culture in advancing ESD cannot be overlooked. This study incorporates CUR as a condition variable. The advancement of digital education can effectively balance educational resources, and open educational resources provide diverse learning opportunities for students of different ages [10]. HEIs maintain the most direct talent circulation with society, driving macroeconomic growth and technological innovation [47]. Based on the key position and powerful influence of HEIs, this study takes the information resource reserve of higher education stage as a condition variable for configuration analysis.

3.3. Variable Description: Outcome Variable (ESD Implementation Efficiency)

Given the absence of a standardized evaluation framework for ESD and significant regional development disparities, this study will be based on international policy texts, China’s existing education policies, and the current development situation. Based on existing policy texts regarding the inputs and outputs required for the implementation of ESD policies, this study further selects specific input and output indicators. By analyzing these policy contents, it is evident that human resources, financial resources, and material resources constitute the primary dimensions for advancing ESD. This study will focus on these dimensions to select input indicators. Table 1 lists specific content related to human resources, financial resources, and material resources as mentioned in relevant policy texts. Through reviewing the policy texts such as Transforming our World: The 2030 Agenda for Sustainable Development, The Education 2030 Framework for Action and China’s Education Modernization by 2035, it was found that the establishment of a sustainable education system with adequate teachers, adequate education funds per capita and perfect education facilities is an important basis for promoting ESD process.
Table 1. ESD policy implementation input and output index selection basis.
Policy TextReference ContentDimensions of Input Required for ESD Development
Education at a Glance 2022: OECD Indicators [48]“There exists a statistically significant association between educational resource inputs—including fiscal funding allocations, human capital investments, and infrastructure development—and systemic educational outputs.”human resources, financial resources
The Education 2030 Framework for Action [49]“It requires relevant teaching and learning methods and content that meet the needs of all learners, taught by well-qualified, trained, adequately remunerated and motivated teachers, using appropriate pedagogical approaches.”
“We therefore are determined to increase public spending on education in accordance with country context, and urge adherence to the international and regional benchmarks of allocating efficiently at least 4–6% of Gross Domestic Product and/or at least 15–20% of total public expenditure to education.”
“Every learning environment should be accessible to all and have adequate resources and infrastructure
to ensure reasonable class sizes and provide sanitation facilities.”
human resources, financial resources, material resources
China’s Education Modernization by 2035 [50]“Open educational resources and conducive learning environments are pivotal in fostering a lifelong learning society, as they democratize knowledge access and sustain intellectual engagement across age groups.”
“It is imperative to establish a standardized system centered on faculty allocation, per-student funding, and teaching facility optimization, aligned with talent development objectives.”
human resources, financial resources, material resources
Education for sustainable development in action: learning & training tools [51]“Hiring more teachers and strengthening teacher training can contribute to sustainable development.”
“ESD is inseparable from interdisciplinary cooperation, and new teaching technologies (distance learning, etc.) can support its development, and governments and educational institutions can purchase relevant equipment”
human resources, material resources
Based on the evaluation of education quality and education equity in relevant studies, as well as data availability, this study selects input indicators from three perspectives: human, financial and material resources [52,53,54]. For human resources, this study chooses teacher–student ratio as an input indicator, as it reflects the quality of education. In accordance with the minimum educational qualifications of teachers at all levels and types of teachers in the Teachers Law of the People’s Republic of China (hereinafter referred to as the “Teachers Law”), the proportion of full-time teachers with academic qualifications which is higher than the required one is selected to supplement the human resources input to measure the quality of education [55,56]. In terms of financial resources, education funding is often considered as a measure of the degree of education security at the economic level. In this study, per student public budget education expenses and the proportion of public budget education expenses to public budget expenditures are used to evaluate ESD financial input. In terms of material resources, teaching hardware facilities and book resources provide a solid foundation, reflecting the guarantee of education conditions and the reserve of learning resources. Therefore, this study chooses amount of teaching equipment per student and number of books per student to represent ESD material input.
When it comes to ESD implementation output, this study measures the overall quality of the population according to SDG4 content. Since the education level of the population is a key factor for sustainable development, reducing the illiteracy rate and addressing gender inequality in education are main components of ESD goals. This study uses the population with at least high school as the expected output index. The absolute value of difference in educational attainment ratio between the sexes and the illiteracy rate of population over aged 15 are used as undesirable outputs indicators.

4. Methodology

4.1. The DEA Approach

DEA is a non-parametric evaluation method used to evaluate the decision-making efficiency of decision making units (DMU) [57]. But the traditional DEA model (CCR and BCC) cannot measure the slack variable part. In order to be able to take into account slack variables, take into account expected and undesirable outputs, and better distinguish effective DMUs, this study will use super-efficiency SBM-DEA to evaluate the efficiency of ESD implementation in 31 provinces of China during year 2017–2022 [58]. In Equation (1), ρ is the efficiency value, and m ,   s 1 ,   s 1 are the index quantity of input, expected output and undesirable output. j = 1 , j 0 n x i 0 , j = 1 , j 0 n y k 0 , j = 1 , j 0 n z t 0 , represents the input, expected output and undesirable output matrix. λ is the weight variable, S i x , S k y , S t z represent the slack variables of input, expected output, and undesirable output.
m i n ρ = 1 1 m i = 0 m S i x X i 0 1 + 1 s 1 + s 2 k = 1 s 1 S k y y k 0 + t = 1 s 2 S t z z t 0
s . t . x i 0 j = 1 , j 0 n λ j x j + S i x   ( i = 1 , m ) y k o j = 1 , j 0 n λ j y j S k y   ( k = 1 , s 1 ) z t 0 j = 1 , j 0 n λ j z j + S t z   ( t = 1 , s 2 ) S i x 0 , S k y 0 , S t z 0 , λ j 0   ( j = 1 , n , j 0 ) j = 1 , j 0 n λ j = 1
Traditional DEA compares efficiency by measuring inputs and outputs, where cases with fewer inputs accompanied by more outputs are typically considered “efficient”. However, traditional DEA models cannot further compare the efficiency levels among these “efficient cases”, whereas super-efficiency models address this limitation. Additionally, SBM (Slack-Based Measure) models can identify wasted resources through slack variables. Leveraging the advantages of super-efficiency SBM-DEA, this study adopts it to evaluate ESD efficiency.

Data Selection and Analysis Procedure

According to the input–output index system established in Section 3.2, this study first sorted out all the required secondary index data and used the entropy method to calculate the weight. And then calculated a new index data according to the weight and organized it into a balanced panel format. The entropy method process is presented in Section 4.2.1. Finally, the super-efficiency SBM-DEA model in software MaxDEA 9 is used for analysis, and the static efficiency value of each DMU is obtained, which is the outcome variable in the subsequent dynamic QCA.

4.2. Dynamic QCA Method

QCA attempts to explore complex causal relationships between combination conditions and outcome variables. Traditional QCA only considers the configuration effect from the perspective of cases and lacks a temporal dimension to analyze changing trends of antecedents. Therefore, this study employs the dynamic QCA method using R Studio version (2023.12.0+369) to comprehensively explore the dynamic development process of ESD implementation efficiency from both the perspective of time and case. Dynamic QCA is judged from three perspectives: pooled, between and within, and the changing trend of consistency is investigated by consistency adjustment distance [59].

4.2.1. Data Preparation

According to the input and output indicators selected in Section 3.3 for evaluating ESD implementation efficiency, the secondary input indicators included seven education stages, namely: HEIs (undergraduate), senior high school education, secondary vocational school, junior high school education, primary school education, preschool education and special education. Under the indicator of teacher–student ratio, this study excludes HEIs (undergraduate), preschool education and special education, for the following reasons. Due to variations in teaching models and characteristics across different educational stages, the student-teacher ratio standard cannot be directly compared across these stages. Forcing it into a unified framework may result in reduced explanatory power of the indicator. In HEIs, disciplinary differences lead to diverse teaching modes such as large-class lectures and tutorial systems. In most regions of China, preschool education has not been incorporated into the compulsory education stage; moreover, there are significant differences between public and private institutions regarding teacher staffing standards and quality assessment systems, making horizontal comparisons challenging [60]. Due to heterogeneity in types of disabilities, care requirements, and students needs, special education institutions’ statistical standards for student-teacher ratios vary across regions (e.g., whether to include therapists and other auxiliary staff) [48]. For the index of “the proportion of full-time teachers with academic qualifications which is higher than the required one”, this study chooses education stage with clearly defined qualification requirements in the Teachers Law for measurement. Additionally, since special education is a relatively small part of the overall education system, it is not listed as a separate category in official government statistics. The secondary index of “per student public budget education expenses” in this study also excludes the special education stage. Since official statistics lack specific data on public budget education expenditures and public budget expenditures for educational institutions at all levels, no secondary indicator was established for another indicator of financial resources. Under the index of “amount of teaching equipment per student”, preschool education and special education are not included because of their own characteristics.
Table 2 presents the input and output indicators and their data sources for evaluating ESD implementation efficiency. Table 3 shows the detailed indicators and data sources for the condition variables.
Based on the research purpose and considering that ESD processes are usually discussed at the country or region level, this study adopts a provincial perspective to provide theoretical support for policy makers from different regions. At the same time, taking one year lag of SDGs proposed by the United Nations as the starting point of this study, panel data of 31 provinces in China from 2017 to 2022 are taken as samples. The condition variable data were obtained through the following procedure: First, the data are preliminarily sorted out according to the condition variable selected in Section 3.1. Then, the entropy method to determine index weights and eliminate the influence of dimension. Finally, the weighted data were incorporated into the dynamic QCA analysis. The outcome variable is the efficiency value of the last part of the super-efficiency SBM-DEA. The specific calculation formula of the entropy method is as follows, and the weight calculation results of condition variables are shown in Table 3.
First, the indicators are standardized. The standardization process of positive indicators is as follows:
X i j * = X i j X m i n X m a x X m i n
Standardization process of negative indicators:
X i j * = X m a x X i j X m a x X m i n
Suppose there are m evaluation indicators and n evaluation objects. X i j represents the i evaluation object of the j index ( i = 1, 2,…… m , j = 1,2,…… n ), X i j * is the value obtained after normalization, and X m i n and X m a x are the minimum and maximum values in this index.
Secondly, calculate the proportion of the i evaluation object of the j index:
P i j = X i j * i = 1 m X i j *
Thirdly, the information entropy of item j is calculated:
e j = 1 l n m × i = 1 m ( P i j × l n P i j )
Finally, calculate the weight of each indicator:
w j = 1 e j j = 1 n 1 e j

4.2.2. Calibration

Calibration is a critical step in transforming raw data into membership scores ranging from 0 to 1, with anchor point selection directly influencing result robustness. According to Ragin’s direct calibration method, the typical choice for calibration anchors includes sets such as (0.95, 0.5, and 0.05; or alternatively, 0.75, 0.5, 0.25). The former set proves suitable when research data exhibit few extreme values [33]. Based on the data characteristics of this study, a direct calibration method was used and three thresholds (0.95, 0.5, and 0.05) were selected to represent full affiliated, crossover, and full unaffiliated. Table 4 shows the calibration thresholds for each variable.

5. Results

5.1. Super-Efficiency SBM-DEA Results

MaxDEA 9 software was used to calculate the ESD implementation efficiency of each province after calculating the input index and output index (Table 5).

5.2. Necessity Analysis of Individual Conditions

When the consistency is greater than 0.9 and the coverage is greater than 0.5, the condition variable is a necessity condition. In dynamic QCA, when the consistency adjustment distance is less than 0.2, which means a high accuracy, and it is necessary to further explore its necessity [59]. As shown in Table 6, since the pooled consistency of all condition variables is less than 0.9 and the consistency adjustment distance is less than 0.2, there is no necessary condition.

5.3. Configuration Analysis

The construction of a truth table forms the basis for analyzing the sufficiency conditions in dynamic QCA. According to previous studies and the case characteristics of this study, the consistency threshold is set as 0.85, the PRI consistency threshold as 0.75, and the frequency threshold as 1 [33]. Finally, the core and edge conditions in each configuration path are found according to the obtained simple and intermediate solutions (Table 7).

5.4. Results and Discussion

According to Table 7, the pooled consistency of the configuration with high ESD implementation efficiency is 0.885 (greater than 0.75) and the pooled coverage is greater than 0.5. The BECONS distance and WICONS distance of each configuration are less than 0.2. This means that the obtained configuration results have good explanatory power [33].

5.4.1. Pooled Results

Based on the configuration characteristics, the results can be categorized into three developmental types.
Type I: abundant basic resources. In configuration 5, EDL and SWR serve as core conditions, while STIR exist as marginal condition. ESD development requires substantial financial support and strong scientific–technological innovation capacity [62]. Environmental and ecological sustainability constitutes a key component of the SDGs. EHS measures can reduce environmental pollution, enhance resource utilization, maintain biodiversity, indirectly promote the development of green economy, and good health conditions help improve citizens’ quality of life. Thus, these factors contribute to enhanced public participation in sustainable social development processes [63,64]. In addition, enhanced environmental governance capacity can significantly improve public environmental awareness. Environmental education-based ESD development may be positively affected [65]. The typical case of this development type is Hunan province, which has numerous resource-based cities. Under the dual constraints of limited resources and urgent environmental pollution issues, these resource-based cities prioritize ecological civilization construction as a key focus to maintain ecological balance. By altering their development structure to achieve diversified industrial development and sustainable growth, they indirectly promote the efficiency of ESD.
Type II: complementary technology–culture resources. STIR and CUR serve as the sole core conditions in configuration 3 and 1. Scientific and technological innovation can effectively enhance teaching means, optimize the teaching evaluation system, and overcome traditional educational resources limitations [66]. Taking Guangdong province as an example of Type I, China’s largest economic province, the innovation ecosystem with technology research, achievement transformation, and science and technology finance as the core power into science and technology innovation in Guangdong. Supported by robust economic-technological innovation, the province is establishing an equitable, high-quality education system that consequently improves ESD implementation. While configuration 1 is represented by Yunnan province with multi-ethnic culture, the relatively underdeveloped economic conditions. Notably, this economic disadvantage has not substantially impeded ESD development. As one of the global development trends, cultural integration has a mutually reinforcing relationship with sustainable development, so cultural diversity education has been adopted as one of the main contents of ESD in many countries [67]. In China’s context, STIR and CUR not only enhance ESD efficiency but also exhibit a complementary relationship.
Type III: culture and information technology educational resources driven. HIR and CUR emerge as core conditions in configurations 2 and 4, playing an important role in enhancing ESD implementation efficiency. In the context of globalization, cultural diversity plays an increasingly important role in ESD development. The rich regional cultural characteristics enable ESD practice to carry out localized innovation [67,68]. Concurrently, digital infrastructure development enables educational resource sharing and innovative tool creation, establishing comprehensive lifelong learning systems [69,70]. At the same time, HEIs’ information resource capacity directly correlates with sustainable talent training. Thus, exploring their practical contributions to ESD and sustainable development can provide insights for efficiently achieving SDGs. Take Liaoning province as a typical case in configuration 2. Dalian University of Technology (DUT), as one of the earliest universities in China to develop digital teaching platform, DUT has significantly advanced its digital infrastructure. The establishment of its digital academy marks the innovation of the digital education model of DUT.

5.4.2. Between-Group Results

The results of between-group analysis complement traditional QCA’s cross-sectional findings. As can be seen from Table 5, the BECONS distance of the 5 configurations are all less than 0.2, which means that there is no significant temporal effects. However, deeper examination of configuration consistency levels reveals that two configurations experienced initial declines followed by rebounds between 2017 and 2019. The reason may be that in the early stage after the proposal of SDG4, ESD development in various regions was in the exploration stage, and the development path was not fully formed, so the interpretation of the configuration fluctuated. Also, most configurations exhibited sharp declines in 2020 (Figure 2), with particularly significant consistency reductions in configurations 1, 4, and 7. Such concentrated fluctuations are not random and therefore not the result of a benign bias. The outbreak of COVID-19 in 2020 has put the economy at risk of recession, and more social resources are mainly provided to support public health problems [71]. At the same time, due to the sudden transformation of online teaching mode, it is difficult to guarantee the quality of online teaching in some areas of China (especially those with relatively backward network information technology), and the digital divide exacerbates the inequality of educational resources [72,73]. Due to the spatial disparities in the distribution of digital resources in China, issues such as the digital divide persist during the rapid advancement of computerization [74]. In less developed regions of China, challenges such as insufficient technological infrastructure, funding shortages, and lower policy implementation capabilities result in significant disparities in technology access and utilization compared to other areas [75]. These disparities were also found among regions of China, with those distributed along China’s eastern coast presenting the highest ICT levels, whereas provinces in the west present very low ICT levels [76]. Consequently, the ESD implementation efficiency patterns likely underwent transformation during this online learning transition period. Nevertheless, by 2021, all configurations achieved between-group consistency scores of 0.75, demonstrating robust interpretive validity.

5.4.3. Within-Group Results

Table 6 demonstrates that all five configurations exhibit WICONS distances below 0.2, indicating statistically equivalent interpretive strength across configurations. Consequently, it is necessary to explore the within-group coverage and regional distribution coverage of each configuration for cases. As dynamic QCA lacks established solutions for this analytical challenge, this study adapts the Kruskal–Wallis rank-sum test methodology from prior research. According to Table 8, the coverage of configurations 1, 3, 4 and 5 did not show significant differences in regional distribution (east, central, west and northeast), while there were significant differences in configurations 2 (Table 9). Configuration 2 is mainly distributed in the western and central regions, and the significant differences are mainly caused by regional characteristics.
First, cultural diversity in the central and western regions, the protection of characteristic buildings, intangible cultural heritage, and the development and utilization of other cultural resources occupy an important position in the ESD development path. Second, due to the relatively backward economy and less diversified industrial structure in the western region compared to the eastern region, the economic development resources in western region are lacking, which affects the ESD implementation efficiency to a certain extent [77]. HIR serves as the core condition, which means the digital information technology to break the temporal and spatial constraints. And it could optimize educational resources and promote educational equity. Therefore, information resources have played a prominent role in advancing ESD in regions with limited material resources. Finally, the absence of EHS in this configuration does not affect the results. However, the western region has more abundant natural resources. If these resources can be developed and utilized to foster regional economic coordination and ecological education, they may indirectly enhance ESD implementation [78].

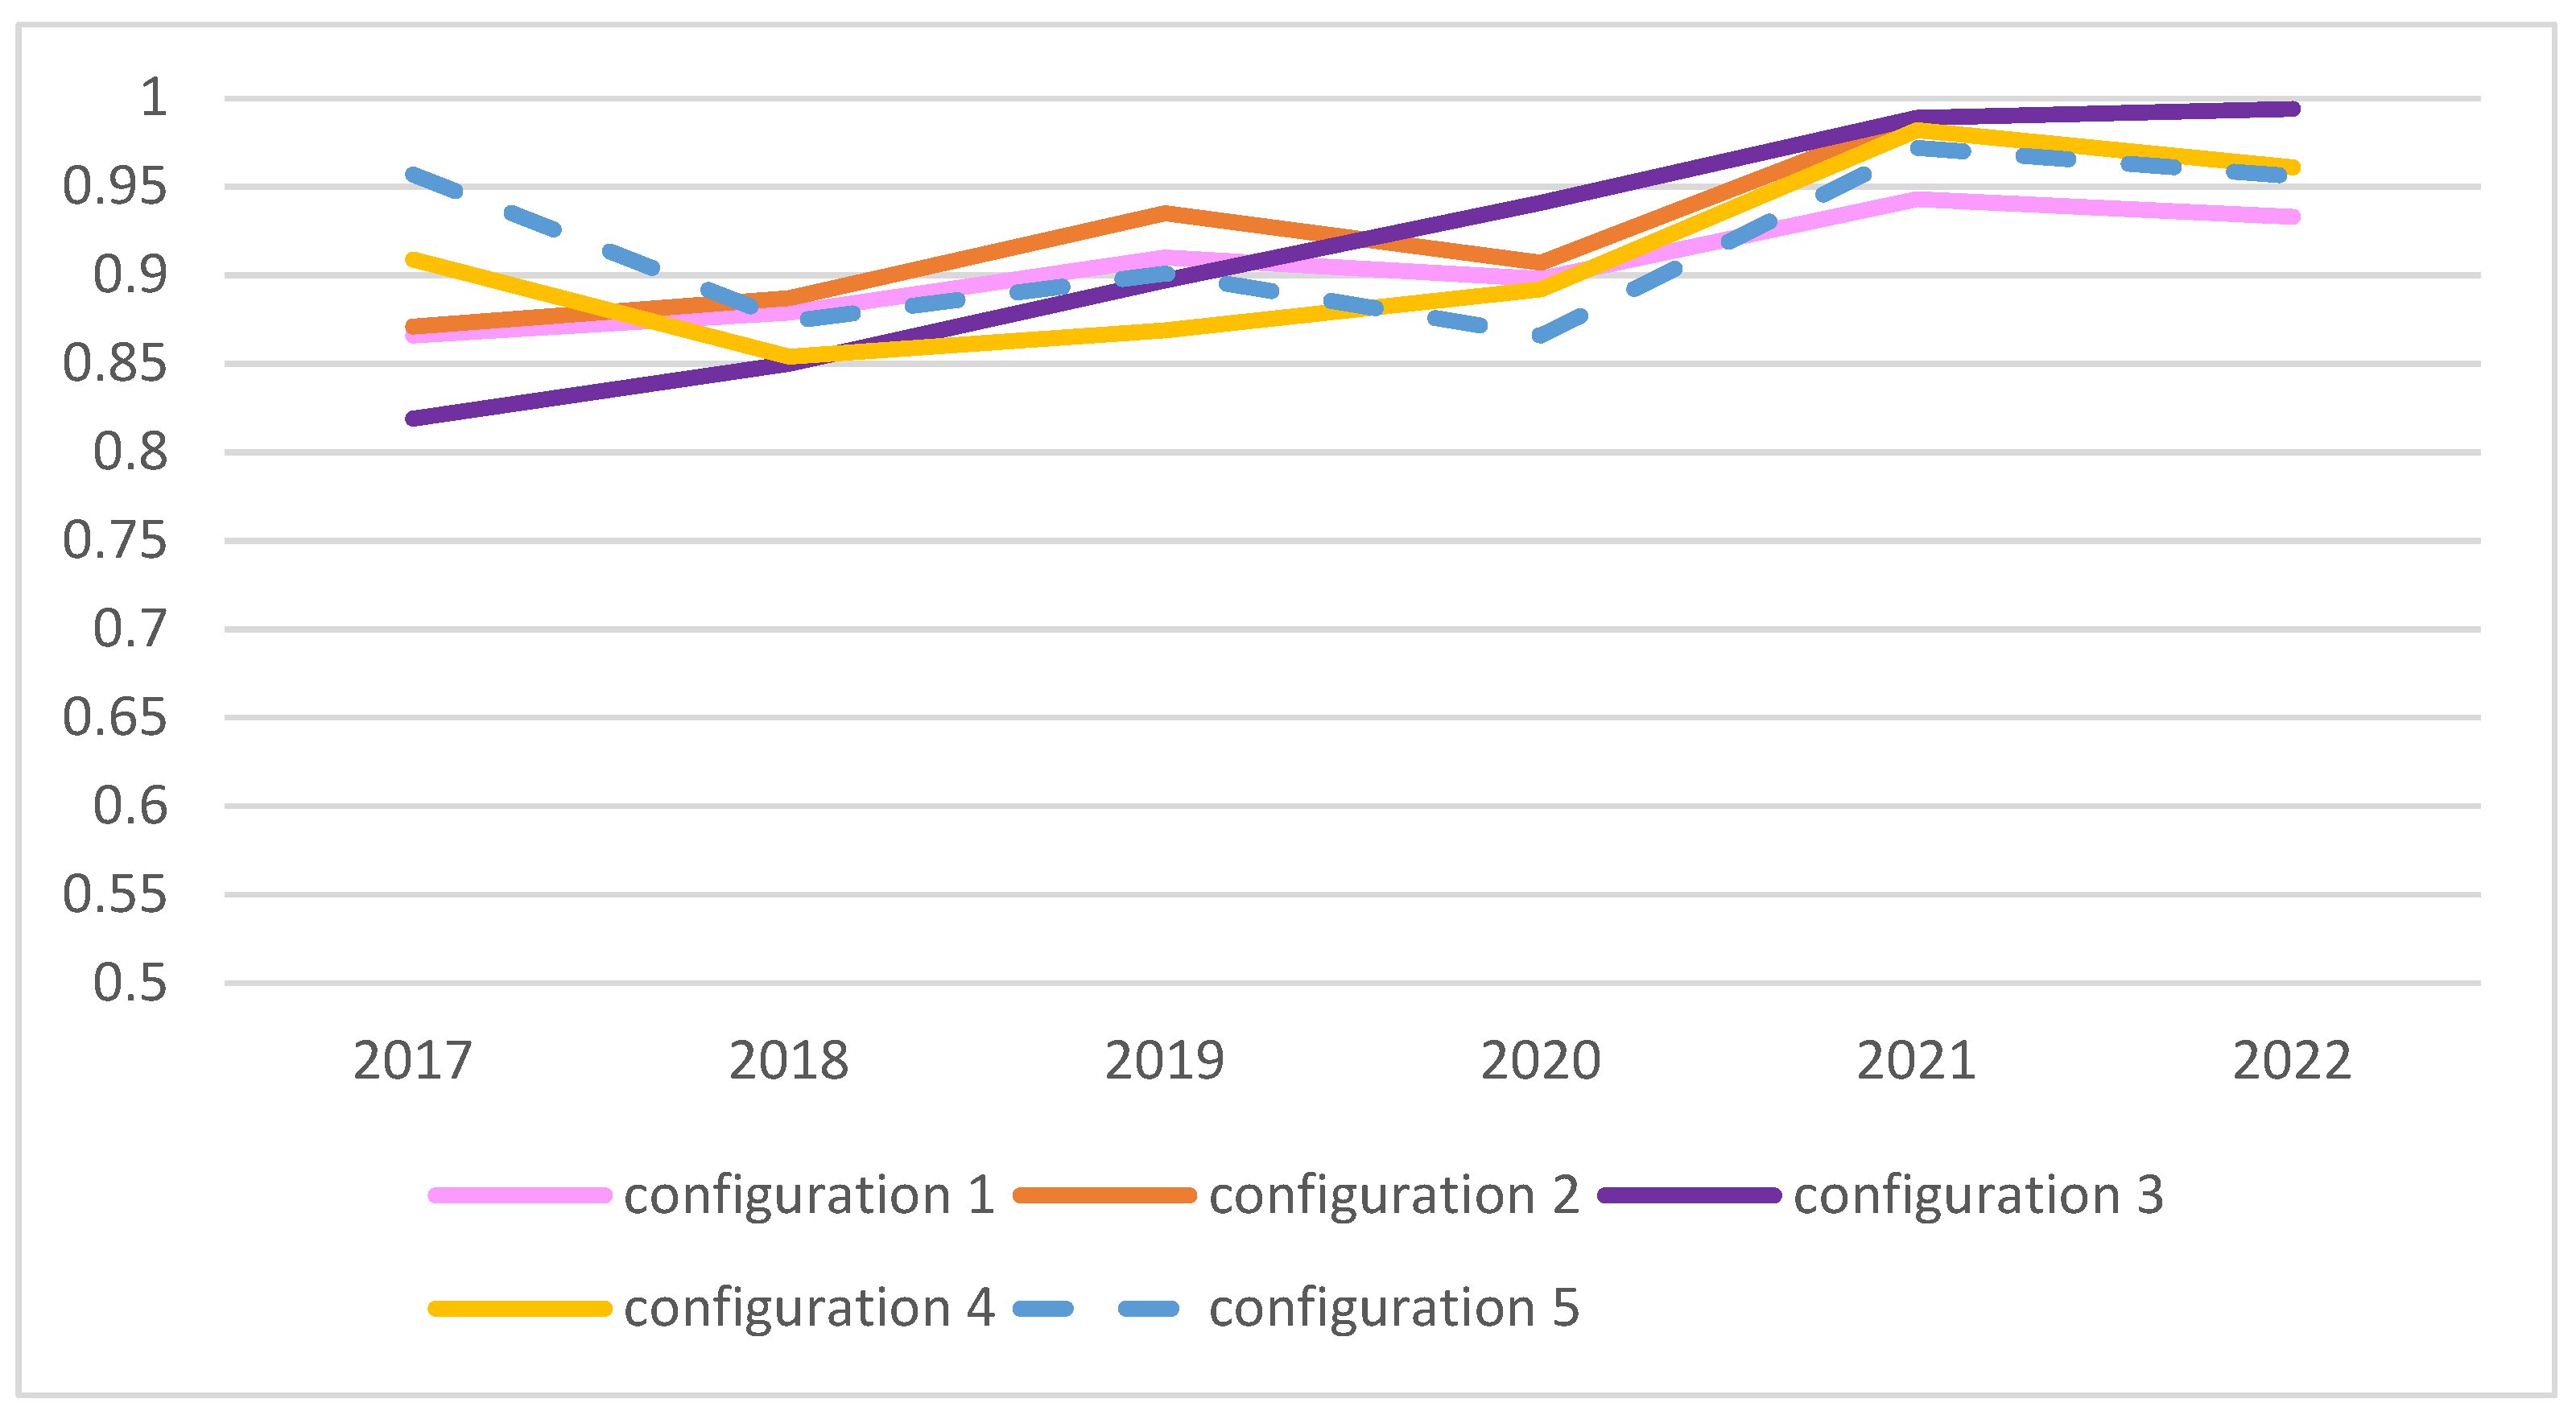
5.5. The Robustness Test

To ensure the validity of our qualitative comparative analysis (QCA) results, we conducted multiple robustness checks following established methodological guidelines [79]. In the QCA method, the robustness of configuration results is often verified by altering the calibration thresholds [80]. In this study, the direct calibration method was initially employed, selecting 0.95 (full membership), 0.5 (crossover point), and 0.05 (full non-membership) as the anchor points. To test robustness, these anchors were subsequently replaced with 0.85 (full affiliated), 0.5 (crossover), and 0.15 (full unaffiliated). As shown in Table 10, the configuration results obtained after modifying the calibration anchors are largely consistent with the original findings of this study, thereby demonstrating the robustness of the results.

6. Conclusions

Resources play a critical role in ESD advancement, where improved resource integration capacity significantly contributes to sustainable development [81]. This study emphasizes the importance of high-quality education and lifelong learning as prerequisites for achieving sustainability through a comprehensive understanding of ESD, thereby promoting social and personal sustainability. The advancement of ESD requires synergistic integration of diversified resources, with information-based resources demonstrating particular strategic significance. As critical enablers, digital platforms, intelligent educational tools, and data analytics systems can transcend spatiotemporal constraints, while optimize resource allocation efficiency to facilitate personalized interactive ESD models. Such technological empowerment substantially enhances both coverage and impact of educational interventions, generating multidimensional accelerative effects toward SDGs. Through the dynamic QCA method, this study identified three distinct pathway patterns: (I) abundant basic resources (configuration 5); (II) complementary technology–culture resources (configuration 1 and 3); (III) culture and information technology educational resources driven (configuration 2 and 4). Most pathways demonstrate minimal regional disparities in their distribution patterns. Among them, configuration 2 is primarily distributed in the western and central regions, determined by regional cultural characteristics and economic development levels. This finding substantiates our argument that optimizing resource linkages based on endogenous regional advantages constitutes a critical strategy for enhancing ESD efficiency. Economically developed regions can strengthen university-industry collaboration and technological investment, while less developed regions can leverage their natural and cultural resources to develop distinctive sustainable development education programs. Education policy makers need to fully consider regional resource endowments, promote collaboration between educational departments, enterprises, non-governmental organizations, and communities, and enhance resource utilization efficiency. Additionally, it is essential to establish an education efficiency evaluation system to regularly monitor the synergistic effects of external resources and educational outputs, enabling timely adjustments to policy instruments.

6.1. Theoretical Contribution

Firstly, this study enriches the application of RDT in the field of sustainable development and provides a novel perspective for evaluating the implementation of ESD policies. Secondly, this study highlights the significant contribution of the synergistic interaction between information technology resources and traditional resources in advancing ESD objectives. Furthermore, this study yields important practical implications: First, regions should develop customized ESD implementation models based on their unique resource endowments to optimize effectiveness. Second, the findings reveal that synergy between HEIs’ information resources and other social resources can promote ESD implementation efficiency. This synergy provides a theoretical foundation for leveraging digital technologies in sustainable education initiatives. According to the results of configuration analysis, the condition variable of HIR serves as the core condition in two configurations, this shows that the information technology educational resource has a certain significance for the implementation of ESD. Even this is important for the sustainable development of society. With the improvement of information infrastructure and digital education advancement, the exploration of ESD implementation and goal fulfillment from the perspective of HEIs’ information resources deserves the attention of policy makers and scholars [82]. Furthermore, educational technology applications present crucial opportunities for establishing lifelong learning systems. Maximizing information resource advantages should constitute a key consideration in ESD policy formulation processes.

6.2. Implications

ESD represents both a global development objective and an individual commitment. By exploring the factors affecting ESD implementation efficiency, this study is helpful for policy makers with evidence to enhance governance effectiveness and develop China-specific approaches for achieving ESD targets. As the same time, this study addresses the limitation of traditional QCA methods, which often overlook the temporal dimension, and pioneers a research approach that explores the efficiency of ESD implementation from a resource-based perspective. In addition, this study demonstrates that the information resources in HEIs play a vital role in societal ESD processes. These findings will help education practitioners pay attention to the use of digital resources in the future, and fully cultivate students’ awareness of lifelong learning and sustainable development ability, thereby indirectly improving the quality of education.
Based on the research findings, the following recommendations are proposed for education policy makers and practitioners: First, policy makers need to recognize the significant role of information technology resources in ESD policy implementation. Informatization and digitalization can optimize the allocation of educational resources across regions through the sharing of curriculum and teaching resources, thereby expanding the coverage of high-quality educational resources and promoting educational equity. Therefore, as policy makers gradually establish and refine the ESD policy framework, they should further consider the role of information technology in achieving ESD goals and how to leverage policy guidance to fully harness the positive impact of information technology resources. Second, future researchers need to focus on the synergistic effects of diverse resources in the implementation of ESD policies. The collaboration of varied resources not only fosters interdisciplinary development but also facilitates the integration of modern technologies with traditional sustainable development resources to create new pathways for progress. Therefore, stakeholders involved in the formulation and execution of ESD policies, such as government departments and educators, must accurately identify the core roles of different social resources in enhancing ESD policy implementation efficiency. Additionally, they should recognize the opportunities presented by diverse resource combination models for the future development of ESD. This approach will contribute to exploring efficient ESD development models from the perspective of resource provision. Third, it is essential to strengthen collaborative connections among the entities responsible for implementing ESD policies. The collaborative role of multiple ESD policy actors in advancing ESD objectives is critically important. Such cooperation is manifested not only in policy formulation and implementation but also entails broad participation both within and beyond the educational system. By enhancing the interrelationships among various stakeholders, it becomes possible to efficiently integrate diverse resources and achieve complementary advantages, thereby forming a collective force to advance the implementation of ESD policies. Furthermore, the participation of various societal forces in ESD development contributes to fostering a positive atmosphere for sustainable development within society.

6.3. Research Limitations and Future Research Directions

First, although the condition variables included in this study were selected based on existing theories, other potential condition variables may have been overlooked. Future studies could expand upon this foundation to enrich the research. Second, since there is currently no unified evaluation index system for assessing ESD efficiency, the index system constructed in this study based on the text content of ESD-related policies and the availability of data has room for improvement. Third, this study utilized secondary public data with a macro-level research perspective. Future research could incorporate micro-level analysis by conducting case studies of specific regions through follow-up investigations to evaluate actual ESD implementation efficiency. This approach would enable more targeted recommendations for future development.

Author Contributions

Conceptualization, H.Z. and H.Y.; methodology, H.Z. and H.Y.; software, H.Y.; validation, H.Z. and H.Y.; formal analysis, H.Y. and H.Z.; investigation, H.Y. and H.Z.; resources, H.Y. and H.Z.; writing—original draft preparation, H.Y.; writing—review and editing, H.Z. and H.Y.; supervision, H.Z.; project administration, H.Z.; funding acquisition, H.Z. All authors have read and agreed to the published version of the manuscript.

Funding

This research was funded by Macao Polytechnic University (RP/FCHS-01/2023).

Institutional Review Board Statement

Not applicable.

Informed Consent Statement

Not applicable.

Data Availability Statement

The original data presented in this study are openly available in [61].

Conflicts of Interest

The authors declare no conflicts of interest.

References

  1. Leal Filho, W.; Azeiteiro, U.; Alves, F.; Pace, P.; Mifsud, M.; Brandli, L.; Caeiro, S.S.; Disterheft, A. Reinvigorating the Sustainable Development Research Agenda: The Role of the Sustainable Development Goals (SDG). Int. J. Sustain. Dev. World Ecol. 2018, 25, 131–142. [Google Scholar] [CrossRef]
  2. Kioupi, V.; Voulvoulis, N. Education for Sustainable Development: A Systemic Framework for Connecting the SDGs to Educational Outcomes. Sustainability 2019, 11, 6104. [Google Scholar] [CrossRef]
  3. Buckler, C.; Creech, H. Shaping the Future We Want: UN Decade of Education for Sustainable Development; Final Report; Unesco: Paris, France, 2014. [Google Scholar]
  4. Salvia, A.L.; Leal Filho, W.; Brandli, L.L.; Griebeler, J.S. Assessing Research Trends Related to Sustainable Development Goals: Local and Global Issues. J. Clean. Prod. 2019, 208, 841–849. [Google Scholar] [CrossRef]
  5. Yan, Y.; Wang, C.; Quan, Y.; Wu, G.; Zhao, J. Urban Sustainable Development Efficiency towards the Balance between Nature and Human Well-Being: Connotation, Measurement, and Assessment. J. Clean. Prod. 2018, 178, 67–75. [Google Scholar] [CrossRef]
  6. Kopnina, H.; Meijers, F. Education for Sustainable Development (ESD): Exploring Theoretical and Practical Challenges. Int. J. Sustain. High. Educ. 2014, 15, 188–207. [Google Scholar] [CrossRef]
  7. UNESCO. Unpacking Sustainable Development Goal 4: Education 2030; UNESCO: Paris, France, 2017. [Google Scholar]
  8. Saini, M.; Sengupta, E.; Singh, M.; Singh, H.; Singh, J. Sustainable Development Goal for Quality Education (SDG 4): A Study on SDG 4 to Extract the Pattern of Association among the Indicators of SDG 4 Employing a Genetic Algorithm. Educ. Inf. Technol. 2023, 28, 2031–2069. [Google Scholar] [CrossRef]
  9. Kopnina, H. Education for the Future? Critical Evaluation of Education for Sustainable Development Goals. J. Environ. Educ. 2020, 51, 280–291. [Google Scholar] [CrossRef]
  10. Mokski, E.; Leal Filho, W.; Sehnem, S.; Andrade Guerra, J.B.S.O. de Education for Sustainable Development in Higher Education Institutions: An Approach for Effective Interdisciplinarity. Int. J. Sustain. High. Educ. 2022, 24, 96–117. [Google Scholar] [CrossRef]
  11. Koçak, D.; Türe, H.; Atan, M. Efficiency Measurement with Network DEA: An Application to Sustainable Development Goals 4. Int. J. Assess. Tools Educ. 2019, 6, 415–435. [Google Scholar] [CrossRef]
  12. Li, C.; Zhou, H. Enhancing the Efficiency of Massive Online Learning by Integrating Intelligent Analysis into MOOCs with an Application to Education of Sustainability. Sustainability 2018, 10, 468. [Google Scholar] [CrossRef]
  13. Chiabrishvili, M.; El-Kanj, N.; Tvaliashvili, A.; Chiabrishvili, K. Sustainable economic education—Important factor for the sustainable economic development. In Proceedings of the 12th International Conference of Education, Research and Innovation (ICERI 2019), Seville, Spain, 11–13 November 2019; Chova, L., Martinez, A., Torres, I., Eds.; 2019; pp. 2930–2935. [Google Scholar]
  14. Hillman, A.J.; Withers, M.C.; Collins, B.J. Resource Dependence Theory: A Review. J. Manag. 2009, 35, 1404–1427. [Google Scholar] [CrossRef]
  15. Carrión-Martínez, J.J.; Luque-de la Rosa, A.; Fernandez-Cerero, J.; Montenegro-Rueda, M. Information and Communications Technologies (ICTs) in Education for Sustainable Development: A Bibliographic Review. Sustainability 2020, 12, 3288. [Google Scholar] [CrossRef]
  16. McCain, T.; Jukes, I. Windows on the Future: Education in the Age of Technology; Corwin Press: Thousand Oaks, CA, USA, 2001. [Google Scholar]
  17. Assar, S. Information and Communications Technology and Education. In International Encyclopedia of the Social & Behavioral Sciences, 2nd ed.; Elsevier: Amsterdam, The Netherlands, 2015; pp. 66–71. [Google Scholar]
  18. Zhang, T.; Shaikh, Z.A.; Yumashev, A.V.; Chłąd, M. Applied Model of E-Learning in the Framework of Education for Sustainable Development. Sustainability 2020, 12, 6420. [Google Scholar] [CrossRef]
  19. Yang, M.; Wang, J.; Li, G. Higher Education for Sustainable Development in China: Policies, Curriculum, Research, and Outreach Activities, and Campus Practices. In Engagement with Sustainable Development in Higher Education: Universities as Transformative Spaces for Sustainable Futures; Springer: Cham, Switzerland, 2022; pp. 121–132. [Google Scholar]
  20. Kozlova, D.; Pikhart, M. The Use of ICT in Higher Education from the Perspective of the University Students. Procedia Comput. Sci. 2021, 192, 2309–2317. [Google Scholar] [CrossRef]
  21. Bosu, R. The Role and Use of ICT in Administrative Activities in Higher Education Institutions: The Views of Administrators in Higher Educational Institutions in Ghana. Int. J. Innov. Res. Dev. 2019, 8, 1–7. [Google Scholar] [CrossRef]
  22. Erdoğan, S.; Çakar, N.D.; Ulucak, R.; Danish; Kassouri, Y. The Role of Natural Resources Abundance and Dependence in Achieving Environmental Sustainability: Evidence from Resource-Based Economies. Sustain. Dev. 2021, 29, 143–154. [Google Scholar] [CrossRef]
  23. Little, A.W.; Green, A. Successful Globalisation, Education and Sustainable Development. Int. J. Educ. Dev. 2009, 29, 166–174. [Google Scholar] [CrossRef]
  24. Chankseliani, M.; Qoraboyev, I.; Gimranova, D. Higher Education Contributing to Local, National, and Global Development: New Empirical and Conceptual Insights. High Educ. 2021, 81, 109–127. [Google Scholar] [CrossRef]
  25. Redman, A.; Wiek, A.; Barth, M. Current Practice of Assessing Students’ Sustainability Competencies: A Review of Tools. Sustain. Sci. 2021, 16, 117–135. [Google Scholar] [CrossRef]
  26. Sinakou, E.; Boeve-de Pauw, J.; Van Petegem, P. Exploring the Concept of Sustainable Development within Education for Sustainable Development: Implications for ESD Research and Practice. Environ. Dev. Sustain. 2019, 21, 1–10. [Google Scholar] [CrossRef]
  27. Almulla, M.A.; Al-Rahmi, W.M. Integrated Social Cognitive Theory with Learning Input Factors: The Effects of Problem-Solving Skills and Critical Thinking Skills on Learning Performance Sustainability. Sustainability 2023, 15, 3978. [Google Scholar] [CrossRef]
  28. Orlovic Lovren, V.; Maruna, M.; Stanarevic, S. Reflections on the Learning Objectives for Sustainable Development in the Higher Education Curricula–Three Cases from the University of Belgrade. Int. J. Sustain. High. Educ. 2020, 21, 315–335. [Google Scholar] [CrossRef]
  29. Rieckmann, M.; Bormann, I. Higher Education Institutions and Sustainable Development; MDPI: Basel, Switzerland, 2020. [Google Scholar] [CrossRef]
  30. Drees, J.M.; Heugens, P.P.M.A.R. Synthesizing and Extending Resource Dependence Theory: A Meta-Analysis. J. Manag. 2013, 39, 1666–1698. [Google Scholar] [CrossRef]
  31. Zheng, H.; Ge, L. Carbon Emissions Reduction Effects of Sustainable Development Policy in Resource-Based Cities from the Perspective of Resource Dependence: Theory and Chinese Experience. Resour. Policy 2022, 78, 102799. [Google Scholar] [CrossRef]
  32. Deslatte, A.; Stokan, E. Hierarchies of Need in Sustainable Development: A Resource Dependence Approach for Local Governance. Urban Aff. Rev. 2019, 55, 1125–1152. [Google Scholar] [CrossRef]
  33. Rihoux, B.; Ragin, C.C. Configurational Comparative Methods: Qualitative Comparative Analysis (QCA) and Related Techniques; Sage: Thousand Oaks, CA, USA, 2009; Volume 51. [Google Scholar]
  34. Lv, K.; Yu, A.; Gong, S.; Wu, M.; Xu, X. Impacts of Educational Factors on Economic Growth in Regions of China: A Spatial Econometric Approach. Technol. Econ. Dev. Econ. 2017, 23, 827–847. [Google Scholar] [CrossRef]
  35. Psacharopoulos, G.; Patrinos*, H.A. Returns to Investment in Education: A Further Update. Educ. Econ. 2004, 12, 111–134. [Google Scholar] [CrossRef]
  36. Miller, C.L. The Effect of Education Spending on Student Achievement. In Proceedings of the Annual Conference on Taxation and Minutes of the Annual Meeting of the National Tax Association, New Orleans, LA, USA, 15–17 November 2018; Volume 111, pp. 1–121. [Google Scholar]
  37. Walker, W.; Hughes, M.; Farquhar, R. Advancing Education: School Leadership in Action; Routledge: London, UK, 2018. [Google Scholar]
  38. Glomm, G.; Kaganovich, M. Social Security, Public Education and the Growth–Inequality Relationship. Eur. Econ. Rev. 2008, 52, 1009–1034. [Google Scholar] [CrossRef]
  39. Jones, J.B.; Li, Y. Social Security Reform with Heterogeneous Mortality. Rev. Econ. Dyn. 2023, 48, 320–344. [Google Scholar] [CrossRef]
  40. Acosta Castellanos, P.M.; Queiruga-Dios, A. From Environmental Education to Education for Sustainable Development in Higher Education: A Systematic Review. Int. J. Sustain. High. Educ. 2022, 23, 622–644. [Google Scholar] [CrossRef]
  41. Musolin, M.H.; Serour, R.O.H.; Siregar, M.; Hamid, S.A.; Ismail, A.; Huda, M.; Rohim, M.A. Developing Personalised Islamic Learning in Digital Age: Pedagogical and Technological Integration for Open Learning Resources (OLR). In Proceedings of the Ninth International Congress on Information and Communication Technology, London, UK, 19–22 February 2024; Yang, X.-S., Sherratt, S., Dey, N., Joshi, A., Eds.; Springer Nature: Singapore, 2024; pp. 11–25. [Google Scholar]
  42. Bilgen, S.; Sarıkaya, İ. Exergy for Environment, Ecology and Sustainable Development. Renew. Sustain. Energy Rev. 2015, 51, 1115–1131. [Google Scholar] [CrossRef]
  43. Isar, Y.R. ‘Culture’, ‘Sustainable Development’ and Cultural Policy: A Contrarian View. In Cultural Policies for Sustainable Development; Routledge: London, UK, 2018; ISBN 978-1-351-02550-8. [Google Scholar]
  44. Nocca, F. The Role of Cultural Heritage in Sustainable Development: Multidimensional Indicators as Decision-Making Tool. Sustainability 2017, 9, 1882. [Google Scholar] [CrossRef]
  45. Labadi, S.; Giliberto, F.; Rosetti, I.; Shetabi, L.; Yildirim, E. Heritage and the Sustainable Development Goals: Policy Guidance for Heritage and Development Actors; ICOMOS: Charenton-le-Pont, France, 2021. [Google Scholar]
  46. Murti, R.C. Culturally Responsive Teaching to Support Meaningfull Learning in Mathematics Primary School. J. Prima Edukasia 2023, 11, 294–302. [Google Scholar] [CrossRef]
  47. Findler, F.; Schönherr, N.; Lozano, R.; Reider, D.; Martinuzzi, A. The Impacts of Higher Education Institutions on Sustainable Development: A Review and Conceptualization. Int. J. Sustain. High. Educ. 2019, 20, 23–38. [Google Scholar] [CrossRef]
  48. OECD Indicators. Education at a Glance 2022: OECD Indicators; OECD Publishing: Paris, France, 2022; Available online: https://www.oecd.org/en/publications/education-at-a-glance-2022_3197152b-en.html (accessed on 4 April 2025).
  49. Available online: https://uis.unesco.org/sites/default/files/documents/education-2030-incheon-framework-for-action-implementation-of-sdg4-2016-en_2.pdf (accessed on 4 April 2025).
  50. China Unveils Blueprint for Building Strong Education System by 2035. Available online: https://english.www.gov.cn/policies/latestreleases/202501/20/content_WS678d85c6c6d0868f4e8eef83.html (accessed on 14 April 2025).
  51. Education for Sustainable Development Toolkit—UNESCO Digital Library. Available online: https://unesdoc.unesco.org/ark:/48223/pf0000152453 (accessed on 14 April 2025).
  52. Cardoso, I.G.; Lacerda, D.P.; Piran, F.S. A DEA Model to Assess the Educational System in Brazil. Int. J. Manag. Educ. 2021, 15, 245–275. [Google Scholar] [CrossRef]
  53. Lee, B.L.; Johnes, J. Using Network DEA to Inform Policy: The Case of the Teaching Quality of Higher Education in England. High. Educ. Q. 2022, 76, 399–421. [Google Scholar] [CrossRef]
  54. Nazarko, J.; Šaparauskas, J. Application of DEA Method in Efficiency Evaluation of Public Higher Education Institutions. Technol. Econ. Dev. Econ. 2014, 20, 25–44. [Google Scholar] [CrossRef]
  55. Partey, P.A.; Annim, S.K.; Yidana, M.B.; Sebu, J. Estimating the Extent of Educational Resource Deprivation among Basic Schools and Its Effect on Quality Education in Ghana. Int. J. Educ. Dev. 2024, 109, 103077. [Google Scholar] [CrossRef]
  56. Ajani, I.R.; Akinyele, O.B. Effects of Student-Teacher Ratio on Academic Achievement of Selected Secondary School Students in Port Harcourt Metropolis, Nigeria. J. Educ. Pract. 2014, 5, 100–106. [Google Scholar]
  57. Cooper, W.W.; Seiford, L.M.; Zhu, J. Handbook on Data Envelopment Analysis; Springer Science & Business Media: New York, NY, USA, 2011; ISBN 978-1-4419-6151-8. [Google Scholar]
  58. Tone, K. A Slacks-Based Measure of Efficiency in Data Envelopment Analysis. Eur. J. Oper. Res. 2001, 130, 498–509. [Google Scholar] [CrossRef]
  59. Castro, R.G.; Ariño, M.A. A General Approach to Panel Data Set-Theoretic Research. JAMSIS 2016, 2, 63–76. [Google Scholar] [CrossRef]
  60. Hu, B.Y.; Li, K. The Quality Rating System of Chinese Preschool Education: Prospects and Challenges. Child. Educ. 2012, 88, 14–22. [Google Scholar] [CrossRef]
  61. National Bureau of Statistics of China >> Yearbook. Available online: https://www.stats.gov.cn/english/Statisticaldata/yearbook/ (accessed on 14 April 2025).
  62. Ke, X.; Yu, W. The Mechanism Research on the Development of Higher Education Impact on the Economic Growth. Proc. Soc. Sci. Educ. 2013, 10, 157. [Google Scholar]
  63. Hu, N.; Zheng, B. Natural Resources, Education, and Green Economic Development. Resour. Policy 2023, 86, 104053. [Google Scholar] [CrossRef]
  64. Li, X.; Ma, L.; Ruman, A.M.; Iqbal, N.; Strielkowski, W. Impact of Natural Resource Mining on Sustainable Economic Development: The Role of Education and Green Innovation in China. Geosci. Front. 2024, 15, 101703. [Google Scholar] [CrossRef]
  65. Vasudevan, H.; Moya, D.R.R.C.; Nagarathanam, R.; Newaz, F.T. Green Training and Pro-Environmental Behaviour Enhancing Education Sustainable Development Goal at Higher Education Institutions: Conceptual Approach. Int. J. Indian Cult. Bus. Manag. 2024, 31, 322–341. [Google Scholar] [CrossRef]
  66. de Andrade Silva, A.R.; Outeiro, A.D.S.; Arantes Fazenda, I.C. Education & Innovation: A Path to Sustainable Development. In Proceedings of the 8th International Conference on Innovation and Management, Kitakyushu, Japan, 30 November–2 December 2011; pp. 98–103. [Google Scholar]
  67. Wiktor-Mach, D. What Role for Culture in the Age of Sustainable Development? UNESCO’s Advocacy in the 2030 Agenda Negotiations. Int. J. Cult. Policy 2020, 26, 312–327. [Google Scholar] [CrossRef]
  68. Benito, B.; Guillamon, M.-D.; Rios, A.-M.; Cifuentes-Faura, J. The Relationship between Culture and Sustainable Development Goal Compliance at the Municipal Level. Sustain. Dev. 2024, 33, 333–348. [Google Scholar] [CrossRef]
  69. Franca Uyetaqui, N.S.; Martins Sato, B.E.; de Lima, G.M.; Esteves dos Santos, K.E. The right to sustainable education from the ybyram startup case study: Gamified sustainable education. Humanidades Inov. 2021, 8, 33–45. [Google Scholar]
  70. Hrebeniuk, A.; Okseniuk, I. “Digital turn” in education in the context of society’s sustainable development. Inf. Technol. Learn. Tools 2024, 100, 1–15. [Google Scholar] [CrossRef]
  71. Borma, A. The Covid-19 Pandemic. Controversies And Measures Proposed To Reduce The Impact Of Future Pandemics. Oradea J. Bus. Econ. 2023, 8, 19–25. [Google Scholar] [CrossRef]
  72. Nyashanu, M.; Mtambo, C.; Karonga, T.; Walker, J. Exploring the Impact of COVID-19 Lockdown on Learning among Higher Education Students on the Copperbelt Province, Zambia. Cogent Educ. 2023, 10, 2200631. [Google Scholar] [CrossRef]
  73. Sanz-Labrador, I.; Cuerdo-Mir, M.; Doncel-Pedrera, L.M. The Use of Digital Educational Resources in Times of COVID-19. Soc. Media + Soc. 2021, 7, 20563051211049246. [Google Scholar] [CrossRef]
  74. Loo, B.P.; Wang, B. Progress of E-Development in China since 1998. Telecommun. Policy 2017, 41, 731–742. [Google Scholar] [CrossRef]
  75. Fong, M.W. Digital Divide between Urban and Rural Regions in China. Electron. J. Inf. Syst. Dev. Ctries. 2009, 36, 1–12. [Google Scholar] [CrossRef]
  76. ITU. Measuring the Information Society Report 2016; ITU: Geneva, Switzerland, 2016. [Google Scholar]
  77. Jia, H. Study on Agriculture Circular Economy and Sustainable Development in West China. In Innovation, Entrepreneurship and Strategy in the Era of Internet; Xiaowen, J., Erming, X., Woodside, A., Eds.; Sichuan University: Chengdu, China, 2016; pp. 148–152. [Google Scholar]
  78. Li, X.; Qin, W.; Qi, F.; Zhang, S. Regional Differences in China’s Ecological Civilization Construction from an Evolutionary Perspective and the Influencing Factors. Int. J. Sustain. Dev. World Ecol. 2024, 31, 627–638. [Google Scholar] [CrossRef]
  79. Ragin, C.C. The Comparative Method: Moving beyond Qualitative and Quantitative Strategies; Univ of California Press: Auckland City, CA, USA, 2014. [Google Scholar]
  80. Fiss, P.C. Building Better Causal Theories: A Fuzzy Set Approach to Typologies in Organization Research. AMJ 2011, 54, 393–420. [Google Scholar] [CrossRef]
  81. Duan, W.; Luo, G. Perceptions of Social Responsibility, Resource Integration Ability and Sustainable Development of Family Grain Farms—Evidence from China. Pol. J. Environ. Stud. 2024, 33, 1091–1100. [Google Scholar] [CrossRef]
  82. Ricard, M.; Zachariou, A.; Burgos, D. Digital Education, Information and Communication Technology, and Education for Sustainable Development. In Radical Solutions and eLearning: Practical Innovations and Online Educational Technology; Burgos, D., Ed.; Lecture Notes in Educational Technology; Springer: Singapore, 2020; pp. 27–39. ISBN 978-981-15-4952-6. [Google Scholar]
Figure 1. Research framework.
Sustainability 17 03809 g001
Figure 2. Between-group consistency change trend.
Sustainability 17 03809 g002
Table 2. Input and output indicators of ESD implementation efficiency.
Primary IndicatorsSecondary IndicatorsDimensionsData Sources
Teacher–student ratio (%)senior high school educationInput
(human resources)
China Educational Finance Statistical Yearbook, Educational Statistics Yearbook of China [61]
secondary vocational school
junior high school education
primary school education
The proportion of full-time teachers with academic qualifications which is higher than the required one (%)senior high school education
secondary vocational school
junior high school education
primary school education
preschool education
Per student public budget education expenses (yuan/per student)HEIs (undergraduate)Input
(financial resources)
secondary vocational school
senior high school education
junior high school education
primary school education
preschool education
Proportion of public budget education expenses to public budget expenditures (%)no secondary indicators
Amount of teaching equipment per student (yuan/per student)HEIs (undergraduate)Input
(material resources)
senior high school education
secondary vocational school
junior high school education
primary school education
Number of books per studentHEIs (undergraduate)
senior high school education
secondary vocational school
junior high school education
primary school education
preschool education
special education
The population with education above high schoolno secondary indicatorsOutput (expected output)China Statistical Yearbook [61]
The absolute value of difference in educational attainment ratio between the sexesOutput (undesirable output)
The illiteracy rate of population over aged 15
Table 3. Description of dynamic QCA condition variables.
Condition VariablesIndicatorsWeightsData Sources
EDLPer capita GDP (trillion yuan)0.30China Statistical Yearbook [61]
Proportion of the urban population (%)0.07
Per capita disposable income (yuan)0.24
Consumer price index0.08
total retail sales of consumer goods (trillion yuan)0.32
SWRNumber of health technicians per thousand population0.23
Number of persons receiving lowest cost of living (%)0.56
Proportion of residents insured by basic medical insurance (%)0.16
Proportion of residents participating in basic old-age insurance (%)0.05
STIRR&D personnel full-time equivalent 0.33
Number of patents granted in China 0.31
Amount of technology market transaction (trillion yuan)0.36
EHSProportion of general industrial solid wastes utilized (%)0.14
afforestation area (hectare)0.42
Capacity for harmless treatment of household waste (ton/day)0.44
CURPer capita public library collection0.07
Number of terminals in the digital reading room0.03
Number of museum collections0.09
Art performance group shows (ten thousand plays)0.81
HIRPer capita number of digital terminals0.67
The proportion of network multimedia classrooms in total classrooms (%)0.33
Note: EDL = economic development level; SWR = social welfare resources; STIR = scientific and technological innovation resources; EHS = environmental and health sustainability; CUR = cultural resources; HIR = HEIs’ information resources.
Table 4. Calibration thresholds for variables.
VariablesCalibration
Full AffiliatedCrossoverFull Unaffiliated
Outcome variable (Y)ESD implementation efficiency1.1370.6230.384
Condition variablesEDL47,371.11917,698.1366893.046
SWR22.33619.38216.446
STIR297,921.56837,870.6151685.539
EHS250,139.62684,645.37811,252.214
CUR384,786.47073,107.0577323.883
HIR0.8840.5770.415
Note: EDL = economic development level; SWR = social welfare resources; STIR = scientific and technological innovation resources; EHS = environmental and health sustainability; CUR = cultural resources; HIR = HEIs’ information resources.
Table 5. ESD implementation efficiency.
YearProvinceEfficiencyYearProvinceEfficiencyYearProvinceEfficiency
2017Anhui0.43382019Heilongjiang0.83382021Shandong0.5188
2018Anhui0.48822020Heilongjiang0.87752022Shandong0.5494
2019Anhui0.46842021Heilongjiang0.81582017Shanxi1.0696
2020Anhui0.47632022Heilongjiang0.88192018Shanxi1.0572
2021Anhui0.53082017Hubei0.63892019Shanxi1.0516
2022Anhui0.52832018Hubei1.01242020Shanxi1.0816
2017Beijing1.20182019Hubei1.00742021Shanxi1.0526
2018Beijing1.31642020Hubei1.00142022Shanxi1.0518
2019Beijing1.29402021Hubei0.66662017Shaanxi0.6051
2020Beijing1.27822022Hubei0.64002018Shaanxi0.6420
2021Beijing1.25192017Hunan1.03702019Shaanxi0.6146
2022Beijing1.23292018Hunan1.01312020Shaanxi0.5417
2017Fujian0.50782019Hunan1.03532021Shaanxi0.6219
2018Fujian0.44542020Hunan1.00192022Shaanxi0.6663
2019Fujian0.40702021Hunan1.02692017Shanghai1.0699
2020Fujian0.47742022Hunan1.01482018Shanghai1.0600
2021Fujian0.50852017Jilin0.60582019Shanghai1.0323
2022Fujian0.51632018Jilin0.71372020Shanghai1.0644
2017Gansu0.57532019Jilin0.76792021Shanghai1.0685
2018Gansu0.50682020Jilin1.04962022Shanghai1.0561
2019Gansu0.52292021Jilin0.80872017Sichuan0.4912
2020Gansu0.52212022Jilin1.01502018Sichuan0.5986
2021Gansu0.54552017Jiangsu0.50852019Sichuan0.7487
2022Gansu0.52082018Jiangsu0.49962020Sichuan0.5363
2017Guangdong0.66812019Jiangsu0.55922021Sichuan0.5584
2018Guangdong0.58302020Jiangsu0.55602022Sichuan0.5646
2019Guangdong0.48772021Jiangsu0.57112017Tianjin1.1320
2020Guangdong0.59422022Jiangsu0.62632018Tianjin1.1134
2021Guangdong0.62052017Jiangxi0.50062019Tianjin1.0869
2022Guangdong0.64102018Jiangxi0.52212020Tianjin1.0427
2017Guangxi0.46972019Jiangxi0.60102021Tianjin1.0511
2018Guangxi0.47832020Jiangxi0.51812022Tianjin1.0452
2019Guangxi0.56342021Jiangxi0.60622017Tibet0.2053
2020Guangxi0.54362022Jiangxi0.62122018Tibet0.2412
2021Guangxi0.55542017Liaoning1.13932019Tibet0.3227
2022Guangxi0.64112018Liaoning1.10382020Tibet0.3015
2017Guizhou0.41152019Liaoning1.09342021Tibet0.2872
2018Guizhou0.37802020Liaoning1.06662022Tibet0.3163
2019Guizhou0.35122021Liaoning1.20552017Xinjiang1.0742
2020Guizhou0.40932022Liaoning1.11882018Xinjiang1.2365
2021Guizhou0.48472017Inner Mongolia1.04662019Xinjiang1.1103
2022Guizhou0.44992018Inner Mongolia1.01332020Xinjiang1.0107
2017Hainan0.52362019Inner Mongolia1.03372021Xinjiang1.0164
2018Hainan0.71042020Inner Mongolia0.65192022Xinjiang1.0148
2019Hainan0.66482021Inner Mongolia1.01192017Yunnan0.4268
2020Hainan0.50062022Inner Mongolia1.01752018Yunnan0.4283
2021Hainan0.52522017Ningxia0.67452019Yunnan0.6007
2022Hainan0.56602018Ningxia0.56222020Yunnan0.4661
2017Hebei0.62472019Ningxia0.55382021Yunnan0.5268
2018Hebei1.02152020Ningxia0.58202022Yunnan0.5056
2019Hebei0.62922021Ningxia0.53962017Zhejiang0.3774
2020Hebei1.00602022Ningxia0.55752018Zhejiang0.4327
2021Hebei1.08512017Qinghai0.36452019Zhejiang0.4912
2022Hebei1.14202018Qinghai0.40692020Zhejiang0.4653
2017Henan1.01502019Qinghai0.40152021Zhejiang0.4558
2018Henan0.65922020Qinghai0.43372022Zhejiang0.4830
2019Henan1.00742021Qinghai0.43582017Chongqing0.6828
2020Henan1.03382022Qinghai0.48512018Chongqing0.8036
2021Henan1.03902017Shandong0.54272019Chongqing1.0065
2022Henan1.05602018Shandong0.51972020Chongqing0.7441
2017Heilongjiang0.65112019Shandong0.51322021Chongqing1.0238
2018Heilongjiang0.76012020Shandong0.51702022Chongqing1.0174
Table 6. Analysis of necessary conditions.
Condition VariablesY~Y
Pooled ConsistencyPooled CoverageBECONS DistanceWICONS DistancePooled ConsistencyPooled CoverageBECONS DistanceWICONS Distance
EDL0.6200.6810.0330.0770.5800.5860.0460.085
~EDL0.6230.6170.0340.0790.6850.6240.0250.073
SWR0.6240.6380.0840.0690.6390.6010.0730.070
~SWR0.6090.6470.0950.0700.6150.6010.0720.071
STIR0.5240.6760.0380.0910.5320.6320.0360.097
~STIR0.7150.6240.0290.0630.7270.5840.0160.067
EHS0.5930.6690.0450.0780.6020.6260.0570.071
~EHS0.6680.6460.0470.0650.6810.6060.0720.061
CUR0.6280.6980.0180.0690.5640.5760.0250.086
~CUR0.6180.6060.0280.0780.7040.6360.0150.070
HIR0.6080.6650.0980.0680.6390.6440.0870.060
~HIR0.6750.6700.0720.0590.6680.6110.0790.061
Note: EDL = economic development level; SWR = social welfare resources; STIR = scientific and technological innovation resources; EHS = environmental and health sustainability; CUR = cultural resources; HIR = HEIs’ information resources; ~ indicates that logical negation (NOT) in QCA.
Table 7. Configuration analysis.
Y
12345
EDL
SWR
STIR
EHS
CUR
HIR
Consistency0.9070.9290.9180.9110.919
PRI0.7810.8000.7750.7500.785
Raw coverage0.3500.2870.2190.2670.266
Unique coverage0.0590.0280.0040.0390.029
BECONS distance0.0120.0210.0290.0210.019
WICONS distance0.0360.0320.0310.0320.031
Pooled consistency0.885
Pooled PRI0.768
Pooled coverage0.512
Note: indicates the existence of core conditions; indicates the absence of core conditions; indicates the existence of edge conditions; indicates the absence of edge conditions; blank indicates the antecedent condition can either exist or not exist; EDL = economic development level; SWR = social welfare resources; STIR = scientific and technological innovation resources; EHS = environmental and health sustainability; CUR = cultural resources; HIR = HEIs’ information resources.
Table 8. Results of the Kruskal–Wallis rank-sum test.
Configuration 1Configuration 2Configuration 3Configuration 4Configuration 5
Mean0.4620.3890.3210.3890.388
SD0.2890.2530.2750.2890.308
Chi-square4.1997.8031.2521.5983.710
df.33333
Sig.0.2410.050 *0.7410.6600.294
Note: * p < 0.1.
Table 9. Average coverage of different regions.
RegionsConfiguration 2
East0.263
Central0.361
West0.540
Northeast0.266
Table 10. The configuration results of the robustness test.
Y
12345
EDL
SWR
STIR
EHS
CUR
HIR
Consistency0.8910.9070.9100.8990.903
PRI0.7780.7790.7670.7760.767
Raw coverage0.3410.2860.2160.2650.268
Unique coverage0.0580.0290.0070.0410.031
BECONS distance0.0120.0230.0280.0200.019
WICONS distance0.0350.0330.0300.0330.031
Pooled consistency0.853
Pooled PRI0.728
Pooled coverage0.503
Note: indicates the existence of core conditions; indicates the absence of core conditions; indicates the existence of edge conditions; indicates the absence of edge conditions; blank indicates the antecedent condition can either exist or not exist; EDL = economic development level; SWR = social welfare resources; STIR = scientific and technological innovation resources; EHS = environmental and health sustainability; CUR = cultural resources; HIR = HEIs’ information resources.
Disclaimer/Publisher’s Note: The statements, opinions and data contained in all publications are solely those of the individual author(s) and contributor(s) and not of MDPI and/or the editor(s). MDPI and/or the editor(s) disclaim responsibility for any injury to people or property resulting from any ideas, methods, instructions or products referred to in the content.

