Article

Monitoring Strategy of Air Pollution Emission from Ships in Urban Port Areas Based on Supervisory Game Analysis

1
Key Laboratory of LNG Industry Chain, School of Transportation, Fujian University of Technology, Fuzhou 350118, China
2
Department of Logistics Management, School of Transportation, Fujian University of Technology, Fuzhou 350118, China
*
Author to whom correspondence should be addressed.
Sustainability 2025, 17(9), 3822; https://doi.org/10.3390/su17093822
Submission received: 10 March 2025 / Revised: 9 April 2025 / Accepted: 21 April 2025 / Published: 23 April 2025
(This article belongs to the Section Sustainable Transportation)

Abstract

:
In response to the International Maritime Organization’s (IMO) 2020 sulfur cap and China’s stricter emission control policies, this study investigates the strategic interaction between port authorities and shipowners concerning air pollution emissions from ships in port areas. Using supervisory game theory, we construct a model that captures the cost–benefit trade-offs between inspection efforts by regulators and compliance behavior by ship operators. Empirical data from Guangzhou Port in 2020—including government inspection costs, fuel substitution costs, subsidy schemes, and fine levels—are incorporated into the model to simulate equilibrium outcomes. Results indicate that while the current level of inspection has a significant deterrent effect, the probability of full compliance remains low at 34.36%, highlighting the importance of a balanced regulatory approach combining inspection, fines, and subsidies. Policy implications suggest that increased financial incentives and stronger penalties can reduce both regulatory costs and non-compliance risks. This study contributes to the literature on maritime environmental governance by providing a quantitative supervisory framework grounded in real-world port data.

1. Introduction

China possesses a coastline exceeding 18,000 km [1] and hosts a dense network of major coastal port cities, including Dalian, Tianjin, Qingdao, Shanghai, Shenzhen, and Guangzhou [2]. These ports serve as critical gateways for China’s international trade and maritime logistics. Behind the busy international trade, the increasingly serious problem of ship air pollution and port environmental pollution has attracted increased attention, making the control of ship air pollution the key control content of coastal cities [3]. The rapid development of maritime transportation has led to a pressing issue of increased shipload and tonnage, with maritime navigation becoming more frequent. This urgency is further compounded by the substantial power-fuel demand of ships, resulting in significant secondary pollutant emissions. Such a large amount of emissions, if not controlled, will have a huge negative impact on the coastal environment, and one of the keys to controlling ship pollution is the control of sulfur in ship fuel [4].
In response, the International Maritime Organization (IMO) implemented a global sulfur cap on 1 January 2020, mandating that the sulfur content in marine fuels not exceed 0.5% m/m [5]. Based on the IMO’s new sulfur cap, China has issued a more stringent ship emission control plan. According to the implementation plan for the 2020 Global Marine Fuel Sulfur Limits proposed by the Ministry of Communications, starting from 1 January 2020, when entering China’s emission control zone, ships should use fuel with a sulfur content of less than 0.1% m/m [6]. Responses to the sulfur cap vary according to the methods provided by IMO regulations: One is to install emission desulfurization towers for ships, even if such ships continue to use high-sulfur fuel oil (sulfur content not higher than 3.5% m/m) [7]. After the desulfurization tower treats the waste gas discharged by ships, the pollution emission is considerably reduced, but the cost of installing the desulfurization tower increases. The other is to use low-sulfur fuel (sulfur content of 0.1% m/m) [8]. While these policies are designed to curb ship emissions, they also introduce significant compliance costs for shipowners. Switching to low-sulfur fuel increases operating expenses, while the installation of scrubbers entails substantial capital investment and maintenance obligations. Consequently, many shipowners may be reluctant to comply unless compelled by robust regulatory enforcement.
The enforcement of these emission standards places a considerable burden on port authorities. Under the 2020 Global Marine Fuel Sulfur Limit Implementation Plan, the maritime department is empowered to conduct sampling inspections of ship fuel’s sulfur content to ensure strict compliance for ships entering the port emission control areas. Ships failing to meet the fuel sulfur content requirements are subject to legal regulations [9]. Due to the logistical challenges and high costs associated with inspecting every vessel, enforcement typically relies on random sampling. Within this regulatory context, a strategic interaction emerges between maritime authorities and shipowners: the former must decide whether to conduct inspections, while the latter must determine whether to comply with fuel regulations. This interaction can be conceptualized as a game, where both parties seek to optimize their outcomes under uncertainty and cost constraints.
Among China’s major ports, Guangzhou Port offers a strategically valuable case for such analysis. Located in the Pearl River Delta, Guangzhou is a high-traffic port that has also been an early adopter of clean fuel subsidy schemes [10]. Its regulatory practices and compliance dynamics provide an illustrative setting for exploring the interplay between environmental policy and enforcement strategies. To investigate these dynamics, this study develops a supervisory game theory model that simulates the strategic decision-making processes of both regulatory agencies and shipowners. By incorporating empirical data from Guangzhou Port—including differential fuel costs, inspection expenditures, government subsidies, and penalty structures—the model estimates equilibrium probabilities for inspection and compliance. Unlike prior studies that are either purely theoretical or largely descriptive, this research integrates quantitative modeling with real-world data, offering a policy-relevant framework for balancing environmental goals with practical economic constraints.
The remainder of this paper is organized as follows. Section 2 introduces the literature review of the sulfur cap and the supervision game of ship pollution. Section 3 designs the supervision game model of emission reduction costs between government regulatory agencies and ship operators. Section 4 verifies the supervision game model. Section 5 establishes the monitoring strategic recommendations. Lastly, the conclusion provides a reference basis for future research on greening marine ships.

2. Literature Review

With the continuous expansion of global maritime trade, the environmental impact of marine transportation has become increasingly pronounced. Ship operations are a significant source of air pollutants, which adversely affect the air quality of port cities and contribute to regional environmental degradation. Liu et al. [11] analyzed ship emission inventories at Qingdao Port from 2005 to 2017 and observed a consistent upward trend in the emissions of nitrogen oxides (NOX), sulfur dioxide (SO2), carbon monoxide (CO), and particulate matter (PM10), with NOX exhibiting the highest emission levels, followed by SO2. Complementary findings were reported by Zeng and Lu [12], who estimated ship emissions at Xiamen Port for the year 2018. Their results indicated that carbon dioxide equivalent (CO2e) emissions were the most prominent, followed by NOX and sulfur oxides (SOX). Similarly, Li and Zhou [13] assessed the emissions profile of ships operating at Zhuhai Gaolan Port in the same year and found that NOX remained the dominant pollutant, while SO2 emissions were the lowest. Based on these findings, they estimated the average sulfur content in marine fuel to be 1611.7 ppm—substantially exceeding the regulatory threshold of 0.5% m/m—underscoring the necessity of further reducing sulfur content in marine fuels to mitigate SO2 emissions effectively.
In response to the complex dynamics of port environmental regulation, game theory has emerged as a valuable analytical framework for examining the strategic interactions between regulators and polluters. Within the maritime sector, a number of studies have applied supervisory and evolutionary game models to explore how emission regulations influence the decision-making behaviors of governmental authorities and ship operators. For example, Jiao and Liu [14] examined how variations in government subsidies and inspection frequencies affect corporate compliance, while Yan et al. [15] extended this analytical approach to multi-agent systems using empirical data from river basins.
Given this context, the following section provides a comprehensive literature review of game-theoretic approaches to ship pollution supervision in port environments. This review aims to identify current research gaps, evaluate modeling assumptions and their practical implications, and explore the potential of integrated regulatory strategies in addressing the unique challenges of mobile pollution sources and stochastic inspection regimes.

2.1. Sulfur Cap

At present, the focus and challenges of global port shipping emission control are focused on the emissions of sulfur dioxide from ships. The United International Maritime Organization (UN-IMO) has continuously introduced a series of international conventions and regulations for the emission control of marine ports since 2007, mainly to establish emission control areas at important seaports, within which all ships are forcibly required to use low-sulfur fuel oil.
In addition, the International Convention for the Prevention of Pollution from Ships was amended in 2016, and it was decided that starting from 1 January 2020, the sulfur content of fuel used by all ships in the control area will not exceed 0.5% [16]. In order to meet the standard of fuel sulfur content not exceeding 0.50%, shipping companies can only improve in three aspects, namely using low-sulfur fuel [17,18], installing desulfurization towers, or using new LNG ships; these three methods will all affect the operating costs of shipping companies. According to Liu and Zhang [5] and Li [19], China must be to have stricter emission standards for ships in the context of the worldwide implementation of sulfur caps for ships. It is foreseeable that whether the decision is to switch to low-sulfur fuel oil or install a desulfurization tower, it will increase the operating costs of shipping companies, which also gradually highlights the contradiction between operating costs and pollution prevention.

2.2. Supervision Game of Ship Pollution in Port Areas

A growing body of research examines the game-theoretic dynamics of ship pollution supervision, focusing on the strategic interactions among maritime regulatory authorities, ship operators, and other stakeholders. These studies highlight communication challenges and conflicting interests that shape pollution control efforts. For instance, Li [19] investigates the interplay among three key actors in China’s watershed pollution control—namely the central government, local governments, and enterprises—using game theory to model their strategic behaviors. The analysis reveals the absence of a pure-strategy Nash equilibrium, suggesting that a mixed-strategy Nash equilibrium more accurately captures the probabilistic decision-making of these actors. In this context, the central government’s probability of supervision significantly influences the likelihood of collusion between local governments and enterprises aimed at evading environmental regulations. Stricter oversight reduces the incentives for such collusion, balancing the costs of supervision against regulatory compliance.
Some game-theoretic models applied to pollution control include Zhang et al. [20], who use the KMRW reputation model within an incomplete-information repeated-game framework to assess the stability of cooperative alliances in transboundary water pollution governance. The model identifies three critical factors—discount factor (δ), penalty factor (ε), and compensation factor (c)—that determine the stability of these alliances. Adequate compensation reduces reliance on penalties, while excessive penalties without compensation may deter cooperation. A Nash equilibrium emerges when a long cooperation period (high δ), balanced penalties (ε), and sufficient compensation (c) incentivize even untrustworthy actors to cooperate until the final stage, maximizing their utility and stabilizing the alliance. Jiao and Liu [14] develop an evolutionary game model to study inland waterway vessels’ pollution prevention decisions, incorporating the bounded rationality of shipowners. Treating the ship population as an evolving system, the model shows that when pollution control costs are low and benefits are high, all ships will eventually adopt control measures, regardless of their initial behaviors. Conversely, when the costs exceed the benefits, most ships will abandon pollution control efforts. In intermediate cases, ships adapt their strategies through learning and imitation, converging toward a stable proportion of pollution-controlling vessels. Guo et al. [21] propose a social welfare maximization game model to analyze interactions between the government and two competing enterprises under a total sewage emission control policy. The model suggests dynamic policy adjustments: tightening controls when sewage stock (S) increases and relaxing them when it decreases. When enterprises have differing pollution control costs (e.g., due to technological disparities), uniformly strict emission limits reduce overall social welfare, necessitating differentiated policies based on enterprise characteristics, such as scale, profitability, and technical capacity.
In the game of pollution prevention and control, strategic conflicts and policy interventions significantly influence the dynamics. Wang and Zhang [22] argue that profit-driven enterprises often resort to illegal sewage discharge, creating conflicts with governments and the public. Effective interventions include strengthening penalties for excessive emissions, reducing regulatory oversight costs, enhancing tax rebate systems to lower compliance costs, and maintaining transparent violation records for public disclosure. Internally, intensifying enterprise supervision mitigates the tragedy of the commons and supports the development of sustainable monitoring frameworks.
Research on ship pollution prevention and control can be roughly divided into two categories based on geographical location: river basin ship pollution and ocean ship pollution. Regarding river basin pollution, Yan et al. [15] use game theory to analyze interactions between fully rational ships in both pairwise and system-wide contexts. When the costs of pollution prevention and associated losses exceed the benefits, ships lose motivation for control. However, when benefits outweigh the costs, adoption of control measures increases. Huang [23] applies cooperative game theory to analyze watershed pollution treatment costs, finding that cost reductions for some members raise costs for others. To maintain a stable coalition, additional benefits must be fairly distributed to compensate for those incurring increased costs, ultimately reducing overall treatment expenses. Regarding ocean pollution dynamics, ocean water bodies are more variable than river basins, leading to faster pollution diffusion [24]. Li [25], Wang [24], and Liao [26] systematically explore the types, characteristics, and causes of ship pollution, while Han and Yuan [27] address illegal discharge from a legal perspective, noting its spread through water flows. Song et al. [28] propose an integrated pollution prevention mechanism for watershed-estuarine-offshore zones.
Despite these valuable contributions, many existing studies remain heavily reliant on abstract theoretical models, failing to incorporate real-world cost structures, which limits their practical applicability. Furthermore, relatively few investigations address the specific complexities of port environments, particularly the presence of mobile pollution sources like ships and the application of stochastic inspection mechanisms. These research gaps underscore the need for context-sensitive, empirically grounded studies to inform the development of more effective and adaptive environmental governance strategies in maritime settings.

3. Supervision Game Model

This study discusses the inspection behavior of whether the sulfur content of fuel oil in marine ships meets the standard, which occurs when the ship is docked at the port. China’s emission control area is a polygonal area within China’s territorial waters, and the government maritime department has the right to conduct random inspections of any ship in this area. However, observing at sea and directly intercepting and inspecting is unrealistic because the sea breeze and current are strong, and intuitively judging whether a ship is using fuel with excessive sulfur content is impossible. Therefore, the maritime department can hardly intercept and inspect directly at sea, and the cost of manpower, material resources, and time for inspection is high. For the ship and its crew, inspections disturb the daily operation of the ship, and when the ship is sailing at sea, not only are the winds and waves heavy but the boiler of the ship is still in operation, which is prone to accidents. Thus, this is fundamentally different from the inspection of ships in an inland environment. The government has jurisdiction over the entire inland river basin, and the flow rates of rivers and lakes are also relatively slow. The government can intercept suspicious ships for inspection while they are sailing, which is not possible in a marine environment.
Therefore, if the government maritime department wants to inspect the ship, it can only choose to do so when the ship is docked at the port. To meet business needs, ships always have time to stop at the port for loading and unloading of goods, rest, and replenishment of materials. At this time, it is most suitable for supervisors to board the ship to inspect the boiler and braking equipment and judge whether fuel oil that meets the standard is used in the control area according to the inspection results. Finally, even if the inspection by the government maritime department only occurs when the ship is docked at the port, this kind of inspection can only be a random inspection.
To define the scope of this study clearly, the ships discussed in this study refer to river–sea direct ships and ocean-going ships, excluding inland ships. In addition, ships used for military and government official purposes are not within the scope of the study, and small ships under 20 gross tonnages are also excluded because these small ships cannot sail at sea. The ship fuel emission pollution discussed in this study belongs to the inevitable emission pollution after the combustion of power fuel. This kind of pollution has two major characteristics. First, it is unavoidable because all ships using fuel power objectively produce this type of pollution. Second, the better the fuel quality, the lower the pollution level. The fewer pollutants (represented by sulfur) in the fuel oil, the less objective emissions after combustion. A scrubber can also be installed to filter and desulfurize the exhaust gas after fuel combustion to reduce pollution. The ship fuel oil standard discussed in this study, according to the “Implementation plan of ship air pollutant emission control area” by the Ministry of Communications of China, will enter China’s emission control area from 1 January 2020, and ships should use fuel with a sulfur content of less than 0.1% m/m or must be equipped with a scrubber [6]. Therefore, the fuel oil discussed in this study is the fuel oil with a sulfur content less than or equal to 0.1% m/m, which is also called clean fuel oil or light sulfur fuel oil. Fuels with a sulfur content greater than 0.1% m/m are also called high-sulfur fuels.

3.1. Design of the Supervised Game Model

3.1.1. Supervised Game Model

The players involved in the game analysis discussed in this study are the government maritime supervision department and the ship operating legal person, hereinafter referred to as the government and the ship owner, respectively. The government maritime supervision department has the right to inspect the ships in the port. The main body of pollution prevention and control in this study is the marine ships. The legal person of the ship is responsible for the operation, profit, and loss, and the shipowner has the decision-making power over the behavior of the ship. Therefore, the game analysis around the prevention and control of ship pollution is a game between the government and the shipowner, and the two constitute the main body of the game analysis. Regarding the behavior of the game subject, the government has the power of inspection and can inspect the ship or not. The shipowner has all the decision-making powers related to the ship and can decide to use the oil in compliance with the law or use the oil illegally, referred to as law-abiding or illegal. With regard to game analysis, this study is only designed for the initial game situation of the two sides and does not discuss the long-term scale of the continuous game and the game results.

3.1.2. Parameters of the Supervised Game Model

The selection of the parameters of the supervised game model mainly comes from the compilation of literature and actual data. According to Wang and Zhang [22], in the game analysis of watershed pollution prevention and control between enterprises and the government, the parameters considered include the income of enterprises due to excessive pollution discharge and the cost of watershed pollution prevention and control. Huang [23] also considered the cost of pollution control in the game analysis of watershed pollution. Another part of the parameters refers to the literature on corporate pollution and government supervision. For example, Li et al. [29] and Zheng [30] proposed that the government can subsidize excellent law-abiding environmental protection enterprises to encourage such enterprises to continue to maintain law-abiding behavior so as to reduce the burden of law-abiding enterprises due to compliance with environmental protection norms. Moreover, relevant real-world data, such as the cost of government inspections and the cost of changing ships’ oil, are considered. To ensure the model’s clarity and accessibility, Table 1 provides a concise summary of the primary symbols employed in the game framework. In this study, a parameter with a positive sign means income and gain; a parameter with a negative sign means loss and cost.

3.1.3. Development of the Supervised Game Model

In the supervision game between the government and shipowners studied in this study, the participants in the game are composed of the inspecting party’s government maritime department (X) and the inspected party’s ship owner (Y). From the perspective of X, Y does not comply with the regulations on marine fuel oil standards when X chooses to inspect, and Y complies with the regulations on marine fuel oil standards when X chooses not to inspect. From the perspective of Y, X does not inspect when Y chooses not to comply with the marine fuel standard regulations, and X inspects when Y chooses to comply with the marine fuel standard regulations. X and Y do not know in advance what kind of game behavior the other party will take. In the game, X and Y make decisions approximately simultaneously, and finally, the game results show a random probability distribution.
Therefore, according to Table 2, the government has four situations, which are described as follows:
(1)
When the government chooses to inspect, and the shipowner chooses to comply with the regulations on marine fuel oil standards, the benefit of government = social indirect benefit − inspection cost of government − enterprise subsidy = +fac.
(2)
When the government chooses to inspect, and the shipowner chooses not to comply with the regulations on marine fuel oil standards, the benefit of government = fines imposed by the government − inspection cost of government = +da.
(3)
When the government does not inspect, and the shipowner chooses to comply with the regulations on marine fuel oil standards, the benefit of government = social indirect benefit − enterprise subsidy = +fc.
(4)
When the government does not inspect, and the shipowner chooses not to comply with the regulations on marine fuel oil standards, the benefit of government = − cost of environmental pollution directly controlled by the government − indirect social loss suffered by the government = −ef.
According to Table 3, shipowners also have four situations, which are described as follows:
(1)
When the government chooses to inspect, and the shipowner chooses to comply with the regulations on marine fuel oil standards, the benefit of the shipowner = −the increased cost of the ship using oil in compliance with the law + enterprise subsidy = −b + c.
(2)
When the government chooses to inspect, and the shipowner chooses not to comply with the regulations on marine fuel oil standards, the benefit of the shipowner = −fines imposed by the government = −d.
(3)
When the government does not inspect, and the shipowner chooses to comply with the regulations on marine fuel oil standards, the benefit of the shipowner = −the increased cost of the ship using oil in compliance with the law + enterprise subsidy = −b + c.
(4)
When the government does not inspect and the shipowner chooses not to comply with the regulations on marine fuel oil standards, the shipowner’s benefit is 0.
Based on Table 2 and Table 3, the combined strategies and benefits can be obtained, as shown in Table 4. According to Table 4, the following can be observed:
(1)
When the ship is law-abiding, the benefit of the government choosing to inspect (−a + fc) is less than the benefit of the government choosing not to inspect (+fc); thus, when the ship is law-abiding, the government adopts the strategy of not inspecting, which is always established.
(2)
When the shipowner chooses not to comply with the regulations on marine fuel oil standards, the benefit of the government choosing to inspect is −a + d, and the benefit of the government choosing not to inspect is −ef.
(3)
When the government chooses to inspect, the benefit for the shipowner choosing to comply with the marine fuel oil standard is −b + c, and the benefit for the shipowner choosing not to comply with the marine fuel oil standard is −d.
(4)
When the government does not inspect, the benefit for the shipowner choosing to comply with the marine fuel oil standard is −b + c, and the benefit for the shipowner choosing not to comply with the marine fuel oil standard is 0.

3.2. Equilibrium Solution of the Supervised Game Model

3.2.1. Equilibrium Solution

This study assumes that the probability of government inspection is α, and the probability of government non-inspection is 1 − α. The probability that the shipowner chooses to comply with the regulations on marine fuel oil standards is β, and the probability that the shipowner chooses not to comply with the regulations on marine fuel oil standards is 1 − β, and α ∈ [0, 1] and β ∈ [0, 1].
The equilibrium solution satisfies the following properties: First, it is the optimal solution that the current participants can choose for the opponent’s behavior, and its benefit is the largest. Second, the current participant’s change of strategy against the opponent’s behavior will not bring about an increase in revenue, that is, the strategy does not need to be changed. Thus, the equilibrium solution of the supervised game model can be derived in accordance with these two equilibrium properties.
The equilibrium solution can be solved in accordance with property 1. First, the expected benefit of the participant can be defined as D, and then the expected return of the participant (D) and the derivative of the expected return D with the probability P can be calculated. When dD/dP = 0, the probability P of letting D be the maximum value can be obtained, and then the equilibrium solution can be obtained.
Therefore, according to Table 1 and Table 2, the expected benefits of the government and the shipowner can be obtained, respectively, as shown in Equations (1) and (2).
D g o v e r n m e n t = D I n s p e c t i o n , L a w a b i d i n g + D N o n i n s p e c t i o n , L a w a b i d i n g + D I n s p e c t i o n , N o t   l a w a b i d i n g + D N o n i n s p e c t i o n , N o t   l a w a b i d i n g + = α β a + f c + α 1 β a + d + 1 α β f c + 1 α 1 β × 0
D s h i p o w n e r = D I n s p e c t i o n , L a w a b i d i n g + D N o n i n s p e c t i o n , L a w a b i d i n g + D I n s p e c t i o n , N o t   l a w a b i d i n g + D N o n i n s p e c t i o n , N o t   l a w a b i d i n g + = α β b + c + α 1 β d + 1 α β b + c + 1 α 1 β × 0
Next, the derivative of Dgovernment by the probability α (dDgovernment/) and the derivative of Dshipowner by the probability β (dDshipowner/) can be calculated in accordance with Equations (1) and (2), respectively. Then, dDgovernment/ = 0 and dDshipowner/ = 0 can be solved, as shown in Equations (3) and (4).
d D g o v e r n m e n t d α = β d e f + a + d + d + f = 0 β = a + d + d + f d + d + f
d D s h i p o w n e r d β = α b + c + α d + 1 α b + c = 0 α = b c d
According to Equations (3) and (4), the probability of government inspection (α) with Dgovernment being the maximum values is α = (b − c)/d, and the probability that the shipowner chooses to comply with the regulations on marine fuel oil standards (β) with Dshipowner being the maximum values is β = (−a + d + e + f)/(d + e + f).
The equilibrium solution can be solved in accordance with property 2. An equilibrium solution occurs when, for a player, the payoffs of its alternative strategy A and strategy B appear as TA = TB. Therefore, for the government and the shipowner, when TInspection = TNon-inspection and TLaw-abiding = TNot law-abiding, an equilibrium solution can be obtained, and then the probability of government inspection (α) and the probability that the shipowner chooses to comply with the regulations on marine fuel oil standards (β) are shown in Equations (5) and (6).
T I n s p e c t i o n = T N o n i n s p e c t i o n β a + f c + 1 β a + d = β f c + 1 β e f β = a + d + e + f d + e + f
T L a w a b i d i n g = T N o t   l a w a b i d i n g α b + c + 1 α b + c = α d + 1 α × 0 α = b c d
According to Properties 1 and 2, when the expected return is maximized, the equilibrium probabilities of α and β can be obtained when the equilibrium occurs, and the solutions of Properties 1 and 2 about α and β are equal.

3.2.2. Equilibrium Expected Benefit

Assume that the equilibrium probability is p* when the equilibrium solution is established; when the equilibrium solution is reached, there is an expected benefit T for any party, satisfying T|p* = TA|p* = TB|p*.
Therefore, for the government, when the equilibrium solution is reached, the expected benefit of the government (Tgovernment) can obtain two results, namely TInspection|p* = β and TNon-inspection|p* = β, where the equilibrium solution probability (β) is shown in Formula (5). Then, the equilibrium solution probability (β) is substituted into the TInspection|p* = β and TNon-inspection|p* = β to obtain two results, which are shown in Equations (7) and (8), respectively, and the results of Equations (7) and (8) are equivalent, that is, Tgovernment|p* = β = TInspection|p* = β = TNon-inspection|p* = β.
For the shipowner, when the equilibrium solution is reached, the expected benefit of the shipowner (Tshipowner) also has two outcomes, namely TLaw-abiding|p* = α and TNot law-abiding|p* = α, where the equilibrium solution probability (α) is shown in Equation (6). Then, the equilibrium solution probability (α) is substituted into the TLaw-abiding|p* = α and TNot law-abiding|p* = α to obtain two results, which are shown in Equations (9) and (10), respectively, and the results of Equations (9) and (10) are equivalent, that is, Tshipowner|p* = α = TLaw-abiding|p* = α = TNot law-abiding|p* = α.
T g o v e r n m e n t | p * = β = T I n s p e c t i o n | p * = β = β a + f c + 1 β a + d | p * = β = a + e + f + d f c d e + f + d a + d
T g o v e r n m e n t | p * = β = T N o n i n s p e c t i o n | p * = β = β f c + 1 β e f | p * = β = a + e + f + d 2 f c + e e + f + d e f
T s h i p o w n e r | p * = α = T L a w a b i d i n g | p * = α = α b + c + 1 α b + c | p * = α = c b
T s h i p o w n e r | p * = α = T N o t   l a w a b i d i n g | p * = α = α d + 1 α × 0 | p * = α = b c d × d = c b

3.3. Discussion on the Significance of Equilibrium Solutions

First, in accordance with Equations (4) and (6), the inspection probability of government (α) can be obtained and is shown as α = (b − c)/d and α ∈ [0, 1], where b is the increased cost of the ship using oil in compliance with the law, c is the enterprise subsidy of government, and d is the fines imposed by the government.
(1)
With other parameters unchanged, the inspection probability (α) is positive for the increased cost of the ship using oil in compliance with the law (b). It means that the greater the cost increase caused by the replacement of low-sulfur clean fuel oil by ships, the more shipowners may avoid the implementation of the low-sulfur clean fuel oil replacement regulations; thus, theoretically, the probability of inspection should be higher. Therefore, when the green transformation of the shipping industry is more time-consuming and labor-intensive, more tracking and supervision by the government should be in place.
(2)
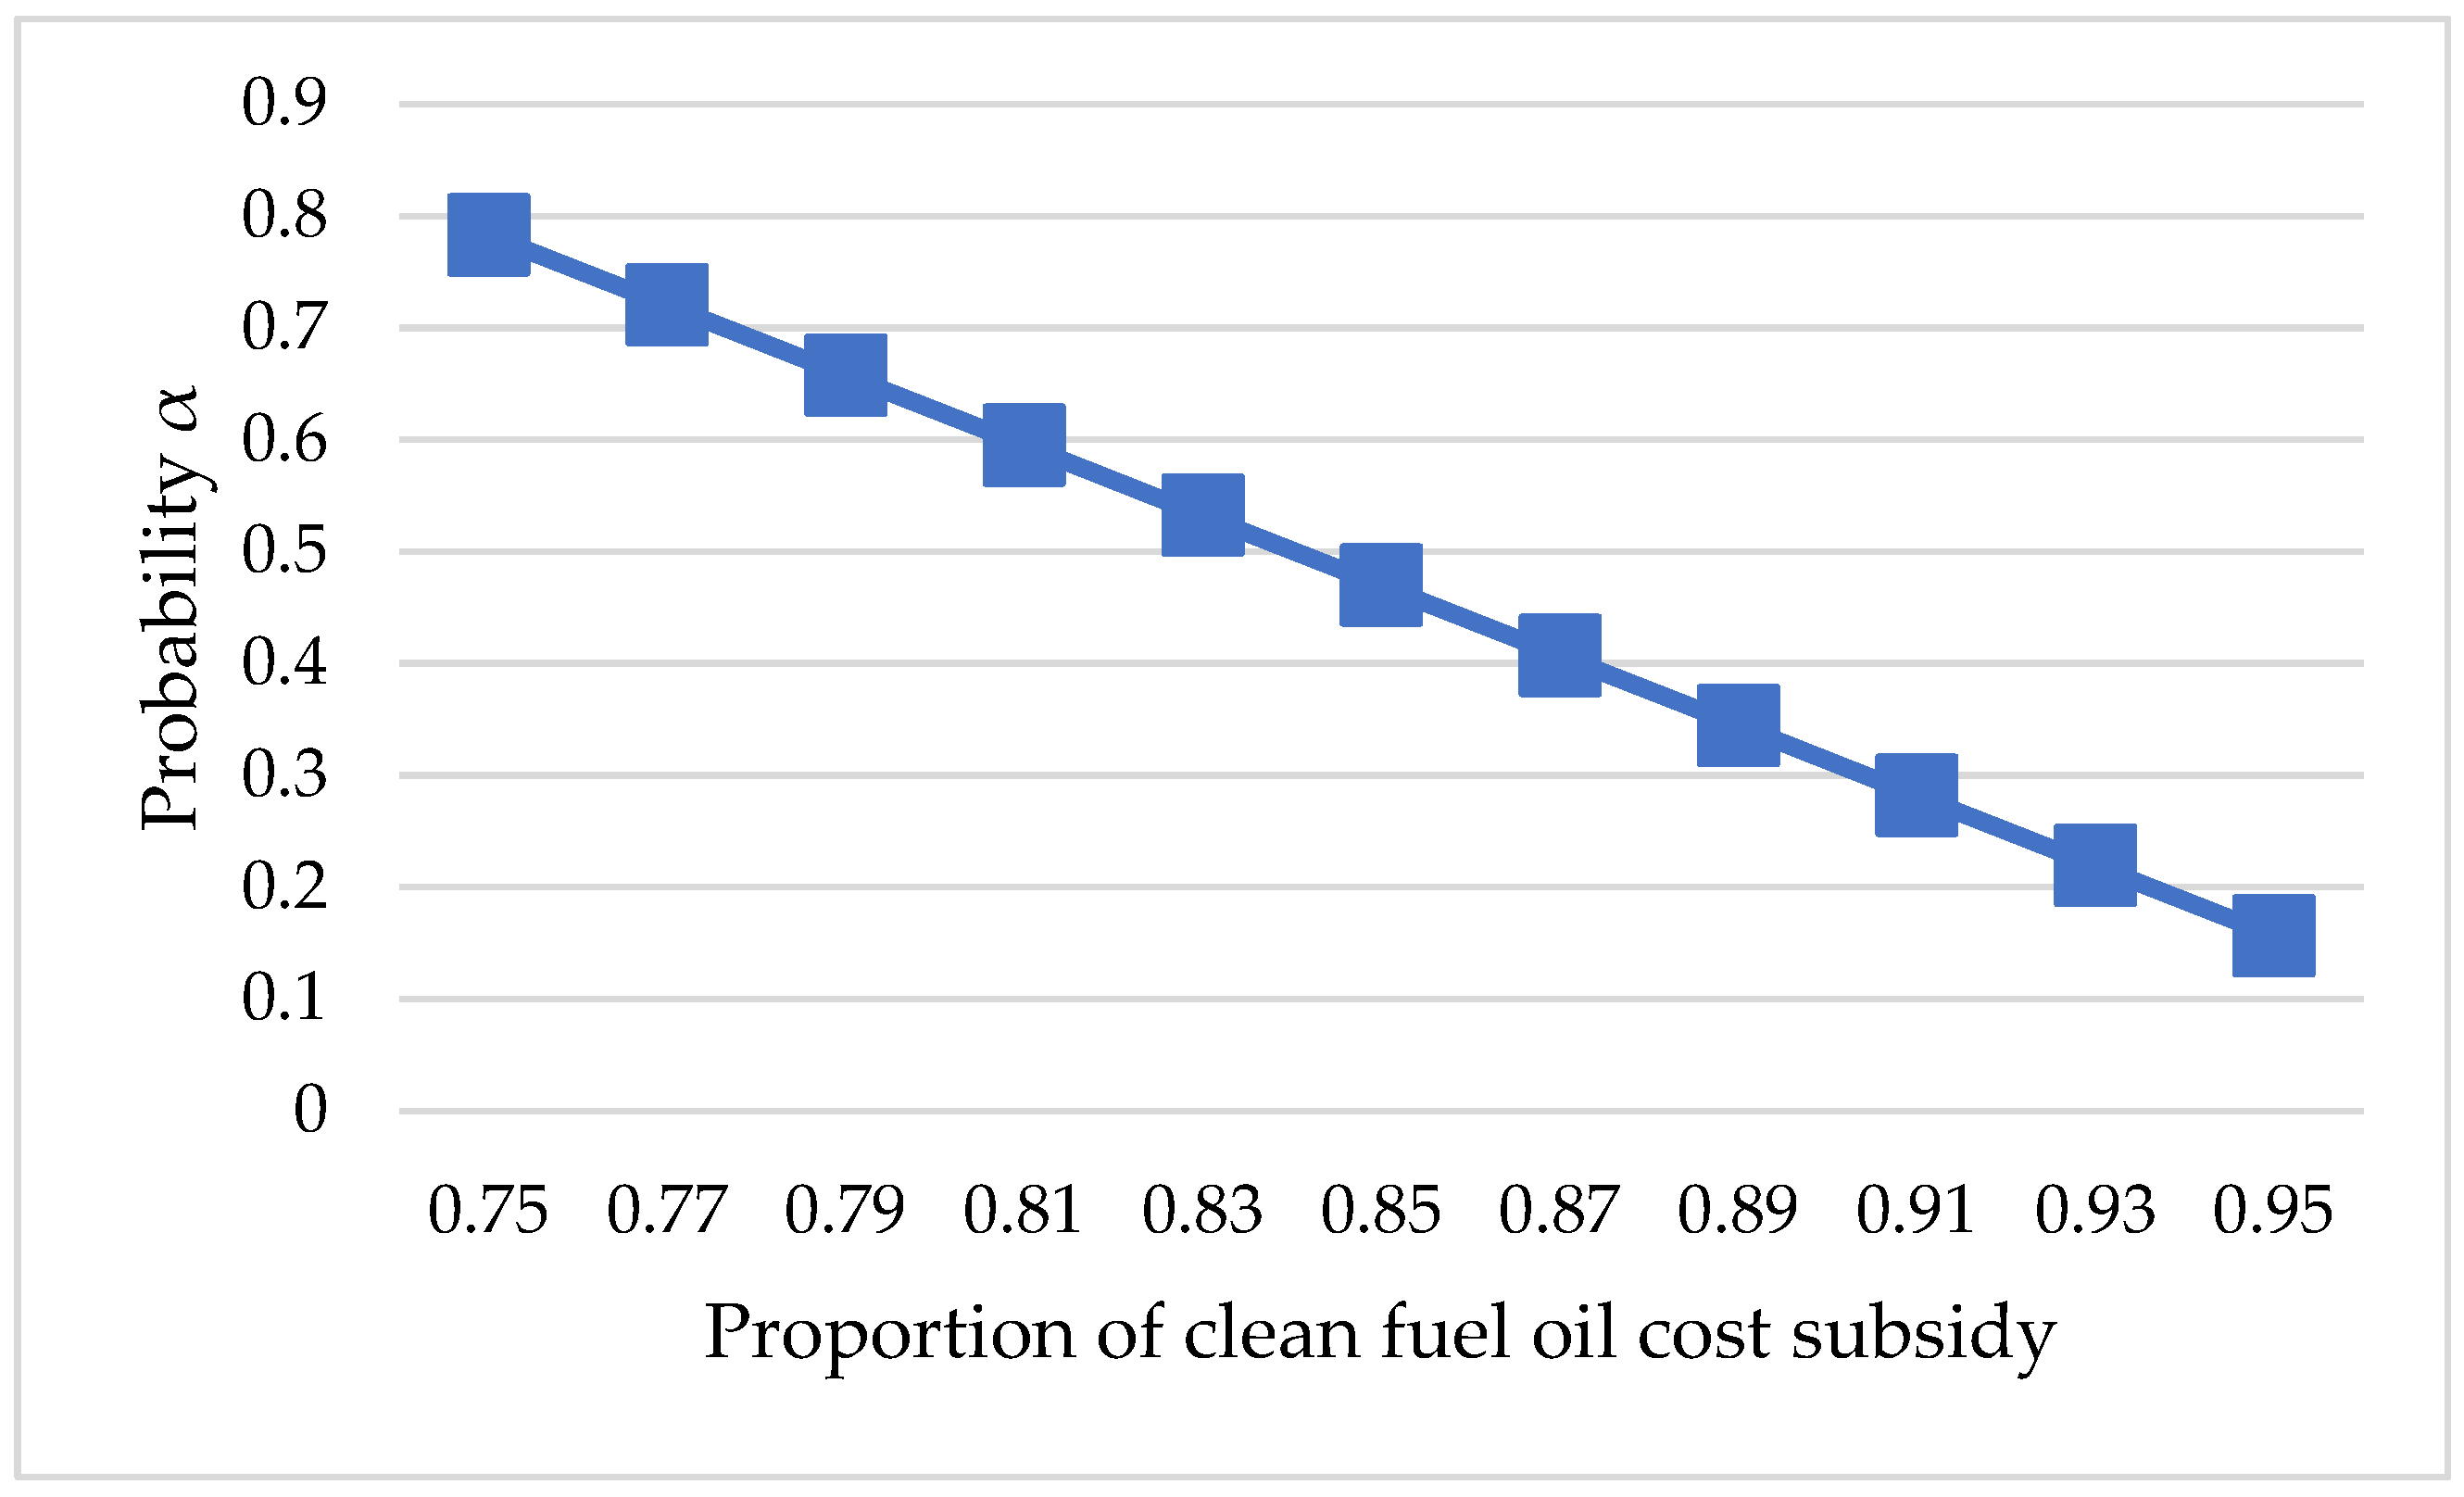
With other parameters unchanged, the inspection probability (α) is negatively correlated with the enterprise subsidy (c). It means that the greater the government subsidy to enterprises, the lower the cost of replacing low-sulfur clean fuel oil for ships, and the more willing shipowners are to replace low-sulfur clean fuel oil; thus, theoretically, the probability of inspection should be lower. Further, if the increased cost of the shipowner’s law-abiding use of low-sulfur clean fuel oil is equal to the government’s corporate subsidy (b = c), that is, the cost of the shipowner’s law-abiding use of low-sulfur clean fuel oil is fully subsidized by the government, and when the government bears all the costs, the inspection probability is zero. In other words, theoretically, if the government decides to subsidize the increased cost of the shipowner fully due to the replacement of low-sulfur clean fuel oil, whether the shipowner abides by the legal oil use regulations does not need to be checked. Therefore, in the context of green emission reduction in the shipping industry, government subsidies are not only meant to share the cost of emission reduction with ship operators but also to reduce the government’s own inspection costs and encourage shipping operators to speed up their green transformation.
(3)
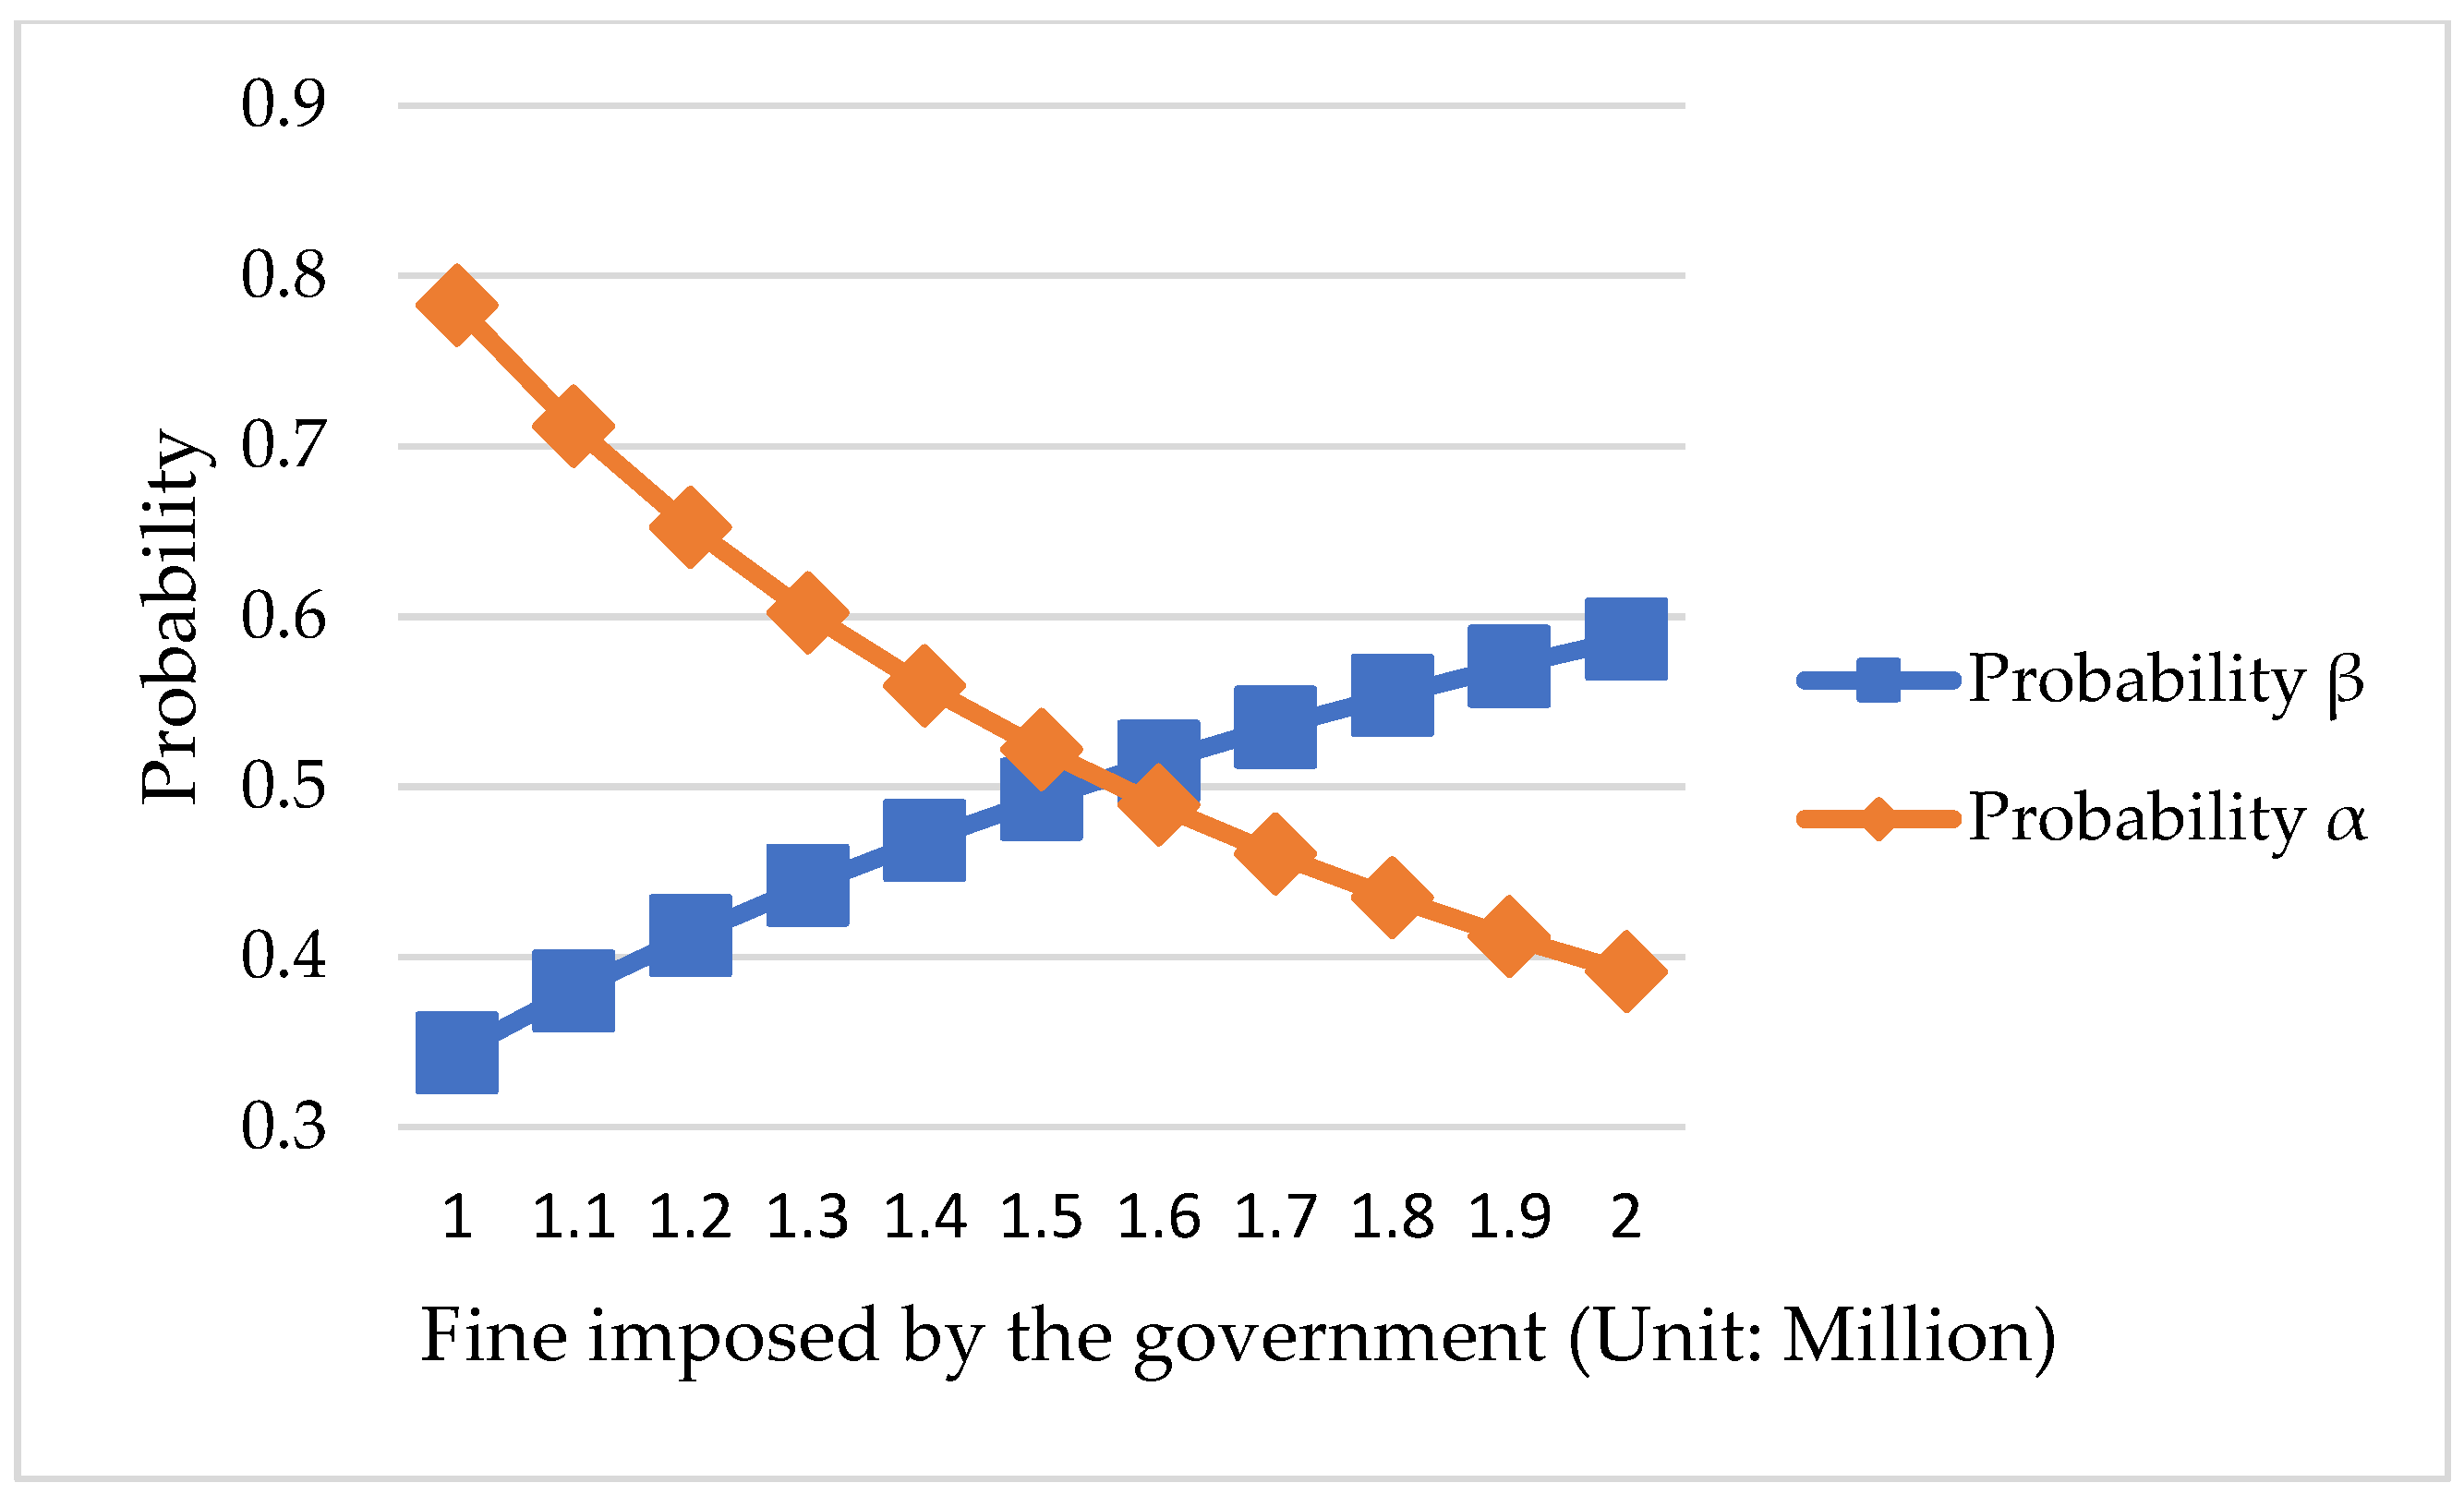
With other parameters unchanged, the inspection probability (α) is negatively correlated with the fines imposed by the government (d), that is, the greater the government fine, the greater the deterrent effect on the shipowner; thus, the theoretical inspection probability can also be reduced. Therefore, a fine with sufficient punishment will also reduce the probability of government inspection and reduce the cost of government enforcement. Further, assuming that the enterprise subsidy of the government is equal to 0 (c = 0), that is, when the government does not subsidize the cost of replacing low-sulfur clean fuel oil, the government inspection probability is rewritten as α = b/d. Given that α ∈ [0, 1], that is, the fines imposed by the government (d), and the increased cost of the ship using oil in compliance with the law (b) should satisfy bd, this means that government fines should be heavy enough to attract the attention of ship operators, that the violation of the law of the ship industry must be investigated, and that the law enforcement of the government maritime department must be strict.
Second, according to Equations (3) and (5), the probability that the shipowner choosing to comply with the regulations on marine fuel oil standards (β) can be obtained, and then its partial derivative with respect to the parameters d, e, and f can be shown as Equation (11).
β d = 1 1 d + e + f 2 = 0 β e = 1 1 d + e + f 2 = 0 β f = 1 1 d + e + f 2 = 0
The results show that the fine imposed by the government (d), the cost of environmental pollution directly controlled by the government (e), and the indirect social loss suffered by the government due to environmental pollution (f) will not affect the probability that the shipowner chooses to comply with the regulations on marine fuel oil standards (β). Therefore, the main influence of the probability (β) is the government’s inspection cost of the ship (a), and the two have a negative correlation. When the government’s inspection cost of ships increases, it means that under the government’s limited budget resources, the scale of inspections on ships will be reduced, which may lead to shipowners’ flukes and reduce the probability of shipowners complying with the law. On the contrary, when the government’s inspection cost of ships decreases, it means that under the limited budget resources of the government, the scale of inspections on ships can be expanded, which can deter shipowners’ flukes and increase the probability of shipowners complying with the law.

4. Data Analysis of the Supervised Game Model

This study verifies the supervision game model using relevant literature and real data on Guangzhou and its ports in 2020.

4.1. Estimation of Parameters

  • Parameter a:
According to the research results of Fu and Liu [31], the cost of inspecting ships by government law enforcement agencies is classified in accordance with whether the ship has defects. If no defects are found when the vessel is inspected, the inspection cost is USD 607.20. In 2020, the exchange rate of USD to CNY was approximately 6.3474. To simplify the calculation, the exchange rate between USD and CNY is 1:6; thus, USD 607.20 equals approximately CNY 3643.20. If defects are found when inspecting the ship, the inspection cost is USD 910.80, equivalent to CNY 5464.80.
In accordance with the Guangzhou Port Supervision Annual Report [32] published by the Guangzhou Maritime Safety Administration in 2020, the supervision data of Guangzhou Port in 2020 can be obtained, including port state control and flag state control; the data results are shown in Table 5. According to Table 5, the cost of supervision and inspection of ships in Guangzhou Port in 2020 was approximately CNY 1,116,640.80.
  • Parameter b:
The price difference between high-sulfur diesel oil (0.5% m/m sulfur content) and light sulfur diesel oil (0.1% m/m sulfur content) used by ships is approximately USD 200 per ton, and the cost of purchasing and installing a desulfurization tower on a ship is also approximately USD 2.5 million to 4 million. Moreover, all costs and operational risks during the installation and use of the desulfurization tower are borne by the shipowner [33]. From this, the cost of additional expenses incurred by a ship due to the sulfur cap can be estimated.
First, according to the analysis of Shyu et al. [34], taking the post-Panamax container ships on the Europe–Asia route as an example, the voyage time of the ship for each voyage is approximately 71 days, which includes approximately 12.33 days (=4.22 + 8.11) for each voyage to sail in pollution emissions port control areas and berth at the port. During this period, the ship must replace the low-sulfur fuel oil; the cost of low-sulfur fuel oil is USD 222,964 (=142,468 + 80,496). In addition, considering the crew’s vacation and rest in port, the ship sails for approximately 260 days a year [33]; thus, the annual voyage of the ship is about three times (=260/71). Therefore, the cost of low-sulfur fuel oil required for ships sailing in pollution emission control areas and berthing at ports is USD 668,892 per year (=222,964 × 3).
Second, if you choose to use a desulfurization tower, the cost range is between USD 2.5 million and USD 4 million; thus, the average cost of installing a desulfurization tower is approximately USD 3.75 million. Due to the influence of high acidity in the fuel oil, the service life of the desulfurization tower hardly exceeds 10 years. Therefore, based on the 10-year service life, the average annual cost of installing the desulfurization tower is approximately USD 375,000.
Based on the cost of replacing the clean fuel oil and the cost of installing the scrubber, the estimated cost of the shipowner’s law-abiding oil is USD 521,946 (=(668,892 + 375,000)/2), which is equivalent to approximately CNY 3,131,676.
  • Parameter c:
According to the Guangzhou Port Ship Emission Control Subsidy Fund Management Measures, which published the general principles of fund management measures in 2019 [35], the subsidy for the increased cost of replacing clean fuel oil is approximately 70–75% of the increased cost. Therefore, this study chooses the highest subsidy amount as 75% of the increased cost (=CNY 3,131,676×0.75).
  • Parameter d:
According to Article 106 of Chapter VII of the Law of the People’s Republic of China on the Prevention and Control of Air Pollution, if a person violates the provisions of this law and uses fuel oil for ships that do not meet the standards or requirements, the maritime administrative agency and the competent fishery department shall impose a fine of not less than CNY 10,000 but not more than CNY 100,000 according to their duties; and according to Article 99, if the circumstances are serious, a fine of not less than CNY 100,000 but not more than CNY 1,000,000 may be imposed, and the people’s government has the right to order the suspension of business, production, and rectification [36]. Moreover, under the general provisions of the Air Pollution Prevention and Control Law, local governments have other local regulations and penalties. In consideration of the loss of business suspension, other local punishment measures, and the design of the minimum amount of CNY 10,000 and the maximum amount of CNY 1 million, setting the estimated value of the fine at CNY 1 million is appropriate.
  • Parameter e:
According to the Special Fund Arrangement Plan for the 2020 Pollution Prevention and Control Battle of the Guangdong Provincial Department of Ecology and Environment [37], Guangzhou City obtained and used CNY 700,000 in air pollution prevention and control funding for the dock renovation in 2020.
  • Parameter f:
According to the statistics of health and economic losses caused by air pollution in 76 key cities in China in 2014 selected by Ni [38], the medical and health losses caused by air pollution accounted for 1.33% of the GDP of the 76 cities. The statistic only considers additional health care expenditures due to causes such as premature death and disease and does not consider other losses, such as agriculture, construction, and industry.
Meanwhile, according to the 2020 Guangzhou Economic Operation Profile released by the Guangzhou Municipal Government, the GDP of Guangzhou in the year 2020 was CNY 2501.911 billion [39]. Given that the Guangzhou Municipal Government has not yet announced the relevant coefficient of the proportion of ship pollution in the total emissions in 2020, the Shenzhen Maritime Safety Administration measured the total amount of sulfur dioxide emitted by ships entering and leaving Shenzhen Port in 2012, accounting for the total amount of sulfur dioxide emissions in Shenzhen in that year (65.8% of the amount) [40]. Therefore, this coefficient is used in this study to measure the proportion of ship pollution in air pollution.
Finally, according to data released by the Guangzhou Municipal Government, the number of permanent residents in Guangzhou in 2020 will reach 18,676,605 [41]. From this we can base the total medical expenditure = GDP × medical burden coefficient × pollution emission coefficient of ships, which is the total medical expenditure paid due to air pollution, and the indirect expenditure per capita = total medical expenditure ÷ the number of resident populations in the region, which is the per capita medical expenditure paid for by air pollution. Therefore, the additional indirect social loss caused by air pollution in Guangzhou in 2020 can be estimated to be CNY 1200, as shown in Table 6. The indirect loss is the per capita medical cost loss.

4.2. Probability and Expected Benefit in Equilibrium

According to Table 2 and Table 3, the government and shipowners’ benefit matrices can be obtained by substituting the above parameter estimates into the calculation. The results are shown in Table 7 and Table 8 and are explained as follows:
(1)
When the ship is law-abiding, the benefit of the government choosing to inspect (CNY −3.4642 million) is less than the benefit of the government choosing not to inspect (CNY −2.3476 million). Thus, when the ship is law-abiding, the government adopts the strategy of not inspecting.
(2)
When the shipowner chooses not to comply with the regulations on marine fuel oil standards, the benefit of the government choosing to inspect (CNY −0.1166 million) is more than the benefit of the government choosing not to inspect (CNY −0.7012 million). Thus, the government adopts the strategy of inspecting when the ship is not law-abiding.
(3)
When the government chooses to inspect, the benefit for the shipowner choosing to comply with the marine fuel oil standard (CNY −0.7829 million) is more than the benefit for the shipowner choosing not to comply with the marine fuel oil standard (CNY −1.00 million). Thus, the shipowner adopts the strategy of complying when the government chooses to inspect.
(4)
When the government does not inspect, the benefit for the shipowner choosing to comply with the marine fuel oil standard (CNY −0.7829 million) is less than the benefit for the shipowner choosing not to comply with the marine fuel oil standard (CNY 0). Thus, the shipowner adopts the strategy of not complying when the government chooses not to inspect.
By substituting the parameter estimates into Equations (3) and (4), the probability of government inspection and the probability of shipowner abiding by the law can be obtained, respectively. Therefore, the probability that shipowners entering and leaving Guangzhou Port will comply with the regulations on replacing low-sulfur fuel is 34.36%, and the probability of Guangzhou Maritime Safety Bureau’s inspection of ships is 78.29%.
Then, in accordance with Equations (7) and (8), the expected benefits of government inspection and non-inspection can be obtained, respectively. The calculation results of these two equations are equal. Therefore, the Guangzhou Municipal Government’s expected benefit in the supervision game of ship low-sulfur fuel in 2020 was reasonably estimated to be CNY −1.2669 million.
Finally, in accordance with Equations (9) and (10), the expected benefits of shipowner law-abiding and not law-abiding can be obtained, respectively. Therefore, the expected benefits of shipowners entering and leaving Guangzhou ports in the supervision game of ship low-sulfur fuel in 2020 is CNY −0.7829 million.
α I n s p e c t i o n = b c d = 3.1317 2.3488 1.00 78.29 %
β L a w a b i d i n g = a + d + e + f d + e + f = 1.1166 + 1.00 + 0.70 + 0.0012 1.00 + 0.70 + 0.0012 34.36 %
T g o v e r n m e n t | p * = β = T I n s p e c t i o n | p * = β = a + e + f + d f c d e + f + d a + d = ( 1.1166 + 0.70 + 0.0012 + 1.00 ) ( 0.0012 2.3488 1.00 ) 0.70 + 0.0012 + 1.00 1.1166 + 1.00 = 1.2669   ( million )
T g o v e r n m e n t | p * = β = T N o n i n s p e c t i o n | p * = β = a + e + f + d 2 f c + e e + f + d e f = ( 1.1166 + 0.70 + 0.0012 + 1.00 ) ( 2 × 0.0012 2.3488 + 0.70 ) 0.70 + 0.0012 + 1.00 0.70 0.0012 = 1.2669   ( million )
T s h i p o w n e r | p * = α = T L a w a b i d i n g | p * = α = T N o t   l a w a b i d i n g | p * = α = c b = 2.3488 3.1317 = 0.7829   ( million )
According to the above analysis results, the expected benefits for the government and shipowners are negative, which is normal. The issue explored in this study is about the social costs caused by promoting the legal use of low-sulfur clean fuel in the marine shipping industry. The expected benefit results are negative, indicating the cost expenditures borne by the government and shipowners on this issue of low-sulfur clean fuel for ocean vessels.
Then, calculation results show that the probability of government inspection is 78.29%, and the probability of shipowners complying with the law is less than 40%, at only 34.36%. This result shows that in the early stages of introducing the sulfur cap, the government must conduct spot checks on ships through more frequent inspections to assess the compliance of the inspected ships with the sulfur cap. Meanwhile, under a high frequency of inspections, shipowners consciously improve their compliance with the sulfur cap to reduce the penalty costs caused by noncompliance with the sulfur cap. However, the expected benefit is negative. Therefore, relevant policies, such as encouraging ship operators to reduce emissions actively and use green oil, can continue to be implemented to reduce the pressure of increasing costs of replacing clean fuel and develop ship operators’ long-term good and conscious behavior of complying with the sulfur cap. Ultimately, the frequency and inspection costs of government supervision and inspections can also be reduced, forming a positive cycle for compliance with the sulfur cap.

4.3. Policy Implications of Equilibrium Outcomes

Policy instruments targeting ship emission control primarily include fuel subsidies for compliant fuel use and fines for the illegal use of high-sulfur marine fuels. According to the Administrative Measures for Ship Emission Control Subsidy Funds at Guangzhou Port (General Provisions of the Fund Management Measures, issued in 2019) [35], financial subsidies are provided to compensate for the incremental cost of switching to cleaner marine fuels, with the subsidy covering approximately 70% to 75% of the additional cost. In this study, the upper bound of 75% is adopted as the baseline subsidy rate. Additionally, the Law of the People’s Republic of China on the Prevention and Control of Atmospheric Pollution stipulates that ship operators using non-compliant fuels may be fined between CNY 10,000 and 100,000. In severe cases, as outlined in Article 99 of the same law, fines can escalate to between CNY 100,000 and 1,000,000, accompanied by administrative penalties such as suspension of operations imposed by local governments [36].
This study first explores the effect of enhancing the subsidy policy—specifically increasing the subsidy rate from 75% to 95%. As illustrated in Figure 1, such an increase leads to a reduction in the probability of government inspections, indicating that more generous subsidies not only incentivize compliance among shipowners but also lower the inspection burden for regulators, thus creating a mutually beneficial outcome. Second, the effect of strengthening penalty measures is examined by increasing the maximum fine from CNY 1 million to CNY 2 million. As shown in Figure 2, this adjustment significantly increases the probability that shipowners will choose to comply with marine fuel standards, thereby allowing for a potential reduction in inspection frequency without compromising regulatory effectiveness.
Overall, the results suggest that both enhanced fines and strategically calibrated subsidies can effectively alter shipowner behavior while simultaneously reducing the regulatory workload for government authorities. The supervisory game-theoretic framework thus not only offers predictive insights but also serves as a practical tool for optimizing port emission control policies.

5. Monitoring Strategic Recommendations

5.1. Government’s Long-Term Re-Inspection Strategy

According to the conclusion of the previous section, the probability of government inspection is related to shipowners’ fines, subsidies, and compliance costs. However, this is only a random inspection policy suggestion based on an equilibrium solution. In the policy implementation process, more factors must be considered when designing the inspection plan. The most important thing is that the supervision game between shipowners and the government is a long-term repeated game. Ships will not enter and exit the port only once, and the government will not only conduct a one-time supervision inspection on ships. Moreover, it is only partially reasonable for the government to always perform inspections at the same frequency on all ships in the long term. This ignores the historical information of the game between the government and the shipowner, and historical data need to be explored and utilized fully. Moreover, when the government performs inspections, it will subjectively hope to find ships with emission pollution problems as much as possible. Therefore, if a ship has accumulated multiple good inspection results, high-frequency inspections of this ship are a waste of resources. On the contrary, if the ship has accumulated multiple poor inspection results, it is more meaningful to increase the inspection frequency of this ship.

5.2. Recommendation for the Government’s Long-Term Re-Inspection Strategy

After considering the results of historical inspections, the government’s inspection design should be able to vary from ship to ship. That is:
(1)
The inspection frequency should be appropriately reduced for ships with good cumulative inspection performance.
(2)
The inspection frequency should be appropriately increased for ships with poor cumulative inspection performance.
(3)
The design of the inspection frequency should be dynamically modified, which can change according to the ship’s behavior. The modification of the inspection frequency design is based on the ship’s past inspection performance. Therefore, this paper designs a long-term re-inspection plan for the government based on the sampling inspection with adjustment proposed by Montgomery [42].
First, assume that the probability of the government inspecting the shipowner’s ship is α, and then three different values of α are considered, namely α1, α2, α3, and α1 < α2 < α3. The probability α1 indicates that the probability of the government inspecting the shipowner’s ship is lower, which is the inspection probability for shipowner’s ships with good historical inspection results. The probability α2 means that the probability of the government inspecting the shipowner’s ship is medium, that is, the probability that the government inspects the shipowner’s ship for the first time or has a small historical inspection record. The probability α3 indicates that the government has a high probability of inspecting the shipowner’s ship, which is the inspection probability of the shipowner’s ship with poor historical inspection results.
Then, Figure 3 shows the government’s inspection process for shipowners’ ships. The detailed process is as follows.
(1)
All ships inspected for the first time are carried out according to the inspection probability α2.
(1)
If the following conditions occur at the same time: 5 consecutive inspections passed, the ship-related inspection documents submitted by the shipowner are complete and without omissions, and the government administrative review and approval are passed, etc., then the probability of the government inspecting the shipowner’s ship can be adjusted to α1.
(2)
If one of the following conditions occurs: the ship fails the most recent inspection, the shipowner conceals or falsifies the ship-related inspection documents submitted, the necessary conditions for government inspection regulations change, etc., the probability of the government inspecting the shipowner’s ship will be adjusted to α3.
(2)
For ships with an inspection probability of α1, if one of the following conditions occurs: the result of the most recent inspection is a failure, the relevant ship inspection documents submitted by the shipowner expire or become invalid, the necessary conditions for government inspection regulations change, etc., then the inspection probability of the ship will be adjusted to α2.
(3)
For ships with an inspection probability of α3, if one of the following conditions occurs: 5 consecutive inspections passed, the ship-related inspection documents submitted by the shipowner are complete and without omissions, and the government administrative review and approval are passed, etc., then the probability of the government inspecting the shipowner’s ship can be adjusted to α2.
The approach proposed in this study is conceptually informed by the risk-based inspection frameworks established under the Paris and Tokyo MoUs. However, it extends these models by integrating supervisory game theory and dynamically adjusting the inspection probability (α) based on shipowners’ historical compliance performance. This results in a more adaptive and economically grounded strategy. In contrast, the current inspection regime under China’s Maritime Safety Administration (MSA) (e.g., Guangzhou) is predominantly policy-driven, relying on administrative planning rather than a structured risk-tiering system. While the Paris and Tokyo MoUs represent mature international frameworks that determine inspection frequency through a combination of historical performance and predefined risk factors (Table 9), the method presented in this study addresses key limitations of the China MSA model by introducing a responsive, risk-sensitive mechanism. Moreover, this approach holds the potential for future integration with international systems by embedding economic considerations—such as subsidies and penalties—directly into the decision-making logic. In doing so, it enhances both the flexibility and effectiveness of port-state control enforcement strategies.

6. Conclusions and Future Research

6.1. Conclusions

The public management functions of government must be better utilized in the context of the gradual implementation of the sulfur cap and the greening of the shipping industry. Through policy formulation, administrative law enforcement, supervision, and management, the government can promote green emission reductions in the shipping industry and encourage shipowners to be more active in desulfurizing oil, which is crucial to the protection of the atmospheric environment in coastal cities.
This study collects relevant literature and prevention and control experience and uses game theory methods to study the emission reduction cost game between the government and shipowners around air pollution prevention and control. Meanwhile, on the basis of the relevant data of the Guangzhou Municipal Government on port and air pollution control in 2020 and a relevant literature survey, the costs of various parameters are reasonably estimated. Finally, the parameter estimates are substituted into the game model to analyze and discuss the costs and benefits of the government and shipowners on air pollution prevention and control. Based on empirical parameters from Guangzhou Port, the model reveals that a 78.29% inspection probability and a 34.36% compliance probability are achieved under current cost structures. These findings suggest that targeted increases in subsidies or fines can significantly improve compliance behavior while reducing the need for costly inspections.
The supervisory game framework developed in this study provides a novel analytical tool for balancing enforcement costs and environmental benefits in the context of maritime air pollution control. By quantifying the interaction between government actions and enterprise compliance, the model offers a policy-relevant basis for designing more efficient and adaptive regulatory mechanisms.

6.2. Future Research

Future research could expand on this model in several directions. One promising area is the extension to dynamic or repeated game frameworks, where shipowners adjust behavior over time in response to past inspections. Another is to incorporate heterogeneity across ports or vessel types, allowing for differentiated policy strategies. Finally, integrating third-party certification mechanisms or digital fuel monitoring technologies could provide a richer representation of real-world enforcement systems. These enhancements would help further align game-theoretic modeling with the evolving complexities of green port governance.

Author Contributions

Conceptualization, C.-K.K.; methodology, C.-K.K. and D.-L.Z.; validation, C.-K.K.; formal analysis, C.-K.K. and D.-L.Z.; investigation, D.-L.Z.; data curation, D.-L.Z.; writing—original draft preparation, C.-K.K. and D.-L.Z.; writing—review and editing, C.-K.K. All authors have read and agreed to the published version of the manuscript.

Funding

This research received no external funding.

Data Availability Statement

The original contributions presented in this study are included in the article. Further inquiries can be directed to the corresponding author.

Conflicts of Interest

The authors declare no conflict of interest.

References

  1. Chen, X.J.; Jia, L.Q.; Jia, T. Overview and Characteristics of China’s Islands: Based on “Statistical Communiqué on China’s Island Survey in 2017”. China Geol. 2021, 4, 756–758. [Google Scholar]
  2. Wang, J.J. Port-city Development in China. In Handbook on Transport and Urban Transformation in China; Chen, C.L., Pan, H.X., Shen, Q., Wang, J.J., Eds.; Edward Elgar Publishing: Northampton, MA, USA, 2020; pp. 19–35. [Google Scholar]
  3. Cui, X.Y. Prevention and Control of Ship Pollution and Analysis of Effective Treatment of Port Environmental Pollution. Energy Conserv. Environ. Prot. 2020, 5, 20–21. [Google Scholar]
  4. Zis, T.P.; Cullinane, K. The Desulphurisation of Shipping: Past, Present and the Future Under a Global Cap. Transp. Res. Part D Transp. Environ. 2020, 82, 102316. [Google Scholar] [CrossRef]
  5. Liu, Y.; Zhang, Z.Y. Common Legal Risks and Countermeasures for China and Hong Kong Shipping Companies during the Implementation of the Sulphur Cap. Marit. China 2021, 3, 42–45. [Google Scholar]
  6. Wang, J. Where will China’s Ship Emissions Reduction Go Under the Sulphur Cap? Transp. Constr. Manag. 2019, 6, 62–65. [Google Scholar]
  7. Zannis, T.C.; Katsanis, J.S.; Christopoulos, G.P.; Yfantis, E.A.; Papagiannakis, R.G.; Pariotis, E.G.; Rakopoulos, D.C.; Rakopoulos, C.D.; Valli, A.G. Marine Exhaust Gas Treatment Systems for Compliance with the IMO 2020 Global Sulfur Cap and Tier III NOx Limits: A Review. Energies 2022, 15, 3638. [Google Scholar] [CrossRef]
  8. Zou, J.; Yang, B. Evaluation of Alternative Marine Fuels From Dual Perspectives Considering Multiple Vessel Sizes. Transp. Res. Part D Transp. Environ. 2023, 115, 103583. [Google Scholar] [CrossRef]
  9. Announcement of the Maritime Safety Administration of the People’s Republic of China on the Implementation Plan for the 2020 Global Marine Fuel Sulfur Limits. Available online: https://www.egcsa.com/wp-content/uploads/China-MSA-implementation-regulation-on-IMO-2020-Google-English-translation.pdf (accessed on 23 October 2019).
  10. Guangzhou Port Authority; Guangzhou Ecological Environment Bureau; Guangzhou Maritime Safety Administration. Notice on the Management Measures for Guangzhou Port Ship Emission Control Subsidy Funds; Guangzhou Municipal People’s Government Gazette: Guangzhou, China, 2019; Volume 24, pp. 10–20. [Google Scholar]
  11. Liu, L.H.; Wang, L.; Sheng, Y. Research on the Negative Externality Cost of Air Pollutant Emission of Ships in Qingdao Port. Environ. Sci. Technol. 2021, 44, 196–201. [Google Scholar]
  12. Zeng, F.T.; Lu, J. Ship Emission Inventory and Valuation of Eco-efficiency in Xiamen Port. China Environ. Sci. 2020, 40, 2304–2311. [Google Scholar]
  13. Li, M.M.; Zhou, Z.J. Research on Ship Air Pollutant Emission List in Gaolan Port of Zhuhai. China Marit. Saf. 2021, 21, 54–56. [Google Scholar]
  14. Jiao, F.F.; Liu, J. Study of Inland Ship Water Pollution Control Policy Strategy based on Game Theory. IOP Conf. Ser. Earth Environ. Sci. 2018, 191, 012128. [Google Scholar] [CrossRef]
  15. Yan, C.G.; Jin, A.Y.; Zhu, X.G. Game Theory Based Water Pollution Control Making-Decision for Inland Waterway Ships. Tsinghua Forum Rule Law 2014, 28, 58–61. [Google Scholar]
  16. Cullinane, K.; Bergqvist, R. Emission Control Areas and Their Impact on Maritime Transport. Transp. Res. Part D Transp. Environ. 2014, 28, 1–5. [Google Scholar] [CrossRef]
  17. Wu, F. Problem Analysis and System Design of Ship Fueled with Low Sulfur Fuel Oil. Jiangsu Ship 2010, 27, 23–25+39. [Google Scholar]
  18. Tian, Y.J.; He, W.J.; Peng, C.S.; Ma, G.X. Assessment of the Costs and Environmental Benefits of Converting to the Low-Sulphur Oil for Berthing Vessels in the Pearl River Estuary Bay Are. Res. Environ. Sci. 2018, 7, 1322–1328. [Google Scholar]
  19. Li, S.W. Game Analysis of Water Pollution Control in China’s Watershed. IOP Conf. Ser. Earth Environ. Sci. 2018, 153, 062061. [Google Scholar] [CrossRef]
  20. Zhang, Z.F.; He, W.J.; An, M.; Degefu, D.M.; Shen, J.Q.; Yuan, L. Multi-Game Theory Analysis of Cooperation Stability of Trans-boundary Water Pollution Governance. Nat. Environ. Pollut. Technol. 2019, 18, 471–478. [Google Scholar]
  21. Guo, M.J.; Jiang, Z.Y.; Bu, Y.; Cheng, J.H. Supporting Sustainable Development of Water Resources: A Social Welfare Maximization Game Model. Int. J. Environ. Res. Public Health 2019, 16, 2896. [Google Scholar] [CrossRef]
  22. Wang, B.; Zhang, S.K. Game Analysis of Watershed Pollution Prevention and Control. Foreign Econ. Relat. Trade 2017, 7, 141–144. [Google Scholar]
  23. Huang, D.B. Research on Cost Control of Watershed Pollution Based on Cooperative Game. Environ. Sci. Manag. 2020, 45, 15–19. [Google Scholar]
  24. Wang, R. Analysis of the Impact and Prevention Control Strategy of Ship Pollution on the Marine Environment. China Water Transp. 2018, 18, 96–97. [Google Scholar]
  25. Li, Y.M. Current Situation and Control Measures of Ship Pollution Prevention and Control. China Water Transp. 2019, 8, 97–98. [Google Scholar]
  26. Liao, H.Z. Current Situation Analysis and Countermeasure Research on Marine Pollution Caused by Ships. Technol. Wind. 2020, 25, 100–101. [Google Scholar]
  27. Han, B.Z.; Yuan, G.H. Study on Difficult Issues of Marine Illegal Pollutant Disposal Administrative Penalty. China Marit. Saf. 2017, 3, 27–29. [Google Scholar]
  28. Song, S.; Guo, L.F.; Zhang, H.; Zhang, H. Research on Pollution Control Mechanism of Watershed, Estuary and Coastal Sea Areas. Mar. Environ. Sci. 2021, 40, 838–842. [Google Scholar]
  29. Li, L.P.; Li, Y.Y.; Gao, J. Prevention and Control Experiences of Pollution from Vessels and Ports in United States and Suggestions for China. Environ. Sustain. Dev. 2017, 42, 111–115. [Google Scholar]
  30. Zheng, X. Prevention and Control Measures for Ship Pollution of the Ocean. Mar. Equip./Mater. Mark. 2020, 8, 99–100. [Google Scholar]
  31. Fu, J.J.; Liu, C.L. Effectiveness Assessment of Statistics on Port State Control. World Shipp. 2011, 34, 50–52. [Google Scholar]
  32. Guangzhou Port State Control. Annual Report in 2020. Available online: https://www.sohu.com/a/449646329_120209847 (accessed on 2 September 2021).
  33. Liu, Z.K. Can the Shipowner Require the Charterer to Share the Cost of Low-sulfur Oil under the COA Contract? Marit. China 2020, 4, 50–51. [Google Scholar]
  34. Shyu, W.H.; Wang, C.M.; Chu, C.H.; Shu, L.C.; Chen, T.C. Analysis of the Evaluation Model of Bunker Adjustment Surcharge for Liner Shipping. Marit. Q. 2019, 28, 57–73. [Google Scholar]
  35. Policy Interpretation of the Notice of Guangzhou Port Authority, Guangzhou Ecological Environment Bureau and Guangzhou Maritime Safety Administration on Issuing Measures for the Management of Subsidy Funds for Ship Emission Control at Guangzhou Ports. Available online: http://www.gz.gov.cn/zwgk/zcjd/zcjd/content/mpost_3089284.html (accessed on 4 July 2019).
  36. Air Pollution Prevention and Control Law of the People’s Republic of China. Available online: http://www.mee.gov.cn/ywgz/fgbz/fl/201811/t20181113_673567.shtml (accessed on 13 November 2018).
  37. Announcement from the Office of the Department of Ecology and Environment of Guangdong Province on the Special Fund Arrangement Plan for Fighting Pollution Prevention and Control in 2020. Available online: http://gdee.gd.gov.cn/zjgl/content/post_2895851.html (accessed on 14 February 2020).
  38. Ni, Z.Y. Switching to China VI, the Post-processing Industry Chain will Welcome an Incremental Market of 500 Billion from 2020 to 2025; Southwest Securities: Chongqing, China, 2020; p. 2. Available online: https://pdf.dfcfw.com/pdf/H3_AP202011061427031398_1.pdf (accessed on 5 November 2020).
  39. A Brief Overview of Guangzhou’s Economic Operations in 2020. Available online: http://www.gd.gov.cn/zwgk/sjfb/dssj/content/post_3191492.html (accessed on 1 February 2021).
  40. Ships Have Become the Third Largest Source of Air Pollution—The Pollution of One Ship is Equal to 210,000 Trucks. Available online: http://politics.people.com.cn/BIG5/n/2015/0720/c70731-27327353.html (accessed on 20 July 2015).
  41. Guangzhou’s Permanent Population Exceeds 18 Million. Available online: http://www.gz.gov.cn/xw/jrgz/content/post_7283634.html (accessed on 16 May 2021).
  42. Montgomery, D. Introduction to Statistical Quality Control, 8th ed.; John Wiley & Sons: Hoboken, NJ, USA, 2019. [Google Scholar]
  43. Paris MoU Annual Report 2023. Available online: https://parismou.org/system/files/2024-07/Paris%20MOU%20Annual%20Report%202023.pdf (accessed on 1 July 2024).
  44. The Annual Report on Port State Control in the Asia-Pacific Region 2023. Available online: https://www.tokyo-mou.org/doc/ANN23-web.pdf (accessed on 1 April 2025).
Figure 1. Probability α.
Sustainability 17 03822 g001
Figure 2. Probability α and Probability β.
Sustainability 17 03822 g002
Figure 3. Transfer flowchart of ship inspection rules.
Sustainability 17 03822 g003
Table 1. Table of parameters.
SymbolDescription
aThe inspection cost of the government, that is, the cost paid by the government when it adopts an inspection strategy.
bTo comply with the law and reduce emissions, the cost of the ship using oil to comply with the law is increased, including oil changes or the installation of scrubbers.
cThe government subsidizes excellent law-abiding enterprises. This study only considers the subsidy for marine fuel.
dThe fine imposed by the government when the ship is found to be illegally using high-sulfur fuel oil during inspection.
eThe cost of environmental pollution is directly controlled by the government, that is, the cost paid by the government to directly control air pollution.
fThe indirect social loss suffered by the government due to environmental pollution, such as increased medical and health burdens. On the contrary, it is the indirect social benefit that the government expects to obtain after the environment is improved because the medical expenditure generated by the related environmental pollution can be converted into other social construction expenditures that generate social benefits.
αThe probability of government inspection.
βThe probability that the shipowner chooses to comply with the regulations on marine fuel oil standards.
Table 2. Benefit matrix of government.
Shipowner
Government Law-AbidingNot Law-Abiding
Inspectiona + fca + d
Non-inspection+fcef
Table 3. Benefit matrix of shipowner.
Shipowner
Government Law-AbidingNot Law-Abiding
Inspectionb + cd
Non-inspectionb + c0
Table 4. Benefit matrix of government vs. shipowner.
Shipowner
Government Law-AbidingNot Law-Abiding
Inspectiona + fcb + ca + dd
Non-inspection+fcb + cef0
Table 5. Inspection fees of ships in Guangzhou Port in 2020.
FSC/PSCWhether Defects Are Found During the Inspection of the ShipNumber of ShipsInspection Cost per ShipTotal
PSCNo defects exist20CNY 3643.20
(USD 607.20)
CNY 72,864.00
Defects exist13CNY 5464.80
(USD 910.80)
CNY 71,042.40
FSCNo defects exist135CNY 3643.20
(USD 607.20)
CNY 491,832.00
Defects exist88CNY 5464.80
(USD 910.80)
CNY 480,902.40
TotalCNY 1,116,640.80
Table 6. Indirect social loss caused by air pollution in Guangzhou in 2020.
Item of Indirect Social LossAmount
GDP of Guangzhou in 2020 (unit: billion)CNY 25,019.11
Medical burden coefficient of air pollution1.33%
Pollution Emission Factors of Ships65.80%
Total medical expenditure of Guangzhou in 2020 (unit: billion)CNY 218.95
Total medical expenditure of Guangzhou in 2020 (unit: ten thousand)CNY 2,189,522.39
Resident population of Guangzhou in 202018,676,605
Indirect expenditure of Guangzhou in 2020 (unit: ten thousand)CNY 0.12
Table 7. Benefit matrix of government (Unit: million CNY).
Shipowner= Shipowner
Government Law-abidingNot law-abidingGovernment Law-abidingNot law-abiding
Inspectiona + fca + dInspection−3.4642−0.1166
Non-inspection+fcefNon-inspection−2.3476−0.7012
Table 8. Benefit matrix of shipowner (Unit: million CNY).
Shipowner= Shipowner
Government Law-abidingNot law-abidingGovernment Law-abidingNot law-abiding
Inspectionb + cdInspection−0.7829−1.00
Non-inspectionb + c0Non-inspection−0.78290.00
Table 9. Comparison of international ship re-inspection strategies.
Region/SystemStrategy TypeBasis for Inspection AdjustmentReference
Paris MoURisk-based targetingShip type, age, flag performance, inspection and detention historyParis MoU Annual Report 2023 [43]
Tokyo MoUShip risk profile (SRP)Detention count, ISM audit, class, RO, age, typeThe Annual Report on Port State Control in the Asia-Pacific Region 2023 [44]
China MSA (e.g., Guangzhou)Random + administrative assignmentInspection sampling based on local air pollution control plansGuangzhou Port State Control Annual Report 2020 [32]
This studySupervisory game + dynamic αShip’s historical inspection performance (pass/fail pattern)Present study
Disclaimer/Publisher’s Note: The statements, opinions and data contained in all publications are solely those of the individual author(s) and contributor(s) and not of MDPI and/or the editor(s). MDPI and/or the editor(s) disclaim responsibility for any injury to people or property resulting from any ideas, methods, instructions or products referred to in the content.

