Abstract
To promote sustainable development in urban environments, minimising the reflected light pollution from glass curtain walls is critical. This study investigates numerical evaluation methods for assessing the impact of curtain wall-reflected light on road traffic light pollution. While existing research focuses on indoor glare and static target pollution, limited attention has been given to the dynamic impacts on moving traffic participants. This research evaluates light pollution (discomfort glare) induced by triple-layer hollow glass curtain walls in green buildings. A mathematical model predicting the solar reflection characteristics (reflectivity and brightness) was established using optical equations, with the accuracy verified through field experiments and numerical simulations. Subsequently, a driver discomfort glare (DDG) evaluation model was developed, incorporating the dynamic relationships between reflected light sources and drivers, including relative position variations, vertical eye illumination, and correlations between sightlines, driving speed, and road terrain. A numerical simulation system was implemented using Rhino’s Ladybug + Honeybee tools, demonstrated through a case analysis of high-rise buildings in Dalian. The system simulated glare effects under sunny/snowy conditions while examining thickness-related variations. The results revealed significant correlations between the glass thickness, weather conditions, and discomfort glare intensity. The proposed DDG model and simulation approach offer practical tools for assessing dynamic light pollution impacts, supporting the theoretical evaluation of outdoor light environments in green buildings. This methodology provides an effective framework for analysing the moving-target light pollution from architectural reflections, advancing sustainable urban design strategies.
1. Introduction
Since the beginning of the 21st century, low-carbon sustainable development in the operation phase of the building and green transformation have become the main themes of new urbanisation construction and development in the international community [1,2]. The coordination and integration of architecture, transportation, and urban environments have become one of the hot research topics in the international community. With the acceleration of global urbanisation, architects are increasingly favouring the use of glass curtain walls as a form of building skin, as glass curtain walls have a practical and aesthetic appeal [3,4]. China is currently the world’s largest producer and consumer of curtain wall buildings, and the curtain wall output value of China has reached about USD 115 billion by 2022 [5]. Meanwhile, the curtain wall effects on the environment, including light pollution, have a negative impact on urban inhabitants’ quality of life, either directly or indirectly. Unlike sky glow, which affects astronomical observations by brightening the night sky [6], light trespass, which directly interferes with the quality of human life and destroys ecosystems [7], and over-illumination, which wastes energy and imposes economic costs [8], the glare generated by reflections from glass curtain walls creates visual disturbances for travelling drivers and has also become one of the important issues to be solved for the sustainable development of cities, particularly with regard to road traffic safety. The harmful reflected light generated by curtain wall buildings on drivers can be divided into two categories: discomfort glare and disability glare. The evaluation of green building technology requires minimising these two types of harmful glare in curtain wall buildings as much as possible to avoid light pollution. In Canada, the government published comprehensive design recommendations for curtain wall building practices to address the risks associated with light pollution from glass curtain walls [9]. In Japan, existing buildings are given a daylight reflecting layer under the Sapporo City Building Environmental Consideration System [10], and the evaluation provides five ratings and solutions for dealing with reflected light. In Europe, the 2022 curtain wall product standard from the European Committee for Standardization offers comprehensive requirements for calculation techniques, performance testing, and assessment [11]. In China, the 2019 revision of the Green Building Evaluation Standard proposes disabled glare and discomfort glare to evaluate the harmfulness of reflected light from glass curtain walls, and the 2015 regulation ‘Photothermal Performance of Glass Curtain Walls’ suggests that the reflectance ratio of glass curtain walls should be no greater than 0.3. It is evident that a considerable number of countries worldwide are acutely aware of the issue of harmful glare pollution from glass curtain wall buildings. However, their evaluation standards merely encompass indexes or grade requirements for discomfort glare and are devoid of precise calculation methodologies for assessing the detrimental impact of glare, particularly the assessment of the discomfort caused by the reflected light from curtain walls on drivers. Therefore, it is very necessary to study the evaluation method of the impact of the reflected light from curtain walls on driver glare.
As the principal cause of the driver’s glare is the reflected light from the glass curtain wall, it is of paramount importance to comprehend the propagation law of light in the multi-layer insulating glass curtain wall and ascertain the illuminance of the reflected light on the surface of the glass curtain wall. The current glass curtain wall is mostly a combination of two or more pieces of glass, and the hollow gap generated by the two pieces of glass changes the transmission mode of light, so that the energy of light can be transmitted between many glass plates without a clear transmission direction. Petherbridge [12] proposed analytical equations for each layer of a multi-layer glass curtain wall system based on ray tracing calculations that transform the recursive problem into a geometric progression. Nisbet [13], based on Petherbridge’s research, proposes a mathematical model for triple glazing that considers only one radiant reflection and does not require the use of a geometric progression. Although the above optical models are available, they are limited by the fact that new mathematical equations need to be re-established for each additional layer of glass in the curtain wall system, and the computational complexity increases. Subsequently, Collins and Wright [14] simplified multiple reflections and transmissions in complex systems to the energy exchange between two surfaces and verified the accuracy of the mathematical model. Based on the research results of Collins and Wright, ISO15099/2003 [15] proposes a calculation model for windows, doors, and shading devices. In addition, the Lawrence Berkeley National Laboratory’s WINDOW 7.8 [16] software uses ISO 15099/2003 [15] as the basis for its glazing performance calculations. The combination of Optics [17], which is from the same laboratory, and WINDOW software is widely used to calculate the reflectance of glass curtain walls [18]. However, to quickly predict the extent to which reflected light from a curtain wall will affect the driver’s discomfort glare from the total illuminance value of ambient light, a mathematical model that uses the total illuminance value of ambient light as a variable for solving the reflectivity of a multi-layered insulating glass curtain wall has not yet been given sufficient attention, despite the optical calculation models described above. In addition, most of the glass panel reflectance calculation models are based on segmented spectral wavelengths [19,20], but in the actual scenario of the impact of reflected light from the glass curtain wall on the driver, it is difficult to accurately obtain the parameters of the segmented spectral wavelengths, and the calculation formula is not conducive to the rapid and efficient calculation of the reflected light intensity of the glass curtain wall and the assessment of the impact of the reflected light from the curtain wall on the driver. Therefore, in order to improve the accuracy of the driver discomfort glare impact assessment and future predictions, it is essential to incorporate a set of reasonably accurate optical models for insulating glass in the light pollution assessment models for glass curtain walls.
The concept of glare was initially presented by Holladay in 1926, when he claimed that the retina of the human eye perceives excessively strong light as the cause of a phenomenon [21]. In 1984, the Illumination Engineering Society of North America (IESNA) defined glare as the phenomenon of the discomfort or visual loss caused by light that appears in a person’s field of view far beyond what the human eye can adapt to [22]. The source of glare can be a direct light source, such as sunlight, lights, etc., or an indirect light source, such as reflected light from a smooth object surface. Glare not only causes visual discomfort, but strong glare can also damage vision and even lead to blindness [23]. Therefore, glare can be classified into discomfort glare and disability glare based on the degree of harm. Discomfort glare refers to the discomfort caused by bright light in the surrounding environment to the human eye, which may cause a person’s line of sight to disappear or lead to a decrease in vision [24]. Disability glare refers to the phenomenon of the decreased contrast in human retinal imaging caused by cluttered glare sources in the surrounding environment, resulting in a decrease in imaging quality or difficulty in imaging objects in the human brain [25]. The International Commission on Illumination also divides glare into quality levels in the classification of lighting quality; namely, the lower the lighting brightness limit requirement, the more glare gradually increases, and the lighting quality decreases [26]. Obviously, the harmful glare generated by the reflected light of glass curtain wall buildings on surrounding road vehicle drivers may be one or more of the two types of glare mentioned above, which must be effectively controlled. Therefore, many scholars have conducted relevant research. Redelmeie came to the conclusion in 2017 that midday glare is the primary factor contributing to traffic accidents, with a 16 percent increased risk of causing a serious collision compared to normal lighting conditions [27]. Casado-Sanz demonstrated that a glare that is too strong to see through while driving is a major contributing factor to the likelihood of deadly collisions [28]. Furthermore, the image produced in the field of view of a vehicle driver travelling at fast speeds will exhibit a significant blurring of the edges in comparison to glare in indoor static situations, which has a negative impact on drivers and pedestrians and may cause the driver to be unable to drive normally [28].
Several glare indices have been established and adopted in countries around the world. Daylighting is usually evaluated using the daylight glare index (DGI) and the daylight glare probability (DGP) evaluation models. Other evaluation methods, such as the unified glare rating (UGR), threshold increment (TI), and glare rating (GR), are suitable for evaluating artificial lighting conditions with a small-range light source. The parameters required by each glare evaluation method and the glare source analysis are shown in Table 1 [29,30,31].

Table 1.
Glare evaluation method and its required parameters.
The DGI evaluation index was later developed, extending the Glare Index to the computation of large-area glare sources, thanks to the combined efforts of Hopkinson and Chauvel [32,33]. The DGP model was presented by Wienold and Christoffersen in 2006 and was based on the subjective perception of harmful reflected light by the human eye [34]. Now, the DGP model is a widely used glare evaluation approach and an important measure to evaluate the window-induced perception of intense light sources. In the research of indoor glare evaluation, Chaloeytoy and Ichinose et al. examined the impact of huge glass curtain walls’ reflections on an office’s interior with the DGP model during the day when direct sunshine is not present [35]. They then applied high dynamic range images to capture the luminance value of the light source in the room, and the results confirmed that the vertical illuminance value is a parameter that is well adapted to the glare scenario and that it can be used to evaluate the comfort of the human eye’s visual perception. In addition, numerous academics from Asia [36], Australia [37], the United States [38,39], and the European Union [40] have also investigated and verified the DGP model’s applicability and threshold. Existing glare studies have primarily focused on indoor environments and static light pollution from fixed targets (e.g., office spaces or architectural fixtures), relying on static models that assume fixed light sources and stationary observers. However, these limitations restrict their applicability to scenarios involving dynamic outdoor environments, where glare from glass curtain walls interacts with moving traffic participants (e.g., drivers). Unlike the indoor glare dominated by direct sunlight transmission and analysed under steady-state conditions, the outdoor glare caused by reflected light from multi-layered glass curtain walls involves time-varying light intensities (due to solar position changes and driver motion) and complex reflection paths across multiple glass layers. These dynamic factors generate transient visual disturbances that are inadequately addressed by traditional static models.
In summary, it can be seen that the reflected light of glass curtain wall buildings will have harmful glare effects on vehicle drivers. Many researchers have mainly studied the harmful glare effects of the indoor glare, direct sunlight glare, or discomfort glare caused by drivers driving out of tunnels. There is relatively little research on the harmful glare effects of glass curtain wall-reflected light on drivers. Meanwhile, the DGP model is currently the most widely used research model for evaluating the impact of indoor glare. For multi-layer insulated glass curtain wall systems, existing research mainly focuses on the study of their heat transfer characteristics, lacking optical models for reflectivity and reflected brightness. Therefore, this article takes the commonly used three-layer hollow curtain wall system in green buildings as the research object and equates the process of reflected light entering the car through the windshield with the process of sunlight passing through the window glass. Based on the indoor glare impact evaluation model, DGP, this article studies the evaluation of the discomfort glare impact of reflected light in glass curtain wall systems on drivers. This study establishes a glare impact evaluation model, driver’s discomfort glare (DDG), applicable to the reflection of high-rise curtain walls based on the DGP glare evaluation model. It primarily takes into account the following three aspects. First, determining the model for the inner and outer surfaces of the insulating glass’s illuminance and total reflectance and then solving for the system’s visible spectral transmittance, absorptance, and reflectance. Second, the original parameters in the DGP model will be applied to the DDG model to evaluate the effect of discomfort glare from glass curtain walls on drivers after adjusting for the luminance of the glare source, the vertical illuminance, the stereo angle between the glare source and the driver’s line of sight, the position index, and other DGP parameters. Lastly, the total reflectance model is confirmed by on-site experimental measurements, and the extent of the glare’s influence on drivers on peripheral roads is assessed through the use of a software simulation, which reveals the impact of the glare on the DDG model under the light environment conditions of various seasons and times of the day. Ultimately, field test measurements were used to validate the total reflectance model, and a software simulation was used to assess the impact of glare on drivers of peripheral road vehicles. This research reveals the features of variations in the DGP values as well as the impact of glare on drivers in various light environments during the day and different seasons and provides a feasible calculation method to address the discomfort glare impact of reflected light from high-rise building glass curtain walls on vehicle drivers.
2. The Influencing Factors Analysis of the Drivers’ Discomfort Glare Caused by the Reflected Light on Glass Curtain Walls
This subsection describes the factors that influence the discomfort glare of drivers from reflected light from glass curtain walls.
2.1. Determination of Relative Position Relationship Between Sun, Buildings, and Vehicles
The direction and brightness of glass curtain wall-reflected light are closely tied to the positional relationship between the sun, building, road, and vehicle driver. So, it is essential to determine the relationship between the ground and building coordinate systems, specifically the sun azimuth angle, sun altitude angle, and building azimuth angle. The solar altitude angle and solar azimuth angle describe the sun’s trajectory. The solar altitude angle is the angle between the sun’s direct rays and the ground plane. The solar azimuth angle is the angle between the projection of the sun’s direct rays on the base plane and the ground plane, which is usually 0° in the south direction, positive in the west, and negative in the east.
As shown in Figure 1, the interrelationship between the sun, the building, and the road orientation can be delineated by means of the ground coordinate system and the building coordinate system. The light strikes the surface of the glass curtain wall, and the angle of intersection between the light and the normal vector on the building’s front façade in the horizontal projection direction is recorded as θxy, the angle of intersection between the light and the normal vector on the building’s front façade in the vertical projection direction is recorded as θz, and the centre of the building’s bottom is the origin, and the building’s azimuth angle is γb.
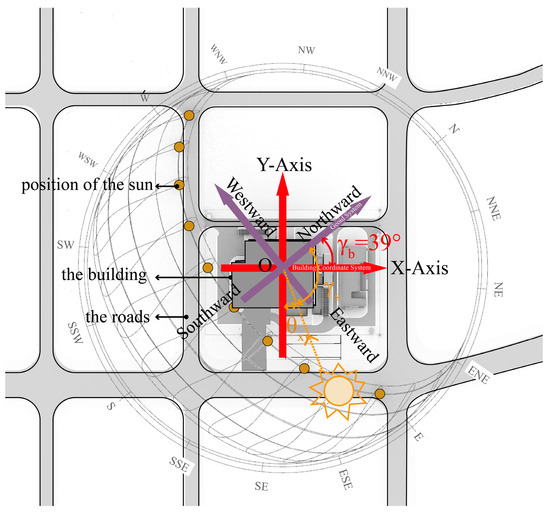
Figure 1.
The relative position relationship between the sun, the building, and the road.
2.2. Analysis of Influencing Factors of Drivers’ Discomfort Glare of Reflected Light
Figure 2 is a schematic diagram of the process of sunlight reflecting from a triple-glazed curtain wall and entering the human eye. In the figure, the sun’s rays irradiate to the surface of the curtain wall system, and part of the light in the three-layer insulating glass curtain wall system, after many reflections, will transmit the light superposition to the outermost glass surface to form a light spot in the drivers’ eyes. For drivers driving on the road, the reflected light spots from the outer surface of the glass into the cab, with the different brightnesses of the reflected light, will produce different types of glare effects on the driver’s vision. According to the DGP model, the factors affecting the brightness of the glare are mainly as follows.

Figure 2.
A schematic illustration of the process by which the sun reflects light into the human eye from a three-layer glass curtain wall.
The DGP model (shown in Equation (1)) can be used to summarise the main influencing factors into four key parameters: the luminance parameter of the light source (Li), the relative positional relationship between the human eye and the light source (Pi), the stereo angle characteristics of the light source (wsi), and the vertical illuminance received by the human eye (Ev).
The following specific analysis is carried out for the influence mechanism of the glare brightness in the driving scene.
(1) Influencing factor 1: glass curtain wall-reflected luminance
The brightness of the reflected light source of the glass curtain wall is one of the main factors affecting the discomfort glare for road drivers. With the sunlight beam irradiation in the three-layer insulating glass curtain wall system, the incident light in the curtain wall system through multiple reflections, the transmission, and, ultimately, the glass surface superimposed on the shot, the light superimposed on the outside surface of the glass curtain wall produced by the total brightness is called the glass curtain wall-reflected light source brightness.
(2) Influencing factor 2: relative position of driver and light source
The main determinants of a driver’s perception of the reflected light from a curtain wall are the driver’s position relative to the reflected light and the orientation of the driver’s line of sight. Figure 3 shows the link between the direction of the road and the direction of the driver’s view and the reflected light from the curtain wall. The direction of the driver’s line of sight is affected by the inclination angle of the road. When the vehicle travelling direction is uphill, the horizontal relative angular difference between the line of sight direction and the position of the reflected light source decreases, and the driver is more likely to be affected by the glare. Therefore, it is particularly important to calculate the angle between the reflected light of the curtain wall and the horizontal line of sight of the driver.
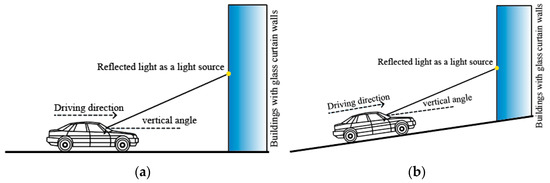
Figure 3.
Relationship between reflected light from glass curtain walls and road direction. (a) Horizontal roadway and (b) uphill road.
(3) Influencing factor 3: driver’s line of sight
As shown in Figure 4, the maximum transmission area of the driver’s field of view can be approximated and simplified as a cone, in which the field of view is affected by the extent of the front windscreen area of the vehicle (in this study, only the general situation of the driver is considered, ignoring the effects of the driver’s posture, height, and the refractive mode of the vehicle’s glass). The angle of the maximum transmission of the reflected light from the curtain wall is angle αe, which is also the angle between the driver’s line of sight and the upper edge of the front windscreen. In addition, studies have shown that the driver’s field of vision gradually narrows as the driving speed increases during driving and that the driver’s field of vision ranges from 100° during conventional road driving at a travelling speed of 40 km/h [41].
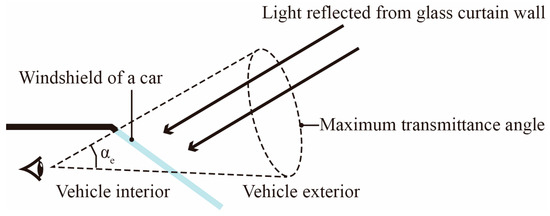
Figure 4.
Side view of driver’s eye position in relation to reflected light from glass curtain wall.
(4) Influencing factor 4: vertical illuminance
Vertical illuminance is a parameter that describes the light situation. In general, the light source can be divided into a point light source and a surface light source, and the reflected light of the three-layer insulating glass curtain wall system is usually gathered at one point, which can be classified as the point light source. The reflected light can be divided into horizontal illumination and vertical illumination. Horizontal illuminance is the light that is parallel to the horizontal direction of the driver’s eyes after irradiation, and vertical illuminance is the light that is parallel to the vertical direction of the driver’s eyes after irradiation. Vertical illuminance is an important factor in the degree of the glare influence.
Based on the analysis of the above influencing factors, it can be seen that the study of the impact of reflected light from the glass curtain wall as a light source on the discomfort glare caused for the driver is essential to explore the interaction between the optical properties of the curtain wall system, the road space, and the driver’s vision. According to the above analysis, the specific evaluation indexes involved in the three are summarised as shown in Figure 5. Among them, the number of glass layers of the multi-layer glass curtain wall system, the thickness of the single-layer glass, the spacing between the single-layer glass, the total reflectivity of the glass curtain wall, the reflective luminosity of the glass curtain wall, and the orientation of the glass curtain wall are the main parameters. In the road system, the relative position of the road to the glass curtain wall building, the orientation of the road, and the inclination of the road are the main influencing parameters. For drivers, the vertical illuminance of the driver’s eye, the relative position of the driver’s eye to the light source, and the driver’s direction of travel all affect the driver’s discomfort glare evaluation.
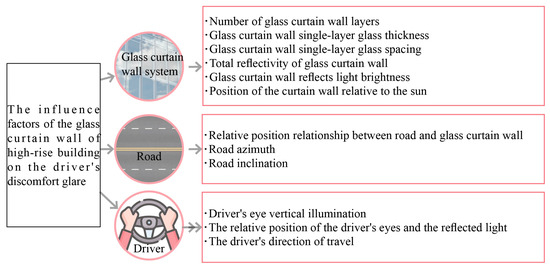
Figure 5.
Selection of evaluation indicators.
3. Reflectivity and Reflectance Brightness Calculation Model and Establishment of Multi-Layer Hollow Glass Curtain Wall System
In this subsection, firstly, the reflectance of the single-glazing system is solved, and, secondly, the balance equation of the luminous flux of a triple-glazed curtain wall is established, and the total reflectance is solved based on the mathematics of the reflectance of the single glazing. The total reflectance of the three-layer glass curtain wall is then used to establish and solve the luminance of the reflected light on the surface of the curtain wall.
3.1. Reflectance Calculation Model and Establishment of Three-Layer Insulating Glass Curtain Wall
To calculate the total reflectance of a three-layer insulating glass curtain wall, the calculation model of the single-glazing system reflectance is studied first.
3.1.1. Modelling of the Calculation of the Reflectance of Light in Single-Glazing Systems
A single-layer glass system can consist of an inner and outer layer of glass and an air layer in between as shown in Figure 6, and the letters a and b stand for the glass’s front and back sides, respectively. When direct sunlight strikes a single pane of glass with direct reflectance, some of the light is reflected at the glass’s forward-facing surface, and the remaining light enters the glass medium for transmission, where some of the light is absorbed by the glass, and the remaining light reaches the glass’s backward-facing surface. Similarly, the glass’s backward-facing surface exhibits interfacial reflection. There is an endless number of reflections of the light in the glass medium between the forward and backward interfaces. Thus, the total reflection and transmission of a single pane of glass is the combined value of the direct sunlight after an unlimited number of reflections and transmissions at the glass interface and in the glass medium. Therefore, the reflectance and transmittance of the single glass plate are calculated first, and then the reflectance and transmittance of the single-glass system are calculated according to the light propagation principle analysed above.
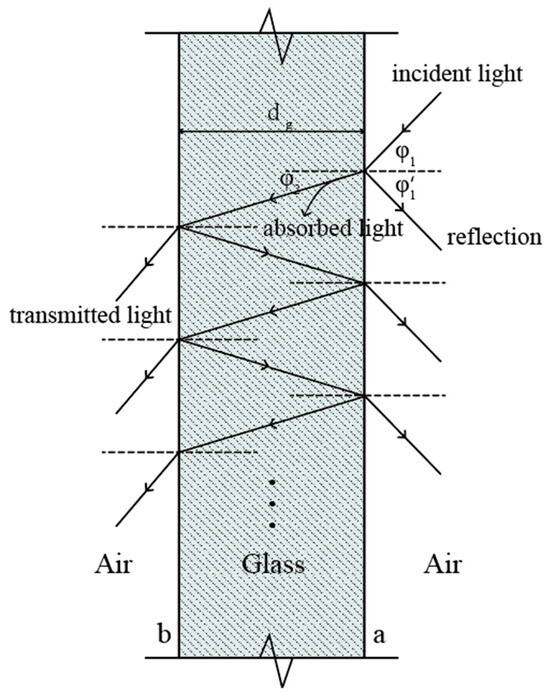
Figure 6.
Figure of direct light transmittance and reflectance of monolayer glass.
First, the reflectivity of a single glass is calculated according to the principle of light propagation. The Fresnel equations can be used to calculate the reflectivity of the air–uncoated glass interface, as show in Equations (2) and (3). Considering both x and y as polarised light, the reflectivity of a single glass surface ηk is [42]:
where the angle of incidence of the sun’s rays is φ1(°), and the angle of refraction is φ2(°). n1 is the refractive index of air and n2 is the refractive index of the single-layer glass. For the insulating glass, which is filled with air, the refractive index of air is 1.0, and for the refractive index of ordinary glass or Low-E glass material the spectral range of the wavelength of the incident light does not have a great impact on the refractive index, which can be taken as 1.526. In addition, the following assumptions are included in the model: the two interlayers of insulating glass have a constant temperature, disregarding the effect of temperature on the absorption of the various light wavelengths; and each piece of glass is a transparent, diffused grey sheet with a homogeneous surface to receive light.
The single-layer glass system’s transmittance is determined by the Beer–Lambert Law. In the transmission process, due to the glass panel’s own characteristics and different coatings, the light will have a certain degree of attenuation, which introduces the extinction coefficient kcoating-r. The attenuation differential equation of solar illuminance in the glass medium is established, and the transmittance of single-layer glass can be assessed using Equations (4) and (5).
where Esol is the solar illuminance (lx); kcoating-r is the extinction coefficient of the glass panel with the coating (m−1), which takes the value of 38 m−1 in this study; τk is the transmittance of the sun in a single-layer glass medium; and dg is the thickness of the glass (mm).
The light that is reflected and transmitted at each moment is computed cumulatively using the ray tracing concept. The front surface of the glass has a direct reflectance of ηa, and the rear surface has a direct reflectance of ηb, assuming that the direct solar flux illuminating the front surface of the glass is 1. Equation (6) shows how to compute the direct reflectance of a single-layer system of glass, assuming that the material behind the glass front is the same as that of the medium and that temperature has no effect on the refractive index.
The optical characteristics of glass diffusion and direct reflection differ greatly from one another because the single-layer glass diffusion reflection lacks the distinct incidence direction of direct reflection. There are few precise statistics and publications about the optical diffusion performance of single-layer glass; typically, the glass’s optical performance under a 60° direct light is used to estimate its optical diffusion performance. The total reflectance of a single-layer glass sample comprises both direct and diffuse reflectance components, and the expression for the total reflectance is obtained by Equation (7):
where ηd,all is the total reflectivity of single-layer glass; Ez is the illuminance of the direct visible light on the surface of the curtain wall glass (lx); and Es is the illuminance of the diffusion visible light on the surface of the curtain wall glass (lx).
The total transmittance of single-layer glass τd,all is given by Equation (8):
3.1.2. Modelling of Light Reflection Calculations in Multi-Layer Glazing Systems
Next, the total visible light reflectance of the multi-layer insulating glass is calculated based on the total visible light reflectance of the single-layer glass. Multi-layer glass curtain wall systems, due to their special structural and material characteristics, cause the sunlight in the process of the interaction with the curtain wall to show complex optical phenomena. As the sunlight passes through each layer of glass, in turn, there are multiple reflections and transmissions through the layers, so the classical ray tracing method is not applicable in this study. This study introduces the luminous flux energy conservation equation to solve the problems associated with multi-layer glass curtain wall systems. When light encounters a medium, such as glass and air/argon gas, during the propagation of a triple-glazed curtain wall, a part of the incident light flux is reflected (Rall), a part is absorbed (Aall), and a part transmits through the medium into the space on the other side (Tall), and according to the law of the conservation of energy, the sum of these three parts should be equal to the incident light flux [43], as shown in Equation (9). The following assumptions were used in modelling the conservation of the luminous flux: (1) solar energy is absorbed uniformly over the thickness of each layer; (2) the medium does not have fluorescent or phosphorescent properties—i.e., the absorbed light energy is not reradiated in other wavelengths of light; and (3) none of the absorbed light energy triggers a chemical or electrical energy conversion. The energy conservation equation of the luminous flux can comprehensively consider the energy changes caused by the multiple reflections and transmissions of sunlight propagating in multi-layer glass curtain walls, which provides a feasible theoretical basis for the accurate calculation of the total reflectivity of the multi-layer glass curtain wall and the brightness of the surface-reflected light.
Based on the light flux conservation model, this subsection proposes an optical model for the visible illuminance values at the surface of a triple-glazed insulating glass curtain wall. This model takes into account both direct and diffuse visible light in the external environment under daytime sunlight conditions, as well as the value of the reflected light from the road.
Figure 7 represents a schematic diagram of the light propagation in a three-layer insulated glass curtain wall system, which is composed of the total energy of the outdoor environment from the sun’s visible direct light illuminance (Edir), the sun’s visible diffuse light illuminance (Edif), the ground diffuse light illuminance value (Egro) (because the object of study is the daytime sunlight in the curtain wall of the reflected light, so street lights, billboards, and other sources of luminance value will not be taken into account), and the total flow of the outdoor environment into a unit of glass within the value of energy for the value that is Edir + Edif + Egro. In addition, the luminous flux of incoming visible direct light is denoted by Zi,n, the luminous flux of outgoing visible direct light is denoted by Zo,n, the luminous flux of incoming visible diffuse light is denoted by Si,n, and the luminous flux of outgoing visible diffuse light is denoted by So,n. The hollow layer of the glass curtain wall, the nth hollow layer from the indoor to the outdoor reception and the transfer to the n − 1 layer of energy, is equal to the n + 1 layer in its transmission of energy and the n layer in the front of the glass panel reflected energy sum; the n + 1 layer of the hollow layer from the outdoor to the indoor reception and the transfer to the nth layer of energy is equal to the nth layer in its transmission of energy and the n + 1 layer in the back of the glass panel reflected energy sum. Therefore, Equations (10)–(14) are established as follows:
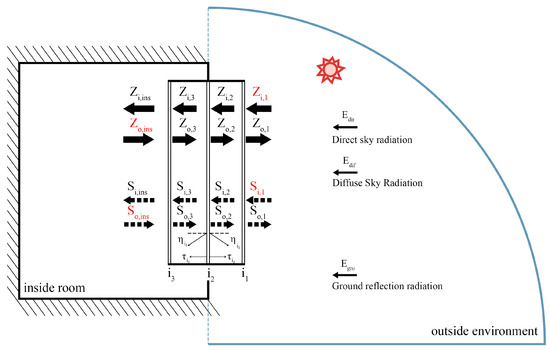
Figure 7.
Schematic diagram of light energy flow in three-layer insulating glass curtain wall system.
Finally, the above energy balance equation is solved numerically by a matrix to obtain the values of Zo,1, So,1, Zi,ins, and Si,ins to calculate the total reflectance and total transmittance of the three-layer insulating glass curtain wall system. The value of the total reflectance per unit area of a multi-layer insulating glass curtain wall can be obtained from the ratio of the sum of the total direct light flux and total diffusion light flux emitted to the outdoors by the outermost glass panel to the total luminous flux of the outdoor environment. The value of the total transmittance and reflectance can be obtained from the ratio of the sum of the total direct and diffused luminous fluxes emitted to the room by the innermost glass panel to the total luminous flux outside, as shown in Equations (15) and (16).
3.2. Reflectance Calculation Model Verification of Three-Layer Insulating Glass Curtain Wall
The present study proposes a theoretical model of reflectance, transmittance, and luminance, founded upon the fundamental principles of optics. This model is distinguished by its clarity of physical meaning and its rigorous mathematical representation. The model is solved by a matrix operation method, which effectively avoids the convergence problem that may exist in the traditional iterative algorithm and ensures the computational accuracy from the dual dimensions of the modelling mechanism and the solving process. As demonstrated in Equation (16), the model’s key input parameters comprise outdoor total solar illuminance and indoor total illuminance. The availability of accurately measured parameters following instrument calibration provides a reliable data foundation for model validation. In this study, transmittance is chosen as the core index for the experimental validation of the mathematical model, based on the consideration of the testability of the parameters in the actual project.
To enhance the persuasiveness and practical engineering value of this study, the research team conducted a series of tests on the triple-glazed curtain wall optical model using an actual project in Dalian, China. The selected project is the Dalian Metro Control Centre Office Building, located at 121°62′ E and 38°96′ N. This building is a newly constructed ultra-high-rise glass curtain wall office building, situated in an area with a well-developed road network and high traffic volume.
The building features a typical tower-shaped tetrahedral design, with flat façades on all four sides (east, south, west, and north), making it a common type of glass curtain wall building in urban environments. Its regular geometric shape and lack of significant protrusions or indentations provide an ideal test environment for validating the accuracy of the optical model. By selecting this building, this study aims to demonstrate the practical applicability and reliability of the triple-glazed curtain wall optical model in real-world engineering scenarios.
The office building’s outside enclosure is a hollow three-layer glass curtain wall, with a 12 mm gap between each layer of glass. The three levels of glass are all single-layer, 6 mm thick glass. We chose a room with a glass curtain wall on the south side and a solid wall on the other three sides, as shown in Figure 8. This room is 7500 mm by 11,000 mm by 3000 mm in length, width, and height. Three pairs of measurement sites are arranged inside and outside the room’s window of 1#, 2# and 3#.
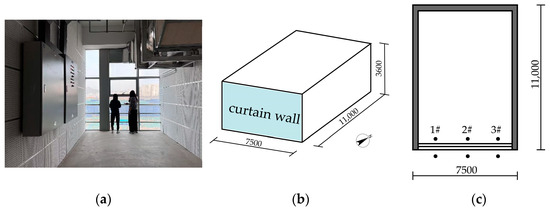
Figure 8.
Validation of optical mathematical models. (a) Interior of experimental room; (b) dimensions of laboratory room (mm); and (c) three pairs of measurement points were arranged in the room at the locations inside and outside the windows of 1#, 2# and 3#.
The TASI digital illuminometer was selected as the measurement tool for the illuminance value, with an effective evaluation range of the 0~200,000 lx, which can measure the visible illumination. The experimental measurements were conducted from 22 December 2023 to 5 January 2024, with data collected on three clear days (22 December 2023, 30 December 2023, and 5 January 2024) to verify the accuracy of the solar illumination transfer model. The experiment was conducted over the course of a day, commencing at 7:00 a.m. and concluding at 16:00. Each instrument was calibrated before the experiment. The horizontal illumination was measured at each test location in the laboratory. Data were collected at five-minute intervals, and the mean of the five data points was calculated for use in determining the mean illumination inside and outside the window.
The dynamic optical model of the triple-glazed curtain wall is solved numerically. The solar altitude angle, diffusion illuminance, and direct solar illuminance are the input data, and the data source is the epw file of a typical Dalian meteorological year. The degree of the sun incidence angle is utilised as a boundary condition, and the MATLAB R2024a software is employed to solve it numerically.
To calculate the transmittance of this special form of glass, the relative error (RE) and root mean square error (RMSE) were calculated to estimate the agreement between the modelled and measured data quantitatively. They are defined as Equations (17) and (18):
where M is the total number of data, and si and ei are the experimental and simulated values, respectively.
The illuminance measured within and outside the glass during the experiment confirmed the dynamic optical model of the hollow triple glass, and Figure 9 illustrates the changes during the calculation and experiment. By comparing the computed and measured values of the transmittance of the hollow triple glass, it is evident that the transmittance obtained from the optical model calculation and the glass’s changing laws are identical, with most errors (RE and RMSE) being less than 8%. The measured values and the modelling findings agree fairly well.
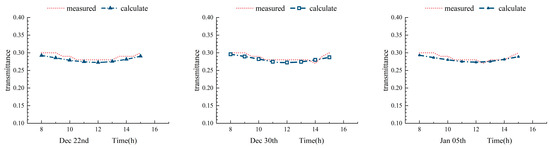
Figure 9.
Comparison between experimental and calculated values of transmission of three-layer glass curtain wall.
Meanwhile, a control validation was carried out using WINDOW 7.8, a simulation software developed by the Lawrence Berkeley National Laboratory, which is capable of analysing products made from any combination of glass layers under any environmental conditions and at any inclination of the glass plate. The model (6Low-e-12Argon-6-12Argon-6) was constructed using the parameters of the glass curtain wall of the actual Dalian Line 5 Control Centre project. The optical parameters of visible light reflectivity for a three-layer, hollow curtain wall were calculated, and the results are presented in Table 2.
Table 2.
Berkeley Lab WINDOW simulation results of reflectance values.
Table 2 illustrates that the combined value of the visible reflectance for Berkeley Lab’s WINDOW triple glazing is 0.238, with the RMSE value of the visible reflectance for a triple-glazed curtain wall calculated based on the value of the solar illuminance proposed in this study being 3.86%, which indicates that the method proposed in this study to calculate the total reflectance of triple glazing based on the value of solar illuminance is more accurate.
3.3. Reflection Brightness Model Establishment of Three-Layer Insulating Glass Curtain Wall
In this section, light in the visible wavelength range of 380~780 nm, which can directly cause visual sensations, is studied to determine the brightness of sunlight. The brightness of the surface of the glass curtain wall is calculated based on the total reflectance of the three-layer insulating glass curtain wall obtained in Section 3.1, which provides a database for the subsequent evaluation of the impact of the reflected light from the glass curtain wall on the driver’s glare level. According to Planck’s blackbody formula, the radiance at each specific wavelength can be calculated, from which the radiance of the sun at a wavelength of 380–780 nm can be calculated by Equation (19):
where λ1 is 380 nm, λ2 is 780 nm, and T is the temperature of the radiating body. Taking the average solar temperature T = 5900 K, the first blackbody radiation constant is C1 = 3.74 × 10⁸ W·m−2·μm4 and the second blackbody radiation constant is C2 = 14,388 μm·K.
The intensity of the solar radiation is expressed in Equation (20) as follows:
where Rs is the solar radius.
The surface of the glass curtain wall in the optical system has a three-dimensional angle to the sun; thus, the relationship between the cubic angle and the solar intensity can be expressed by Equation (21):
where Acur is the optical system irradiation of the surface area of the glass curtain wall (m2). ls is the optical system in the glass curtain wall in the distance between the sun (m). ε is the sunlight and the curtain wall plane angle between the normal (°).
According to Equations (19)–(21), the mathematical formula for the equivalent luminance of the sun on the surface of the glass curtain wall can be derived by Equation (22), as follows:
where ks is the atmosphere of the wavelength of the transmittance of the calculation, using the average visible light transmittance rate of 0.598.
Letting the total reflectivity of the glass curtain wall be ηi,all, according to Equations (15) and (22), we can finally obtain the brightness of the reflected light on the surface of the curtain wall, as shown in Equation (23):
For drivers on the road, the reflected light from the outer surface of the multi-layer insulating glass curtain wall is the main source of glare, and the luminance of the outer surface of the glass curtain wall can be calculated according to Equation (23), which establishes a theoretical basis for the subsequent establishment of an evaluation model of the impact of glare on driver discomfort.
4. The Establishment of a Multi-Factor Evaluation Model for Driver Discomfort Glare Considering the Position Relationship Between the Sun, Buildings, and Vehicles and the Classification of the Degree of Discomfort Caused by Glare
In accordance with the systematic analysis of the influencing factors of driver glare in Section 2, this section will construct a quantitative assessment model system of driving glare caused by reflected light from curtain walls. The specific research framework is as follows: Firstly, a calculation model is established to determine the area covered by reflected light from the sun of the curtain wall building, and a dynamic spatial position relationship model is constructed between the reflected light source and the driver. Secondly, a mathematical characterisation model of the vertical illuminance in the driver’s eyes caused by reflected light from the curtain wall is established, taking into account the parameters of the building’s optical characteristics. Finally, through the multi-physical field coupling analysis, we construct the evaluation model of the driver discomfort glare caused by reflected light from the curtain wall, which is based on the quantitative assessment results of the degree of the glare influence.
4.1. Establishment of Calculation Model for Solar Reflected Light Coverage Area Around Curtain Wall Buildings
Before modifying the daylight glare model of the above Formula (23), the coverage area of reflected light on the surrounding roads should first be defined to determine the spatial range of the glare evaluation.
As shown in Figure 10, we simulate the path that sunlight takes to reach the glass curtain wall and the path that reflected light takes to reach the road by utilising the geometric optics approach. The position of the reflected light falling on the road is ultimately found by using the intersection of the two sets of linear equations, which are the linear equations of the reflected light and the linear equations of the road surface, respectively. The path of the light beams is represented by vectors in the system of equations, and the direction of the reflected light rays is determined by the law of specular reflection.
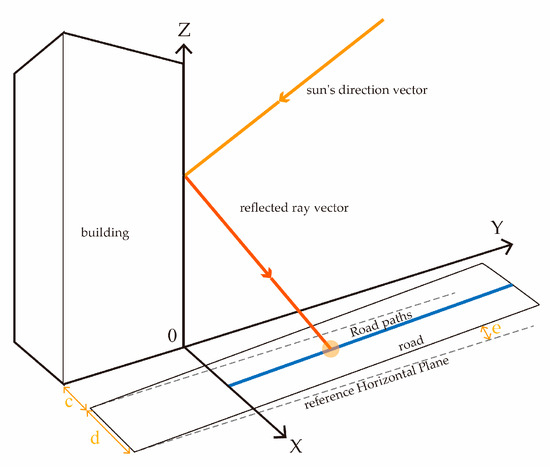
Figure 10.
The trajectory of sunlight as it intersects with a glass curtain wall, and that of reflected light as it intersects with a road, which can be simulated by employing the geometric optics approach.
First, the sun’s direction vector, represented by the symbol , can be written as the following equation:
where the solar azimuth is Υs, and the solar altitude angle is hs.
To make the computation simpler, we only take into account the scenario in which the building is oriented parallel to the road. In this scenario, the surface normal vector of the glass curtain wall building parallel to the road is represented by the following formula:
It is known that the reflected ray vector is and the normal vector is . Since the incident ray is defined as the direction vector of the sun’s rays, the reflected ray’s equation and simplification are as follows:
The linear equation of a reflected ray can be represented as a line that passes through a point (x0, y0, z0) and follows the trajectory. Consequently, the linear equation of a reflected ray is as follows:
where t denotes the scalar parameter.
The road commences at the origin and is perpendicular to the xz-plane, with an inclination of e degrees to the xy-plane. A linear equation for the road plane can be derived as follows:
where e is the angle of the inclination of the road (°), c is the distance between the building and the road (m), and d is the width of the road (m).
4.2. Establishment of Relative Position Model Between Reflected Light Source and Vehicle Drivers
The relative position of the glare source of the glass curtain wall and the driver’s viewpoint is the position coefficient, which is expressed by the letter PiR = f(T, R, H).
A spatial right-angle coordinate system is established, as shown in Figure 11, with the driver’s viewpoint serving as the coordinate system’s origin. The straight-line distance between the viewpoint position and the glare source is R; the viewpoint position’s horizontal offset distance from the glare source’s centre is T; the height of the glare source’s centre above the viewpoint is H; the ratio of the human eye’s straight-line distance to its height is db=|R/H|; and the driver’s eye’s horizontal distance from the position of the glare source is the ratio of its height, or Sb=|T/H|.
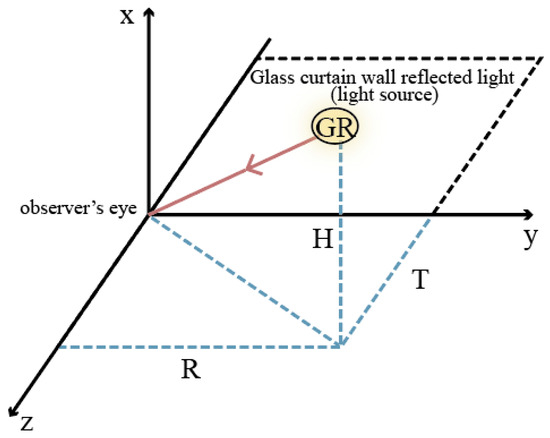
Figure 11.
Position coefficient coordinate system.
The relationship between the relative position of the reflected light from the curtain wall and the driver’s eye can be calculated according to Equation (29) as follows:
4.3. Establishment of Mathematical Model for Vertical Illuminance from Reflected Light of Curtain Wall on Drivers
Considering the differences in vehicle types and dynamic spatial distribution characteristics (excluding the interference of shading devices), this study focuses on constructing a geometrical relationship model between the reflected light from glass curtain walls and the driver’s visual interface and quantifying the intensity of light pollution in dynamic traffic scenarios by taking the vertical illuminance of the receiving plane of the human eye as the core evaluation parameter.
According to the law of stereo angular projection, the calculation of the illuminance at a point on the windscreen of a car is shown in Figure 12; A is the surface source of reflected light from the glass curtain wall, O is a point on the windscreen of the car, n1 is the normal to the microfacial source dA on the surface radiation source and its angle with the line connecting the point O is β, n2 is the normal to the point O, the angle with the n1 is found to be α, and the distance from dA to the point O is r.
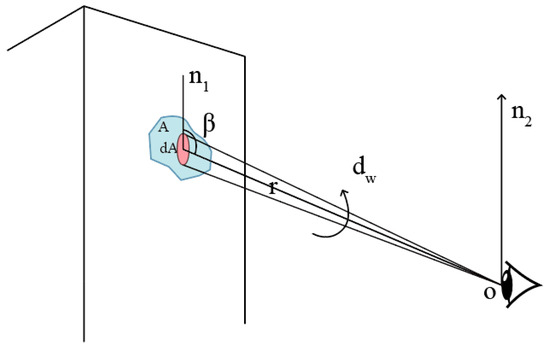
Figure 12.
Schematic diagram of three-dimensional angle of glare source of glass curtain wall.
According to the inverse square ratio law of distance, the vertical illuminance at point O where the reflected light from the glass curtain wall is located on the microelement face can be deduced as EvR:
where the luminous intensity in the direction of the line between A and O in the Figure 12 is expressed as EvR (lx); Ap indicates the equivalent area of the glare source in the direction of the driver’s eyes (m2); and r is the driver’s point of view position from the vertical plane of the source of the reflective surface of the glass curtain wall horizontal distance (m).
In addition, the consideration of different traffic conditions can be equated to the problem of the driver’s travel speed. The driver’s field of vision contracts after the increase in driving speed. If the field of vision range is simplified into a cone—as in the establishment of the indicator coordinate system, for which the observer’s eyes are located at the origin of the coordinates—the field of vision range is relative to the origin as a fixed point of a cone, and the mathematical model of the driver’s field of vision range can be obtained through Equation (31), as follows:
In order to simplify the calculation, the bottom area of the cone is used to replace the intercepted spherical surface area, and the correction coefficient of the stereo angle of the field of view of a small car driver travelling at a speed of 40 km/h is obtained as follows, w = 2.41.
4.4. Establishment of Evaluation Model for Driver Discomfort Glare Caused by Reflected Light from Curtain Walls
To conduct parametric modelling and coefficient corrections, according to Section 4.1, Section 4.2 and Section 4.3, the evaluation model of reflected light from the curtain wall is shown in Equation (32), as follows:
where EvR is the vertical illuminance at the position of the human eye (lx); LsiR is the luminance at the reflected light of the curtain wall (cd/m2); wsiR is the stereo angle formed by the position of the light source and the point of view (sr); and PiR is the index of the position of the light source relative to the glare.
4.5. Classification of Degree of Impact of Reflected Light from Curtain Walls on Driver Discomfort Glare
It is assumed that the human eye experiences the same discomfort from light of the same illuminance level, and that the level of discomfort from glare is not related to the light source but only to the illuminance level and brightness of the light incident on the human eye. Therefore, the DGP rating method is used to classify the level of impact of DDG.
In the Table 3, referring to the DGP glare level, for DDG, the glare can be divided into four levels: when DDG < 0.35, the glare is considered imperceptible; when 0.35 ≤ DDG < 0.40, the glare is considered perceptible; when 0.40 ≤ DDG < 0.45, the glare is considered to cause an uncomfortable feeling; and when 0.45 ≤ DDG, the glare is considered intolerable.
Table 3.
The DDG range and the levels of influence of the reflected light [30,44].
5. Construction of Simulation System for Evaluating Impact of Driver Discomfort Glare and Analysis of Results
5.1. Case Description of High-Rise Building with Glass Curtain Wall
The control centre office building of Dalian Metro Line 5, the first cross-sea metro line in Northeast China, will open for business in 2022. The Metro Line 5 control centre office building is situated in the Barracuda Bay District of Dalian City, Liaoning Province, at the exit of the Metro Line 5 station. According to the Dalian 2049 City Vision Plan and the Dalian City Master Plan (2001–2020), the region will prioritise the construction of numerous large- and medium-sized public facilities in the future. Barracuda Bay will be developed as a future new hub city, progressively transforming the area from an industrial brownfield site to a green and sustainable development area. Although there are currently no finished structures surrounding the building, the Barracuda Bay area planning indicates that the future construction would primarily focus on public and commercial space, making heavy pedestrian and vehicular traffic inevitable.
The building’s 51° north by west layout is parallel to the roadways that encircle it. The building site is level and is 145 m in length from east to west and 115 m from north to south. The main entrances of the building face the southeast side. The building is surrounded by roads on three sides: the northwest side is adjacent to the No. 21 Road through plot II, the southeast side is adjacent to the No. 22 Road through the urban green belt, and the northeast side is adjacent to the No. 13 Road. There are twenty-one stories above ground and three floors below, with a total building area of 53,837 m2 and a total building height of 95.4 m. Figure 13 displays the general plan and location plan.
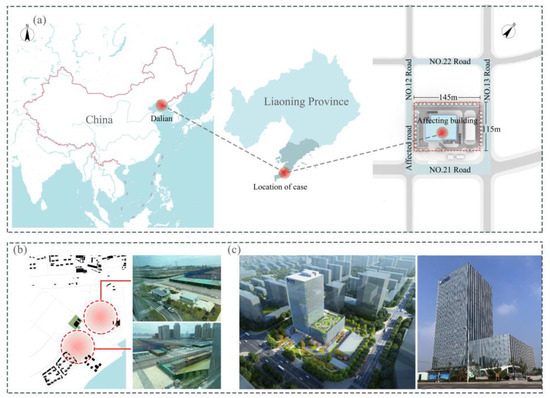
Figure 13.
The location and status of the study subject: (a) the location of the building, the affecting building, and the affected roads; (b) the main façade of the building facing the road as a secondary urban road; and (c) the façade of the affecting glass curtain wall materials.
The reflected light from the glass curtain wall of the examined structure may have an impact on four nearby roads—namely, the No. 22 Road, the major road facing the front of the building; the No. 13 Road on the east side of the building; the No. 12 Road on the west side; and the No. 21 Road on the north side. As is shown in Figure 14, where No. 21 on the north side is separated from the main building by a plot of about 80 m, No. 22, No. 13, and No. 12 are adjacent to the plot on which the study building is placed. Compared to Routes 21, 13, and 12, Route No. 22 is a secondary urban road with heavier traffic. The amount of people entering and leaving the metro station during the morning and evening peaks is higher than that of other times, making the road situation relatively complex and prone to traffic accidents during those times. The drivers’ spatial distribution is denser from west to east in the morning peak (7:00–9:00), and the cars’ spatial distribution is denser from east to west in the evening peak (17:30–19:30). The reason for this is that Dalian’s main urban area is located on the west side of the study object. During the morning and evening peak hours, the traffic volume is relatively high, and as the city gradually grows, so will the frequency of traffic gatherings.

Figure 14.
Photographs of the current state of the roads surrounding the curtain wall building.
The current condition of Section No. 21 is six lanes in both directions, with a lane width of about 3.5 m and a total width of 22 m, with no median strip, separated by a double yellow line of about 0.5 m, and non-motorised lanes on both sides of about 1 metre in width, and with street lamps on the roadside. The direction of travel of the vehicles, i.e., the azimuth of the road, is approximately 39.1°. Motorised vehicles are parked on both sides of the road. There are two underground station entrances and pedestrian crossings adjacent to the study building.
Road No. 13, in its present state, is a four-lane road in both directions with a lane width of about 3.5 m and a total width of 16 m without a median strip, separated by a double yellow line of about 0.5 m, with non-motorised lanes of about 1-metre wide or so on both sides, and with street lamps on both sides of the road. The direction of travel of the vehicles, i.e., the azimuth of the road, is approximately 129.1°. Motor vehicles are parked at the pavement on one side of the road.
Road No. 12 is currently a four-lane road in both directions with a lane width of about 3.5 m, without a central divider, separated by a double yellow line of about 0.5 m wide, with non-motorised lanes of about 1 metre on both sides, and with street lamps at the roadside. The direction of travel of the vehicles, i.e., the azimuth of the road, is approximately 129.1°. There are no motorised vehicles parked on either side of the road.
Road No. 22 is currently a four-lane road in both directions, with a lane width of about 3.5 m, no central divider, separated by a double yellow line of about 0.5 m wide, and an azimuth angle of 39.1° For this road, there are no motor vehicle stops on either side of the road.
5.2. Construction of Numerical Simulation System Based on RHINO for Degree of Discomfort Glare Caused by Reflected Light on Drivers and Numerical Simulation Evaluation Process
The use of technical methods to simulate and calculate the impact of reflected light from glass curtain walls on drivers allows for the generation of images and evaluation data that closely represent real-world conditions. Given the complexity of dynamically modelling the real-time spatial relationships between the sun, buildings, and moving vehicles—spanning macroscopic (e.g., solar trajectory) and microscopic (e.g., light reflection) scales—the selection of an appropriate simulation platform is critical. Despite Rhino’s potential limitations, such as its reliance on empirical input data (e.g., road surface reflectivity) and uncertainties arising in extreme scenarios (e.g., rapid vehicle acceleration or non-uniform glass surface coatings), it was chosen as the primary tool for this study due to its unique advantages. Unlike Ecotect, whose simplified model architecture struggles to integrate traffic dynamics into light environment simulations, and TRNSYS 18, which faces challenges in capturing the real-time relative motion between the sun, buildings, and vehicles, Rhino offers unparalleled flexibility. Its visualisation capabilities enable the intuitive construction of dynamic mathematical models linking these three elements (e.g., glass curtain walls, roads, and vehicles). Furthermore, its compatibility with Grasshopper—a parametric design tool—facilitates precise geometric modelling and parameterisation.
The construction of the simulation system for this study is shown in Figure 15; the first part of which consists of modelling glass curtain wall buildings, roads, and small cars using Rhino and Grasshopper as modelling tools. Next, we set the weather information, location information, and simulation time. The second part of the analysis of the light environment was carried out using the Radiance core, which simulates both static and dynamic light environment scenarios to determine the spatial extent of the subsequent simulation, i.e., the coverage domain of the reflected light from the glass façade on the road. Meanwhile, we use Equations (14) and (22) in Section 3 to solve the reflectivity of the glass curtain wall and the brightness of the reflected light on the surface of the curtain wall. The third part calculates the degree of the influence of the driver discomfort glare according to Equation (32) and translates the results into a visualisation graph.
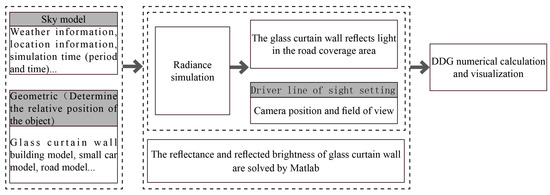
Figure 15.
Building block ideas for RHINO-based simulation systems.
Figure 16 shows the evaluation workflow that considers the coverage domain of the reflected light from the glass curtain wall on the road, the relative positions of the glass curtain wall building, the road and the driver, the brightness of the reflected light from the glass curtain wall, the vertical illuminance at the driver’s eye, and so on to compute all the components required for the DDG. The DDG impact level assessment toolkit consists of two main parts. The first part is to analyse the influence area of reflected light from the glass curtain wall based on the ray tracing with Radiance as the calculation core, including the building and road model building and relevant parameter settings, the reflected light ray tracing model, and the visualisation model of the reflected area. The second part is the numerical calculation of DDG and the visualisation of the glare situation, including the modelling of a small car and the parameter settings of the driver’s front windscreen, the driver’s field of view settings, the numerical input of the reflected light brightness, the numerical calculation of DDG, and the visualisation of the display.
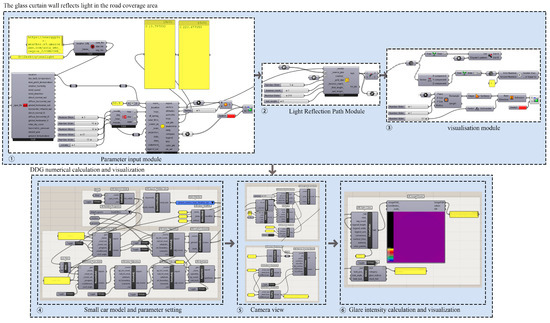
Figure 16.
Simulation system programme construction.
5.3. Numerical Simulation Analysis of Impact of Reflected Light from Curtain Wall of Case Building on Discomfort Glare of Drivers
5.3.1. Case Building and Surrounding Road Traffic Scene Modelling
First of all, the selected study object is modelled according to the actual dimensions of the building; the dimensions of the building plane are 67.75 m × 55.2 m, the height of the tower part of the building is 95.4 m, and the height of the podium part of the building is 36.75 m. The objects around the study object are modelled according to the actual situation, including other buildings and trees in the site, etc. In order to facilitate the simulation, the building details and outdoor space are reasonably simplified and ignored. The road is modelled according to the actual situation of the scene, including the location of the road, the width of the road, the number of carriageways, etc., as shown in Figure 17.
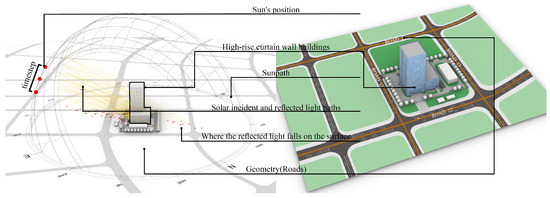
Figure 17.
The modelling of the research object.
5.3.2. Numerical Simulation of Boundary Conditions for Degree of Discomfort and Glare Caused by Reflected Light from Curtain Walls on Drivers
For the choice of the simulation date, because the reflected light of the glass curtain wall has continuity and variability, the reflected light of the glass curtain wall building in a year should be taken as the study object when conducting the study. However, the amount of simulation data in a year is very large; in order to simplify the amount of simulation data, in this study 7:00–18:00 of the typical seasons of a year (spring equinox on 20 March, summer solstice on 21 June, autumn equinox on 23 September, and winter solstice on 22 December) is used as the simulation time to approximate the representation of a year’s data of the light environment.
For the setting of the boundary conditions, the four lanes of the east–west main road, north–south main road, and two secondary roads around the building are modelled according to the actual situation of the project. The sky model adopts CIE full clear sky and imports the Dalian weather data EPW file, and the sky type selected was full clear sky (International Commission of Illumination standard clear sky). For the material setting, the curtain wall is selected as hollow three-layer glass and the road surface is asphalt pavement according to the actual situation. The surface of the outer envelope of the study object was meshed with an accuracy of 4 m × 4 m during the simulation. The reflectivity of the snow-covered pavement is taken to be 0.9 and that of the dry asphalt pavement is taken to be 0.14. The driver’s eye height was controlled by the camera view, with the eye height 1.5 m above the road surface and the line of sight 1~2° below the horizontal line.
5.4. Discussion
5.4.1. The Analysis of the Coverage Area Formed by the Reflected Light of the Glass Curtain Wall on the Surrounding Roads
Figure 18 shows the areas affected by the reflected light from the glass façade on the surrounding roads from 7:00 to 18:00 on the four typical days mentioned above. The red dots on the road surface in the figure show the main affected areas, and the yellow sphere is the path of the sun. From 6:00 a.m. to 7:00 a.m., the curtain wall light reflection mainly affects the road sections No. 21 and No. 13, and road section No. 12 is slightly affected. The length of road section No. 21 is mainly affected by 73 m, the length of road section No. 13 is affected by 88 m, and the length of road section No. 12 is affected by 32 m. The affected area of road section No. 21 is located in the crossroads, and the reflected light ray is irradiated in the centre of the road, and the impact length of road section No. 13 is longer, but the irradiated area is concentrated at the edge of the road. The affected area of Road No. 21 is located at an intersection, and the reflected light is directed at the centre of the road, while Road No. 13 has a longer length but the irradiated area is concentrated at the edge of the road. The analysis shows that the situation is most unfavourable on the summer solstice, when the glare is more severe on east–west roads than on north–south roads.

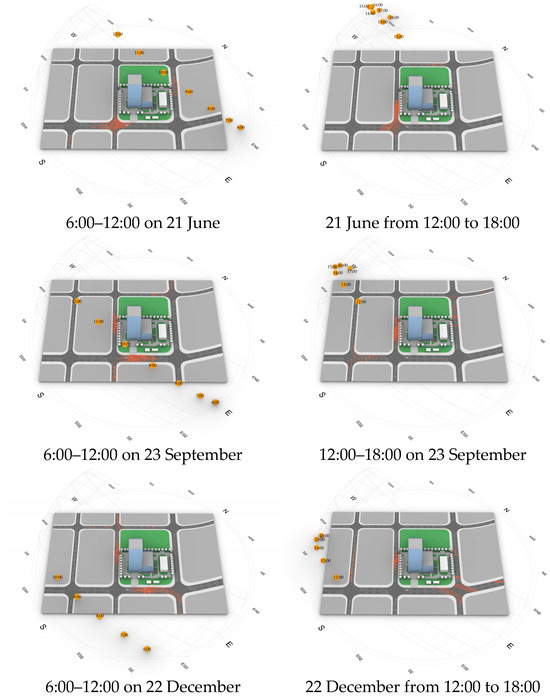
Figure 18.
Distribution maps of the coverage area formed by the reflected light of the glass curtain wall on the surrounding roads at different times.
In the afternoon, from 17:00 to 18:00, the reflected light from the curtain wall mainly affects the road sections at the intersection of Road No. 21 and Road No. 12 and the north side of the road. The distances affected were 94.1 m and 54.5 m. The main affected area was at the intersection of Road No. 21 and Road No. 12.
5.4.2. Analysis of Glass Thickness on Reflectivity and Discomfort Glare Level
Based on the conclusions of the main affected road areas in Section 5.4.1 above, the discomfort glare simulation for drivers and the discomfort glare evaluation were carried out for these road areas. The glass thickness also has a large impact on the reflectivity of the glass.
In this section, the south-facing glass curtain wall installed in the south direction is selected, and four different thicknesses of glass (3 mm-3 mm-3 mm, 4 mm-4 mm-4 mm, 5 mm-5 mm-5 mm, and 6 mm-6 mm-6 mm, respectively) are chosen to study the reflectivity of the outer surface of the glass of the material thicknesses as well as the degree of the impact on the driver. The values of the reflectance and sunlight incidence angle for different glass thicknesses on a typical climate day in Dalian are shown in Figure 19. The extent of the effect of a typical day in Dalian on the road driver discomfort glare is shown in Figure 20.
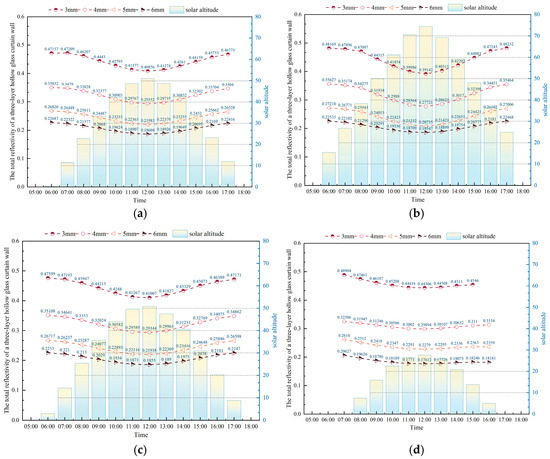
Figure 19.
The total reflectance of the glass on typical climate days in Dalian. (a) Total reflectivity of the curtain wall on 21 March; (b) total reflectivity of the curtain wall on 21 June; (c) total reflectivity of the curtain wall on 23 September; (d) total reflectivity of the curtain wall on 22 December.
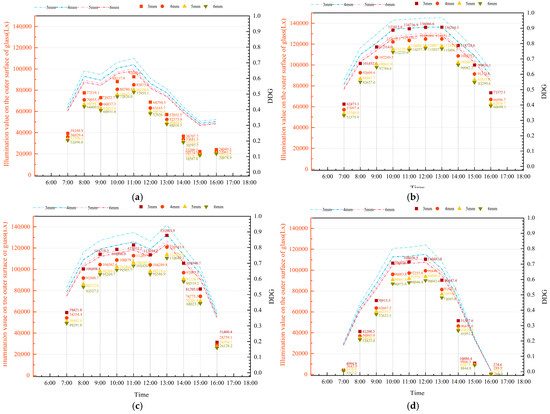
Figure 20.
Illuminance and DDG level of outer surface of glass with different thicknesses of glass. (a) DDG of the reflected light from the three-layer hollow glass curtain wall on 21 March; (b) DDG of the reflected light from the three-layer hollow glass curtain wall on 21 June; (c) DDG of the reflected light from the three-layer hollow glass curtain wall on 23 September; (d) DDG of the reflected light from the three-layer hollow glass curtain wall on 22 December.
As shown in Figure 19 and Figure 20, with the triple insulating glass, as the thickness of the curtain wall glass increases, the reflectivity of the curtain wall decreases from 40% to 18%, and the illuminance on the outer surface of the glass decreases from 33,920 lx to 13,483 lx, with a consequent decline in the DDG value. The physical mechanism behind this phenomenon is rooted in the interplay between the reflection, transmission, and absorption in multi-layer glass systems. When light strikes a glass pane, a portion is reflected at the air–glass interface, according to the Fresnel equations (Equations (1) and (2)), while the remainder enters the glass. Within the glass, light undergoes both absorption (dependent on material properties and thickness) and multiple internal reflections between the front and back surfaces. A thicker glass increases the path length of the light within the glass matrix, thereby enhancing absorption (Equation (4)). This absorption reduces the proportion of light that can be reflected back to the external environment, leading to a decline in total reflectance. Therefore, in sunny areas, the thickness of the triple-insulating curtain wall glass should be as thick as possible (without considering the use of coated glass) to reduce the brightness of the reflected light from the surface of the curtain wall and reduce the risk of driver glare.
5.4.3. Influence of Different Glass Materials on Intensity of Discomfort Glare
To investigate the effects of different glazing materials on mitigating reflective light pollution, this study comparatively analyses three typical glass curtain wall coatings: double-silver Low-E on clear glass, triple-silver Low-E on clear glass, and solar reflective on clear glass. The simulated glass curtain walls maintain a three-layer configuration with thicknesses of 6 mm-12 mm-6 mm-12 mm-6 mm, incorporating air gaps between layers. The winter solstice was selected as the simulation date due to its characteristically low solar altitude angle, which prolongs the duration of the potential glare impact on drivers. The DDG values for the three coating types were systematically calculated, with the quantitative results presented in Figure 21.
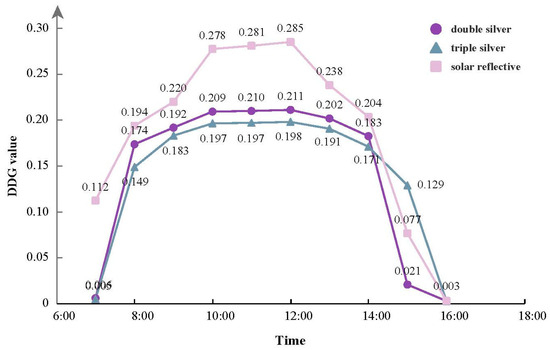
Figure 21.
Relationship between different glazing materials or coating and DDG values.
Based on the DDG temporal variations presented in Figure 21, the three coating types exhibit distinct glare mitigation performances during the winter solstice simulation. The findings indicate that the triple-silver Low-E coating demonstrates the most favourable performance in mitigating the reflective light impact on drivers. This coating maintains the lowest all-day DDG index range (0.129–0.198), with a mean glare intensity of 0.177, representing a 0.92% reduction compared to the double-silver variant. Notably, during morning periods with smaller solar altitude angles (07:00–09:00), it exhibits the minimal peak glare intensity (0.183) among the three coating types, thereby effectively reducing transient visual impairment risks for drivers. In comparison, the double-silver Low-E coating shows significantly elevated daytime average DDG values (0.176). The solar reflective coating presents the least satisfactory glare mitigation characteristics, reaching a critical instantaneous DDG value of 0.194 during morning peak traffic hours (08:00), which indicates that the reflection phenomenon from glass curtain walls, formed by the coating, could significantly elevate road traffic safety risks. The increase in the number of silver layers in the glass coating significantly enhanced the reflected light modulation performance, while the use of reflective coatings had a negative effect on the light pollution mitigation effect.
5.4.4. The Analysis of the Level of Discomfort Glare Caused by the Reflected Light from Glass Curtain Walls Throughout the Year
To analyse the degree of influence of the discomfort glare of the reflected light from the glass curtain wall in the study case throughout the year, we firstly determine the relationship equation between the calculated value of DDG and the total value of solar illuminance (the sum of the direct illuminance value and diffuse illuminance value), and secondly, according to the influence level of the DDG, we calculate the total value of the solar illuminance corresponding to the influence degree of the discomfort glare. Finally, the influence degree of the discomfort glare in this case is obtained by collecting the hour-by-hour solar illuminance values of the Dalian area throughout the year, while considering the range of 20° of vertical angle in the driver’s forward direction.
The facade of the study case is a 6 mm-12 mm (argon)-6 mm-12 mm-6 mm three-layer insulating glass curtain wall. As shown in Figure 22, the relation equation, y = Intercept + B1 × x^1 + B2 × x^2, between the DDG calculated value and the solar illuminance value of the typical day of the three-layer glass curtain wall in Dalian was obtained by numerical fitting with the data. The R2 value of the fitting formula is 0.998, indicating that the linear relationship between DDG and Eall is valid.
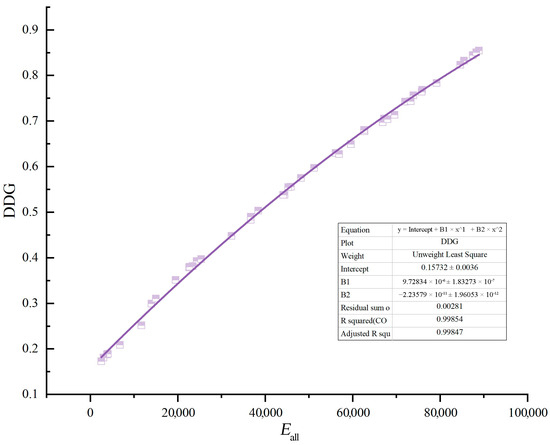
Figure 22.
Fitting relationship between DDG level and total solar illumination value.
Figure 23, Figure 24, Figure 25 and Figure 26, respectively, analysed the influence of the reflected light of glass curtain walls on the driver discomfort glare in four quarters of a year. In the figures, the purple line represents the hourly change in the sun’s altitude angle value throughout the year, the blue triangle represents the hourly DDG calculation value for four quarters, and the red triangle represents the value of the uncomfortable glare reflected by the glass curtain wall for four quarters. On the whole, the discomfort glare in the first and fourth quarters had a greater impact, among which 2.4% of the time was affected by discomfort glare in the first quarter and 3.08% in the fourth quarter. In the second and third quarters, the degree of the discomfort glare that affected drivers was less than 1%, and the impact was small. This is mainly due to the fact that Dalian is in the Northern Hemisphere. In the first and fourth quarters, especially during the winter solstice, the sun shines directly on the Tropic of Capricorn, while the sun altitude angle in the Northern Hemisphere is lower. The lower sun height angle makes it more likely that the reflected light from the glass curtain wall will be reflected horizontally or near horizontally, which makes it easier to enter the driver’s field of view.
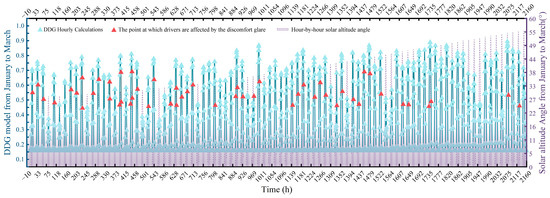
Figure 23.
Temporal variation in DDG level and solar altitude angle from January to March.
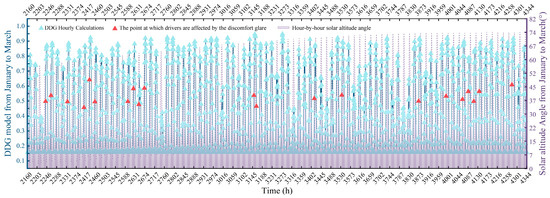
Figure 24.
Temporal variation in DDG level and solar altitude angle from April to June.
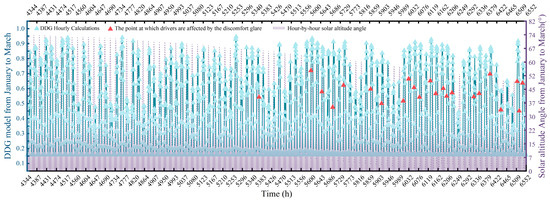
Figure 25.
Temporal variation in DDG level and solar altitude angle from January to March and July to September.
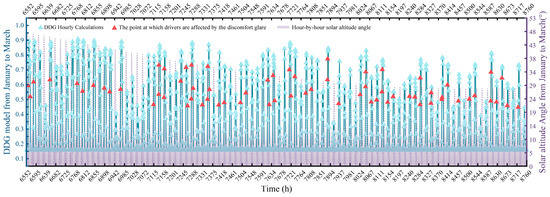
Figure 26.
The temporal variation in DDG level and solar altitude angle from January to March and October to December.
5.4.5. DDG Level Analysis Under Snow and Dry Ground Conditions in Winter
In winter, when sunlight is available on a sunny day, the level of discomfort glare caused to drivers by reflected light from curtain walls can differ significantly between snowy and dry asphalt pavement conditions. Therefore, this article analyses the DDG level under the winter conditions of the snow and dry ground.
The surface luminance of the triple-insulating glass curtain wall is related to the total luminous flux radiated by the sunlight in all directions. Influenced by the driving road conditions, the dry asphalt road (reflectance is taken as 0.14) and snowy road (reflectance is taken as 0.9) are taken as two typical driving road conditions, and inputting the weather information on the winter solstice day, the 6 mm-6 mm-6 mm triple-insulating south-facing glass is used, and the optical performance of the system is as shown in Figure 27.
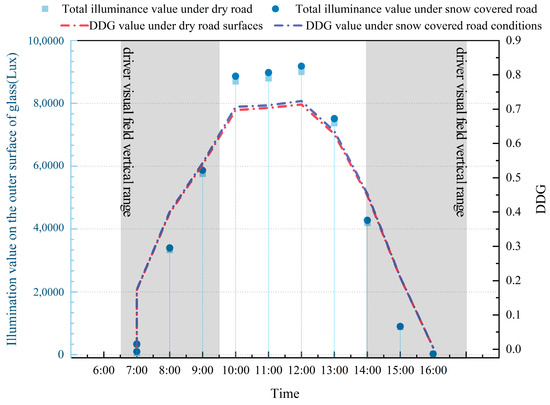
Figure 27.
Comparison of DDG values of reflected light from three-layer hollow curtain wall with snow and dry ground conditions.
As can be seen in Figure 28 and Figure 29, from 7:00 to 16:00 inside the cab, there is a good consistency with the change in the DDG value with the changes in the total illuminance value of the glazed surface. For the two simulation conditions, under the same outdoor light conditions, the average value of total illuminance from the outdoor light source is 37,814.62 lx for the dry asphalt pavement inside the cab, and the average value of total illuminance for the snowy pavement is 37,972.15 lx inside the cab. The value of total illuminance for the dry asphalt pavement reaches the maximum value of 90,043.38 lx at 12:00 inside the cab, and that of the snowy pavement reaches the maximum value of 91,831.97 lx at 12:00. And the DDG average value for snowy roads is 0.28 higher than that for dry roads. The comparison results show that the road surface conditions have a greater influence on DDG.
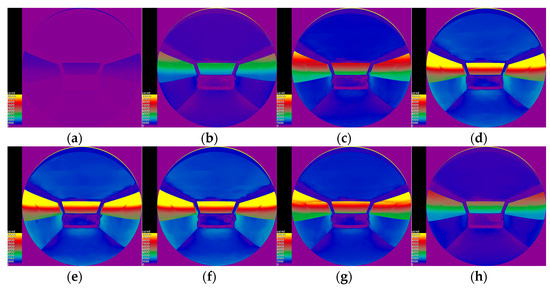
Figure 28.
Analysis of reflected light brightness inside vehicle under dry ground conditions. (a) Brightness value inside car at 7 o’clock; (b) brightness value inside car at 8 o’clock; (c) brightness value inside car at 9 o’clock; (d) brightness value inside car at 10 o’clock; (e) brightness value inside car at 11 o’clock; (f) brightness value inside car at 12 o’clock; (g) brightness value inside car at 13 o’clock; and (h) brightness value inside car at 14 o’clock.

Figure 29.
Analysis of reflected light brightness inside vehicle under snow ground conditions. (a) Brightness value inside car at 7 o’clock; (b) brightness value inside car at 8 o’clock; (c) brightness value inside car at 9 o’clock; (d) brightness value inside car at 10 o’clock; (e) brightness value inside car at 11 o’clock; (f) brightness value inside car at 12 o’clock; (g) brightness value inside car at 13 o’clock; and (h) brightness value inside car at 14 o’clock.
6. Conclusions and Prospects
6.1. Conclusions
To study and solve the evaluation problem of the glare pollution caused by reflected light from building glass curtain walls on road traffic environments, especially drivers, this article focuses on the evaluation of the impact of the reflected light generated by the three-layer hollow glass curtain wall system, commonly used in green building construction, on the light pollution (i.e., discomfort glare) caused by drivers. Firstly, this article adopted a numerical evaluation research method to establish a mathematical model for the current solar reflection and brightness of high-rise building glass and verified the calculation accuracy of the model. Secondly, this article studied the key factors affecting the degree of the discomfort glare pollution caused by reflected light from glass curtain walls to drivers and established the DDG model for the discomfort glare caused by reflected light from curtain walls to drivers. This study developed a numerical simulation system for the discomfort glare pollution caused by reflected light on vehicle drivers in high-rise building glass curtain wall systems based on the Rhino 7 software. Finally, taking a high-rise glass curtain wall building in Dalian as an example, this article simulated and analysed the degree of the discomfort glare caused by reflected light from the building’s curtain wall on drivers and obtained the regularity of the degree of the discomfort glare impact with changing glass thicknesses and weather conditions. Through the above research, the following conclusions can be drawn.
(1) Considering the dynamic changes in the relative positions of the sun, buildings, and vehicle drivers is the key to studying and solving the problem of the glare pollution caused by reflected light from curtain walls on road drivers. The process of light passing through car window glass has the same characteristics as the process of light passing through building window glass. Therefore, the DGP model can serve as the basis for DDG modelling, further establishing mathematical models for reflectivity and reflection brightness.
(2) This study indicates that the mathematical model for evaluating the driver discomfort glare caused by reflected light from curtain walls consists of a glass curtain wall reflectivity calculation model (i.e., Equation (14)), a glass curtain wall reflection brightness model (i.e., Equation (22)), a model for the relative position of the reflected light source and the vehicle driver (i.e., Equation (29)), a model for the vertical illuminance of the reflected light from the curtain wall on the driver (i.e., Equation (30)), and an evaluation model for the DDG model caused by the reflected light from the curtain wall (i.e., Equation (32)). The evaluation calculation of the DDG level should first calculate the coverage area of the sunlight around the curtain wall building according to Equation (28), and then calculate the curtain wall reflectivity, reflected light brightness, relative position of the reflected light source and the driver, and the vertical glare caused by the reflected light on the driver according to the above model. Finally, the illumination and DDG value can be obtained.
(3) On the premise of ensuring a certain number of glass layers in the hollow glass curtain wall system, increasing the thickness of each layer of glass from 3 mm to 6 mm will reduce the total reflectivity of the curtain wall system from 48% to 18%, and the DDG value will also decrease from 0.75 to 0.65. Therefore, in areas with high sunlight intensity, increasing the thickness of the single-layer glass in the three-layer glass curtain wall system can reduce the brightness of the reflected light on the curtain wall surface, thereby reducing the discomfort glare effects on drivers.
(4) According to the DDG evaluation results on driver discomfort glare throughout the year in Dalian, the durations of the discomfort glare impact on drivers are longer in the first and fourth quarters, and the duration of the discomfort glare impact in the first quarter is 2.4%, the highest proportion among the four quarters of the year. Meanwhile, in winter, the DDG value is greatly affected by whether the road area is snowy or not, with the average DDG value on snowy roads being 0.28 higher than on dry roads. In winter, in order to reduce the discomfort glare caused by road snow on drivers, it is necessary to clear the snow on the roads in a timely manner.
In summary, the DDG model and its solution method proposed in this article, as well as the numerical simulation evaluation method based on the Rhino software, provide a feasible numerical evaluation method for solving the discomfort and glare effects of reflected light from high-rise building glass curtain walls on vehicle drivers, as well as the degree of light pollution caused by other moving targets on surrounding roads. It also provides a theoretical analysis method for evaluating the dynamic light pollution problem in the outdoor environments of green buildings. At the same time, this article focuses on the formation process and influencing factors of the glare pollution caused by reflected light from curtain wall buildings on road drivers, including dynamic mathematical modelling methods, model-solving methods, and simulation methods based on the Rhino software. It provides valuable theoretical and methodological references for studying and analysing the problem of the reflected light pollution from curtain wall buildings in other cities.
6.2. Prospects
The evaluation of the degree of discomfort and glare caused by reflected light from glass curtain walls to vehicle drivers is not only related to objective factors, such as the solar altitude angle, curtain wall glass thickness, curtain wall reflectivity, reflected light brightness, vertical illumination, vehicle position, vehicle speed, and road surface snow, but also to subjective factors, such as the driver’s age, physical condition, and psychological emotions. It is a complex dynamic process in which subjective and objective factors are intertwined. Therefore, it is necessary to further conduct in-depth theoretical research and experimental verification from the following perspectives to address this issue and apply them to urban, architectural, and transportation planning and construction processes.
Firstly, regarding the optimisation and simulation research of mathematical models for reflected light pollution, we will focus on optimising the DDG model and its simulation methods to enhance its practicality and accessibility. For example, we will adopt pseudo-spectral methods with Chebyshev collocation points for spatial discretisation [45], generating approximate solutions via numerical integration and optimisation algorithms. This approach aims to simplify the computational complexity of the DDG framework while maintaining predictive accuracy.
Secondly, regarding the study of the correlation between reflected light pollution and subjective factors of vehicle drivers, we will adopt the research methods of IoT monitoring and a questionnaire survey regarding the subjective factors of vehicle drivers. Through real-time testing and research on the solar illumination parameters, curtain wall-reflected light parameters, vehicle travel speed, driver fatigue level, age, physical condition, and driver’s impact on discomfort glare, we will use methods such as big data modelling and neural network machine learning algorithms to study and establish the problem of reflected light pollution, including drivers’ subjective feelings, and carry out more practical scenario-based experimental research and verification work in order to provide theoretical methods for green building evaluation and sustainable urban and transportation planning.
Thirdly, in the construction and research methods of the numerical simulation platform for reflected light pollution on curtain walls, we will fully utilise the Rhino software platform to further optimise and improve the DDG model, enhance the dynamic simulation models of the sun, buildings, and vehicles, and embed methods such as big data analysis, neural network deep learning, and driver subjective factor analysis to enhance the numerical evaluation function of the reflected light pollution on curtain walls, providing a simulation platform for green building light pollution evaluations and sustainable urban and transportation planning research. At the same time, we will develop step-by-step guidelines, including simplified data workflows, open-source code repositories, and case studies, which will assist urban planners and architects in applying our models effectively.
Finally, regarding the research on policies to reduce urban light pollution, we will conduct research on urban light pollution prevention and control policies based on this article and subsequent research results and compare and analyse them with other countries’ urban light pollution prevention and control issues. At the same time, the correlation between the curtain wall glare pollution and the curtain wall structure, curtain wall thickness, building carbon emissions, and building thermal environment creation will be studied to create a green, low-carbon, healthy, and comfortable building environment. Based on the research results, we will provide opinions and suggestions on green buildings, sustainable cities, and transportation and scientific planning to the urban construction and transportation planning authorities.
Author Contributions
Conceptualization, J.Z. and R.P.; methodology, J.Z. and R.P.; software, R.P.; validation, R.P. and Y.H.; data curation, R.P. and Y.H.; writing—original draft preparation, R.P. and J.Z.; writing—review and editing, R.P. and J.Z.; All authors have read and agreed to the published version of the manuscript.
Funding
This research received no external funding.
Institutional Review Board Statement
Not applicable.
Informed Consent Statement
Not applicable.
Data Availability Statement
The data presented in this study are available on request from the corresponding author.
Conflicts of Interest
The authors declare no conflict of interest.
Abbreviations
| Abbreviations | |
| DGP | Daylight Glare Probability |
| GI | Glare Index |
| UGR | Unified Glare Rating System |
| DDG | driver’s discomfort glare |
| Symbols | |
| kcoating−r | extinction coefficient of reflected light of glass panel coating |
| αe | driver’s view angle (°) |
| s | direction vector of the sun’s rays |
| γs | solar azimuth (°) |
| hs | solar altitude angle (°) |
| γb | the building’s azimuth angle (°) |
| n | the normal vector |
| r | the reflected ray vector |
| e | angle of inclination of the road |
| c | distance of building from road (m) |
| d | width of roads (m) |
| ηk | the reflectivity of the interface |
| φ1 | the angle of incidence of the sun’s rays (°) |
| φ2 | the angle of refraction |
| n1 | the refractive index of air. |
| n2 | the refractive index of single-layer glass |
| τk | the transmittance of the sun in a single-layer glass medium |
| dg | the thickness of the glass (mm) |
| Esun | the solar radiation illuminance (lx) |
| ηa | direct reflectance of the front surface of the glass |
| ηb | direct reflectance of the rear surface of the glass |
| ηd,all | the total reflectivity of single-layer glass |
| Ez | the illuminance of direct light incident on the glass surface (lx) |
| Es | the illuminance of diffusion light incident on the glass surface (lx) |
| ηi,all | total reflectance of triple insulating glass curtain walls |
| τi,all | total transmittance of triple insulated glass curtain walls |
| LsiR | brightness of reflected light on the surface of the curtain wall |
| Acur | the optical system irradiation of the surface area of the glass curtain wall (m2) |
| ls | the optical system into the glass curtain wall in the distance between the sun (m) |
| ε | the sunlight and the curtain wall plane angle between the normal (°) |
| Ks | the atmosphere on the wavelength of the transmittance of the calculation |
References
- Wang, T.; Ma, M.; Zhou, N.; Ma, Z. Toward Net Zero: Assessing the Decarbonization Impact of Global Commercial Building Electrification. Appl. Energy 2025, 383, 125287. [Google Scholar] [CrossRef]
- Deng, Y.; Ma, M.; Zhou, N.; Zou, C.; Ma, Z.; Yan, R.; Ma, X. Provincial Allocation of China’s Commercial Building Operational Carbon toward Carbon Neutrality. Appl. Energy 2025, 384, 125450. [Google Scholar] [CrossRef]
- Shen, B.; Wang, Y.; Lu, L.; Yang, H. pH-dependent doping level and optical performance of antimony-doped tin oxide nanocrystals as nanofillers of spectrally selective coating for energy-efficient windows. Ceram. Int. 2021, 47, 20335–20340. [Google Scholar] [CrossRef]
- Ying, S.; Tang, M.; Zhang, X.; Hu, Z.; Guo, H. Sunlight Pollution Analysis of Glass Curtain Wall in 3D City. Geomat. Inf. Sci. Wuhan Univ. 2021, 46, 610–619. [Google Scholar] [CrossRef]
- Network, C.C.W. Report on Research and Development Analysis of the Doors, Windows and Curtain Walls Industry in China, 2022–2023. Available online: http://www.52mqw.com/info/2023-3-17/49877-1.htm (accessed on 10 February 2024).
- Green, R.F.; Luginbuhl, C.B.; Wainscoat, R.J.; Duriscoe, D. The Growing Threat of Light Pollution to Ground-Based Observatories. Astron. Astrophys. Rev. 2022, 30, 1. [Google Scholar] [CrossRef]
- Sim, Y.; Kim, I.; Choi, A.; Sung, M. A Preliminary Study of an Evaluation Method for Discomfort Glare Due to Light Trespass. Light. Res. Technol. 2017, 49, 632–650. [Google Scholar] [CrossRef]
- Pothukuchi, K. City Light or Star Bright: A Review of Urban Light Pollution, Impacts, and Planning Implications. J. Plan. Lit. 2021, 36, 155–169. [Google Scholar] [CrossRef]
- Government of Canada. Glass and Metal Curtain Walls. Available online: https://publications.gc.ca/collections/collection_2016/schl-cmhc/NH15-428-2004-eng.pdf (accessed on 10 February 2024).
- Japan, T.B.C.O. Sapporo City Building Environment Consideration System. Available online: https://www.city.sapporo.jp/kankyo/casbee/dl2010/documents/hyoka_ikkatsu_casbee2016.pdf (accessed on 10 February 2024).
- CEN Curtain Walling Product Standard. Available online: https://standards.iteh.ai/catalog/standards/cen/75689053-70e6-4d59-9102-08d1fed0de94/en-13830-2015a1-2020-ac-2022 (accessed on 10 February 2024).
- Petherbridge, P.; Hopkinson, R. Discomfort Glare and the Lighting of Buildings. Light. Res. Technol. 1950, 15, 39–79. [Google Scholar] [CrossRef]
- Nisbet, S.; Mthembu, N. Transwall modelling using effective conductivities. Solar Energy 1992, 49, 127–138. [Google Scholar] [CrossRef]
- Chaiyapinunt, S.; Worasinchai, S. Development of a model for calculating the longwave optical properties and surface temperature of a curved venetian blind. Sol. Energy 2009, 83, 817–831. [Google Scholar] [CrossRef]
- ISO 15099:2003; Thermal Performance of Windows, Doors and Shading Devices—Detailed Calculations. ISO/IOS: Geneva, Switzerland, 2003.
- Lbnl Window. Available online: https://windows.lbl.gov/software/window (accessed on 10 February 2024).
- Lbnl Optics. Available online: https://windows.lbl.gov/software/optics (accessed on 10 February 2024).
- Chunying, L.; Haida, T. Evaluation on year-round performance of double-circulation water-flow window. Renew. Energy 2020, 150, 176–190. [Google Scholar] [CrossRef]
- Mthembu, J.; Roos, A. Modelling the angular behaviour of the total solar energy transmittance of windows. Sol. Energy 2000, 69, 321–329. [Google Scholar] [CrossRef]
- CEN EN 410: Glass in Building—Determination of Luminous and Solar Characteristics of Glazing. Available online: https://civilnode.com/download-standard/10629331711082/bs-en-410-glass-in-building-determination-of-luminous-and-solar-characteristics-of-glazing (accessed on 10 February 2024).
- Holladay, L. The Fundamentals of Glare and Visibility. J. Opt. Soc. Am. 1926, 12, 271–319. [Google Scholar] [CrossRef]
- Kaufman, J.; Christensen, J. Ies Lighting Handbook: 1984 Reference Volume; Illuminating Engineering Society of North America: New York, NY, USA, 1984. [Google Scholar]
- Athanasions, S.; Wienold, J.; Eandi, C.; Gisselbaek, S.; Kawasaki, A.; Andersen, M. Influence of macular pigment on the sensitivity to discomfort glare from daylight. Sci. Rep. 2023, 13, 18551. [Google Scholar] [CrossRef]
- Sichen, L.; Taoning, W.; Athanasions, T. Glare-based selection of roller shade properties. Build. Environ. 2024, 265, 21. [Google Scholar] [CrossRef]
- Xun, Z.; Yihan, X.; Derui, K.; Keer, C.; Xiaozhen, L.; Dezhi, W.; Miaomiao, C. Research on Effectiveness of Anti-Glare Facilities for Road-Rail Same-Story Bridges. China Railw. Sci. 2024, 45, 48–56. [Google Scholar]
- CIE ISO 8995-1:2002(E)/CIE S 008/E:2001 Lighting of Work Places. Available online: https://cie.co.at/ (accessed on 10 February 2024).
- Redelmeier, D.; Raza, S. Life-threatening motor vehicle crashes in bright sunlight. Medicine 2017, 96, e5710. [Google Scholar] [CrossRef]
- Casado-Sanz, N.; Guirao, B.; Lara, G.; Attard, M. Investigating the Risk Factors Associated with the Severity of the Pedestrians Injured on Spanish Crosstown Roads. Sustainability 2019, 11, 5194. [Google Scholar] [CrossRef]
- Abdollahi, V. Adaptive Façade Design for Glare Mitigation and Outside Views in Work Environments. Master’s Thesis, The University of Arizona, Tucson, AZ, USA, 2021. [Google Scholar]
- Suk, J.; Schiler, M.; Kensek, K. Investigation of existing discomfort glare indices using human subject study data. Build. Environ. 2017, 113, 121–130. [Google Scholar] [CrossRef]
- Mushtaha, E.; Hussien, A.A.; Arar, M.; Salleh, S.A.; Mohammad, A.; Masoud, W.; Ahmed, Z.; Almubyedh, H. Artificial lighting systems and the perception of safety in underpass tunnels. Tunn. Undergr. Space Technol. 2022, 122, 15. [Google Scholar] [CrossRef]
- Hopkinson, R. Glare from daylighting in buildings. Appl. Ergon. 1972, 3, 206–215. [Google Scholar] [CrossRef] [PubMed]
- Chauvel, P.; Collins, J.; Collins, R.; Longmore, J. Glare from windows: Current views of the problem. Light. Res. Technol. 1982, 14, 31–46. [Google Scholar] [CrossRef]
- Wienold, J.; Christoffersen, J. Evaluation methods and development of a new glare prediction model for daylight environments with the use of CCD cameras. Energy Build 2006, 38, 743–757. [Google Scholar] [CrossRef]
- Chaloeytoy, K.; Ichinose, M.; Chien, S. Determination of the simplified daylight glare probability (DGPs) criteria for daylit office spaces in Thailand. Buildings 2020, 10, 180. [Google Scholar] [CrossRef]
- Bian, Y.; Luo, T. Investigation of visual comfort metrics from subjective responses in China: A study in offices with daylight. Build. Environ. 2017, 123, 661–671. [Google Scholar] [CrossRef]
- Hirning, M.; Isoardi, G.; Coyne, S.; Hansen, V.; Cowling, I. Post occupancy evaluations relating to discomfort glare: A study of green buildings in Brisbane. Build. Environ. 2013, 59, 349–357. [Google Scholar] [CrossRef]
- Konstantzos, I.; Tzempelikos, A.; Chan, Y. Experimental and simulation analysis of daylight glare probability in offices with dynamic window shades. Build. Environ. 2015, 87, 244–254. [Google Scholar] [CrossRef]
- Kevin, V.; Mehlika, I. A critical investigation of common lighting design metrics for predicting human visual comfort in offices with daylight. Leukos 2014, 10, 145–164. [Google Scholar] [CrossRef]
- Quek, G.; Wienold, J.; Khanie, M.; Erell, E.; Kaftan, E.; Tzempelikos, A.; Konstantzos, I.; Christoffersen, J.; Kuhn, T.; Andersen, M. Comparing performance of discomfort glare metrics in high and low adaptation levels. Build. Environ. 2021, 206, 108335. [Google Scholar] [CrossRef]
- Binghong, P.; Yifei, Z.; Xiaozhong, L. Application of dynamic vision principle in highway alignment design. J. Chang. Univ. Nat. Sci. Ed. 2004, 24, 20–24. [Google Scholar]
- Kim, Y.; Haq, M.; Kim, S. Glass molding of all glass Fresnel lens with vitreous carbon micromold. Opt. Express 2019, 27, 1553–1562. [Google Scholar] [CrossRef] [PubMed]
- Yabe, C.; Harada, K.; Hara, N. Verification of the accuracy of the calculated luminance distributions of scaled physical models with directional reflective surfaces. Build. Environ. 2022, 209, 108670. [Google Scholar] [CrossRef]
- Jakubiec, J.; Reinhart, C. The ‘adaptive zone’—A concept for assessing discomfort glare throughout daylit spaces. Light. Res. Technol. 2012, 44, 149–170. [Google Scholar] [CrossRef]
- Ali, A.M. Numerical Approximation of the Final State of an Incomplete Data Heat Problem. Adv. Differ. Equ. Control. Process. 2023, 30, 199–212. [Google Scholar] [CrossRef]
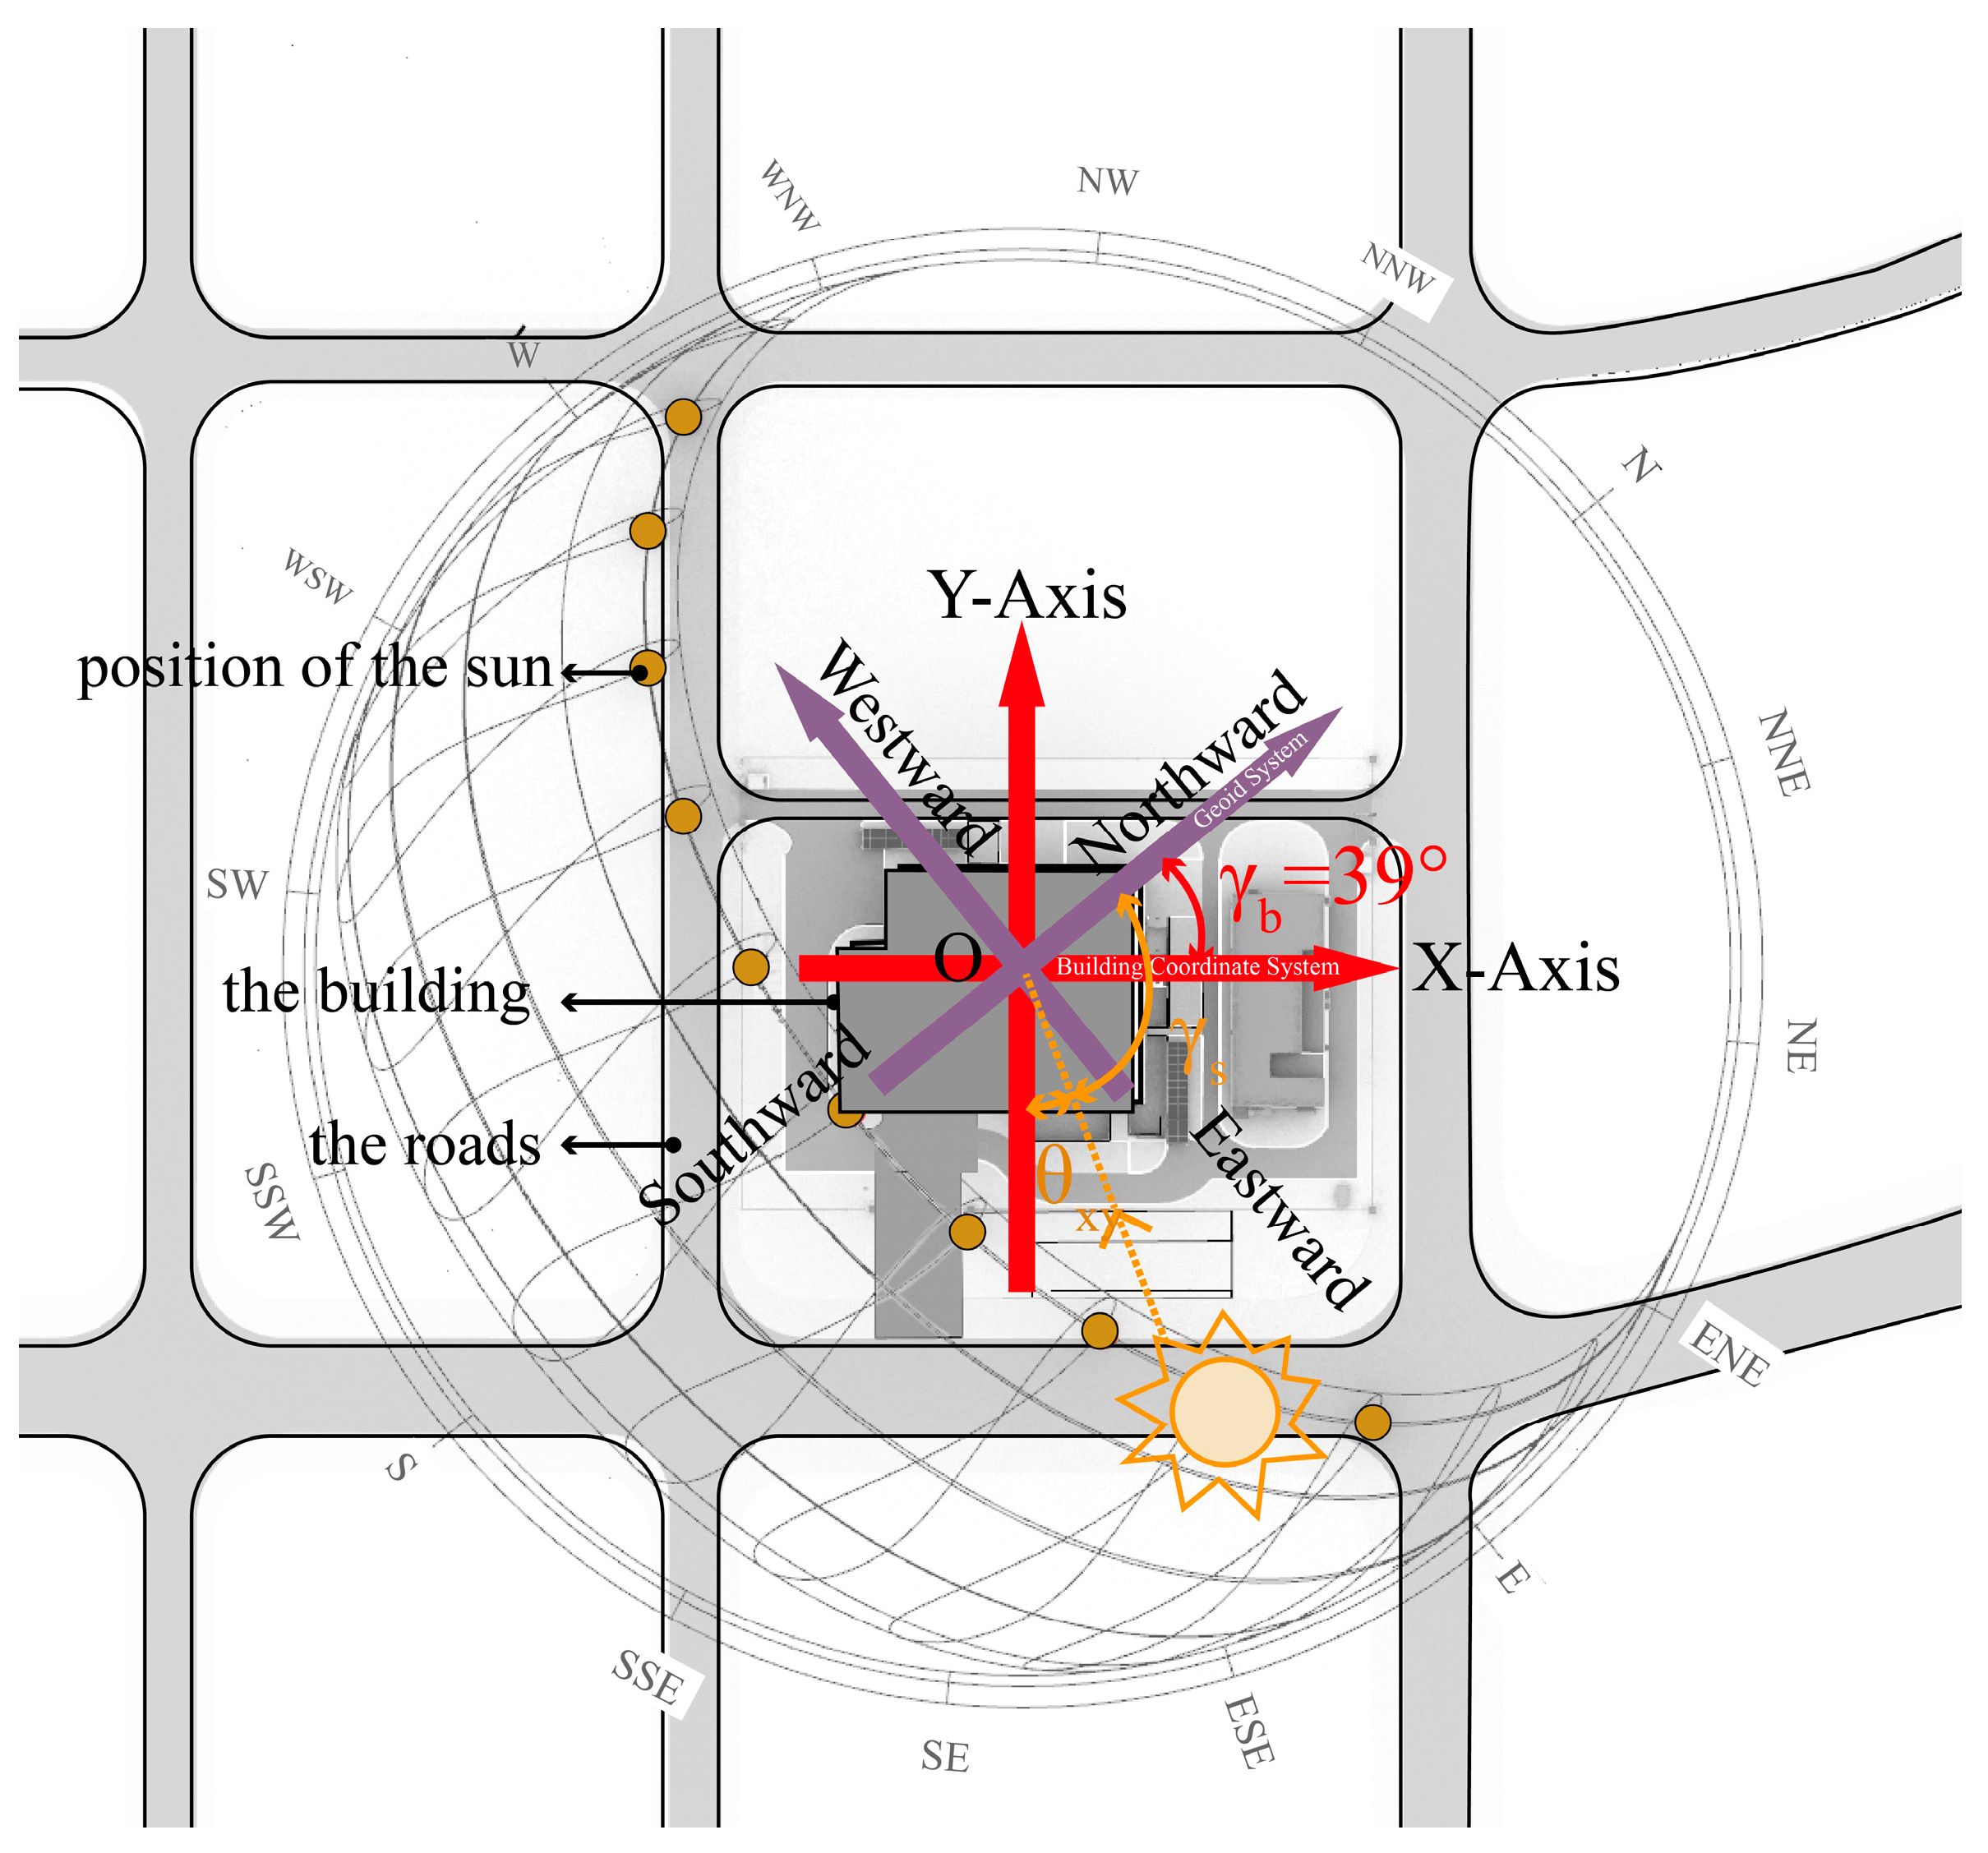
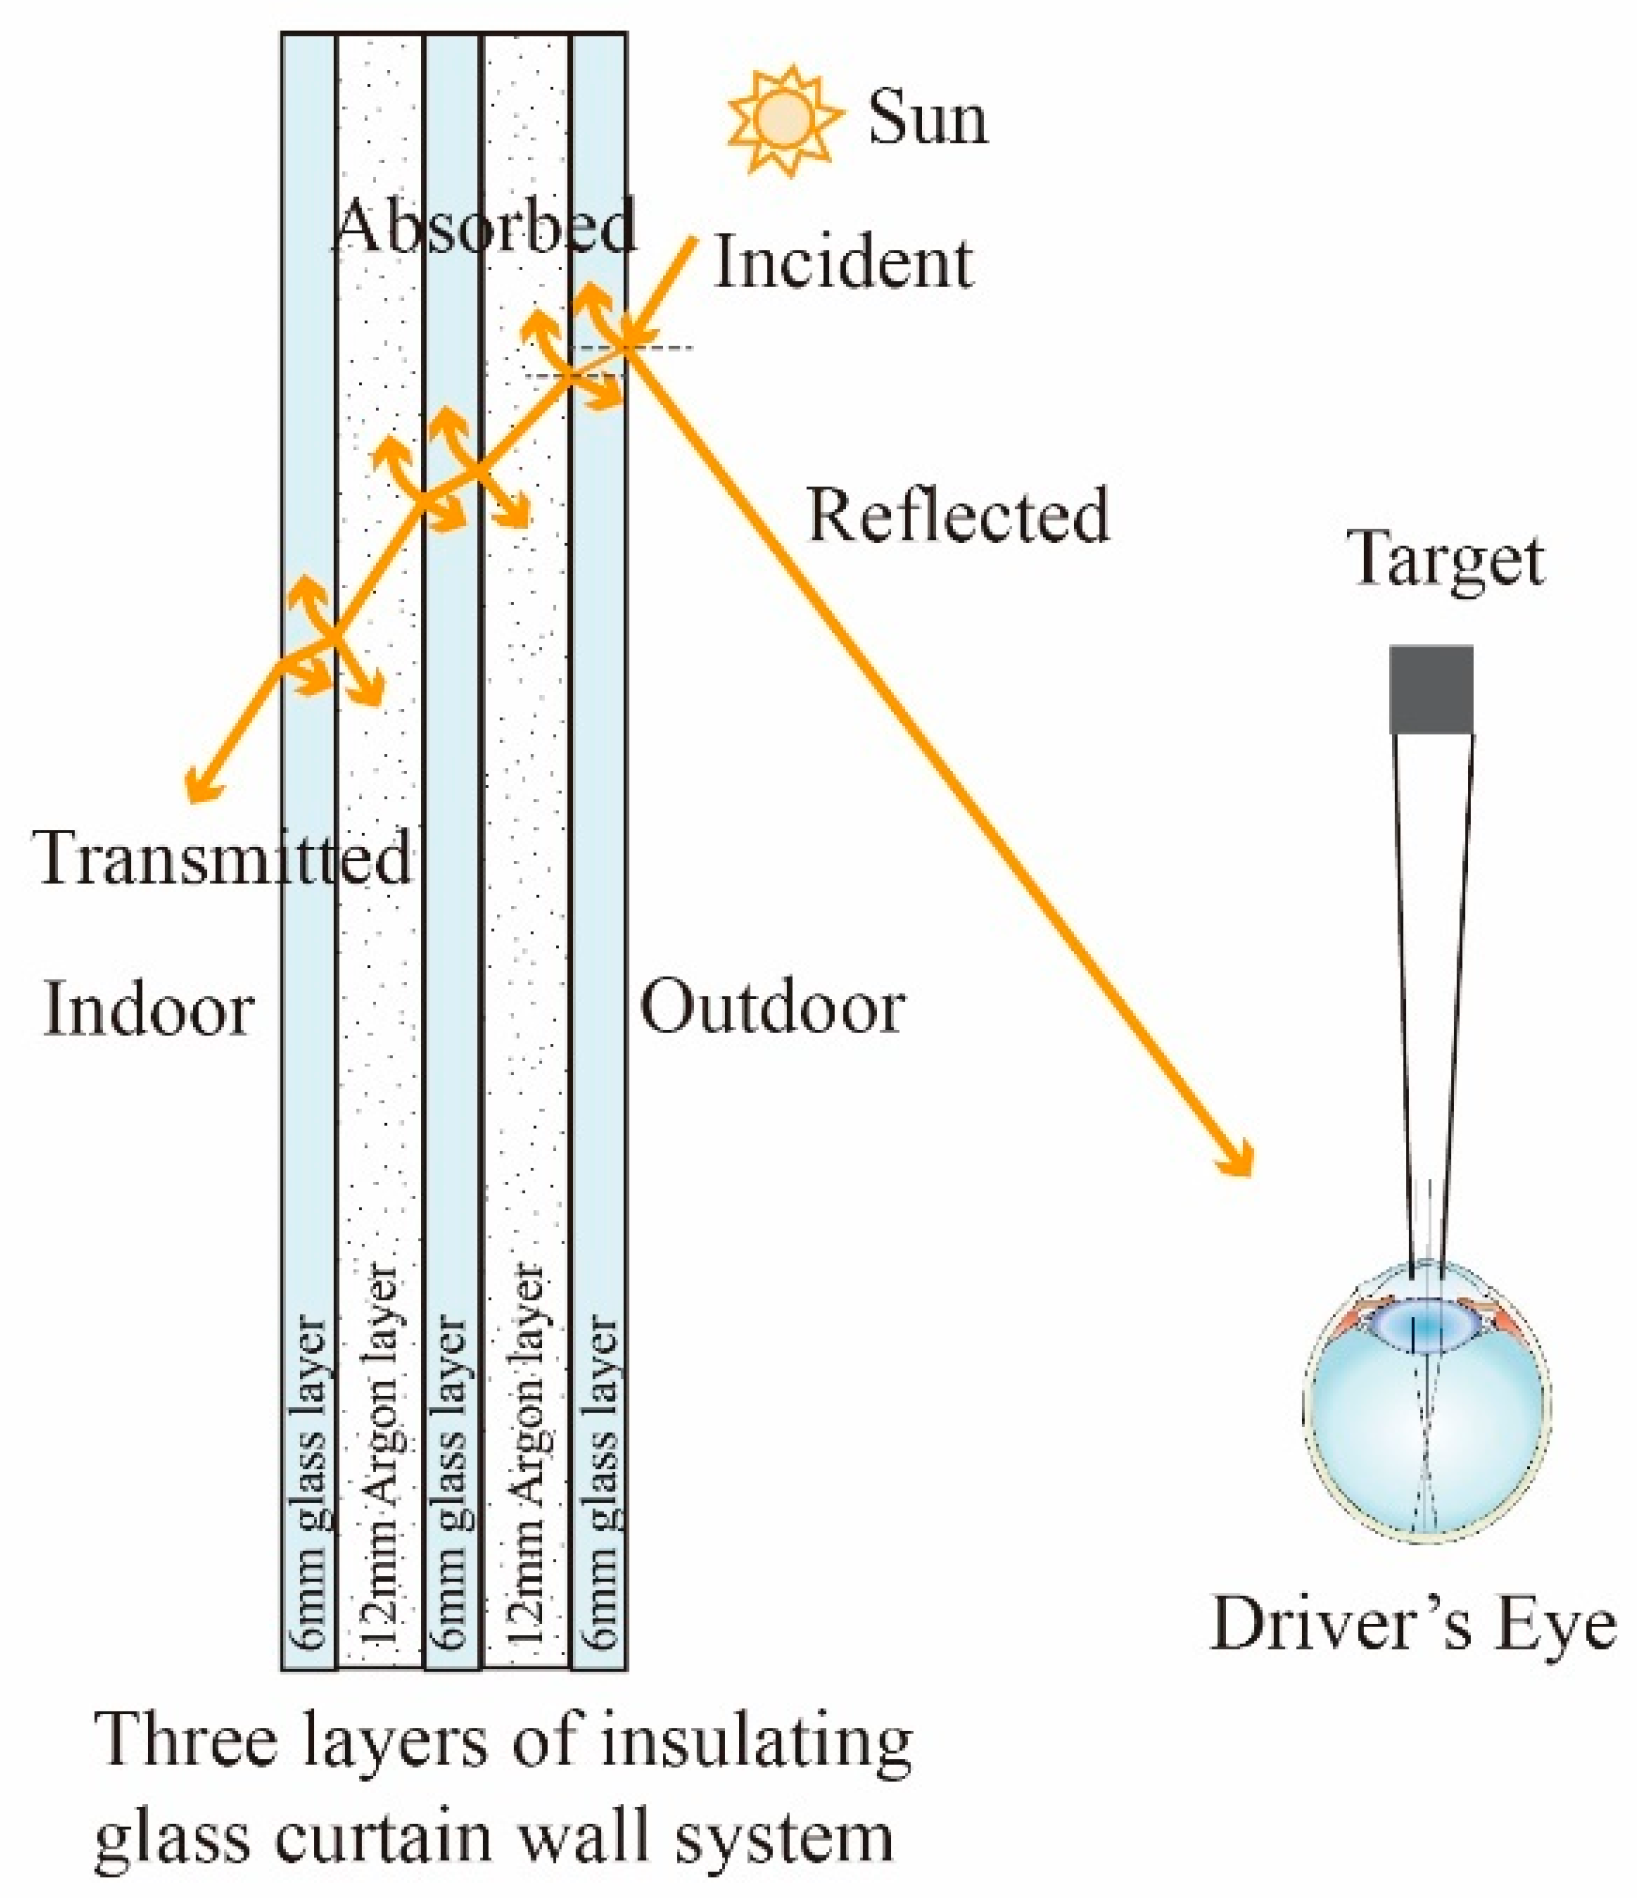

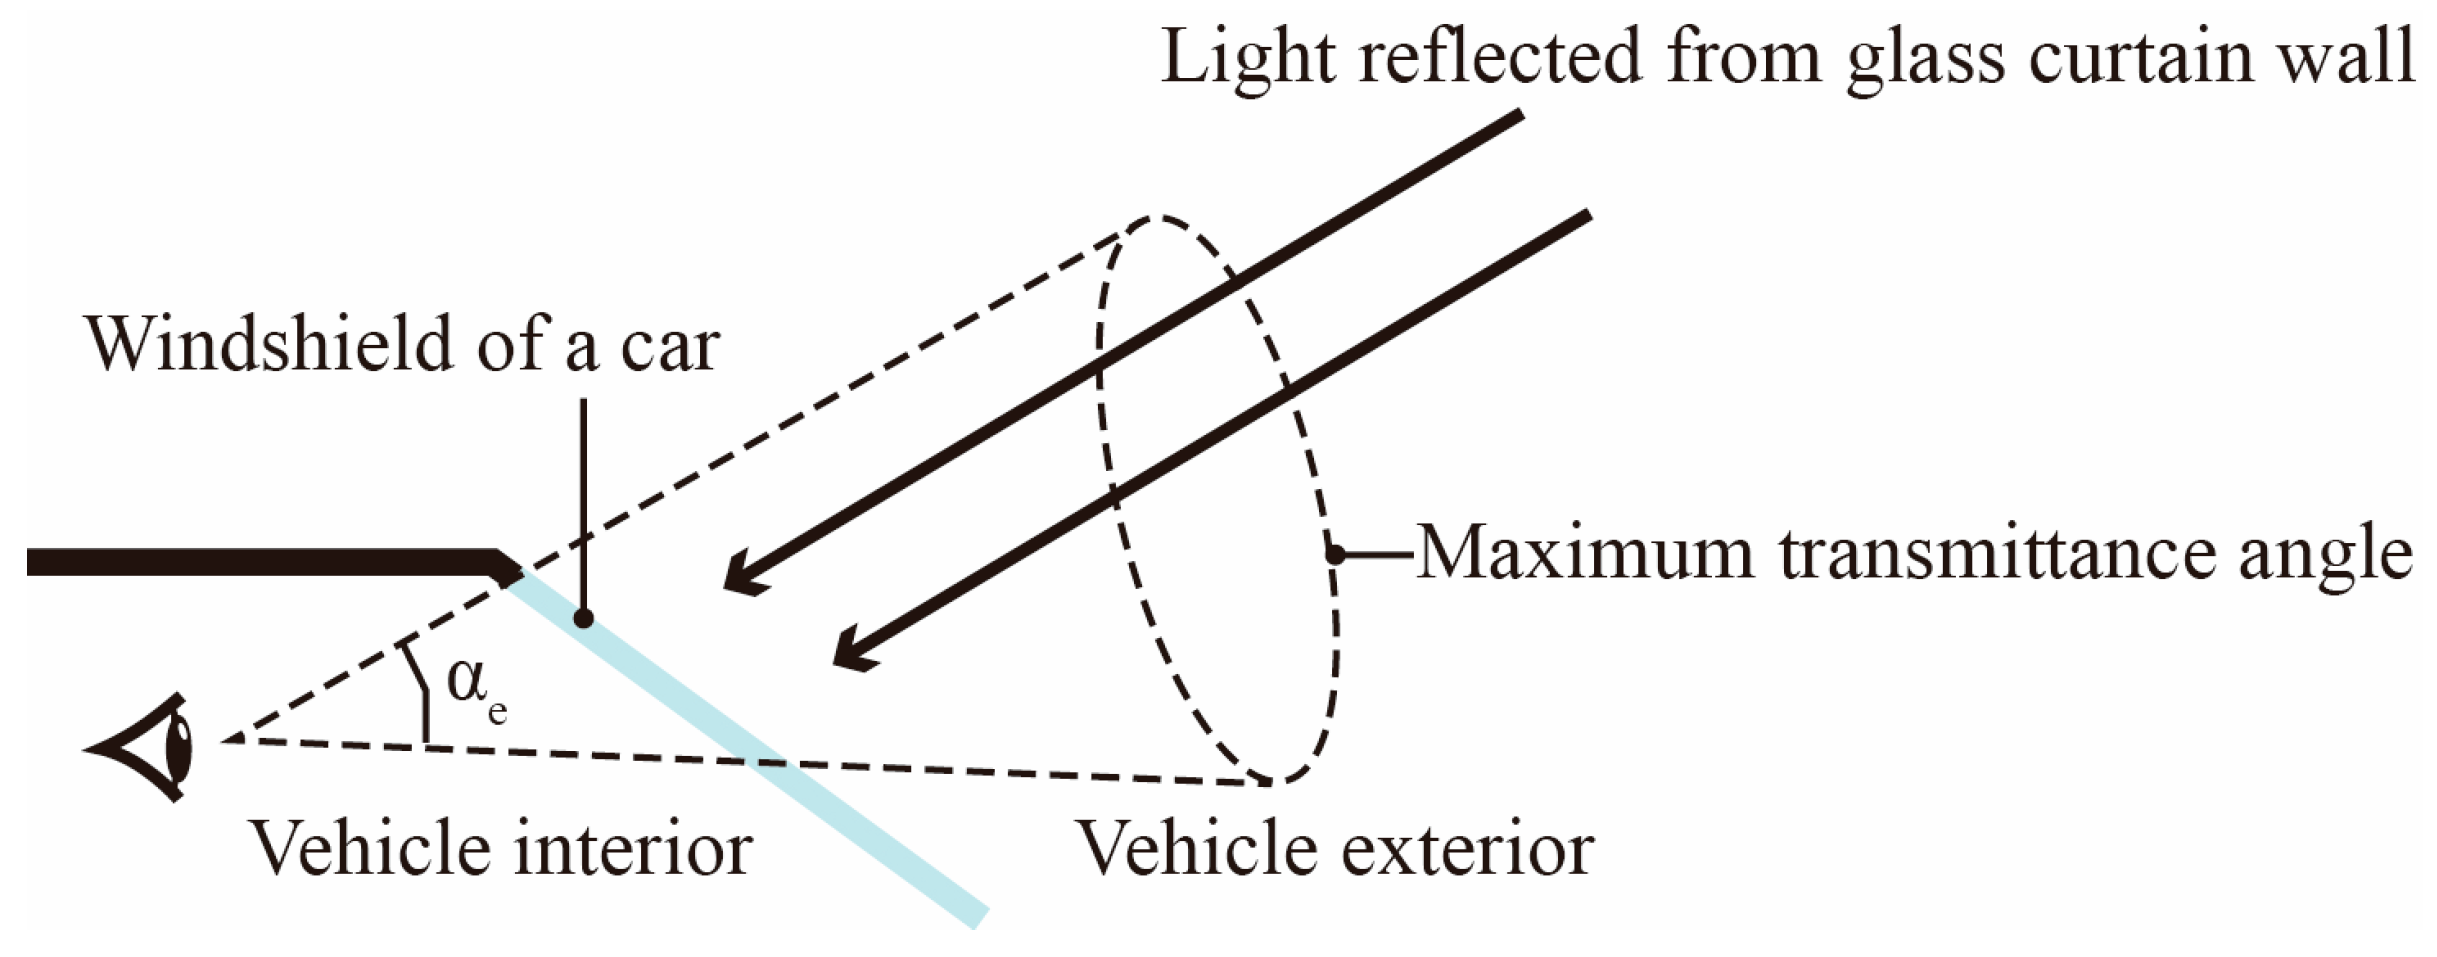

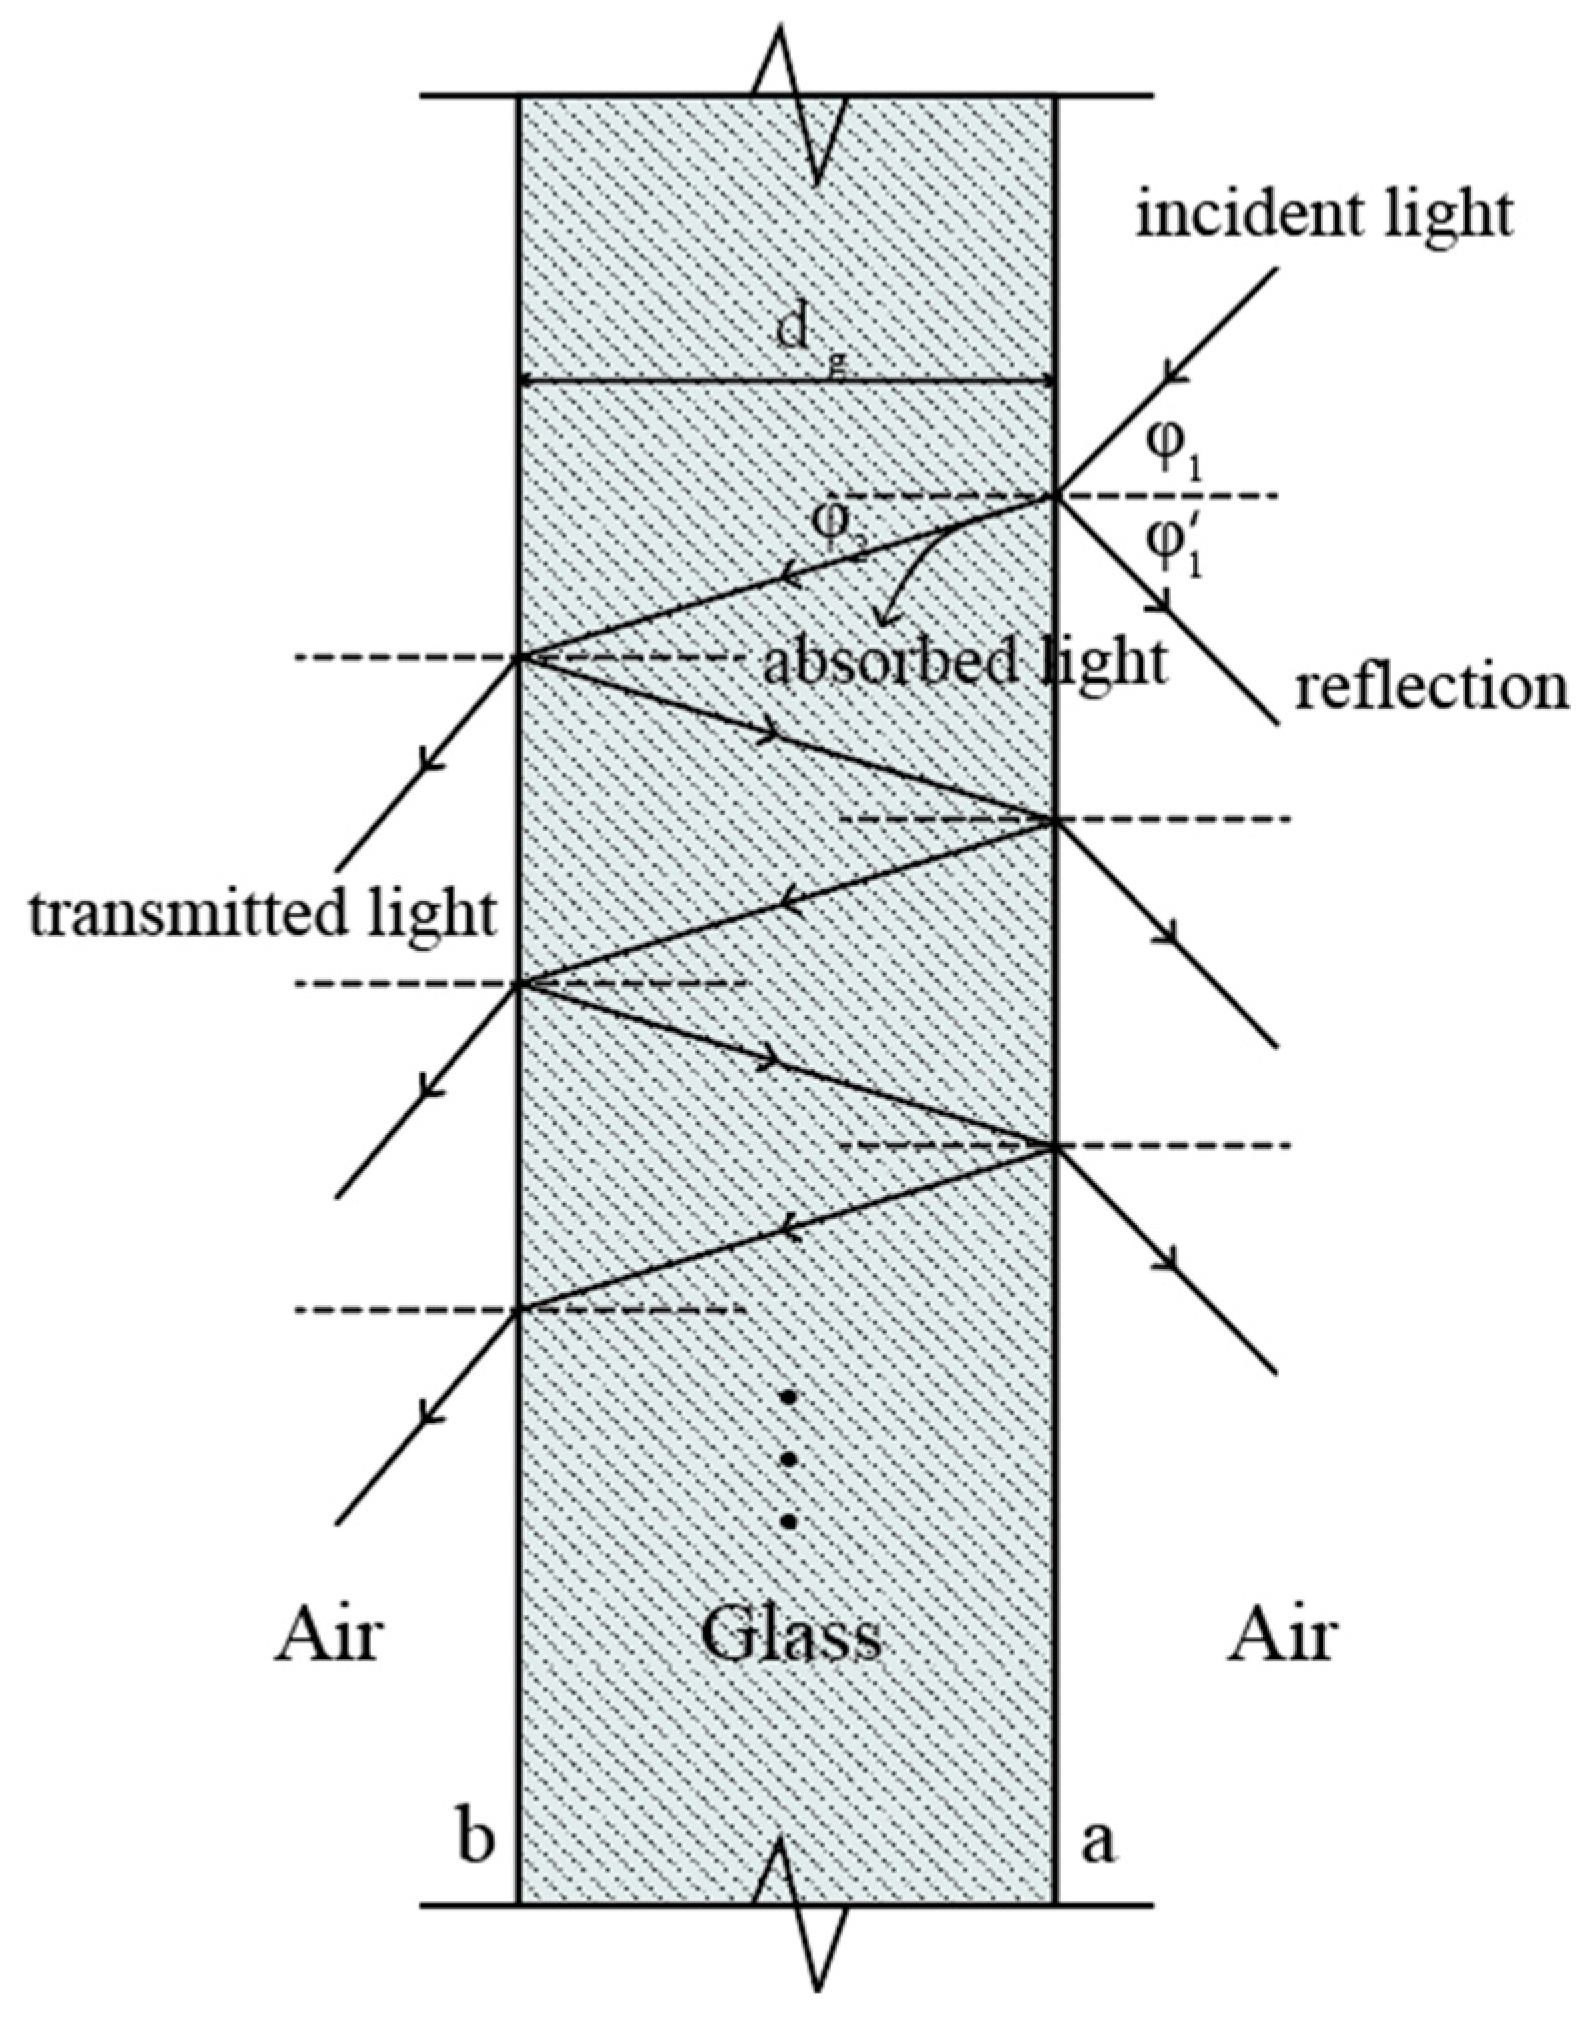


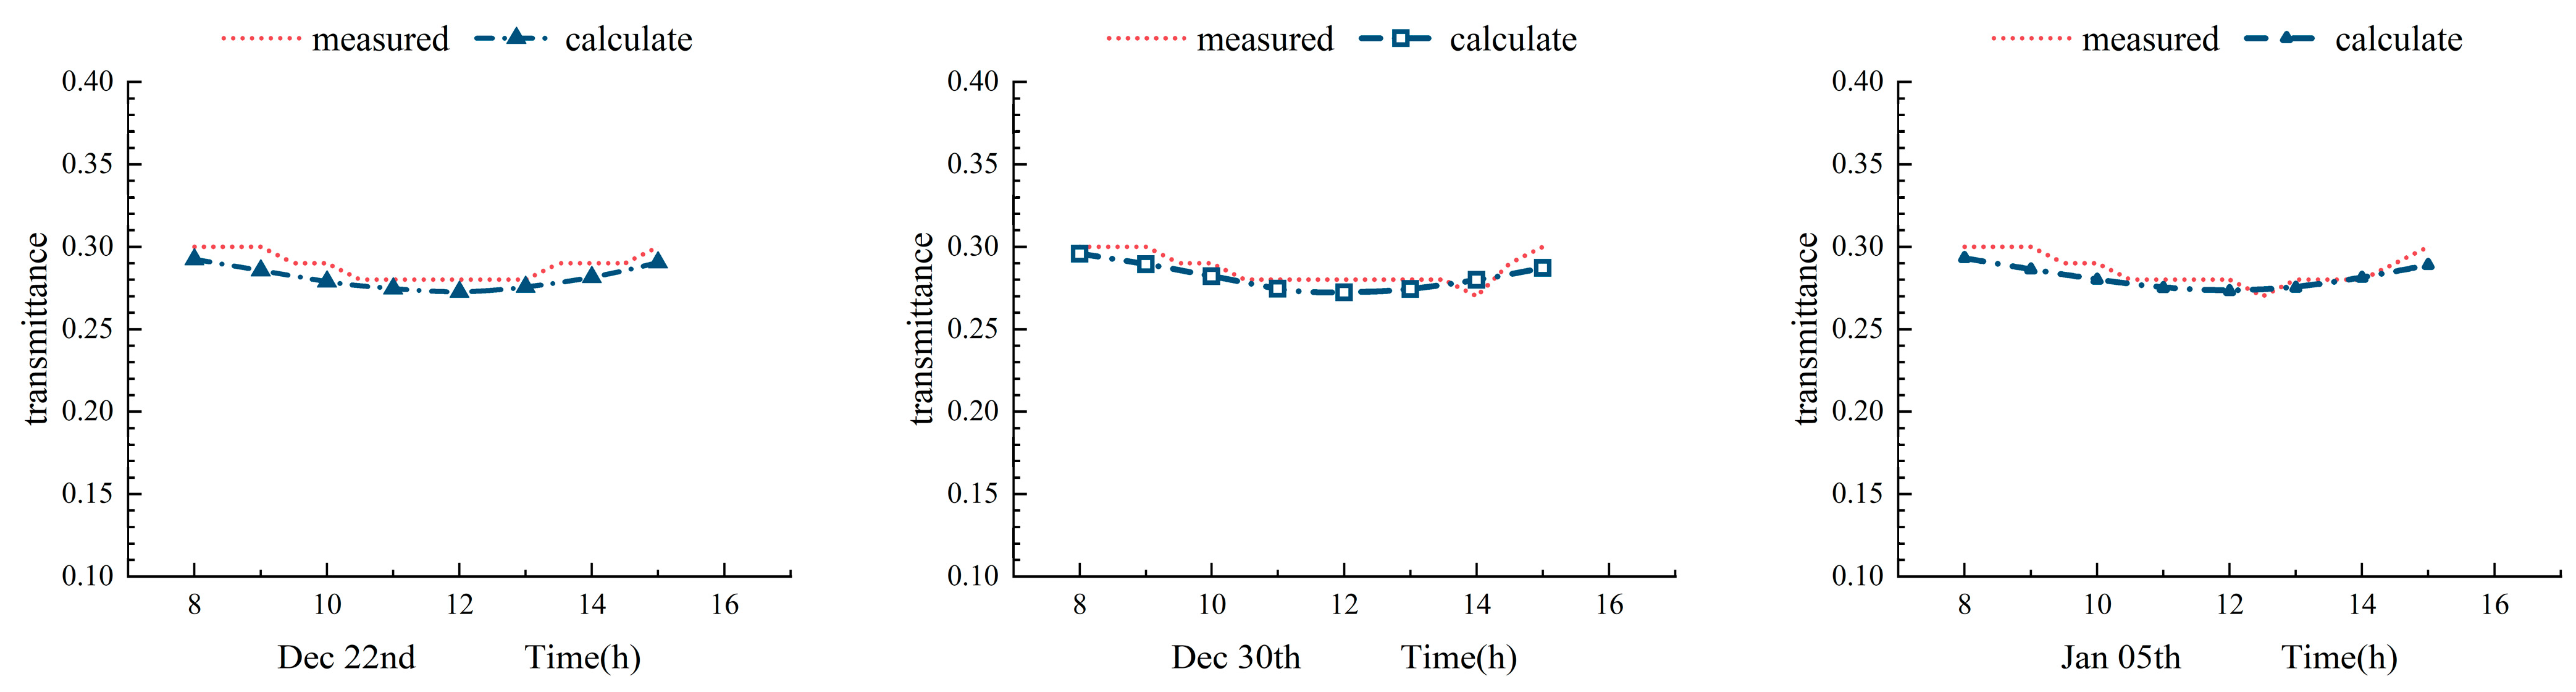

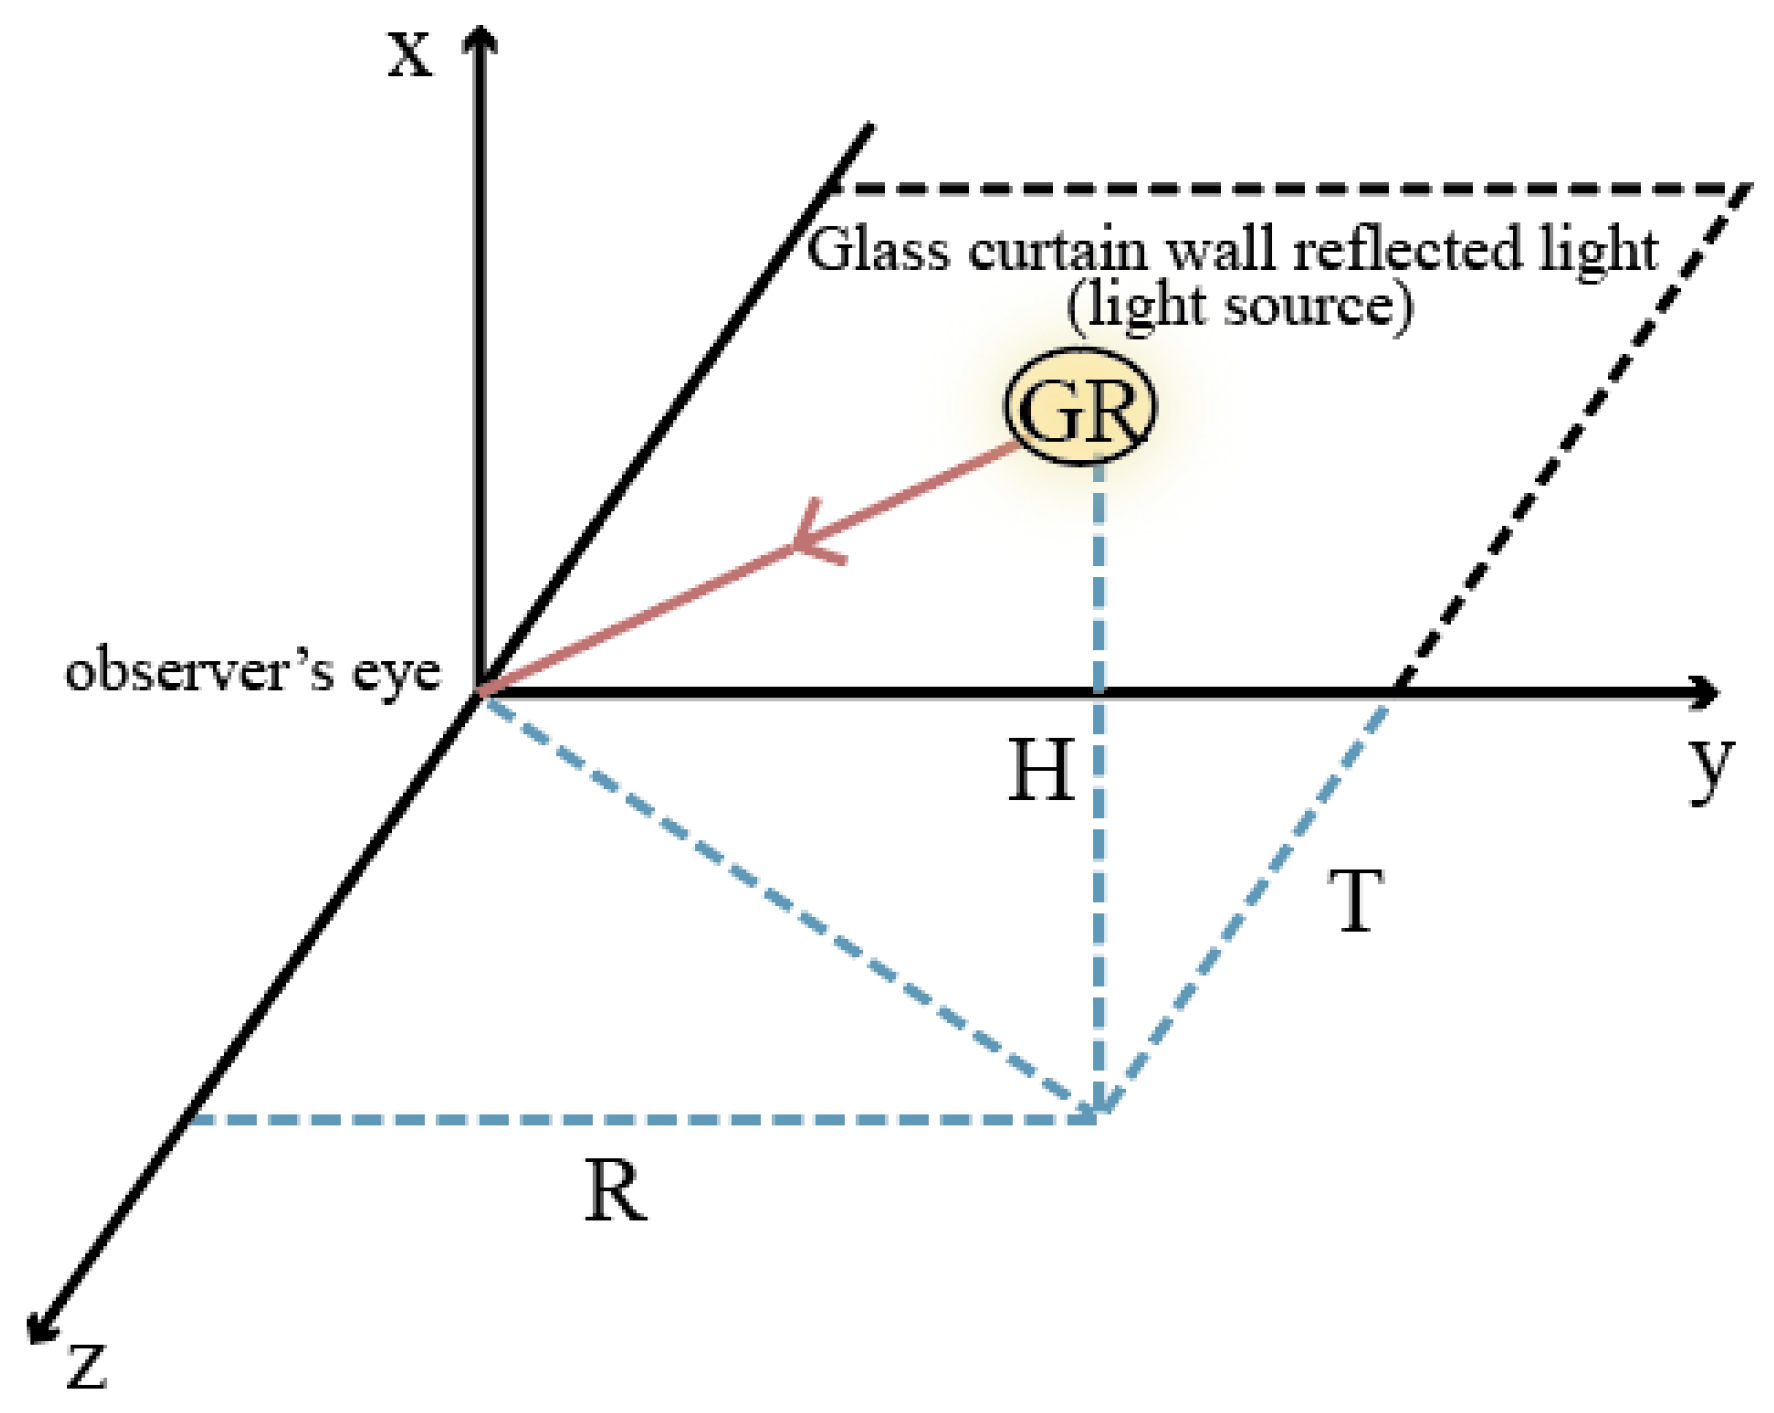

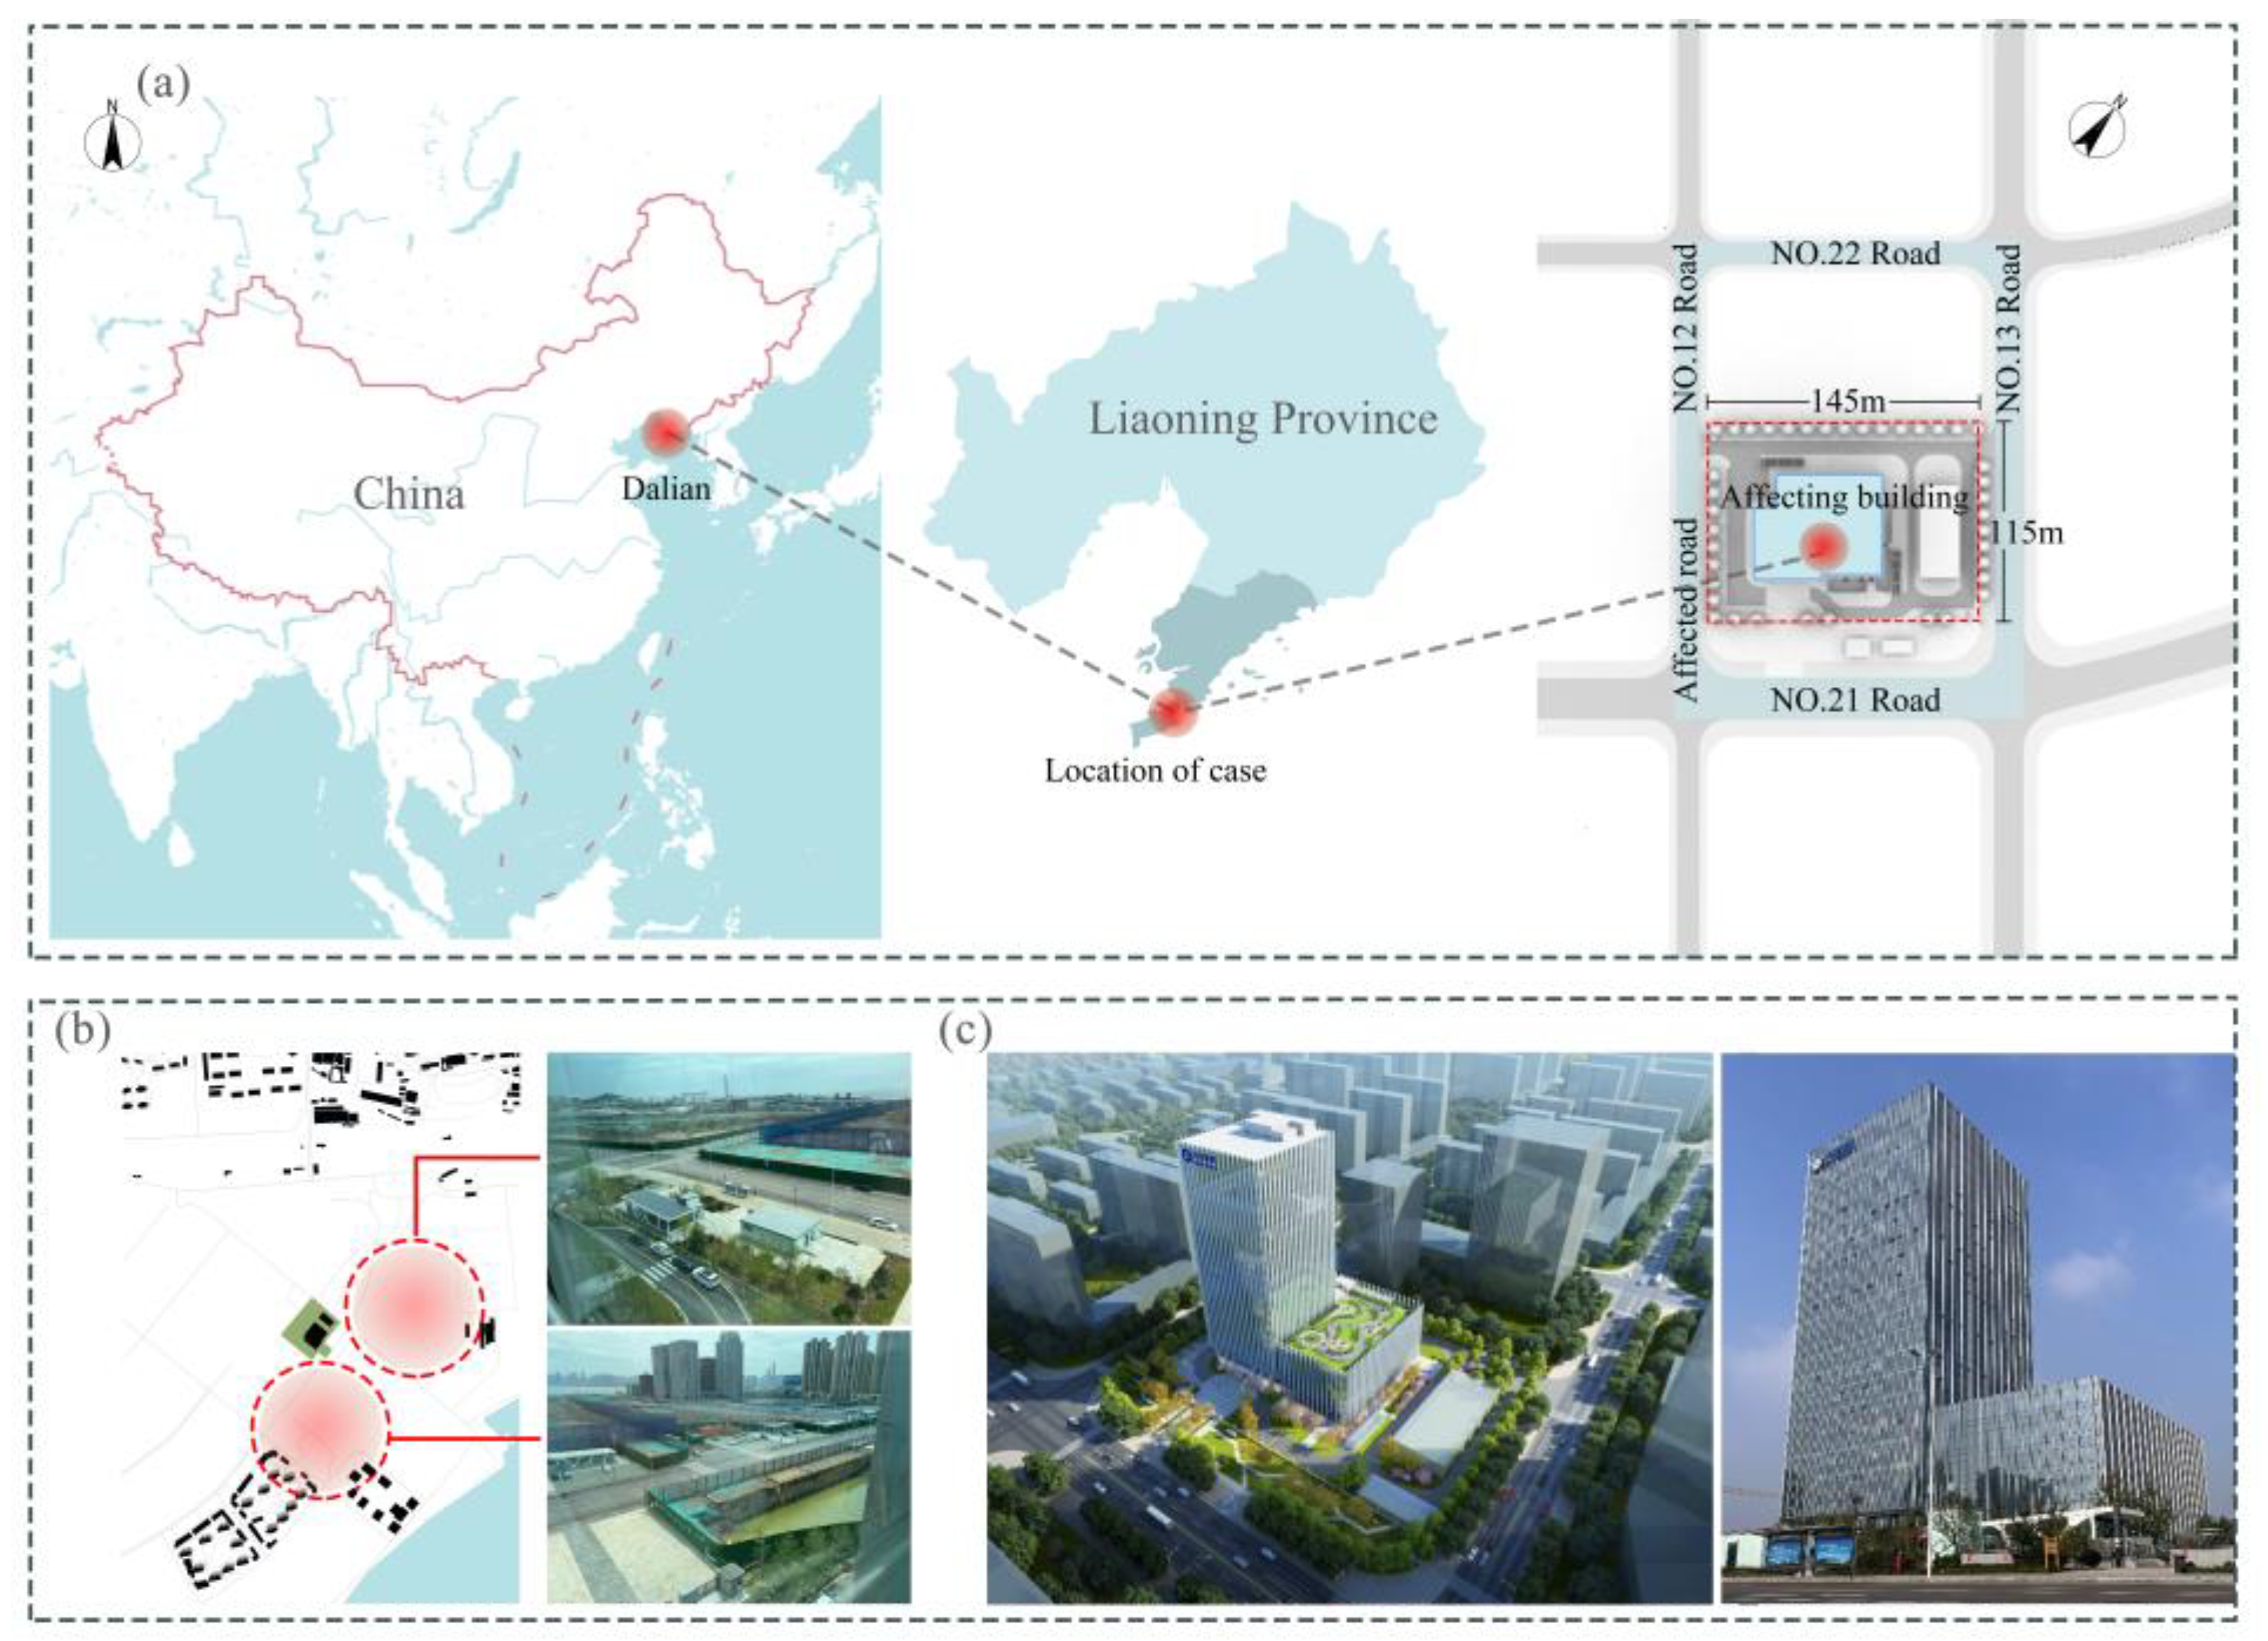
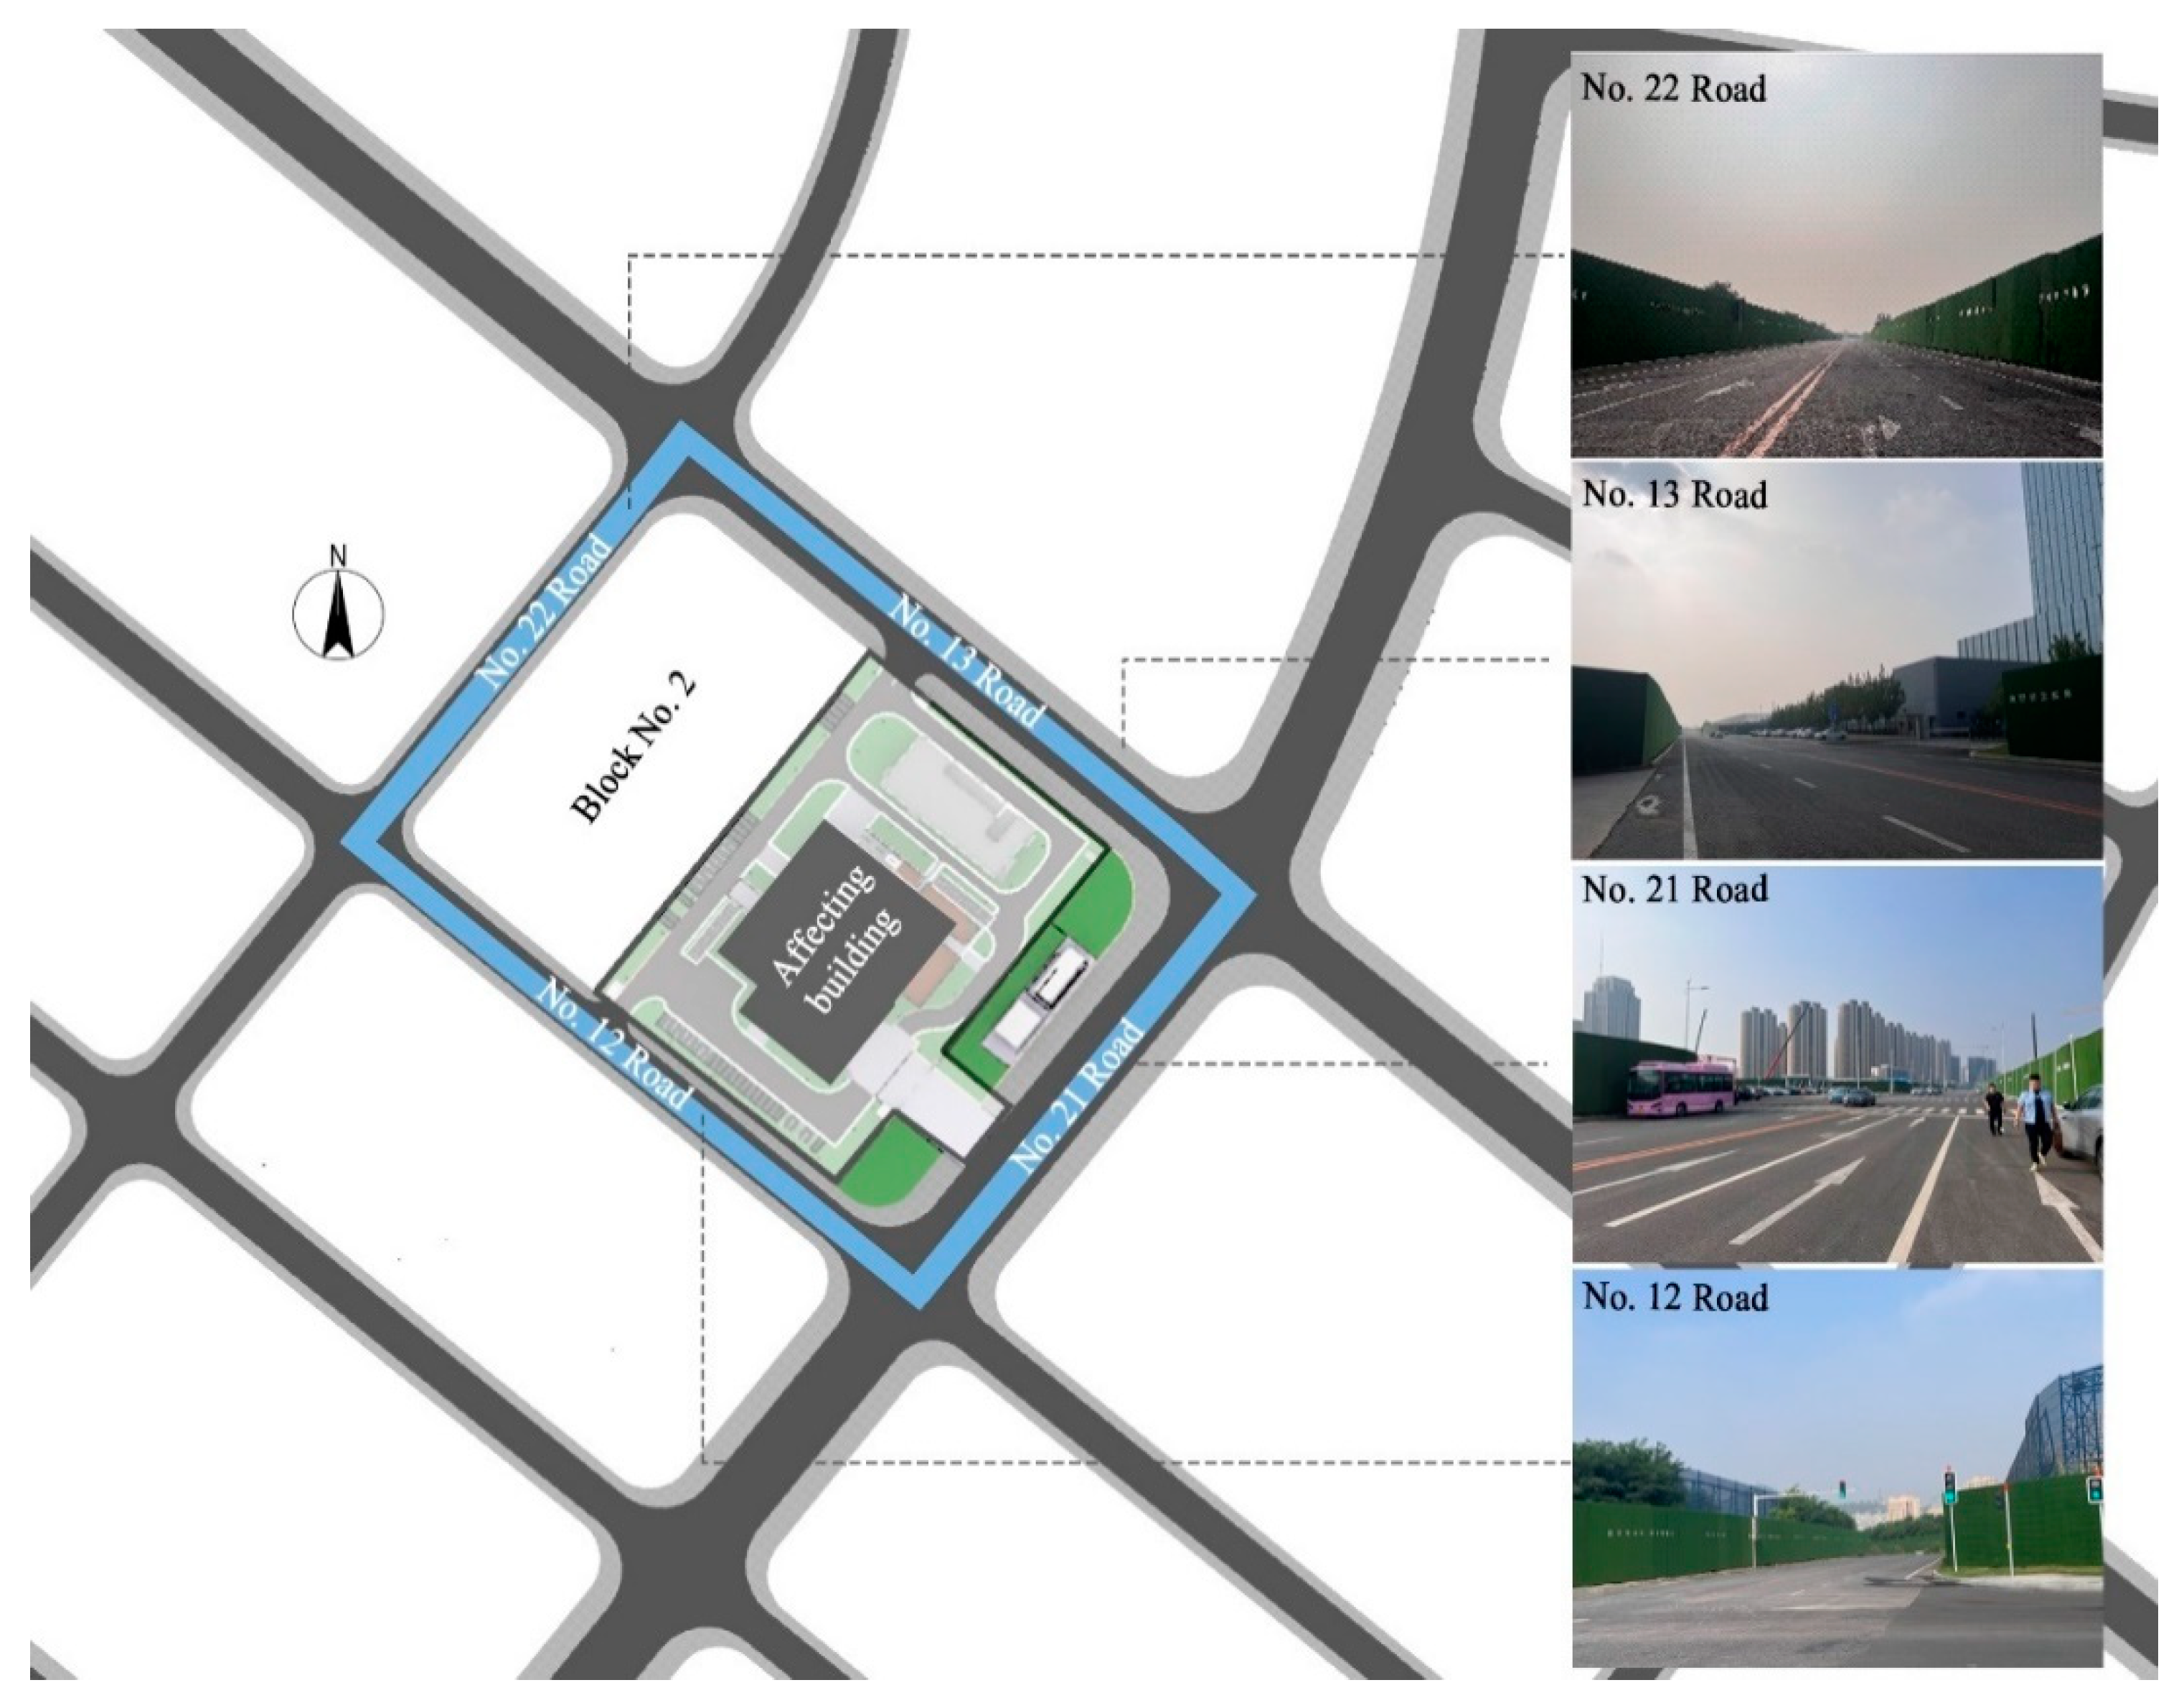
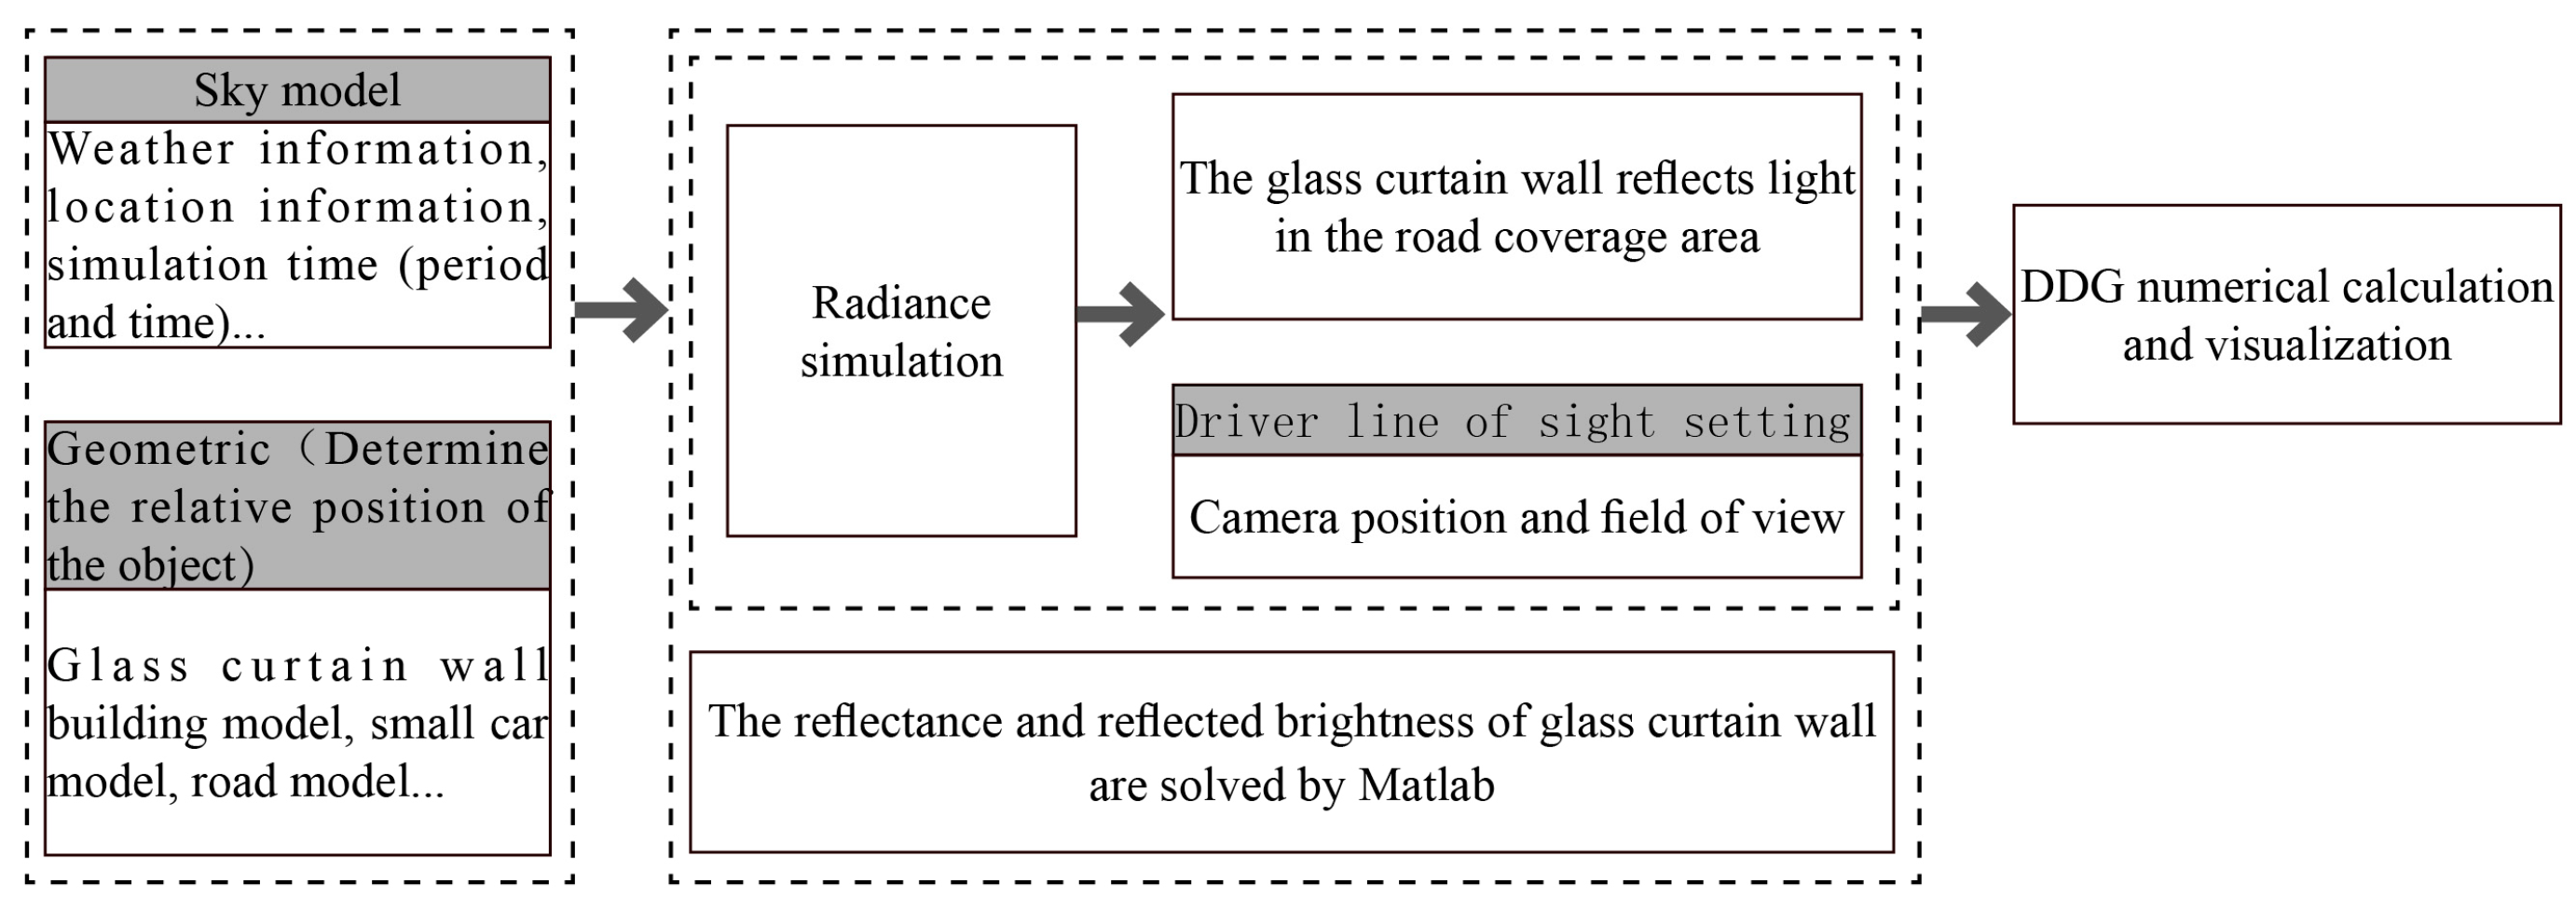
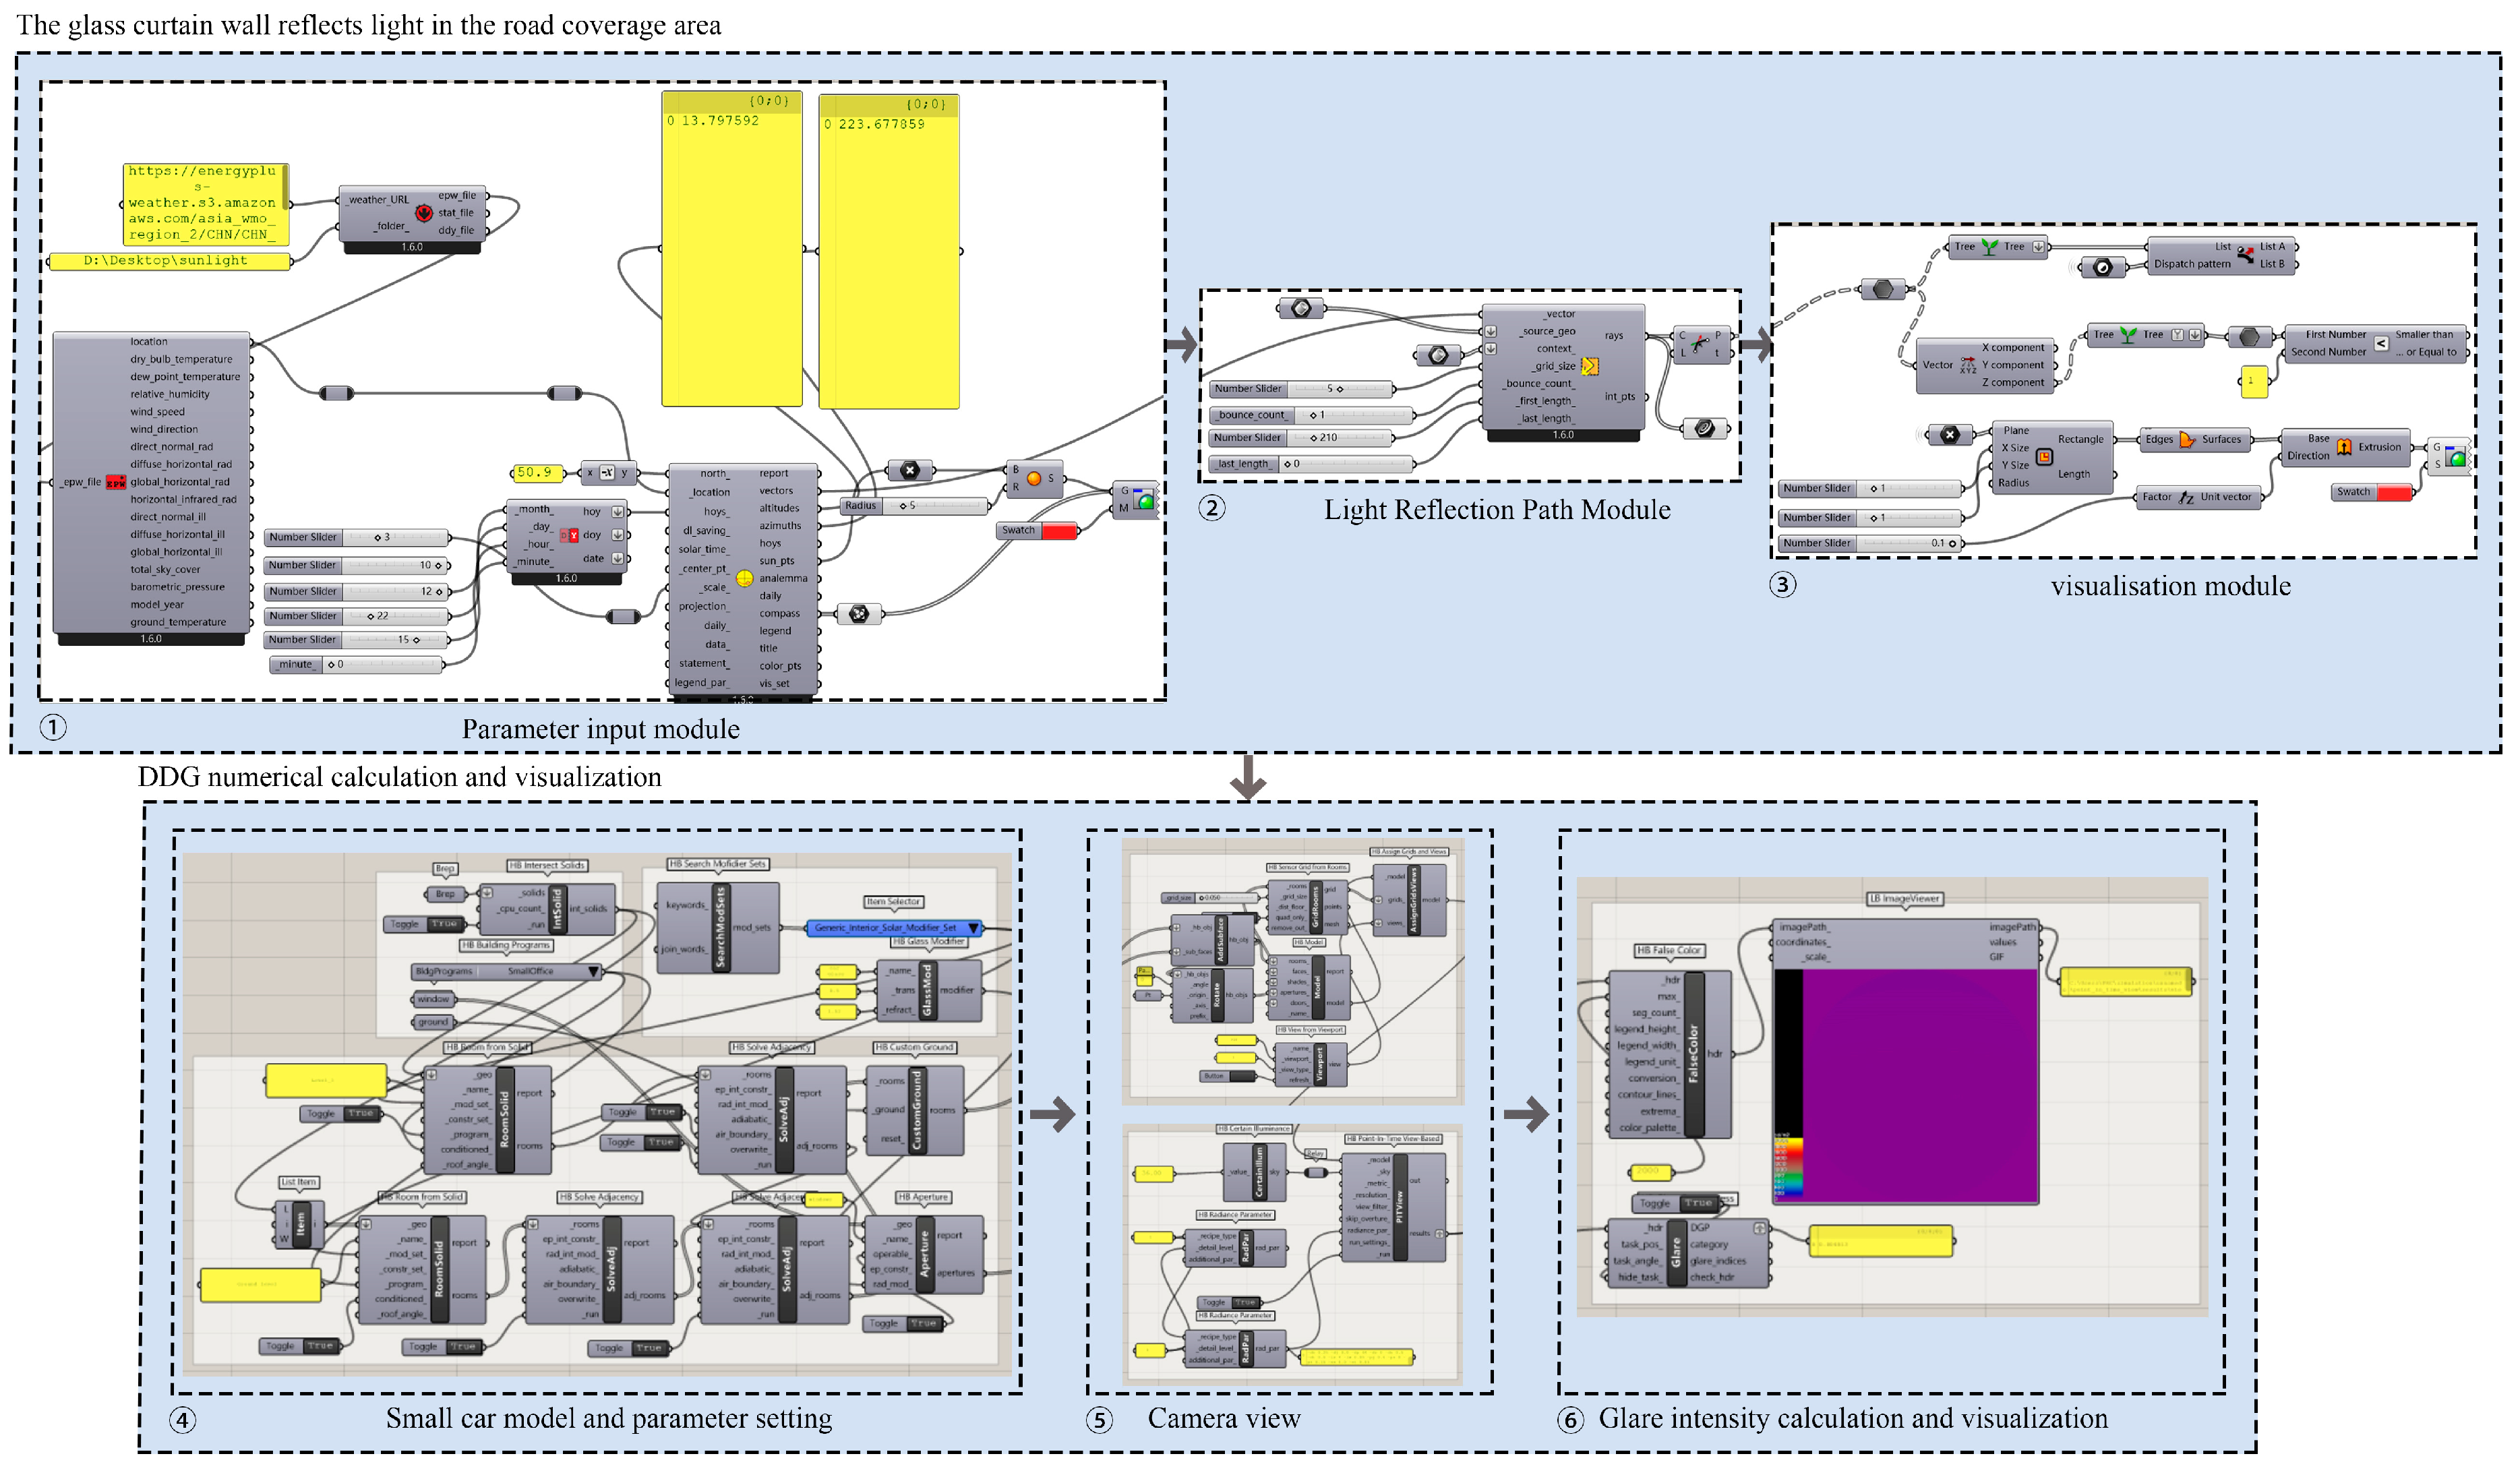

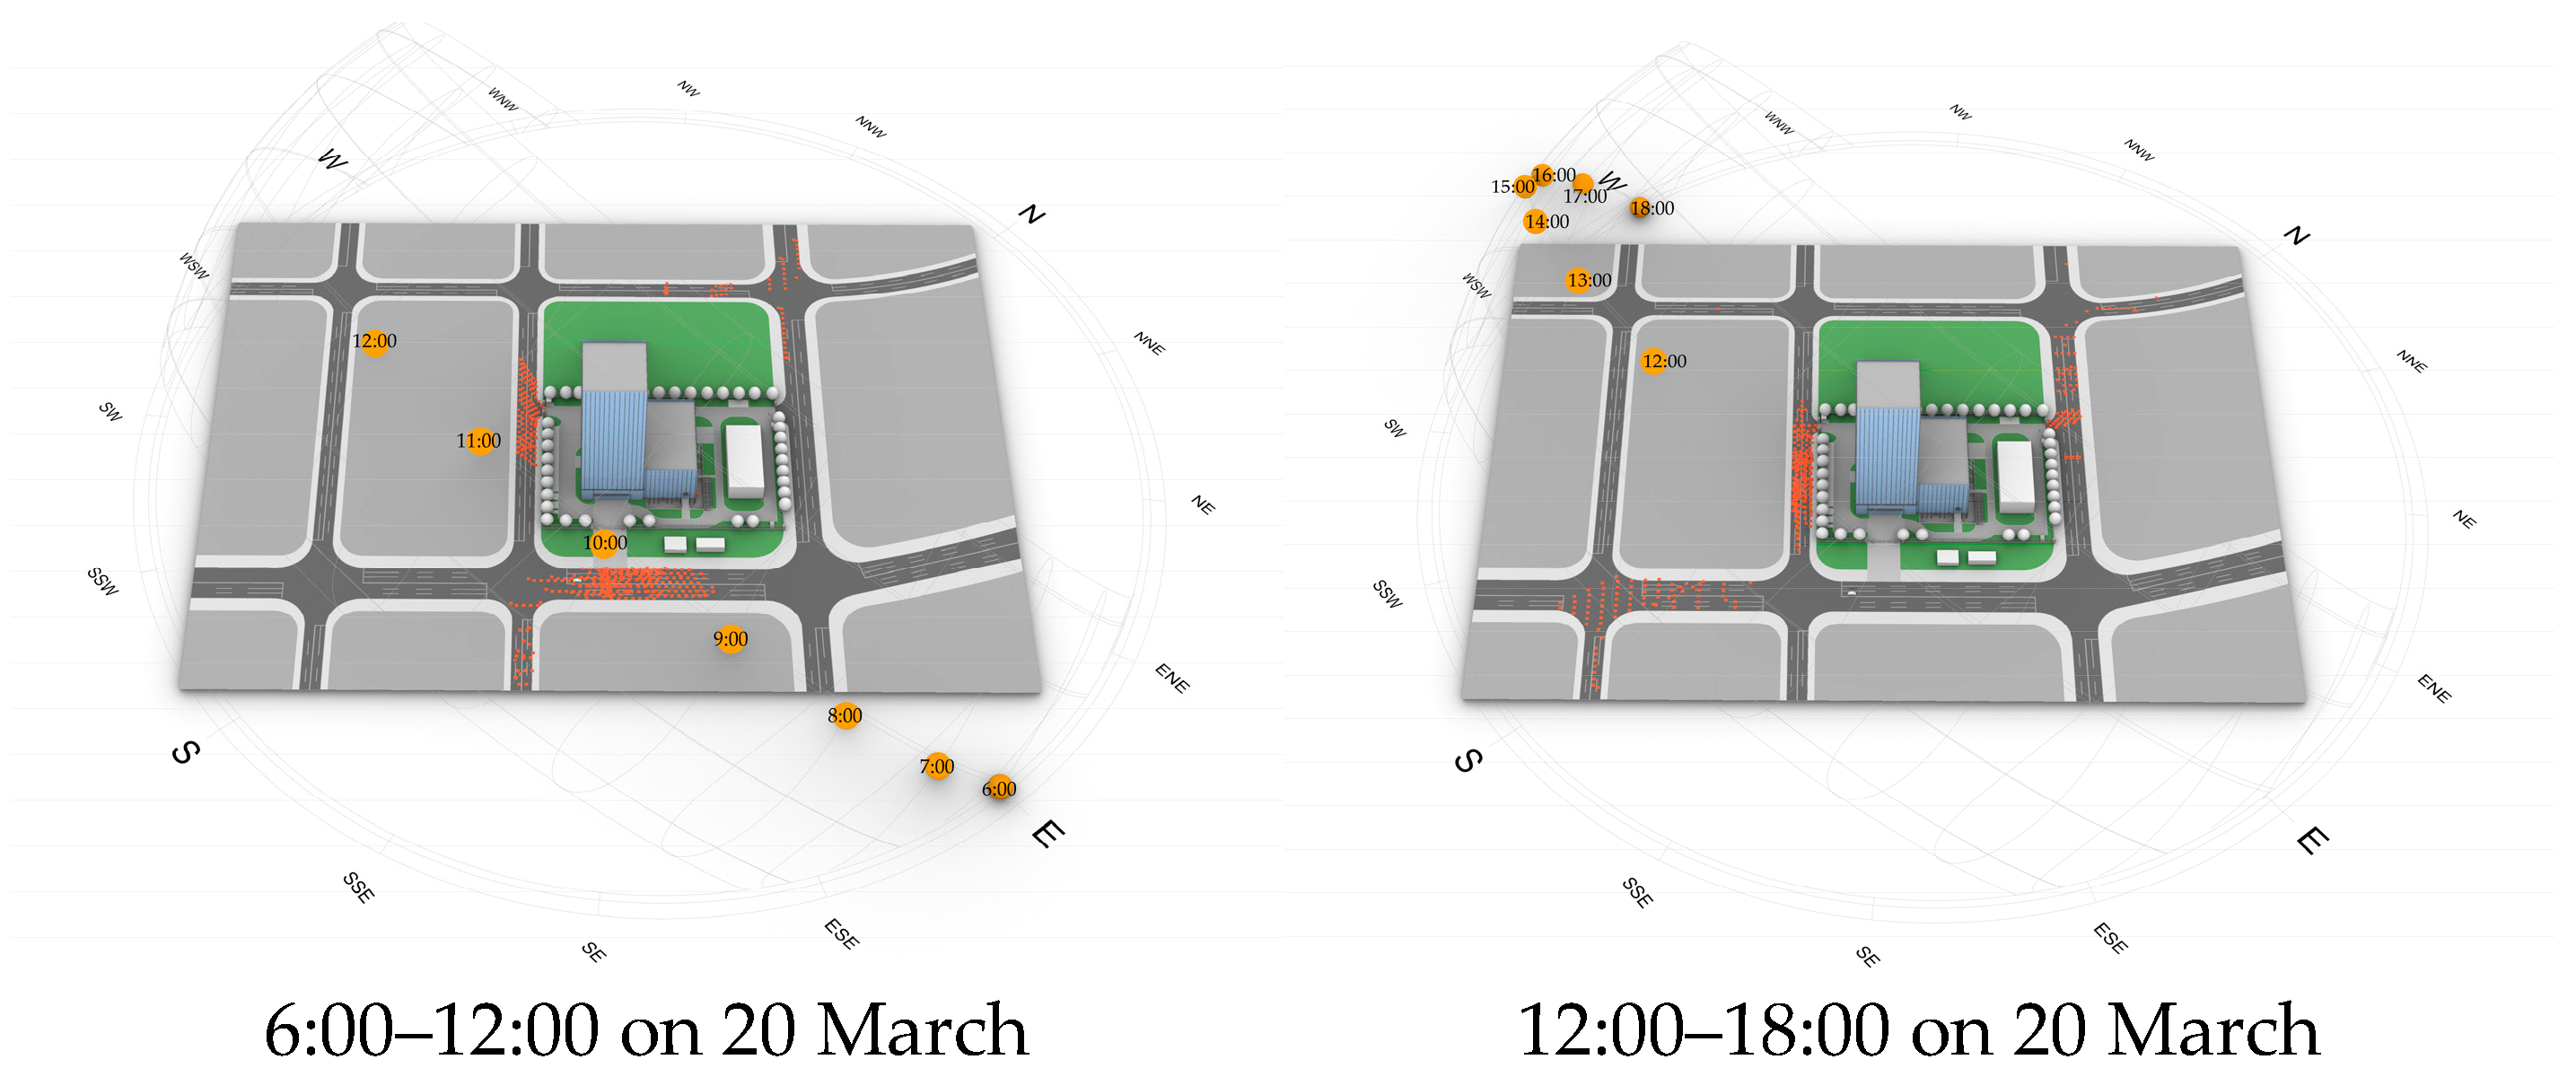
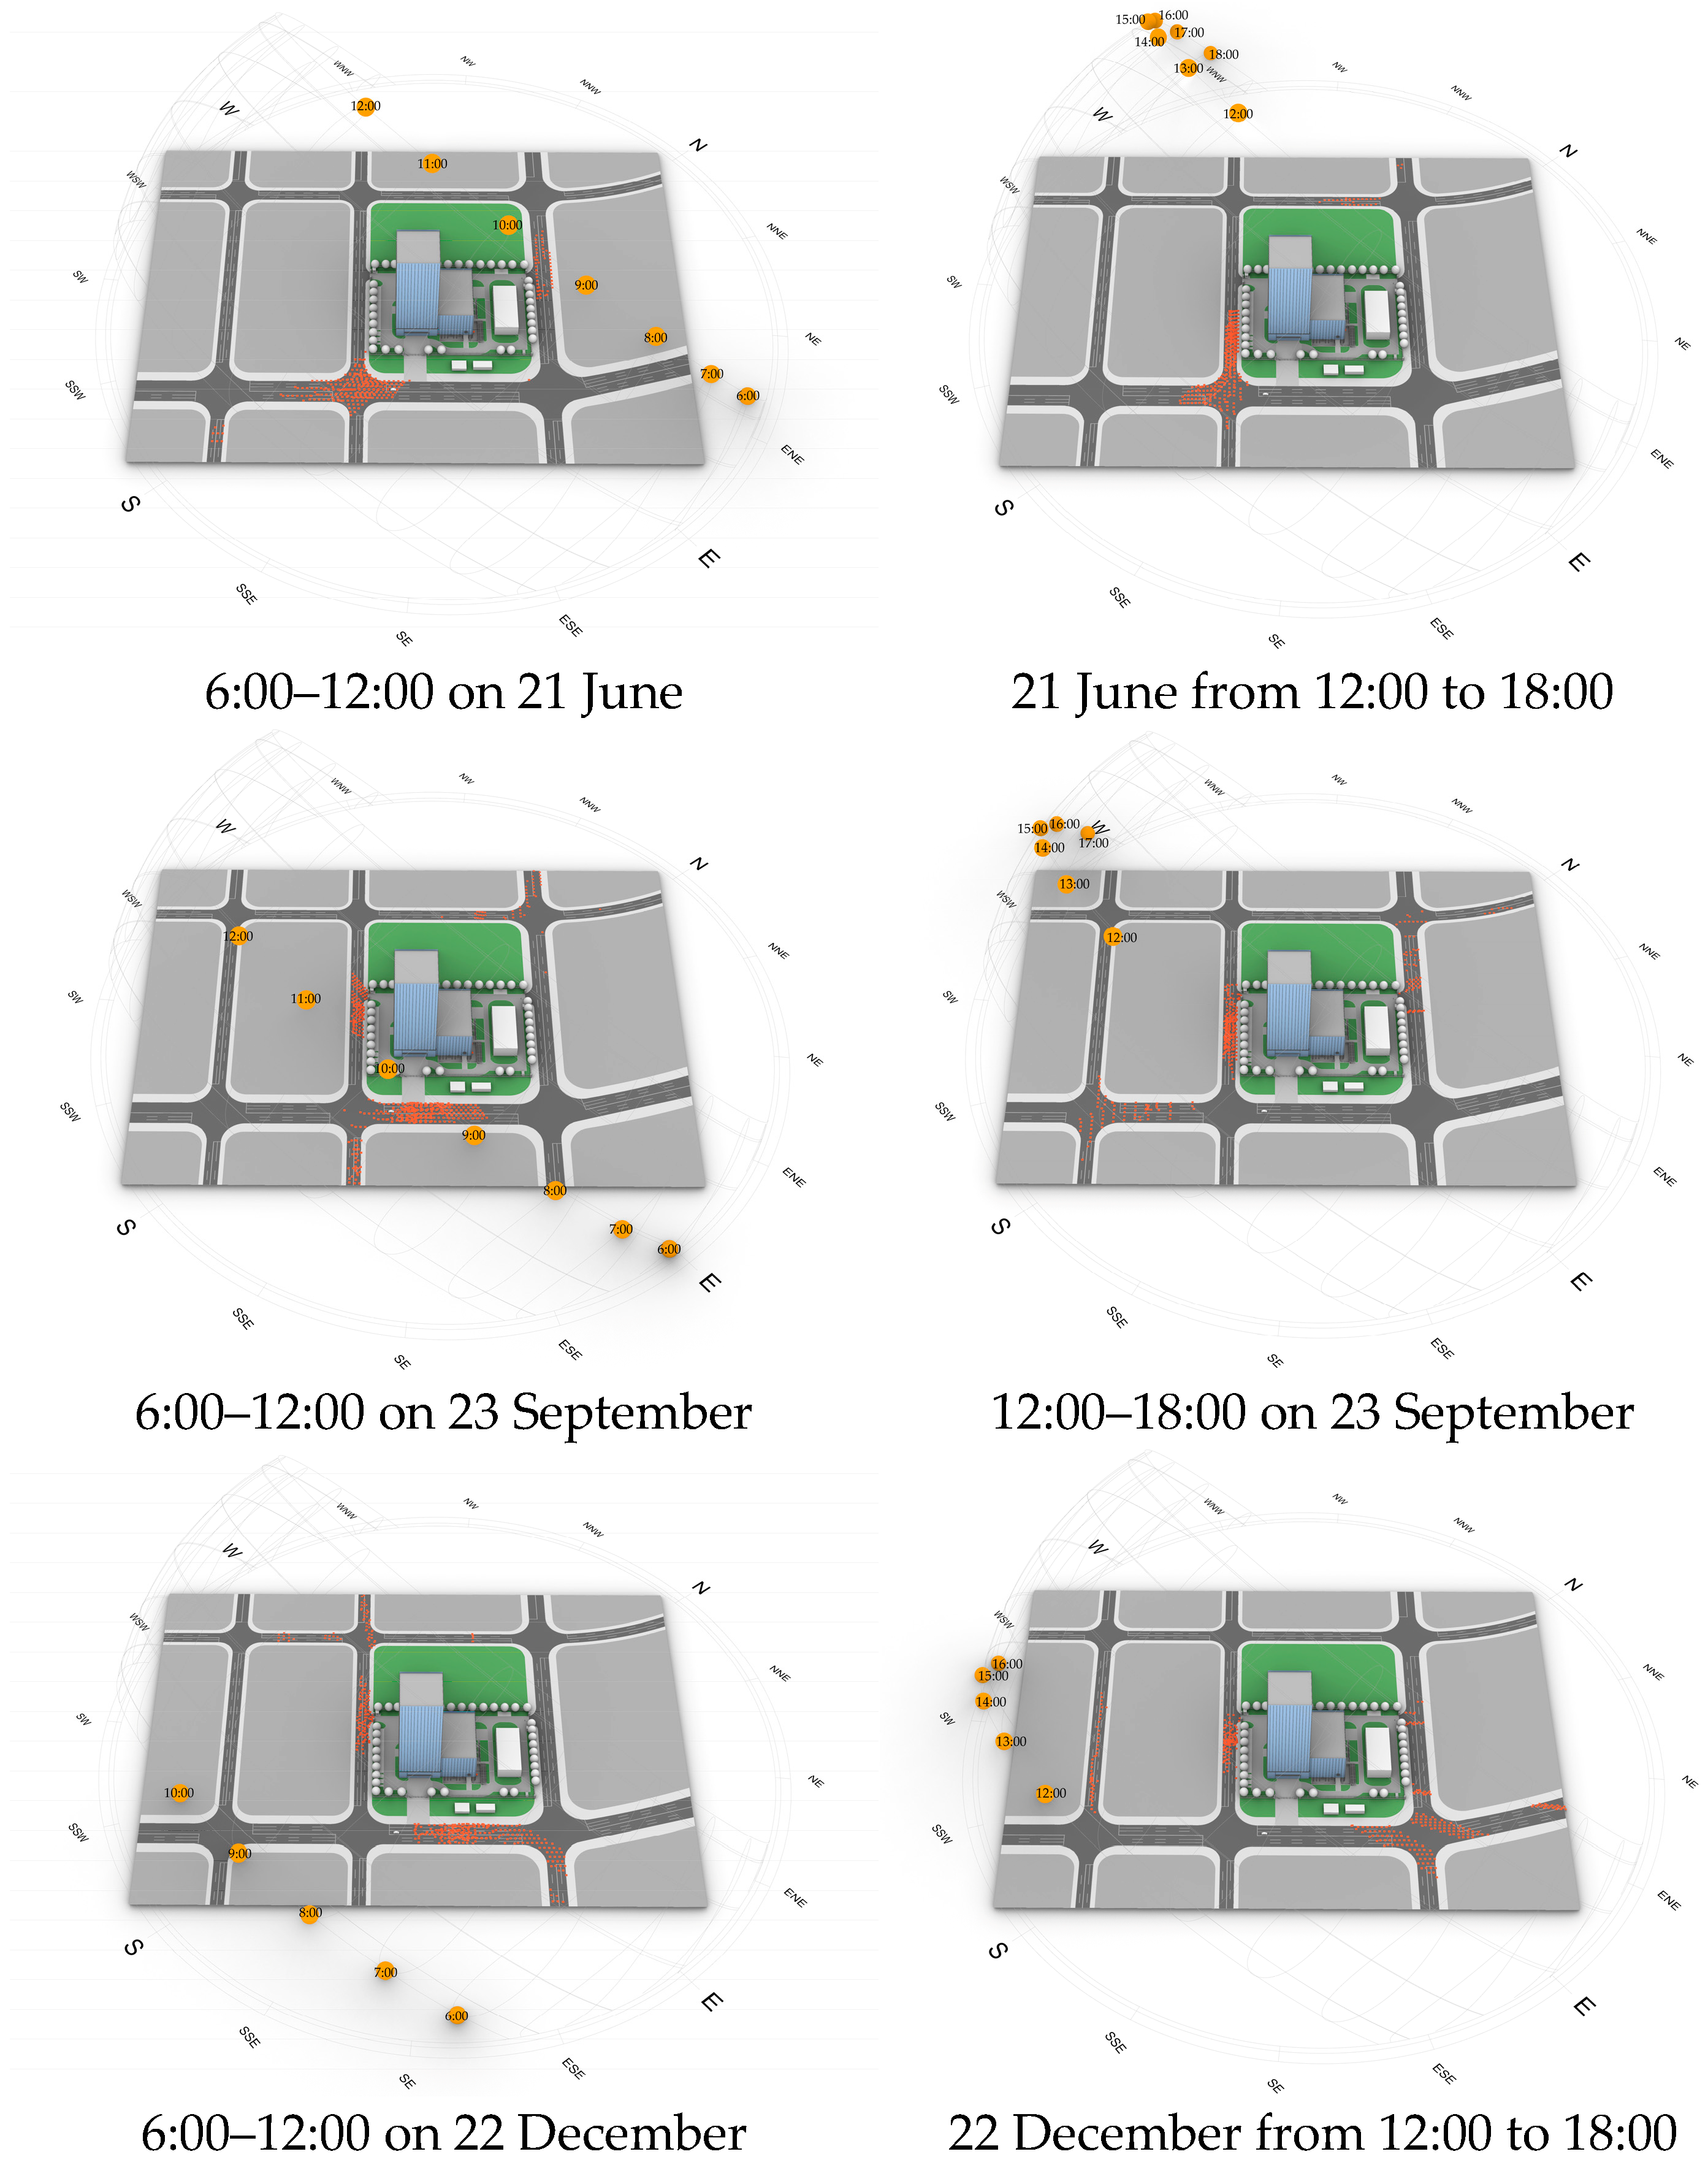
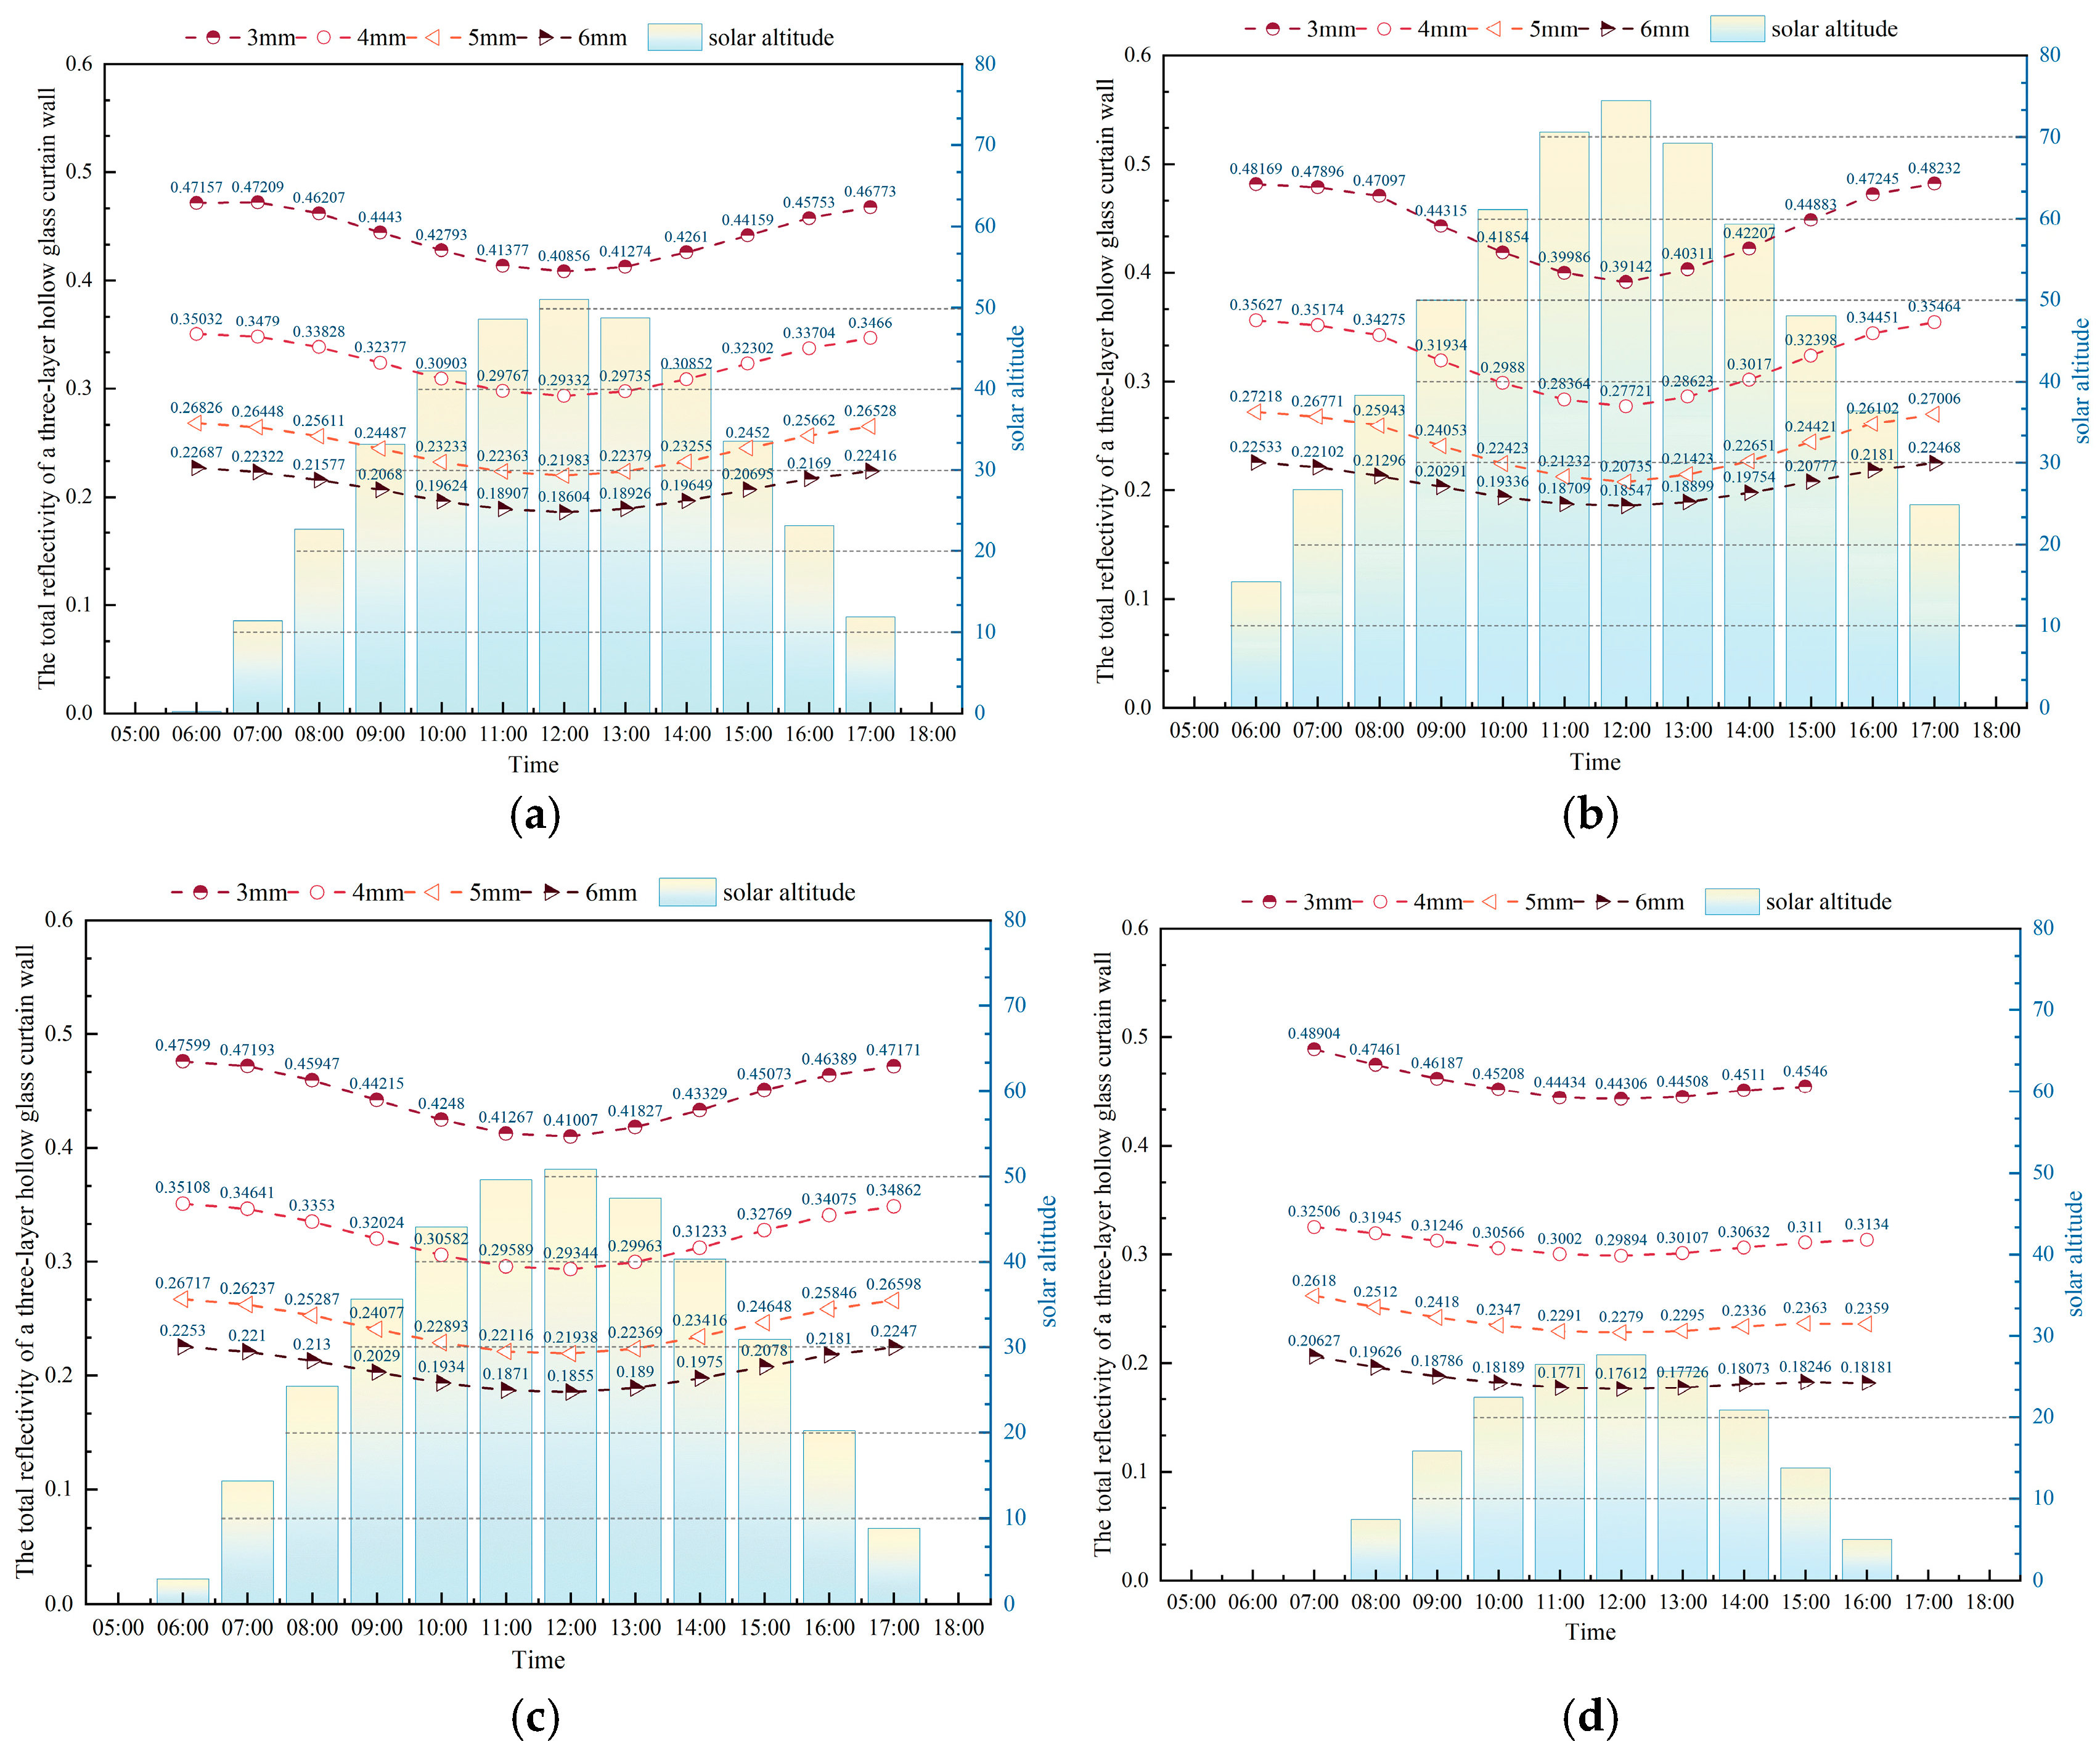
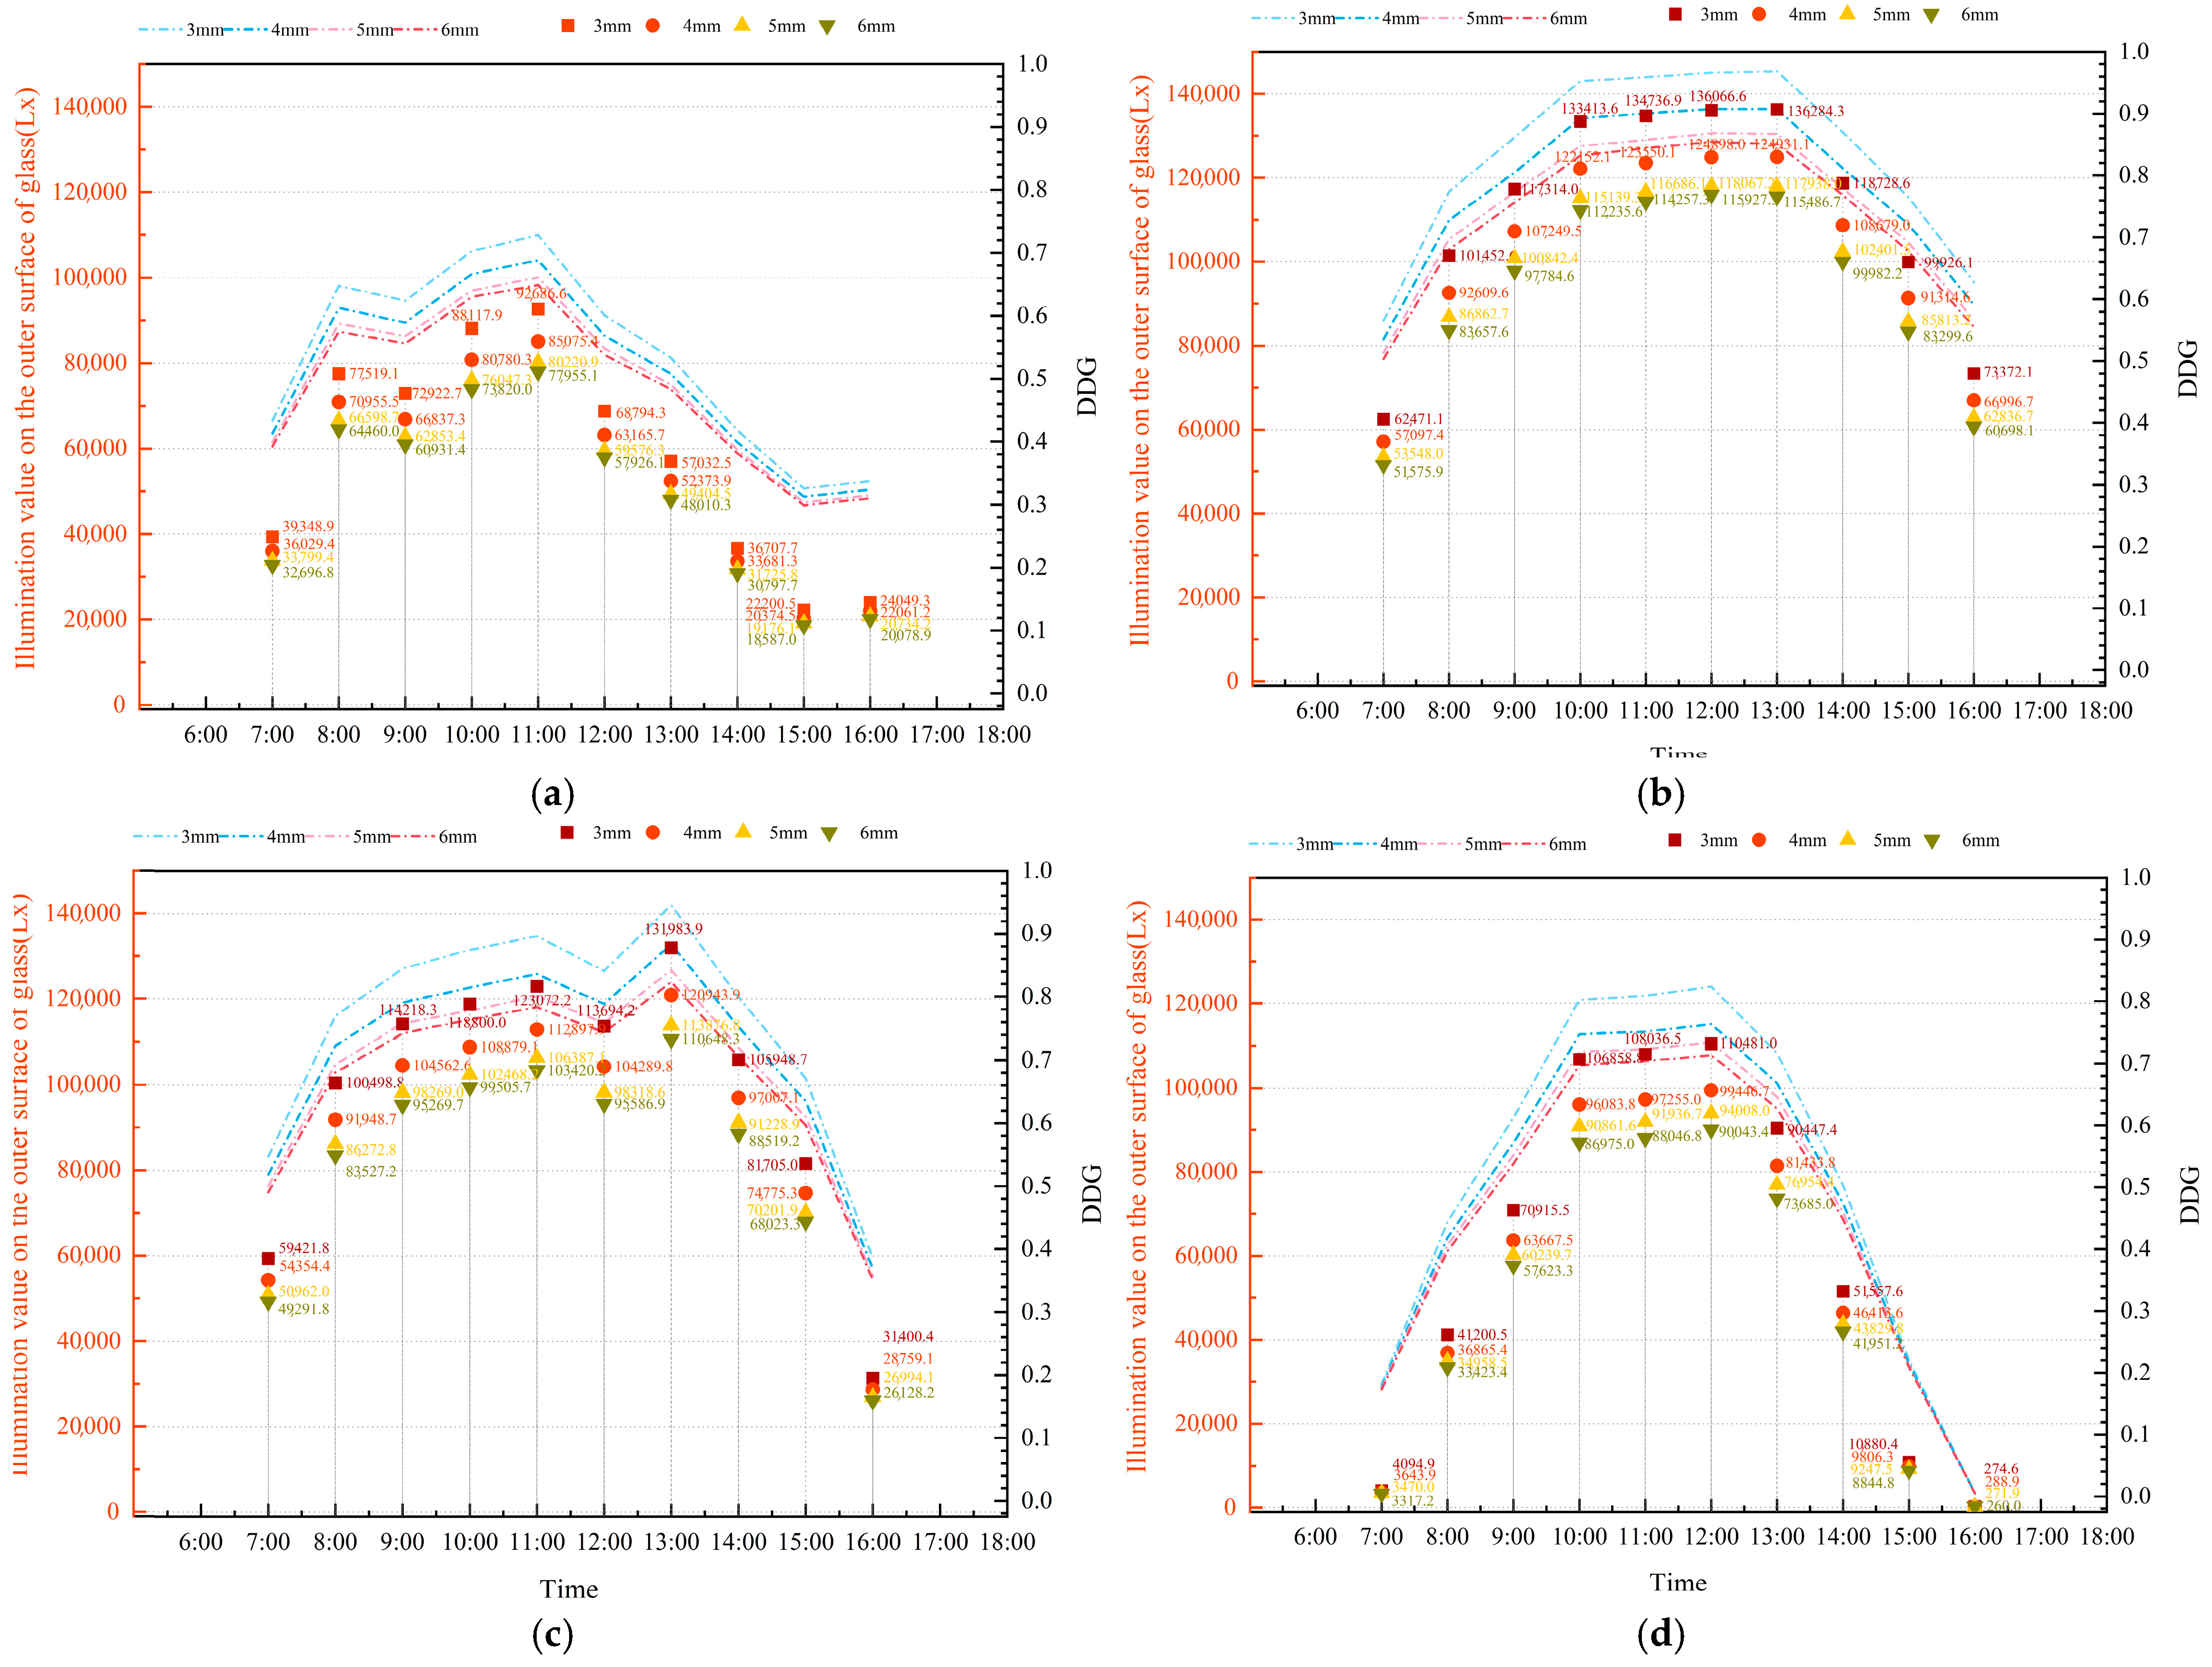
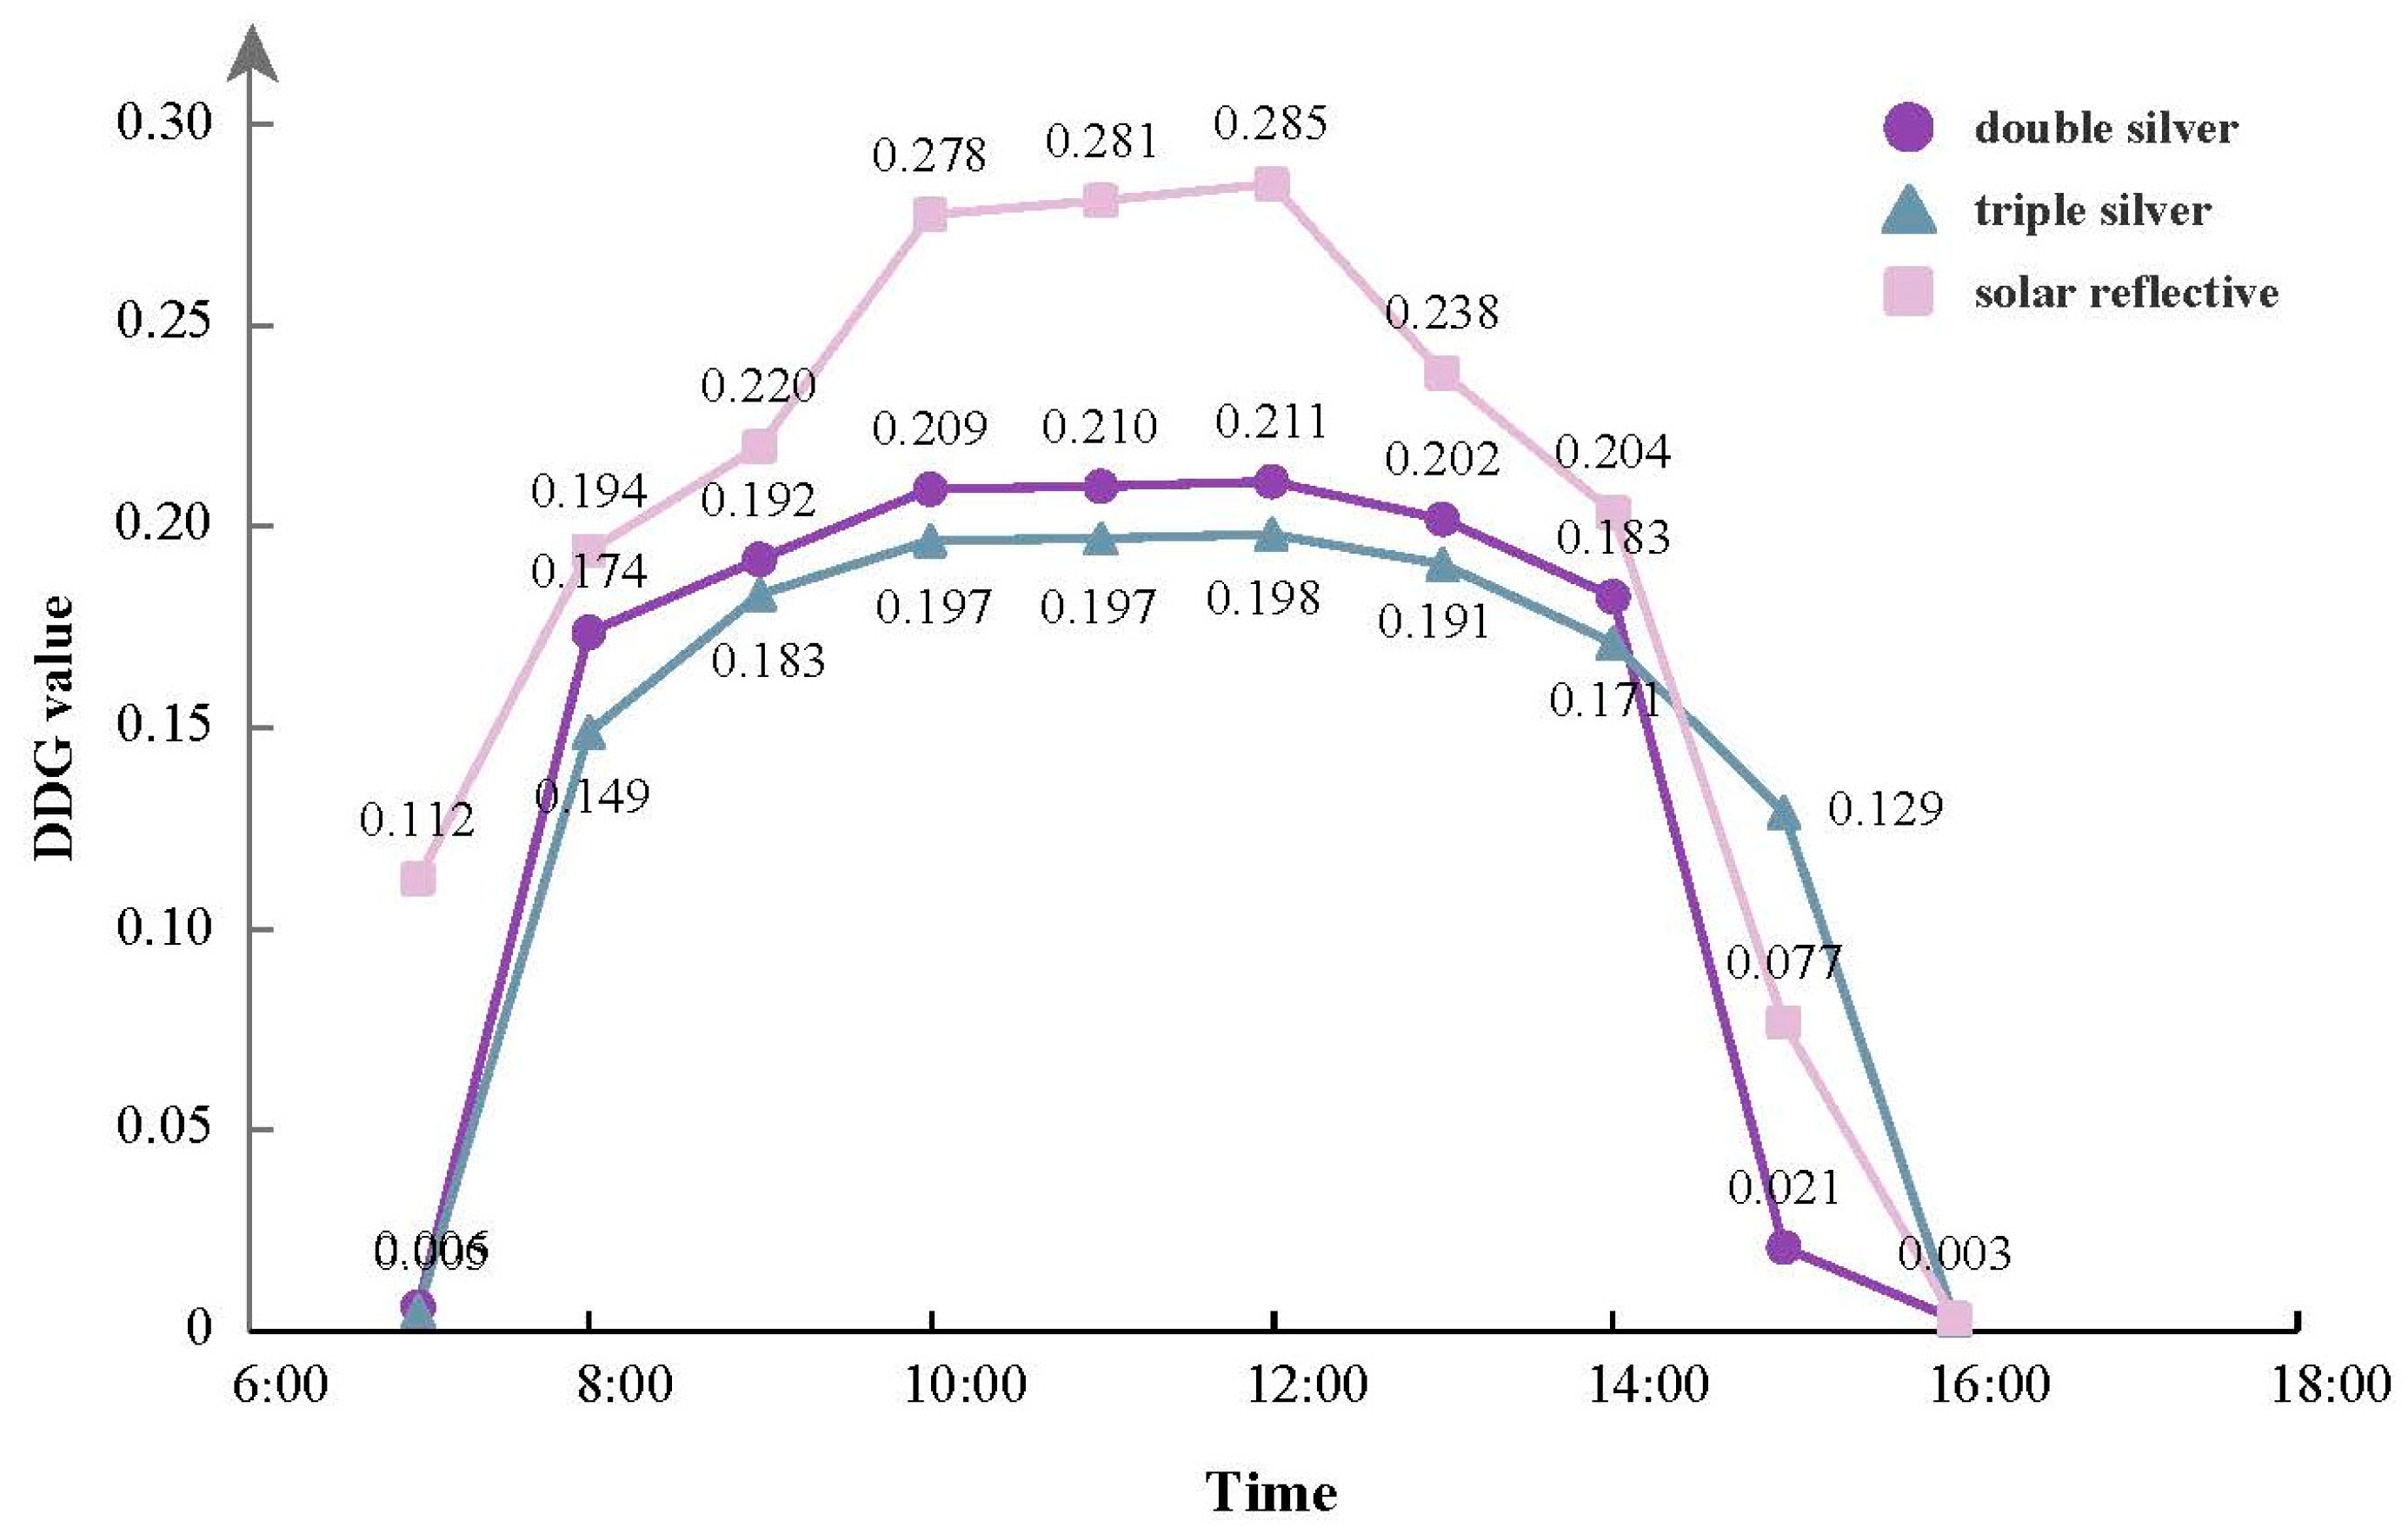
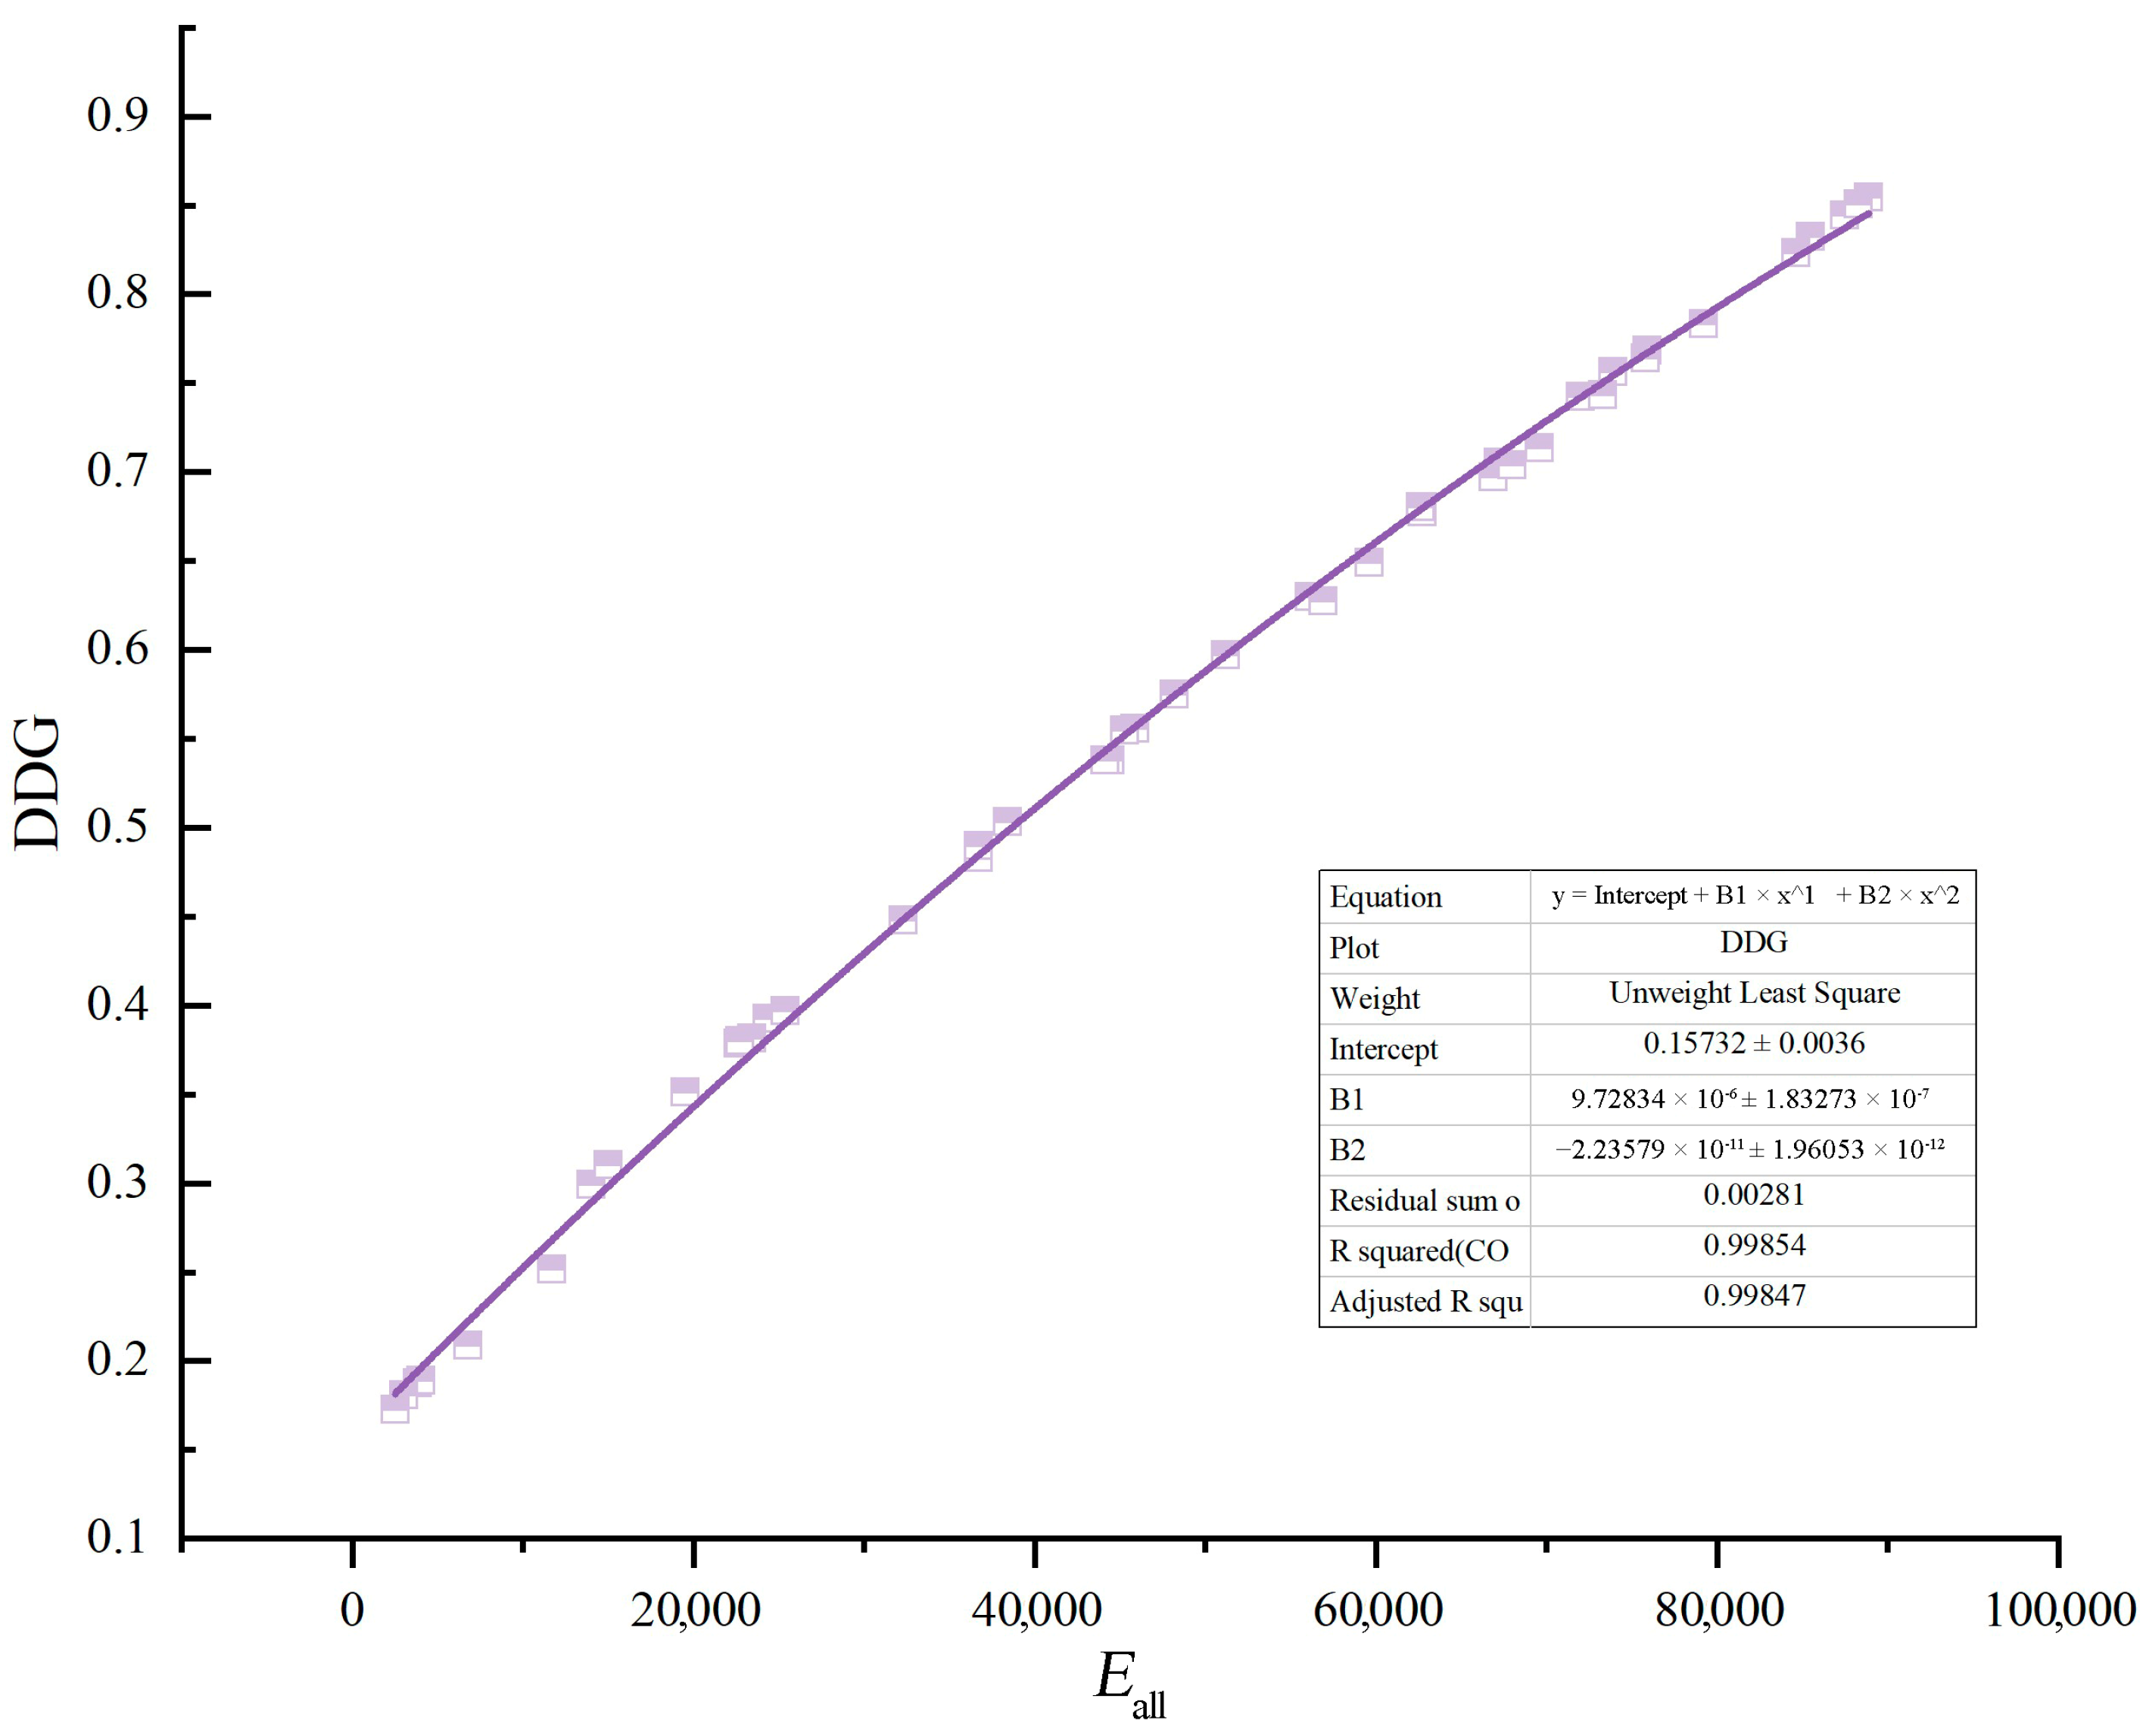
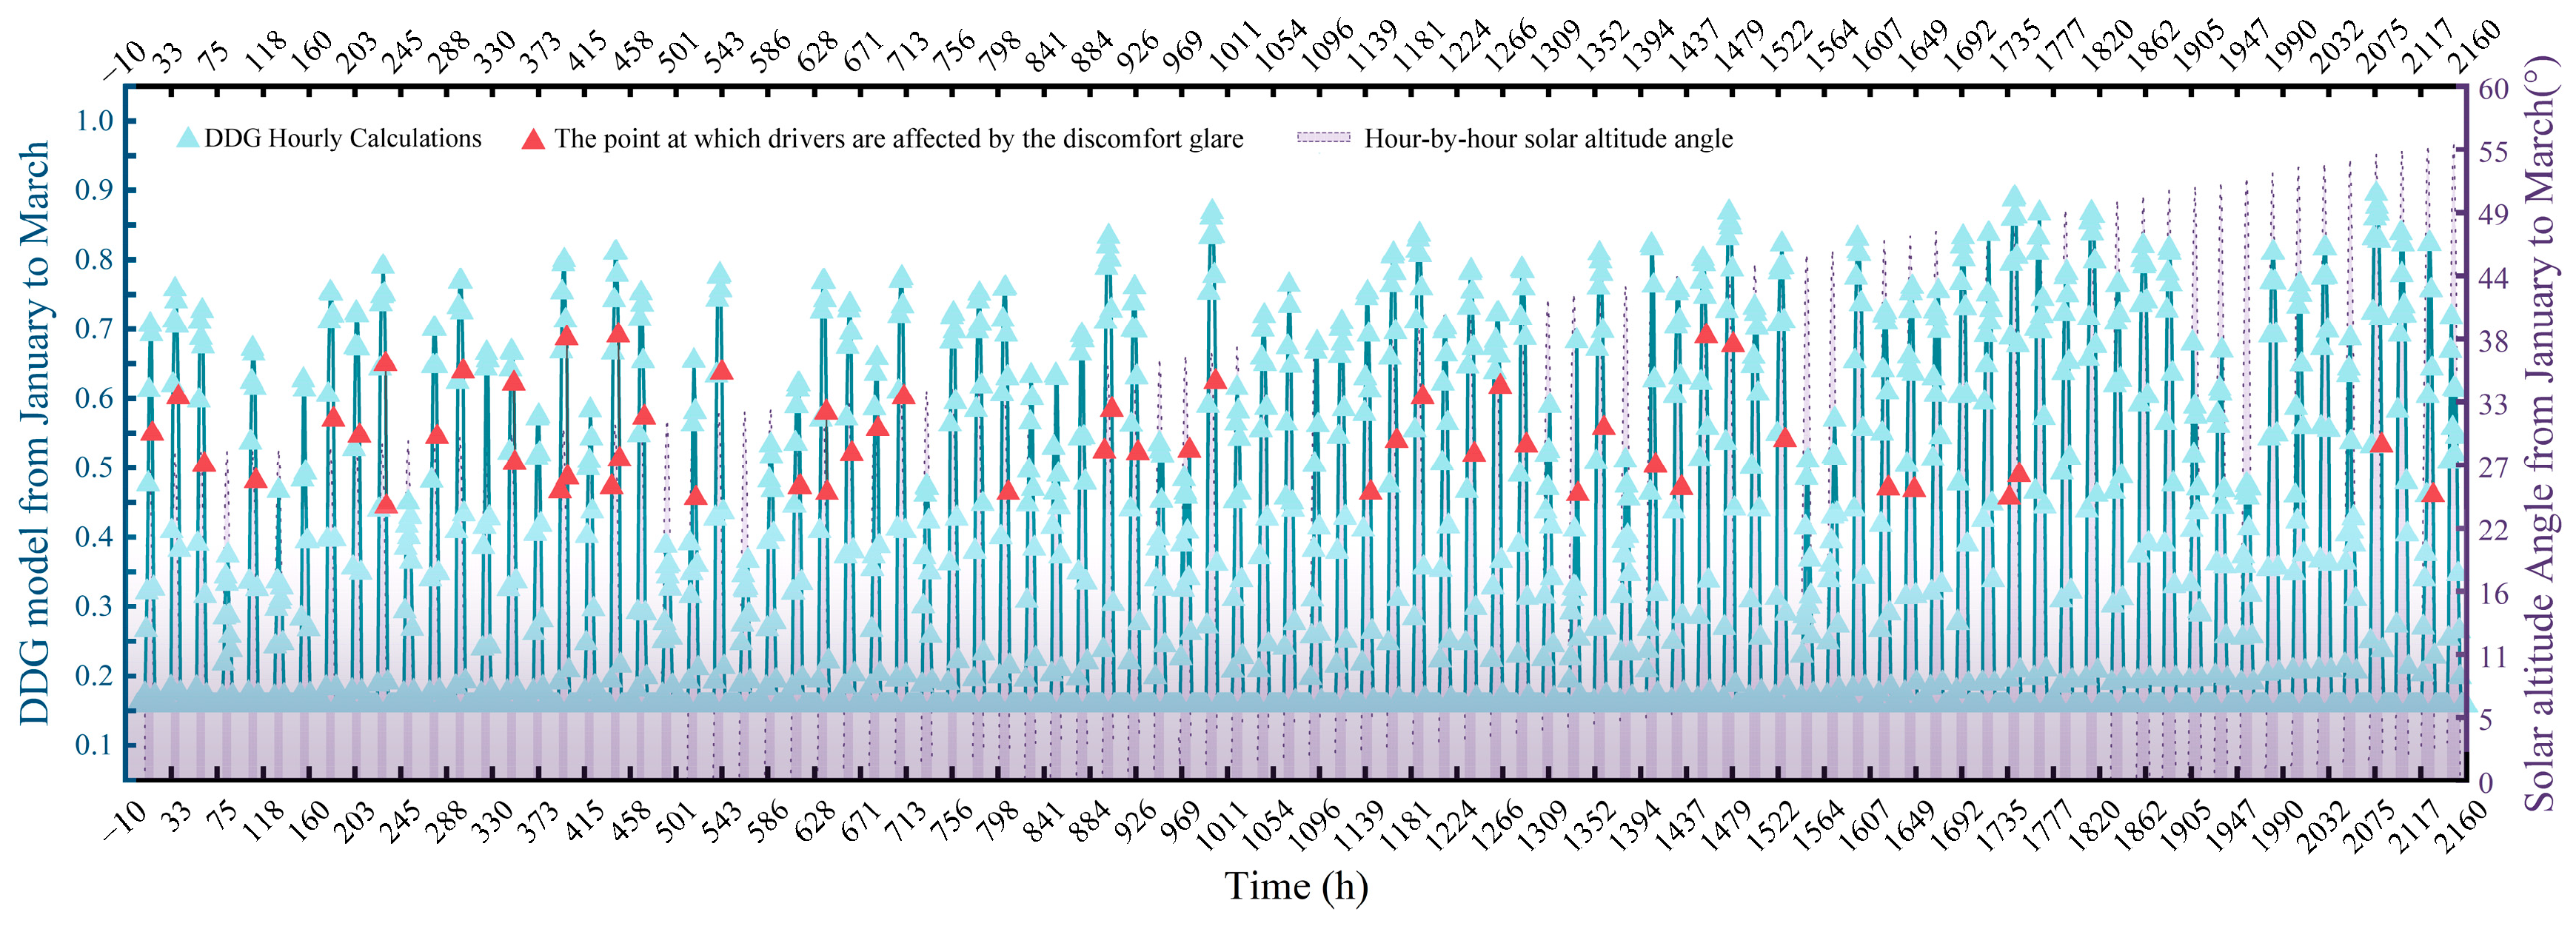
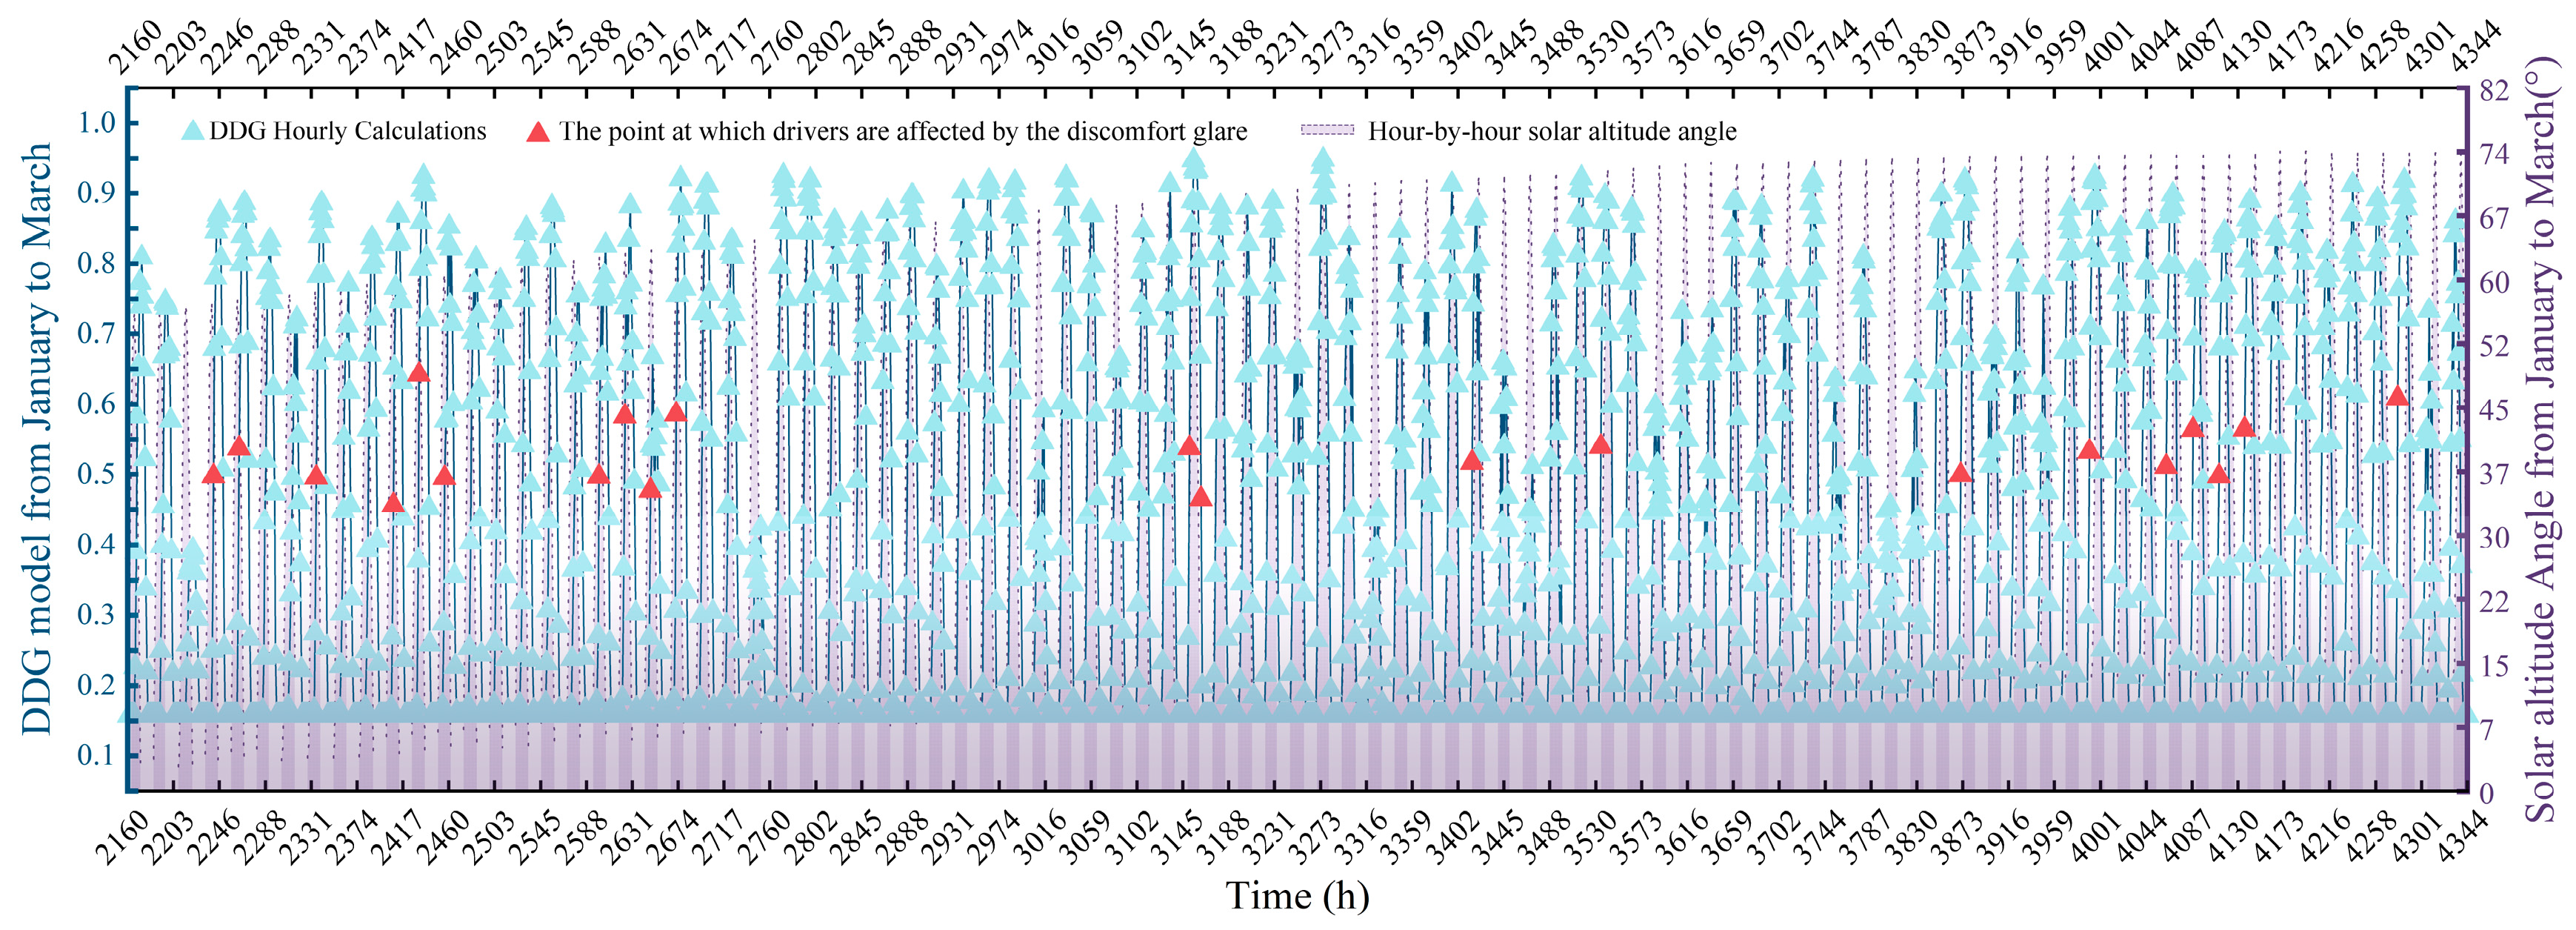
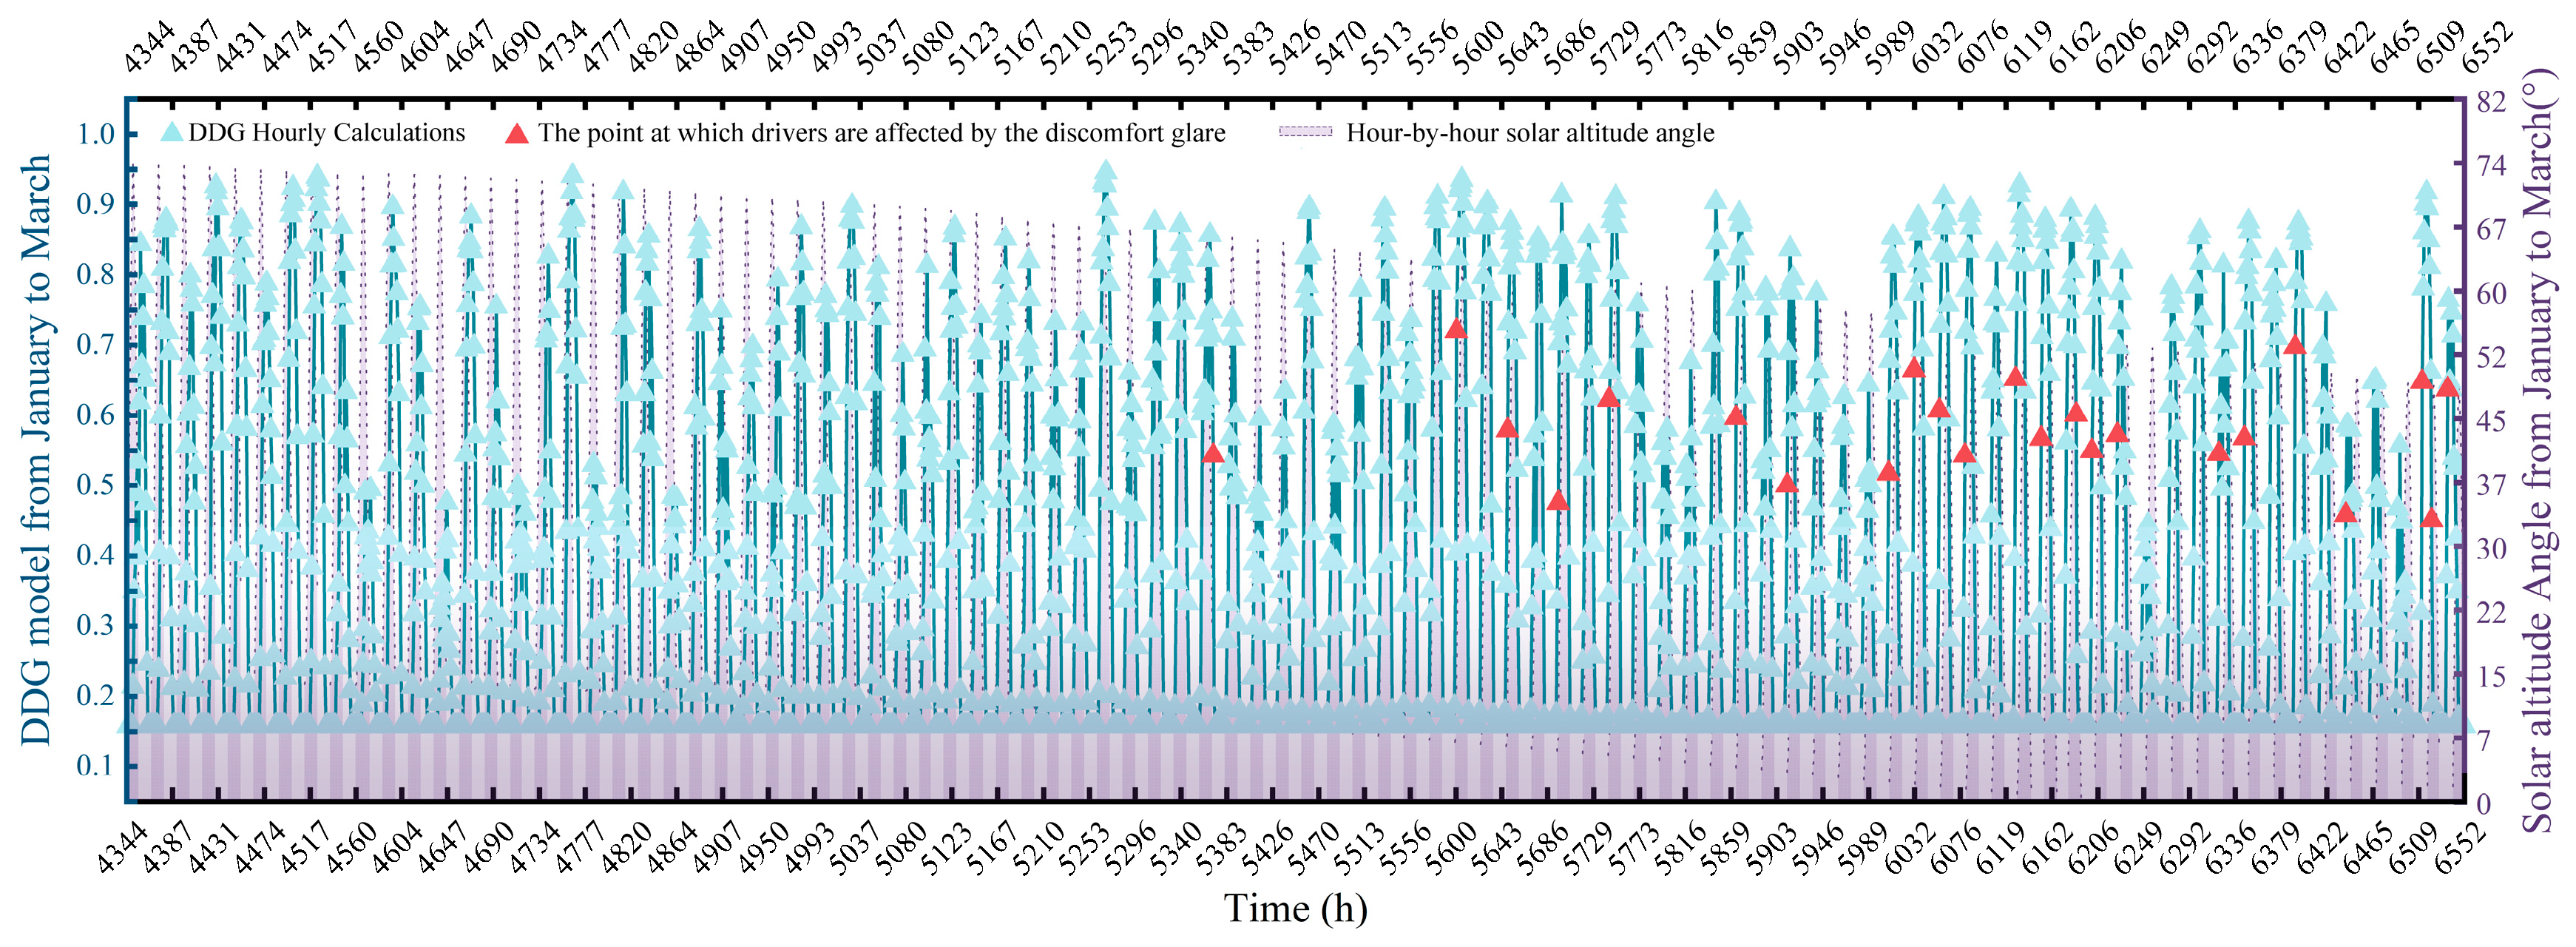
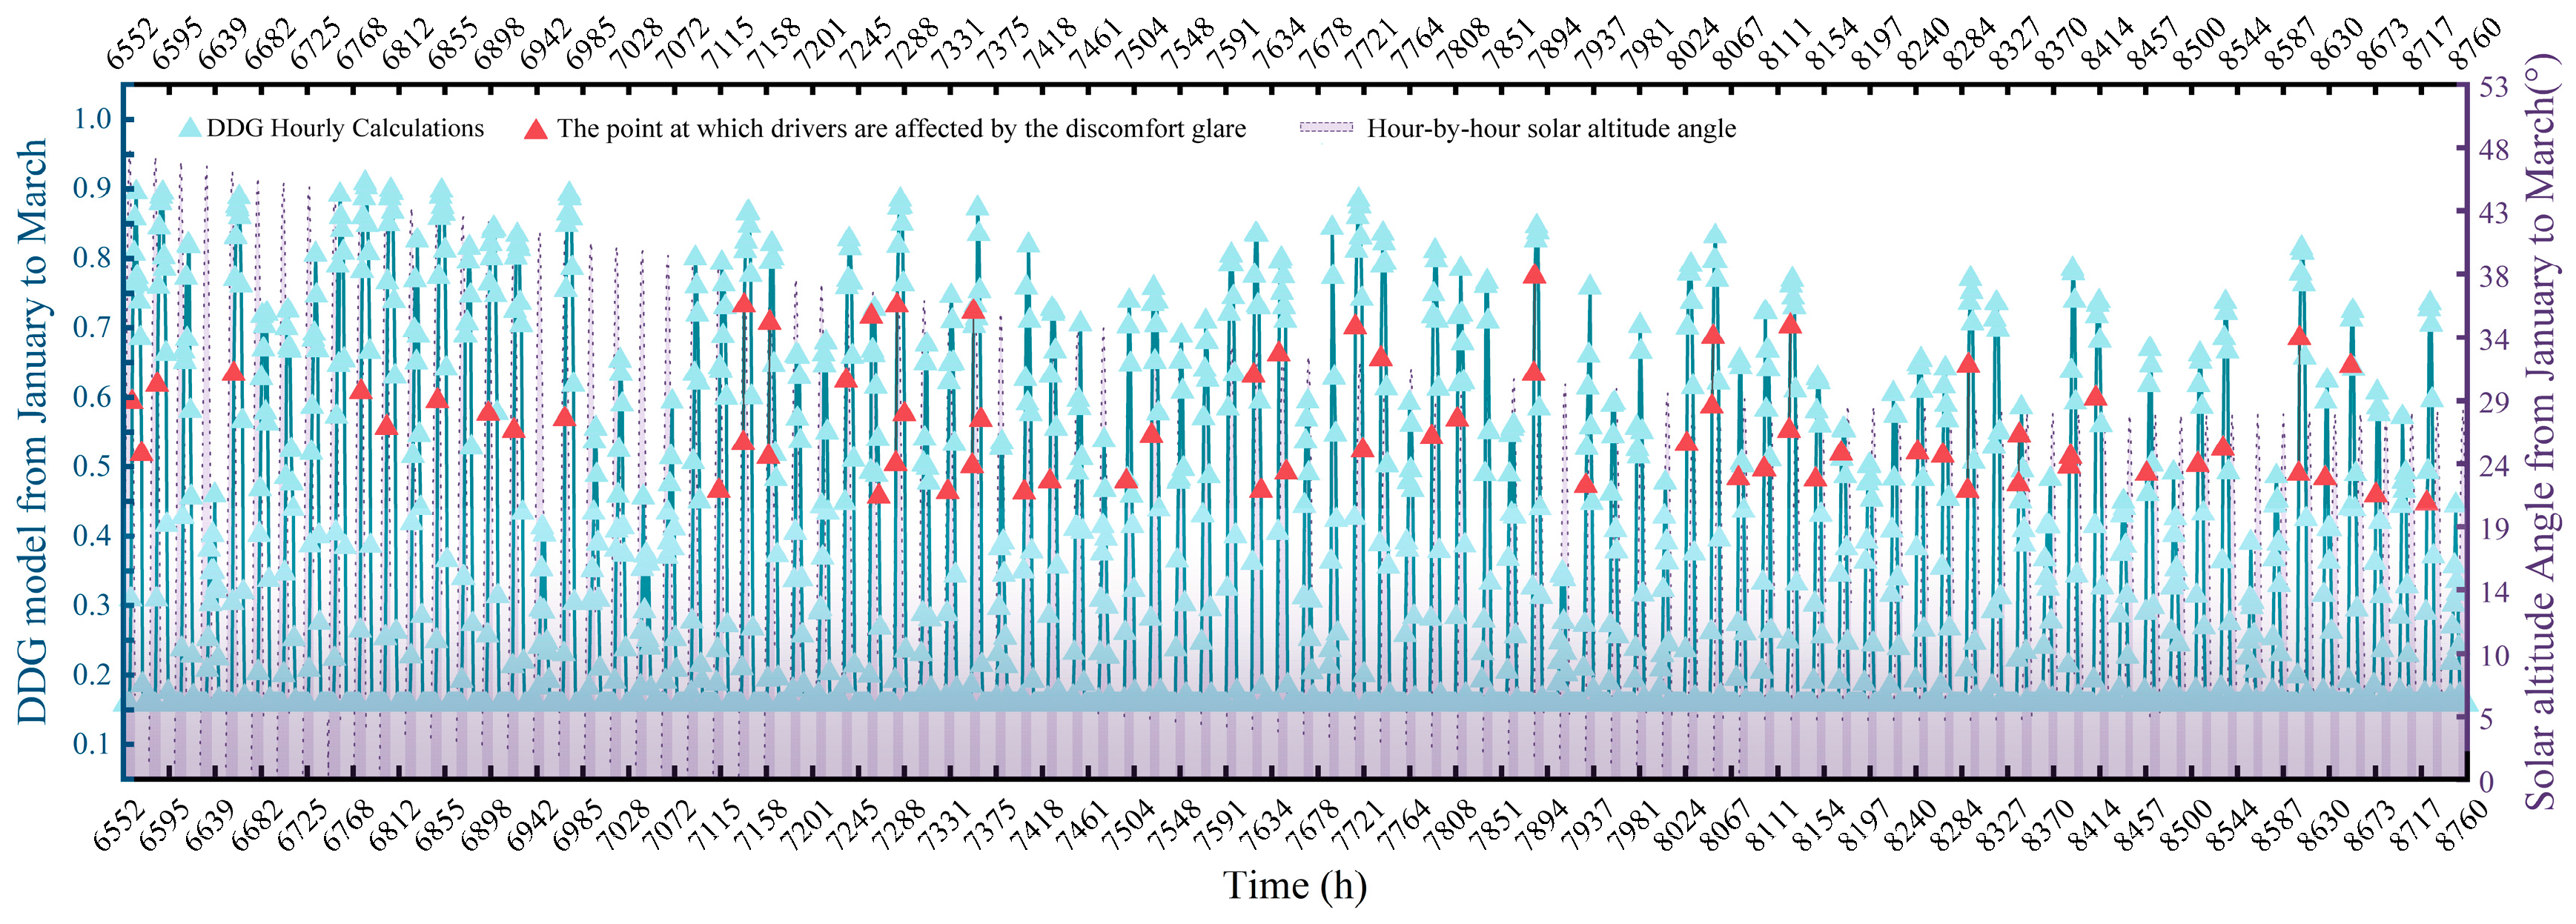
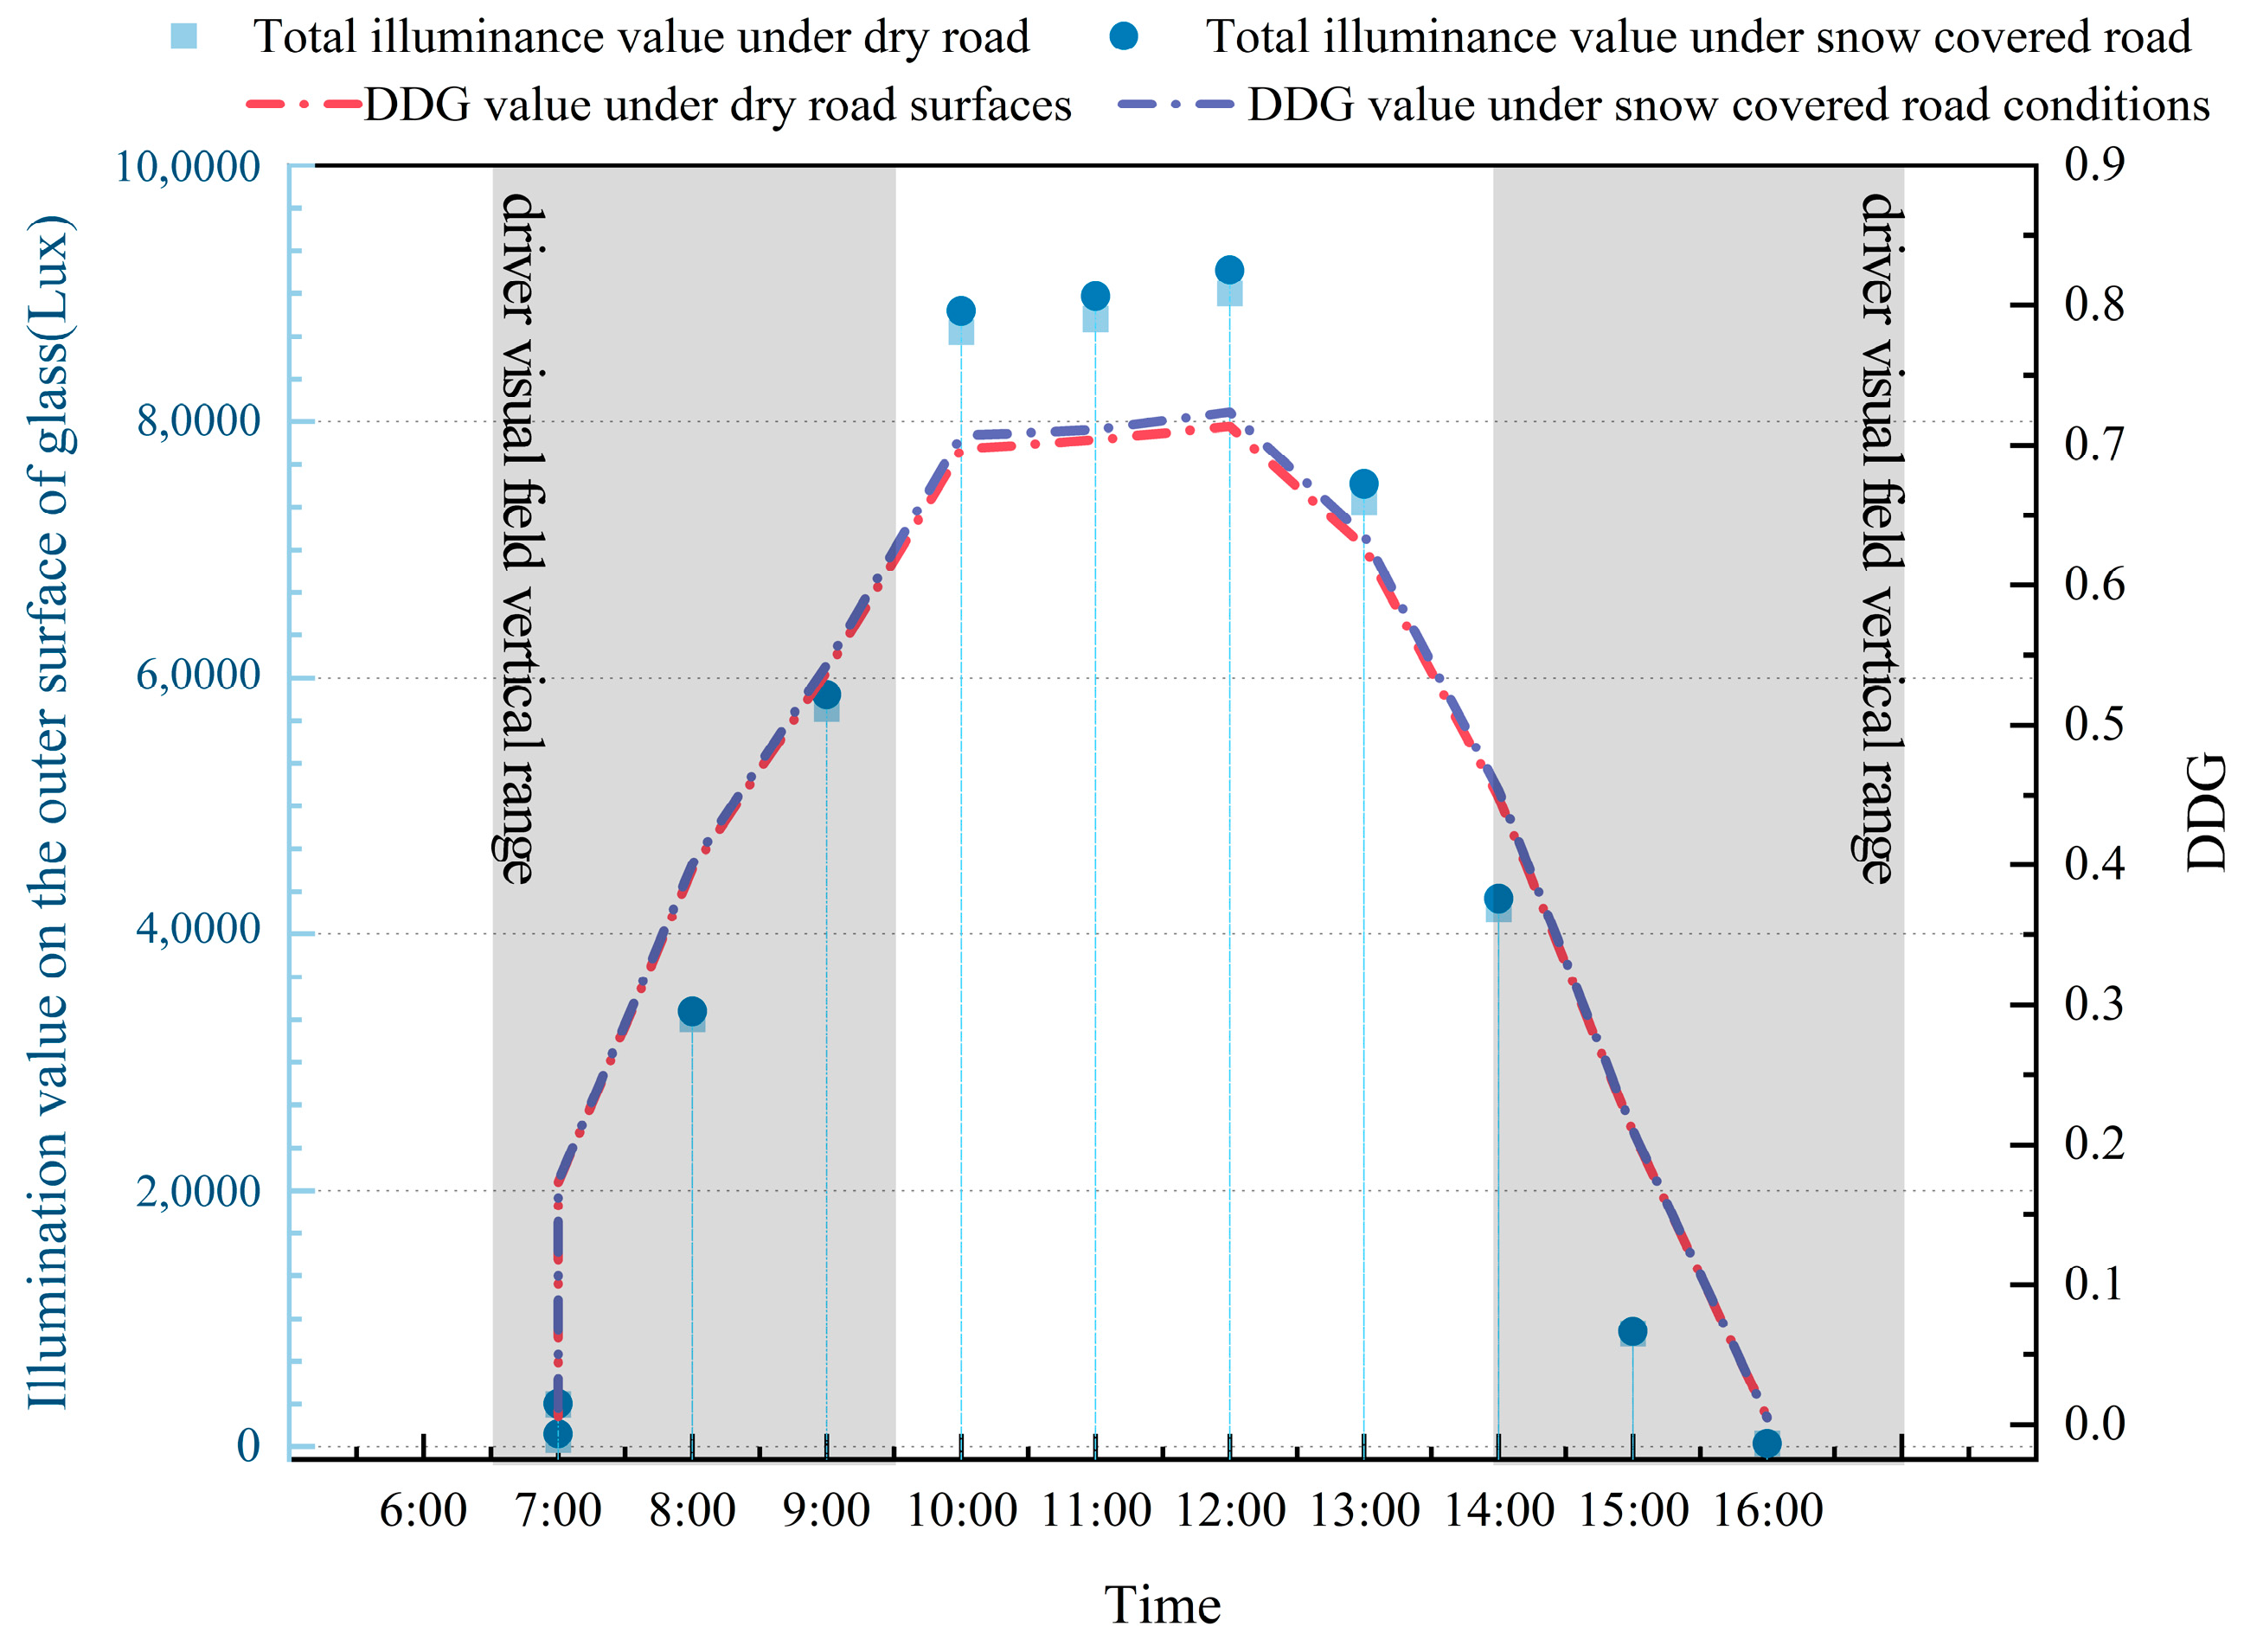

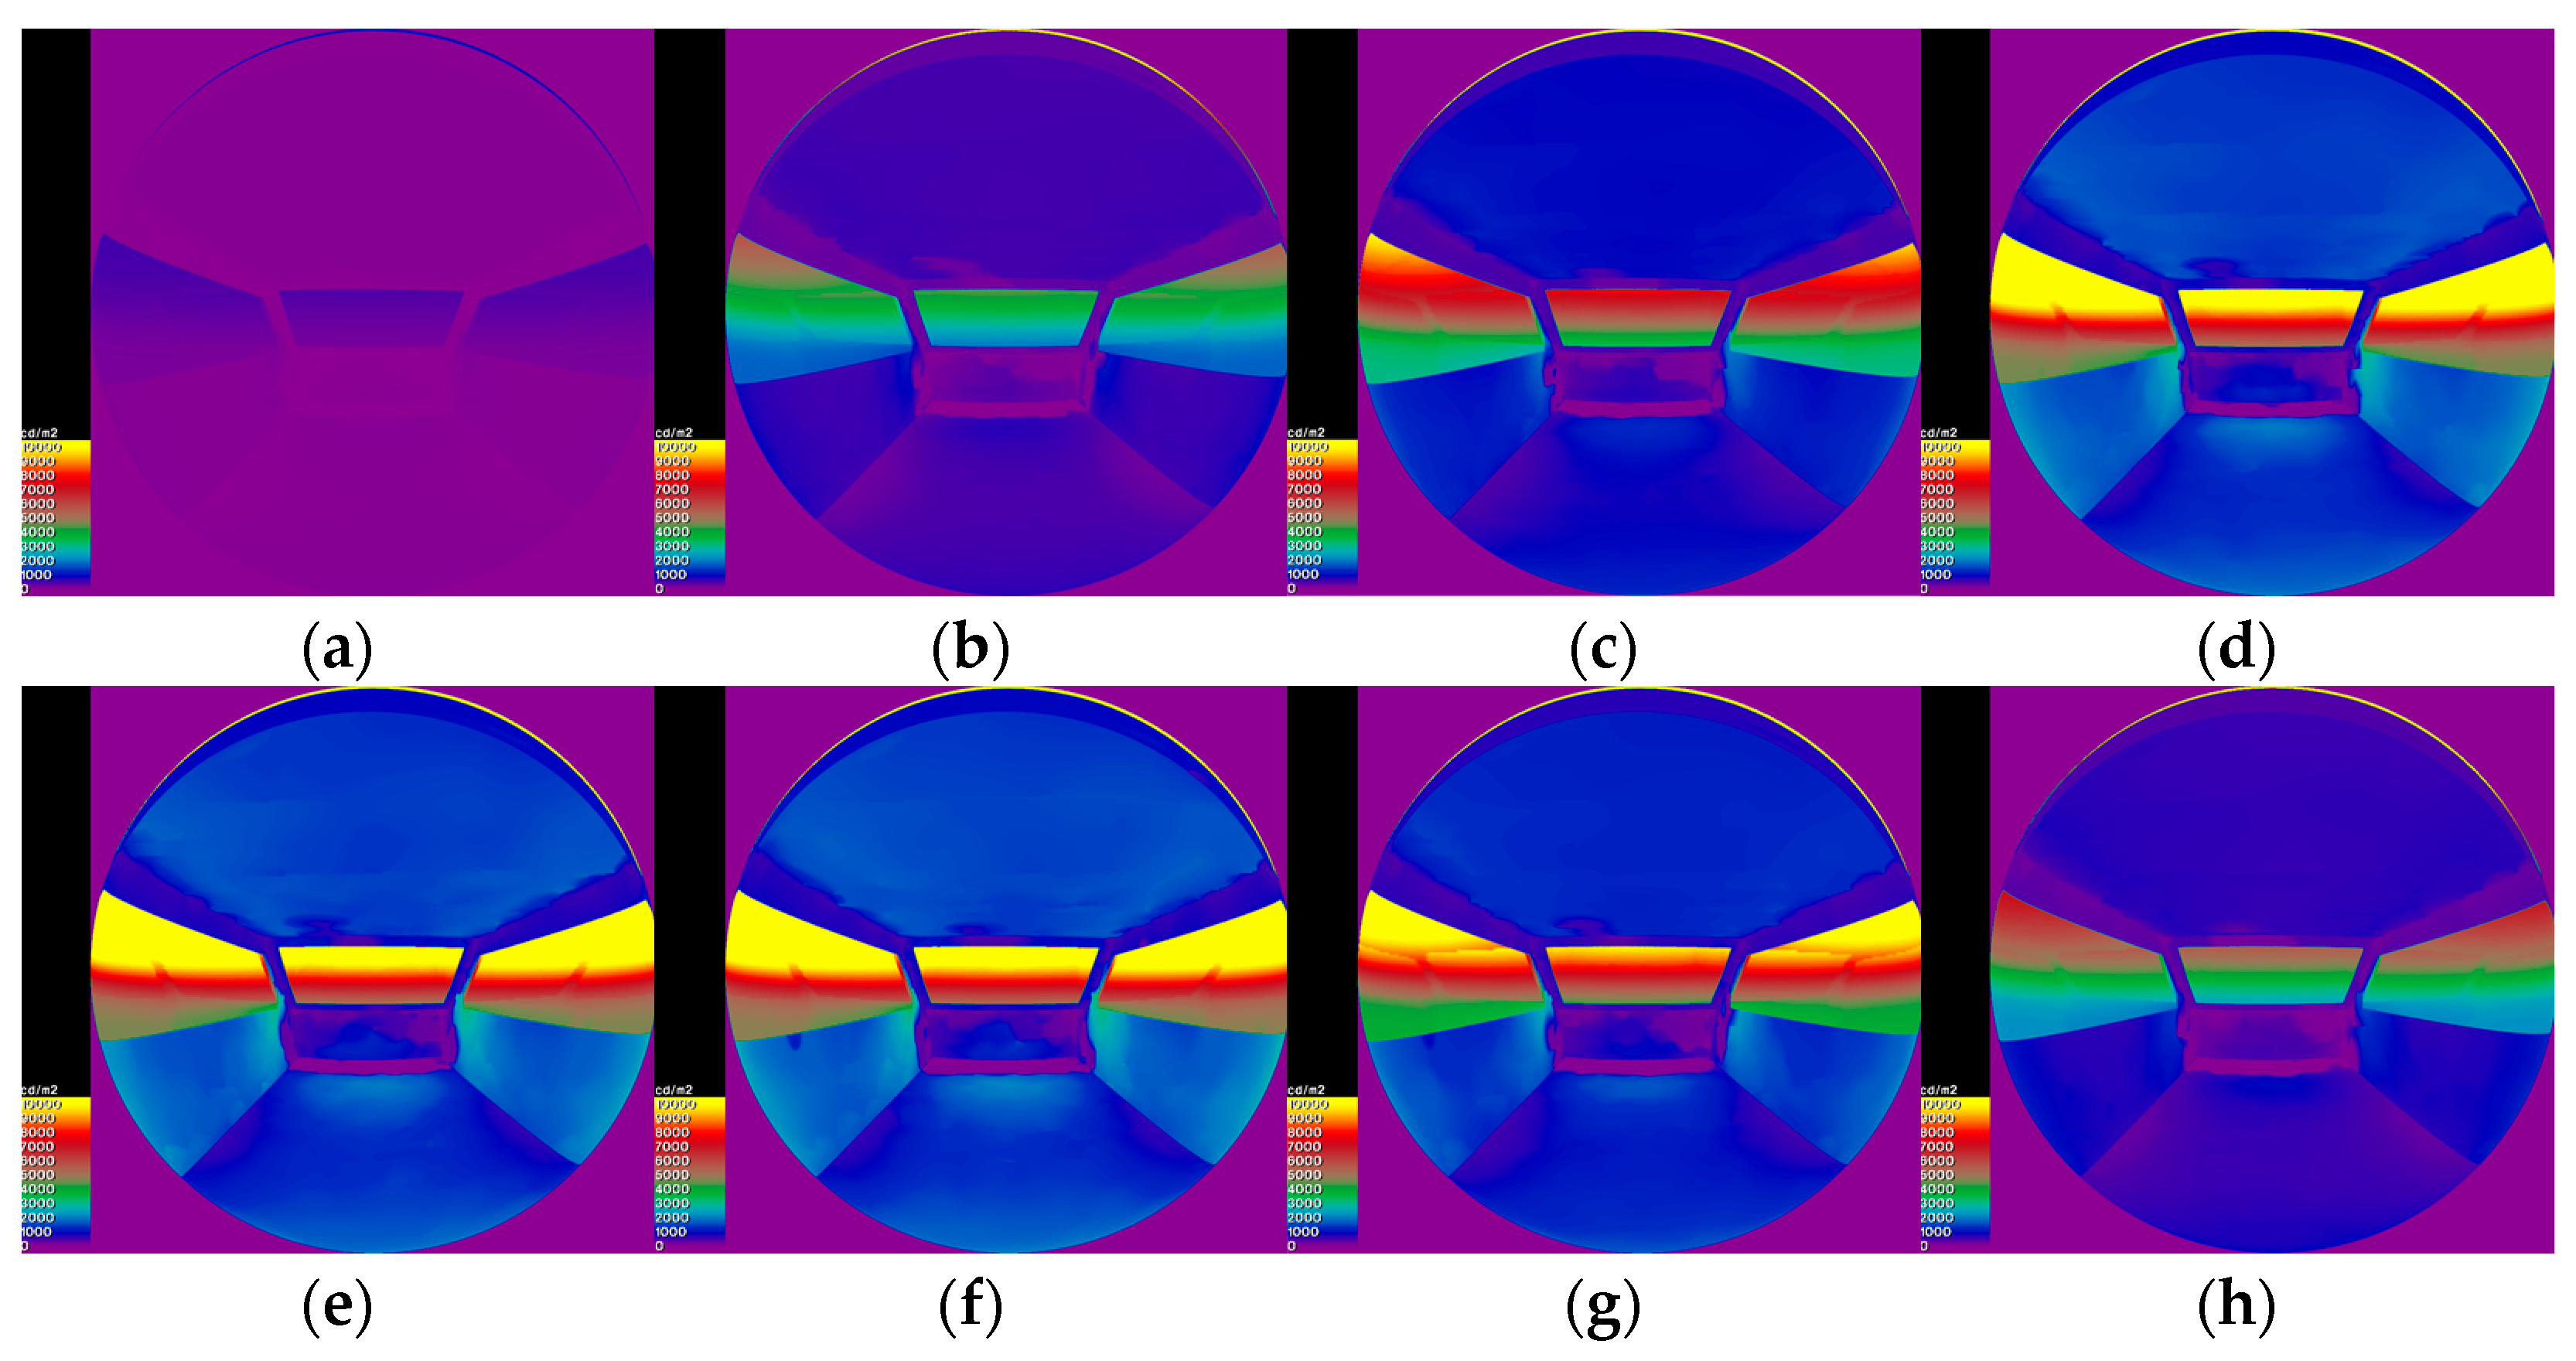
Disclaimer/Publisher’s Note: The statements, opinions and data contained in all publications are solely those of the individual author(s) and contributor(s) and not of MDPI and/or the editor(s). MDPI and/or the editor(s) disclaim responsibility for any injury to people or property resulting from any ideas, methods, instructions or products referred to in the content. |
© 2025 by the authors. Licensee MDPI, Basel, Switzerland. This article is an open access article distributed under the terms and conditions of the Creative Commons Attribution (CC BY) license (https://creativecommons.org/licenses/by/4.0/).