Abstract
Scope: Climate change is one of the most significant threats to human health in the 21st century. Between 2030 and 2050, the number of annual deaths due to climate change, driven by human behaviour, is projected to rise by approximately 250,000. Objectives: This study aims to integrate and adapt the Pro-Environmental Behaviours Scale (PEBS) and evaluate the psychometric properties of the resulting Integrated Pro-Environmental Behaviours Scale (I-PEBS). It seeks to provide a comprehensive measure by incorporating a range of important pro-environmental behaviours and standardizing response formats, enabling the calculation of a synthetic index. Methods: A total of 510 Italian adults (54% female, aged 18–55; M = 35.2, SD = 12.6) participated in this study. Statistical distribution measures were calculated for I-PEBS items, followed by exploratory and confirmatory factor analyses and a construct validity test. Results: Exploratory factor analysis identified an 18-item, six-factor solution, and confirmatory factor analysis showed satisfactory fit indices. Conclusions: The proposed scale has been shown to serve as a reliable and accessible instrument for the assessment of pro-environmental behaviours. This scale can be regarded as a valuable resource for researchers who seek to promote the imperative shift towards more sustainable lifestyles.
1. Introduction
Climate change poses a crucial threat to human health, acting as a risk multiplier. As climatic conditions worsen, the frequency and intensity of extreme weather events such as storms, heat waves, floods, droughts, and fires increase. These events affect health both directly and indirectly, amplifying the risk of mortality and disease outbreaks, as well as generating emergencies in all sectors, including the health and economic ones. Delaying action in tackling climate change increases these risks and threatens to undo decades of progress in public health, going against the collective commitment to secure the human right to health [1]. Research shows that 3.6 billion people already live in areas that are highly susceptible to climate change. Between 2030 and 2050, climate change is expected to cause approximately 250,000 additional deaths per year. It is also estimated that the direct costs of human health-related damage, while not taking into account the costs for all those indirectly affected sectors, such as agriculture, will be between USD 2 and 4 billion per year by 2030 [2]. Agriculture is heavily affected by climate change. Unpredictable rainfall, droughts, and soil degradation reduce crop yields, threatening food security and farmers’ livelihoods. In some regions, traditional farming methods are no longer sustainable, leading to an increasing dependence on food imports and rising prices. Social mobility is also increasingly influenced by climate change, as extreme weather events and rising sea levels force people to migrate from rural to urban areas or even across national borders. This displacement can lead to economic instability, job insecurity, and worsening living conditions, particularly for vulnerable communities. The economy and industry are also at risk since natural disasters, such as hurricanes and floods, damage infrastructure and increase production costs. Additionally, the energy sector faces growing challenges as its dependence on fossil fuels continues to contribute to global warming. Tourism, a key economic sector for many countries, is another particularly vulnerable area. Rising sea levels threaten coastal destinations, while extreme heat and natural disasters make some areas less attractive or even dangerous for visitors. Climate change also affects natural landmarks, such as coral reefs and glaciers, impacting local economies that rely on tourism. Therefore, it is essential to recognize that climate change is a multidimensional issue that influences human life in numerous ways [3].
Human behaviour is a major contributor to climate change [4,5]. It is increasingly viewed as part of complex adaptive systems, which co-evolve with socio-cultural and biophysical contexts. The literature highlights the importance of adopting a more-than-human perspective in sustainability research. This is because, by recognizing the interconnectedness of human and non-human actors and employing complex systems thinking, it is possible to better understand and address the challenges of sustainability transitions. This holistic approach is crucial for fostering sustainable behaviours and achieving long-term environmental goals [6,7]. Within this broad and multidimensional framework, several studies [5] have focused on individuals’ daily behaviours, which people perceive as being under their direct control but which should always be considered within this broader perspective of the issue. Behaviours such as not or incorrectly sorting waste, dietary habits and choices (e.g., excessive consumption of meat), and purchasing clothes from the fast fashion industry have a strong impact on climate change [8,9,10]. For this reason, one of the most important challenges today concerns the possibility of changing the behaviours implemented by individuals at different levels [11] to generate benefits for the environment rather than negative consequences. Pro-environmental behaviour can be defined as the set of human actions that yield environmental benefits compared to alternative behaviours [12]. Given the wide range of these behaviours, various attempts have been made in the literature to categorize them. One widely accepted categorization, formulated by Stern [13], divides ecological behaviour into three categories: environmental activism, non-activist behaviour in the public sphere, and environmentalism-related behaviour in the private sphere. The first category concerns active engagement in environmental movements, the second involves supporting policies aimed at protecting the environment, and the third category includes individual consumer actions with a direct impact on the environment, such as household waste management and the purchase of eco-friendly products.
2. Literature Review
There are several scales in the literature that have been used to measure pro-environmental behaviour [14]. The General Ecological Behaviour Scale [15,16], which consists of 50 items, was one of the first to propose a general measurement of ecological behaviour based on concrete actions rather than attitudes or intentions. The 97-item Stanford Climate Change Behaviour Survey (SCCBS) [17] was built to overcome the limitations of previous instruments, which typically examined only a narrow range of environmental behaviours. On the contrary, by covering a wide array of activities, the latter provides a comprehensive insight into how individual actions impact greenhouse gas emissions. Similarly, the Tabi questionnaire [18] consists of eight items measuring multiple pro-environmental behaviours: energy consumption habits, transportation choices, dietary preferences, and waste management practices.
These three measurement scales only consider the first of the three categories proposed by Stern [13]. Consequently, to overcome such a limitation, Markle [19] proposed the Pro-Environmental Behaviours Scale (PEBS), a four-dimensional scale consisting of 19 items. The first factor, conservation, consists of seven items concerning the frequency with which people engage in behaviours such as reducing consumption of heating, air conditioning, hot water, and lighting (“How often do you wait until you have a full load to use the washing machine or dishwasher?”). The second factor, environmental citizenship, comprises six items evaluating membership in environmental organizations and the frequency with which individuals discuss their pro-environmental behaviours with others (“How often do you talk to others about their environmental behaviour?”). The third factor, food, consists of three items related to the reduction in beef, pork, and poultry consumption over the past year (“During the past year, have you decreased the amount of beef you consume?”). The fourth factor, transportation, includes three items measuring the behaviour over the past year concerning carpooling, using public transportation, and walking or cycling instead of driving (“During the past year, how often have you walked or cycled instead of driving?”). The Cronbach’s alpha is 0.76 for the total scale and 0.62 to 0.74 for the individual dimensions.
Although the PEBS scale appears to be the most comprehensive in the literature to date, the scale could benefit from the integration of certain pro-environmental behaviours that are solidly present in the literature, concerning waste reduction (e.g., preferring reusable products to disposable ones, using shopping bags, and eating leftover food), recycling, and preferring local and seasonal vegetable products [16,17,18]. Furthermore, it would be interesting to add to the scale some behaviours that, in recent years, have been increasingly becoming a problem for the environment, such as the use of clothing products from the fast fashion industry and the recycling of hazardous waste [8,20]. The instrument could also benefit from a simplification of the response format across different items. Indeed, some items present “yes/no” response alternatives, while others use a 5-point Likert scale from 1 (Never) to 5 (Always). Still, others use a three-point Likert scale with response alternatives such as 1 (Hot), 2 (Warm), and 3 (Cold), or even specific alternatives such as “25–29”, “30–34”, “35–39”, and “40 or more” when asking about one’s own car fuel consumption. The use of different response alternatives makes the instrument difficult to use, as it does not allow for the calculation of a summary index for the comparison of individuals and groups. A uniform Likert scale response format could make the instrument easier to use and improve its reliability.
Menardo and colleagues [21] validated the PEBS in Italian and obtained a four-factor solution consisting of 15 items, whose internal consistency (ω coefficient) was 0.71 for the total scale. Items 7 (“At which temperature do you wash most of your clothes?”), 17 (“During the past year, how often have you car-pooled?”), 4 (“How often do you turn off the TV when leaving a room?”), and 1 (“How often do you turn off the lights when leaving a room?”) were eliminated by the authors as they presented too low saturations on the respective factors. Furthermore, the factorial structure that emerged revealed a non-full overlap with the original factorial structure. In particular, item 13 (“Please answer the following question based on the vehicle you drive most often: approximately how many kilometres per litre does the vehicle get?”) saturated on the transportation dimension and not on the environmental citizenship dimension; likewise, item 12 (“During the past year have you increased the amount of organically grown fruits and vegetables you consume?”) saturated on the food dimension and not on the environmental citizenship dimension. Despite this divergence from the original scale factor structure, this validation retains the limitations regarding the response modes; consequently, while relatively comprehensive, it remains difficult to administer.
In light of this examination, it is clear that there is a lack in the literature of a comprehensive yet brief and user-friendly tool that focuses on those behaviours enacted by individuals that have a significant impact on the environment.
The present study aims to integrate the Italian version of the PEBS [19,21] scale with items concerning environmentally relevant behaviour that were missing in the original version of the instrument. It also sought to standardize the response formats in order to enhance the usability of the instrument for research and intervention purposes.
In line with the literature, we assumed that the scale was multidimensional and had high internal reliability.
3. Materials and Methods
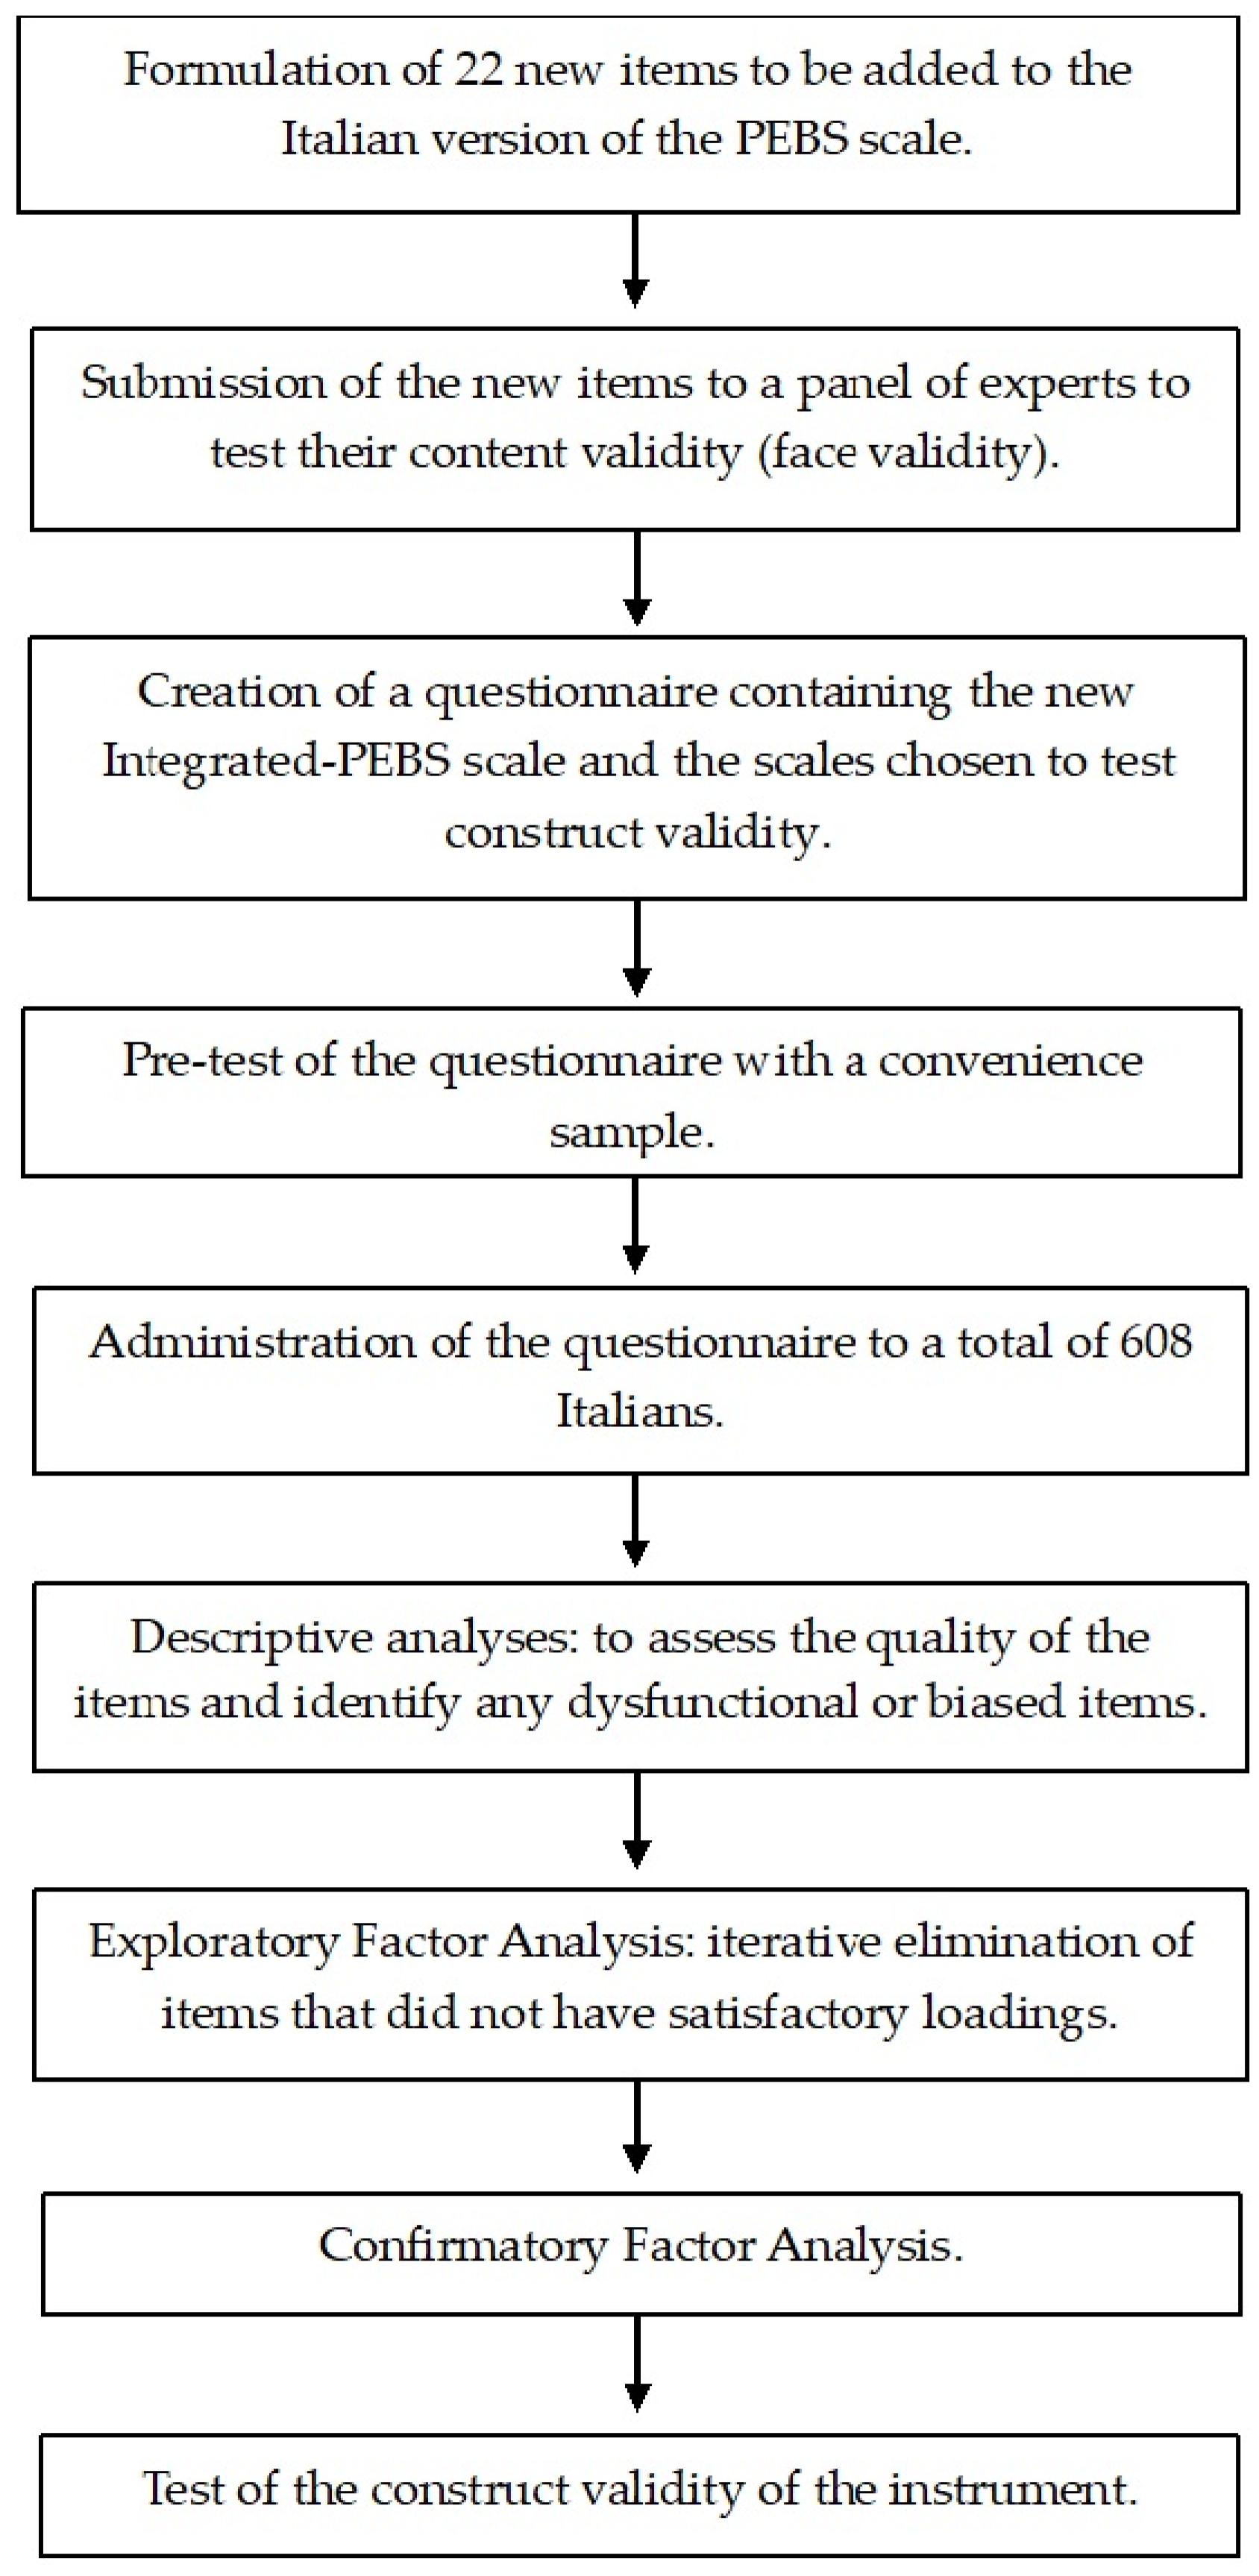
The methodology used and the steps followed to integrate the Italian version of the PEBS scale, develop the Integrated-PEBS (I-PEBS), and test its factorial structure and validity are summarized in Figure 1.
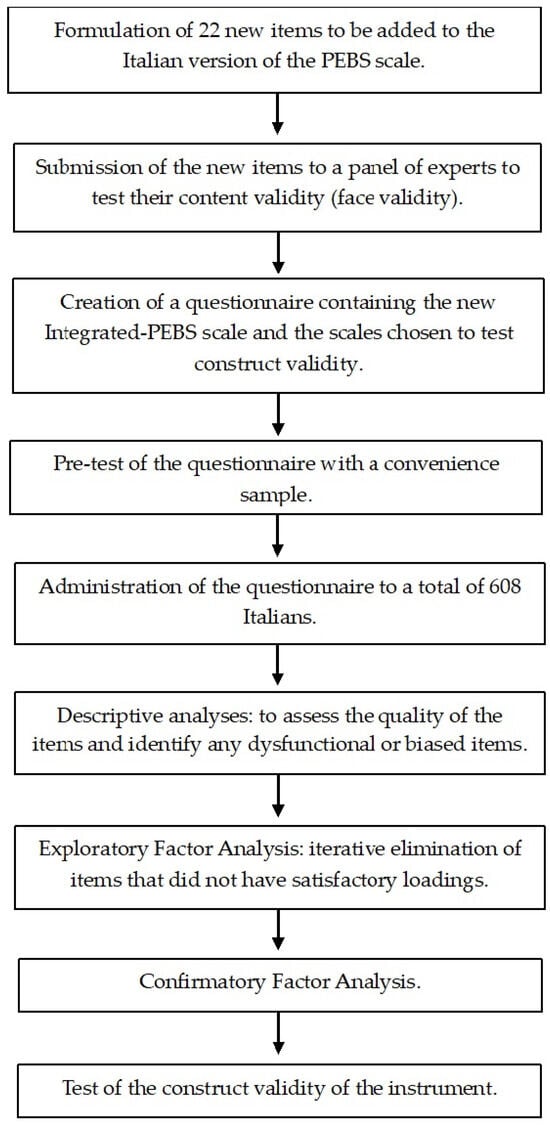
Figure 1.
Flowchart of the methodological steps.
3.1. Integration and Adaptation of the Italian Version of the PEBS Scale
The analysis of the existing literature on pro-environmental behaviour made it possible to identify those categories of behaviours missing from the PEBS [8,9,10,16,17,18,20]. Initially, the authors engaged in a brainstorming session to generate a broad set of potential items for each category in order to cover as many specific behaviours as possible. This was followed by a review phase in which the proposed items were evaluated for clarity, relevance, and representativeness. Redundant or ambiguous items were revised or eliminated. At the end of this process, a total of 4 macro-categories and 22 items were identified: waste reduction (13 items; e.g., “Preferring reusable products over disposable ones—e.g., water bottle, reusable straws and bags, glass containers, etc.”); consumption of local and seasonal vegetable products (2 items; e.g., “Purchasing local vegetable food products”.); sustainable clothing (4 items; e.g., “Purchasing second-hand clothing—e.g., through Vinted, markets, vintage shops, etc.”); recycling (3 items; e.g., “Sorting waste”).
Before starting the study, the additional items formulated by the authors were submitted to a panel of experts to check their content validity (face validity). The expert panel, consisting of three academic researchers, successfully validated the measure.
Subsequently, a convenience sample was used to pre-test the questionnaire, involving 15 people from different age groups. Each participant was asked to provide suggestions for improving the content. The feedback gathered during this pilot test provided useful indications for making the necessary revisions to the items in the questionnaire [22].
Finally, we proceeded to administer the integrated version of the Pro-Environmental Behaviours Scale (I-PEBS) to test its psychometric properties.
3.2. Procedures
Participants were recruited through snowball sampling. Students of two university courses, held between February and March 2024, were asked to fill out a questionnaire and share it with others by word of mouth. According to the inclusion criteria, participants had to be adults aged between 18 and 55 years. Participation was completely voluntary and anonymous. Participants were asked to answer truthfully and informed that they could discontinue their participation at any time. The research protocol was approved by the local ethics committee (prot. 39/2023 of 31 January 2024) and was conducted in accordance with APA ethical standards and the principles of the 1995 Declaration of Helsinki. Consent to participate was obtained on the first page of the questionnaire, which took approximately 30 min to complete.
3.3. Participants
A total of 608 Italian adults took part in the study, of whom those who failed the attention checks included in the questionnaire were excluded from further analysis. Thus, the final sample comprised 510 individuals, fairly balanced by gender (54% women) and aged between 18 and 55 years (M = 35.2, SD = 12.6). Regarding occupational status, 37.5% of the participants were employees, 34.3% were university students, 14.5% were self-employed, 7.8% were housewives, 3.9% were unemployed, and 2% answered ‘other’. In terms of education, 45.3% of the participants were high school graduates, 42.3% were university graduates, 4.7% had a postgraduate degree, 6.7% had a secondary school degree, and a marginal 1% had a primary school degree.
3.4. Measures
The questionnaire included the Integrated Pro-Environmental Behaviour Scale (I-PEBS) and several other scales to assess the construct’s validity [16,23,24]. In particular, global learned helplessness was considered for discriminant validity, given its complete divergence from the investigated construct. Moreover, green self-identity and environmental self-efficacy were considered, as they are related to, yet distinct from, pro-environmental behaviour.
The Integrated Pro-Environmental Behaviours Scale (I-PEBS) consists of 36 items: 14 items from the Italian version of the Pro-Environmental Behaviours Scale (M-PEBS) [19,21] and 22 items developed ad hoc by the authors (N-PEBS). Responses to the items were collected via a 5-point Likert scale from 1 (Never) to 5 (Always). Menardo and colleagues’ scale [21] originally included 15 items, but one of them (“Please answer the following question based on the vehicle you drive most often: approximately how many kilometres per litre does the vehicle get?”) was removed beforehand because it could not be adapted to the new response alternatives of the scale.
Green Self-Identity Scale (GSI) [25]: This scale assesses the extent to which individuals perceive themselves as attentive to sustainable choices. This scale used 3 items (e.g., “I think of myself as a “green consumer”) measured on a 5-point Likert scale from 1 (Completely disagree) to 5 (Completely agree). The Cronbach’s α of the scale was 0.90.
Environmental Self-Efficacy Scale (ESE) [26]: This scale measures the sense of environmental self-efficacy, meaning how much a person believes they can have a positive impact on the environment and solve environmental problems. This scale comprised 10 items (e.g., “I can help mitigate environmental problems in my community if they arise”) measured on a 10-point Likert scale from 1 (Not at all) to 10 (Completely). The Cronbach’s α of the scale was 0.93.
Learned helplessness attributional scale (LHAS) [27]: This scale used 3 items that investigated the dimension of global helplessness, that is, the tendency to believe that problems are caused by factors beyond one’s control (e.g., “In general, if I were to have problems in a situation, it would be because... I find most things difficult”). The items are rated on a 5-point Likert scale from 1 (Completely disagree) to 5 (Completely agree). The Cronbach’s α of the scale was 0.86.
Additionally, a socio-demographic data sheet was included. The collected socio-demographic data covered gender, age, educational level, and occupation.
3.5. Statistical Analyses
Data analysis was conducted using SPSS 28.0 [28] and M-PLUS 8.0 [29] statistical software. After cleaning the data matrix and removing subjects with anomalies, the items were then analyzed by calculating variance, mean, skewness, and kurtosis. Finally, we proceeded first with exploratory factor analysis and then with confirmatory factor analysis.
For the structural validity check, Maximum Robust Likelihood (ML-M) was used, which allows correct estimates to be produced even in the presence of non-normal distributions [30]. The fit indices used include chi-square and degrees of freedom (χ2/df), the Comparative Fit Index (CFI), the Tucker–Lewis Index (TLI), Root Mean Square Error of Approximation (RMSEA), and Standardized Root Mean Square Residual (SRMR). The χ2/df ratio should be between 2 and 5; the CFI and TLI values should exceed 0.90 [31,32]; the RMSEA is considered good if less than 0.05, acceptable if less than 0.08, and fair if less than 0.10 [33]; the SRMR should be less than 0.09 [34]. To assess reliability, internal consistency analysis was used via item covariance, calculating Cronbach’s alpha, where a value above 0.70 is considered necessary for a valid psychological scale [35]. We also calculated the correct correlation between the item score and the total scale score to check internal consistency. Discriminant validity was assessed through Pearson’s correlation analysis (p < 0.05).
4. Results
4.1. Descriptive Analyses
To assess the quality of the items and the presence of dysfunctional or biased items, we calculated the variances, means, skewness, and kurtosis of the 36 scale items. The results shown in Table 1 indicate that the distribution of sample responses is generally normal for all items except for item 4 (skewness = −1.273 and kurtosis = 1.668) and item 6 (skewness = 1.645 and kurtosis = 2.117) of the PEBS scale by Menardo and colleagues [21] and items 5 (skewness = −1.826 and kurtosis = 2.663) and 16 (skewness = −1.503 and kurtosis = 1.573) from of our integration. However, no extreme values of skewness (>3 in absolute value) or kurtosis (>10 in absolute value) were observed, which suggests that the distribution is not severely non-normal [36].

Table 1.
Mean, standard deviations, variance, skewness, kurtosis, corrected correlations, and reliability of the I-PEBS items.
4.2. Exploratory Factor Analysis
An exploratory factor analysis was carried out. Starting from the initial solution (Bartlett’s sphericity test: χ2 (630) = 4718.630 (p ≤ 0.000); Kaiser–Meyer–Olkin: 0.816), items were iteratively removed if they did not have satisfactory saturations on any of the dimensions that emerged or that had high saturations on several factors. This resulted in a solution with 18 items (Cronbach’s α = 0.78) distributed over six factors (Table 2). This final solution (Bartlett’s sphericity test: χ2 (153) = 2892.895 (p ≤ 0.000); Kaiser–Meyer–Olkin: 0.754) explained 53.75% of the total variance. In particular, factor 1 explained 20.11% of the variance, factor 2 explained 10.53%, factor 3 explained 9.32%, factor 4 explained 5.89%, factor 5 explained 4.27%, and factor explained 6 3.62%.
Table 2.
Exploratory factor analysis, item-total correlations, and Cronbach’s α.
4.3. Confirmatory Factor Analysis
The 18-item, six-factor structure was subjected to confirmatory factor analysis and showed satisfactory fit indices [χ2 (df) = 303.742 (120), p ≤ 0.000; χ2/df = 2.53; CFI = 0.934; TLI = 0.916; RMSEA = 0.055 (0.047–0.062); and SRMR = 0.051]. The standardized coefficients of the dimensions are all satisfactory: waste reduction ranges from 0.63 to 0.67; meat consumption ranges from 0.63 to 0.82; vegetable consumption ranges from 0.53 to 0.88; environmental activism ranges from 0.45 to 0.81; sustainable clothing ranges from 0.75 to 0.78; separate collection ranges from 0.56 to 0.97. In addition, a second-order CFA was also performed to verify the convergence of the six dimensions with the more general construct of pro-environmental behaviour. The fit indices were also found to be satisfactory [χ2 (df) = 362.871 (129), p ≤ 0.000; χ2/df = 2.53; CFI = 0.916; TLI = 0.900; RMSEA = 0.060 (0.052–0.067); and SRMR = 0.064]. The final scale in Italian and an ad hoc English translation are presented in Appendix A.
4.4. Construct Validity
To test the discriminant validity of the instrument, a correlation analysis was carried out between the six dimensions of the I-PEBS and the Green Self-Identity, Environmental Self-Efficacy, and Global Learned helplessness scales. The results of the correlation analyses show that the dimensions of the Integrated Pro-Environmental Behaviours Scale are significantly correlated with each other; exceptions are the correlation between environmental activism and meat consumption, meat consumption and sustainable clothing, and environmental activism and recycling. Furthermore, the I-PEBS is positively correlated with Green Self-Identity and Environmental Self-Efficacy, while it is not correlated with Global Learned Helplessness (Table 3).
Table 3.
Correlational analysis for construct validity.
5. Discussion
Climate change is one of the most pressing threats to human health in the 21st century, and the scientific community has a moral obligation to make its own contribution on the subject and inform the public about the risks they are facing [37]. In psychology, research on this topic still appears to be limited, both with regard to the psychological effects of climate change [38] and the tools at our disposal to encourage behavioural change and guide the population towards ecological and environmentally friendly ways of acting [5]. Although scientific research increasingly highlights the crucial role of unsustainable individual behaviours in generating environmental problems, efforts to raise public awareness currently remain inadequate and fragmented [39]. This situation calls for a radical change in people’s habits towards more sustainable lifestyles [5].
To advance psychological research on climate change, it is necessary to be able to measure the behaviours that have an impact on the environment that individuals implement. In everyday life, people engage in behaviours that have an impact on the environment, often wasting valuable resources, meaning that changing these behaviours could allow for greater environmental sustainability [40]. For this reason, the possibility of measuring the extent to which an individual’s actions are pro-environmental or, on the contrary, detrimental to the environment appears to be of primary importance.
Starting from this need, we decided to propose an integration of what is currently the most complete scale in the literature for measuring pro-environmental behaviour, i.e., the PEBS scale. Specifically, we aimed to overcome the limitations of this scale in order to generate a more useful and accessible tool for researchers who are beginning to study this topic. The scale we proposed has several advantages: it presents the same response alternatives for all items, covers a wide range of pro-environmental behaviours, and presents a reduced number of items.
The results of the descriptive analyses indicated that the distribution of responses across the 36 items is generally normal, with skewness and kurtosis values within acceptable limits. However, some exceptions were observed, specifically for items 4 and 6 from the original PEBS scale, as well as items 5 and 16 from the authors’ integration, which displayed moderate skewness and kurtosis. Despite these deviations, the overall distribution is not severely non-normal.
The exploratory factor analysis provided strong support for the multidimensional structure of the Integrated Pro-Environmental Behaviours Scale (I-PEBS). The final solution comprised 18 items distributed across six factors, each demonstrating adequate internal consistency (Cronbach’s alpha ranging from 0.70 to 0.80). These factors collectively explained 53.75% of the total variance, with Factor 1 (reducing waste) accounting for the largest proportion (20.11%). The satisfactory factor loadings and internal reliability suggested that the scale effectively captures the different dimensions of pro-environmental behaviours.
The confirmatory factor analysis (CFA) further corroborated the validity of the six-factor structure. The model exhibited satisfactory fit indices (e.g., CFI = 0.934, RMSEA = 0.055, and SRMR = 0.051), reinforcing the appropriateness of the identified dimensions. Additionally, the second-order CFA confirmed the convergence of these six dimensions into a broader construct of pro-environmental behaviour, with fit indices remaining within acceptable thresholds. These findings substantiate the structural validity of the I-PEBS, suggesting that it is a robust measure for assessing pro-environmental behaviours.
The dimensions identified through factor analyses are as follows: reducing waste (5 items), which assesses behaviours implemented by individuals that allow them to protect the environment by avoiding unnecessary waste, such as preferring reusable products over disposable ones; meat consumption (3 items), which measures the frequency of consumption of different types of meat; vegetable consumption (3 items), which measures the consumption of seasonal, local, and organic vegetable products; environmental activism (3 items), which assesses personal commitment and interest in environmental issues; sustainable clothing (2 items), measuring the recycling of clothes and the purchase of second-hand clothes; recycling (2 items), evaluating individual recycling behaviour.
The construct validity analysis provided further evidence of the scale’s relevance. The dimensions of the I-PEBS were significantly correlated, except for some weak or non-significant relationships (i.e., between environmental activism and meat consumption, meat consumption and sustainable clothing, and environmental activism and separate waste collection). The absence of a significant correlation with Global Learned Helplessness further supports the discriminant validity of the instrument, demonstrating that pro-environmental behaviours are distinct from generalized perceptions of helplessness.
6. Conclusions
The present research contributes to the literature on measuring pro-environmental behaviours through the development and validation of the I-PEBS, offering a multidimensional, concise, and user-friendly tool. The I-PEBS represents a step forward in measuring and understanding pro-environmental behaviours.
While this scale offers the advantage of being agile and readily usable, a trade-off is its limited ability to encompass the full spectrum of climate-relevant individual behaviours.
Furthermore, since what can be labelled as “pro-environmental” may change over time due to the advent of new technologies and societal changes (e.g., the spread of the fast fashion industry), new additions to the existing scale may be necessary in the future. In particular, one limitation of the final version of the I-PEBS is the absence of items investigating the transportation category [41,42]. While this category was originally present in Menardo’s PEBS scale [21], the items related to it were eliminated during the exploratory factor analysis. This is likely due to the fact the sample used in our study does not perceive the use of public transportation as a real choice, given that in Southern Italy—where the sample was drawn from—the public transport system is not particularly efficient [43].
Moreover, our study is limited by its use of a convenience sample with snowball sampling, which could therefore be affected by the specificities of the socio-cultural context within which it was conducted. A larger and more varied number of participants in terms of geographic origin would certainly overcome this limitation.
To enhance the scientific and applied value of the I-PEBS, future research directions could include cross-cultural validation by testing the scale in different contexts to verify its validity and applicability across various cultures. It would also be valuable to combine I-PEBS responses with observable behavioural measures, such as dietary habits or sustainable consumption choices. Another promising research avenue could explore the psycho-social variables that predict the enactment of pro-environmental behaviours included in the I-PEBS.
The I-PEBS also has important practical implications, with the potential to influence behavioural change at multiple levels. At the global level, data collected through I-PEBS administration can support the development of more targeted and evidence-based environmental policies, helping policymakers identify critical intervention areas and assess the effectiveness of environmental initiatives. At the national level, the scale can be used to design educational programs and awareness campaigns tailored to the specific needs of different populations. At the local level, the I-PEBS can be employed to monitor changes in pro-environmental behaviours before and after the implementation of interventions, providing useful data for their optimization.
In conclusion, the I-PEBS aims to be an effective and efficient tool for measuring key climate change-related individual behaviour. It is a short instrument that presents easy-to-interpret response alternatives and therefore makes the dissemination of results more immediate. Through its application, it will be possible to foster environmental awareness and promote concrete actions to address climate change.
Author Contributions
Conceptualization, A.R.D., D.C., C.C., M.C. and R.P.; methodology, A.R.D. and C.C.; software, A.R.D. and C.C.; validation, A.R.D. and C.C.; formal analysis, A.R.D. and C.C.; investigation, C.C., M.C. and R.P.; data curation, C.C., M.C. and R.P.; writing—original draft preparation, A.R.D. and C.C.; writing—review and editing, A.R.D., D.C., C.C., R.P. and M.C.; visualization, A.R.D. and C.C.; supervision, A.R.D.; project administration, A.R.D. and D.C. All authors have read and agreed to the published version of the manuscript.
Funding
This research received no external funding.
Institutional Review Board Statement
The study was conducted in accordance with the Declaration of Helsinki and approved by the Ethics Committee of the University of Naples Federico II (prot. 39/2023 of 31 January 2024).
Informed Consent Statement
Informed consent was obtained from all subjects involved in the study.
Data Availability Statement
Due to privacy restrictions, the data presented in this study are available from the corresponding author upon request.
Conflicts of Interest
The authors declare no conflicts of interest.
Appendix A
The following is the final 18-item Integrated Pro-Environmental Behaviours Scale (I-PEBS). The scale was administered and validated in Italian. An ad hoc English translation is still provided.
| Italian Version | English Translation | |
| Quanto spesso metti in atto ciascuno dei comportamenti indicati: | How often do you perform each of the indicated behaviours: | |
| F1 | Riduzione degli sprechi | Reducing waste |
| N_Pebs21 | Riciclare i rifiuti speciali (ad es., pile, oli esausti, farmaci). | Recycling special waste (e.g., batteries, waste oil, and medications). |
| N_Pebs20 | Riciclare i capi di abbigliamento, depositandoli negli appositi contenitori. | Recycling clothes by depositing them in the appropriate containers. |
| N_Pebs19 | Utilizzare la shopping bag (borse per la spesa riutilizzabili) quando si fanno compere. | Using shopping bags (reusable shopping bags) when shopping. |
| N_Pebs18 | Mangiare il cibo avanzato dal/i giorno/i prima. | Eating leftover food from the previous day(s). |
| N_Pebs12 | Preferire prodotti riutilizzabili rispetto a quelli usa e getta (ad es., borraccia, cannucce e buste riutilizzabili, contenitori in vetro, ecc.). | Preferring reusable products over disposable ones (e.g., water bottles, reusable straws and bags, glass containers, etc.). |
| F2 | Consumo di carne | Meat consumption |
| M_Pebs10 | Mangiare carne bovina (ad es. bistecca di manzo, hamburger di manzo). | Eating beef (e.g., beef steak and beef burger). |
| M_Pebs11 | Mangiare carne suina (ad es. costine di maiale, salsiccia di maiale). | Eating pork (e.g., pork ribs and pork sausage). |
| M_Pebs12 | Mangiare carne avicola (ad es. coscia di pollo, petto di tacchino). | Eating poultry (e.g., chicken leg and turkey breast). |
| F3 | Consumo di verdure | Vegetable consumption |
| N_Pebs1 | Comprare prodotti alimentari vegetali locali. | Purchasing local plant food products. |
| N_Pebs2 | Comprare prodotti alimentari vegetali di stagione. | Purchasing vegetable food products in season. |
| M_Pebs9 | Consumare frutta e verdura coltivata biologicamente. | Consuming organically grown fruits and vegetables. |
| F4 | Attivismo ambientalista | Environmental activism |
| M_Pebs6 | Contribuire finanziariamente a qualche gruppo ambientalista, di conservazione o di protezione della fauna selvatica. | Contributing financially to some environmental, conservation, or wildlife groups. |
| M_Pebs5 | Partecipare ad iniziative o eventi organizzati da gruppi ambientalisti, di conservazione o di protezione della fauna selvatica. | Participating in initiatives or events organized by environmental, conservation, or wildlife groups. |
| M_Pebs7 | Guardare programmi televisivi, film o video su Internet riguardanti questioni ambientali. | Watching TV programmes, films, or videos on the Internet about environmental issues. |
| F5 | Abbigliamento sostenibile | Sustainable clothing |
| N_Pebs15 | Utilizzare applicazioni, come Vinted, per il riciclo di abiti che non si utilizzano più. | Using applications, such as Vinted, to recycle clothes you no longer use. |
| N_Pebs6 | Acquistare capid’abbigliamento di seconda mano (ad es., attraverso Vinted, mercati, negozi vintage, ecc.). | Purchasing second-hand clothes (e.g., through Vinted, markets, vintage shops, etc.). |
| F6 | Raccolta differenziata | Recycling |
| N_Pebs11 | Gettare tutti i rifiuti indistintamente nell’indifferenziato. | Throwing all rubbish indiscriminately into the undifferentiated bin. |
| N_Pebs5 | Fare la raccolta differenziata. | Sorting the waste. |
| Note: The abbreviation M_Pebs refers to items from the Italian version of the Pro-Environmental Behaviours Scale by Menardo and colleagues [21]. The abbreviation N_Pebs refers to items developed ad hoc by the authors. | ||
References
- World Health Organization (WHO). Climate Change and Health. Available online: https://www.who.int/news-room/fact-sheets/detail/climate-change-and-health (accessed on 18 December 2024).
- Shukla, P.R.; Skea, J.; Slade, R.; Al Khourdajie, A.; Van Diemen, R.; McCollum, D.; Malley, J. Climate Change 2022: Mitigation of Climate Change. Contribution of Working Group III to the Sixth Assessment Report of the Intergovernmental Panel on Climate Change; Cambridge University Press: Cambridge, UK, 2022; Volume 10, ISBN 9781009157926. [Google Scholar]
- Celik, S. The Effects of Climate Change on Human Behaviors. Environ. Clim. Plant Veg. Growth 2020, 577, 577–589. [Google Scholar]
- Intergovernmental Science-Policy Platform on Biodiversity and Ecosystem Services (IPBES). Summary for Policymakers of the Global Assessment Report on Biodiversity and Ecosystem Services; IPBES Secretariat: Bonn, Germany, 2019; ISBN 978-3-947851-13-3. [Google Scholar]
- Grilli, G.; Curtis, J. Encouraging Pro-Environmental Behaviours: A Review of Methods and Approaches. Renew. Sustain. Energy Rev. 2021, 135, 110039. [Google Scholar] [CrossRef]
- Gallo, M.; Marinelli, M. Sustainable Mobility: A Review of Possible Actions and Policies. Sustainability 2020, 12, 7499. [Google Scholar] [CrossRef]
- Schill, C.; Anderies, J.M.; Lindahl, T.; Folke, C.; Polasky, S.; Cárdenas, J.C.; Schlüter, M. A More Dynamic Understanding of Human Behaviour for the Anthropocene. Nat. Sustain. 2019, 2, 1075–1082. [Google Scholar] [CrossRef]
- Niinimäki, K.; Peters, G.; Dahlbo, H.; Perry, P.; Rissanen, T.; Gwilt, A. The Environmental Price of Fast Fashion. Nat. Rev. Earth Environ. 2020, 1, 189–200. [Google Scholar] [CrossRef]
- Alsheyab, M.A.T. Recycling of Construction and Demolition Waste and Its Impact on Climate Change and Sustainable Development. Int. J. Environ. Sci. Technol. 2022, 19, 2129–2138. [Google Scholar] [CrossRef]
- Capasso, M.; Guidetti, M.; Bianchi, M.; Cavazza, N.; Caso, D. Enhancing intentions to reduce meat consumption: An experiment comparing the role of self-and social pro-environmental identities. J. Environ. Psychol. 2025, 101, 102494. [Google Scholar] [CrossRef]
- Lange, F. Behavioral Paradigms for Studying Pro-Environmental Behavior: A Systematic Review. Behav. Res. 2022, 55, 600–622. [Google Scholar] [CrossRef]
- Lange, F.; Dewitte, S. Measuring Pro-Environmental Behavior: Review and Recommendations. J. Environ. Psychol. 2019, 63, 92–100. [Google Scholar] [CrossRef]
- Stern, P.C. Toward a Coherent Theory of Environmentally Significant Behavior. J. Soc. Issues 2000, 56, 407–424. [Google Scholar] [CrossRef]
- Deltomme, B.; Gorissen, K.; Weijters, B. Measuring Pro-Environmental Behavior: Convergent Validity, Internal Consistency, and Respondent Experience of Existing Instruments. Sustainability 2023, 15, 14484. [Google Scholar] [CrossRef]
- Kaiser, F.G. A General Measure of Ecological Behavior 1. J. Appl. Soc. Pyschol. 1998, 28, 395–422. [Google Scholar] [CrossRef]
- Pasquariello, R.; Bianchi, M.; Mari, F.; Caso, D. Fostering local seasonality: An extended value-belief-norm model to understand sustainable food choices. Food Qual. Prefer. 2024, 120, 105248. [Google Scholar] [CrossRef]
- Armel, K.C.; Yan, K.; Todd, A.; Robinson, T.N. The Stanford Climate Change Behavior Survey (SCCBS): Assessing Greenhouse Gas Emissions-Related Behaviors in Individuals and Populations. Clim. Chang. 2011, 109, 671–694. [Google Scholar] [CrossRef]
- Tabi, A. Does Pro-Environmental Behaviour Affect Carbon Emissions? Energy Policy 2013, 63, 972–981. [Google Scholar] [CrossRef]
- Markle, G.L. Pro-Environmental Behavior: Does It Matter How It’s Measured? Development and Validation of the Pro-Environmental Behavior Scale (PEBS). Hum. Ecol. 2013, 41, 905–914. [Google Scholar] [CrossRef]
- Zhang, Z.; Malik, M.Z.; Khan, A.; Ali, N.; Malik, S.; Bilal, M. Environmental Impacts of Hazardous Waste, and Management Strategies to Reconcile Circular Economy and Eco-Sustainability. Sci. Total Environ. 2022, 807, 150856. [Google Scholar] [CrossRef]
- Menardo, E.; Brondino, M.; Pasini, M. Adaptation and Psychometric Properties of the Italian Version of the Pro-Environmental Behaviours Scale (PEBS). Environ. Dev. Sustain. 2020, 22, 6907–6930. [Google Scholar] [CrossRef]
- Gray, D.E. Doing Research in the Real World, 4th ed.; SAGE Publications: London, UK, 2021; pp. 1–100. [Google Scholar]
- Singh, S.; Khanwani, G. Environmental Concerns, Communal Orientation, and Environmental Self-Efficacy as Predictors of Ecologically Conscious Consumer Behaviour among Young Adults. IOP Conf. Ser. Earth Environ. Sci. 2023, 1279, 012030. [Google Scholar] [CrossRef]
- Zheng, Q.; Wang, W. The Relationship between the Digital Divide and the Well-Being of Older Adults: The Mediating Role of Learned Helplessness and the Moderating Role of Growth Mindset. Curr. Psychol. 2024, 43, 21547–21556. [Google Scholar] [CrossRef]
- Carfora, V.; Cavallo, C.; Caso, D.; Del Giudice, T.; De Devitiis, B.; Viscecchia, R.; Cicia, G. Explaining Consumer Purchase Behavior for Organic Milk: Including Trust and Green Self-Identity within the Theory of Planned Behavior. Food Qual. Prefer. 2019, 76, 1–9. [Google Scholar] [CrossRef]
- Moeller, B.L.; Stahlmann, A.G. Which Character Strengths Are Focused on the Well-Being of Others? Development and Initial Validation of the Environmental Self-Efficacy Scale: Assessing Confidence in Overcoming Barriers to Pro-Environmental Behavior. J. Well-Being Assess. 2019, 3, 123–135. [Google Scholar] [CrossRef]
- Luse, A.; Burkman, J. Learned Helplessness Attributional Scale (LHAS): Development and Validation of an Attributional Style Measure. J. Bus. Res. 2022, 151, 623–634. [Google Scholar] [CrossRef]
- IBM. What’s New in SPSS Statistics 28; IBM Corporation: Armonk, NY, USA, 2021. [Google Scholar]
- Muthén, L.K.; Muthén, B.O. Mplus User’s Guide: Statistical Analysis with Latent Variables; Muthén & Muthén: Los Angeles, CA, USA, 2010. [Google Scholar]
- Satorra, A.; Bentler, P.M. Corrections to Test Statistics and Standard Errors in Covariance Structure Analysis. Sociol. Methodol. 1994, 24, 239–255. [Google Scholar]
- McDonald, R.P.; Ho, M.-H.R. Principles and Practice in Reporting Structural Equation Analyses. Psychol. Methods 2002, 7, 64–82. [Google Scholar] [CrossRef] [PubMed]
- Hu, L.; Bentler, P.M. Cutoff Criteria for Fit Indexes in Covariance Structure Analysis: Conventional Criteria versus New Alternatives. Struct. Equ. Model. Multidiscip. J. 1999, 6, 1–55. [Google Scholar] [CrossRef]
- Kline, T.J. Psychological Testing: A Practical Approach to Design and Evaluation; Sage Publications: Thousand Oaks, CA, USA, 2005. [Google Scholar]
- Bentler, P.M.; Wu, E.J. EQS 6.1 for Windows. Structural Equations Program Manual; Multivariate Software: Encino, CA, USA, 2005. [Google Scholar]
- Nunnally, J.C.; Bernstein, I.H. Psychometric Theory; McGraw-Hill: New York, NY, USA, 1994. [Google Scholar]
- Kline, R.B. Principles and Practice of Structural Equation Modeling; Guilford Publications: New York, NY, USA, 2023. [Google Scholar]
- Ripple, W.J.; Wolf, C.; Newsome, T.M.; Barnard, P.; Moomaw, W.R.; Grandcolas, P. World Scientists’ Warning of a Climate Emergency. BioScience 2020, 70, 8–12. Available online: https://www.jstor.org/stable/26891410 (accessed on 18 December 2024). [CrossRef]
- Rocque, R.J.; Beaudoin, C.; Ndjaboue, R.; Cameron, L.; Poirier-Bergeron, L.; Poulin-Rheault, R.-A.; Fallon, C.; Tricco, A.C.; Witteman, H.O. Health Effects of Climate Change: An Overview of Systematic Reviews. BMJ Open 2021, 11, e046333. [Google Scholar] [CrossRef] [PubMed]
- Moloney, M.E.; Love, T.P. Assessing Online Misogyny: Perspectives from Sociology and Feminist Media Studies. Sociol. Compass 2018, 12, e12577. [Google Scholar] [CrossRef]
- Aarts, H.; Dijksterhuis, A. The Silence of the Library: Environment, Situational Norm, and Social Behavior. J. Pers. Soc. Psychol. 2003, 84, 18–28. [Google Scholar] [CrossRef]
- Bassanelli, S.; Belliato, R.; Bonetti, F.; Vacondio, M.; Gini, F.; Zambotto, L.; Marconi, A. Gamify to Persuade: A Systematic Review of Gamified Sustainable Mobility. Acta Psychol. 2025, 252, 104687. [Google Scholar] [CrossRef] [PubMed]
- Pellegrini, M.; Tagliabue, M. An Overview of Psychological Factors in Mobility Choices: The Impact on Pro-Environmental Behavior. Disc. Sustain. 2024, 5, 161. [Google Scholar] [CrossRef]
- Cartenì, A.; D’Acierno, L.; Gallo, M. A Rational Decision-Making Process with Public Engagement for Designing Public Transport Services: A Real Case Application in Italy. Sustainability 2020, 12, 6303. [Google Scholar] [CrossRef]
Disclaimer/Publisher’s Note: The statements, opinions and data contained in all publications are solely those of the individual author(s) and contributor(s) and not of MDPI and/or the editor(s). MDPI and/or the editor(s) disclaim responsibility for any injury to people or property resulting from any ideas, methods, instructions or products referred to in the content. |
© 2025 by the authors. Licensee MDPI, Basel, Switzerland. This article is an open access article distributed under the terms and conditions of the Creative Commons Attribution (CC BY) license (https://creativecommons.org/licenses/by/4.0/).