Article

Numerical Simulation Study on the Dynamic Diffusion Characteristics of Ammonia Leakage in Ship Engine Room

Marine Engineering College, Dalian Maritime University, Dalian 116026, China
*
Author to whom correspondence should be addressed.
Sustainability 2025, 17(9), 3826; https://doi.org/10.3390/su17093826
Submission received: 19 March 2025 / Revised: 14 April 2025 / Accepted: 15 April 2025 / Published: 24 April 2025
(This article belongs to the Section Hazards and Sustainability)

Abstract

:
This study established a numerical model for ammonia leakage and diffusion in confined ship engine room spaces and validated its effectiveness through existing experiments. The research revealed the evolution patterns of ammonia cloud dispersion under various working conditions. Multi-parameter coupling analysis demonstrated that the combined effect of leakage source location and obstacle distribution alters the spatial configuration of gas clouds. When leakage jets directly impact obstacles, the resulting vortex structures maximize the coverage area of high-concentration ammonia near the ground. Ventilation system efficiency shows a significant negative correlation with hazardous zone volume. The hazardous zone volume was reduced by 50% when employing a bottom dual-side air intake combined with a top symmetric exhaust scheme, compared to the bottom single-side intake with an opposite-side top exhaust configuration. By enhancing the synergistic effect between longitudinal convection and top suction, harmful gas accumulation in lower spaces was effectively controlled. These findings not only provide a theoretical basis for ventilation system design in ammonia-fueled ships but also offer practical applications for risk prevention and control of maritime ammonia leakage.

1. Introduction

Under the global trend of reducing greenhouse gas emissions, the International Maritime Organization (IMO) has formulated a greenhouse gas reduction strategy for international shipping. It outlines short-term measures to reduce carbon intensity by 40% compared to 2008 levels by 2030 and sets a target of achieving net-zero greenhouse gas emissions by 2050 [1,2,3]. Consequently, the adoption of alternative fuels capable of effectively reducing carbon emissions in maritime applications has come to the forefront [4,5]. Ammonia as a fuel produces no direct carbon emissions at the point of use. Furthermore, green ammonia produced from renewable energy and green hydrogen can achieve net-zero carbon emissions throughout its full life cycle. This enables it to meet even the most stringent long-term emission reduction regulations [5,6,7]. Its compatibility with existing internal combustion engines and retrofitted vessels with minimal modifications highlights its adaptability and technical maturity [8,9]. Mature production systems and well-established port storage/transport infrastructure further ensure a stable fuel supply for fleets [10]. The economic viability concerns associated with using such new fuels can be effectively mitigated through intelligent route planning [11,12]. Additionally, ammonia’s narrow flammability range and high ignition temperature reduce combustion risks, enabling safe large-scale onboard storage. These practical advantages have positioned ammonia as a standout candidate among alternative fuels [13,14,15], making it a preferred choice for new dual-fuel vessel designs. However, real-world operations involving collisions, operational errors, or component failures may lead to ammonia leakage and diffusion within cabin spaces [16]. Ammonia exhibits high toxicity. Exposure to concentrations of 140–210 mg/m3 causes noticeable discomfort, 553 mg/m3 triggers immediate acute symptoms, and concentrations of 3500–7000 mg/m3 can be fatal [17]. In confined cabin environments, improper handling of leakage incidents could severely endanger lives and property [18,19,20]. Therefore, to mitigate accident consequences and enhance safety assurance, systematic research on ammonia dispersion patterns in confined spaces is imperative.
Research on ammonia leakage and dispersion has evolved over decades, forming a methodological framework centered on experimental studies and numerical simulations [21]. Experimental investigations into hazardous gas dispersion primarily include large-scale field experiments and small-scale wind tunnel tests [22]. The former visually demonstrates the physical processes of dispersion dynamics, provides critical data for numerical model development, and enables realistic assessment of accident consequences. For instance, the 1996 European FLADIS project systematically quantified aerosol composition and thermodynamic equilibrium in flashing jet flows through pressurized liquid ammonia releases, revealing the coupling mechanism between near-field dense gas clouds and far-field passive dispersion [23]. Similarly, the Jack Rabbit experiments [24], simulating instantaneous releases of chlorine/ammonia (1–2 tons over 30 s) in depressions, demonstrated that dense gas clouds remained trapped in depressions for 30–60 min under wind speeds below 1.5 m/s. These findings validated Briggs’ theoretical predictions of entrainment duration and served as an analogical basis for predicting toxic zone retention caused by obstacles in other leakage scenarios [25]. The 2022 Red Squirrel Test [26] conducted a comparative study on low-temperature liquid ammonia leakage processes onto concrete surfaces or water bodies. The findings revealed that during low-pressure or non-pressurized leakage scenarios, low-temperature liquid ammonia exhibits significantly smaller dispersion impact ranges compared to high-pressure, ambient-temperature liquid ammonia. This phenomenon is attributed to its lower evaporation rate and reduced vapor density (which results in stronger buoyancy). The results validate the inherent safety advantages of low-temperature liquid ammonia as a storage/transportation medium. The study also employed PHAST (version 8.23) to simulate leakage evaporation and dispersion. Results showed strong agreement between model predictions and experimental data for concrete surface leakage but revealed overestimated concentrations for instantaneous gas clouds generated by water surface leakage, indicating a need for parameter optimization. While these studies provide critical empirical foundations for two-phase flow source term modeling and dispersion dynamics, they also reveal limitations—high costs, the predominant focus on open-field scenarios with unstable environmental parameters, and limited applicability to risk assessments in confined spaces like ship engine rooms.
With the advancement of computational fluid dynamics (CFD) technology, numerical simulation has become a mainstream approach for gas dispersion studies [27,28]. Small-scale wind tunnel experiments offer cost efficiency and stable, controllable conditions [29], making them particularly suitable for validating numerical models, especially those simulating gas dispersion in confined spaces. Wei Tan et al. [30] conducted small-scale wind tunnel experiments in a food processing facility, verifying the accuracy of the steady-state k-ε turbulence model in simulating ammonia dispersion. Their work demonstrated that obstacles significantly alter dispersion pathways. Follow-up simulations [31] revealed that under uniform wind fields in such scenarios, ammonia initially moves upward during leakage, forming high-concentration zones near the central axis. Obstacles modify dispersion trajectories through turbulence enhancement and flow obstruction, leading to localized concentration spikes, while long-range dispersion follows a Gaussian distribution dominated by wind-driven dilution. For ship-specific scenarios, Yadav and Jeong [32] employed CFD to simulate ammonia dispersion behaviors in engine rooms under varying leakage directions and temperature gradients. They analyzed the resulting toxic and flammable zones to assess ammonia’s safety as a marine fuel, emphasizing the need for optimized cabin design and ventilation systems to mitigate crew exposure risks. Xie et al. [33] developed a 1:10 scaled engine room experimental system using helium as a substitute for natural gas in dispersion studies. Their work, combined with CFD simulations, validated the accuracy of the transient realizable k-ε turbulence model in simulating light gas dispersion within engine compartments. The model was further applied to investigate the spatiotemporal distribution patterns of natural gas leakage in full-scale engine rooms, analyzing the effects of leakage volume, temperature, ventilation, and leak location on gas concentration. These experimental and numerical investigations into gas dispersion in confined spaces provide a robust theoretical foundation and practical reference for the model construction and computational methodology adopted in the current study.
Existing studies on ammonia leakage and dispersion in confined spaces primarily focus on consequence assessment and mitigation guidance. While considerations of leakage direction or temperature exist, there remains a gap in understanding the influence of other factors on the evolution of dispersion processes. This study addresses this by establishing a corresponding model based on the spatial characteristics of large ship engine rooms. Utilizing computational fluid dynamics (CFD) methods, it investigates the impacts of relative leakage locations, ventilation rates, and leakage rates on ammonia dispersion dynamics, supported by multi-factor coupling analysis. Ventilation configurations were systematically adjusted, and enhanced ventilation rates (closer to real-world operational conditions) were simulated to evaluate the efficacy of different layouts. The findings provide a reliable modeling framework for predicting ammonia dispersion consequences in shipboard environments and establish a theoretical foundation for formulating emergency response protocols.

2. Numerical Model

2.1. Mathematical Model

The mathematical models used in numerical simulation studies of gas jets and diffusion primarily consist of governing equations and turbulence models. The specific components of these models are outlined as follows:
(1)
Continuity Equation
The mass conservation principle governs ammonia dispersion dynamics. This equation states that the rate of mass accumulation within a fluid element equals the net mass inflow during the same period. The continuity equation is expressed as follows:
ρ t + d i v ( ρ u ) = 0
(2)
Momentum Conservation Equations
The rate of momentum change in a fluid element equals the sum of external forces acting on it. The momentum conservation equations in the x, y, and z directions are formulated as follows:
( ρ u ) t + d i v ( ρ u u ) = p x + τ x x x + τ y x y + τ z x z + F x
( ρ v ) t + d i v ( ρ v u ) = p y + τ x y x + τ y y y + τ z y z + F y
( ρ w ) t + d i v ( ρ w u ) = p z + τ x z x + τ y z y + τ z z z + F z
Here, p represents pressure, τxx, τxy, τxz denote components of the viscous stress tensor τ due to molecular viscosity, and Fx, Fy, Fz signify body forces (e.g., buoyancy, gravity) acting on the fluid element.
(3)
Species Transport Equation
The leakage and dispersion process involves a mixture of ammonia, nitrogen, oxygen, and water vapor. Each component adheres to the species mass conservation law, which states that the rate of mass change for a chemical species within a system equals the sum of net diffusive flux through the system boundaries and its production/consumption via chemical reactions. For species s, the equation is expressed as follows:
ρ c s t + d i v ( ρ u c s ) = d i v D s g r a d ( ρ c s ) + S s
The four terms sequentially represent the temporal rate of change, convection term, diffusion term, and reaction source term, where cS is the volume concentration, ρcs denotes mass concentration, DS is the diffusion coefficient, and SS is the production rate of species.
(4)
Energy Equation
ρ E t + d i v v ρ E + p = d i v j h i j i ρ + S h
(5)
Turbulence Model
This study employs the realizable k-ε turbulence model, which enhances turbulent viscosity calculation through dynamic functions, enabling more accurate jet dispersion predictions than the standard k-ε model. Compared to the RNG k-ε model, it simplifies the ε-equation solving process while maintaining computational precision for rotational and shear flows, achieving higher computational efficiency. Its adaptive correction mechanism further renders it particularly suitable for large-scale engineering simulations, aligning with this study’s economic requirements for computational resources. In recent three years, studies by Yuan et al. [34] and Xie et al. [33] have experimentally validated the effectiveness of the realizable k-ε turbulence model in simulating light gas dispersion within similar confined spaces. The governing equations are as follows:
Turbulent Kinetic Energy (k) Transport Equation:
t ρ k + x j ρ k u j = x j u + u t σ k k x j + G k + G b ρ ε
Turbulent Dissipation Rate (ε) Transport Equation:
t ρ ε + x j ρ ε u j = x j u + u t σ ε ε x j + ρ C 1 ε E ε ρ C 2 ε 2 k + v ε + C 1 ε ε k C 3 ε G b
Here:
C 1 = max 0.43 , η η + 5
η = 2 S i j S j i · k ε
S i j = 1 2 u i x j + u j x i
Turbulent Viscosity:
μ t = ρ C μ k 2 ε
The symbols corresponding to the variables in the equations are defined in Table 1.

2.2. Computational Domain and Boundary Conditions

The confined cabin space for ammonia dispersion simulation has geometric dimensions of 18.4 m (L) × 9.6 m (W) × 8 m (H) (Figure 1). A baseline ventilation layout with top-side exhaust and opposite-side lower intake vents was adopted, featuring three uniformly arranged 1 m × 1 m square vents on each side. The vents were appropriately extended to stabilize inflow/outflow air currents. Three distinct leakage points, each 6 cm in diameter, were selected based on their varying relative positions to obstacles and ventilation airflow. Additionally, monitoring point D was established at a height of 6 m above the ground for grid independence verification. The detailed schematic is shown in Figure 1. In this study, each gas component is treated as an ideal gas. Prior to conducting the transient simulation of the ammonia leakage process, a stable wind field is first solved. Through parameter adjustment, the time step is set to 0.05 s. Drawing on the research of Yadav et al. [32], the environmental temperature in the computational model was set to 35 °C. This value was determined through a holistic assessment of equipment heat dissipation, ventilation efficiency, and operational conditions within the enclosed cabin environment. The selected temperature aligns with standard ambient ranges while reflecting typical air temperature levels during moderate-load operations in cabin spaces. Given that this study does not investigate temperature-dependent effects on ammonia dispersion, the thermal parameter was simplified to a constant 35 °C to maintain the stability of other environmental variables. Additional computational configurations are provided in Table 2.

2.3. Grid Independence Verification and Model Validation

This study selected the fluid domain model with an upwind leakage point A for grid independence verification. By adjusting the mesh refinement regions and their intensities, three models with varying mesh qualities were established for validation: Fine (840,627 cells), Medium (688,917 cells), and Coarse (597,453 cells). The general configuration of the refinement regions near the leakage port is shown in Figure 2. Within these regions, the Fine mesh has a grid size of 1~8 cm, while the Coarse and Medium meshes exhibit grid sizes of 2~8 cm.
After comparing the computational results at monitoring point D (Figure 1) across the three mesh generation schemes (Figure 3), the mesh processing approach corresponding to the medium mesh was selected as the reference for this project’s mesh generation and refinement criteria.
This study adopted Wei Tan et al.’s small-scale wind tunnel experiments [30] to validate the numerical model accuracy. The authors of the experiment employed a similarity ratio of 1:40 in their study. They analyzed the similarity conditions for the dimensionless parameters Re, Ri, Pr, Ro, and Ec, concluding that this wind tunnel experiment satisfies the requirements of the similarity criteria. The geometric schematic of the experimental setup is shown in Figure 4. The computational domain measures 1.4 × 0.75 × 0.5 m, with a release rate of 0.9 L/min, wind speed of 1.6 m/s, and ambient temperature maintained at 26 °C. The positions of leakage sources and monitoring points are summarized in Table 3. A geometric model consistent with the experimental setup was established, with boundary conditions configured according to experimental parameters. After obtaining a stable flow field, transient simulation was adopted to replicate the leakage process observed in the experiments. Four monitoring points were selected in three critical regions: near the release source, obstacle zones, and areas distant from the source. Stabilized ammonia concentration values were recorded and compared with experimentally collected data.
Comparative analysis revealed deviations controlled within 5.2~11.8% (Figure 5, Table 4), where numerical results showed an overall underestimation compared to experimental data while maintaining consistent concentration distribution patterns. The results demonstrate that the numerical model performed well in predicting ammonia leakage and dispersion behavior.

3. Results and Discussion

The parameter configurations investigated in Section 3.1, Section 3.2, Section 3.3 and Section 3.4 of this study are summarized in Table 5. According to China Classification Society (CCS) regulations, ship engine compartments must maintain a minimum ventilation capacity of 30 air changes per hour (ACH). In Section 3.4’s ventilation layout study, a 2 m/s airflow velocity was selected to satisfy this requirement. In the analysis of other factors, a lower inlet velocity of 1 m/s was adopted to highlight the influence of these factors on the diffusion process. The selection of leakage rate ranges was informed by relevant studies [32,33,35] within a similar computational domain, where leakage rates were set between 0.05279 and 0.144 kg/s. To further investigate the influence of leakage rates, this study incorporated an additional lower leakage rate value as a comparative case in the analysis.

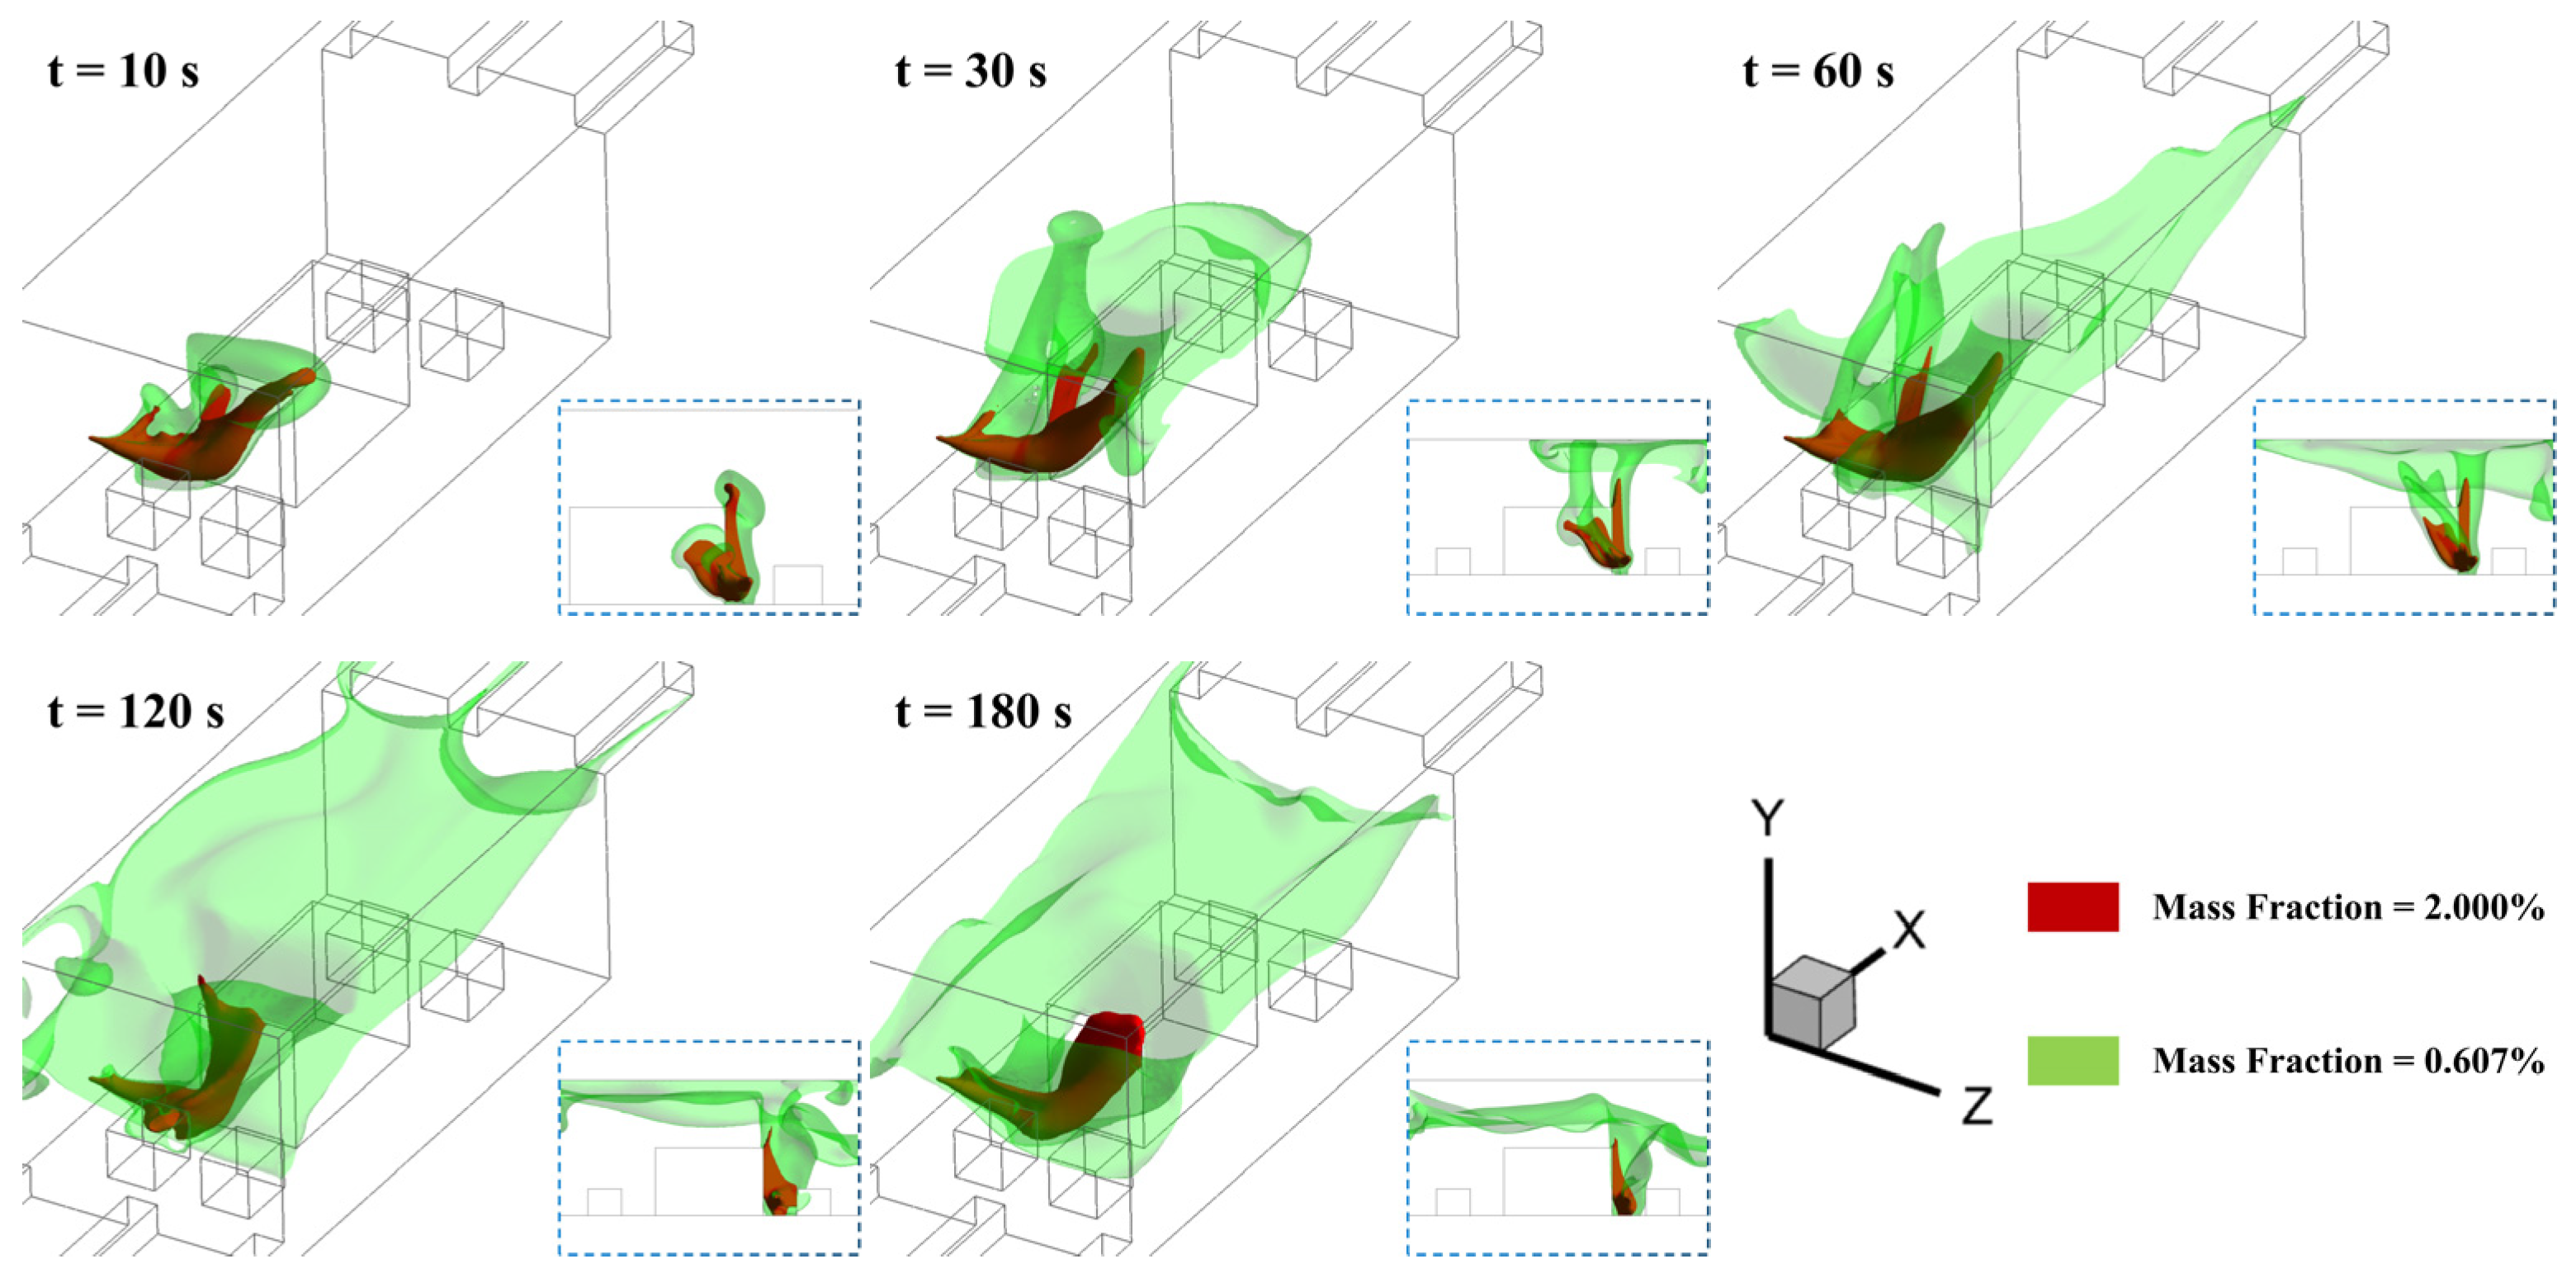
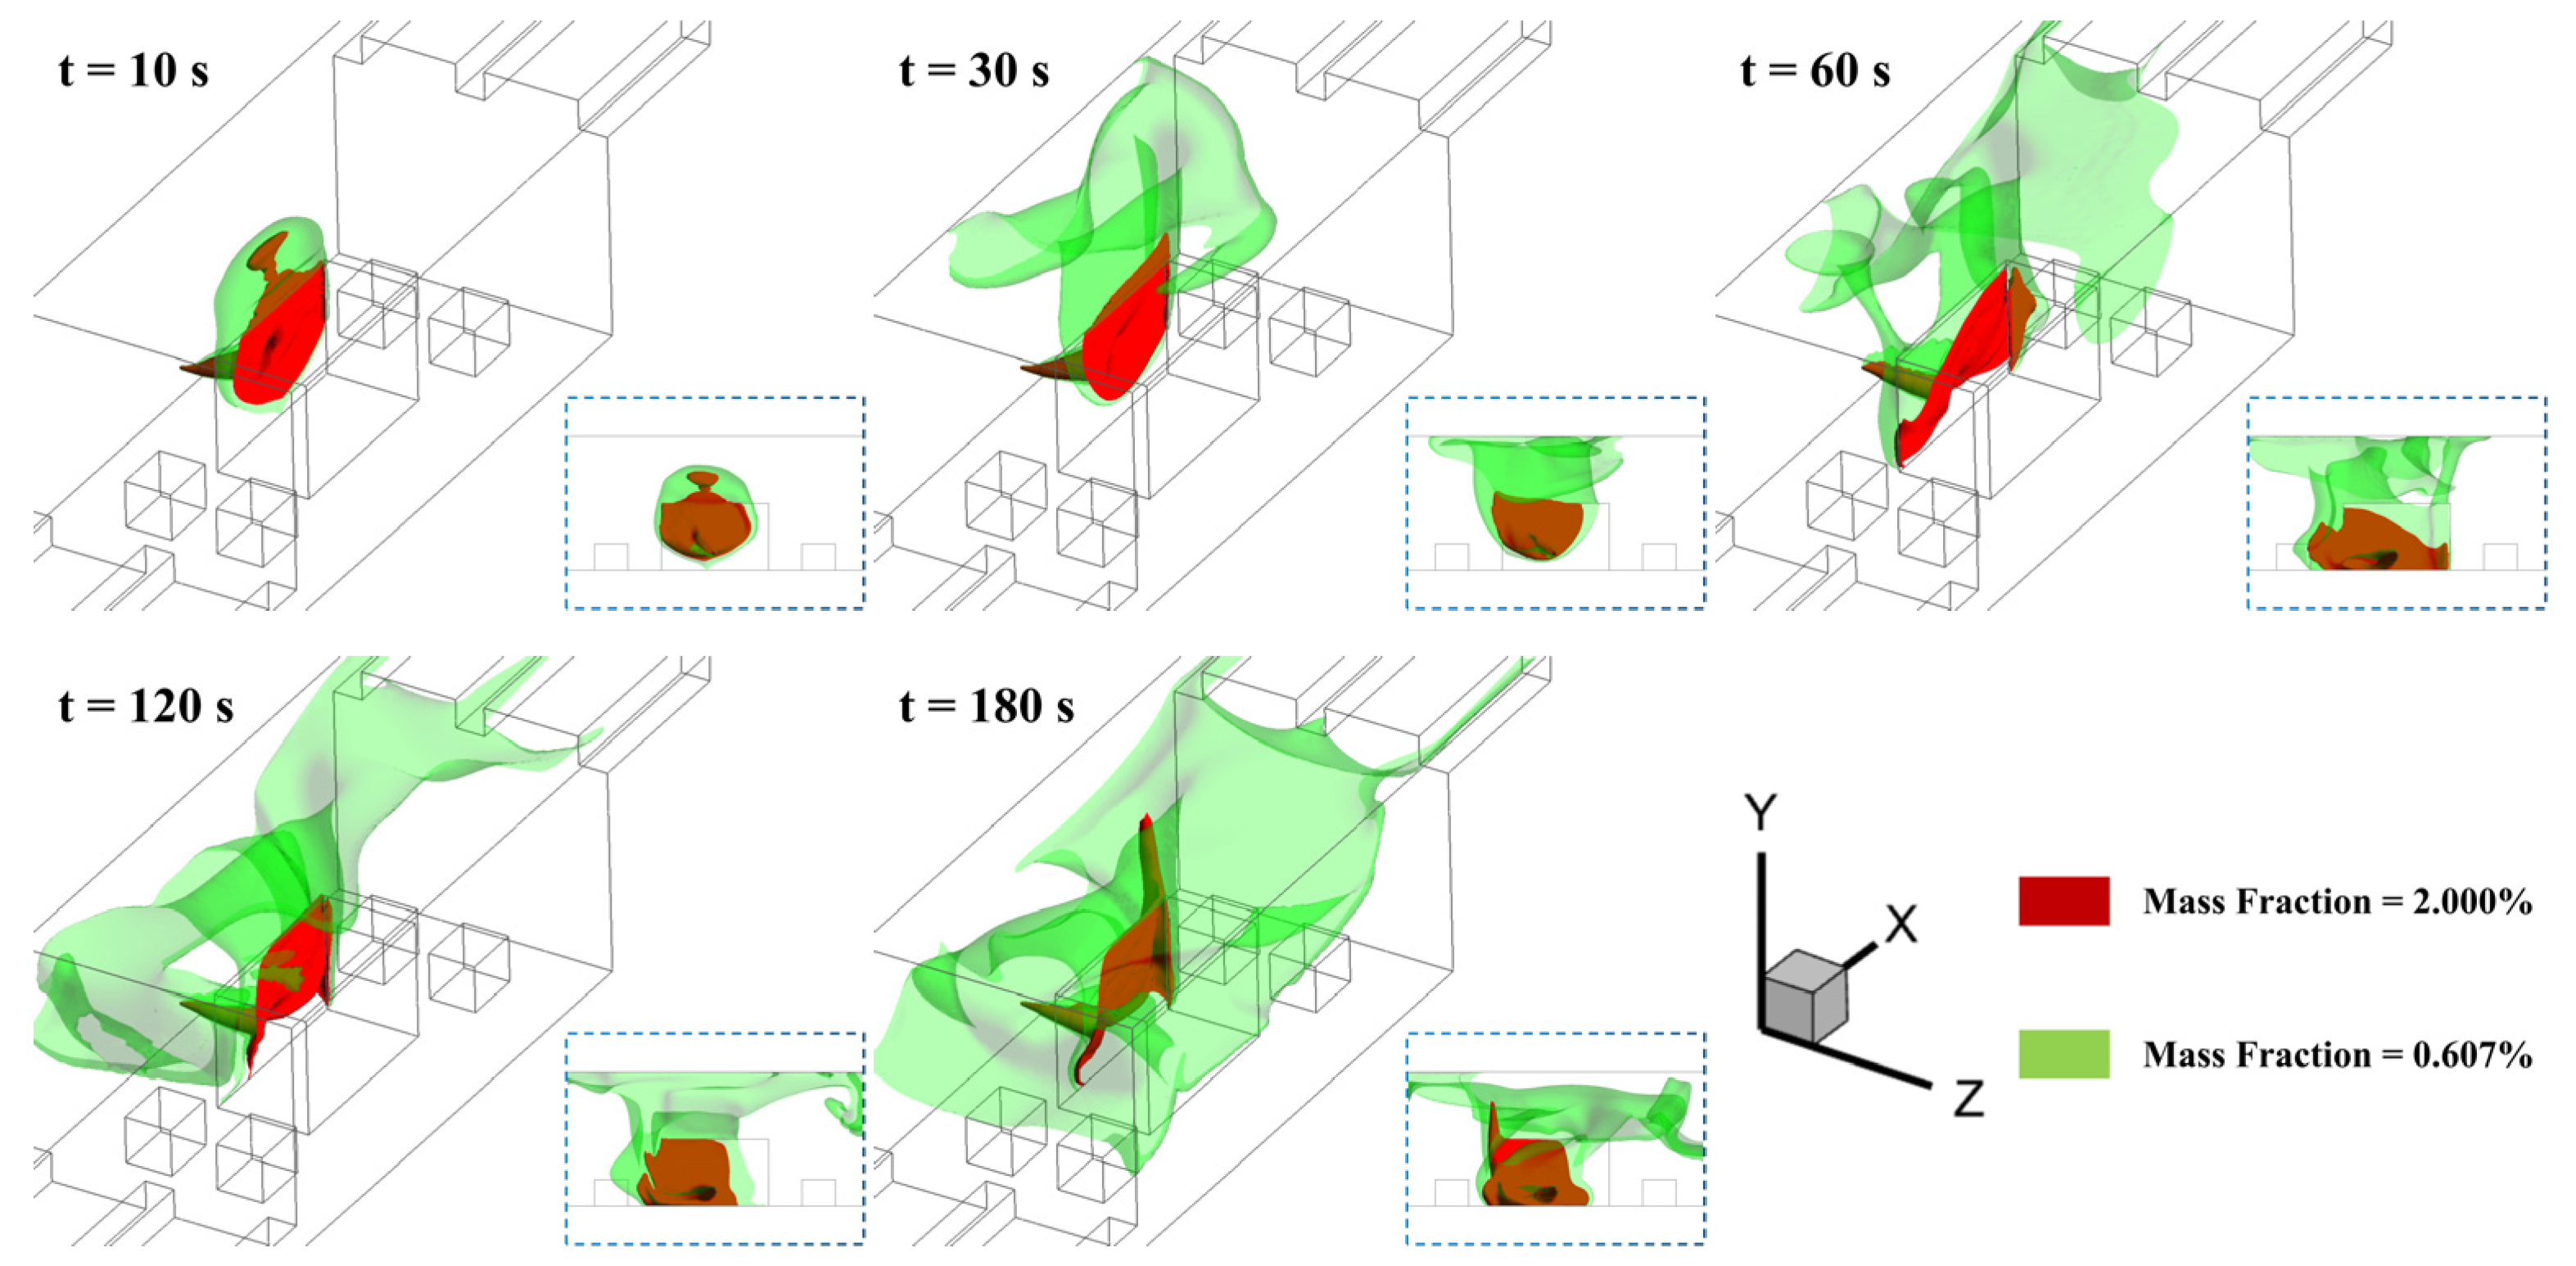
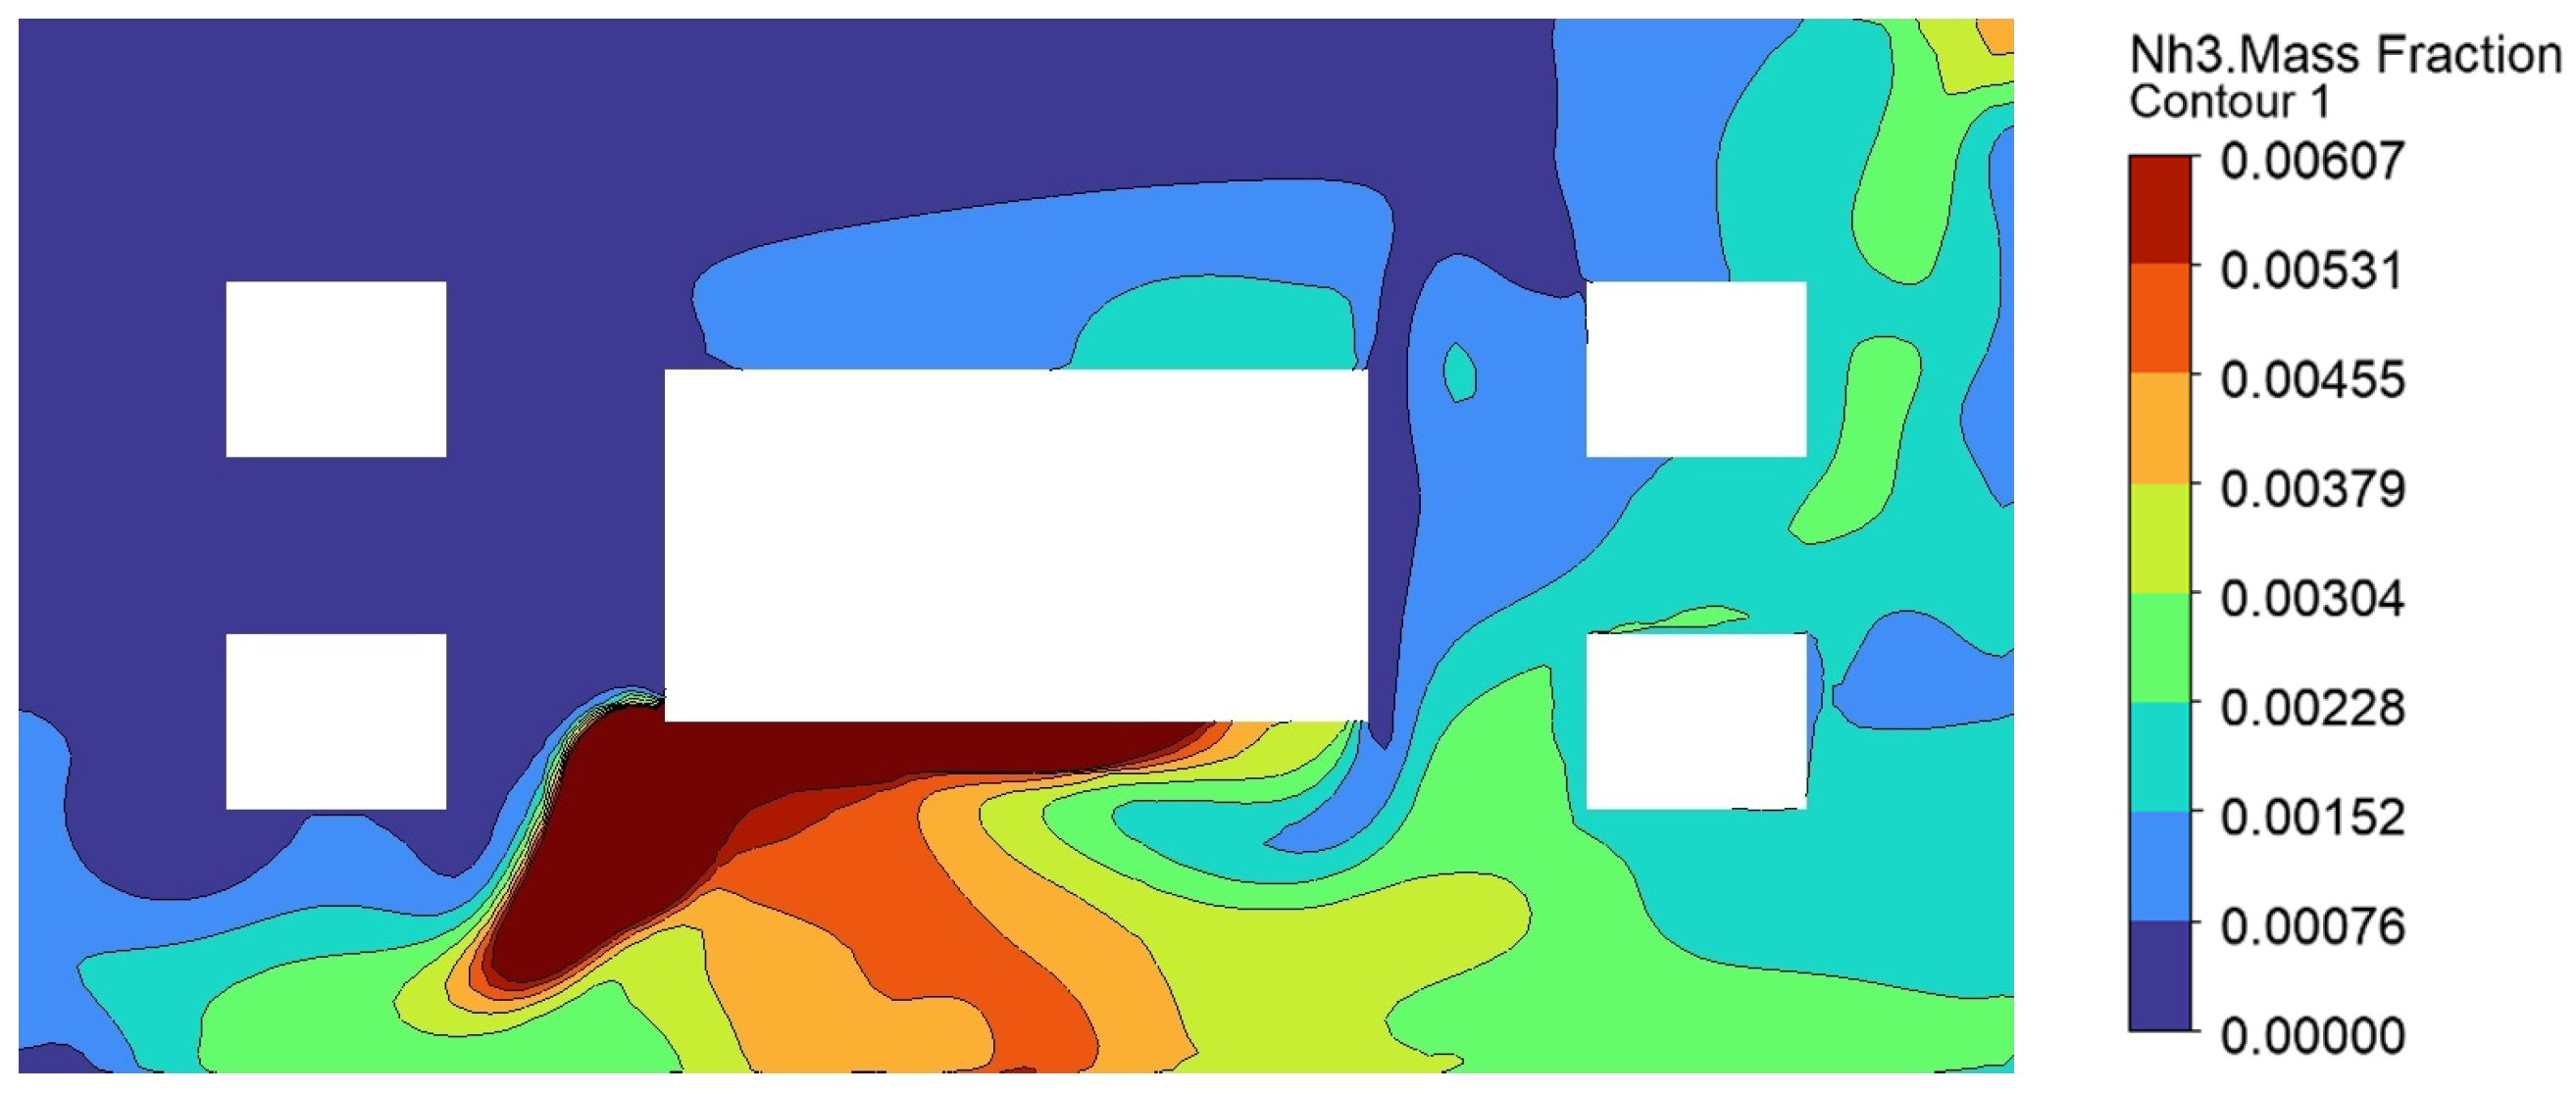
3.1. Effect of Leakage Location

This section aims to demonstrate the evolution characteristics of ammonia cloud dispersion. A lower inlet wind speed of 1 m/s was selected to minimize its impact on the manifestation of dispersion characteristics. The leakage rates at Locations A, B, and C were all set to 0.05 kg/s. According to a document released by the National Health Commission of the PRC, the immediate lethal concentration of ammonia gas ranges from 3500 mg/m3 to 7000 mg/m3 [17]. Exposure to this concentration can result in death within a very short period (potentially within one minute). At 35 °C, the air density is 1.146 kg/m3. The mass fraction of ammonia (ω) in the gas mixture can be approximated in relation to its mass concentration Cmg (mg/m3) as follows:
ω = C mg C m g + 1.146 × 10 6 × 100 %
Therefore, the mass concentrations of 7000 mg/m3 and 3500 mg/m3 correspond to mass fractions of approximately 0.607% and 0.304%, respectively. An isosurface with an ammonia mass fraction of 0.607% was used in the figures to represent the highly hazardous ammonia cloud dispersion zones, while an isosurface with an ammonia mass fraction of 2% was employed to indicate the high-concentration region within the jet core.
The three leakage locations (A, B, and C) differ in their positions relative to the primary ventilation pathway and their surrounding obstacle distributions. Leakage Location A corresponds to a scenario where the leakage port is unobstructed directly ahead and situated along the primary ventilation airflow path. In Figure 6, the motion of the ammonia jet near the leakage point is initially dominated by momentum, exhibiting a relatively horizontal conical dispersion with directional deflection influenced by wind flow. This causes a small portion of the jet to impact the obstacle wall while the remaining portion continues to propagate along the obstacle’s sidewall.
As the initial momentum diminishes, buoyancy gradually becomes dominant. The separated ammonia cloud (split by the obstacle) rapidly ascends, reaching the cabin ceiling within 30 s and spreading laterally. Influenced by the wind field and the ceiling boundary layer, the dispersion rate shows significant anisotropy along the x-axis direction. By 120 s, the main cloud fully occupies the ceiling region and begins to descend under concentration gradient forces. However, its further dispersion slows markedly when crossing the inlet–outlet connection line due to the strong dilution effect of the ventilation airflow. At the 1.5 m height above the floor, the core high-concentration zone accumulates near the windward sidewall of the central obstacle, as shown in Figure 7. Other elevated-concentration areas are distributed upwind of the leakage point, with no immediate lethal concentration zones (hereinafter referred to as ILCZ) observed downwind of the leakage location.
Leakage Location B corresponds to a scenario where the leakage port is obstructed by a frontal obstacle. As shown in Figure 8, prior to impacting the obstacle wall, the ammonia jet motion is dominated by initial momentum and slightly deflected by wind direction, consistent with the behavior observed at Leakage Location A. After impacting the obstacle wall, the main cloud propagates parallel to the wall surface. The upward-moving portion undergoes buoyancy-driven ascent followed by downward dispersion governed by concentration gradients, exhibiting process characteristics similar to those of Leakage Location A.
In Figure 9, the downward-dispersing portion of the jet along the wall initially accumulates in the space between the jet and the floor. As momentum dissipates, the dispersion transitions to a regime dominated by concentration gradients and buoyancy. Compared to Leakage Location A, where a larger fraction of the jet continues upward after wall impact, Leakage Location B delivers less ammonia to the ceiling region within the same timeframe, hindering efficient ammonia removal by exhaust airflow. Additionally, vortex structures induced by jet–wall interaction cause high-concentration ammonia accumulation in near-floor regions near the obstacle, exacerbating accident severity. As evident in Figure 7 and Figure 9, ILCZ at the 1.5 m height for Leakage Location B is significantly larger than that for Location A. This suggests that enhancing upward cloud dispersion while suppressing near-floor accumulation is crucial for improving ventilation efficiency.
Leakage Location C corresponds to a scenario where the jet front is unobstructed and not situated along the primary ventilation airflow path. During the initial leakage phase (t = 10 s), the ascent height of the ammonia cloud is similar to that of Location A, but the overall dispersion extent of the jet is significantly smaller (Figure 10). Subsequently, the dispersion process still follows a pattern dominated first by buoyancy-driven upward motion impacting the ceiling and spreading across the upper space, then gradually descending under concentration gradient forces. However, after reaching the ceiling, the cloud from Location C is closer to the exhaust vent compared to Location A, which facilitates ammonia discharge. Consequently, the volume of the ILCZ at the ceiling is smaller than in Scenario A.
Furthermore, since the initial jet at Location C is less influenced by the near-floor wind field and obstacles compared to Locations A and B, the local turbulence intensity is lower. This reduces disturbances during the upward dispersion process, resulting in less ammonia retention at the bottom and a smaller ILCZ area near the ground. As shown in Figure 11, the lethal concentration zone for Location C forms in a confined space between obstacles ahead of the leakage port. In practical ship cabin environments, obstacles inevitably obstruct localized ventilation. Such scenarios cannot be fully resolved by simply enhancing horizontal airflow. Instead, promoting upward airflow to accelerate cloud dispersion could effectively reduce ammonia concentrations in similar regions.

3.2. Effect of Leakage Rate

Figure 12 illustrates the ammonia dispersion processes under different leakage rates at an inlet wind speed of 1 m/s. During the initial phase (t = 10 s), higher leakage rates result in straighter jet trajectories, with less lateral deflection of the main jet induced by the wind field. However, as dispersion progresses, the deflected jet gradually reorients toward the central axis regardless of the leakage rate. Within the first 10 s, the ascent height of the main cloud remains roughly consistent across leakage rates. When the cloud contacts the ceiling and begins lateral dispersion, higher leakage rates accelerate the occupation of the entire ceiling space, followed by faster downward dispersion driven by concentration gradients.
Figure 13 shows that at a leakage rate of 0.25 kg/s, the hazardous zone expands gradually, with a final volume less than 10% of the total cabin volume, indicating containment within the current ventilation capacity. When the leakage rate increases to 0.5 kg/s, exceeding the ventilation system’s capacity, the hazardous zone volume becomes five times that of the former.
Beyond these general trends, interactions between extreme leakage rates (too low or too high) and wall obstructions introduce additional complexities. For the 0.25 kg/s leakage, the main jet is deflected by ventilation airflow to the left side of the central obstacle. Wall interactions slightly advance its transition to a buoyancy-dominated dispersion phase. Due to the low leakage rate and the small angle between the jet flow direction and the wall surface, no extensive high-concentration accumulation forms between the jet and the floor, unlike the patterns observed at Leakage Location B.

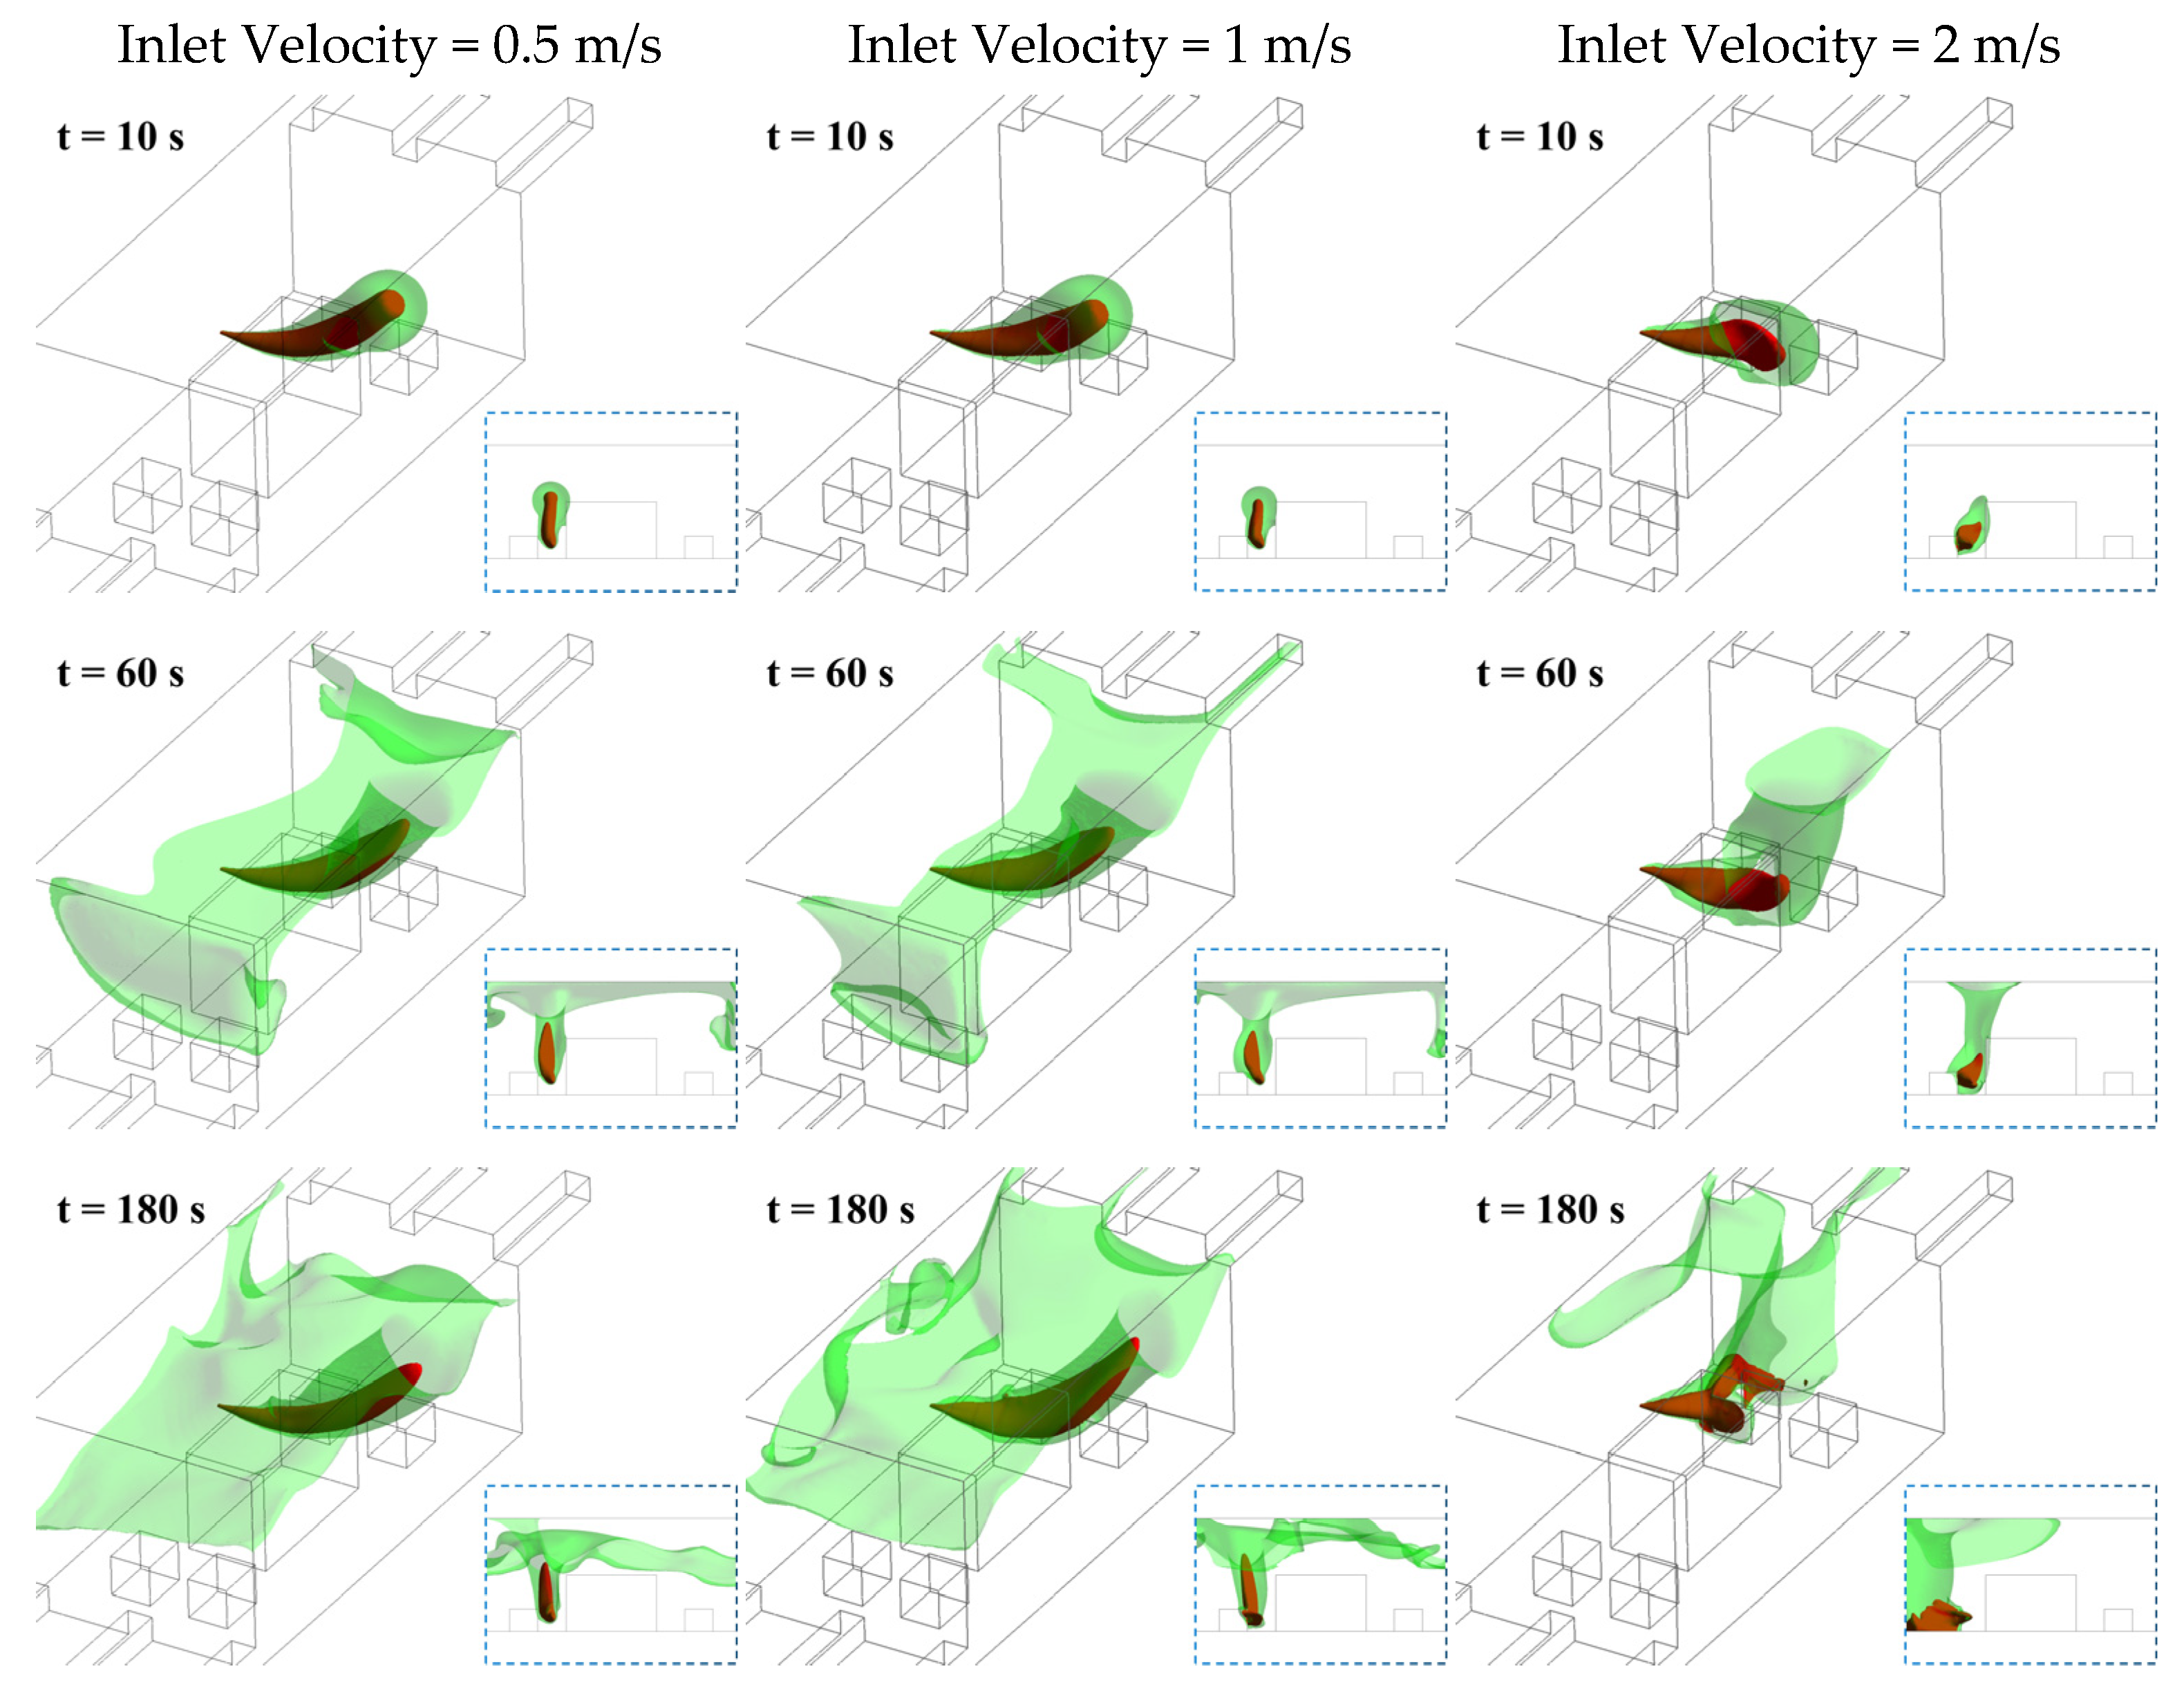
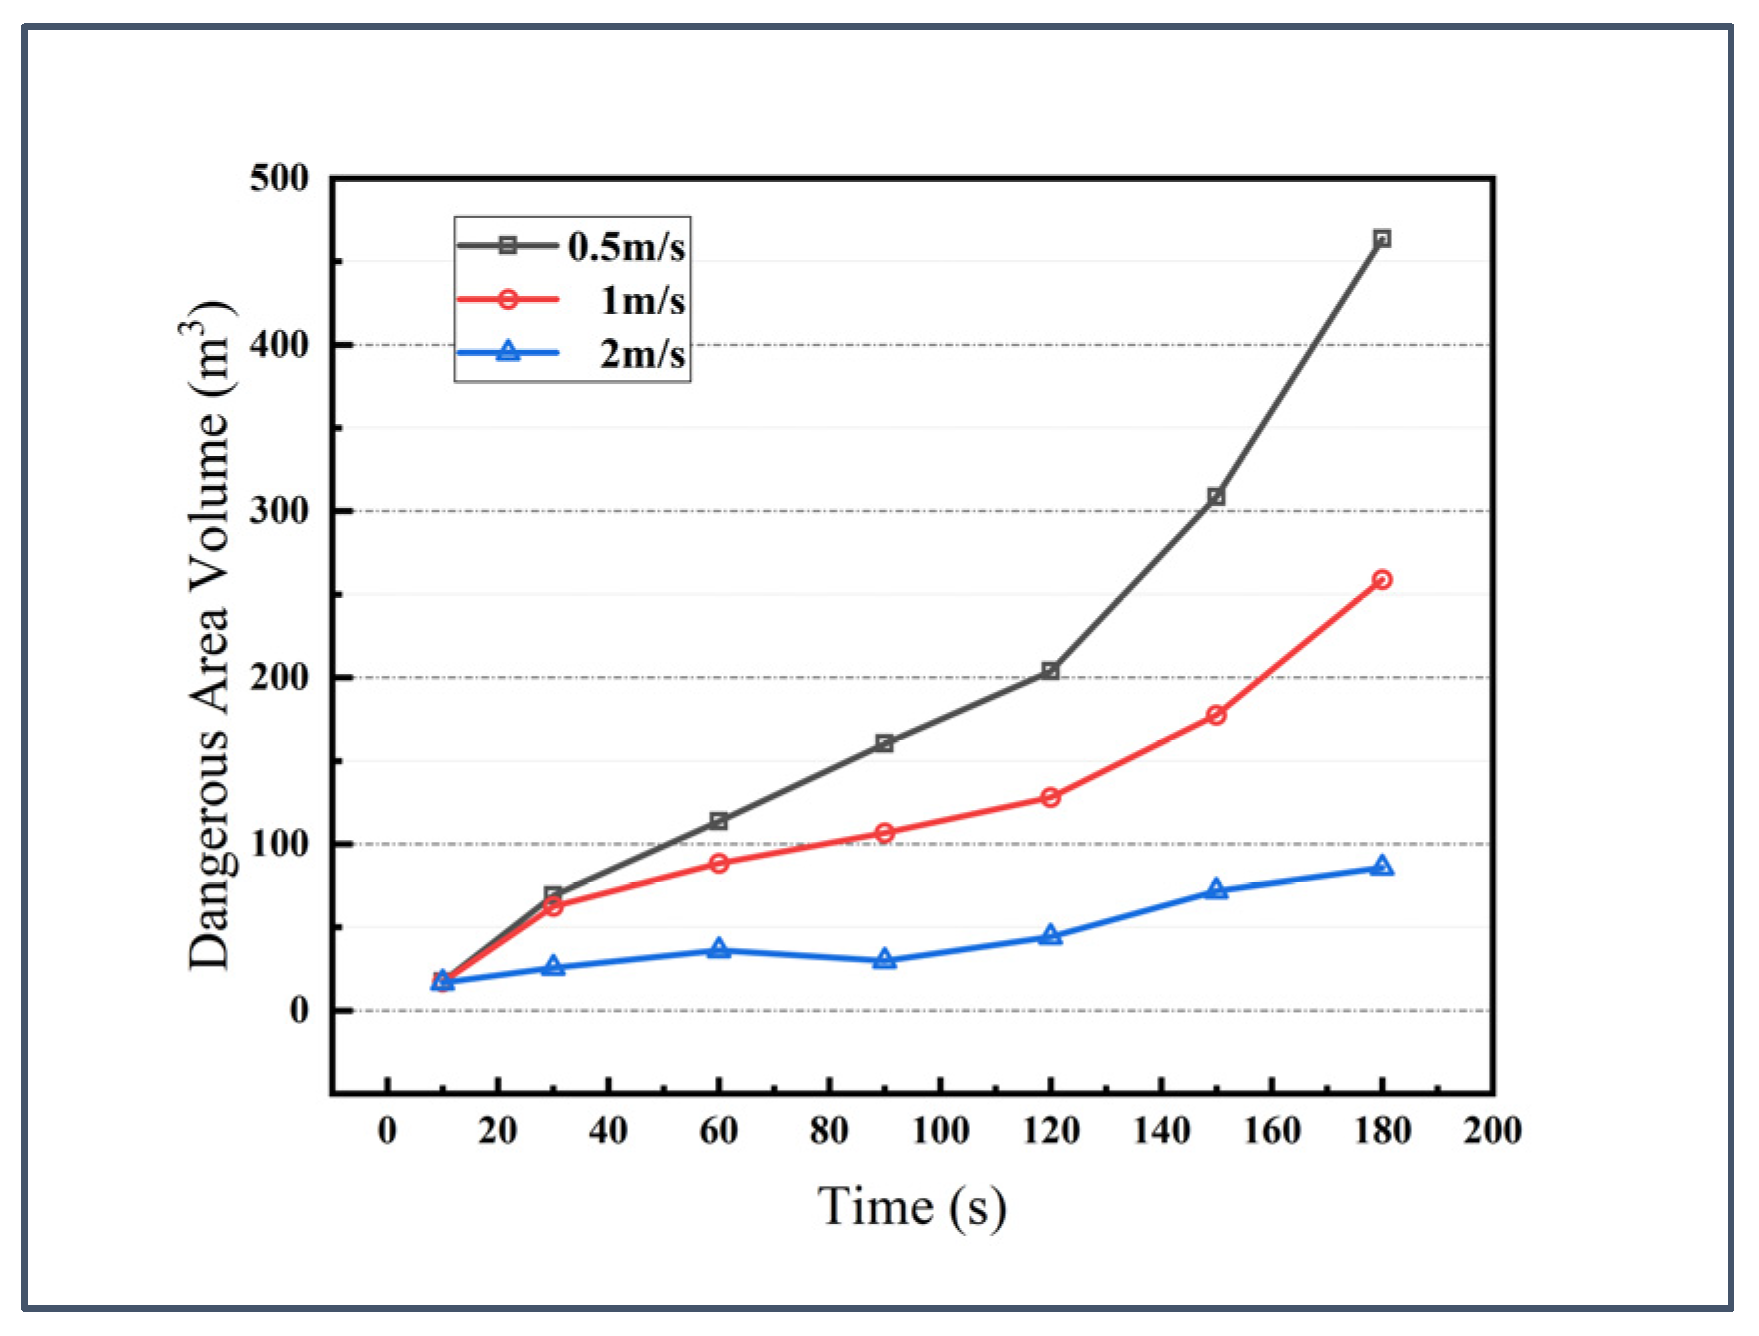
3.3. Effect of Ventilation Rate

This section analyzes the dispersion processes at Leakage Location C under different inlet wind speeds. Since the near-floor jet at Location C is less influenced by ventilation airflow compared to other locations, it better highlights the impact of ventilation on the dispersion dynamics in the upper cabin space. By comparing the dispersion processes within the first 60 s in Figure 14, it is observed that at an inlet wind speed of 2 m/s, the main ammonia cloud reaches the ceiling significantly later. Higher ventilation rates enhance the exhaust airflow’s ability to remove accumulated ammonia from the ceiling more rapidly, thereby reducing high-concentration zones in the upper region and suppressing downward dispersion.
Figure 15 demonstrates that increasing the wind speed effectively suppresses the volume of hazardous zones. However, under the current ventilation configuration, further increasing the wind speed beyond 2 m/s yields diminishing returns.
Excessive near-floor wind speeds, however, impede the ascent of the bottom ammonia cloud. Combined with wall interactions, this leads to high-concentration accumulation between the leakage jet and the downwind wall, worsening conditions in near-floor personnel activity zones (Figure 16). Additionally, higher wind speeds intensify vortical flow along the inclined path of the primary ventilation stream, accelerating the downward dispersion of ceiling-accumulated ammonia into the lower space on the inlet side, where lethal concentration zones subsequently form.

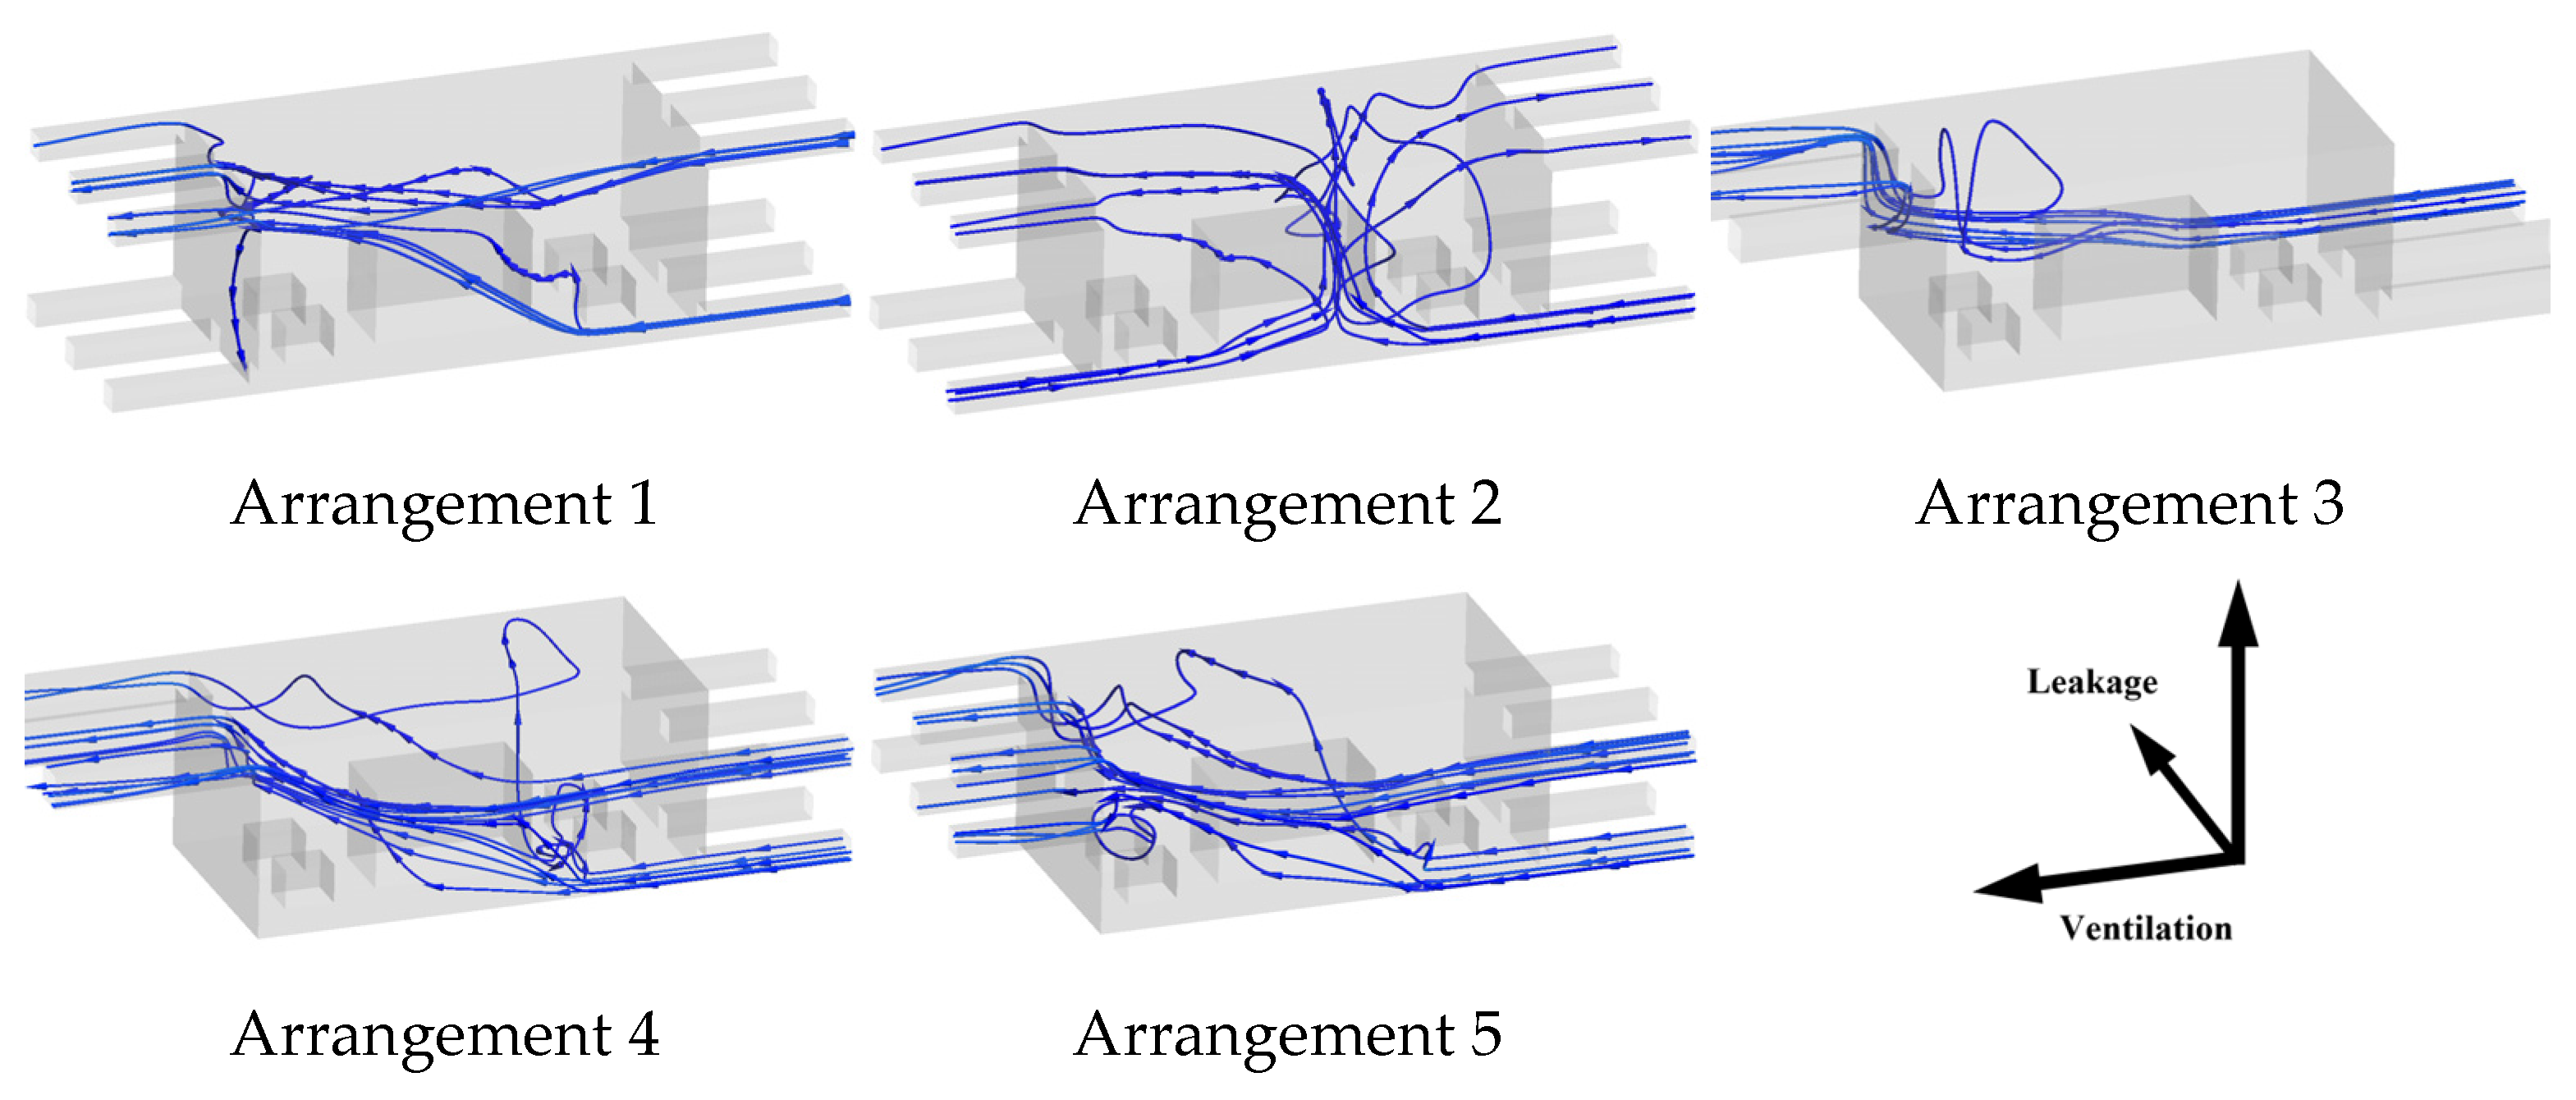
3.4. Adjustment of Ventilation Configuration

Based on the preceding analysis, modifications were made to the inlet and exhaust vent distributions in the model. These adjusted ventilation configurations are abbreviated as Arrangements A1–A5, as shown in Figure 17.
As identified earlier, high-concentration ammonia accumulation tends to occur in specific near-floor regions—such as between the jet and the floor/obstacle walls or between the jet and the downwind-side wall. This is addressed as follows:
  • A1 enhances horizontal ventilation in near-floor zones while maintaining ceiling ventilation;
  • A2 adopts bilateral floor inlets and bilateral ceiling exhaust vents to establish upward airflow, promoting ammonia ascent and intensifying upper-space exhaust;
  • A3 increases the cross-sectional area of all ventilation openings compared to the original design;
  • A4 relocates a portion of the inlet area to the mid-upper cabin to strengthen top-space inflow, building on A3;
  • A5 further shifts part of the exhaust area downward from A4.
All modified configurations maintain identical total inlet/outlet areas, doubled from the original model. Each inlet operates at a wind speed of 2 m/s, satisfying regulatory requirements of over 30 air changes per hour. The leakage rate remains 0.05 kg/s, and the ambient temperature is fixed at 35 °C.
In Figure 18, blue isosurface (ammonia mass fraction = 0.305%, equivalent to 3500 mg/m3) represents the extent of the immediate lethal concentration zone (ILCZ) 180 s after leakage—a lower threshold than the 0.607% value used in Section 3.1. The orange isosurface delineates the high-concentration core of the ammonia cloud. Notably, Arrangement A2 exhibits the smallest hazardous zone, reduced by one-third to one-half compared to other configurations. This improvement arises from synergistic design modifications:
(1)
The momentum carried by the inlet airflow from both sides at the base suppresses the lateral diffusion of ammonia in the near-surface space;
(2)
Upward airflow accelerates vertical dispersion;
(3)
Dual ceiling exhaust vents enable localized ammonia removal, minimizing ceiling accumulation.
Figure 19 shows that, among other configurations employing horizontal ventilation, Arrangement A3 (which solely enlarges the original vent area) achieves the smallest ILCZ volume. The ILCZ volumes follow the order A3 < A4 < A5, indicating that optimal ventilation efficiency requires positioning inlets as low as possible and exhaust vents as high as possible and enlarging vent areas to enhance airflow capacity.
Figure 20 reveals underutilization of floor exhausts in A1, while downward swirls near exhaust vents exacerbate near-floor hazardous zones (Figure 21), a phenomenon also observed in A5. In contrast, A4 and A5 demonstrate smaller near-floor hazardous areas than A3, suggesting that excessive unidirectional inlet airflow worsens ground-level dispersion. Conversely, A2’s bilateral inlets effectively constrain near-floor hazards, maximizing safety in personnel activity zones.

4. Conclusions

This study employs numerical simulations to investigate ammonia dispersion in confined ship engine room environments, analyzing the characteristics of dispersion evolution under different leakage locations, leakage rates, ventilation speeds, and ventilation configurations alongside multi-parameter coupling analysis. The key findings are as follows:
  • The horizontal ammonia dispersion process in confined engine rooms comprises three distinct phases: (1) jet phase dominated by initial momentum; (2) buoyancy-dominated ascent phase; and (3) downward dispersion phase driven by concentration gradients after the cloud occupies the ceiling space;
  • Jets at different leakage locations generate varying degrees of near-floor high-concentration accumulation due to obstacle distributions and ventilation airflow. Obstacle-induced turbulence intensifies near-wall interactions, resulting in the largest high-concentration zones when jets directly impact walls;
  • When leakage rates exceed the ventilation system’s capacity, the growth rate of hazardous zone volume increases disproportionately relative to the leakage rate;
  • During the initial 10 s of leakage, the hazardous zone volumes show negligible variation across different wind speeds. Increasing the airflow significantly enhances ventilation efficiency—at the 180 s mark, the hazardous zone volume at 2 m/s inlet wind speed is 65% smaller than that at 1 m/s. However, this accelerated ventilation may paradoxically intensify other risks. Elevated ammonia concentration accumulation near leakage sources and enhanced downward dispersion of ceiling-level gas clouds. Both mechanisms could expand immediately lethal zones in near-ground areas. Furthermore, considering the cubic proportionality between fan power consumption and rotational speed, coupled with accelerated wear of ventilation components under high-speed operation, these factors may collectively compromise the vessel’s operational economy;
  • Compared to horizontal ventilation enhancements, a bilateral inlet–outlet configuration (inlets on opposite floor sides, exhausts on opposite ceiling sides) reduces hazardous zone volume by 50% and minimizes near-floor hazards. For horizontal layouts, optimal performance requires maximizing vent opening areas, positioning inlets as low as possible and exhausts as high as possible. Optimizing ventilation layout design can significantly enhance near-ground ventilation efficiency without requiring substantial increases in fan rotational speed. This approach demonstrates superior feasibility and merits priority consideration in engineering implementations.
This study investigates the dispersion dynamics and accidental impact boundaries of ammonia clouds under varying leakage scenarios within ship engine compartments. The findings can help optimize the layout design of engine room ventilation systems and predict the consequences of leakage accidents. This study also provides both theoretical foundations and practical references for formulating risk prevention and control strategies as well as emergency response measures. However, simplified assumptions were adopted regarding leakage modes, thermal settings of equipment surfaces, and cabin wall temperatures. Subsequent experimental or computational studies should incorporate these factors to refine the prediction accuracy of gas cloud evolution patterns.

Author Contributions

Methodology, X.L.; Validation, X.L.; Resources, G.Y.; Writing—original draft, X.L.; Writing—review & editing, B.S., J.L. and Y.S.; Visualization, X.L.; Supervision, G.Y., B.S., J.L. and Y.S.; Project administration, G.Y. All authors have read and agreed to the published version of the manuscript.

Funding

This work was supported by the National Key R&D Program of China (No. 2023YFB4301701).

Institutional Review Board Statement

Not applicable.

Informed Consent Statement

Not applicable.

Data Availability Statement

Data are contained within the article.

Conflicts of Interest

The authors declare that they have no known competing financial interests or personal relationships that could have appeared to influence the work reported in this paper.

References

  1. IMO. Marine Environment Protection Committee (MEPC 80), 3–7 July 2023. Available online: https://www.imo.org/en/MediaCentre/MeetingSummaries/Pages/MEPC-80.aspx (accessed on 18 March 2025).
  2. Balcombe, P.; Brierley, J.; Lewis, C.; Skatvedt, L.; Speirs, J.; Hawkes, A.; Staffell, I. How to Decarbonise International Shipping: Options for Fuels, Technologies and Policies. Energy Convers. Manag. 2019, 182, 72–88. [Google Scholar] [CrossRef]
  3. Zhang, C.; Zhu, J.; Guo, H.; Xue, S.; Wang, X.; Wang, Z.; Chen, T.; Yang, L.; Zeng, X.; Su, P. Technical Requirements for 2023 IMO GHG Strategy. Sustainability 2024, 16, 2766. [Google Scholar] [CrossRef]
  4. Kim, K.; Roh, G.; Kim, W.; Chun, K. A Preliminary Study on an Alternative Ship Propulsion System Fueled by Ammonia: Environmental and Economic Assessments. J. Mar. Sci. Eng. 2020, 8, 183. [Google Scholar] [CrossRef]
  5. Kojima, Y.; Yamaguchi, M. Ammonia as a Hydrogen Energy Carrier. Int. J. Hydrogen Energy 2022, 47, 22832–22839. [Google Scholar] [CrossRef]
  6. Lee, H.; Lee, J.; Roh, G.; Lee, S.; Choung, C.; Kang, H. Comparative Life Cycle Assessments and Economic Analyses of Alternative Marine Fuels: Insights for Practical Strategies. Sustainability 2024, 16, 2114. [Google Scholar] [CrossRef]
  7. Braun, A.; Gierenz, N.; Braun, S.; Kubach, H.; Bernhardt, S.; Prehn, S.; Müller, M.; Engelmeier, L.; Fehlemann, L.; Steffen, M.; et al. Aspects of Ammonia as Green Fuel for Propulsion Systems of Inland Water Vessels. Energy Technol. 2024, 13, 2301648. [Google Scholar] [CrossRef]
  8. Huang, Q.; Liu, J. Preliminary Assessment of the Potential for Rapid Combustion of Pure Ammonia in Engine Cylinders Using the Multiple Spark Ignition Strategy. Int. J. Hydrogen Energy 2024, 55, 375–385. [Google Scholar] [CrossRef]
  9. Park, C.; Jang, I.; Lee, J.; Kim, M.; Park, C.; Kim, Y.; Choi, Y. Effect of a Compression Ratio Increase and High-Flow-Rate Injection on the Combustion Characteristics of an Ammonia Direct Injection Spark-Ignited Engine. J. Mar. Sci. Eng. 2025, 13, 268. [Google Scholar] [CrossRef]
  10. Al-Aboosi, F.Y.; El-Halwagi, M.M.; Moore, M.; Nielsen, R.B. Renewable Ammonia as an Alternative Fuel for the Shipping Industry. Curr. Opin. Chem. Eng. 2021, 31, 100670. [Google Scholar] [CrossRef]
  11. Chen, X.; Hu, R.; Luo, K.; Wu, H.; Biancardo, S.A.; Zheng, Y.; Xian, J. Intelligent Ship Route Planning via an A* Search Model Enhanced Double-Deep Q-Network. Ocean. Eng. 2025, 327, 120956. [Google Scholar] [CrossRef]
  12. Dong, T.; Alamoush, A.; Schönborn, A.; Masodzadeh, P.G.; Park, C.; Park, H.-S.; Vakili, S.; Bilgili, L.; Ballini, F.; Ölcer, A.I. Roadmap for the Decarbonization of Domestic Passenger Ferries in the Republic of Korea. Sustainability 2025, 17, 1545. [Google Scholar] [CrossRef]
  13. Zhao, Y.; Liu, F.; Zhang, Y.; Wang, Z.; Song, Z.; Zan, G.; Wang, Z.; Guo, H.; Zhang, H.; Zhu, J.; et al. Economic Assessment of Maritime Fuel Transformation for GHG Reduction in the International Shipping Sector. Sustainability 2024, 16, 10605. [Google Scholar] [CrossRef]
  14. Ejder, E.; Arslanoğlu, Y. Evaluation of Ammonia Fueled Engine for a Bulk Carrier in Marine Decarbonization Pathways. J. Clean. Prod. 2022, 379, 134688. [Google Scholar] [CrossRef]
  15. Otsason, R.; Laasma, A.; Gülmez, Y.; Kotta, J. Ulla Tapaninen Comparative Analysis of the Alternative Energy: Case of Reducing GHG Emissions of Estonian Pilot Fleet. J. Mar. Sci. Eng. 2025, 13, 305. [Google Scholar] [CrossRef]
  16. Jang, H.; Mujeeb-Ahmed, M.P.; Wang, H.; Park, C.; Hwang, I.; Jeong, B.; Zhou, P.; Mickeviciene, R. Regulatory Gap Analysis for Risk Assessment of Ammonia-Fuelled Ships. Ocean. Eng. 2023, 287, 115751. [Google Scholar] [CrossRef]
  17. China CDC. Technical Plan for Health Emergency Response to Acute Ammonia Poisoning Incidents. Available online: https://niohp.chinacdc.cn/zdyyjzt/zdyajjsfa/201309/P020130910594811572280.pdf (accessed on 18 March 2025).
  18. Hu, L.; Niu, J.; Wu, W.; Zhao, Z.; Du, M.; Chen, L.; Zheng, Q.; Cao, H. Quantitative Analysis of Toxicity Risks in the Operation of Ammonia-Fueled Tugboats. Ocean. Eng. 2024, 310, 118759. [Google Scholar] [CrossRef]
  19. Joseph Sekhar, S.; Samuel, M.S.; Glivin, G.; Le, T.; Mathimani, T. Production and Utilization of Green Ammonia for Decarbonizing the Energy Sector with a Discrete Focus on Sustainable Development Goals and Environmental Impact and Technical Hurdles. Fuel 2024, 360, 130626. [Google Scholar] [CrossRef]
  20. Wong, A.Y.H.; Selin, N.E.; Eastham, S.D.; Mounaïm-Rousselle, C.; Zhang, Y.; Allroggen, F. Climate and Air Quality Impact of Using Ammonia as an Alternative Shipping Fuel. Environ. Res. Lett. 2024, 19, 084002. [Google Scholar] [CrossRef]
  21. Theobald, M.R.; Sanz-Cobena, A.; Vallejo, A.; Sutton, M.A. Suitability and Uncertainty of Two Models for the Simulation of Ammonia Dispersion from a Pig Farm Located in an Area with Frequent Calm Conditions. Atmos. Environ. 2015, 102, 167–175. [Google Scholar] [CrossRef]
  22. Scotto di Perta, E.; Agizza, M.A.; Sorrentino, G.; Boccia, L.; Pindozzi, S. Study of Aerodynamic Performances of Different Wind Tunnel Configurations and Air Inlet Velocities, Using Computational Fluid Dynamics (CFD). Comput. Electron. Agric. 2016, 125, 137–148. [Google Scholar] [CrossRef]
  23. Nielsen, M.; Ott, S.; Jørgensen, H.E.; Bengtsson, R.; Nyrén, K.; Winter, S.; Ride, D.; Jones, C. Field Experiments with Dispersion of Pressure Liquefied Ammonia. J. Hazard. Mater. 1998, 56, 59–105. [Google Scholar] [CrossRef]
  24. Hanna, S.; Britter, R.; Argenta, E.; Chang, J. The Jack Rabbit Chlorine Release Experiments: Implications of Dense Gas Removal from a Depression and Downwind Concentrations. J. Hazard. Mater. 2012, 213–214, 406–412. [Google Scholar] [CrossRef] [PubMed]
  25. Bauer, T.J. Comparison of Chlorine and Ammonia Concentration Field Trial Data with Calculated Results from a Gaussian Atmospheric Transport and Dispersion Model. J. Hazard. Mater. 2013, 254–255, 325–335. [Google Scholar] [CrossRef] [PubMed]
  26. Dharmavaram, S.; Carroll, M.J.; Lutostansky, E.M.; McCormack, D.; Chester, A.D. Allason Red Squirrel Tests: Air Products’ Ammonia Field Experiments. Process Saf. Prog. 2023, 42, 481–498. [Google Scholar] [CrossRef]
  27. Labovský, J.; Jelemenský, Ľ. CFD Simulations of Ammonia Dispersion Using “Dynamic” Boundary Conditions. Process Saf. Environ. Prot. 2010, 88, 243–252. [Google Scholar] [CrossRef]
  28. Galeev, A.D.; Salin, A.A.; Ponikarov, S.I. Consequence Analysis of Aqueous Ammonia Spill Using Computational Fluid Dynamics. J. Loss Prev. Process Ind. 2013, 26, 628–638. [Google Scholar] [CrossRef]
  29. Ohba, R.; Kouchi, A.; Hara, T.; Vieillard, V.; Nedelka, D. Validation of Heavy and Light Gas Dispersion Models for the Safety Analysis of LNG Tank. J. Loss Prev. Process Ind. 2004, 17, 325–337. [Google Scholar] [CrossRef]
  30. Tan, W.; Du, H.; Liu, L.; Su, T.; Liu, X. Experimental and Numerical Study of Ammonia Leakage and Dispersion in a Food Factory. J. Loss Prev. Process Ind. 2017, 47, 129–139. [Google Scholar] [CrossRef]
  31. Tan, W.; Lv, D.; Guo, X.; Du, H.; Liu, L.; Wang, Y. Accident Consequence Calculation of Ammonia Dispersion in Factory Area. J. Loss Prev. Process Ind. 2020, 67, 104271. [Google Scholar] [CrossRef]
  32. Yadav, A.; Jeong, B. Safety Evaluation of Using Ammonia as Marine Fuel by Analysing Gas Dispersion in a Ship Engine Room Using CFD. J. Int. Marit. Saf. Environ. Aff. Shipp. 2022, 6, 99–116. [Google Scholar] [CrossRef]
  33. Xie, Y.; Liu, J.; Hao, Z.; Xu, Z.; Qin, J.; Zhu, J. Numerical Simulation and Experimental Study of Gas Diffusion in a Ship Engine Room. Ocean Eng. 2023, 271, 113638. [Google Scholar] [CrossRef]
  34. Mei, Y.; Shuai, J. Research on Natural Gas Leakage and Diffusion Characteristics in Enclosed Building Layout. Process Saf. Environ. Prot. 2022, 161, 247–262. [Google Scholar] [CrossRef]
  35. Gao, Q. A Study on the Simulation of Ammonia Leakage and Diffusion Based on CFD. Master’s Thesis, University of Petroleum, Beijing, China, 2017. [Google Scholar]
Figure 1. Computational domain setup.
Sustainability 17 03826 g001
Figure 2. Mesh refinement regions.
Sustainability 17 03826 g002
Figure 3. Mesh independence test.
Sustainability 17 03826 g003
Figure 4. Schematic diagram of the experimental setup used for model validation.
Sustainability 17 03826 g004
Figure 5. Ammonia concentration at monitoring points.
Sustainability 17 03826 g005
Figure 6. Ammonia dispersion process at Leakage Location A.
Sustainability 17 03826 g006
Figure 7. Ammonia concentration at 1.5 m height for Leakage Location A at 180 s.
Sustainability 17 03826 g007
Figure 8. Ammonia dispersion process at Leakage Location B.
Sustainability 17 03826 g008
Figure 9. Ammonia concentration at 1.5 m height for Leakage Location B at 180 s.
Sustainability 17 03826 g009
Figure 10. Ammonia dispersion process at Leakage Location C.
Sustainability 17 03826 g010
Figure 11. Ammonia concentration at 1.5 m height for Leakage Location C at 180 s.
Sustainability 17 03826 g011
Figure 12. Ammonia dispersion processes under different leakage rates.
Sustainability 17 03826 g012
Figure 13. Volume of hazardous zones under different leakage rates.
Sustainability 17 03826 g013
Figure 14. Effect of ventilation rate on the dispersion process.
Sustainability 17 03826 g014
Figure 15. Volume of hazardous zones under different inlet wind speeds.
Sustainability 17 03826 g015
Figure 16. Ammonia concentration at 1.5 m height under different inlet wind speeds.
Sustainability 17 03826 g016
Figure 17. Ventilation configuration.
Sustainability 17 03826 g017
Figure 18. Dispersion processes under different vent opening configurations.
Sustainability 17 03826 g018
Figure 19. Volume of lethal concentration zones for different ventilation configurations.
Sustainability 17 03826 g019
Figure 20. Ventilation airflow patterns under different configurations.
Sustainability 17 03826 g020
Figure 21. Ammonia concentration at 1.5 m height under different configurations.
Sustainability 17 03826 g021
Table 1. Definition of symbols.
SymbolMeaningUnit
τViscous stressPa
FBody forcesN
ρDensitykg/m3
tTimes
uVelocity vectorm/s
pPressurePa
CsVolume concentration%
DsDiffusion coefficientm2/s
ETotal energyJ
hiSpecific enthalpy of substance iJ/kg
jiDiffusion flux of substance ikg/(m2·s)
kTurbulent kinetic energym2/s2
μMolecular viscosity coefficientkg/(m·s)
μtTurbulent viscosity coefficientkg/(m·s)
σkTurbulent kinetic energy diffusion constant-
GbTurbulent kinetic energy generation term due to buoyancykg/(m·s3)
GkTurbulent kinetic energy generation term due to mean velocity gradientkg/(m·s3)
εTurbulent kinetic energy dissipation ratem2/s3
σεConstant related to the diffusion of turbulent kinetic energy dissipation rate-
C1Constant of the generation term of the turbulent kinetic energy dissipation rate-
C2Constant of the dissipation term of the turbulent kinetic energy dissipation rate-
C1εConstant of the buoyancy effect term on the turbulent kinetic energy dissipation rate-
Table 2. Boundary conditions and computational settings.
OptionValue
Air inletVelocity-inlet
Ammonia inletMass-flow-inlet
OutletOutflow
Temperature35 °C
MethodSIMPLEC
Residual10−5
Time Step0.05 s
Table 3. Positions of key points in the experiment.
PointLocation (m)
xyz
leak source0.050.3750.05
a0.350.3750.05
b0.4750.3750.05
c1.10.450.05
d1.30.4450.05
Table 4. Deviations between simulated and experimental values.
Pointabcd
Deviation−7.35%−9.16%−5.28%−11.76%
Table 5. Parameter settings for different cases.
Variables as Research
Subjects
Parameter Settings
Leakage LocationLeakage Rate (kg/s)Ventilation Rate (m/s)
Leakage LocationA, B, C0.051
Leakage RateA0.025, 0.05, 0.075, 0.11
Ventilation RateC0.050.5, 1, 2
Ventilation ConfigurationA0.052
Disclaimer/Publisher’s Note: The statements, opinions and data contained in all publications are solely those of the individual author(s) and contributor(s) and not of MDPI and/or the editor(s). MDPI and/or the editor(s) disclaim responsibility for any injury to people or property resulting from any ideas, methods, instructions or products referred to in the content.

