Abstract
A review of the global history of tourism development reveals a strong connection between government involvement and the growth of the tourism industry. In China, tourism authorities are increasingly emphasizing the role of government service websites in advancing digital governance within the sector. Drawing on theories of public administration, resource dependence, and regional innovation systems, this study constructs an analytical framework to investigate the influencing mechanisms of government service websites on tourism development. Using data from the government tourism websites of 31 Chinese provinces, this study systematically examines, for the first time, the mediating role of tourism resources and the moderating effect of provincial economic competitiveness. Content analysis and keyword extraction techniques were employed to collect data on website service functions, tourism resources, and tourism development for the year 2023. These were analyzed using a PLS structural equation model. The results indicate that government website service functions positively, albeit modestly, promote tourism development, explaining 24.4% of the variance. Among service functions, public services (weight = 0.611) contribute significantly more than administrative management (0.368) and information management (0.238). Although the mediating effect of tourism resources did not reach statistical significance, internal structural analysis shows that cultural customs resources (0.512) contribute more to tourism development than water landscapes (0.443) and geological landscapes (0.338), highlighting the unique advantage of “soft resources” in a digital environment. Incorporating provincial economic competitiveness significantly increases the explanatory power of the model to 47.9%, with development level competitiveness (0.268) and government function competitiveness (0.267) playing the most prominent moderating roles. These findings suggest that the effectiveness of digital governance in promoting tourism development is shaped by multiple complex factors. Accordingly, governments should adopt differentiated digital strategies based on regional economic conditions and resource endowments, with a focus on enhancing public service functions, optimizing the digital representation of cultural resources, and strengthening regional economic foundations to fully unleash the industrial potential of digital governance.
1. Introduction
The 14th Five-Year Plan for Digital Government Development emphasizes the need to restructure government capacity using data as a key element, promoting the digital and intelligent transformation of public services [1]. With the rapid advancement of digital technologies and the continued implementation of the “Internet Plus” strategy, e-government platforms have become increasingly vital in government governance and public service delivery [2]. In this study, e-government refers to the comprehensive transformation of traditional administrative models through the application of modern information technologies such as big data, cloud computing, and artificial intelligence. Its primary aim is to streamline administrative processes, improve efficiency, and ultimately provide residents with more convenient, efficient, and transparent services [3].
Tourism government service websites, established by cultural and tourism authorities, serve as official online platforms and key bridges between governments and the public. These platforms are not only responsible for disseminating policy information, promoting tourism resources, and providing online services, but have also emerged as critical tools for facilitating high-quality tourism development [4,5]. Provincial comprehensive economic competitiveness refers to a multidimensional evaluation of a region’s development level, environmental quality, and government performance [6]. Digital governance is playing an increasingly significant role in advancing tourism. Sousa et al. [7,8] highlight that digital technologies are profoundly transforming tourist experiences and business operations. These technologies not only enhance visitor satisfaction but also facilitate industry transformation and upgrading [9]. According to real-time data from the National Government Service Platform, all 31 provincial-level cultural and tourism departments in China have established online service portals offering tourism-related government services. Although the construction and operation of these platforms have made significant progress in recent years, the relationship between their service functions and regional tourism development has yet to be fully elucidated.
As a key driver of economic growth in China, tourism plays a vital role in promoting regional development. In 2023, domestic tourism revenue reached RMB 4.91 trillion, contributing 7.86% to GDP and supporting 74.7 million jobs [10]. Research indicates that tourism development is profoundly influenced by government services, policy support, and information technology [11,12]. In 2024, 75% of tourists obtained travel information using online platforms [13]. Provincial tourism government service websites may have a substantial impact on local tourism development by improving information transparency, simplifying administrative procedures, and optimizing resource allocation. Given that tourism is a resource-dependent industry, its development is closely linked to regional economic conditions and resource endowments [14]. However, variations in tourism resources and economic competitiveness across provinces suggest that the influence of government website service functions on tourism development may be geographically differentiated [15,16].
Therefore, this study introduces tourism resources as a mediating variable to analyze their role in the relationship between government platform service functions and tourism development. In addition, provincial comprehensive economic competitiveness is incorporated as an external variable to explore the internal and external pathways through which provincial tourism government service websites affect tourism development. This approach carries significant theoretical and practical implications.
By focusing on all 31 provincial-level tourism government service websites in China, this study investigates their impact on tourism development, with particular attention given to the mediating role of tourism resources and the moderating role of comprehensive provincial economic competitiveness. The objective is to reveal the internal and external driving mechanisms of tourism industry development in a digital governance environment and to provide a theoretical foundation and policy recommendations for optimizing digital government services and promoting high-quality tourism development.
2. Theoretical Framework and Literature Review
This study constructs an analytical framework based on three theoretical perspectives: public administration theory, resource dependence theory, and regional innovation systems theory.
Tourism government service websites are platforms developed by government agencies using modern information management models and network communication technologies to optimize departmental structures and workflows, providing the public with convenient and efficient tourism-related services [17]. The public administration theoretical system offers the most direct support for the functional design of such platforms. From this perspective, government service models are transitioning from traditional administrative paradigms to models based on new public management and new public service concepts [18]. Accordingly, the functions of government websites have evolved from one-way information dissemination to two-way interactive services [19]. Hood’s [20] new public management theory emphasizes the introduction of business management principles to enhance service efficiency and quality, while Osborne’s [21] new public governance theory stresses multi-actor participation and networked governance—both providing a theoretical basis for the functional design of tourism government websites.
Tourism resources form the material foundation for tourism development. Resource dependence theory focuses on the relationship between organizations and their external environments, positing that organizations depend on external resources for survival and growth [22]. As a typical resource-dependent industry, tourism development heavily relies on natural landscapes and historical and cultural assets. The content and priorities of tourism government platforms often vary significantly according to regional tourism resource endowments [23]. Recent studies indicate a complex nonlinear relationship between tourism resources and tourism development; regions with higher levels of informatization are more effective in transforming resource advantages into economic benefits [24]. This suggests that information technology may serve as a key medium in converting tourism resources into industrial development. Thus, tourism resources not only constitute the material basis for development but also play a critical role in shaping the content of government platforms. For this reason, tourism resources are treated as a mediating variable in this study.
The theory of regional innovation systems emphasizes that regional economic development depends on the interactions among innovation actors and the institutional environment [25]. Under this theoretical lens, a regional innovation system is essentially the outcome of economic activity organized at the regional level [26]. Together, these perspectives provide the theoretical foundation for analyzing provincial-level comprehensive economic competitiveness in China—focusing both on the spatial clustering of innovation factors and the shaping effects of institutional environments. Within the framework of tourism governance, even if the service functions of tourism government websites are well developed, a lack of robust economic support may limit their effectiveness in promoting tourism. Therefore, this study considers provincial comprehensive economic competitiveness as an external variable affecting the relationship between government platforms and tourism development.
Existing research primarily focuses on the role of government websites in enhancing tourism, such as improving service efficiency and optimizing resource allocation [27,28,29]. Studies on the relationship between tourism resources and development have identified resource richness and development level as key factors in sustainable tourism growth [30,31]. For instance, Zhang Qinyue [32], using the TOE framework, confirmed that digital governance enhances the allocation of cultural and tourism resources. Ying Haojie [33] found that Zhejiang’s cultural and tourism department significantly increased destination visibility using targeted marketing on new media platforms. Furthermore, regions with stronger economic competitiveness exhibit clear advantages in infrastructure, public service provision, and market appeal [34]. The digital economy is also recognized as a powerful driver of high-quality tourism development [35]. However, these studies often focus on individual factors without incorporating mediating variables.
Drawing on domestic and international tourism evaluation systems [36,37,38,39], this study selects four core indicators to assess provincial tourism development: the number of travel agencies, number of star-rated hotels, number of tourists, and tourism revenue. These metrics reflect the overall development of the tourism industry in terms of industrial scale, reception capacity, market activity, and economic contribution. Notably, Destination Management Organizations (DMOs), as leadership entities composed of government agencies, stakeholders, and professionals, play a key role in fostering partnerships and shared visions [36]. Under China’s administrative system, provincial tourism government websites assume some of the DMOs’ responsibilities by promoting tourism through administrative management, information management, and public service functions [40,41]. These three functional dimensions are therefore used to assess website service content.
With the implementation of the “Internet Plus Government” strategy, the Website Quality Index (WQI) has emerged as a critical tool for evaluating tourism government websites. It reflects overall quality across four dimensions: technical performance, communication, connectivity, and persuasive capacity [23]. Lu Yunting [42] categorized tourism resources into the following categories: (1) natural attractions (geology, landforms, hydrology, climate, and flora and fauna); (2) cultural attractions (relics, ethnic customs, arts, theme parks, sports venues, exhibitions); and (3) integrated attractions (urban landscapes, rural scenery). Zeng Qiguo [43] classified resources into natural (land, water, biological, climate), cultural (historical), and service-related resources (local specialties). Li Minghui and Guo Jianxing concluded that all classification schemes ultimately fall under two broad categories: natural and cultural resources [44,45]. Based on this framework, this study divides tourism resources into two main categories: natural tourism resources and cultural tourism resources. Natural resources include geomorphic landscapes, water bodies, and biological landscapes; cultural resources include historical relics, modern facilities, religious sites, and folk customs. Additionally, the number and grade of tourist attractions are important indicators of tourism competitiveness, with AAAAA-rated scenic areas being the highest and most influential in China [46]. Therefore, the number of 4A and 5A scenic spots is used to measure the quantity of tourism resources.
Provincial comprehensive economic competitiveness reflects regional innovation capacity and development levels, encompassing nine dimensions: macroeconomy, industrial economy, sustainable development, fiscal and financial systems, knowledge economy, development environment, government performance, development level, and coordinated planning [6].
In summary, while existing research has demonstrated the positive role of digital governance in promoting tourism by optimizing resource allocation and facilitating industrial transformation, and while the impact of economic competitiveness on tourism has also been confirmed, no studies have yet examined the combined influence of tourism government websites, tourism resources, and provincial economic competitiveness. To address this gap, this study proposes a theoretical framework incorporating “service functions–mediating variable–external variable”, focusing on 31 provincial-level tourism government websites in China. Specifically, it investigates the mediating role of tourism resources and the moderating role of economic competitiveness and proposes the following research hypotheses:
H1:
The content and quality of services provided by provincial tourism government websites positively influence tourism development.
H2:
The quantity and type of tourism resources mediate the relationship between tourism government websites and tourism development.
H3:
Provincial comprehensive economic competitiveness moderates the relationship between tourism government websites and tourism development.
3. Research Data and Methods
3.1. Research Framework
This study investigates the relationship between provincial tourism governance websites and tourism development in China, using tourism resource quantity and types as mediating variables and provincial economic comprehensive competitiveness as a moderating variable. The study encompasses four main variables: the independent variable is the service functions of provincial tourism governance websites (website service content, Website Quality Index (WQI)); the external variable is provincial economic comprehensive competitiveness (nine dimensions); the mediating variable is tourism resource quantity and types; and the dependent variable is provincial tourism development (four indicators). Based on the research background, objectives, and related literature, a research framework diagram is proposed (Figure 1).
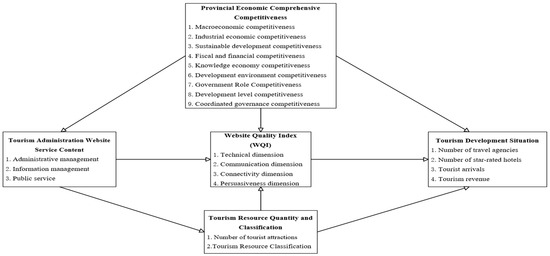
Figure 1.
Research framework.
3.2. Data Sources
This study employed a multi-stage, systematic data collection strategy to ensure comprehensiveness and representativeness.
To collect data on the service content of tourism government websites, all 31 provincial-level administrative regions in China were selected to ensure geographic representativeness. The study focused on a complete annual period from 1 January to 31 December 2023, in order to eliminate seasonal fluctuations. In accordance with the standardized requirements outlined in the Guidelines for Government Website Development, the “Notices and Announcements” section of each website was selected as the primary textual source, as it serves as a central channel for disseminating key government decisions and actions, thereby reflecting the service orientation of the websites. The collected titles were standardized into Word documents, with non-substantive elements such as dates and numerical codes removed during the preprocessing phase.
Data on the website quality index (WQI) were derived from the Annual Work Reports of Government Websites compiled by provincial tourism authorities, which are considered authoritative sources for evaluating website performance. From the original 36 evaluation indicators, this study selected core variables representing the four dimensions proposed by Fernández-Cavia et al.—technology, communication, contact, and persuasion. These indicators were then standardized using Z-scores to eliminate the influence of differing units and enhance comparability.
Tourism resource data were obtained from official sources and publicly recognized platforms. The number of 4A and 5A scenic spots in each province was collected directly from the official lists published by provincial tourism administrations. Descriptive data on tourism resource types were systematically gathered from the Baidu Encyclopedia pages of each province’s scenic attractions, given the platform’s comprehensiveness and public familiarity. Based on the literature review and established classification frameworks, the resources were coded into seven categories: geomorphic landscapes, aquatic landscapes, biological landscapes, historical relics, modern facilities, religious culture, and folk customs. Keyword frequencies in each category were quantified using the TF-IDF algorithm to assess the relative prominence of each resource type.
Tourism development data were selected based on the multi-dimensional characteristics of the tourism industry. Four core indicators were used: the number of travel agencies, number of star-rated hotels, total tourist arrivals, and tourism revenue. These represent industrial scale, reception capacity, market activity, and economic contribution, respectively. All data were obtained from the China Tourism Statistical Yearbook and official provincial statistics. To enhance comparability, indicators were standardized to eliminate dimensional inconsistencies.
As the latest report on provincial economic competitiveness for 2022–2023 had not been published, data from the 2021–2022 period were used for lag analysis. Despite the time gap, the relative stability of regional competitiveness ensures that this substitution has a minimal effect on the robustness of the findings.
3.3. Methods
3.3.1. Content Analysis Method
Content analysis is a mixed-method approach that systematically and objectively identifies textual characteristics for analytical and inferential purposes [47]. This study used content analysis to collect, organize, and examine various data, including the “Notices and Announcements” sections of 31 provincial tourism government websites, annual government website reports, provincial economic competitiveness indicators, tourism development metrics, and tourism resource classifications. A systematic framework was constructed to code key variables such as information themes and frequencies. Two trained researchers independently performed trial coding and engaged in multiple rounds of discussion to reach consensus. During the formal analysis phase, all data were collected and cross-validated independently by both researchers. Any discrepancies were resolved through negotiation, and a third expert was consulted when necessary. Inter-coder reliability was assessed using Cohen’s Kappa coefficient, which yielded values above 0.85, indicating a high level of agreement and ensuring the reliability and objectivity of the results.
3.3.2. Keyword Extraction Method
Keyword extraction is a core technique for processing unstructured textual data [48]. In this study, it was used to analyze the content of both the government websites and the descriptive texts on provincial tourism resources. Preprocessing involved removing stopwords, punctuation, and other irrelevant information. The NLPIR-ICTCLAS 2023 semantic analysis system was then employed for Chinese word segmentation and part-of-speech tagging. Keywords were extracted using a combination of the TF-IDF (Term Frequency and Inverse Document Frequency) algorithm and the TextRank algorithm. TF-IDF is calculated using the formula:
Here, n represents the number of times the term appears in a certain text; ∑n is the total number of terms in that text; N is the total number of documents; and D is the number of documents containing the term. The module will also filter out the terms with higher TF-IDF values as feature words according to the set threshold or sorting rule.
Two experienced researchers independently conducted the keyword extraction and classification. Then, results were compared, and Cohen’s Kappa coefficient was calculated. A value above 0.85 indicated strong agreement. Any disagreements in classification were resolved by a third expert to ensure methodological reliability and result validity.
3.3.3. The PLS Path Modeling Method
Partial least squares (PLS) path modeling is a variance-based technique suitable for exploratory research and small-sample analysis [49]. It offers several advantages: it does not require normal data distribution, performs well with small samples, accommodates complex models, tolerates missing data in external variables, and allows simultaneous processing of multiple independent and dependent variables [50]. Moreover, bootstrapping techniques embedded in PLS models are effective for handling small samples and non-normal data. Given the sample size (31 provinces) and the model’s complexity—including multiple latent variables and non-normally distributed data—SmartPLS 4.0 software was employed for analysis. The analysis was conducted in three stages: first, examining the direct relationship between tourism government websites and tourism development; second, introducing tourism resources as a mediating variable; and third, incorporating provincial economic competitiveness as a moderating variable. In each stage, the measurement model was assessed according to the standards for formative and reflective indicators, followed by an evaluation of the structural model.
4. Research Results
4.1. Relationship Between Tourism Administration Websites and Tourism Development Situation
This section evaluates the direct impact of tourism administration website service functions on the tourism development situation. Using a partial least squares (PLS) structural equation model, website service content and website quality index (WQI) are treated as formative indicators, while tourism development situation is treated as a reflective indicator.
4.1.1. Evaluation of the Measurement Model
- (1)
- Evaluation of the Reflective Indicators
“Tourism development” was treated as a reflective construct, consisting of four indicators: the number of star-rated hotels, the number of travel agencies, tourism revenue, and tourist arrivals. The evaluation results demonstrated good internal consistency, with a Cronbach’s α of 0.871 and a composite reliability (CR) of 0.912. Additionally, the factor loadings of all indicators exceeded 0.7 (0.860, 0.783, 0.894, and 0.856, respectively), as shown in Table 1, meeting the requirements for convergent validity.

Table 1.
Evaluation of the reflective indicator measurement model.
Using the Fornell–Larcker criterion, the average variance extracted (AVE) for “tourism development” was 0.849, which was greater than the squared correlations between this construct and other constructs, indicating good discriminant validity. Specifically, the AVE of “tourism development” with the “website quality index (WQI)” was 0.408, and its AVE with “website service content” was 0.414, both of which were smaller than its own AVE of 0.849. Thus, based on the Fornell–Larcker criterion, the construct demonstrated discriminant validity.
- (2)
- Evaluation of the Formative Indicators
For the formative constructs—website service content and website quality index (WQI)—collinearity was tested using variance inflation factor (VIF) values. Results showed no collinearity issues for website service content, as the VIF values for its three dimensions (administrative management, information management, and public service) were all below 5. However, for WQI, VIF values exceeded 5 for all dimensions except technical performance, indicating collinearity issues. Consequently, only technical performance was retained for WQI.
The weight significance test revealed that administrative management (weight = 0.368, t = 2.354, p < 0.05) and public service (weight = 0.611, t = 4.162, p < 0.001) significantly influenced the tourism development situation. Although information management (weight = 0.238, t = 1.651, p > 0.05) was not statistically significant, it was retained due to its factor loading exceeding 0.5 (0.602), as shown in Table 2, indicating an absolute contribution.
Table 2.
Adjusted evaluation of the formative indicator measurement model.
In the “website quality index (WQI)”, the factor weight for the “technical domain” is 1.000, indicating that the more functions related to service provision and security protection available on the tourism government website’s annual performance report, the more positively it impacts tourism development. Within “website service content”, the factor weight for “administrative management” is 0.368, suggesting that a higher frequency of terms related to tourism development planning/strategies, tourism industry regulations, resource development and management, as well as industry supervision and evaluation, is associated with better tourism development outcomes. The factor weight for “information management” is 0.238, indicating that a higher frequency of terms related to news updates, tourism data analysis, and the publication of administrative policies is positively linked to tourism development. The factor weight for “public service” is 0.611, showing that a higher frequency of terms related to online service applications and coordination among destination stakeholders contributes significantly to improved tourism development.
4.1.2. Evaluation of the Structural Model
After verifying the reliability and validity of each measurement indicator, the structural model’s relationships between latent variables and explanatory power is further analyzed to test the research hypotheses.
- (1)
- Assessment of Structural Model Collinearity
First, it is necessary to examine whether collinearity exists among the latent variables. Similar to the assessment of the formative measurement model, a tolerance value ≤ 0.200 or a VIF ≥ 5.000 indicates collinearity issues. As shown in Table 3, the VIF for “website service content” concerning “tourism development” is 1.132, and the VIF for “website quality index (WQI)” concerning “tourism development” is also 1.132, indicating no collinearity issues.
Table 3.
Collinearity of latent variables and path coefficients in structural models.
- (2)
- Significance of Path Coefficients and Effect Size
The path analysis results show that the path coefficient from “website service content” to “tourism development” is 0.321 (t = 2.227, p < 0.05), indicating statistical significance. However, the path coefficient from “website quality index (WQI)” to “tourism development” is 0.282 (t = 1.507, p > 0.05), which is not statistically significant. The effect size (f2) analysis reveals that both independent variables have a low impact on the dependent variable (f2 < 0.15), as shown in Table 3.
- (3)
- Analysis of the Coefficient of Determination (R2)
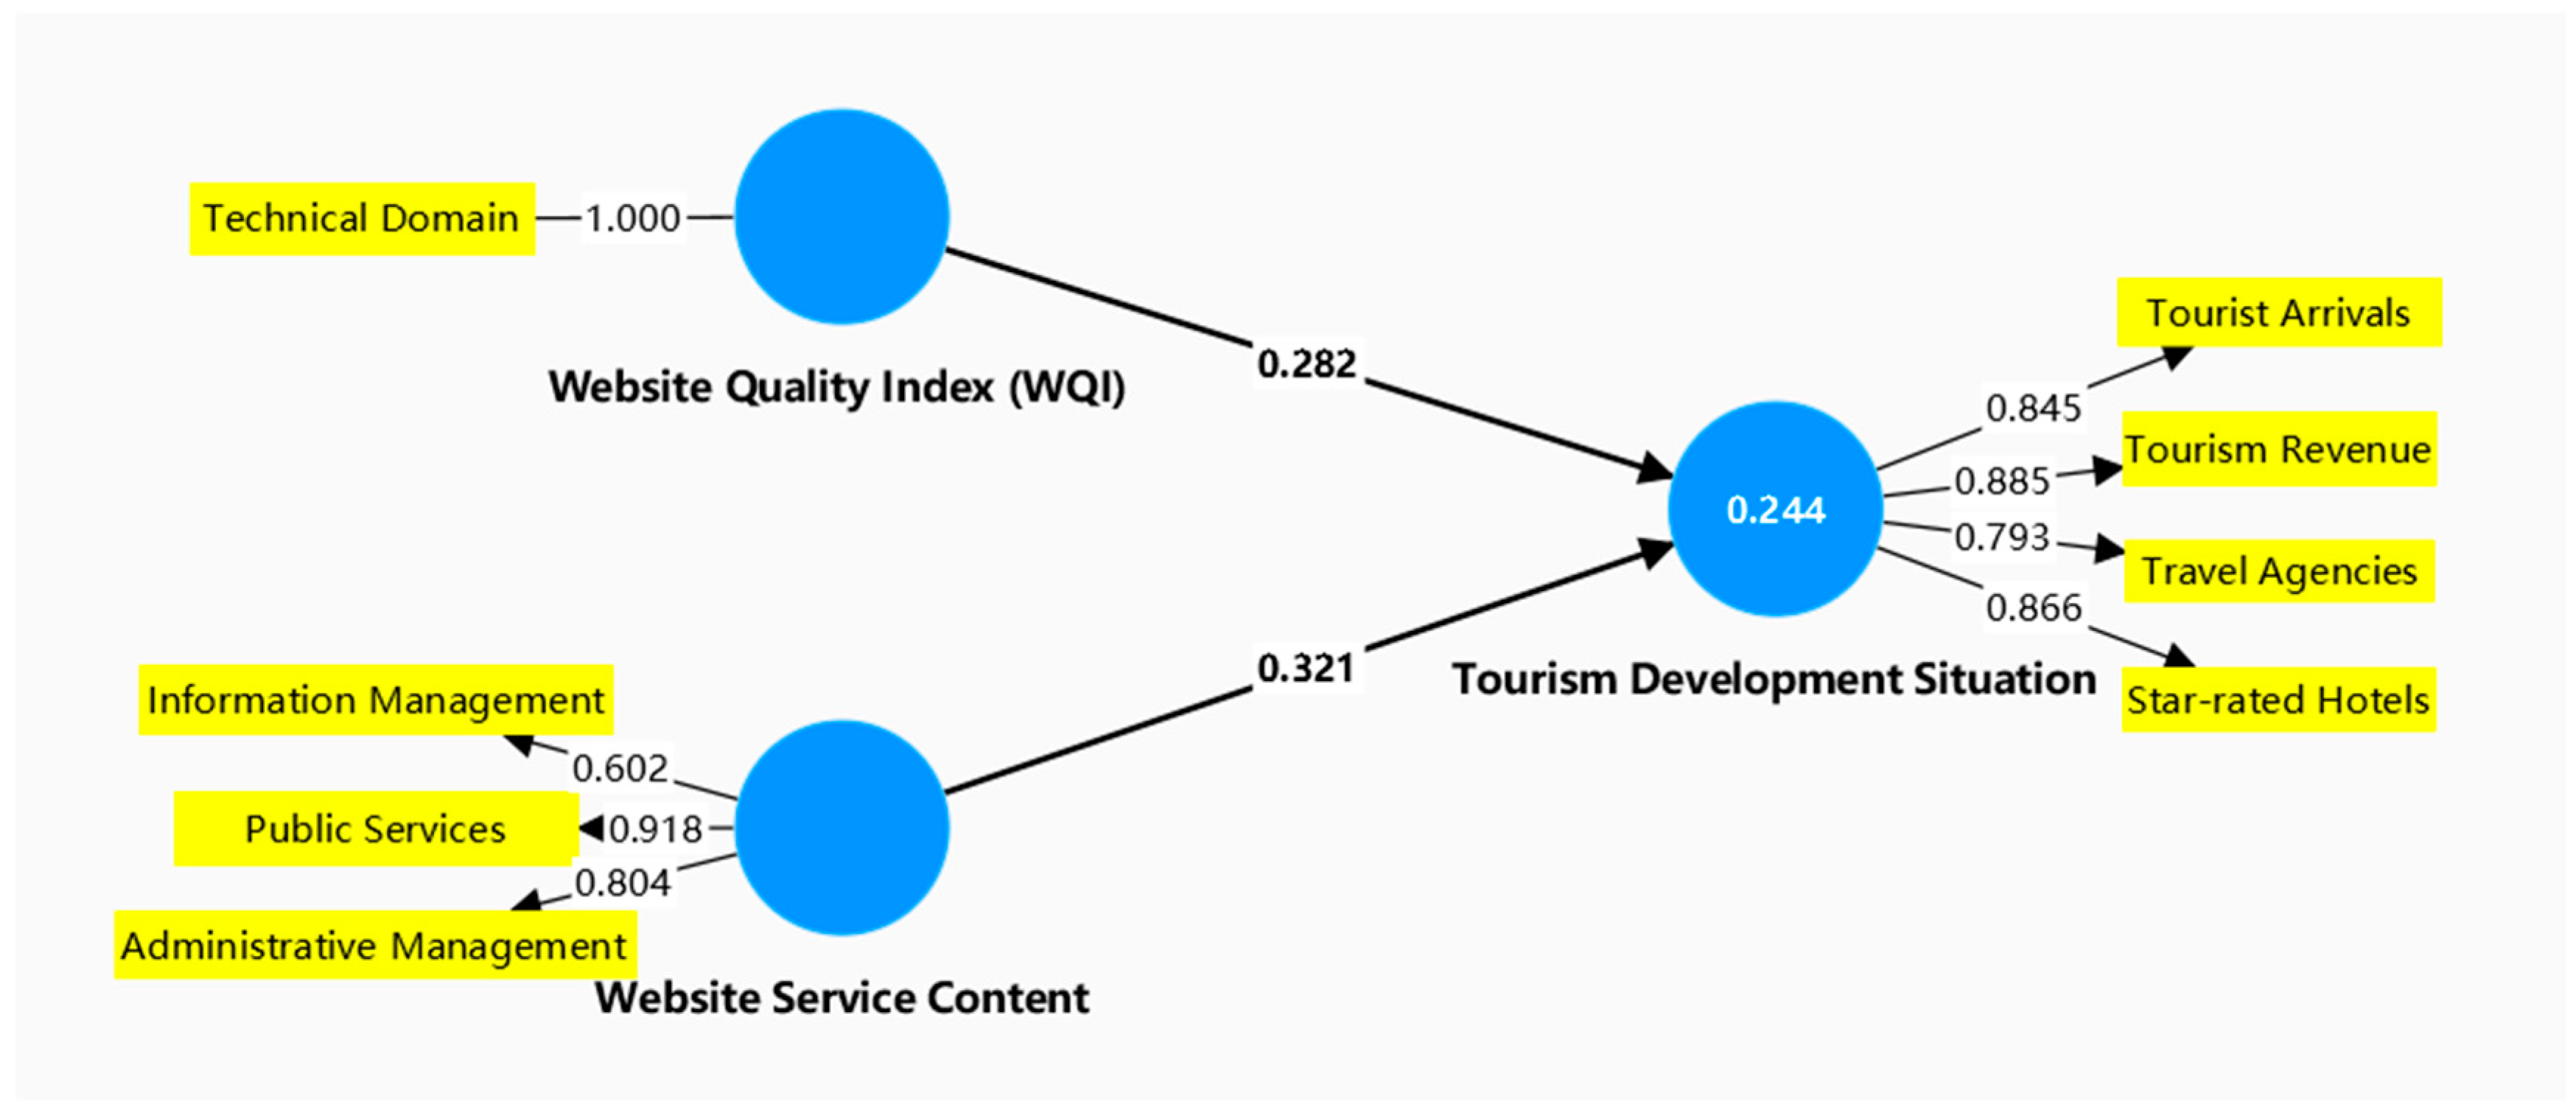
The model analysis results indicate that “website service content” and “website quality index (WQI)” jointly explain 24.4% of the variance in “tourism development” (R2 = 0.244), as shown in Figure 2, suggesting that provincial tourism government websites have a certain explanatory power for tourism development, albeit with low predictive accuracy.
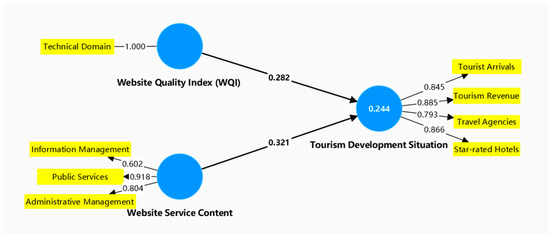
Figure 2.
Structural model of the impact of website service content and WQI on the tourism development situation.
These findings support Hypothesis 1: The service content and quality of provincial tourism government websites positively influence tourism development, with the public service functions of government websites contributing most significantly. This highlights the greater importance of service orientation in driving industry development, aligning with the core concept of public value creation in digital government theory.
The results of the structural model analysis indicate that the service content of tourism government websites has a significant positive impact on tourism development (path coefficient = 0.321, p < 0.05), whereas the effect of the website quality index (WQI) is not statistically significant (path coefficient = 0.282, p > 0.05). The overall explanatory power of the model is 24.4% (R2 = 0.244), suggesting that while tourism government websites play a role in promoting tourism development, their influence is limited.
This outcome warrants interpretation from both theoretical and practical perspectives. From a theoretical standpoint, the findings support the central tenet of New Public Service (NPS) theory, which emphasizes a service-oriented government. The fact that service content exerts a stronger influence than technical indicators suggests that the value of government websites lies primarily in the substantive services and content they provide, rather than in their technological sophistication. This corroborates the “steering rather than rowing” perspective articulated by Denhardt and Denhardt [18], highlighting the shift of government roles from controllers to service providers in the digital era.
Although the explanatory power of 24.4% may appear modest, it is comparable to the 22.7% explanatory power reported by Zhou et al. [51] regarding smart destination platforms, indicating that as a single policy tool, the influence of government websites is inherently constrained. These platforms must work in concert with other policy instruments to produce greater effects.
An analysis of the relative weights of individual service dimensions further reveals that public service functions (weight = 0.611) far outweigh administrative management (0.368) and information management (0.238). This disparity in weights reflects a broader shift in digital governance—from traditional information dissemination platforms to service-oriented portals. These findings echo the research by Li Xin [29] on the construction of government online service halls, which emphasizes that user needs and experiences are becoming central to the digital transformation of public administration. The relatively weak impact of information management also merits reflection, as it may signal systemic deficiencies in information disclosure or ineffective presentation formats that fail to capture users’ attention.
From a practical perspective, these findings offer direct implications for the development of tourism government websites. The significant influence of service content suggests that the key to enhancing the utility of such platforms lies in optimizing service-related functions, particularly by strengthening public service capabilities. It is recommended that local tourism authorities prioritize the development of online processing services, interactive features, and integrated resource access, rather than merely publishing policy documents and news. Such an approach would better align with the actual needs of businesses and tourists alike.
4.2. The Mediating Effect of the Quantity and Types of Tourism Resources
To test Hypothesis 2, this study incorporates “the quantity and types of tourism resources” as a mediating variable to analyze its role in the relationship between tourism administration websites and tourism development.
4.2.1. Evaluation of the Measurement Model
After adding the “tourism resource quantity and type” variable, the adjusted measurement model was evaluated. The internal consistency and convergent validity of “tourism development” remained satisfactory (Cronbach’s α = 0.871, composite reliability = 0.912). Within the “tourism development” construct, the composite reliability of star-rated hotels was 0.831, travel agencies 0.785, tourism revenue 0.911, and tourist arrivals 0.869, confirming indicator reliability across all four measures.
“Tourism resource quantity and type”, as a formative construct, underwent collinearity and weight significance testing, retaining three indicators: “geographical landscape resources” (weight = 0.338), “water landscape resources” (weight = 0.443), and “folk custom resources” (weight = 0.512), while excluding the proportions of 4A scenic spots, 5A scenic spots, and other resource types, as shown in Table 4.
Table 4.
Evaluation results of the adjusted formative indicator measurement model.
Among the retained indicators, folk culture resources exhibited the highest impact (weight = 0.512), followed by water landscape resources (weight = 0.443) and geomorphological landscape resources (weight = 0.338). These findings suggest that cultural tourism resources, such as folk customs and traditions, may play a more significant role in promoting tourism development in the digital era.
4.2.2. Evaluation of the Structural Model
- (1)
- Collinearity Assessment
Variance inflation factor (VIF) values for all latent variables were below the threshold of 5, indicating no collinearity issues.
- (2)
- Path Coefficients and Effect Size Analysis
The results show that the path coefficient from “tourism resource quantity and type” to “website service content” is 0.217 (t = 0.877, p > 0.05), to “website quality index (WQI)” is 0.142 (t = 0.706, p > 0.05), and to “tourism development” is 0.223 (t = 1.163, p > 0.05), all of which are not statistically significant. The effect sizes for each path were also low (f2 < 0.15), as shown in Table 5.
Table 5.
Collinearity of latent variables and path coefficients in structural models.
- (3)
- Analysis of the Coefficient of Determination (R2)
After incorporating “tourism resource quantity and type”, the model’s explanatory power for “tourism development” dropped from 24.4% to 19.2%, as shown in Figure 3, suggesting the potential existence of complex interaction or suppression effects rather than a simple mediating role.
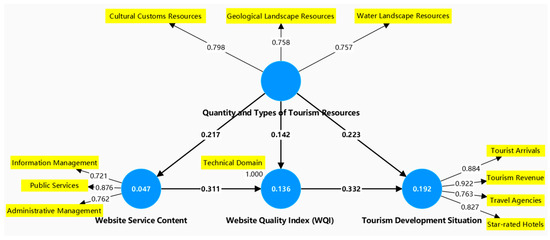
Figure 3.
The influence model of tourism resources quantity and type as mediating variables on the development of tourism industry.
This decrease in explanatory power may be attributed to several factors: first, a possible nonlinear relationship exists between tourism resources and government website services that the linear model could not accurately capture; second, different types of tourism resources may exert opposing influences on website service content and tourism development, canceling out some effects; third, interactive effects between tourism resources and government website services may reduce the overall explanatory power when the mediating variable is added.
Nevertheless, the direction of the path coefficients indicates that “tourism resource quantity and type” positively influences “website service content” (0.217), “website quality index” (0.142), and “tourism development” (0.223), supporting the view that tourism resources positively affect government website services and tourism development. Furthermore, among “tourism resource quantity and type”, “folk custom resources” (0.512) carried more weight than “water landscape resources” (0.443) and “geographical landscape resources” (0.338), indicating that cultural tourism resources may exert a greater influence on tourism development in the digital age. The positive path coefficients imply that provinces featuring more descriptive content on geographical landscapes, water landscapes, and folk customs in their government websites tend to exhibit higher website quality indices, richer website service content, and better tourism development.
Although tourism resources did not exhibit a statistically significant mediating effect, the internal differentiation among resource types offers important insights. One possible explanation for the nonsignificant mediation is the comprehensive nature of tourism resource presentation on Baidu Baike, which may obscure measurable variance. Nonetheless, the study reveals that intangible cultural resources—particularly folk customs—carry greater weight in influencing the relationship between government platform content and tourism development than natural landscape resources. This finding highlights the unique advantage of digital platforms in conveying “soft resources” and cultural identity, aligning with the growing research focus on cultural tourism [52].
From the perspective of resource dependence theory, the content development of tourism government websites is, to some extent, reliant on local resource endowments, especially those with distinct cultural value and communication potential. Such resources are more likely to attract tourist interest in digital environments. A prime example is the Ganzi Prefecture Bureau of Culture and Tourism, which promoted local attractions such as Luding Bridge, Mugecuo Lake, and Maoya Grassland through multimedia campaigns. These efforts have significantly contributed to the growth of Ganzi’s tourism sector [53].
However, the varying effects of different resource types also expose a critical issue: the current lack of precise content targeting and resource integration capabilities on many government platforms. This limitation warrants further investigation in future studies.
Additionally, the model’s explanatory power declined after incorporating tourism resources as a variable—dropping from 24.4% to 19.2%—a counterintuitive result that invites critical reflection. Several possible explanations can be offered. First, the measurement of tourism resources in this study was based on content analysis rather than actual levels of resource development, potentially underestimating the influence of resource quality and utilization. Second, there may be a suppressor effect between resources and platform functions; in regions with abundant natural or cultural assets, governments might allocate fewer resources to developing digital services. Third, the use of Baidu Baike as a data source has inherent limitations and may not fully capture the actual richness or promotional status of regional tourism resources.
These limitations suggest that future research should adopt more refined indicators for measuring tourism resources, incorporating field investigations and diverse data sources to better understand how resources function within the broader dynamics of digital governance and tourism industry development.
4.3. The Moderating Effect of Provincial Economic Comprehensive Competitiveness
To test Hypothesis 3, this study introduces “provincial economic competitiveness” as an external variable and analyzes its moderating effect on the relationship between tourism government websites and tourism development.
4.3.1. Evaluation of the Measurement Model
As a formative construct, “provincial economic competitiveness” underwent multicollinearity testing and weight significance testing. The indicators for “industrial economic competitiveness” (9.402), “macroeconomic competitiveness” (15.356), and “knowledge economic competitiveness” (12.524) were all greater than 5.000, as shown in Table 6; therefore, these measurement indicators were deleted. Additionally, the “sustainable development competitiveness” indicator was found to be statistically insignificant. Consequently, the following five indicators were retained: “development level competitiveness”, “development environment competitiveness”, “government role competitiveness”, “coordination competitiveness”, and “fiscal and financial competitiveness”.
Table 6.
Measurement indicators for “provincial economic comprehensive competitiveness”.
4.3.2. Evaluation of the Structural Model
- (1)
- Collinearity Assessment
The variance inflation factor (VIF) values for all latent variables were below 5, indicating no collinearity issues in the structural model.
- (2)
- Path Coefficients and Effect Size Analysis
The results show that “provincial economic competitiveness” has a statistically significant path coefficient of 0.541 (t = 3.658, p < 0.01) for “tourism development”, with a high effect size (f2 = 0.549). However, the impact of “provincial economic competitiveness” on both the “website quality index (WQI)” (path coefficient = 0.097, t = 0.502, p > 0.05) and “website service content” (path coefficient = 0.032, t = 0.157, p > 0.05) was not significant.
Notably, after the inclusion of “provincial economic competitiveness”, the path coefficient for “website quality index (WQI)” on “tourism development” became statistically significant (0.279, t = 2.249, p < 0.05), as shown in Table 7, indicating that economic competitiveness may have strengthened the relationship between website quality and tourism development.
Table 7.
Collinearity of latent variables and path coefficients in structural models.
- (3)
- Analysis of the Coefficient of Determination (R2)
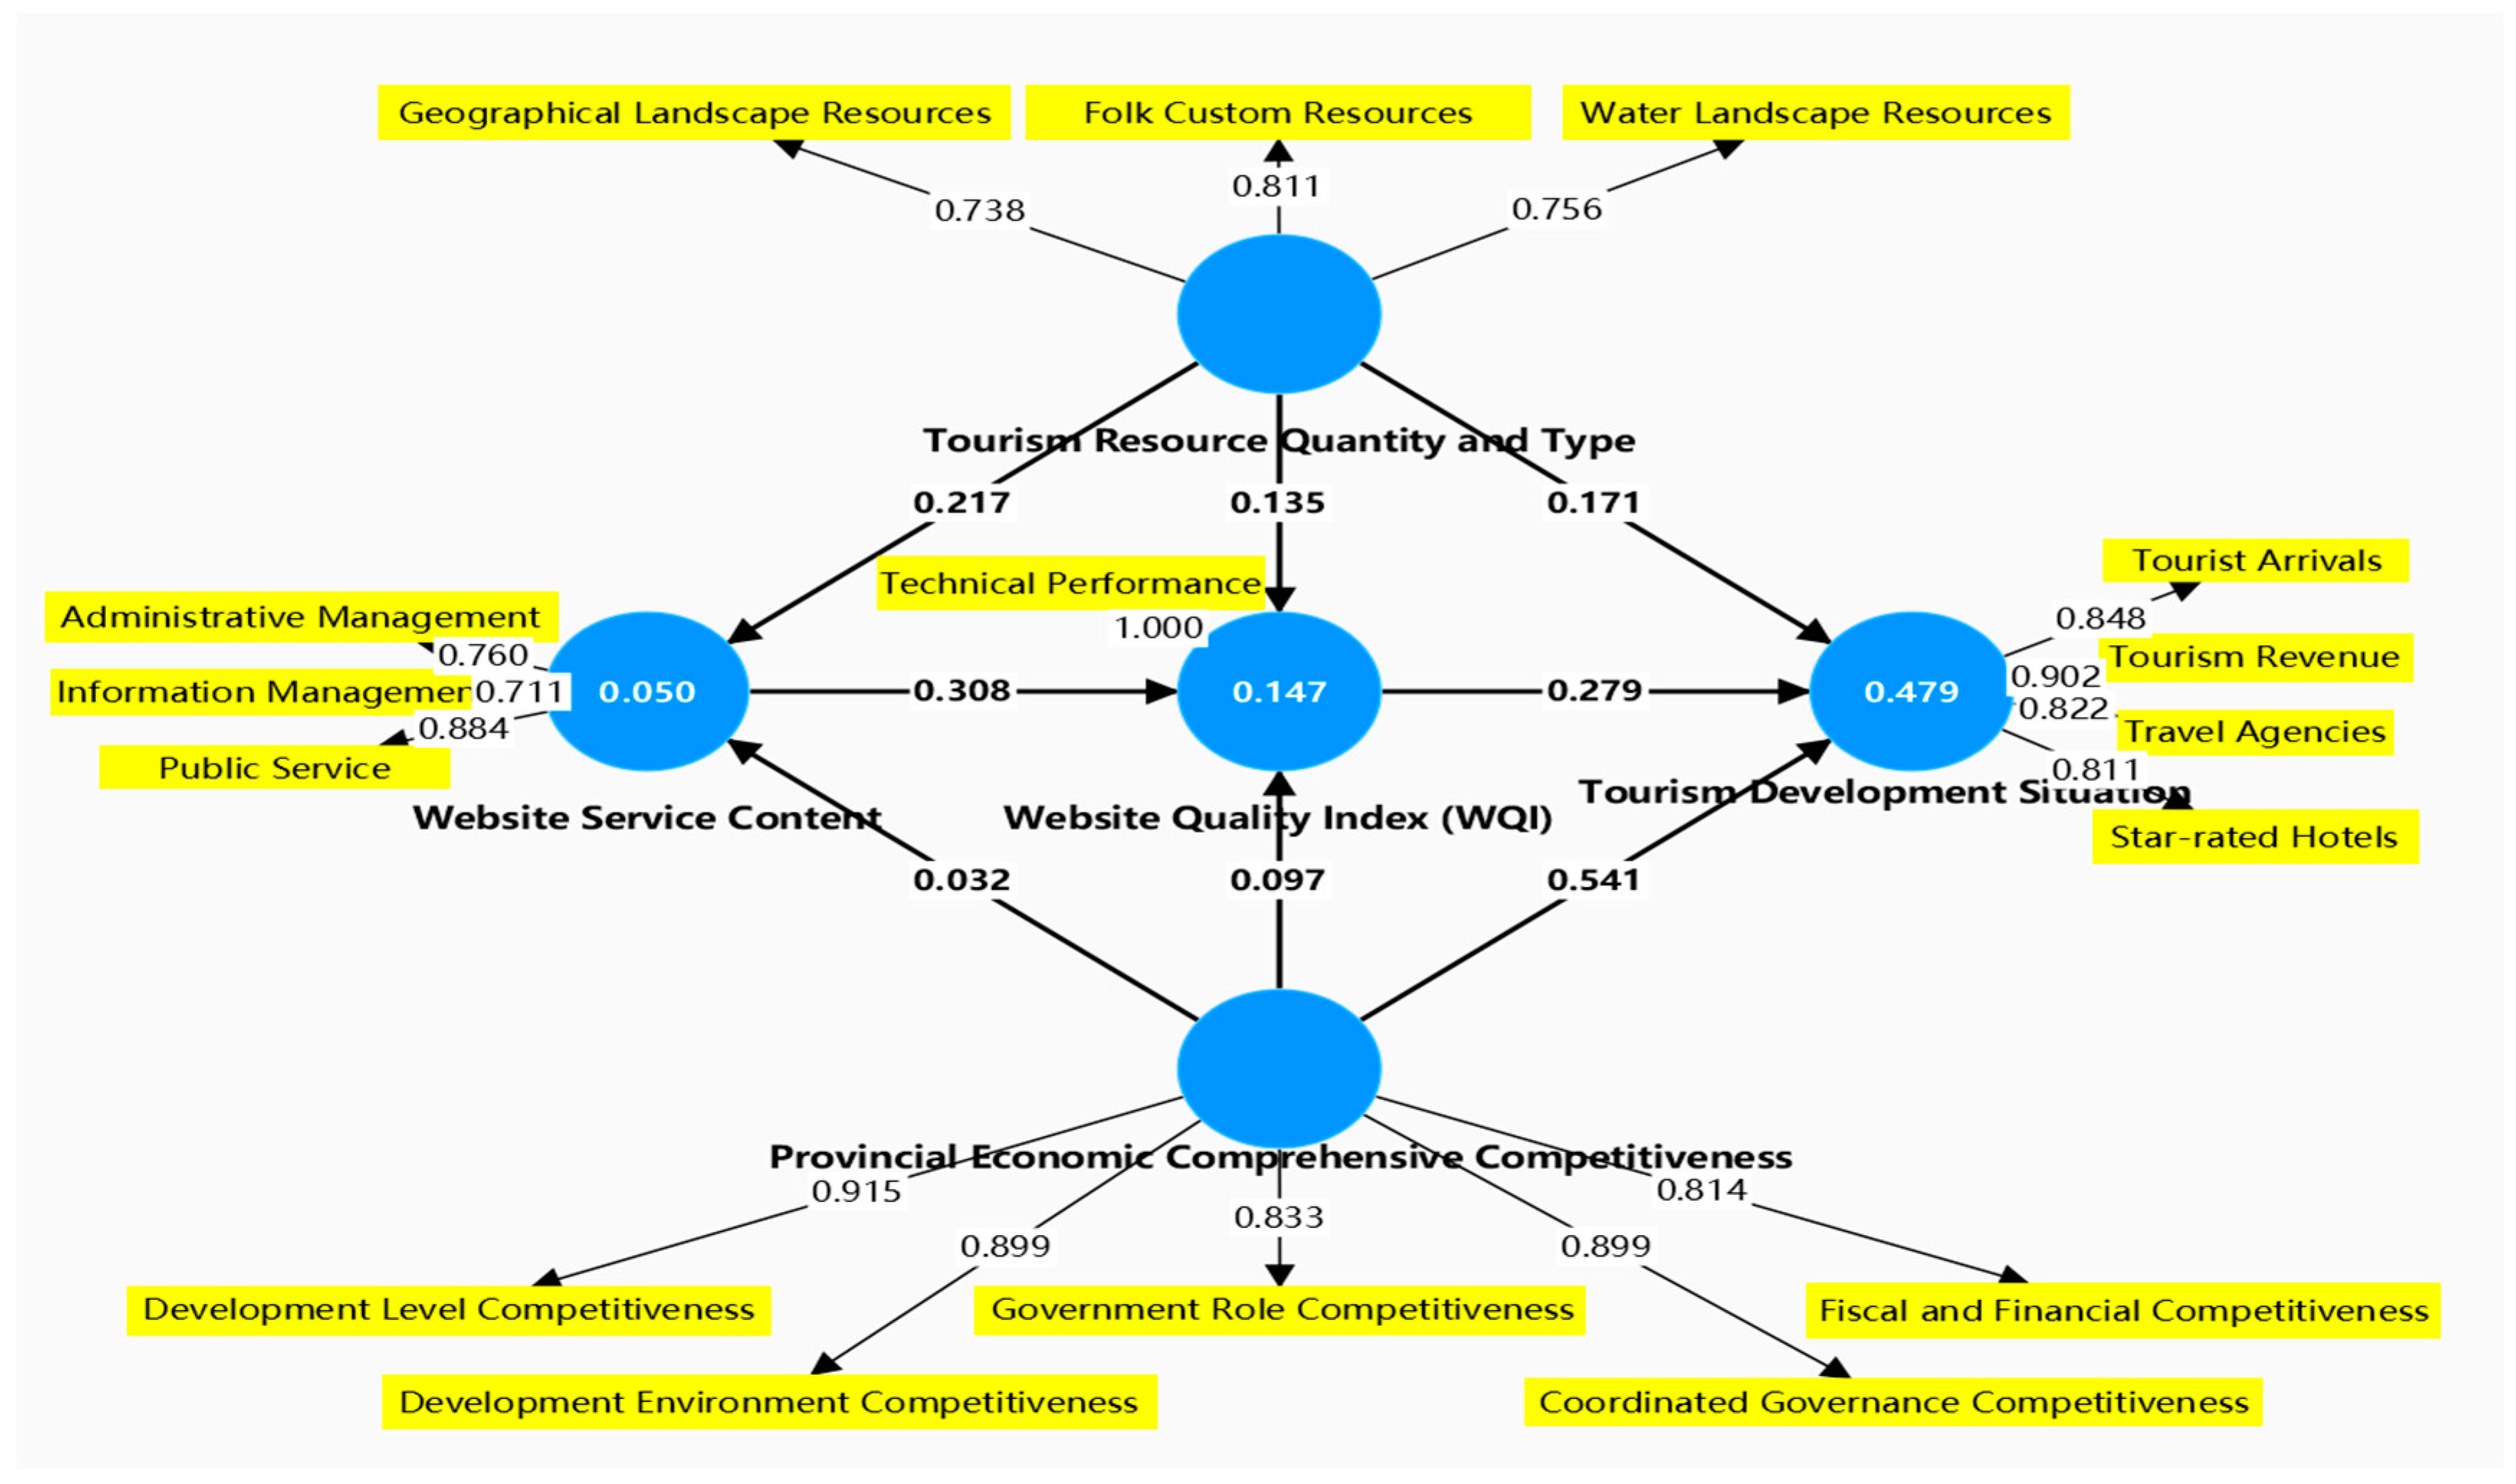
When only “tourism resources quantity and type” was included as a mediator, the R2 for the latent variables’ explanatory power on tourism development was 0.192, indicating a low explanatory level. However, after incorporating “provincial economic competitiveness” as an external variable, the R2 increased to 0.479, as shown in Figure 4, demonstrating a moderate level of explanatory power. The inclusion of the mediator “tourism resources quantity and type” accounted for 19.2% of the variation in tourism development. With the addition of “provincial economic competitiveness”, this explanatory power increased to 47.9%, suggesting that “provincial economic competitiveness” is a crucial factor influencing the relationship between the independent and dependent variables. The path coefficient for “provincial economic competitiveness” to tourism development was 0.541, while the path coefficients for website service content and website quality index (WQI) were 0.032 and 0.097, respectively, indicating positive correlations. This implies that stronger provincial economic competitiveness, including development level competitiveness (industrialization, urbanization, etc.), development environment competitiveness (infrastructure, social environment, policy), government role competitiveness (economic stimulation, price control, urban-rural gaps, social insurance coverage), coordination competitiveness (labor productivity, energy usage reduction), and fiscal and financial competitiveness (fiscal balance, per capita deposits, number of listed companies), leads to better website service content, better WQI, and improved tourism development.

Figure 4.
The influence model of provincial economic comprehensive competitiveness as an external variable on the development of the tourism industry.
The powerful moderating effect of provincial economic competitiveness is one of the key findings of this study. After incorporating this variable, the model’s explanatory power significantly increased to 47.9%, confirming that the economic environment is a key external condition influencing the effectiveness of digital governance. Importantly, the weights for “development level competitiveness” (0.268) and “government role competitiveness” (0.267) are nearly identical, suggesting that urbanization processes and government governance abilities play equally important roles in digital transformation. A critical observation is that after including the economic competitiveness variable, the effect of the website quality index on tourism development became significant (increased from 0.282 to 0.279, p < 0.05), indicating that the economic environment may enhance the connection between government website quality and tourism development.
In terms of the differential moderating effects, the most significant influences came from “development level competitiveness” and “government role competitiveness” among the five economic competitiveness dimensions. This highlights the crucial role of urbanization processes and government governance abilities in enhancing the effectiveness of digital governance. However, a potential paradox emerges: in more economically developed regions, the marginal contribution of government websites to tourism development may be smaller, as these regions already possess more diversified drivers for tourism growth. This finding suggests that digital government initiatives should not be viewed as a one-size-fits-all solution for promoting tourism, but rather should be tailored according to the region’s stage of development and available resources.
5. Conclusions and Recommendations
5.1. Conclusions
The study finds three key conclusions regarding the relationship between government websites and tourism development.
First, government websites have a positive but limited impact on tourism development, with an explanatory power of 24.4%. Among the website functions, public service functions have a significantly higher contribution (weight: 0.611) than administrative management (0.368) and information management (0.238). This moderate explanatory power should be understood dialectically. On one hand, it suggests that digital governance is just one of many factors influencing tourism development, aligning with Zhou et al.’s [51] finding that smart destination strategies explain 21.8% of tourism development. On the other hand, it highlights the limitations of using notifications and announcements as content proxies for government websites, as they may not fully capture the scope of website functions. Despite this, the significant contribution of public service functions affirms the application of new public service theory in the context of digital governance.
Second, while tourism resources did not show a significant mediating role between e-government and tourism development, the analysis of different resource types revealed that cultural resources (weight: 0.512) contribute more to tourism development than water landscapes (0.443) and geological landscapes (0.338). This finding may be explained by the advantages of “soft resources” in the digital environment, consistent with Richards’ [52] observations on the significant added value of cultural tourism elements in digital media. The absence of a significant mediating effect contrasts with Zavattaro and Bryer’s [54] research, which found a positive correlation between resource abundance and government website effectiveness. This discrepancy may be due to differences in resource measurement methods, indicating a more complex, nonlinear relationship between resources and e-government than a simple mediation effect.
Third, provincial economic competitiveness significantly moderates the relationship between government websites and tourism development, increasing the model’s explanatory power to 47.9%. This strong moderating effect highlights the crucial role of regional economic conditions in the effectiveness of digital governance, in line with the regional innovation systems theory. The roles of development level competitiveness (weight: 0.268) and government action competitiveness (weight: 0.267) are consistent with Zhang et al.’s [4] findings on the role of government economic governance capacity in promoting high-quality tourism development. Notably, after introducing economic competitiveness variables, the previously insignificant website quality index became significant (path coefficient increased from 0.282 to 0.279, p < 0.05). This interaction effect suggests that the impact of technical quality may be either enhanced or suppressed depending on regional economic conditions.
5.2. Recommendations
5.2.1. Differentiated Strategies
The study results indicate that the impact of tourism government websites on tourism development is significantly moderated by the regional economic environment. Therefore, it is recommended to implement differentiated digital service strategies based on the economic development level and resource endowments of each region. For economically developed areas, where there is a strong foundation for tourism development, government websites should focus on providing innovative and personalized service functions, such as smart tourism recommendations and one-stop service platforms. These advanced features would enhance the digital representation and dissemination of regional tourism brands. For economically underdeveloped regions, given the significant contribution of public service functions (weight: 0.611) to tourism development, priority should be given to improving core public services, such as online service applications and complaint handling, to maximize service effectiveness with limited resources. This recommendation directly responds to the empirical finding in the study that the contribution of public service functions is significantly higher than that of administrative management and information management functions.
5.2.2. Resource-Oriented Website Design
The study found significant differences in the impact of different types of tourism resources on government platform content production and tourism development. Specifically, cultural resources (weight: 0.512) contribute more to tourism development than natural landscape resources. Based on this finding, it is recommended that government websites adopt a resource-oriented, differentiated strategy for content development. For regions rich in cultural resources, government platforms should enhance the digital expression of cultural IP, creating immersive digital experiences such as VR folk experiences and digital exhibitions of intangible cultural heritage. This approach takes full advantage of the digital platform’s strengths in cultural dissemination. As found in the study, the effectiveness of cultural resources in digital environments is higher than that of natural landscape resources, and the digital expression of “soft resources” may be more engaging for users. For regions abundant in natural landscape resources, the focus should be on integrating geological and water resources with emerging tourism formats, such as promoting outdoor sports experiences and eco-tourism routes through digital content, overcoming the limitations of purely natural resources in digital representation. This recommendation directly addresses the study’s finding that the influence of geological and water landscape resources is relatively limited in digital environments.
5.2.3. Prioritizing Technological Functionality
In enhancing website quality, priority should be given to optimizing technological functions, such as ensuring the stability of service systems and enhancing cybersecurity measures. These factors directly affect user experience and service efficiency. The study reveals that the technological dimension is crucial for ensuring government website quality and serves as the foundation for maximizing service effectiveness.
5.2.4. Strengthening Public Services
Given that the weight of public service factors (0.611) is significantly higher than that of administrative management (0.368) and information management (0.238), local governments should strengthen the public service functions of their websites. Key areas for improvement include online service applications, visitor inquiries and complaints, and stakeholder coordination, promoting the transformation of government websites from “management-oriented” to “service-oriented” platforms.
5.3. Research Limitations and Future Directions
Despite the contributions of this study, several limitations need to be critically addressed.
First, the sample is limited to cross-sectional data from 31 provincial-level administrative regions, without considering time-based analysis. This restricts the ability to capture the dynamic evolution of e-government and tourism development and makes it difficult to control for potential endogeneity issues. For example, regions with higher levels of tourism development may invest more in building government websites, which could lead to reverse causality, affecting the validity of the results.
Second, the explanatory power of the model is relatively low at 24.4%, suggesting that there are significant unexplained factors. This limitation could stem from the measurement methods used for government website services, which primarily rely on analysis of announcement titles and may not fully capture the breadth of website functions. Additionally, important factors like marketing efforts and infrastructure development were not considered in the study, and the assumption of linear relationships among variables may overlook possible nonlinear interactions.
Third, tourism resource data were sourced from Baidu Baike, which may not fully cover all resources or may be biased in public perception. While the study found differences in the influence of different types of resources (e.g., geological landscapes, water landscapes, cultural elements), the mechanisms underlying these differences, such as resource development level, management quality, and accessibility, were not fully explored.
Fourth, from a methodological perspective, although PLS is suitable for small sample studies, the sample size of 31 may still lead to insufficient statistical power when testing complex models. The simultaneous testing of mediation and moderation effects increased the model’s complexity, which may have reduced the stability of parameter estimates.
Given these limitations, future research could expand in several directions. One avenue would be to conduct longitudinal studies using panel data to better control for time effects and endogeneity issues. Another would be to refine the measurement of government website functions, incorporating user experience evaluations and real usage data for more comprehensive assessments. Additionally, a more sophisticated resource evaluation system could be developed, incorporating multiple dimensions such as resource development level, quality, and accessibility. Expanding the sample size to include municipal-level or tourism destination-level units could also increase statistical power and improve the robustness of the findings. Lastly, future research could explore more complex nonlinear models, such as threshold effect models or multi-level interaction models, to more accurately reflect the complex relationships between variables. These improvements would deepen the understanding of the relationship between e-government and tourism development.
Author Contributions
Conceptualization, C.L.; methodology, J.-P.S.; software, H.-R.W.; validation, Y.F. and C.L.; formal analysis, H.-R.W.; investigation, H.-R.W.; resources, Y.F.; data curation, J.-P.S.; writing—original draft preparation, H.-R.W.; writing—review and editing, Y.F.; visualization, H.-R.W.; supervision, C.L.; project administration, Y.F.; funding acquisition, Y.F. All authors have read and agreed to the published version of the manuscript.
Funding
This research received no external funding.
Institutional Review Board Statement
Not applicable.
Informed Consent Statement
Not applicable.
Data Availability Statement
If necessary, you can ask the corresponding author for the data.
Conflicts of Interest
The authors declare no conflict of interest.
References
- State Council. 14th Five-Year Digital Government Construction Plan. China Government Website, 2021. Available online: https://www.gov.cn/zhengce/content/2022-01/12/content_5667817.htm (accessed on 6 December 2024).
- Yang, Y.; Luo, A.; Liu, Z.; Li, H.; Zhao, Z. Research on the Digital Transformation of Service-Oriented Government under the Background of Digital Government Construction. East China Sci. Technol. 2024, 2, 78–80. [Google Scholar]
- Li, Y.; Mai, M.U. The Practical Dilemma and Optimization Path of Rural E-Government Service Platforms. Smart Agric. Guide 2025, 5, 18–21. [Google Scholar]
- Zhang, H.; Xia, Z.; Zeng, Z. The Economic Governance Capability of the Government and High-Quality Development of China’s Tourism Industry. Sustainability 2024, 16, 7370. [Google Scholar] [CrossRef]
- Jiao, K. Research on Government Functions in the Development of Tourism in Zhengding County. Master’s Thesis, Hebei Normal University, Shijiazhuang, China, 2021. [Google Scholar]
- Li, J.P.; Li, M.R.; Li, J.J.; Su, H.W.; Huang, M.X. China Provincial Economic Comprehensive Competitiveness Development Report (2017–2018); Social Science Literature Publishing House: Beijing, China, 2019. [Google Scholar]
- Sousa, N.; Alén, E.; Losada, N.; Melo, M. Breaking Barriers: Unveiling Challenges of Introducing Virtual Reality for Managers in the Tourism Industry. Tour. Hosp. Manag. 2024, 30, 269–282. [Google Scholar] [CrossRef]
- Sousa, N.; Alén, E.; Losada, N.; Melo, M. The Adoption of Virtual Reality Technologies in the Tourism Sector: Influences and Post-Pandemic Perspectives. J. Tour. Herit. Serv. Mark. 2024, 10, 47–57. [Google Scholar] [CrossRef]
- Li, S. Digital Economy and High-Quality Development of Tourism. Shanxi Univ. Financ. Econ. J. 2025, 47 (Suppl. 1), 70–72. [Google Scholar]
- Ministry of Culture and Tourism of the People’s Republic of China. 2023 Cultural and Tourism Development Statistical Bulletin; Ministry of Culture and Tourism of the People’s Republic of China: Beijing, China, 2023. [Google Scholar]
- Yang, C. Study on the High-Quality Development Level and Influencing Factors of Tourism Industry in Shandong Province. Master’s Thesis, Qufu Normal University, Qufu, China, 2021. [Google Scholar]
- Wu, L. Research on Government Support Strategies in the Development of Smart Tourism in Xuzhou. Master’s Thesis, China University of Mining and Technology, Xuzhou, China, 2019. [Google Scholar]
- China Tourism Research Institute. National Smart Tourism Development Report; China Tourism Research Institute: Beijing, China, 2024. [Google Scholar]
- Zhang, G.; Wang, D.; Cheng, S. Research on the Driving Mechanism of High-Quality Development in Resource-Dependent Industries. China Soft Sci. 2021, 10, 56–68. [Google Scholar]
- Zhang, P.; Zhang, L.; Qiao, H.; Tian, L. Spatiotemporal Evolution and Regional Disparities of High-Quality Development of China’s Tourism Economy: Based on the New Development Concept. J. Cent. China Norm. Univ. 2024, 58, 470–480. [Google Scholar]
- Wang, Y.; Gui, C. Measurement, Regional Differences, and Spatiotemporal Evolution of High-Quality Development in China’s Tourism Economy. J. Lanzhou Univ. Financ. Econ. 2024, 40, 109–124. [Google Scholar]
- Hu, H.; Zhou, Y.; Zheng, Y. Evaluation of Tourism Investment Functions Based on Website Platforms—A Case Study of Official Tourism Government Websites in 31 Provinces. Resour. Dev. Mark. 2010, 26, 752–754. [Google Scholar]
- Denhardt, R.B.; Denhardt, J.V. The New Public Service: Serving Rather Than Steering. Public Adm. Rev. 2000, 60, 549–559. [Google Scholar] [CrossRef]
- Liu, Q.; Liang, B.; Chen, X. Study on the Construction of Local Government Portal Websites: A Service Function Perspective. E-Gov. 2021, 3, 44–53. [Google Scholar]
- Hood, C. A Public Management for All Seasons? Public Adm. 1991, 69, 3–19. [Google Scholar] [CrossRef]
- Osborne, S.P. (Ed.) The New Public Governance? In Emerging Perspectives on the Theory and Practice of Public Governance; Routledge: Oxfordshire, UK, 2010. [Google Scholar]
- Zhang, X.; Kong, S. Research on the Constructing Path of Rural Cooperative Organizations and Resource Relationships—Based on Resource Dependence Theory. Econ. Forum 2024, 11, 50–57. [Google Scholar]
- Fernández-Cavia, J.; Rovira, C.; Díaz-Luque, P.; Cavaller, V. Web Quality Index (WQI) for Official Tourist Destination Websites: Proposal for an Assessment System. Tour. Manag. Perspect. 2014, 9, 5–13. [Google Scholar] [CrossRef]
- Zhu, J.; Lu, X. Mechanisms and Spatial Effects of Digital Economy Enhancing Tourism Economic Resilience. Geogr. Sci. Prog. 2024, 43, 2004–2020. [Google Scholar]
- Cooke, P. Regional Innovation Systems, Clusters, and the Knowledge Economy. Ind. Corp. Change 2001, 10, 945–974. [Google Scholar] [CrossRef]
- Ma, H.; Wang, M.; Wang, F.; Guo, H. The New Regional Innovation System under New Productivity: Framework and Construction Path—A Case Study of Tianjin. China Sci. Technol. Forum 2025, 1, 15–25. [Google Scholar]
- Zhu, L. Research and Application of Government Websites Based on Cloud Computing. Master’s Thesis, Nanjing University of Posts and Telecommunications, Nanjing, China, 2018. [Google Scholar]
- Lei, Y. Research on the Development of Government Websites as Internet Celebrities from the Perspective of Good Governance. Master’s Thesis, Zhejiang Sci-Tech University, Hangzhou, Chian, 2022. [Google Scholar]
- Li, X. Research on the Construction of Government Online Service Halls—Taking ‘Qingdao Government Website’ as an Example. Econ. Trade Pract. 2018, 14, 264. [Google Scholar]
- Guo, T. Research on the Impact Mechanism of Resource-Based Regional Tourism Development on Economic Structure Transformation. J. Shanxi Youth Vocat. Coll. 2024, 37, 95–99. [Google Scholar]
- Wei, M.; Wei, H.; Xu, R. Research on the Impact of Digital Economy on Regional Tourism Economic Growth. Stat. Inf. Forum 2023, 38, 59–70. [Google Scholar]
- Zhang, Q.; Song, R. Research on the Impact of Digital Governance on the Integrated Development of Culture and Tourism—An Empirical Study Based on the TOE Framework. Tour. Forum 2024, 17, 94–104. [Google Scholar]
- Ying, H. Research on the Development of Cultural and Tourism New Media Platforms—A Case Study of Zhejiang Provincial Department of Culture and Tourism’s New Media Platform Operations. News Res. Guide 2023, 14, 103–105. [Google Scholar]
- Wang, Z.; Tang, G. Research on the Spatial Dislocation of Provincial Tourism Competitiveness and Tourism Network Attention in China’s Yangtze River Delta. Geogr. Geogr. Inf. Sci. 2024, 40, 142–150. [Google Scholar]
- Li, X. E-Government Digitization Promotes Tourism Development—Based on the Mediating Effect of Tourism Resources and the Moderating Effect of Provincial Economic Competitiveness. China Bus. Theory 2025, 4, 26–29. [Google Scholar]
- UNWTO; IFC. Tourism for Development—Volume IV: Tourism Destination Management; World Tourism Organization: Madrid, Spain, 2019. [Google Scholar]
- Niu, Y. Research on the Indicator System for Sustainable Development of the Tourism Industry. China Popul. Resour. Environ. 2002, 12, 42–45. [Google Scholar]
- Peng, D. Preliminary Exploration of the Construction of Tourism Development Index. Coop. Econ. Sci. Technol. 2004, 10, 20. [Google Scholar]
- Liu, X. International Recommendations on Tourism Statistics and Their Implications for China. World Res. 2016, 10, 47–52. [Google Scholar]
- Xi, G. Research on the Construction of Digital Tourism Service Information Platform in China. Inf. Syst. Eng. 2013, 12, 124–125. [Google Scholar]
- Zhan, Z.; Wang, Y.; Wu, L.; Zhang, X. Government Website Evaluation Using DEA Model. Oper. Res. Manag. 2006, 15, 97–102. [Google Scholar]
- Lu, Y. Modern Tourism Geography; Landscape Enterprise Co., Ltd.: Taipei, Taiwan, 1993. [Google Scholar]
- Zeng, Q. Current Situation and Sustainable Development Planning of Sichuan’s Geoscience Tourism. Sustain. Dev. 2013, 3, 143–154. [Google Scholar]
- Li, M.; Guo, J. Tourism and Recreation Resource Planning, 2nd ed.; Yangzhi Culture: New Taipei City, Taiwan, 2015. [Google Scholar]
- Ren, Y.; Lu, L.; Han, Y. Research Framework on Tourism Resources from the Perspective of New Tourism Resource Views. J. Nat. Resour. 2022, 37, 551–567. [Google Scholar]
- Zhu, W.; Dong, C. Study on the Spatiotemporal Evolution and Influencing Factors of 5A Tourist Attractions in China. World Sci. Technol. Res. Dev. 2016, 38, 1084–1090. [Google Scholar]
- Wang, Z.; Qian, Z.; Wang, B.; Zhen, Y. Analysis of the Normative Documents of Green Building Design in the Yangtze River Delta—Based on Content Analysis. New Archit. 2020, 5, 98–103. [Google Scholar]
- Zeng, Y. Automatic Indexing, Automatic Classification, and Automatic Abstracting; Huatai Bookstore: Taipei, Taiwan, 1997. [Google Scholar]
- Hair, J.F.; Hult, G.T.M.; Ringle, C.M.; Sarstedt, M. A Primer on Partial Least Squares Structural Equation Modeling (PLS-SEM), 2nd ed.; Sage: Los Angeles, CA, USA, 2017. [Google Scholar]
- Hair, J.F., Jr.; Hult, G.T.M.; Ringle, C.; Sarstedt, M. (Eds.) Structural Equation Modeling: Partial Least Squares (PLS-SEM); Tang, J., Translator; Higher Education Press: Taipei, Taiwan, 2016. [Google Scholar]
- Zhou, L.; Song, Y.; Zeng, L.; Liu, J.; Xie, K. Attracting Digital Nomads: Smart Destination Strategies, Innovation, and Competitiveness. J. Destin. Mark. Manag. 2024, 33, 100835. [Google Scholar] [CrossRef]
- Richards, G. Cultural Tourism: A Review of Recent Research and Trends. J. Hosp. Tour. Manag. 2018, 36, 12–21. [Google Scholar] [CrossRef]
- Ma, X. The Spread and Path of Government Websites Becoming ’Internet Celebrities. News Res. Guide 2023, 14, 101–103. [Google Scholar]
- Zavattaro, S.M.; Bryer, T.A. The Potential for Branding in Local Government Websites: A Content Analysis and Proposed Typology. J. Public Aff. 2016, 16, 285–294. [Google Scholar]


Disclaimer/Publisher’s Note: The statements, opinions and data contained in all publications are solely those of the individual author(s) and contributor(s) and not of MDPI and/or the editor(s). MDPI and/or the editor(s) disclaim responsibility for any injury to people or property resulting from any ideas, methods, instructions or products referred to in the content. |
© 2025 by the authors. Licensee MDPI, Basel, Switzerland. This article is an open access article distributed under the terms and conditions of the Creative Commons Attribution (CC BY) license (https://creativecommons.org/licenses/by/4.0/).