Article

The Impact of Digital Village Construction on the Comprehensive Efficiency of Eco-Agriculture: An Empirical Study Based on Panel Data from 53 Counties in Fujian Province

by
Wenqi Lian
1,
Zexi Xue
2,
Gaiyan Ma
1 and
Fangfang Zeng
1,*
1
College of Rural Revitalization, Fujian Agriculture and Forestry University, Fuzhou 350002, China
2
College of Computer and Information Sciences, Fujian Agriculture and Forestry University, Fuzhou 350002, China
*
Author to whom correspondence should be addressed.
Sustainability 2025, 17(9), 3840; https://doi.org/10.3390/su17093840
Submission received: 4 March 2025 / Revised: 21 April 2025 / Accepted: 22 April 2025 / Published: 24 April 2025
(This article belongs to the Section Sustainable Agriculture)

Abstract

:
This study is based on panel data from 53 counties in eight prefectural-level cities in Fujian Province, spanning from 2012 to 2022. It employs the entropy method, DEA-SBM model, fixed-effects spatial Durbin model, and spatial autoregressive model to investigate the impact of digital village construction on the comprehensive efficiency of eco-agriculture in Fujian. The results are as follows: (1) During the study period, the comprehensive efficiency of eco-agriculture in 53 counties of Fujian showed a fluctuating upward trend. (2) The level of digital village construction in Fujian exhibited notable regional variation, with the following ranked order: Central region > Southern region > Eastern region > Western region > Northern region. (3) A significant spatial positive effect was observed on eco-agricultural efficiency, with H-H and L-L spatial correlation patterns. (4) Digital village construction significantly improved the comprehensive efficiency of eco-agriculture in Fujian, but no spatial spillover effect was observed. Based on these findings, this study recommends strengthening technological innovation, enhancing regional exchanges, and tailoring policies to local conditions. This study applies the theory of technology diffusion in spatial economics to eco-agriculture, aiming to explore the specificity of digital technology spillover and the inhibitory effects of “blocked data-sharing channels” and the “digital divide” on such spillover.

1. Introduction

Fujian Province is one of the first pilot ecological provinces in the country. By treating the entire province as an ecosystem, it has aimed to develop advanced ecosystems in areas such as sanitary cities, garden cities, eco-agriculture, and eco-industry [1]. The construction of eco-provinces should prioritize the development of the eco-economy. This includes fostering several key eco-industries, with eco-agriculture being a core focus in Fujian Province, based on its unique provincial conditions [2]. In terms of eco-agriculture development, Fujian Province places significant emphasis on the protection and development of eco-agriculture. It has established three provincial-level experimental areas for sustainable agricultural development as well as three national and 12 provincial-level pilot counties for eco-agriculture protection, which serve as examples for the nation’s eco-agricultural development.
Traditional villages, which rely on conventional agricultural methods, face several challenges. These include low mechanization and automation, limited information flow through personal communication, and a dependence on primary industries as their sole economic source. These limitations result in low production efficiency, restricted information flow, slow infrastructure development, and lagging technological advancements. Additionally, their resource use is inefficient, the economic model is self-sufficient, and inter-regional communication remains closed, all of which hinder sustainable agricultural development in Fujian [3]. Modern information technology, coupled with rich application scenarios and significant scale effects [4], aims to bridge the “digital divide” between urban and rural areas and achieve equal access to basic public services [5]. As a result, the digital village construction has become a pivotal force for the modernisation of agriculture and rural areas and a central driver for rural revitalisation. The digital village construction extensively integrates digital core technologies in agriculture, rural areas, and farmers [6]. Specifically, it builds a real-time data transmission platform through 5G networks, edge computing, and other modern information technologies, which enhances both the efficiency of digital information transmission and the development of digital infrastructure in rural areas [7]; it creates online tourism platform, expanding rural tourism services, and effectively unlocking the potential of the rural tertiary industry [8]; it relies on biotechnology integrated crop management system, variable rate technology (VRT), and other “smart agriculture” technologies to enhance agricultural mechanization and intelligence [9]; it employed cloud computing and AI agent technology (Artificial Intelligence Agents) to build an online digital training platform based on “data + technology + algorithm” to improve the knowledge and information access of health technicians and extend the reach of rural public health services [9]; it relies on IoT technology (such as LoRa and NB-IoT) to improve rural financial service delivery, establish a robust rural financial system, and provide farmers with strong financial support and abundant loan resources [8]; it builds a rural e-commerce platform based on blockchain technologies (e.g., alliance chain, public chain), promoting digital management to enhance farmers’ income and wealth, while also stimulating rural consumption and upgrading the consumption structure through intelligent products and digital services [10]. Overall digital village construction leverages the empowering effects of digital core technologies to streamline market information exchanges, transform agricultural production methods, enhance farmers’ information access, and achieve significant breakthroughs in information infrastructure, industrial development, technological agriculture, life services, financial services, and quality of life compared to traditional village settings.
In the practice of digital village construction, the focus varies from country to country. For example, digital village construction in the U.S. is focused on building an improved rural information service system [11]. Canada is focused on promoting the integration and sharing of agricultural information resources in order to promote the process of digital village construction [12]. India is focused on building a nationwide informatization promotion and application network in order to promote digital village construction [13]. Finally, China’s digital villages are focused on strengthening the construction of digital infrastructure and promoting the application of digitalization to rural industries, rural governance, and farmers’ lives [14]. Notably, the digital village practices in all countries are also focused on establishing improved digital sharing channels and eliminating the information and technical barriers among regions [15].
The comprehensive efficiency of eco-agriculture evaluates both the positive and negative externalities of agricultural production. It reflects the efficiency of resource use, economic output, rural social benefits, environmental protection, and ecological security, and effectively assesses the relationships among resource inputs, economic and social benefits, and environmental pollution [16]. Commonly used models for measuring the comprehensive efficiency of eco-agriculture include the super-efficient SBM model [17], the nearest distance to the strongest efficient frontier (MINDS) model [18], the modified DEA-SBM model [19], the data envelopment analysis (DEA) model [20], and the super-efficient DEA model [21], among others.
Existing research on the comprehensive efficiency of eco-agriculture has primarily focused on the meso-level, such as national, provincial, and watershed scales in domestic studies [22,23,24,25]. Meanwhile, foreign research concentrates on the micro-level, including agricultural products and agricultural management entities, such as co-operatives and farms [26,27,28]. However, both areas lack research on the comprehensive efficiency of eco-agriculture at the county and township levels [29]. In terms of research perspective, both domestic and international scholars have conducted limited studies on the comprehensive efficiency of eco-agriculture in the temporal and spatial dimensions [30]. Regarding the driving factors, scholars have identified the industrial structure [31], the level of industrialization [32], and the development of the digital economy [33] as key drivers of eco-agricultural development.
At present, there is limited research on the relationship between digital villages and eco-agriculture both domestically and internationally. However, there has been progress in studies on the application of digital technology in village construction and ecological governance. Foreign research primarily focuses on the emission-reduction effects of digital technology [34], the digital-driven sustainable transformation of rural areas [35], and eco-governance within the digital economy [36]. Domestic studies have mainly examined digital technology’s eco-efficiency [37], the environmental impact of digitalization [38], and the role of digital technologies in influencing ecological performance [39,40], among other topics. Although digital technology, as the core element of digital village construction, is a key pathway to improving eco-agriculture efficiency, it is crucial to analyze its impact on the comprehensive efficiency of eco-agriculture from a spatial perspective. This is especially important given the challenges posed by poor data-sharing channels [41] and the widening digital divide [42].
According to spatial economics theory, digital technology has a diffusion effect [43], which can drive technological progress in surrounding regions. The technology diffusion effect refers to the creation of technical links between the growth pole and other regions, promoting inter-regional technological competition and cooperation which, in turn, accelerates technological progress across the entire region [44]. According to the theory of growth poles, digital technology can exert a long-term diffusion effect, fostering technological progress and coordinated development in both the region and neighboring areas. However, technological diffusion is influenced by inter-regional uneven development conditions and development levels, and other factors [45]. As a result, regions with higher development levels experience more pronounced diffusion effects, while less developed areas may see little to no diffusion. Although spatial economics offers a theoretical framework for technology diffusion, research has predominantly focused on clean energy [46], high-tech industries [47], and other fields. Research on the application of technology diffusion in eco-agriculture is relatively limited.
This study analyzes data from 2012 to 2022, using the DEA-SBM model to assess the comprehensive efficiency of eco-agriculture in 53 counties in Fujian Province. The entropy method is employed to calculate the level of digital village construction in these counties, while the fixed-effects spatial Durbin model and spatial autoregressive model are used to investigate the impact of digital village construction on eco-agriculture efficiency in Fujian. The expected contributions of this paper are as follows: (1) 53 counties in Fujian Province are selected as the study area, and a spatial research framework at the county level is developed; (2) digital technology is emphasized as a key factor, the spatial diffusion of technology is considered, and theoretical insights into the impact of digital village construction on the comprehensive efficiency of eco-agriculture are provided.

2. Theoretical Analysis and Research Hypotheses

According to geographical theory, the spatial proximity of geographic units directly influences the flow of factors, establishing spatial dependence among these units [48]. During agricultural production, neighboring counties depend on the spatial continuity of hydrology, soil, and other natural resources to create cross-regional flow pathways for factors, materials, and energy. This spatial dependence drives capital agglomeration, labor migration, and technology diffusion, creating a synergistic evolution of agricultural production activities in neighboring counties, which in turn generates spatial interactions [49]. Based on this, hypothesis H1 is formulated.
Hypothesis 1. 
There is a positive spatial correlation in the comprehensive efficiency of eco-agriculture.
Digital village construction is a key strategy for modernizing agriculture and rural areas, as well as for building a modern industrial system in China [50,51]. In May 2019, the “Outline of Digital Village Development Strategy,” issued by the General Office of the CPC Central Committee and the State Council, emphasized that digital village construction can leverage the diffusion effect of information technology innovations, the spillover effect of knowledge, and the inclusive accessibility of digital technologies, thus promoting the digitalization of the entire agricultural value chain and supporting sustainable, high-quality agricultural development [52]. The comprehensive efficiency of eco-agriculture encompasses three key aspects: economic output efficiency, social benefit efficiency, and ecological environmental protection efficiency. Grounded in endogenous growth theory, human capital theory, and digital governance theory, digital village construction leverages technology, labor, and data elements to foster agricultural innovation, enhance human capital, and improve eco-agricultural protection efficiency. This, in turn, boosts economic output, social benefits, and ecological protection efficiency, thereby enhancing the comprehensive efficiency of eco-agriculture [53] (Figure 1). Specifically, digital village construction empowers agricultural development through technological elements, creating a model based on digital technology. This reduces production and transaction costs while improving resource utilization, thereby enhancing economic output efficiency. At the same time, digital technology empowers the dynamic monitoring systems of agricultural ecosystems, enhancing ecological protection and further promoting the comprehensive efficiency of eco-agriculture. Furthermore, digital village construction also enhances the capabilities of the labor force by promoting access to new technologies and knowledge, reducing information costs, and facilitating the spread of agricultural innovations. This enhances agricultural human capital [54], helps to achieve social benefits, and further improves the comprehensive efficiency of eco-agriculture. Additionally, digital village construction integrates data elements throughout the agricultural production chain, combining with other production factors to form advanced productivity. This improves resource allocation efficiency, boosting economic output. Simultaneously, digital village construction enhances eco-agricultural protection through data elements, strengthening the modernization of the eco-agricultural governance system and improving environmental protection, thereby promoting the comprehensive efficiency of eco-agriculture [55]. Based on these observations, hypotheses H2a and H2b are proposed.
Hypothesis 2a. 
Digital village construction notably contributes to enhancing the comprehensive efficiency of eco-agriculture under time-fixed conditions.
Hypothesis 2b. 
Digital village construction notably contributes to enhancing the comprehensive efficiency of eco-agriculture under spatially fixed conditions.
According to the technology diffusion theory, distance is a key factor influencing the diffusion of digital village construction technologies [56]. Specifically, regions experience technological competition and a catch-up process. Regions with less advanced technology will actively adopt advanced technologies from more developed regions, promoting technological progress through adaptation, imitation, and learning. This process is particularly evident in digital village construction, where technology diffusion facilitates the spillover of local knowledge and technology to neighboring regions, creating spatial linkages that positively influence agricultural production both locally and in neighboring regions. Furthermore, the ongoing promotion of digital village construction has driven the spatial flow and upgrading of labor forces. The data-driven, networked, and intelligent technologies introduced by digital village construction impose new requirements on the labor force, compelling adaptation to the transformation of eco-agricultural production methods. However, if the labor force becomes overly concentrated, it may trigger inter-regional movement due to the crowding effect, which can significantly impact the comprehensive efficiency of eco-agriculture both locally and in neighboring regions. Digital village construction is an effective way to enhance agricultural production efficiency, reduce surface pollution and carbon emissions, and minimize resource waste by replacing outdated agricultural machinery. Additionally, it provides both the region and neighboring regions with a theoretical foundation and practical experience to develop differentiated strategies and enhance regional linkages. In inter-regional competition and cooperation, digital village construction enables both regions to fully leverage the spillover effects of the digital economy, jointly fostering sustainable and high-quality agricultural development. Based on these factors, hypothesis H3 is proposed.
Hypothesis 3. 
Digital village construction affects the comprehensive efficiency of local eco-agriculture and enhances the efficiency of eco-agriculture in neighboring counties through spatial spillover effects.

3. Materials and Methods

3.1. Construction of the Indicator System

3.1.1. Explanatory Variables

The explanatory variable is the level of digital village construction. Based on the “China Digital Village Construction Report (2023)”, the “Digital Village Construction Guide 2.0”, and related research, the evaluation of the digital village construction level is developed considering the reasonableness and scientific validity of indicator selection and the accessibility of county data. The evaluation framework consists of six dimensions: digital information infrastructure, digital industry development, digital science and technology agriculture, digital life services, digital financial services, and rural quality of life (Table 1).
The digital information infrastructure is a cornerstone of digital village construction [7], measured by the fixed telephone penetration rate, which is defined as the proportion of fixed telephone subscribers to the total household population. Digital industry development is crucial for digital village construction [8] and is measured by the development level of the tertiary industry, specifically represented by tertiary value added. Digital science and technology agriculture supports digital village construction [9] and is measured by the degree of agricultural mechanization, specifically represented by the area covered by digital agricultural mechanization technologies. Digital life services are a key driver of digital village construction [9], measured by the number of health technology employees. Digital financial services reflect the development of digital finance in rural industries [8], measured by the amount of financial loans, specifically represented by the year-end balance of loans from financial institutions. Rural quality of life, a key goal in digital village construction [10], is measured by per capita disposable income and total retail sales of consumer goods.

3.1.2. Explained Variables

The explained variable is the comprehensive efficiency of eco-agriculture. Based on the concept of comprehensive efficiency of eco-agriculture and relevant research on eco-agriculture efficiency evaluation systems, we developed an input-output evaluation index system that incorporates non-expected output (Table 2).
For the input indicators, this study considered the characteristics of eco-agriculture development in Fujian Province and selected facility agricultural land, farmland, labor force, and agricultural machinery as key inputs. Specifically, the input level of facility agricultural land was measured by the total area occupied by facility agriculture; the input level of agricultural land was calculated by the total sown area of crops; the input level of labor force was measured by the number of employees; and the input level of agricultural machinery was determined by the total power of agricultural machinery.
For expected output, we selected the added value of the primary industry in agriculture, given that the primary industry is central to the development of the national economy. For non-expected output, we used carbon emissions from agriculture as an indicator to reflect the pressure on the agricultural ecosystem. The biomass conversion method was employed to calculate carbon emissions from total grain production.

3.1.3. Control Variables

Based on the variable selection method of Xu Caiyao et al. [53], this study selected control variables, including the level of economic development (lngdp, measured by gross regional product), the number of administrative divisions (lntown, measured by the number of townships), the level of agricultural development (lnadd, measured by the added value of agricultural production), and the scale of the oilseed industry (lnoil, measured by oilseed output). The description of the indicators for each variable is shown in Table 3.

3.1.4. Data Sources

This study focused on the 53 counties of eight prefecture-level cities in Fujian Province, using panel data from 2012 to 2022. The relevant data were sourced from the China County Statistical Yearbook. Based on the time series of the panel data, this study assumed continuity. The missing data were randomly distributed, making linear interpolation a more appropriate method for filling in gaps compared to mean interpolation, which lacks time trend information. Although linear interpolation may affect the estimation accuracy of individual indicators, this study found that it did not fundamentally alter the structure of the relationships among variables. This study employed a sub-regional independent linear interpolation strategy to avoid issues related to cross-regional data crossover.

3.2. Methods

3.2.1. Entropy Method

The entropy value method (hereafter referred to as the entropy method) is an objective technique for determining indicator weights. It is based on data information, which reflects the relative differences of the evaluated objects [57]. In this study, the extreme value normalization method (maximum and minimum values) was used to process the indicator values, and the entropy method was applied to measure the level of digital countryside construction in 53 counties across eight prefecture-level cities in Fujian Province from 2012 to 2022.

3.2.2. Biomass Conversion Method

In the evaluation system for the comprehensive efficiency of eco-agriculture, this study adopted the method proposed by Fan Gaoyuan et al. [58], which calculates carbon emissions by assessing the destruction of soil organic matter through ploughing and quantifying the resulting carbon and nitrogen loss. Agricultural carbon emissions primarily refer to emissions generated during agricultural production, while carbon emissions from agricultural land use encompass emissions from arable land, garden land, pastureland, waters, and unused land [59]. A more established method for estimating carbon sinks in arable land is the biomass conversion method, which uses the economic yield of crops to project the total carbon sink. Therefore, carbon emissions from cropland are calculated as follows:
E a = i e i = i T i × δ i
where E a represents the carbon emissions from cropland, T i denotes the various carbon sources, and δ i is the conversion factor for these sources. The coefficients for ploughing are represented as 312.6kg C/kg.

3.2.3. DEA-SBM Models Incorporating Non-Expected Output

To account for non-expected outputs for certain indicators, this study adopted the DEA-SBM non-radial model for measurement. This study used 53 counties across eight prefecture-level cities in Fujian Province as decision-making units, focusing on the underlying concept of the comprehensive efficiency of eco-agriculture measurement. However, when the efficiency value of certain decision units is equal to or greater than 1, it is not possible to further evaluate their comprehensive eco-agriculture efficiency. Therefore, the super-efficient SBM model with slack variables in the objective function [60] was introduced to further decompose efficiency values and distinguish among decision units.
The vector defining the matrix takes the following form:
X = x 1 , x 2 , , x n R n × m Y g = y 1 g , y 2 g , , y n g R n × r
The specific model is as follows:
m i n ρ = 1 1 m i = 1 m s i x i k 1 + 1 p r = 1 p s r + y r k g
s . t . x i k = j = 1 , j k n λ j x i j + s i i = 1,2 , , m y r k g = j = 1 , j k n λ j y r j g + s r + r = 1,2 , , p 1 + 1 p r = 1 p s r + y r k g > 0 λ j 0 j , s i 0 i , s r + 0 r
where ρ represents the comprehensive efficiency level of eco-agriculture in the county, n represents the number of decision-making units, m ( p ) represents the number of inputs (outputs) of decision-making units, s i ( s r + ) represents the slack variables of inputs (outputs), k represents the decision-making units evaluated, λ j represents the coefficients of linear combination of the jth decision-making unit, and x i ( y r g ) represents the matrix of inputs (outputs).

3.2.4. Spatial Measurement Models

To further analyze the spatial interaction between digital village construction and the comprehensive efficiency of eco-agriculture, we first measured the spatial autocorrelation using G l o b a l   M o r a n t s   I [61]. The formula is as follows:
G l o b a l   M o r a n t s   I = n i = 1 n j = 1 n W i j X i X X j X i = 1 n j = 1 n W i j i = 1 n X i X 2
where W i j represents the spatial weight matrix, X i ( X j ) denotes the observed value for regions i ( j ), and X denotes all county observations.
Next, the LM and LR tests were used to determine whether to apply the spatial Durbin model (SDM) or the spatial autoregressive model (SAR), which are defined as follows:
SDM modeling:
l n α g r i i t = δ 1 j = 1 N W i j l n α g r i j t + 1 l n d i g i t i t + β 1 l n g d p i t + β 2 l n t o w n i t + β 3 l n α d d i t + β 4 lnoi l i t + j = 1 N W i j η 1 l n d i g i t i t + η 2 l n g d p i t + η 3 l n t o w n i t + η 4 l n α d d i t + η 5 lnoi l i t + μ i + ε i t
SAR modeling:
l n α g r i i t = δ 1 j = 1 N W i j l n α g r i j t + 1 l n d i g i t i t + β 1 l n g d p i t + β 2 l n t o w n i t + β 3 l n α d d i t + β 4 l n o i l i t + μ i + ε i t
where μ i represents the spatial individual effect, W i j is the spatial weight matrix, δ denotes the spatial autoregressive coefficient, ε is the random error term, and η 1 , η 2 ,…, η 5 indicates the spatial regression coefficient.

4. Results

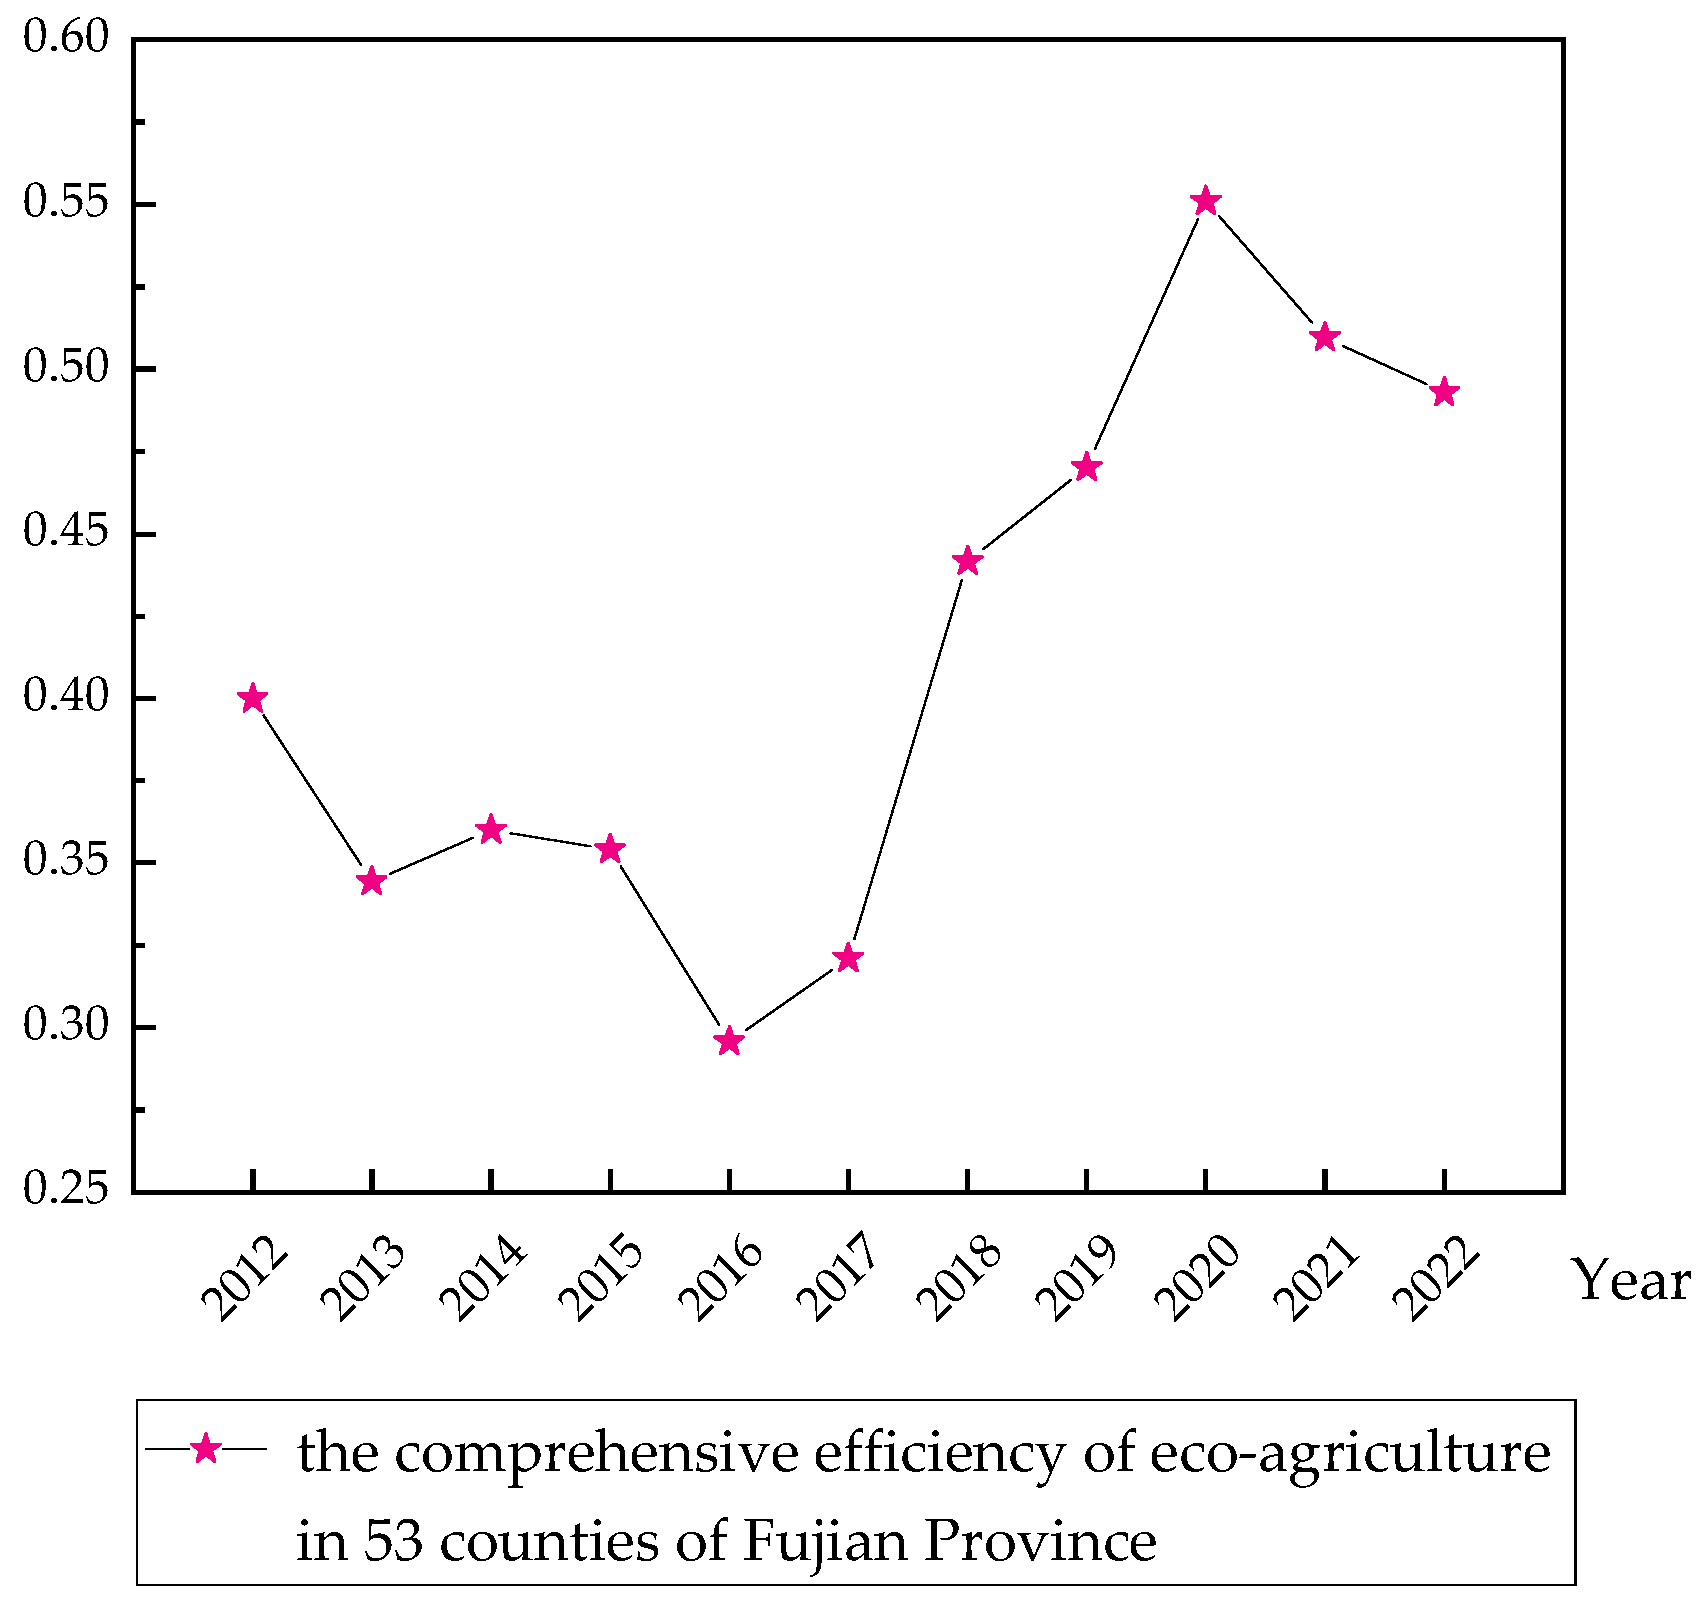
4.1. Measurement of the Comprehensive Efficiency of Eco-Agriculture

This study applied the DEA-SBM model to assess the comprehensive efficiency of eco-agriculture in 53 counties of Fujian Province from 2012 to 2022. As shown in Figure 2, the average comprehensive efficiency of the 53 counties in Fujian Province was 0.40 in 2012 and 0.49 in 2022, representing an increase of 22.5% during the study period, indicating a generally fluctuating growth trend.
Table 4 shows that the comprehensive efficiency of eco-agriculture of Lianjiang County remained high, achieving DEA efficiency from 2012 to 2022. In contrast, Luoyuan County achieved DEA efficiency in all years except 2016. Both Dongshan and Guangze counties maintained high comprehensive efficiency of eco-agriculture, achieving DEA efficiency from 2012 to 2022. Due to space constraints, this article presents the comprehensive efficiency of eco-agriculture for Lianjiang, Luoyuan, Dongshan, and Guangze counties, while the efficiency of the remaining 49 counties is relatively low. The reasons for this may be as follows: Lianjiang County and Luoyuan County are under the jurisdiction of Fuzhou City, benefiting from the location advantages and policy support of the provincial capital. These counties excel in ecological protection and restoration project implementation. Guangze County, located in northern Fujian, has low economic and agricultural development levels. However, its surface source pollution and agricultural carbon emissions are relatively low, resulting in a high comprehensive efficiency of eco-agriculture. Dongshan County, located in southern Fujian within the subtropical monsoon climate zone, has a warm and humid climate with abundant annual precipitation and ample sunlight, which is conducive to crop growth. As a result, its comprehensive efficiency of eco-agriculture is relatively high [62].

4.2. Measurement of the Level of Digital Village Construction

This study divided the 53 counties in Fujian Province into five regions: Western, Eastern, Central, Northern, and Southern, based on their geographical locations. The entropy method was used to measure the level of digital village construction across the 53 counties in Fujian Province from 2012 to 2022, with the results presented in Table 5. The results indicate that the average digital village construction levels in the Southern, Northern, Central, Eastern, and Western regions were 0.0422, 0.0153, 0.0423, 0.0183, and 0.0180, respectively. This shows a ranking of Central region > Southern region > Eastern region > Western region > Northern region, highlighting regional differences in digital village construction levels across Fujian Province. This can be attributed to the higher economic development and rich agricultural resources in the Central region and Southern region, as well as the widespread application of smart irrigation systems, precision fertilization technology, and other advanced agricultural technologies, which greatly enhance agricultural production efficiency. As a result, these regions have a higher level of digital village construction. The Eastern region benefits from location advantages and strong policy support, allowing for considerable investment in the popularization and application of digital technology in rural areas. However, compared to the Southern region, the Eastern region still requires further development of its cultural resources. In contrast, the Western region and Northern region face geographic constraints and weaker economic foundations, leading to insufficient financial investment in digital village construction. Consequently, the popularization of digital technology in these areas is limited, and their communication and information infrastructure lags behind, resulting in a significantly lower level of digital village construction compared to the other regions [63].

4.3. Analysis of the Impact of Digital Village Construction on the Comprehensive Efficiency of Eco-Agriculture

4.3.1. Spatial Correlation Analysis

This study applied the global Moran index test to evaluate the comprehensive efficiency of eco-agriculture across 53 counties in Fujian Province. The results in Table 6 indicate that from 2017 to 2022, the average global Moran index value for the comprehensive efficiency of eco-agriculture in Fujian’s 53 counties was 0.256. The index passed the 5% significance level in 2020 and 2021, and the remaining years passed at the 1% level. This suggests a significant positive spatial correlation in the comprehensive efficiency of eco-agriculture across the counties, thus supporting H1. The spatial clustering of comprehensive efficiency of eco-agriculture is significant, with the efficiency in each county being correlated with that of neighboring counties. The eco-agricultural efficiency of one county both influences and is influenced by that of its neighbors.
To examine the spatial correlation, differentiation, and clustering or dispersion of the comprehensive efficiency of eco-agriculture between each county and its neighbors, the local spatial autocorrelation analysis method was used, complemented by Moran scatterplots for visual demonstration. The scatterplots for 2012, 2017, and 2022 were selected as sample years at 5-year intervals.
Figure 3 shows that the Moran scatterplot is divided into four quadrants: high–high (H-H), low–high (L-H), low–low (L-L), and high–low (H-L) aggregation zones. Counties in the H-H and L-L zones exhibit a positive spatial correlation in the comprehensive efficiency of eco-agriculture with neighboring counties, while counties in the L-H and H-L zones show a negative correlation. In 2012, 2017, and 2022, the number of counties in the L-L and H-H aggregation areas were 32, 34, and 33, respectively, while those in the H-L and L-H zones were 21, 19, and 20. As shown in the figure, the majority of counties fall into the L-L and H-H zones, indicating a spatial pattern of H-H and L–L correlation in Fujian Province’s eco-agricultural efficiency. The trends over the 3 years show that spatial homogeneity in the L-L and H-H zones is more unstable, with greater fluctuations. In contrast, the spatial heterogeneity in the H-L and L-H zones is more volatile but fluctuates less.
The classification of 53 counties in Fujian Province into four types of aggregation zones was based on a 3-year Moran scatterplot, as shown in Table 7. From 2017 to 2022, the comprehensive efficiency of eco-agriculture in the 53 counties of Fujian Province exhibited spatial autocorrelation and stable spatial agglomeration.
Luoyuan and Lianjiang counties were consistently in the H-H aggregation zone. In 2012, Minqing was in the L-H aggregation zone, and Yongtai was in the H-L aggregation zone. Both shifted to the H-H aggregation zone in 2017 and have remained there since. In 2012, the Western region and Southern region each had one county, while the Central region had four counties. By 2017, the Central region had all four counties. By 2022, the Central region and Eastern region each had three counties, the Southern region had two, and the Northern region had one. This aggregation area represents a spatial form where counties with high comprehensive efficiency of eco-agriculture are surrounded by neighboring counties with even higher efficiency, primarily in central Fujian. The high efficiency of eco-agriculture in this region has led to improvements in neighboring counties. Consequently, this area exhibits a strong diffusion effect, with a notable agglomeration of high-efficiency counties.
Six counties—Shaowu, Minhou, Wuyishan, Nanjing, Zhangpu, and Yunxiao—have consistently been in the L-H aggregation zone. In 2012, Youxi and Fuqing were in the H-H aggregation zone but shifted to the L-H zone in 2017, where they have remained. This region represents a spatial form where counties with lower comprehensive efficiency of eco-agriculture are surrounded by higher-efficiency counties, mainly in southern Min. The comprehensive efficiency of eco-agriculture in this area is relatively low, but its neighboring counties are more efficient.
Fourteen counties—Songxi, Liancheng, Mingxi, Jianning, Anxi, Shouning, Ninghua, Nan’an, Zhouning, Wuping, Changting, Qingliu, Zhenghe, and Shanghang—have been in the L-L aggregation zone. This area represents a spatial form where counties with low efficiency of eco-agriculture are surrounded by others with similarly low efficiency, forming a “L-L agglomeration” phenomenon.
Only Guangze County has been in the H-L aggregation zone. In 2012, Datian was in the H-L zone, but shifted to the L-L zone in 2017, where it has remained. In 2012, Yongtai was in the H-L zone, but shifted to the H-H zone in 2017, where it has remained. In 2012, the Central region occupied one county, the Northern region and Southern region each occupied two counties, and the Western region occupied three counties. In 2017, the Central region, Eastern region, Western region, and Northern region each occupied one county, and the Southern region occupied four counties. In 2022, the Central region and Southern region each occupied one county, and the Northern region and Western region each occupied two counties. This agglomeration area represents a spatial pattern where counties with high comprehensive efficiency of eco-agriculture are surrounded by neighboring counties with lower efficiency. The region exhibits high comprehensive efficiency of eco-agriculture, while its neighboring counties show lower efficiency values. The region can enhance the efficiency of neighboring counties with low comprehensive efficiency of eco-agriculture through the diffusion effect, promoting their transition to L-L and H-H efficiency agglomerations [31].

4.3.2. Analysis of Spatial Measurement Results

Prior to model regression, it was essential to test the model’s validity, with the results presented in Table 8. The Lagrange multiplier test (LM) results indicate that both the SDM and SAR models significantly rejected the null hypothesis at the 1% level, suggesting that the spatial impact of digital village construction on the comprehensive efficiency of eco-agriculture is significant. Therefore, this study used both the SDM and SAR models to examine the spatial impact of digital village construction on the comprehensive efficiency of eco-agriculture.
The fitting results from the spatial Durbin model and the spatial autoregressive model indicate that the goodness of fit (R2) was higher for the time-fixed effect model compared to the spatial-fixed effect model and spatiotemporal two-way fixed effect model. Therefore, the time-fixed effect spatial Durbin and spatial autoregressive models were selected for regression, and the regression coefficients for each variable are presented in Table 9.
As presented in Table 9, the R2 value for the time-fixed SDM model is 0.0936, which exceeds that of the spatial autoregressive model, suggesting that the spatial Durbin model provides a better fit. The rho value from the SDM model regression is positive, and the spatial correlation coefficient passes the 1% significance test, confirming H2a and H2b. The coefficients for digital village construction are all positive, indicating that it positively affects the comprehensive efficiency of eco-agriculture. The reason for this may be that digital village construction, empowered by digital technology, optimizes the allocation of agricultural factors and enhances the agricultural development system [64]. This improves resource utilization efficiency and agricultural production, thereby positively impacting the comprehensive efficiency of eco-agriculture.
The control variables—economic development, the number of administrative divisions, agricultural development level, and the size of the oilseed industry—affect the comprehensive efficiency of eco-agriculture in both the time and space dimensions.
In the spatial autoregressive model (SAR), the rho value is positive and passes the 1% significance test in both time and space, indicating that the region’s comprehensive efficiency of eco-agriculture is significantly influenced by that of neighboring regions.

4.3.3. Spatial Spillover Effects

Using the spatial Durbin model and the spatial autoregressive model, we analyzed the total impact of digital village construction on the comprehensive efficiency of eco-agriculture by separating it into direct and indirect effects. The direct effect refers to the immediate impact of digital village construction on a county’s comprehensive efficiency of eco-agriculture. The indirect effect, or spatial spillover effect, represents the influence of digital village construction in one county on the comprehensive efficiency of eco-agriculture in neighboring counties. The total effect is the sum of the direct and indirect effects. The decomposition results, derived from fitting the spatial Durbin model and the spatial autoregressive model, are shown in Table 10.
As shown in Table 10, the effect decomposition results for the SDM model indicate that digital village construction in each county has some positive impact on the comprehensive efficiency of eco-agriculture in both the county and its neighboring counties. However, this effect does not pass the 10% significance test, meaning that both the local and spillover effects of digital village construction in Fujian Province are currently insignificant, and H3 is not supported. The reasons may be as follows: First, digital village construction in Fujian Province is still in its primary stage, the overall level of digital village construction is not high, the application of new agricultural technologies in most rural areas of Fujian Province is lagging, agricultural data resources are scattered, and the data-sharing channels are not smooth, which inhibits the local and spillover effects of the impact of digital village construction on the comprehensive efficiency of eco-agriculture. Secondly, the unbalanced digital infrastructure construction caused by the differences in regional economic fundamentals is one of the key factors leading to the “digital development divide” [65]. In the process of digital village construction, the Southeast Coastal region of Fujian, such as Fuzhou, Quanzhou, has advanced digital technology, an accurate investment direction of rural digital infrastructure construction, and a high level of rural network infrastructure construction due to its own economic endowment advantages, location advantages, and policy support [63]. Regarding the inland areas of Northwestern Fujian, such as Sanming City and Nanping City, due to the weak economic foundation, the development of digital technology is relatively lagging. The investment in the rural digital information infrastructure is insufficient, resulting in a large gap between the level of its digital infrastructure construction and that of the coastal areas. The significant difference in the development of regional digital technology has also impeded the spillover effect of digital village construction.

5. Discussions

This study constructed a county-scale spatial research framework, focusing on digital technology as a key element. It analyzed the specific nature of technology diffusion from the perspective of spatial economics, examined the spillover effects of digital technology, and investigated the inhibitory role of “blocked data-sharing channels” and the “digital divide” on this spillover. Based on the results of spatial econometric analyses, the following recommendations are proposed for the high-quality development of eco-agriculture in Fujian Province: (1) Strengthen technological innovation and promote coordinated development. Given the low overall comprehensive efficiency of eco-agriculture in the 53 counties of Fujian Province and the large regional disparities, agricultural technological innovation should be prioritized. Efforts should focus on increasing the research and development of key agricultural technologies, driving agricultural modernization through informatization, and improving the transformation and application of agricultural research results through digitalization. This approach will enhance the overall comprehensive efficiency of eco-agriculture in Fujian Province. Additionally, a cross-regional cooperation model for eco-agriculture should be established. Agricultural development cooperation organizations should be built to promote inter-regional collaboration, fostering mutual assistance and a win–win situation. This will help to narrow the inter-regional gap in the comprehensive efficiency of eco-agriculture in Fujian Province, promoting balanced and coordinated development across all counties; (2) Improve data sharing and enhance regional exchanges. Considering the significant disparity in digital village construction levels across counties in Fujian Province, digital infrastructure should be further strengthened, with a focus on creating an integrated platform for digital village construction, enhancing data sharing and support mechanisms, and ensuring the smooth and efficient flow of data, technology, and resources related to digital village development across cities and counties in Fujian Province. Simultaneously, counties should be encouraged to strengthen cooperation and exchange knowledge. The more developed central region should be supported in actively promoting the application of its advanced technologies in agricultural production, management, sales, and other areas, enhancing agricultural efficiency and product quality in neighboring regions, thereby reducing the overall disparity in digital village construction levels; (3) Policies should be tailored to local conditions. Given the significant spatial correlation in the comprehensive efficiency of eco-agriculture, the government should consider each region’s natural endowments and comparative agricultural advantages [66]. Based on the specific agricultural development conditions of each county, development goals should be rationally planned, guiding resources such as funds, technology, and talent to the regions with comparative advantages. Digital village construction should be used to expand agricultural production in counties located in H-H agglomeration areas, maximizing their radiative and diffusion effects to improve eco-agricultural efficiency in the surrounding areas. Simultaneously, efforts should focus on improving the eco-agricultural industrial structure and production methods in counties located in L-L agglomeration areas to raise the overall eco-agricultural efficiency in these counties; (4) Continued promotion of digital village construction is essential. As digital village construction can significantly improve the eco-agricultural efficiency of Fujian, it is crucial to accelerate the improvement of both the macro and information environments within digital villages. Efforts should focus on cultivating digital technology talent, enhancing digital rural governance, and strengthening social services. Furthermore, a modern governance system for digital villages should be established, with an open and transparent data platform to enhance the effectiveness of rural governance. This will promote the overall improvement of digital village construction and enable these villages to exert a regional diffusion effect, driving enhanced eco-agriculture efficiency in both the region and neighboring areas.
However, the study has several limitations. First, the sample includes 53 counties from eight prefectural-level cities in Fujian Province. However, it lacks comparative analysis across areas with varying levels of economic development and resource endowments. Second, some control variables may have been omitted. Additionally, the study only uses a geographic distance weight matrix, neglecting other forms of spatial correlation. The authors of this paper suggest that future research can be expanded in the following directions: (1) Develop a regional comparison framework to analyze the differing impacts of digital village construction on the comprehensive efficiency of eco-agriculture in Fujian’s mountainous and coastal areas. (2) Supplement the control variables from multiple dimensions and perspectives and use machine learning feature selection to identify the optimal combination of control variables. (3) Develop a heterogeneity analysis model for weighting matrices at different distances. (4) Refine the research scale through field interviews and improve policy implementation accuracy by integrating micro-level data.

6. Conclusions

Based on the spatial metrics analysis and the discussion section, the paper summarizes the main findings as follows: (1) During the study period, the comprehensive efficiency of eco-agriculture in 53 counties of Fujian showed a fluctuating upward trend; (2) The level of digital village construction in Fujian exhibited a notable regional variation, with the following ranked order: Central region > Southern region > Eastern region > Western region > Northern region; (3) A significant spatial positive effect was observed on eco-agricultural efficiency, with H-H and L-L spatial correlation patterns; (4) Digital village construction significantly improved the comprehensive efficiency of eco-agriculture in Fujian, but no spatial spillover effect was observed.

Author Contributions

Conceptualization, W.L.; Methodology, W.L. and Z.X.; Software, Z.X.; Validation, W.L. and Z.X.; Formal analysis, W.L.; Investigation, W.L. and Z.X.; Resources, W.L. and Z.X.; Data curation, W.L. and Z.X.; Writing—original draft preparation, W.L.; Writing—review and editing, Z.X.; Visualization, Z.X.; Supervision, G.M. and F.Z.; Project administration, G.M. and F.Z.; Funding acquisition, G.M. and F.Z. All authors have read and agreed to the published version of the manuscript.

Funding

This research was funded by the Key Project on Basic Theory Research of Philosophy and Social Science Disciplines Guided by Marxism in Fujian Universities (FJ2024MGCA026), the Innovation Strategy Research Project of the Fujian Provincial Department of Science and Technology (2024R0029), and the Cross-Strait Rural Revitalization Research Institute Open Topic (208-K80RAQ05A).

Institutional Review Board Statement

Not applicable.

Informed Consent Statement

Not applicable.

Data Availability Statement

The original contributions presented in this study are included in the article; further inquiries can be addressed to the corresponding author.

Conflicts of Interest

The authors declare no conflicts of interest.

Abbreviations

The following abbreviations are used in this manuscript:
SDMSpatial Durbin model
SARSpatial autoregressive model

References

  1. Guan, Y. Study on the Index System for Constructing Eco-province—A case study on Fujian Province. J. Fujian Norm. Univ. (Nat. Sci. Ed.) 2002, 18, 100–104. [Google Scholar]
  2. Yu, J.; Liu, Y.; Dai, Y.; Zheng, J. Reflections on Policies for Building an Ecological Province in Fujian Province. Fujian Forum (Humanit. Soc. Sci. Ed.) 2005, 25, 105–108. [Google Scholar] [CrossRef]
  3. Li, W.; Zhou, S. Reform of Agricultural Production Mode in China under the Background of Digital Economy:Mechanism, Contradiction and Solution. J. Xi’an Jiaotong Univ. (Soc. Sci. Ed.) 2023, 43, 65–73. [Google Scholar] [CrossRef]
  4. Qin, G.; Li, Y.; Ren, K. Actual Contradictions and Optimization Paths of Digital Rural Construction in the Perspective of Multiple Policy Relations. J. Yunnan Natl. Univ. (Philos. Soc. Sci. Ed.) 2023, 40, 104–113. [Google Scholar] [CrossRef]
  5. Liu, Y.; Lyu, P. Digital Village Construction: Goals, Achievements, and Challenges. Econ. Manag. 2022, 36, 25–33. [Google Scholar]
  6. Li, L.; Zhao, W. Mechanism and Path of Digital Rural Construction Boosting the Modernization of Chinese–style Agriculture. J. South China Agric. Univ. (Soc. Sci.) 2024, 23, 12–22. [Google Scholar] [CrossRef]
  7. Zeng, Y.; Song, Y.; Lin, X.; Fu, C. Some Humble Opinions on China’s Digital Village Construction. China’s Rural. Econ. 2021, 37, 21–35. [Google Scholar] [CrossRef]
  8. Feng, Z.; Xu, H. Construction of the Evaluation Index Systemfor the Digital Villages in China and its Practical Utility. J. Yunnan Norm. Univ. (Philos. Soc. Sci. Ed.) 2023, 55, 109–120. [Google Scholar] [CrossRef]
  9. Zhao, M. The Theory and Practice of Modern Ecological Agriculture in China. People’s Forum·Acad. Front. 2019, 8, 24–31. [Google Scholar] [CrossRef]
  10. Bi, D.; Chu, S. Digital Village Construction, Rural Consumption Upgrading, and High-Quality Economic Development. J. South-Cent. Univ. Natl. (Humanit. Soc. Sci.) 2025, 45, 136–144+186–187. [Google Scholar] [CrossRef]
  11. Eanes, F.R.; Singh, A.S.; Bulla, B.R.; Ranjan, P.; Prokopy, L.S.; Fales, M.; Wickerham, B.; Doran, P.J. Midwestern US farmers perceive crop advisers as conduits of information on agricultural conservation practices. Environ. Manag. 2017, 60, 974–988. [Google Scholar] [CrossRef]
  12. Li, J.; Guo, M.; Ma, C. Triple Play and Rural Informatization: International Experience and Inspiration. Intell. Mag. 2012, 31, 136–141. [Google Scholar] [CrossRef]
  13. Philbeck, T.; Davis, N. The fourth industrial revolution. J. Int. Aff. 2018, 72, 17–22. [Google Scholar]
  14. Cui, K. Practical analysis of digital village construction: Progress, patterns and path optimisation. Stud. Social. Chin. Charact. 2023, 29, 74–84. [Google Scholar]
  15. Gao, F.; Wang, J. International experience and inspiration in digital village construction. Jiangsu Agric. Sci. 2021, 49, 1–8. [Google Scholar] [CrossRef]
  16. Ji, X.; Jiang, J. Study on the spatial and temporal evolution of agro-ecological efficiency and influencing factors in major food–producing areas. Stat. Decis. Mak. 2024, 40, 91–96. [Google Scholar] [CrossRef]
  17. Ning, F.; Lu, R.; Du, F. Spatial–temporal Differentiation and Influencing Factors of Agricultural Ecological Efficiency in Counties of Yunnan Province. Agric. Resour. Reg. China 2024, 45, 49–61. [Google Scholar] [CrossRef]
  18. Lu, S.; Xiong, J.; Li, W. Evolution and driving factors of spatial correlation network of agricultural eco–efficiency in the middle reaches of the Yangtze River. Acta Ecol. Sin. 2024, 44, 3199–3212. [Google Scholar] [CrossRef]
  19. Zhou, L.; Zhang, Z.; Zhou, Y. Measurement and spatial–temporal characteristics of agricultural eco–efficiency in a typical North–South Transition Zone from 2001 to 2018. Ecol. Sci. 2023, 42, 153–162. [Google Scholar] [CrossRef]
  20. Ren, H. Comprehensive Measurement of Agroecological Efficiency Based on DEA Modelling. Stat. Decis. Mak. 2019, 35, 99–103. [Google Scholar] [CrossRef]
  21. Feng, Y.; Qi, Q.; Han, J. Spatiotemporal Evolution and Driving Factors of Agricultural Eco–efficiency in China. Soil Water Conserv. Bull. 2018, 38, 254–262. [Google Scholar] [CrossRef]
  22. Chen, Y.; Mu, H. Measurement and Influencing Factors of Agricultural Eco–efficiency in China. Stat. Decis. Mak. 2022, 38, 101–106. [Google Scholar] [CrossRef]
  23. Liang, W.; Deng, C.; Ye, L.; Liu, Y.; Wang, D.; Li, Y. Temporal and Spatial Characteristics and Influencing Factors of Agricultural Ecological Efficiency in Hainan Province. J. Trop. Crops 2025, 46, 236–245. [Google Scholar] [CrossRef]
  24. Zang, J.; Zhang, S.; Tang, C. Spatio–temporal Evolution and Influencing Factors of Agricultural Eco–efficiency in Guangdong Province Under “Dual Carbon” Target. Agric. Resour. Reg. China 2023, 44, 135–146. [Google Scholar] [CrossRef]
  25. Zhu, T.; Tao, J. Analysis of Agricultural Ecological Efficiency in the Yellow River Basin from the Perspective of Carbon Source and Carbon Sink. Ecol. Econ. 2024, 40, 129–135. [Google Scholar]
  26. Basset–Mens, C.; Ledgard, S.; Boyes, M. Eco–efficiency of intensification scenarios for milk production in New Zealand. Ecol. Econ. 2009, 68, 1615–1625. [Google Scholar] [CrossRef]
  27. Gómez–Limón, J.A.; Picazo–Tadeo, A.J.; Reig–Martínez, E. Eco–efficiency assessment of olive farms in Andalusia. Land Use Policy 2012, 29, 395–406. [Google Scholar] [CrossRef]
  28. Pelletier, N.; Arsenault, N.; Tyedmers, P. Scenario modeling potential eco–efficiency gains from a transition to organic agriculture: Life cycle perspectives on Canadian canola, corn, soy, and wheat production. Environ. Manag. 2008, 42, 989–1001. [Google Scholar] [CrossRef]
  29. Wang, G.; Qian, Z.; Shi, R. Research Hotspots and Trends of Agriculture Eco–efficiency in China. Agric. Resour. Reg. China 2023, 44, 20–31. Available online: https://kns.cnki.net/kcms2/article/abstract?v=N5Mfx_KcSpKEoqKJ9Ae5Hzc1L4xv6e5Wn8WSjA3Zu0oYdne70f0IahyVPb4sD3U2F3zGSAZZjBjbb7C2RicgeR5AKXhEfHmn4gpxqC5k9lMmHHjW5NYEdzcAobzD6r0GqIuhKKBK7alLQ22l_AzvvVkcw4owiptgAkRG6KXeYE2XpK5VEps2Zw==&uniplatform=NZKPT&language=CHS (accessed on 21 April 2025).
  30. Lin, E.; Zheng, Y.; Chen, Q. Systematic Review and Analysis of Eco–Efficiency: A Comparative Perspective Between Chinese and English Literatures. J. Ecol. Rural. Environ. 2019, 35, 1497–1504. [Google Scholar] [CrossRef]
  31. Zhao, J.; Dang, G.; Tang, X. Spatial–temporal Differences and Influencing Factors of Agricultural Eco–efficiency in China Based on SBM–Tobit Model. J. Southwest For. Univ. (Soc. Sci.) 2022, 6, 10–18. [Google Scholar]
  32. Bo, Z.; Liu, Y. Measurement of agro-ecological efficiency and influencing factors in ethnic areas. J. South-Cent. Univ. Natl. (Humanit. Soc. Sci.) 2021, 41, 82–89. [Google Scholar] [CrossRef]
  33. Chu, L.; Yue, Y. The Impact of Digital Economy on the Ecological Efficiency in the Yellow River Basin. People’s Yellow River 2023, 45, 47–53. [Google Scholar] [CrossRef]
  34. Hao, A.; Hou, Y.; Tan, J. How does digital village construction influences carbon emission? The case of China. PLoS ONE 2022, 17, e0278533. [Google Scholar] [CrossRef]
  35. Feng, S.; Chong, Y.; Yu, H.; Ye, X.; Li, G. Digital financial development and ecological footprint: Evidence from green–biased technology innovation and environmental inclusion. J. Clean. Prod. 2022, 380, 135069. [Google Scholar] [CrossRef]
  36. Mo, L.; Chen, S.; Wan, S.; Liang, C.; Ma, Y. Digital financial inclusion and economic green growth: Evidence from counties covered by China’s national key ecological functional zones. Front. Environ. Sci. 2025, 13, 1467542. [Google Scholar] [CrossRef]
  37. Zhang, J.; Zhao, X.; Pang, Q.; Zhang, C. Impacts of Digital Economy on Provincial Green Water Resourcesuse Efficiency Based on System Gmm Model Tests. Resour. Ind. 2025, 27, 11–21. [Google Scholar] [CrossRef]
  38. Han, H.; Gong, Y. Spatial spillover effects of digital rural construction on carbon emissions from agriculture. Trans. Chin. Soc. Agric. Eng. 2025, 41, 2298–2307. [Google Scholar] [CrossRef]
  39. Zhu, J.; Pang, W. Impact of digital economy development on ecological well–being performance. Stat. Decis. Mak. 2023, 38, 79–83. [Google Scholar] [CrossRef]
  40. Xia, Y.; Yu, Q.; Zhang, Z. Analysis of the effect of digital economy on the improvement of ecological welfare performance. Resour. Dev. Mark. 2024, 40, 1188–1197. [Google Scholar] [CrossRef]
  41. Gu, X.; Lyu, H. Digital Technology Enabling Rural Industry Modernisation in Ethnic Areas: Mechanisms, Dilemmas and Practical Paths. Agric. Econ. 2023, 43, 7–10. [Google Scholar] [CrossRef]
  42. Lu, Y. Embedding Digital Technology in Rural Society: Application Scenarios, Practical Dilemmas and Optimization Strategies. Mod. City Res. 2024, 39, 120–124. [Google Scholar] [CrossRef]
  43. Luo, Q.; Zhao, Q.; Zhang, L. Realization Path of Digital Technology Enabling High–Quality Agricultural Development. Contemp. Econ. Manag. 2022, 44, 49–56. [Google Scholar] [CrossRef]
  44. Zheng, G. Study on the Influence Effect of Economic and Technological Development Zones on the Spatial Structure of Urban Economy–Taking Beijing as an Example. Explor. Econ. Issues 2006, 27, 48–52. [Google Scholar] [CrossRef]
  45. Zhang, Z. Study on the spatial spillover effects of the digital economy and high–quality agricultural development. Product. Res. 2023, 38, 70–74+95. [Google Scholar] [CrossRef]
  46. Wang, Y.; Li, L.; Wang, P. Institutional pressure and group behavior in corporate green technology diffusion. Chin. Soft Sci. 2024, 39, 197–209. [Google Scholar] [CrossRef]
  47. Li, L.; Peng, F.; He, J.; Zhu, H. Did the “Belt and Road” Initiative Promotes China’s Technology Diffusion—An Analysis Based on High–tech Industry. J. Technol. Econ. 2023, 42, 13–25. [Google Scholar]
  48. Dubin, R.A. Spatial autocorrelation: A primer. J. Hous. Econ. 1998, 7, 304–327. [Google Scholar] [CrossRef]
  49. Shi, X. Spatial and Temporal Characteristics and Influencing Factors of Agricultural Eco–Efficiency in Yangtze River Delta. Master’s Thesis, Zhejiang Ocean University, Zhoushan, China, 17 May 2023. [Google Scholar]
  50. Ding, J.; Wan, H. The spatial characteristics of digital village development and farmers’ income increase effect: An empirical analysis based on Digital Rural County Index and CHFS. J. Nat. Resour. 2023, 38, 2041–2058. [Google Scholar] [CrossRef]
  51. Li, L.; Zeng, Y.; Guo, H. Digital Countryside Construction: Underlying Logic, Practical Errors and Optimization Path. China’s Rural. Econ. 2023, 39, 77–92. [Google Scholar] [CrossRef]
  52. The General Office of the Communist Party of China Central Committee and the General Office of the State Council issued the “Outline of the Digital Rural Development Strategy”. Available online: https://www.chinacourt.org/article/detail/2019/05/id/3922058.shtml (accessed on 16 May 2019).
  53. Xu, C.; Ren, Y.; Zhai, J.; Kon, F. Impact of Digital Rural Construction on Development and Upgrading of Forestry Industry of 26 Counties in Mountainous Regions of Zhejiang Province. For. Sci. 2024, 60, 67–88. [Google Scholar] [CrossRef]
  54. Li, M.; Zhou, Y. Research on Human Capital Structure Effect of Digital Economy Development. Econ. Manag. Stud. 2022, 43, 23–38. [Google Scholar] [CrossRef]
  55. Kong, F.; Wang, L.; Xu, C.; Xu, Z. Modernization of China’s Ecological Environment Governance System and Governance Capacity: Theoretical Analysis, Practical Evaluation and Research Prospect. J. Manag. 2022, 35, 50–64. [Google Scholar] [CrossRef]
  56. Lu, T.; Zhu, Z. The Influence of Artificial Intelligence on Labor Income Share from the Perspective of Space Analysis Based on Static and Dynamic Space Durbin Model. Explor. Econ. Issues 2022, 43, 65–78. [Google Scholar]
  57. Wang, L.; Qi, C.; Zeng, G.; Yang, J. Evaluation and Spatiotemporal Characteristics Analysis of the Development Level of China’s Digital Village Construction. Stat. Decis. Mak. 2024, 40, 65–69. [Google Scholar] [CrossRef]
  58. Fan, G.; Yang, J. Study on Effect of Land Use Structure, Economic Development and Land Carbon Emission––A case Study of Urumqi. Chin. J. Agric. Resour. Reg. Plan. 2017, 38, 177–184. [Google Scholar] [CrossRef]
  59. Zhu, L.; Li, D.; Luo, G.; Peng, Y. Spatial Variance of Farmland Carbon Emission Factors Based on Stirpat and GWR Models. Resour. Ind. 2019, 21, 82–91. [Google Scholar] [CrossRef]
  60. Tone, K. A slacks–based measure of efficiency in data envelopment analysis. Eur. J. Oper. Res. 2001, 130, 498–509. [Google Scholar] [CrossRef]
  61. Pan, D.; Luo, L.; Yu, Y.; Kong, F. Influence of Forest Resource Development Project on the Urban–Rural Income Gap in Old Revolutionary Regions. Sci. Silvae Sin. 2023, 59, 74–89. [Google Scholar] [CrossRef]
  62. Lin, X.; Lin, J.; Liu, F. Study on the Influencing Factors and Ecological Improvement of Agricultural Productivity in Fujian Mountainous Counties under the Perspective of Farmers’ Behaviour. Agric. Econ. 2021, 41, 12–15. [Google Scholar] [CrossRef]
  63. Wang, S.; Wu, R.; Cai, B.; Zhang, M. Analysis of Differences in Development Levels and Obstacles of Digital Villages in Regional Municipalities of Fujian Province. Straits Sci. 2024, 40, 139–144+152. [Google Scholar] [CrossRef]
  64. Bai, W.; Chen, J.; Hou, J. The Impact of Digital Rural Construction the Quality of Agricultural Development. China Bus. Mark. 2025, 39, 68–81. [Google Scholar] [CrossRef]
  65. Zeng, Y.; Zhong, Z. Regional Differences of Digital Rural Construction in China and Driving Factors. Trop. Geogr. 2025, 45, 52–65. [Google Scholar] [CrossRef]
  66. Zheng, K. Evaluation of Agricultural Eco–efficiency in Fujian Province and Exploration of Paths to Improvement. Seed Sci. Technol. 2021, 39, 13–15. [Google Scholar] [CrossRef]
Figure 1. Theoretical analysis framework.
Sustainability 17 03840 g001
Figure 2. The comprehensive efficiency of eco-agriculture in 53 counties of Fujian Province from 2012 to 2022.
Sustainability 17 03840 g002
Figure 3. Moran scatterplot of comprehensive efficiency of eco-agriculture in 53 counties in 2012, 2017, and 2022.
Sustainability 17 03840 g003
Table 1. Digital village evaluation indicator system.
Primary IndicatorsSecondary IndicatorsExplanation of Secondary IndicatorsUnit
of Measure
Digital Information InfrastructureFixed telephone penetration rateTotal fixed telephone subscribers as a proportion of the household population%
Digital Industry DevelopmentDevelopment level of the tertiary industryTertiary value addedCNY 10,000
Digital Science and Technology AgricultureDegree of agricultural mechanizationArea covered by digital agricultural mechanization technologies.Hectares
Digital Life ServicesHealth technology employeesNumber of health technology practitionersPeople
Digital Financial ServicesFinancial loansThe year-end outstanding balance of financial institution loansCNY 10,000
Rural Quality of Life Per capita disposable incomePer capita disposable income of rural residentsCNY
Total retail sales of consumer goodsTotal retail sales of consumer goodsCNY 10,000
Table 2. The comprehensive efficiency of eco-agriculture indicator system.
Input and Output IndicatorsSecondary IndicatorsVariablesUnit
(of Measure)
InputFacility agricultural land inputsBased on data on total area occupied by facility agricultureHectares
Farmland inputsBased on data on total sown area of cropsThousand hectares
Labor force inputsEmployees of the unit
at the end of the year
People
Agricultural machinery inputsBased on data on total power
of agricultural machinery
Kilowatts
Expected outputAdded value of the primary industry in agricultureBased on data on value added in the primary sectorCNY 10,000
Non-expected outputCarbon emissions from agricultureIn terms of total grain productionkg
Table 3. Descriptions of variables.
Variable TypeVariable NameIndicators of MeasurementVariable Symbol
Explanatory variableEco-agricultureComprehensive efficiency of eco-agriculturelnagri
Explained variableDigital village constructionLevel of digital village constructionlndigit
Control variablesLevel of economic developmentGross regional productlngdp
Number of administrative divisionsNumber of townshipslntown
Level of agricultural developmentValue added of agricultural productionlnadd
Size of the oilseed industryOilseed productionlnoil
Table 4. The comprehensive efficiency of eco-agriculture in Lianjiang, Luoyuan, Dongshan, and Guangze from 2012 to 2022.
County20122013201420152016201720182019202020212022Average Value
Lianjiang1.231.281.241.221.371.541.331.341.431.461.561.36
Luoyuan1.011.021.031.030.351.201.341.431.511.581.621.19
Dongshan1.771.751.711.881.871.121.381.321.281.290.221.42
Guangze1.151.161.361.301.171.021.201.191.131.100.521.12
Table 5. Average level of digital village construction in each region of Fujian Province from 2012 to 2022.
RegionAverage Level of Digital Village Construction
Southern region0.0422
Northern region0.0153
Central region0.0423
Western region0.0180
Eastern region0.0183
Whole province0.0277
Table 6. Spatial correlation test of comprehensive efficiency of eco-agriculture from 2017 to 2022.
YearMoran’s IZ-Valuep-Value
20170.403 ***4.2140.000
20180.236 ***2.4700.007
20190.246 ***2.5600.005
20200.221 **2.3150.010
20210.203 **2.1540.016
20220.228 ***2.4030.008
Note: *** and ** indicate significance at the 1 percent and 5 percent levels, respectively.
Table 7. Local spatial clustering of comprehensive efficiency of eco-agriculture in 53 counties in 2012, 2017, and 2022.
YearCounties Where Different Agglomerations Are Located (Number)
H-HL-HL-LH-L
2012Youxi, Luoyuan, Lianjiang, Pingtan, Zhao’an, Fuqing (6)Shaowu, Shaxian, Zhangping, Minhou, Wuyishan, Dehua, Yongchun, Minqing, Nanjing, Xianyou, Zhangpu, Yong’an, Yunxiao (13)Shunchang, Hui’an, Fuding, Songxi, Liancheng, Fu’an, Mingxi, Pinghe, Jianning, Anxi, Jian’ou, Shouning, Xiapu, Shishi, Gutian, Ninghua, Nan’an, Zhouning, Wuping, Changting, Qingliu, Zhenrong, Zhenghe, Pingnan, Shanghang, Jinjiang (26)Datian, Hua’an, Guangze, Dongshan, Yongtai, Pucheng, Taining, Jiangle (8)
2017Luoyuan, Lianjiang, Yongtai, Minqing (4)Youxi, Hui’an, Shaowu, Minhou, Wuyishan, Nanjing, Zhangpu, Gutian, Jinjiang, Yunxiao, Fuqing (11)Shunchang, Fuding, Songxi, Datian, Zhangping, Liancheng, Fu’an, Mingxi, Dehua, Yongchun, Pucheng, Jianning, Anxi, Jian’ou, Xianyou, Shouning, Taining, Chongle, Zhao’an, Yong’an, Ninghua, Nan’an, Zhouning, Wuping, Changting, Qingliu, Zhengrong, Zhenghe, Pingnan, Shanghang (30)Shaxian, Hua’an, Guangze, Dongshan, Pinghe, Pingtan, Xiapu, Shishi (8)
2022Luoyuan, Lianjiang, Fu’an, Pinghe, Yongtai, Minqing, Jian’ou, Xiapu, Zhao’an, Gutian (10)Youxi, Fuding, Shaowu, Shaxian, Dongshan, Minhou, Wuyishan, Nanjing, Zhangpu, Jiangle, Zherong, Pingnan, Yunxiao, Fuqing (14)Hui’an, Songxi, Datian, Hua’an, Liancheng, Mingxi, Dehua, Yongchun, Jianning, Anxi, Xianyou, Shouning, Yong’an, Ninghua, Nan’an, Zhou’ning, Wuping, Changting, Qingliu, Zhenghe, Shanghang, Jinjiang (22)Shunchang, Guangze, Zhangping, Pingtan, Pucheng, Taining, Shishi (7)
Table 8. LM test results.
Explanatory VariableStatisticsLMp
Level of Digital Village ConstructionSpatial error estimation18.352 ***0.000
Space lag estimation16.078 ***0.000
Note: *** indicate significance at the 1 percent level.
Table 9. Spatial econometric model results.
VariablesSDM ModelSAR Model
Time-FixedSpatial-FixedSpatiotemporal Two-Way FixedTime-FixedSpatial-FixedSpatiotemporal
Two-Way Fixed
Spatial
(rho)
0.2095 ***0.2039 ***0.1107 **0.2240 ***0.2015 ***0.1099 **
lndigit0.21530.22230.02920.67230.2008 ***0.0342
lngdp−0.0421 **−0.0144−0.0063−0.02250.0813−0.0053
lntown−0.0586 ***0.03280.0499−0.0612 ***0.01730.0211
lnadd−0.0254 **0.0316 *−0.0253 **−0.0122−0.0333 **−0.0203
lnoil−0.00100.0451 **0.0451 ***−0.00730.03010.0366 *
R20.09360.01910.00280.03290.00260.0039
Note: ***, **, and * indicate significance at the 1 percent, 5 percent, and 10 percent levels, respectively.
Table 10. Effect decomposition results.
VariablesComprehensive Efficiency of Eco-Agriculture
SDM ModelSAR Model
Direct EffectIndirect EffectAggregate EffectDirect EffectIndirect EffectAggregate Effect
lndigit0.25890.65270.91150.6946 *0.1954 **0.8900 **
lngdp−0.0399 **0.0586 *0.0187−0.0236−0.0068−0.0303
lntown−0.0609 ***−0.0711−0.1320−0.0610 **−0.0170 ***−0.0780 ***
lnadd−0.0201 *0.1063 ***0.0862 ***−0.0128−0.0037−0.0165
lnoil−0.0027−0.0383 *−0.0410 ***−0.0071−0.0019−0.0090
R20.09360.09360.0936 ***0.03290.03290.0329
Note: ***, **, and * indicate significance at the 1 percent, 5 percent, and 10 percent levels, respectively.
Disclaimer/Publisher’s Note: The statements, opinions and data contained in all publications are solely those of the individual author(s) and contributor(s) and not of MDPI and/or the editor(s). MDPI and/or the editor(s) disclaim responsibility for any injury to people or property resulting from any ideas, methods, instructions or products referred to in the content.

