Abstract
Teacher professional development (PD) programs ensure quality education, and quality education is the basis for sustainable development. However, the non-participation of mathematics teachers in PD still represents a tough challenge for several school systems and remains poorly understood. Using data from the 2011, 2015, and 2019 cycles of the Trends in International Mathematics and Science Study (TIMSS), we analyzed more than 200 national datasets to identify countries with relevant proportions of non-participation in PD and model cross-nationally the relationship between the odds of this outcome and a set of variables at the teacher and school level, including the interaction between job satisfaction and the attributes of the schools. Successive logistic regression models applied to each national dataset reveals that, in different countries, the teachers’ job satisfaction, sex, teaching experience, the completion of initial teaching training, and the schools’ attributes (i.e., location and socio-economic status (SES)) were significantly associated with the odds of non-participation in PD amongst mathematics teachers. Three cases (Lebanon and Japan in 2015, and Norway in 2019) describes opposite patterns of results for the interaction between the teachers’ job satisfaction and the type of school location (urban vs. remote rural). In Lebanon in 2019, female teachers, as well as more experienced teachers and those teachers working in deprived areas were significantly more likely to report non-participation in PD. This study underscores the importance of undertaking regular and reliable cross-national monitoring of teachers’ non-participation in PD to guide policy efforts aligned with indicator 4.c.7 of the UN’s Sustainable Development Goals framework.
1. Introduction
International surveys in education indicate that teachers’ participation in PD increased steadily over the last decade; thus, in many countries, practically all teachers engage regularly in this type of activities [1,2,3,4,5]. Albeit PD is considered a compulsory requirement to progress in several teaching careers [6,7], many educators take up voluntarily these activities because they represent genuine opportunities to formally upgrade their professional knowledge and skills. For both reasons, educational reforms have traditionally acknowledged PD to be a priority policy mechanism to sustain high-quality education for all students [8,9,10]. Likewise, researchers in this field have thoroughly examined the core features of effective PD [11,12] and its complex interaction with school contextual factors that enable improvements in educational outcomes [13,14,15]. As a result, the great majority of studies nowadays focus on the participation of teachers in PD and assess its impact in multiple levels of school work.
However, teachers’ non-participation in PD activities still represents a tough challenge for several school systems and remains poorly understood. For instance, an analysis (reported below in this article) of reliable cross-country data revealed that mathematics teachers from a particular segment of nations lagged way behind in this indicator over the same time period of international rise. For these countries, the known benefits of PD on teaching quality and students’ achievement are less likely to be accrued than in countries with higher levels of participation. In addition, recent international reports have remarked that many underdeveloped educational systems lack information about the proportions of teachers’ participation in PD [16,17]. Since these nations have also reported lower levels of qualified teachers and educational resources, the absence of valid monitoring of this indicator might certainly hinder the implementation of evidence-based initiatives for school improvement. All in all, this situation limits our understanding of the kind of teachers, schools, and systems for which PD activities may (or may not) work.
At this juncture, educational theory suggested that non-participation in PD might be explained by the interaction between the contextual and individual factors of the teachers’ work [18,19]. But a number of empirical questions remain to better understand the case of countries with relevant proportions of mathematics teachers without participation in PD. First, the research on PD has so far assumed a linear relationship between the predictors of participation and different measures of this outcome (e.g., type of activity attended, hours spent, etc.), disregarding the analysis of what would increase the odds of not engaging in such activities (vs. engaging at some level). In addition, only the direct effects of such predictors were usually of interest for researchers; thus, there is still room to examine the interactions expected in the theory. Furthermore, statistical analyses of valid cross-national data have rarely been performed before in this area, even though several large-scale surveys in education have collected nationally representative information over the last decades.
Resolution of these problems may contribute towards a better understanding of the challenges that these countries meet in order to increase the percentage of teachers who receive in-service training. This proportion has been recently adopted in the Sustainable Development Goals’ framework as a thematic indicator to reliably quantify the expected substantial increase in the supply of qualified teachers—target 4.c.7 [17]. Since this framework acknowledges that PD programs ensure the improvement of quality education, which, in turn, enhances the prosperity of societies, monitoring the barriers to universal access to PD becomes a relevant tool to orientate the decision-making for sustainable development. In this context, the present article sets up to answer the following overarching research question: what attributes of mathematics teachers and their schools were associated with the odds of non-participation in PD activities in countries that took part in the TIMSS 2011, 2015, and 2019? In particular, this article also inquiries whether, in countries with relevant proportions of this indicator, these odds can be explained by the interaction between relevant school conditions (i.e., SES and location) and teachers’ job satisfaction. Using data from three recent cycles of the TIMSS, this study aims to estimate the link between the odds of non-participation in PD and a selection of teacher and school predictors drawn from the specialized literature.
Literature Review
Adult education theory has suggested that teachers’ uptake of PD can be accounted for by the interaction between the characteristics of the teachers’ context and the individual attributes of the teachers themselves [19]. Following this framework, a number of empirical pieces of research in the field of PD have provided evidence that supports the contribution of specific predictors at both levels.
At the teacher level, job satisfaction has emerged as a factor associated with participation in PD, showing significant relationships across different national contexts. Overall, this positive relationship is at present reported bidirectionally: for instance, Yoon and Kim [20,21] reported that more satisfied teachers were more likely to engage in PD activities (and also have a positive perception of their PD experience), whereas Zhou et al. [22] revealed that participation in PD also enhanced job satisfaction by improving teachers’ self-efficacy and competence. Since teachers’ job satisfaction is also directly associated with better school working conditions and positive teachers’ characteristics [23], it may well be the case that participation in PD activities could be explained by the interaction of variables at both levels.
Because teachers’ job satisfaction is closely linked with positive self-efficacy, school climate, and less workload stress [24], teachers with higher rates of job satisfaction might also be more motivated to uptake PD activities to improve their competencies [25]. This idea can be understood in the context of the reported link between participation in PD and the individual teachers’ beliefs about specific aspects of schoolwork [26], including greater constructivist beliefs about instruction [27], increased work engagement [28], positive dispositions towards PD [29], and greater motivation for public service [4]. The research has also indicated that several features of PD were positively associated with increased job satisfaction and positive perceptions of PD [20,30]. Hence, this evidence suggests that increased teachers’ job satisfaction should diminish the risk of non-participation in PD (and vice versa), while different school variables might affect this contribution, too.
Research has also highlighted that sex might be a relevant predictor of teachers’ engagement in PD. For instance, Badri et al. [31] found significant differences in teachers’ attitudes towards PD between male and female teachers. In addition, Yoon and Kim [21] also revealed that male teachers were more likely to belong to high participatory profiles in PD activities (particularly in urban school settings). Nonetheless, an analysis of the 2013 cycle of the Teaching and Learning International Survey (TALIS) yielded mixed results on this predictor: in some countries, male teachers tended to participate more in PD, whereas, in other countries, the same was true for female colleagues, or even no evidence of differences in this outcome were found [32]. Therefore, differences in non-participation in PD between male and female teachers is likely to be affected by cross-cultural characteristics of their school systems, which warrants further scrutiny of the available international data.
Regarding the relationship between teachers’ work experience and their participation in PD, it has been found that newer teachers tend to engage more frequently in these kinds of activities. For example, Zhang et al. [33] revealed that increased teaching experience was associated with decreased motivation for PD. Also, Yoon and Kim [21] found that less experienced teachers were more likely to belong to high participatory profiles in PD activities. Nonetheless, Zhang et al. [33] reported that the quality of previous PD experiences also appeared to be crucial, since teachers who attended successful PD activities in the past maintained higher levels of motivation for engaging in new PD activities. In summary, these findings suggests that more teaching experience might increase the probability of non-participation in PD, and that positive early experiences of PD may buffer this effect throughout the teachers’ career.
The qualification status of teachers has also been found to predict differences in their participation in PD. Initial teacher training is considered a foundation that influences teachers’ subsequent engagement with these activities, because teachers would uptake PD that either enhances (i.e., inclination hypothesis) or completes (i.e., compensation hypothesis) the topics they learned before working in schools [18]. Nonetheless, using data from TALIS 2013, Barrera-Pedemonte [32] reported that, in a number of countries, teachers who did not complete the initial stage of teacher education participated comparatively less in PD activities. Therefore, these results might question the compensation hypothesis, by which the absence of initial preparation for the teaching career would motivate teachers to take more PD opportunities (compared to their more prepared colleagues). Consequently, based on the available international evidence, we would expect that teachers who had completed such level of preparation would take more advantage of PD opportunities.
At the school level, the relationship between the teachers’ location, socio-economic status (SES), and participation in PD has been widely reported [3,4]. Regarding school location, the prevailing view is that opportunities for PD are less frequently offered in rural areas than in urban areas. According to De la Vega Rodríguez [34], teachers in rural zones face unique challenges often associated with geographical and bureaucratic isolation, limiting access to adequate educational policies and chances for PD. In this line of argumentation, Wolfenden et al. [35] argued that teachers living in rural areas meet the meaningful limitations to uptake PD, such as poor internet connectivity, inadequate infrastructure, and limited access to context-related PD content. Under these circumstances, the contextual constraints observed in rural schools and the teachers’ lower participation in PD would combine, shaping each other. In addition, Duk et al. [36] remarked that urban contexts offer increased resources for PD, emphasizing the inequity across locations and underscoring the relevance of designing situated and collaborative programs to maximize the contextual adaptations of PD initiatives. Thereby, effective PD systems should prioritize equity by integrating flexible, scalable, and ICT-mediated solutions that address the fact that teachers in rural locations would be more likely to non-participate in PD.
In the case of schools’ SES, a common position is that teachers working in low socio-economic areas are less likely to take up opportunities of PD than their colleagues in more affluent schools [37,38]. However, recent analyses of international data [4] have revealed that, in Chile, Israel, and Japan, teachers from schools with wealthier families attended less PD activities than their colleagues from more deprived areas (only in Mexico was the opposite found). Albeit, systematic non-participation in PD observed in low SES areas might be interpreted as an effect of financial constraints that could be expected in their schools [39], in high SES zones it would reflect the fact that PD is less necessary because the students’ background becomes less demanding for the teachers [40]. All in all, both interpretations reinforce the idea that the risk of non-participation in PD is conditional to the schools’ location and SES because both conditions challenge teachers to adjust their learning needs to each contextual specificity.
2. Materials and Methods
2.1. Datasets and Samples
The TIMSS is an international large-scale assessment conducted by the International Association for the Evaluation of Educational Achievement. The present secondary data analysis uses eighth grade national datasets from its 2011, 2015, and 2019 cycles, which targeted all students enrolled in each country in the corresponding year of schooling (13/14 years old). The TIMSS uses a two-stage stratified cluster sampling strategy: in the first stage, each country randomly selected at least 150 schools from their national frames, with probability proportional to their size; in the second stage, one or two intact classes were sampled within each school. This procedure usually involves the participation of more than 4000 students per country in each round of the TIMSS; in the 2011, 2015, and 2019 rounds, 79, 64, and 74 countries took part in the assessment, respectively [41,42,43]. We focused our analyses only on the mathematics teachers of these students.
The precision of the survey design of the TIMSS is sensitive to the non-participation of schools and students on the day of the test. For this reason, the organizers set minima for school, classroom, and student rates participation, regarding original sample sizes [41]. In order to correct for classrooms and students non-response, a set of sampling weights are calculated in each cycle by the organizers [44]. As a result, there are specific weighting factors for each student within each national dataset that informs his or her inverse probability of selection, with the necessary adjustments for nonresponse. In the present study, we considered this feature of the sampling strategy to estimate the magnitude of teachers’ non-participation in PD, interpreted as the percentage of the grade eight students taught by mathematics teachers who did not participate in these types of activities in the previous two years before the assessment.
2.2. Variables
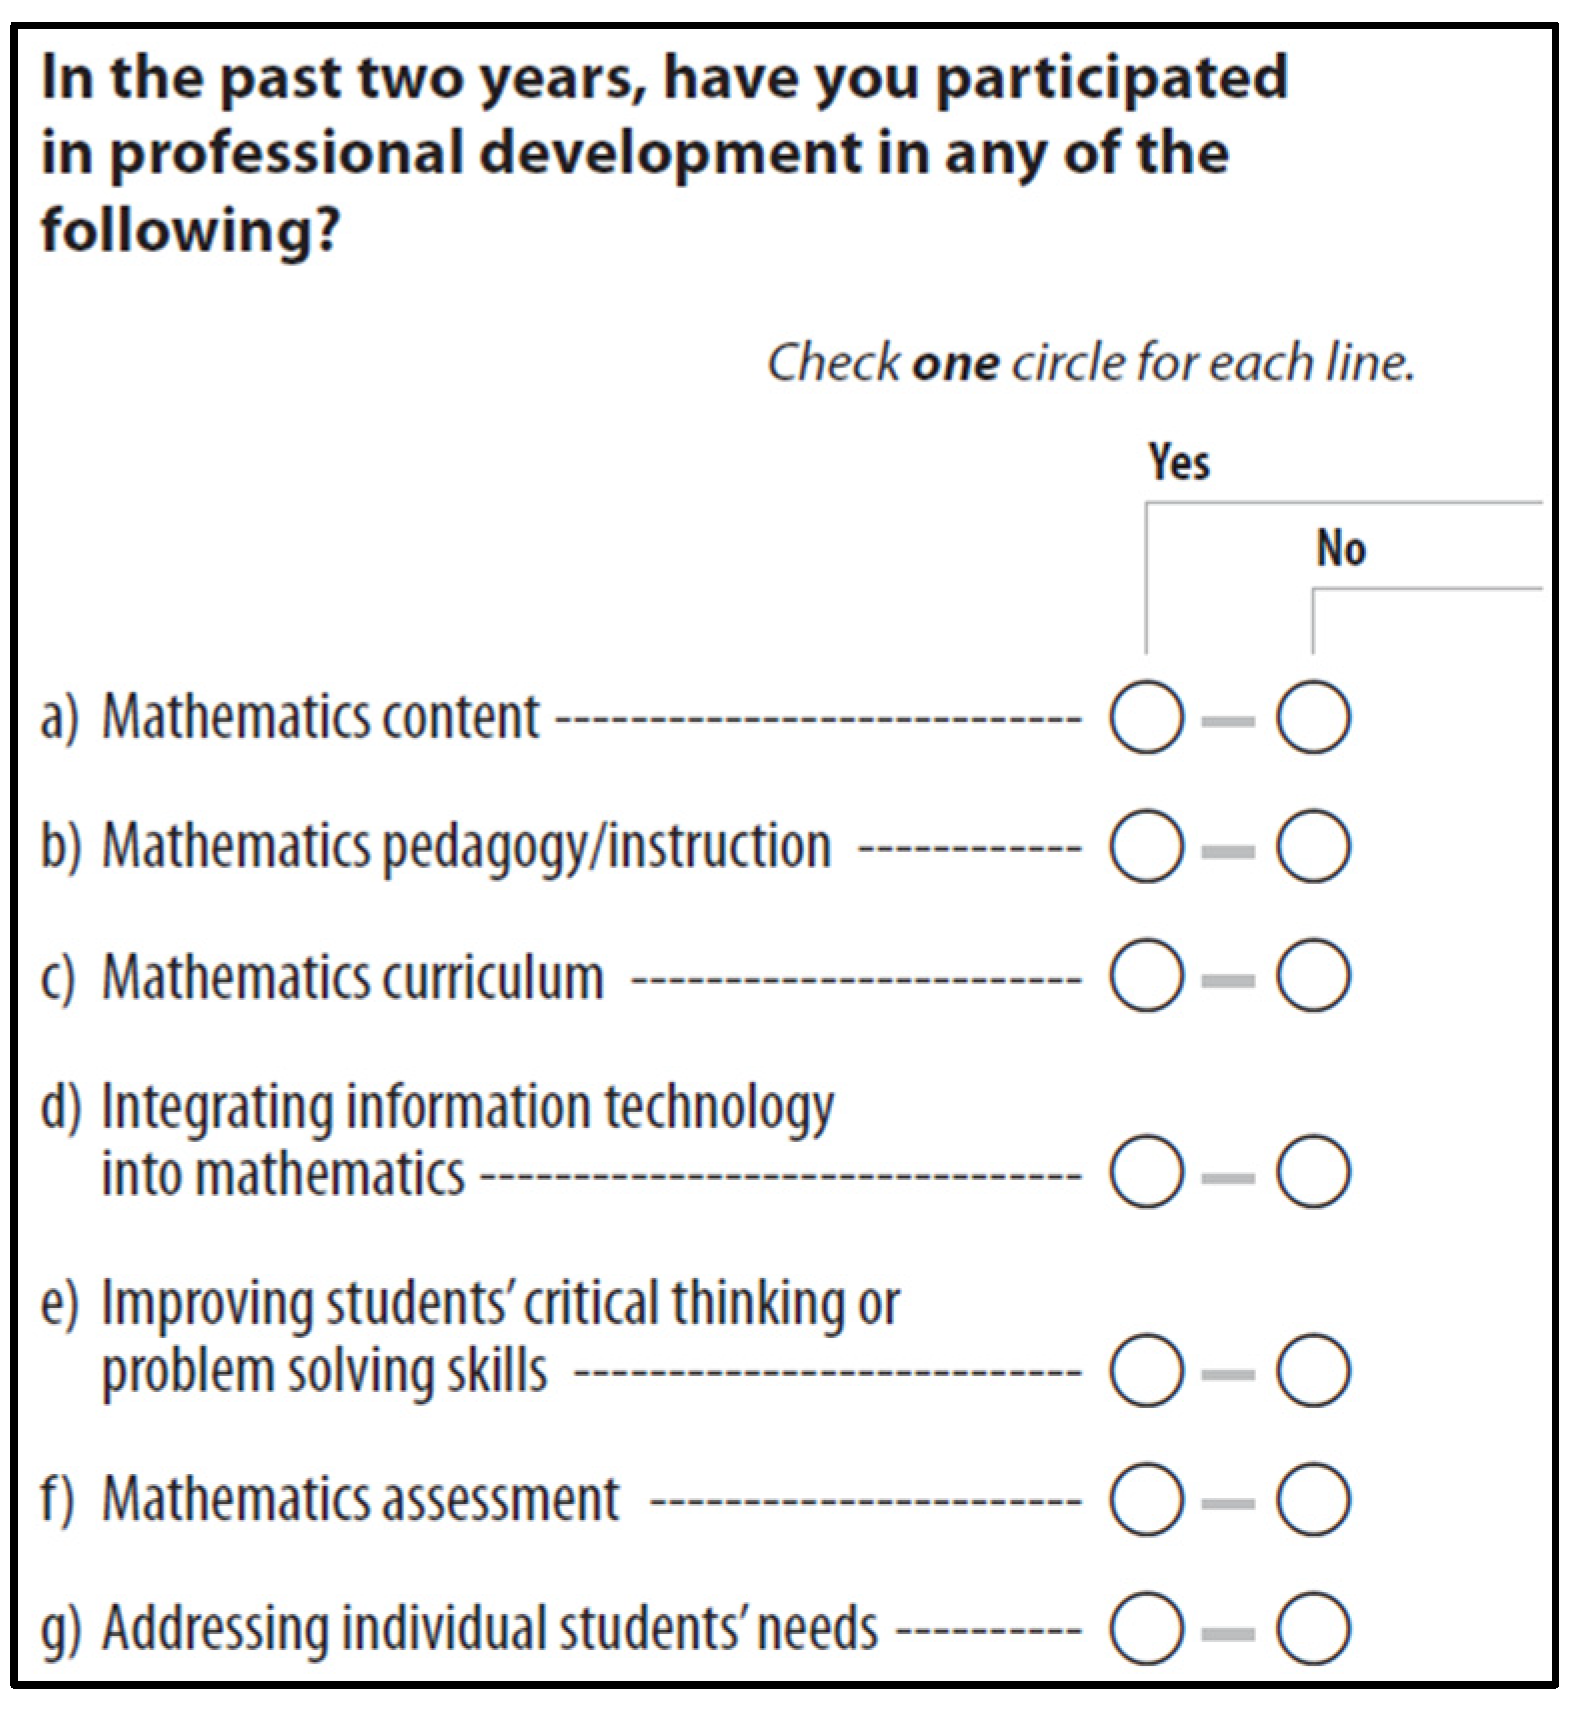
Data on the key variables of the present study were drawn from the Teacher Questionnaire and the School Questionnaire in the TIMSS; these instruments were administered to every mathematics teacher and principal of the sample of students, respectively. Using the questions designed to collect information about teachers’ preparation to teach mathematics, we calculated appropriate versions of the dependent variable. For the TIMSS 2011, we generated this variable for each teacher from their self-reported frequency of participation in PD as indicated in the item presented in Figure 1 (BTBM29A to G in the 2011 TIMSS’s dataset). The new variable was coded with a value of 1 if teachers responded “No” to all lines, and 0 if they checked “Yes” in at least one of the options.
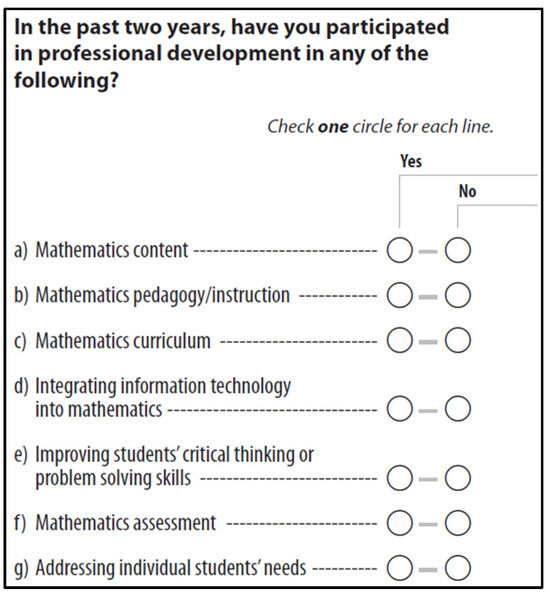
Figure 1.
Item-responses on participation in professional development in the Trends in International Mathematics and Science Study (TIMSS) 2011 Teacher Questionnaire [45]. Source: TIMSS 2011 Assessment. Copyright © 2009 International Association for the Evaluation of Educational Achievement (IEA). Publisher: TIMSS & PIRLS International Study Center, Lynch School of Education, Boston College.
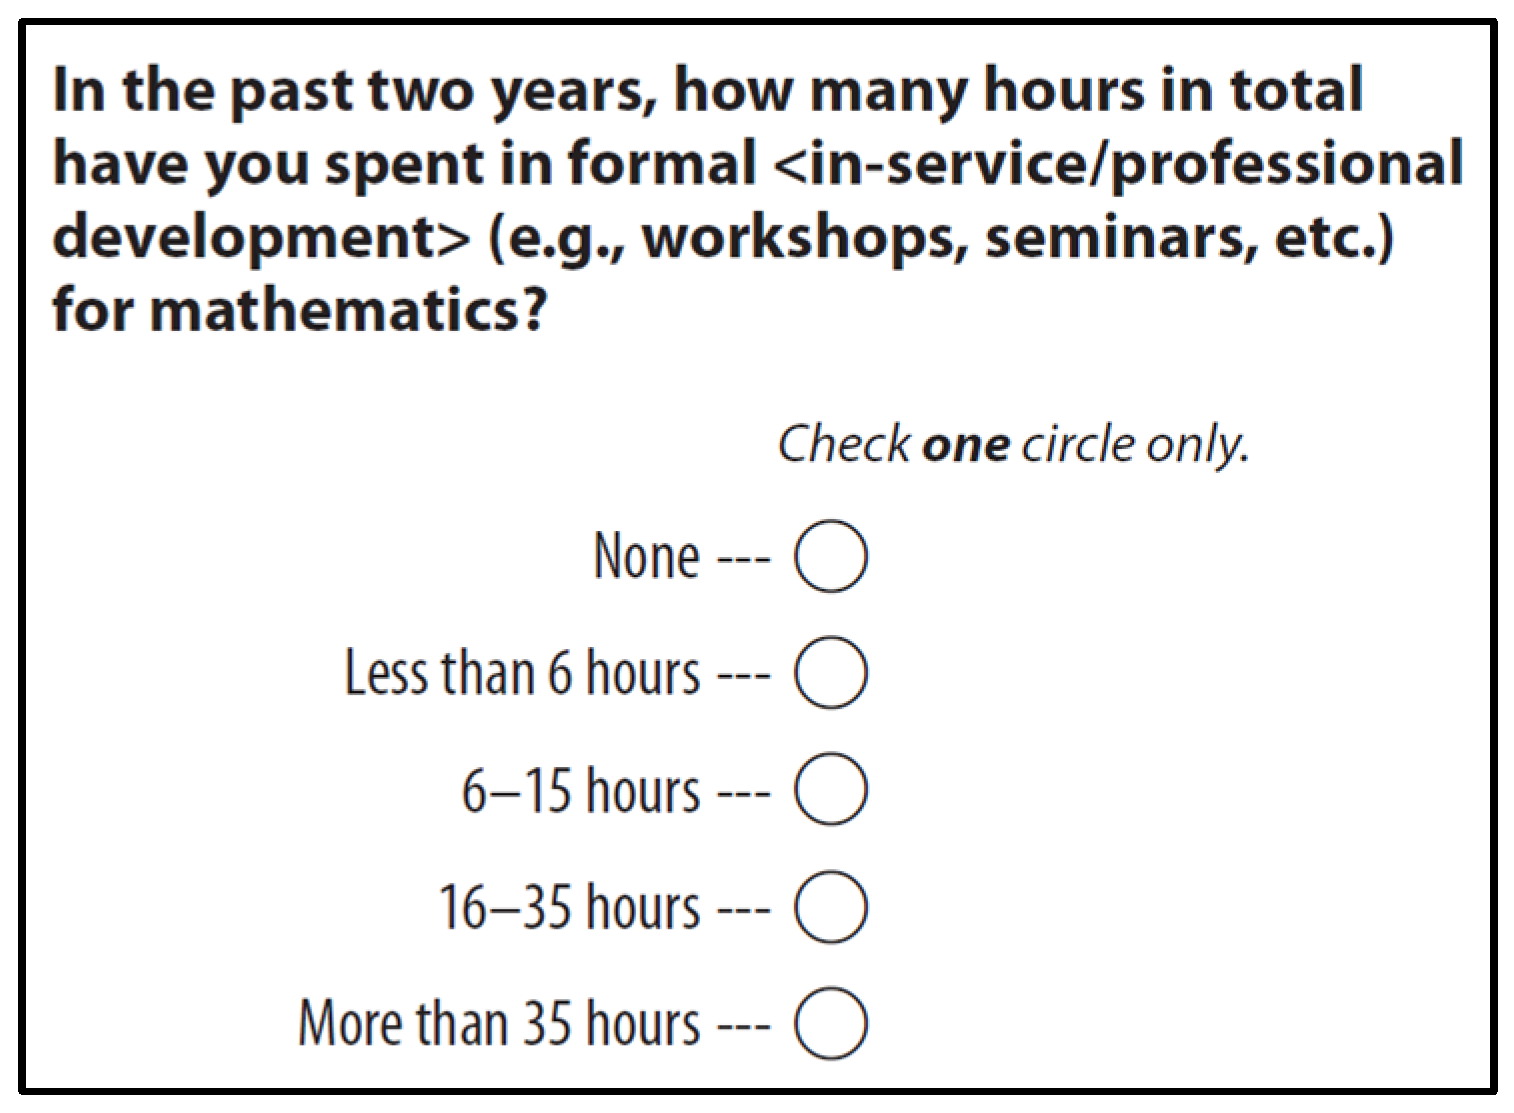
The 2015 and 2019 TIMSS included an additional item to collect self-reported hours spent in PD (BTBM25 in 2015 and BTBM23 in 2019; see Figure 2); in these cases, we created the dependent variable for each teacher from their responses to these items, assigning a value of 1 if they checked the circle “None”, and 0 if they selected any of the remaining options.
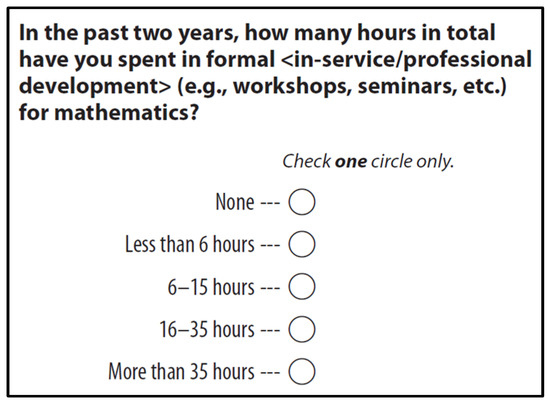
Figure 2.
Item-responses on participation in professional development in the Trends in International Mathematics and Science Study (TIMSS) 2015 [46] and 2019 [47] Teacher Questionnaire. Source: TIMSS 2015 Assessment Frameworks. Copyright © 2013 International Association for the Evaluation of Educational Achievement (IEA). Publisher: TIMSS & PIRLS International Study Center, Lynch School of Education, Boston College; IEA’s Trends in International Mathematics and Science Study—TIMSS 2019 Copyright © 2021 International Association for the Evaluation of Educational Achievement (IEA). Publisher: TIMSS & PIRLS International Study Center, Lynch School of Education and Human Development, Boston College.
The variables hypothesized in the current study as predictors of teachers’ non-participation in PD included the attributes of the teachers and the schools. At the teacher level, these corresponded to job satisfaction, sex, teaching experience and completion of initial teacher training:
- Job satisfaction: We used the continuous scales developed by the organizers of the TIMSS to measure this predictor (BTBGTCS Teacher Career Satisfaction in 2011 [48]; BTBGTJS Teacher Job Satisfaction in 2015 [49] and 2019 [50]). These scales were created using the Item Response Theory methods [51,52,53] based on either the teachers’ degree of agreement (2011) or the frequency they perceived (2015 and 2019) different statements related to their satisfaction with several aspects of their work (for example, “I am content with my profession as a teacher”). The Cronbach’s α for these scales across countries ranged between 0.51 and 0.79 in 2011, between 0.85 and 0.95 in 2015, and between 0.78 and 0.95 in 2019.
- Sex: We recoded the original variable (BTBG02 in 2011, 2015, and 2019) to assign the value 1 to “Female” and 0 to “Male” teachers.
- Teaching experience: We used the original item (BTBG01 in 2011, 2015, and 2019) that contained teachers’ numeric responses to the question “By the end of this school year, how many years will you have been teaching altogether? Please round to the nearest whole number”.
- Completion of the initial teacher training: We developed a new variable to identify the teachers who finished a post-secondary education degree focused on mathematics education. This variable was created by detecting teachers with the highest level of formal education equivalent either to a ISCED Level 5A or higher (BTBG04 in 2011, 2015, and 2019), and that the main area of study of that degree was either “Mathematics” or “Education-Mathematics” (BTBG05 in 2011, 2015, and 2019). We assigned a value of 1 in this new variable to teachers who complied with both attributes, whereas a value of 0 corresponded to those who did not.
At the school level, predictors included principals’ reports on the type of immediate area of the school’s location and its socio-economic status:
- School location: We used the original item (BCBG05B in 2011, 2015, and 2019) that requested principals to indicate the option that best described the immediate area where their school was located. Options included the following: 1 = “Urban–Densely populated”; 2 = “Suburban–On fringe or outskirts of urban area”; 3 = “Medium size city or large town”; 4 = “Small town or village”; 5 = “Remote rural”.
- Socio-economic status of school (SES): Finally, we used the original item (BCBG05C in 2011, 2015, and 2019) that collected principals’ reports on the average income level of the school’s surrounding area (1 = “High”, 2 = “Medium”, and 3 = “Low”).
2.3. Analyses
We divided the analysis into three sequential phases with a focus on the countries where non-participation in PD was comparatively important, and the set of hypothesized predictors and interactions contributed to explain this problem. Firstly, we estimated the magnitude of the dependent variable for all the educational systems that took part in the 2011, 2015, and 2019 mathematics Grade 8 TIMSS. Hence, we calculated the proportion of non-participation within each national dataset as the percentage of the grade eight students taught by mathematics teachers who did not take part in PD activities in the previous two years. This analysis allowed the identification of countries with relevant proportions of non-participation (equal to or greater than 19%) in at least one round of the TIMSS.
Secondly, we assessed the capacity of the set of predictors to account for the differences in non-participation in PD (vs. participation) in each of the above-mentioned countries using a series of logistic regression models (LR). LR is appropriate because it exploits the odds of teachers who indicated lack of participation in PD, calculated as the proportion between the number of such teachers and those who attended any type of PD. We modelled within each country dataset the natural logarithm of such odds through a linear expression based on an intercept and regression coefficients for parameters of interest [54,55]. This statistical model served initially to check whether the odds of non-participation in PD (TPD) were directly associated with the teachers’ job satisfaction (jobsat), sex, years of teaching experience (exp), their status of completion of initial teaching training (ini), as well as the location (loc) and SES of their schools. Accordingly, the form of the model at this stage was as follows:
where = Teacher i, = School j, = Country dataset k.
Thirdly, we performed two rounds of additional analyses to evaluate possible interactions between the teachers’ job satisfaction and the school level predictors on non-participation in PD. In the first round, we added to the model an interaction term to specifically quantify the combined association between the schools’ location and the teachers’ job satisfaction. Consequently, the model took the following form:
where = Teacher i; = School j, = Country dataset k.
In the second round we focused on the interaction between the schools’ SES and the teachers’ job satisfaction, thus the final form of the model was as follows:
where = Teacher i; = School j, = Country dataset k.
In both rounds, the interaction terms were intended to determine whether the odds of non-participation in PD were associated with differences in the teachers’ job satisfaction, or fluctuated according either to the location (urban vs. remote rural) or SES of the schools (high vs. low).
3. Results
We report the results in three sections: Section 3.1 addresses the proportion of non-participation in PD in each country and cycle of the TIMSS; Section 3.2 illustrates the capacity of the initial model to detect direct associations between the dependent variable and the teacher and school level predictors; Section 3.3 describes cases in which the interactions between job satisfaction and school level variables significantly explained teachers’ non-participation in PD.
3.1. Non-Participation in PD Across Countries in 2011, 2015, and 2019
Table 1 describes the estimated proportion of non-participation in PD in the twenty countries with estimates over 19% in either the 2011, 2015, or 2019 TIMSS (school systems were sorted in descending order according to the average proportion observed between years). Most of these cases corresponds to European (Turkey, Norway, Hungary, Finland, Romania, Italy, and Sweden) and Arab countries (Jordan, Morocco, Lebanon, the Syrian Arab Republic, the Palestinian National Authority, Oman, and Bahrain), whereas other regions remained underrepresented (Chile, Botswana, Armenia, the Republic of Korea, and Malaysia). Overall, the table reveals that the non-participation of teachers in PD activities slightly declined over the decade. For instance, the number of countries with relevant proportions of non-participation amounted to 22%, 17%, and 16% of all the nations that took part in each cycle, respectively. In this context, many of these countries reported a clear downward trend in this indicator, including Jordan, Botswana, Finland, Sweden, the Republic of Korea, Oman, Malaysia, and Bahrain. Furthermore, the estimated total proportion of teachers reporting non-participation in PD decreased from 0.14 in 2011 and 0.15 in 2015 to 0.12 in 2019. In summary, these results indicate that non-participation in PD, to some extent, reduced worldwide and, in particular, reduced among countries with relevant magnitudes of this indicators.

Table 1.
Proportion of non-participation in professional development.
In the majority of countries with relevant proportions of non-participation, however, either there was no evidence of such decline or the downward trend did not drop below 0.19 by the end of the decade. To take the most striking example, teachers reported a sharp increase in non-participation in Hungary (from 0.19 in 2011 to 0.26 in 2015 and 0.30 in 2019), Romania (from 0.07 in 2011 to 0.29 in 2019), and Armenia (from 0.04 in 2011 to 0.42 in 2015). In addition, the slight reduction observed throughout this period in Jordan, Botswana, and Finland barely reached a third (0.32 in Botswana in 2015) or a quarter (0.26 in Jordan and 0.25 in Finland in 2019) of the surveyed teachers. Moreover, in countries such as Turkey, Norway, Chile, Morocco, Japan, Lebanon, and Italy the levels of non-participation tended to remain over the 0.19 threshold despite their different patterns of fluctuation. These results suggest that teachers report of non-participation persisted relevantly in all these countries over the decade, thus the predictors of such proportions warrant further investigation.
3.2. Predictors of Non-Participation in PD
Table 2 presents the estimation results of our initial LR model applied to each dataset of the countries with relevant proportions of non-participation in PD. These results illustrate for each nation and cycle the odds of non-participation in PD associated directly with the teacher (job satisfaction, sex, teaching experience, and completion of initial teaching training) and the school level variables (location and SES).
Table 2.
Predictive results of non-participation in professional development.
Regarding teacher level predictors, we firstly observed that wherever the completion of initial teacher training was significantly related with non-participation in PD, it directly contributed to lower proportions in the dependent variable. These were the cases for Turkey in 2011 (OR = 0.30, 95% CI) and 2019 (OR = 0.08, 95% CI), Chile in 2015 (OR = 0.15, 99% CI), Finland in 2019 (OR = 0.24, 99.9% CI), and Japan in 2019 (OR = 0.24, 99.9% CI). In other words, the teachers from these countries who, by the time of the assessment, had finished a postsecondary formal degree of teacher training with a focus in mathematics education were less likely to neglect opportunities of PD. Closer examination revealed that the chances of non-participation in PD (vs. participation) among these countries ranged from −70% (Turkey in 2011) to −92% (Turkey in 2019), compared with colleagues without this type of teacher education.
Likewise, the model showed that in some countries teachers’ job satisfaction also linked directly with non-participation in PD. Take the case of Jordan in 2011 and 2015, where the odds ratio for this teacher level predictor was 0.82 and 0.81 (95% CI), respectively, indicating that, for each standard deviation increase in the level of satisfaction with their job, the odds of non-participation in PD reduced by 18–19%. Similarly, such reduction amounted to 32% in Chile in 2015 (OR = 0.68, 99% CI). These results suggest that teachers with greater levels of job satisfaction were significantly less likely to waste chances to participate in PD activities in both countries.
Interestingly, the teachers’ sex and experience were significantly associated with the dependent variable only in one country and cycle: Lebanon in 2019. In this case, the odds of non-participation in PD activities were 2.75 times higher for female teachers than for their male colleagues (with a 95% confidence interval). In a similar vein, we noted that the longer the experience of teachers, the greater the odds ratio for non-participation in PD (OR = 1.05, 95% CI). Thus, both the sex and experience of Lebanese teachers in 2019 would directly predict their chances to abstain from attending PD activities.
Considering the predictors specified at the school level in the model, we noticed in some cases that the location was directly related with the teachers’ non-participation in PD. On the one hand, this association significantly favored schools located in more rural areas in Chile in 2015. In this case, results showed that the chances of non-participation in PD reduced by 35% insofar as the level of rurality of the schools’ area was augmented (OR = 0.65, 95% CI), suggesting that teachers in less urban schools were also less likely not to participate in PD. On the other hand, we found the opposite pattern of results in 2011 for Turkey and Hungary, and in 2015 for Norway. To mention the cases of Turkey and Norway, in both school systems, the odds ratio for non-participation in PD was approximately 1.36 (95% CI); therefore, the chances of lacking opportunities to attend PD activities increased by 36% for teachers working in more rural areas in both nations (the corresponding percentage even amounted to 70% in Hungary (OR = 1.70, 95% CI)). Consequently, these results indicate that the direct association between non-participation in PD and school location does not always penalize teachers working in more rural schools.
Finally, the direct association between the schools’ SES and the dependent variable was statistically significant only for Lebanon in 2019. In this case, the results indicated that teachers who worked in schools located in more deprived areas were 2.34 times more likely to report non-participation in PD activities than their colleagues in more affluent areas (OR = 2.34, 99% CI). Hence, for the Lebanese teachers surveyed in 2019, the SES of their school environment would significantly predict their opportunities either to participate or not in PD activities.
3.3. Interaction Between Job Satisfaction and School Level Variables on Non-Participation in PD
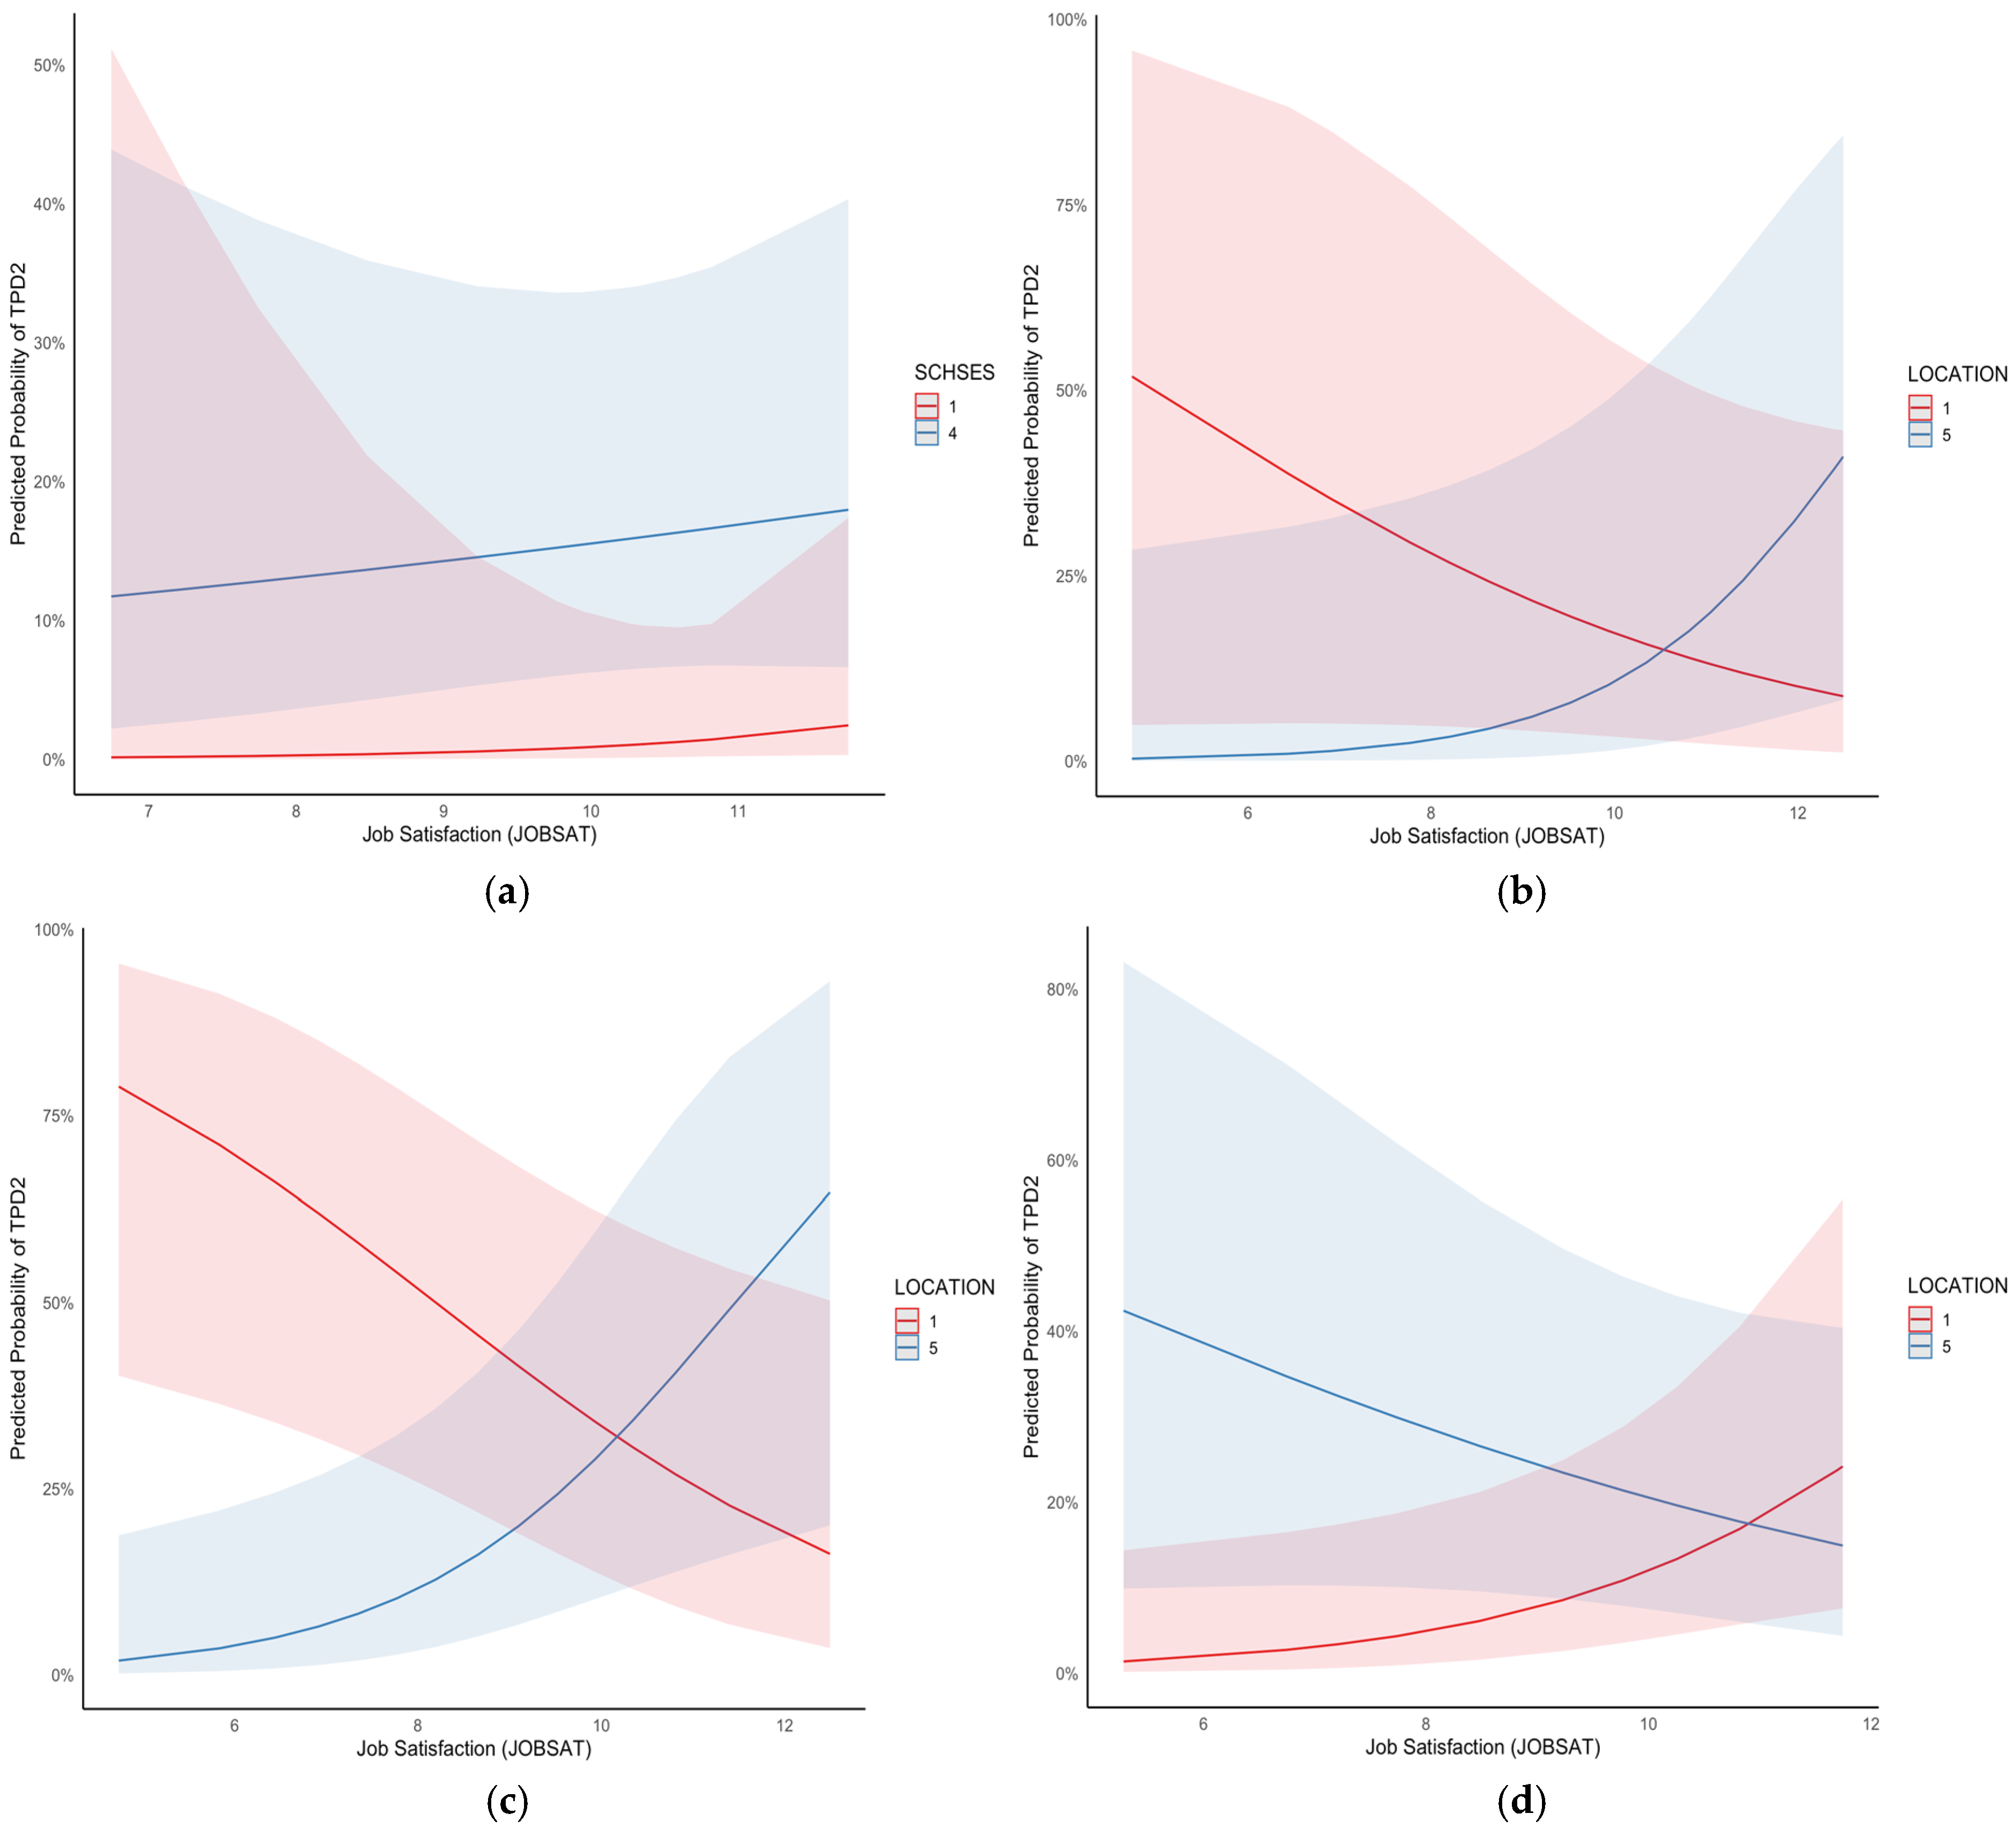
Figure 3 illustrates the four cases where interactions between the teachers’ job satisfaction and the variables at the school level (i.e., location and SES) significantly explained non-participation in PD. Each graph shows the predicted probability of this outcome in the vertical axis and the values of the job satisfaction scale in the horizontal axis. Colored lines represent the two extreme values in each school level predictor: for location these corresponded to 1 = “Urban–Densely populated” (red color) and 5 = “Remote rural” (blue color), and for SES lines represented 1 = “High” (red color) and 3 = “Low” (blue color). The shaded areas depict 95% confidence intervals of estimation.
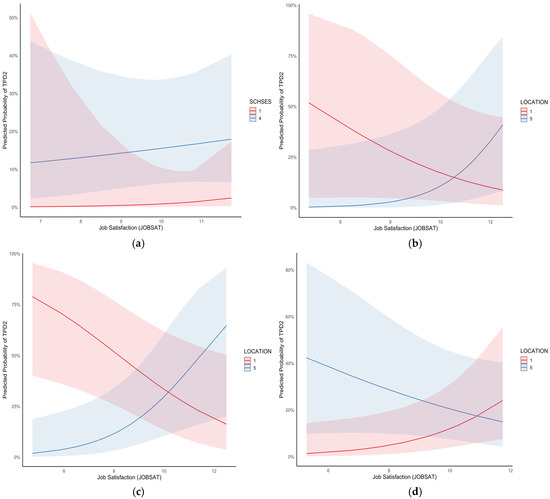
Figure 3.
(a) Interaction between school SES and job satisfaction on non-participation in PD in Lebanon in 2015. (b) Interaction between school location and job satisfaction on non-participation in PD in Lebanon in 2015. (c) Interaction between school location and job satisfaction on non-participation in PD in Japan in 2015. (d) Interaction between school location and job satisfaction on non-participation in PD in Norway in 2019. Source: made by the authors, based on the 2011, 2015, and 2019 TIMSS.
Figure 3a shows that, in 2015 in Lebanon, the contribution of teachers’ job satisfaction to non-participation in PD depended on the SES of schools (b = 0.4, SE = 0.15, p < 0.01). Specifically, the teachers who worked in schools described by their principals as surrounded by a low SES environment reported higher probabilities of lacking opportunities of PD than colleagues in affluent SES areas. It is worth noting that, in wealthier schools, this probability remained practically closer to zero regardless the magnitude of the teachers’ job satisfaction; whereas, in schools located in deprived areas, this indicator ranged approximately from 11% to 15% (interestingly, for these schools, the higher the teachers’ job satisfaction the greater the probability of non-participation in PD activities). All in all, these results indicated that, in this case, the association between the teachers’ job satisfaction and the dependent variable was significantly different for teachers who worked in schools located in high vs. low SES areas.
In the following three cases we detected that the relationship between job satisfaction and the dependent variable depended significantly on the location of the schools. First, we found that, in Lebanon (Figure 3b) and Japan in 2015 (Figure 3c), the pattern of association between this teacher level predictor and the probability of non-participation in PD was significantly different for urban vs. rural schools (b = 0.25, SE = 0.12, p < 0.05). In both cases, this interaction indicated that, for teachers who worked in schools located in remote rural areas, the higher their job satisfaction the greater the probability of non-participation in PD activities. Indeed, the graph shows a sharp rise in non-participation departing from practically zero probability at the six points of the job satisfaction scale to nearly 50% and 65% of probability at the 12 points, respectively. Conversely, higher levels of job satisfaction were associated with lower probabilities of non-participation in PD activities for colleagues who worked in urban environments. To summarize, these cases indicated that the relationship between the teachers’ job satisfaction and their probability of non-participation in PD activities was contingent on the school location, and favored the teachers in urban areas.
It is worth noting that we also evinced a more recent case where the interaction between the teachers’ job satisfaction and the schools’ location on non-participation in PD was statistically significant, and actually favored the teachers in remote rural schools: Norway in 2019 (b = 0.25, SE = 0.12, p < 0.05). The interaction in this case showed that the positive association between job satisfaction and the predicted probability of non-participation in PD was reported amongst teachers from urban schools. On the contrary, greater levels of job satisfaction were related with lesser probabilities of non-participation for teachers who worked in remote rural environments. All in all, these three cases provided evidence for the two opposite scenarios that the interaction between job satisfaction and school location could take: in one situation, the link between satisfaction and non-participation in PD is positive for teachers in remote rural school (e.g., Lebanon and Japan in 2015), and it is negative in the other case (e.g., Norway in 2019).
4. Discussion and Conclusions
Teachers’ non-participation in PD activities surges stagnation in teaching practices, widens gaps in student achievement, and represents a major challenge for several school systems. This highlights the importance of developing robust cross-national comparisons and empirical analyses of school and teacher attributes that may prevent this outcome. We set out to cross-nationally detect direct links between non-participation in PD and mathematics teachers’ job satisfaction, sex, teaching experience, completion of initial teaching training, as well as with the schools’ location and SES. In particular, we also examined the interaction between job satisfaction and school level variables on the odds of non-participation in PD within countries with relevant proportions of this indicator.
Using data from the 2011, 2015, and 2019 TIMSS cycles, we found that in different countries either teachers’ job satisfaction, sex, teaching experience, or their status of completion of initial teaching training were significantly associated with the odds of non-participation in PD. Completion of initial training showed the largest direct association with this outcome, indicating that non-participation was almost two times smaller for teachers with formal post-secondary education degrees in mathematics (compared with their colleagues without this level of training). This finding was consistent with results reported in a number of countries by Barrera-Pedemonte [32] using TALIS 2013 data, in which case, the teachers who lacked initial qualifications attended less PD activities than their certified colleagues. Consequently, our results partially contradicted the compensation hypothesis proposed by Richter [18], which projected that teachers with lower levels of initial preparation would take more advantage of PD opportunities than their more qualified colleagues. This finding also underscored the cardinal importance of adjusted PD systems for teachers without any formal preparation to teach their subjects in the countries examined, thus PD may become an effective mechanism to compensate for the probable lack of mastery in their teaching knowledge, skills and practices.
In our study, we also found that in a number of countries mathematics teachers with greater job satisfaction yielded lower odds of non-participation in PD than their less satisfied colleagues. The results closely matched those obtained by Yoon and Kim [20], using TALIS 2018 data from the United States, and Toropova et al. [23], using the TIMSS 2015 data from Sweden, which indicated that more satisfied teachers were more likely to engage in PD activities, and also had a more positive perception of such experiences. This seems to indicate that PD activities in these countries fairly represented a valuable resource for teachers to sustain their work and maintain them in their careers over time. It is perhaps not surprising that teachers who were more satisfied with their job put more interest in avoiding knowledge obsolescence by taking more PD opportunities. Turning this around, we can also say that countries with this pattern of results should undertake more specific efforts to tailor PD programs targeted to less satisfied teachers. It is possible that, for such teachers, PD should encompass additional motivational components, either intrinsic or extrinsic, in order to reduce the odds of non-participation.
Our study also found that the schools’ location (urban vs. remote rural) significantly conditioned the contribution of teachers’ job satisfaction to their probability of non-participation in PD activities. Paradoxically, the evidence yielded two cases with opposite patterns of results: in Norwegian remote rural schools in 2019, we detected a negative link between job satisfaction and the probabilities of non-participation in PD (and positive in urban schools); whereas, in Japan in 2015, the association was positive for this type of school (and negative for urban schools). The disparity between the results might be firstly understood in the context of the increased chances of non-participation in PD previously observed in remote rural schools in Norway in 2015. One tentative proposal might be that more satisfied teachers in this type of school responded favorably to the new decentralized policies on PD enacted at the end of that decade [56]. By contrast, the case of Japan suggests that teachers prefer urban schools to develop their careers [57], thus the rotation system (known as tenkin, in Japanese [58]) has to ensure that every few years many teachers are posted to rural areas [59]. Hence, it is possible that more satisfied teachers pursued more PD opportunities in urban areas to improve their work opportunities, whereas those working temporarily in rural schools preferred to pause participation during the time of that service. All in all, both types of interactions between job satisfaction and school location on the odds of non-participation in PD are likely to attest the effect of national teacher policies.
Finally, the case of Lebanon in 2019 concentrated multiple evidences of the direct contribution of the teachers’ sex, experience, and the schools’ SES to the odds of non-participation in PD. To be more precise, the results indicated that Lebanese female teachers (2.75 times), as well as more experienced teachers (1.05 times), and those working in schools located in deprived areas (2.34 times) were significantly more likely to report non-participation in PD than their colleagues. Furthermore, this case confirmed the expected interaction between the teachers’ job satisfaction and the two school level variables under examination (i.e., location and SES). On the one hand, the results showed that, for Lebanese teachers who worked in remote rural areas, the higher their job satisfaction the greater the probability of non-participation in PD (whereas this link followed the opposite pattern in urban schools). On the other hand, for teachers in low SES school areas, job satisfaction was also associated with greater probabilities of non-participation in PD (whereas their colleagues in more affluent schools showed practically zero risk, regardless their level of job satisfaction). These specific results provided support for the pessimistic scenario of the Lebanese PD system depicted in the local literature, which has underlined the cumulative negative effect of economic and political crises on teachers’ perception of the poor quality of the PD available in the country [60,61,62].
As with all studies based on international large-scale surveys in education, the cross-sectional nature of the data here analyzed strictly limits any causal interpretation of our estimates on the predictors of non-participation in PD. Further empirical investigations conducting either longitudinal or experimental designs remain necessary in this field to shed more light on the extent to which non-participation in PD is contingent to the attributes examined in our models. Further, it is worth remarking that the amount of error in the odds ratios reported for Botswana, Italy, and Morocco precluded a rejection of the null hypothesis in all the models’ predictors and across all the cycles with the available data. This may indicate that none of these variables were significantly associated with differences in teachers’ non-participation in PD in such countries. Since our model was hardly conceptualized to detect universal predictors of non-participation in PD, further research is necessary in these countries to examine the corresponding capacity of other attributes of teachers, schools, and any other level of their school systems. In this regard, it is worth highlighting that the analyses defined in our study were unable to include all the possible reasons for non-participation in PD, particularly for cultural explanations that may arise in cross-national comparisons of the data. Alternatively, our model is intended to increase the current evidence with significant and meaningful links between the specified predictors and the dependent variables as they could be detected in the data available in international studies in education.
To conclude, our study underlined the importance of undertaking regular and re-liable cross-national monitoring of teachers’ non-participation in PD by exploiting the dense availability of international large-scale surveys in education. By pointing the magnitude of this problem in national samples of mathematics teachers, this study also underlined its negative implications for the quality of education in countries with higher rates of non-participation. These include the increased obsolescence of teachers’ knowledge, outdated pedagogical practices, and neglect for the known benefits of PD on students’ achievement in mathematics. National teacher policies and innovative programs that take into account the drivers of non-participation in PD may contribute to tackle these effects. To this end, our conceptual model was able to detect throughout three cycles of the TIMSS (2011, 2015, and 2019) direct and significant associations between the hypothesized predictors (both at the teacher and school levels) and the odds of non-participation. Also, we provided evidence on the opposite pattern of results that the interaction between job satisfaction and school location can take across nations. In summary, this study illustrated the specific role that attributes of teachers and schools can play in predicting the odds of non-participation in PD in the great majority of countries with relevant proportions in this outcome.
Author Contributions
Conceptualization, F.B.-P.; methodology, F.B.-P. and Z.C.; formal analysis and investigation, F.B.-P. and Z.C.; data curation, F.B.-P. and Z.C.; writing—original draft preparation, F.B.-P., Z.C., Á.N.-E. and L.S.; writing—review and editing, F.B.-P.; supervision, F.B.-P.; funding acquisition, F.B.-P. All authors have read and agreed to the published version of the manuscript.
Funding
This research was funded by the National Agency of Research and Development of Chile, FONDECYT de Iniciación fund (code 11220840).
Institutional Review Board Statement
This study was conducted in accordance with the Declaration of Helsinki, and approved by the Ethics Committee of Universidad de los Andes (Chile; protocol code: CEC2022021; date of approval: 10 May 2022).
Informed Consent Statement
This article reports a secondary analysis of TIMSS data, so informed consent is not applicable.
Data Availability Statement
The information from the datasets can be downloaded at: https://timssandpirls.bc.edu/timss-landing.html (accessed on 16 January 2025).
Conflicts of Interest
The authors declare no conflicts of interest.
References
- Mullis, I.V.S.; Martin, M.O.; Foy, P.; Arora, A. Teacher preparation. In TIMSS 2011 International Results in Mathematics; TIMSS & PIRLS International Study Center, Boston College: Chestnut Hill, MA, USA, 2012. [Google Scholar]
- OECD. Creating Effective Teaching and Learning Environments: First Result from TALIS; OECD Publishing: Paris, France, 2009. [Google Scholar]
- OECD. TALIS 2013 Results: An International Perspective on Teaching and Learning; OECD Publishing: Paris, France, 2014. [Google Scholar]
- OECD. TALIS 2018 Results (Volume I). Teachers and School Leaders as Lifelong Learners; OECD Publishing: Paris, France, 2019. [Google Scholar]
- von Davier, M.; Kennedy, A.M.; Reynolds, K.A.; Fishbein, B.; Khorramdel, L.; Aldrich, C.E.A.; Bookbinder, A.; Ummugal, B.; Yin, L. TIMSS 2023 International Results in Mathematics and Science; TIMSS & PIRLS International Study Center, Boston College: Chestnut Hill, MA, USA, 2024. [Google Scholar]
- European Commission; EACEA; Eurydice. Key Data on Teachers and School Leaders in Europe, 2013 Edition; Eurydice Report; Publications Office of the European Union: Luxembourg, 2013. [Google Scholar]
- OECD. Indicator D5 Who Are the Teachers? OECD Publishing: Paris, France, 2012. [Google Scholar]
- Little, J.W. Teachers’ Professional Development in a Climate of Educational Reform. Educ. Eval. Policy Anal. 1993, 15, 129–151. [Google Scholar]
- OECD. Reimagining Education, Realising Potential, International Summit on the Teaching Profession; OECD Publishing: Paris, France, 2024. [Google Scholar]
- UNESCO. Methodological Guide for the Analysis of Teacher Issues. Teacher Training Initiative for Sub-Saharan Africa (TTISSA) Teacher Policy Development Guide; UNESCO’s Section for Teacher Education (ED/HED/TED): Paris, France; UNESCO’s Regional Bureau for Education in Africa (BREDA)—Pôle de Dakar: Dakar, Senegal, 2010. [Google Scholar]
- Sims, S.; Fletcher-Wood, H. Identifying the characteristics of effective teacher professional development: A critical review. Sch. Eff. Sch. Improv. 2021, 32, 47–63. [Google Scholar] [CrossRef]
- Desimone, L.M. Improving Impact Studies of Teachers’ Professional Development: Toward Better Conceptualizations and Measures. Educ. Res. 2009, 38, 181–199. [Google Scholar] [CrossRef]
- Opfer, V.D.; Pedder, D. Conceptualizing Teacher Professional Learning. Rev. Educ. Res. 2011, 81, 376–407. [Google Scholar] [CrossRef]
- Sancar, R.; Atal, D.; Deryakulu, D. A new framework for teachers’ professional development. Teach. Teach. Educ. 2021, 101, 103305. [Google Scholar] [CrossRef]
- Avalos, B. Teacher professional development in Teaching and Teacher Education over ten years. Teach. Teach. Educ. 2011, 27, 10–20. [Google Scholar] [CrossRef]
- UNESCO; International Task Force on Teachers for Education 2030. Global Report on Teachers: Addressing Teacher Shortages and Transforming the Profession; UNESCO: Paris, France, 2024. [Google Scholar]
- Global Alliance to Monitor Learning. SDG 4.c.7 Recent Professional Development. WG/GAML/12; Global Alliance to Monitor Learning: Paris, France, 2020. [Google Scholar]
- Richter, D. Professional Development Across the Teaching Career. In Cognitive Activation in the Mathematics Classroom and Professional Competence of Teachers: Results from the COACTIV Project; Kunter, M., Baumert, J., Blum, W., Klusmann, U., Krauss, S., Neubrand, M., Eds.; Springer: Boston, MA, USA, 2013; pp. 333–342. [Google Scholar]
- Cookson, P.S. A Framework for Theory and Research on Adult Education Participation. Adult Educ. Q. 1986, 36, 130–141. [Google Scholar] [CrossRef]
- Yoon, I.; Kim, M. Determinants of teachers’ positive perception on their professional development experience: An application of LASSO-based machine learning approach. Prof. Dev. Educ. 2023, 1–15. [Google Scholar] [CrossRef]
- Yoon, I.; Kim, M. Dynamic patterns of teachers’ professional development participation and their relations with socio-demographic characteristics, teacher self-efficacy, and job satisfaction. Teach. Teach. Educ. 2022, 109, 103565. [Google Scholar] [CrossRef]
- Zhou, X.; Padrón, Y.; Waxman, H.C.; Baek, E.; Acosta, S. How Do School Climate and Professional Development in Multicultural Education Impact Job Satisfaction and Teaching Efficacy for STEM Teachers of English Learners? A Path-Analysis. Int. J. Sci. Math. Educ. 2024, 22, 447–468. [Google Scholar] [CrossRef]
- Toropova, A.; Myrberg, E.; Johansson, S. Teacher job satisfaction: The importance of school working conditions and teacher characteristics. Educ. Rev. 2021, 73, 71–97. [Google Scholar] [CrossRef]
- Wartenberg, G.; Aldrup, K.; Grund, S.; Klusmann, U. Satisfied and high performing? A meta-analysis and systematic review of the correlates of teachers’ job satisfaction. Educ. Psychol. Rev. 2023, 35, 114. [Google Scholar] [CrossRef]
- Neto, R.D.C.A.; Rodrigues, V.P.; Panzer, S. Exploring the relationship between entrepreneurial behavior and teachers’ job satisfaction. Teach. Teach. Educ. 2017, 63, 254–262. [Google Scholar] [CrossRef]
- Richardson, V. The Role of Attitudes and Beliefs in Learning to Teach. In Handbook of Research on Teacher Education; Sikula, J., Ed.; Macmillan: New York, NY, USA, 1996; pp. 102–119. [Google Scholar]
- de Vries, S.; Van De Grift, W.J.; Jansen, E.P. Teachers’ Beliefs and Continuing Professional Development. J. Educ. Adm. 2013, 51, 213. [Google Scholar] [CrossRef]
- Richter, D.; Kunter, M.; Klusmann, U.; Lüdtke, O.; Baumert, J. Professional Development Across the Teaching Career: Teachers’ Uptake of Formal and Informal Learning Opportunities; Sense Publishers: Rotterdam, The Netherlands, 2014; pp. 97–121. [Google Scholar]
- Bayar, A. Factors Affecting Teachers’ Participation in Professional Development Activities in Turkey. Ph.D. Thesis, University of Missouri, Columbia, MO, USA, 2013. [Google Scholar]
- Reeves, T.D.; Hamilton, V. Relationships between teacher education mechanisms and teacher practices, self-efficacy, and job satisfaction in the U.S.: An analysis of TALIS 2018. Stud. Educ. Eval. 2022, 75, 101216. [Google Scholar] [CrossRef]
- Badri, M.; Alnuaimi, A.; Yang, G.; Al Rashidi, A.; Al Sumaiti, R. A Structural Equation Model of Determinants of the Perceived Impact of Teachers’ Professional Development—The Abu Dhabi Application. SAGE Open 2017, 7, 2158244017702198. [Google Scholar] [CrossRef]
- Barrera-Pedemonte, F. High-Quality Teacher Professional Development and Classroom Teaching Practices: Evidence from TALIS 2013; OECD Education Working Papers 141; OECD Publishing: Paris, France, 2016. [Google Scholar]
- Zhang, X.; Admiraal, W.; Saab, N. Teachers’ motivation to participate in continuous professional development: Relationship with factors at the personal and school level. J. Educ. Teach. 2021, 47, 714–731. [Google Scholar] [CrossRef]
- De la Vega Rodríguez, L.F. Investigación sobre enseñanza y desarrollo profesional docente en escuelas rurales: Una revisión. Rev. Estud. Exp. Educ. 2021, 20, 307–325. [Google Scholar] [CrossRef]
- Wolfenden, F.; Castillo-Canales, D.; Roque-Gutierrez, E.; Conde-Gafaro, B.; Fletcher, J.; Moncada, R.M.; Namazov, B.; Smith, W.; Khamidova, D.; Solis, M.A.; et al. A Framework for Strengthening Teacher Professional Development Systems with ICT; Edward Elgar Publishing: Cheltenham, UK, 2024. [Google Scholar]
- Duk, C.; Blanco, R.; Zecchetto, F.; Capell, C.; López, M. Desarrollo profesional docente para la inclusión: Investigación acción colaborativa a través de estudios de clase en escuelas chilenas. Rev. Latinoam. Educ. Inclusiva 2021, 15, 67–95. [Google Scholar] [CrossRef]
- Mok, Y.F.; Kwon, T.M. Discriminating participants and non-participants in continuing professional education: The case of teachers. Int. J. Lifelong Educ. 1999, 18, 505–519. [Google Scholar] [CrossRef]
- Kensington-Miller, B. Professional development of mathematics teachers in low socioeconomic secondary schools in New Zealand. in Mathematics education for the third millennium: Towards 2010. In Proceedings of the 27th Annual Conference of the Mathematics Education Research Group of Australasia, Sydney, Australasia, 27–30 June 2004. [Google Scholar]
- Darling-Hammond, L.; Hyler, M.E.; Gardner, M. Effective Teacher Professional Development; Bloomsbury Academic: London, UK, 2017. [Google Scholar]
- Rouwenhorst, T. The (In)Direct Effect of Student Population’s Socio-Economic Status on the Amount of Collaborative Professional Development Among Teachers in Dutch Primary Schools. Master’s Thesis, University of Twente, Enschede, The Netherlands, 2023. [Google Scholar]
- Mullis, I.V.S.; Martin, M.O.; Foy, P.; Arora, A. Population Coverage and Sample Participation Rates. In TIMSS 2011 International Results in Mathematics; TIMSS & PIRLS International Study Center, Boston College: Chestnut Hill, MA, USA, 2012. [Google Scholar]
- Mullis, I.V.S.; Martin, M.O.; Foy, P.; Hooper, M. TIMSS 2015 International Results in Mathematics; TIMSS & PIRLS International Study Center, Boston College: Chestnut Hill, MA, USA, 2016. [Google Scholar]
- Mullis, I.V.S.; Martin, M.O.; Foy, P.; Kelly, D.L.; Fishbein, B. TIMSS 2019 International Results in Mathematics and Science; TIMSS & PIRLS International Study Center, Boston College: Chestnut Hill, MA, USA, 2020. [Google Scholar]
- Rust, K. Sampling, Weighting, and Variance Estimation in International Large-Scale Assessments. In Handbook of International Large-Scale Assessment: Background, Technical Issues, and Methods of Data Analysis; Rutkowski, L., Von Davier, M., Rutkowski, D., Eds.; Chapman & Hall/CRC: London, UK, 2013; p. 117. [Google Scholar]
- TIMSS & PIRLS International Study Center, Boston College. TIMSS 2011 Teacher Questionnaire Mathematics—Grade 8; International Association for the Evaluation of Educational Achievement: Chestnut Hill, MA, USA, 2011. [Google Scholar]
- TIMSS & PIRLS International Study Center, Boston College. TIMSS 2015 Teacher Questionnaire Mathematics—Grade 8; International Association for the Evaluation of Educational Achievement: Chestnut Hill, MA, USA, 2014. [Google Scholar]
- TIMSS & PIRLS International Study Center, Boston College. TIMSS 2019 Teacher Questionnaire Mathematics—Grade 8; International Association for the Evaluation of Educational Achievement: Chestnut Hill, MA, USA, 2018. [Google Scholar]
- International Association for the Evaluation of Educational Achievement (IEA). The TIMSS 2011 Teacher Career Satisfaction Scale, Eighth Grade; International Association for the Evaluation of Educational Achievement: Chestnut Hill, MA, USA, 2013. [Google Scholar]
- Martin, M.O.; Mullis, I.V.S.; Hooper, M.; Yin, L.; Foy, P.; Palazzo, L. Creating and interpreting the TIMSS 2015 context questionnaire scales (Chapter 15). In Methods and Procedures in TIMSS 2015; Martin, M.O., Mullis, I.V.S., Hooper, M., Eds.; TIMSS & PIRLS International Study Center, Boston College: Chestnut Hill, MA, USA, 2016. [Google Scholar]
- Martin, M.O.; von Davier, M.; Mullis, I.V.S. Appendix 16B: TIMSS 2019 Context Questionnaire Scales—Grade 8. In Methods and Procedures in TIMSS 2019 Technical Report; Martin, M.O., von Davier, M., Mullis, I.V.S., Eds.; TIMSS & PIRLS International Study Center, Boston College: Chestnut Hill, MA, USA, 2020. [Google Scholar]
- Mullis, I.V.S.; Martin, M.O.; Foy, P.; Arora, A. Creating and Interpreting the TIMSS and PIRLS 2011 Context Questionnaire Scales; TIMSS & PIRLS International Study Center, Boston College: Chestnut Hill, MA, USA, 2013. [Google Scholar]
- Hooper, M. Developing the TIMSS 2015 context questionnaires. In Methods and Procedures in TIMSS 2015; Martin, M.O., Mullis, I.V.S., Hooper, M., Eds.; TIMSS & PIRLS International Study Center, Boston College: Chestnut Hill, MA, USA, 2016; pp. 2.1–2.8. [Google Scholar]
- Mullis, I.V.S.; Fishbein, B. Updating the TIMSS 2019 Instruments for Describing the Contexts for Student Learning (Chapter 2). In Methods and Procedures in TIMSS 2019 Technical Report; Martin, M.O., von Davier, M., Mullis, I.V.S., Eds.; TIMSS & PIRLS International Study Center, Boston College: Chestnut Hill, MA, USA, 2020. [Google Scholar]
- Agresti, A. Categorical Data Analysis; John Wiley & Sons, Inc.: Hoboken, NJ, USA, 2002. [Google Scholar]
- Long, J.S.; Freese, J. Regression Models for Categorical Dependent Variables Using Stata; Stata Corporation: College Station, TX, USA, 2006. [Google Scholar]
- OECD. Improving School Quality in Norway: The New Competence Development Model; OECD Publishing: Paris, France, 2019. [Google Scholar]
- NIERE. Education in Remote and Isolated Areas in Japan; National Institute for Educational Policy Research: Tokyo, Japan, 2013. [Google Scholar]
- Crehan, L. Recruitment Lessons: How Japan and Australia Attract Teachers into Rural Schools. The Guardian, 22 May 2016. Available online: https://www.theguardian.com/teacher-network/2016/may/22/recruitment-lessons-japan-australia-teachers-rural-schools (accessed on 30 January 2025).
- Yamasaki, H. Teachers and teacher education in Japan. Bull. Grad. Sch. Educ. Hiroshima Univ. 2016, 65, 19–28. [Google Scholar]
- Al-Jammal, K.; Ghamrawi, N. Teacher professional development in Lebanese schools. Basic Res. J. Educ. Res. Rev. 2013, 2, 104–128. [Google Scholar]
- Nabhani, M.; Bahous, R. Lebanese teachers’ views on ‘continuing professional development’. Teach. Dev. 2010, 14, 207–224. [Google Scholar] [CrossRef]
- Husni, N. Barriers in Implementing a Professional Development Program: A Lebanese Example. In Igniting Excellence in Faculty Development at International Schools: Beyond Borders; Pelonis, P., Zaharopoulos, T., Eds.; Springer Nature: Cham, Switzerland, 2024; pp. 137–146. [Google Scholar]
Disclaimer/Publisher’s Note: The statements, opinions and data contained in all publications are solely those of the individual author(s) and contributor(s) and not of MDPI and/or the editor(s). MDPI and/or the editor(s) disclaim responsibility for any injury to people or property resulting from any ideas, methods, instructions or products referred to in the content. |
© 2025 by the authors. Licensee MDPI, Basel, Switzerland. This article is an open access article distributed under the terms and conditions of the Creative Commons Attribution (CC BY) license (https://creativecommons.org/licenses/by/4.0/).