1. Introduction
The construction sector accounts for more than 40% of global energy consumption and 36% of energy-related CO
2 emissions [
1]. The European Union’s Green Deal seeks to achieve net-zero greenhouse gas emissions by 2050 to address this challenge [
2]. Realizing this objective requires substantial modifications in architectural design practices, emphasizing the decrease in initial operational energy and the reduction in embedded carbon [
3]. Recent advancements in artificial intelligence and digital technology have created substantial prospects to revolutionize traditional design processes [
4].
Conventional architectural design adheres to a sequential methodology, commencing with form delineation, succeeded by structural analysis and energy performance assessment [
5]. This method leads to fragmented optimization, since architects prioritize aesthetics and functionality while obtaining limited quantitative performance input during the conceptual design phase [
6]. Structural engineers then assess designs and often identify inefficiencies that require more materials [
7]. Energy consultants undertake thermal simulations, frequently revealing performance inadequacies that necessitate improvements to the building exterior or the augmentation of systems [
8]. Decisions centered on a singular criterion may undermine other aspects, resulting in suboptimal outcomes and extended design timelines [
9]. Despite extensive research on generative design and digital twin technologies, existing studies primarily focus on isolated performance metrics [
10]. Research on generative design has mostly focused on energy efficiency and daylighting, neglecting structural integration [
11]. Operational management is the primary focus of digital twin applications, as opposed to design optimization [
12]. Most research on multi-objective optimization focuses on problems with two objectives. In contrast, situations with three or more conflicting criteria have been studied less frequently [
13].
The application of AI-driven generative design within digital twin frameworks to enhance architectural design is largely unexplored [
14]. In practice, the use of advanced optimization methods is often limited by computational costs and their ability to be used in different situations [
15].
Architectural and engineering practices still face obstacles that hinder their widespread use in industry. These include issues with software compatibility and difficulties in integrating workflows [
16].
Despite these advances, three critical gaps remain unaddressed in the literature: (1) no existing framework simultaneously integrates generative design, digital twin simulation, and multi-objective optimization at the architectural design stage; (2) existing multi-objective studies are predominantly validated through simulation without monitored post-renovation data; and (3) the cross-climate applicability of AI-driven optimization frameworks across European building stocks remains insufficiently demonstrated.
This research details the creation and evaluation of an artificial intelligence-based digital twin framework tailored for generative design applications. The primary objective is to enhance the energy efficiency, structural soundness, and architectural merit of net-zero buildings, specifically within diverse European climatic conditions [
17]. The framework employs NSGA-III and Particle Swarm Optimization algorithms to navigate intricate design landscapes, considering architectural quality, the efficient use of structural materials, and overall energy performance [
18].
A digital twin module, which includes real-time structural analysis and energy modeling, provides continuous data during the optimization process, helping to guide solutions toward the Pareto frontier [
19].
Furthermore, using neural network-based surrogate models helps improve computational efficiency and simplifies the process. This reduces optimization times from days to hours, while still maintaining an accuracy of over 95% [
20]. The methodology is corroborated by case studies in Mediterranean and continental European climate zones, illustrating climate-responsive optimization methodologies. The main contributions of this research are:
Development of an integrated AI-enabled generative design framework simultaneously optimizing architectural form, structural efficiency, and energy performance for Net-Zero buildings, addressing limitations in sequential optimization approaches.
Machine learning surrogate model acceleration achieving 500–850× computational speed-up while maintaining prediction accuracy of R2 > 0.95, reducing optimization cycles from 38 h to 4.2 h and enabling practical design space exploration.
Validation through twelve European building renovation case studies achieving average energy reductions of 84.7% (range 72.3–93.0%), structural material efficiency improvements of 20.1%, and net-zero energy balance feasibility across continental and Mediterranean climate zones.
Demonstration of climate-responsive optimization strategies emerging from physics-based evaluation, with 37% variation in optimal insulation thickness and distinct passive design priorities between climate zones.
This study addresses these gaps through three research questions: (RQ1) Can a generative design digital twin framework simultaneously optimize architectural form, structural efficiency, and energy performance with higher Pareto front quality than sequential methods? (RQ2) What computational acceleration is achievable through ML surrogate integration while maintaining physics-based accuracy? (RQ3) Do climate zone differences produce quantifiably distinct optimal design strategies when processed through a common optimization framework?
2. Literature Review
The intersection of generative artificial intelligence and digital twin technologies in architectural design is a growing area of study. However, strong frameworks that successfully combine architectural aesthetics, structural integrity, and energy efficiency are still limited [
21].
Recent advancements include AI-augmented building information modeling systems, which have shown energy savings exceeding 10% and prediction accuracy above 90% [
22], knowledge-driven optimization frameworks that have decreased computational time by 73% [
23], and multi-task learning approaches that have reduced energy consumption by up to 31%.
While these studies are valuable, they often focus on individual parts. This highlights the limitations of methods that consider multiple performance goals at the same time.
Table 1 summarizes key studies examining AI-enabled generative design, digital twins, and multi-objective optimization for sustainable building design, highlighting recent advances and critical limitations.
2.1. AI-Enabled Generative Design for Building Optimization
Deep reinforcement learning and evolutionary algorithms enhance energy efficiency, reduce emissions, and improve comfort by 13–20% [
30]. Surrogate models minimize optimization time while maintaining high accuracy (R
2 > 0.94) [
31]. Nevertheless, scalability across diverse building typologies remains constrained and necessitates retraining [
32]. While these advances are notable, existing studies predominantly address isolated performance objectives, with structural integration and concurrent multi-domain optimization remaining largely absent from the literature.
2.2. Digital Twin Applications in Building Design and Operation
Digital twin technologies primarily improve operational efficiency, resulting in HVAC energy reductions of 10–35%. The application of large language models has recently enhanced environmental quality control; however, energy-comfort trade-offs remain [
33]. These applications are predominantly focused on post-occupancy operational management rather than design-stage optimization, representing a critical gap that the present study seeks to address.
2.3. Multi-Objective Optimization for Building Performance
Structural optimization results in material savings of 18–27%; however, integrated optimization comprising structure, architecture, and energy efficiency remains limited [
34,
35]. Multi-objective techniques concurrently address energy, cost, carbon, and comfort [
36]. NSGA-III has exhibited strong performance in high-dimensional objective problems [
37], while genetic algorithms decrease energy and carbon emissions by up to 28% and 22% [
38]. Reinforcement learning improves adaptability by 13–20% [
31]. Despite these advances, most studies address two or three objectives, with four-objective problems incorporating architectural quality across diverse European climate zones remaining underrepresented [
39,
40,
41].
2.4. Research Gap and Positioning of the Present Study
Despite these advancements, a comprehensive framework that simultaneously integrates generative AI, digital twin simulation, and multi-objective optimization for Net-Zero buildings across diverse climates remains lacking. Existing studies address isolated disciplinary boundaries: AI-enabled generative design focuses predominantly on energy metrics; digital twin applications target operational rather than design-stage decisions; and multi-objective studies rarely exceed three objectives without architectural quality integration. This framework addresses this tripartite gap within a single calibrated design-stage optimization loop, validated through twelve monitored European renovation case studies spanning two climate zones.
3. Methodological Framework
This section presents the comprehensive methodological framework developed to design, implement, and validate an artificial intelligence-driven digital twin for net-zero building optimization. The framework integrates generative design, physics-based simulation, multi-objective optimization, and machine learning acceleration within a unified computational environment.
A systematic five-stage workflow is adopted:
- (1)
Selection and characterization of representative European building renovation case studies.
- (2)
Development of an integrated generative design and digital twin simulation environment.
- (3)
Formulation of design variables, objective functions, and performance constraints.
- (4)
Deployment of machine learning surrogate models for computational acceleration.
- (5)
Establishment of multi-level validation protocols to ensure reliability and reproducibility.
The following subsections describe each methodological component in detail, including data sources, computational tools, mathematical formulations, and validation strategies.
3.1. Case Study Selection and Description
To assess the efficacy of the suggested integrated framework, twelve exemplary European building renovation projects were chosen as case studies. The selection criteria emphasized buildings with substantiated post-renovation performance, specifically those supported by monitored energy consumption data, rather than relying solely on simulated projections. The dataset encompasses comprehensive technical documentation, including envelope specifications, HVAC system designs, and validated pre- and post-retrofit performance metrics, all sourced from peer-reviewed publications and official project reports [
42,
43].
3.1.1. Building Selection Criteria
The case study portfolio comprises eleven residential buildings (91.7%) and one office building (8.3%). This distribution reflects the predominance of deep-energy residential retrofit initiatives across Europe [
44], while also highlighting the limited availability of monitored commercial retrofit datasets with detailed technical documentation [
45].
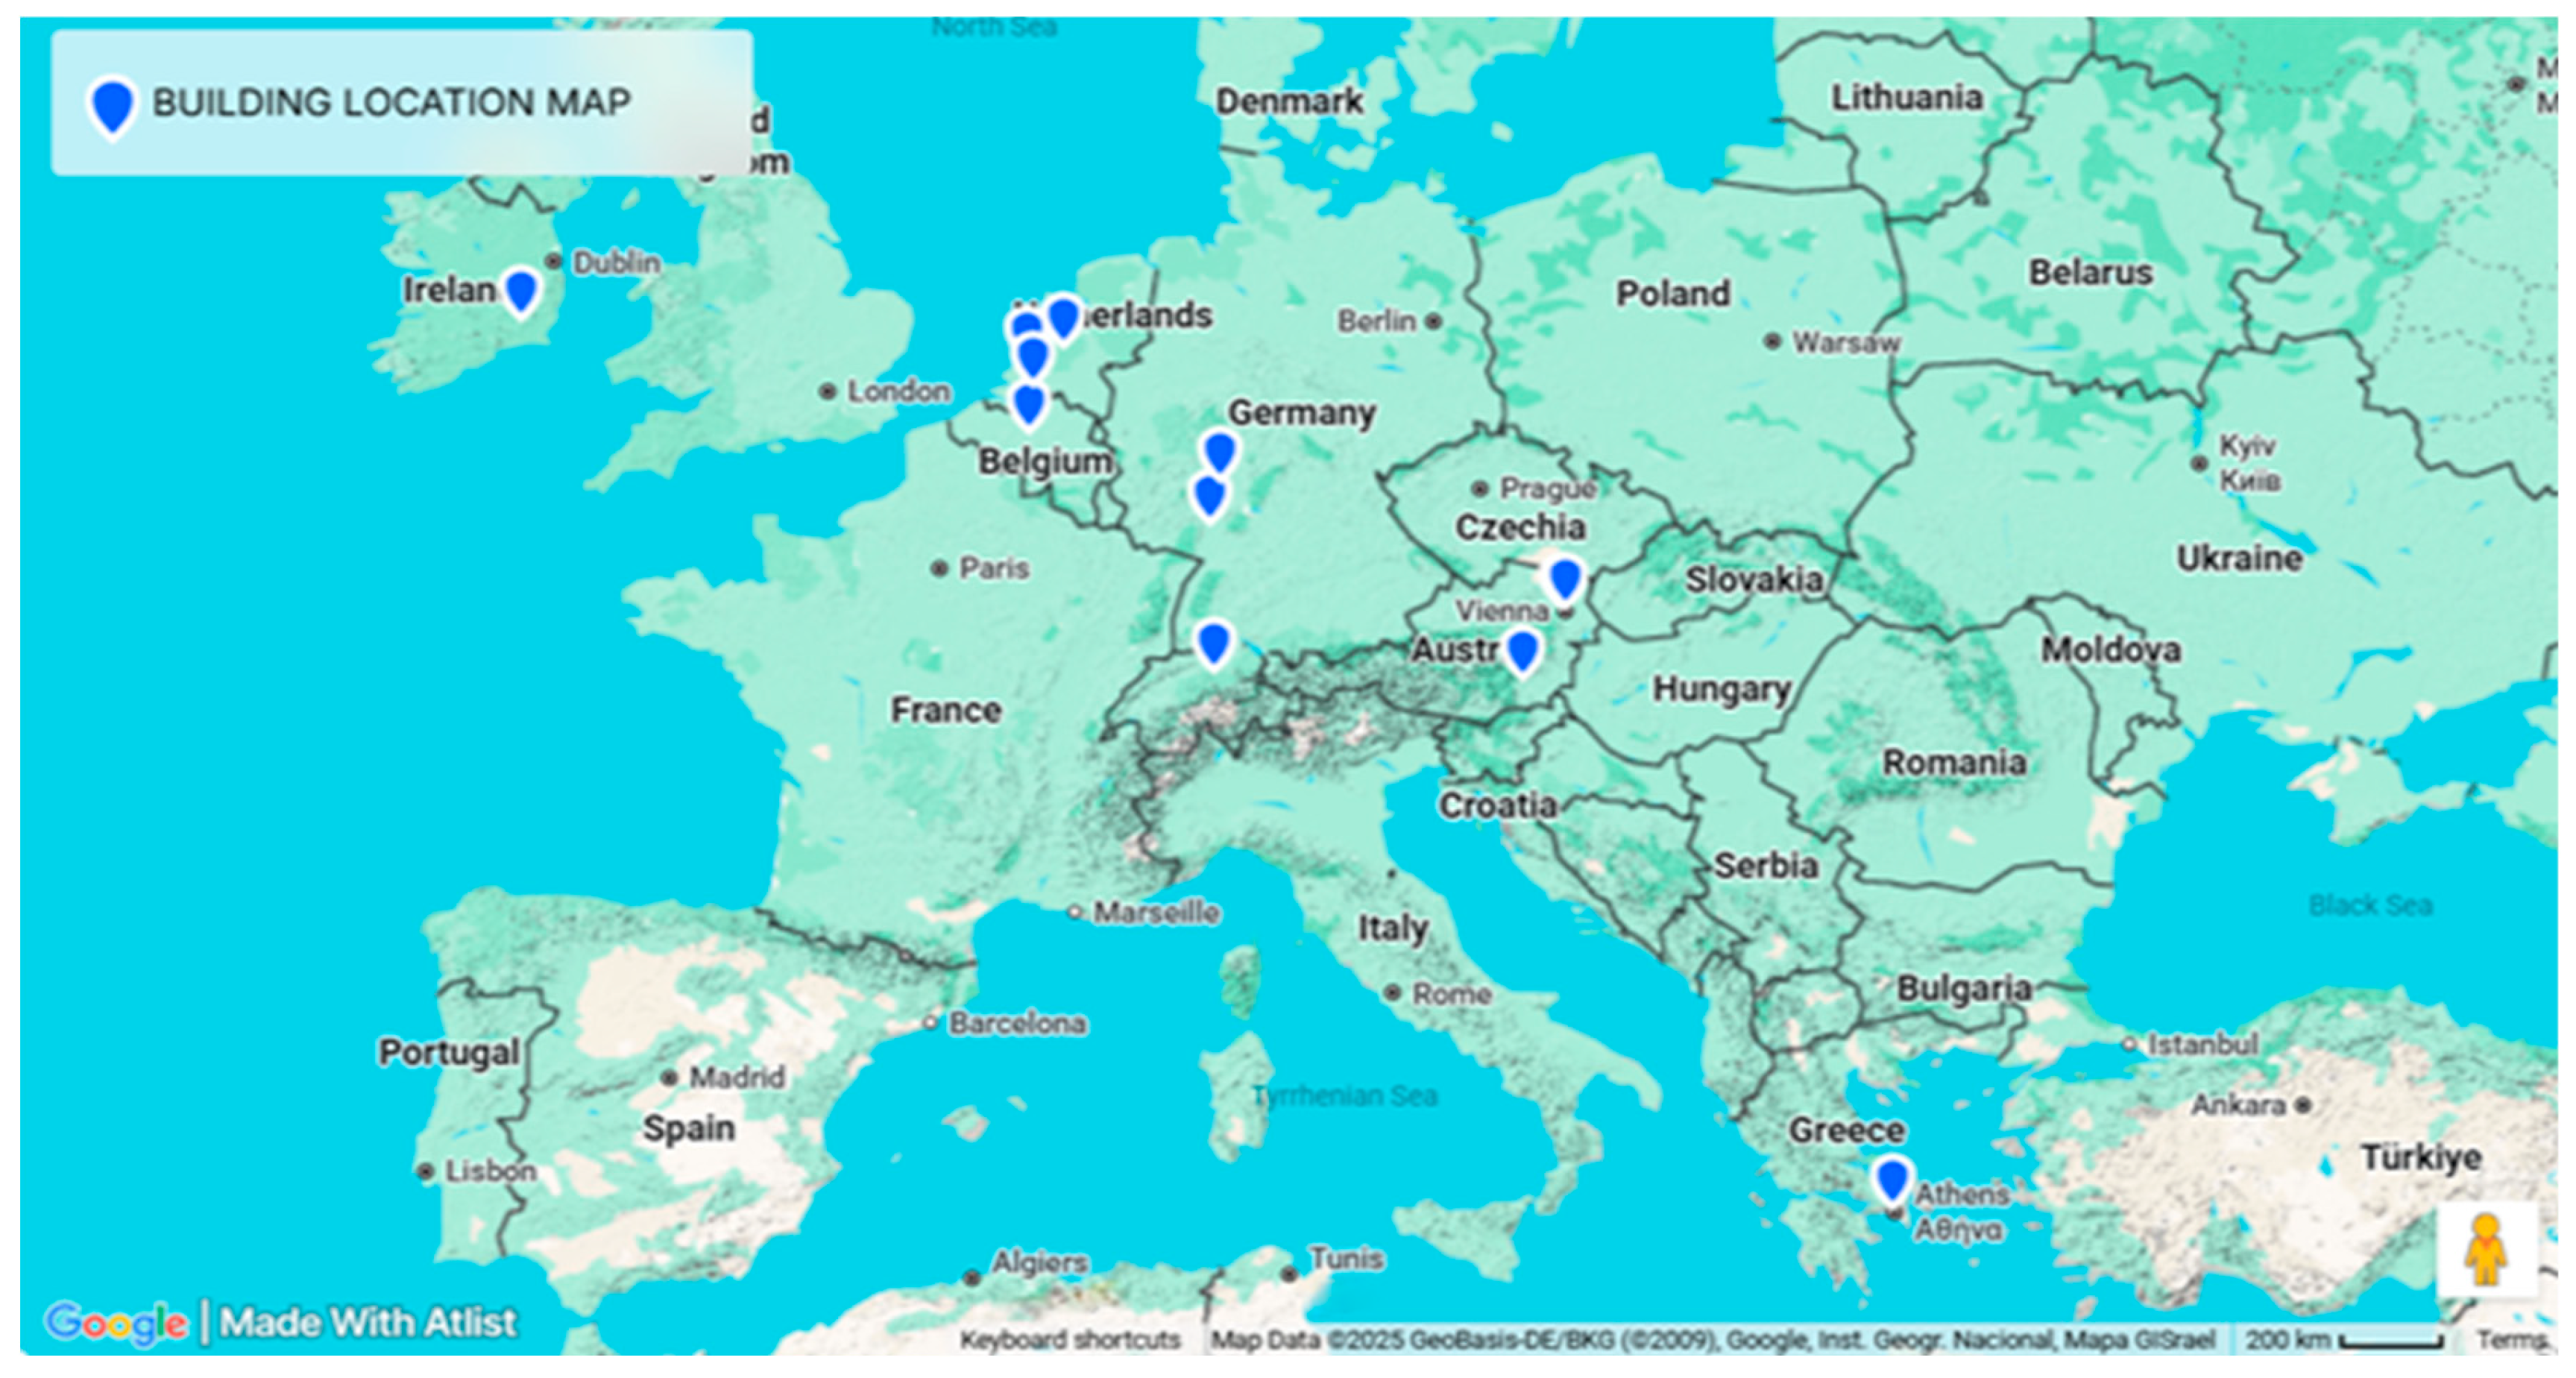
Geographically, the case studies span seven European countries—Germany (3), the Netherlands (3), Austria (3), Greece (1), Switzerland (1), Belgium (1), and Ireland (1)—representing both heating-dominated continental climates and mixed heating–cooling Mediterranean climatic conditions [
46].
Construction periods range from 1907 to 1980, with approximately 75% of buildings dating to post-war development between the 1950s and 1970s [
47]. The selection criteria also required the availability of documented technical specifications and post-renovation performance datasets derived from publicly available research and project reports [
48].
3.1.2. Selected Buildings Overview
The detailed building specifications and performance statistics in
Table 2 were sourced from several peer-reviewed publications and official project documents. The TU Wien Plus-Energy Office building (B1) was recorded as part of the EU Horizon 2020 EXCESS Project [
41]. The multi-family residential building (B2) in Athens was evaluated using dynamic modeling methods [
42]. The Vienna Heritage Student Housing (B3) exemplifies heritage-compatible passive housing renovations [
43]. The German case studies include the Tevesstrasse residential complex (B4) [
44], Grempstrasse building (B5) [
45], and Hoheloogstrasse complex (B6) [
46], as documented by the Passive House Institute.
The De Kroeven social housing [
47], Zug apartment building with MINERGIE-P certification [
48], Camera Obscuradreef complex with net-zero energy approach [
49], Brussels terraced housing benchmark [
50], Irish nZEB social housing with post-occupancy evaluation [
51], Austrian Dieselweg complex with solar facade integration [
52], and the 2ndSKIN pilot project in Vlaardingen [
53] represent monitored European deep-renovation initiatives across multiple national retrofit programs.
Table 2 presents the complete specifications of all twelve case study buildings, including the geographic coordinates, building characteristics, energy performance metrics before and after renovation, and primary data sources with corresponding reference numbers [
41,
42,
43,
44,
45,
46,
47,
48,
49,
50,
51,
52,
53].
Certain data fields, including the exact coordinates and gross floor area for B10, were not publicly disclosed in source publications to protect occupant privacy. The twelve case studies collectively represent a total gross floor area of approximately 75,200 m
2, with individual building sizes ranging from 600 m
2 to 16,080 m
2 [
41,
42,
43,
44,
45,
46,
47,
48,
49,
50,
51,
52,
53]. Post-renovation technical retrofit specifications were compiled for all twelve investigated case study buildings to ensure methodological transparency and reproducibility. The key envelope performance indicators, HVAC system configurations, renewable energy installations, and post-retrofit monitoring durations are summarized in
Table 3.
All the buildings achieved post-renovation airtightness levels within n50 ≤ 0.6–1.0 h
−1, consistent with Passive House or nZEB performance benchmarks. Monitoring periods correspond to measured post-retrofit operational energy datasets used for digital twin calibration and validation. The geographic distribution of the investigated case study buildings across European regions is illustrated in
Figure 1, highlighting the cross-national representation and climatic diversity incorporated within the methodological framework.
3.1.3. Climate Characterization
Climate data for all case study locations were obtained from official national meteorological services and subsequently validated against international databases, including ASHRAE International Weather for Energy Calculations (American Society of Heating, Refrigerating and Air-Conditioning Engineers, Atlanta, GA, USA) and the European Commission Photovoltaic Geographical Information System (PVGIS, European Commission, Brussels, Belgium) [
54,
55,
56,
57,
58].
The comprehensive climate characteristics for all investigated locations are presented in
Table 4, including annual average temperatures, heating and cooling degree days, and solar irradiation values essential for building energy simulation and renewable energy system sizing [
57,
58].
The climate dataset indicates that eleven of the twelve investigated buildings are located within Köppen CFB (temperate oceanic) climate zones, while one case study (Athens, Greece) represents the Köppen CSA (hot-summer Mediterranean) classification. This climatic diversity ensures representation of both heating-dominated and mixed heating–cooling operational conditions within the simulation framework [
55,
57].
3.2. Research Framework Overview
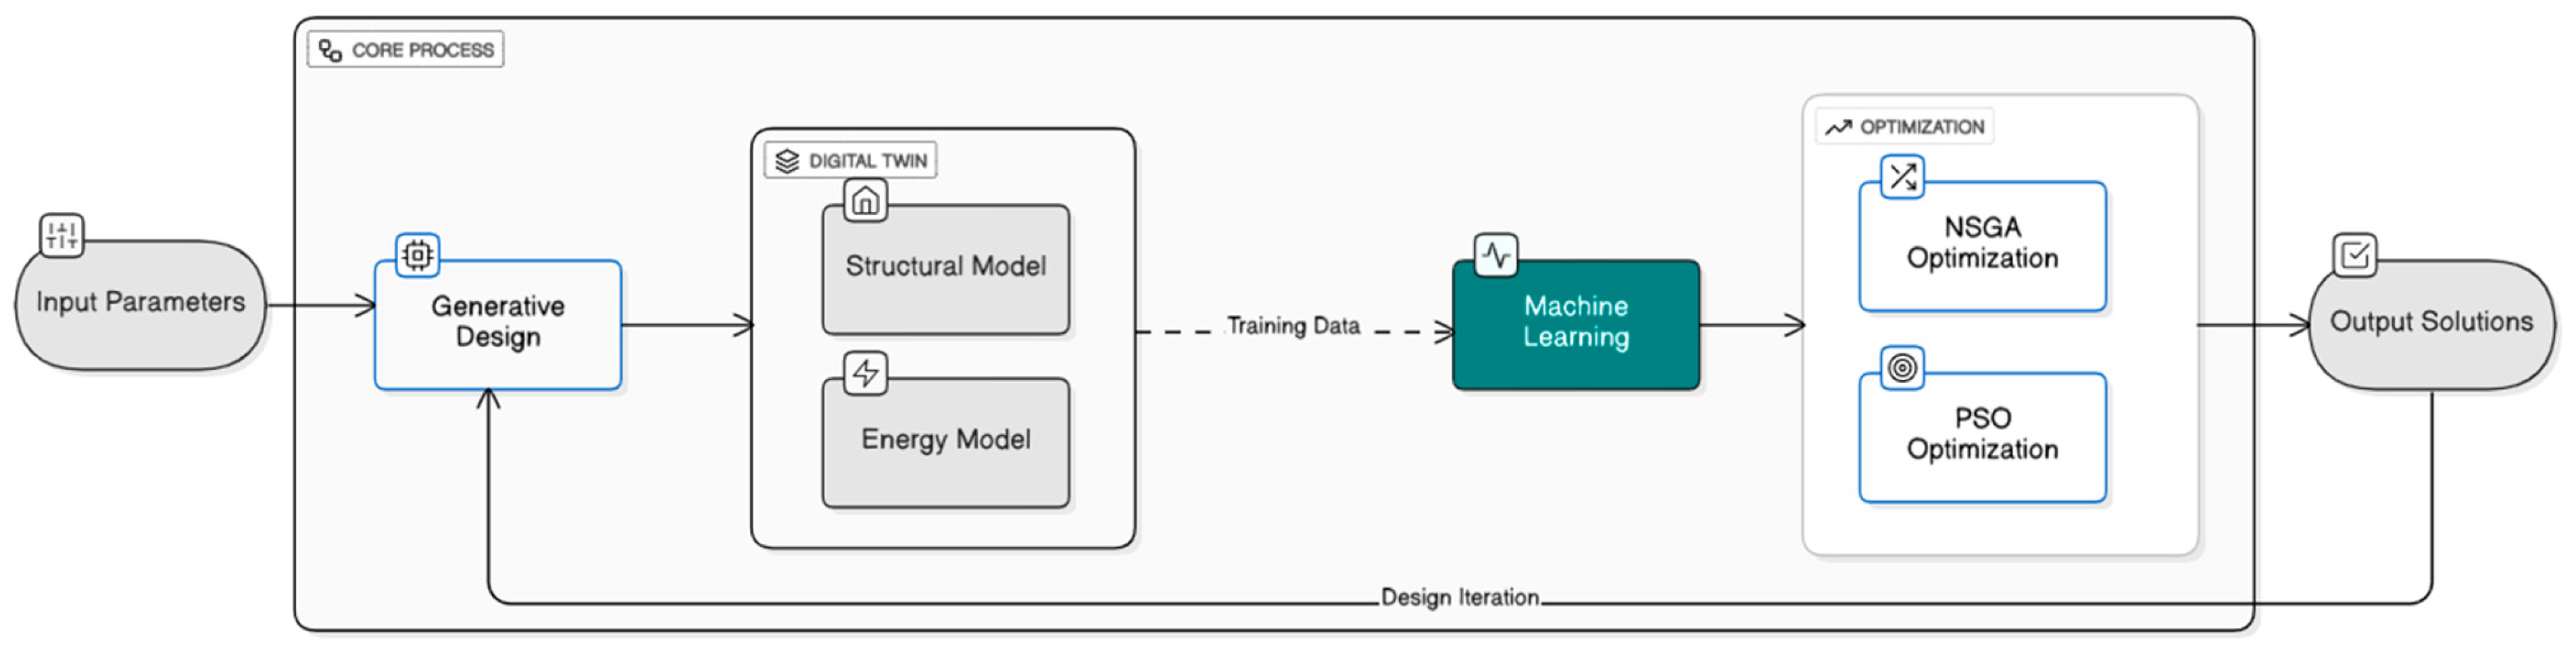
The proposed framework integrates AI-driven generative design algorithms, physics-based Digital Twin simulations, multi-objective optimization, and machine learning methods to improve architectural form, structural efficiency, and building energy performance [
59]. This framework works through the interaction of four main modules: generative design, digital twin simulation, optimization, and surrogate-based performance prediction.
The generative design module uses a parametric approach to change design variables related to architecture, structure, and energy.
These designs are then evaluated within the Digital Twin environment, using physics-based simulations for both structure and energy.
Multi-objective optimization algorithms then find Pareto-optimal solutions, while machine learning surrogate models speed up performance evaluation during iterative design exploration.
The overall architecture of the proposed framework is illustrated in
Figure 2, demonstrating the workflow integration between generative design, digital twin simulations, machine learning acceleration, and optimization processes.
As shown in
Figure 2, design inputs are processed through generative design, evaluated via digital twin simulations, and iteratively optimized using NSGA-III and PSO algorithms, with surrogate models supporting computational acceleration.
3.3. Design Variables and Parameters
The generative design module systematically explores the multi-dimensional design space by parametrically varying architectural, structural, and energy-related variables within feasible ranges informed by building codes, engineering practice, and practical constructability constraints.
Table 5 defines all design variables, including their ranges, units, and relationships to building performance.
3.4. Objective Functions
The multi-objective optimization process seeks to identify Pareto-optimal design solutions that represent optimal trade-offs between competing objectives. The optimization formulation includes four primary objectives: minimizing structural material cost, minimizing embodied carbon, minimizing operational energy consumption, and maximizing architectural quality [
60,
61].
The general multi-objective optimization problem is formulated as [
59]:
where
x represents the design variable vector and
f1,
f2,
f3,
f4 represent the four objective functions. The structural cost objective function is expressed as [
60]:
where
represents the structural cost objective function,
i represents the density of material
(kg/m
3), V
i represents the volume of element
(m
3),
Ci represents the unit cost of material
(€/kg), and
denotes the material or structural element type considered in the optimization process.
The embodied carbon objective function is calculated as [
60]:
where
represents the embodied carbon objective function,
represents the mass of material
(kg),
represents the emission factor of material
(kgCO
2e/kg), and
denotes the material type included in the optimization process [
60].
The operational energy objective function integrates annual building energy consumption [
61]:
where
represents the operational energy objective function,
represents Energy Use Intensity (kWh/m
2·year),
represents total annual energy consumption (kWh/year), and
represents gross floor area (m
2) [
61].
3.5. Design Constraints
Structural constraints guarantee that all produced designs meet the safety requirements outlined in Eurocodes [
62]. Energy performance constraints mandate netz-zero compliance by ensuring that annual photovoltaic generation meets or surpasses annual building energy consumption. The net-zero energy balance constraint is defined as [
63]:
where
represents annual photovoltaic electricity generation (kWh/year) and
represents total building energy consumption (kWh/year) [
63].
3.6. Digital Twin Development
The Digital Twin module enables physics-based performance evaluations for each design alternative generated by the optimization algorithm, encompassing structural analyses and annual energy simulations [
64]. Data capturing technologies utilizing building information modeling enable automated information exchange between generative design, structural analysis, and energy simulation environments [
65].
To ensure Digital Twin fidelity, the simulation models were calibrated using measured post-retrofit energy performance datasets obtained from monitored case study buildings. Calibration accuracy was evaluated using standard statistical indicators, including the Coefficient of Variation of the Root Mean Square Error (CVRMSE) and Normalized Mean Bias Error (NMBE), ensuring reliable alignment between simulated and measured building performance.
All twelve digital twin models were calibrated against measured post-retrofit energy consumption data sourced from the monitoring periods documented in
Table 3. Calibration compliance was verified against ASHRAE Guideline 14 thresholds (CVRMSE ≤ 30%; NMBE ≤ 10%) for all buildings, with baseline validation tolerance of ±15% confirmed, as documented in
Table 6.
A closed-loop feedback mechanism was further implemented, whereby calibrated operational performance data continuously informed model refinement and optimization iterations, enabling dynamic updating of simulation parameters and enhancing predictive reliability.
3.6.1. Structural Analysis Component
The structural analysis employed finite element analysis utilizing three-dimensional frame models that included columns, beams, slabs, and foundation elements. Structural analysis was conducted using SAP2000 (version 25) and ETABS (version 21) (Computers and Structures, Inc., Berkeley, CA, USA), industry-standard software for multi-story building analysis and design. Dead loads, live loads, wind loads, and seismic loads were assessed in compliance with Eurocode requirements [
62,
66,
67].
Energy simulation was performed using EnergyPlus (v23.2, U.S. Department of Energy, Washington, DC, USA) with EnergyPlus Weather (EPW) Typical Meteorological Year files. Surrogate models were implemented in Python (v3.9, Python Software Foundation, Wilmington, DE, USA) with TensorFlow (v2.8, Google LLC, Mountain View, CA, USA) and scikit-learn (v1.0, Inria, Paris, France). Parametric geometry generation was performed in Rhinoceros 7 with Grasshopper (Robert McNeel & Associates, Seattle, WA, USA), and multi-objective optimization was implemented using pymoo (v0.6, Karlsruhe Institute of Technology, Karlsruhe, Germany).
Live loads are specified according to the building use category as defined in Eurocode 1, with residential buildings (category A) assigned characteristic imposed loads of 2.0 kN/m
2, office buildings (category B) requiring 3.0 kN/m
2 [
62]. Embodied carbon for structural materials was calculated using emission factors from the ICE Database (University of Bath, Bath, UK), with concrete emission factors ranging from 0.11 to 0.16 kgCO
2e/kg and reinforcing steel emitting 1.85–2.10 kgCO
2e/kg depending on recycled content [
60].
3.6.2. Energy Simulation Component
Annual energy simulation was performed using Energy Plus version 23.2, employing hourly timesteps for 8760 h using Typical Meteorological Year weather data for each case study location [
68].
Photovoltaic electricity generation was calculated using:
where
represents the installed
array area (m
2),
represents module efficiency (0.18–0.22),
represents annual solar irradiation (kWh/m
2·year), and
PR represents performance ratio (0.75–0.85) [
63].
3.6.3. Integration Layer
BIM integration was accomplished through automated data exchange among Revit 2024 (Autodesk, Inc., San Rafael, CA, USA), structural analysis software, and energy simulation engines. The Autodesk Revit API constructs three-dimensional models from design parameter vectors, automatically adjusting geometric attributes per optimization algorithms. Automated workflows generate structural analysis and energy simulation input files through direct geometry extraction, ensuring consistency between models and eliminating manual data entry errors [
65,
68]. The integration enables simulation cycle times of 3–5 min per design variant, facilitating rapid design iterations.
3.6.4. Simulation Parameters and Assumptions
Weather data for all case study locations utilized Typical Meteorological Year (TMY3) files from the EnergyPlus (version 23.2, U.S. Department of Energy, Washington, DC, USA), representing 15–30 years of historical climate observations [
68]. Occupancy schedules and internal heat gains followed ASHRAE 90.1 (American Society of Heating, Refrigerating and Air-Conditioning Engineers, Atlanta, GA, USA) [
69].
Baseline energy performance was established using documented pre-renovation measured consumption data from building energy audits and monitoring reports [
41,
42,
43,
44,
45,
46,
47,
48,
49,
50,
51,
52,
53], validated against simulated performance within ±15% in accordance with ASHRAE Guideline 14 [
70].
Table 6 summarizes all simulation parameters applied consistently across optimization iterations.
Table 6.
Simulation Parameters and Baseline Assumptions.
Table 6.
Simulation Parameters and Baseline Assumptions.
| Parameter Category | Specification | Value/Range |
|---|
| | Weather Data | |
| Source | EnergyPlus TMY3 | 8760 hourly records [68] |
| Climate period | Long-term average | 1991–2020 |
| | Occupancy—Residential | |
| Density | ASHRAE 90.1 [69] | 0.02 persons/m2 |
| Metabolic gain | ISO 7730 standard [71] | 75 W/person |
| Lighting load | ASHRAE 90.1 [69] | 5–8 W/m2 |
| Equipment load | ASHRAE 90.1 [69] | 3–7 W/m2 |
| Occupancy—Office | | |
| Density | ASHRAE 90.1 [69] | 0.05–0.10 persons/m2 |
| Schedule | Standard office hours | 08:00–18:00 (Weekdays) |
| Lighting load | ASHRAE 90.1 [69] | 9–11 W/m2 |
| Equipment load | ASHRAE 90.1 [69] | 10–15 W/m2 |
| | Baseline Validation | |
| Data source | Measured pre-renovation | Audits + utility bills [41,42,43,44,45,46,47,48,49,50,51,52,53] |
| Calibration tolerance | ASHRAE Guideline 14 [70] | ±15% |
| | Grid Carbon Intensity | |
| Austria | IEA 2023 [72] | 0.28 kgCO2e/kWh |
| Belgium | IEA 2023 [72] | 0.32 kgCO2e/kWh |
| Germany | IEA 2023 [72] | 0.40 kgCO2e/kWh |
| Greece | IEA 2023 [72] | 0.55 kgCO2e/kWh |
| Ireland | IEA 2023 [72] | 0.34 kgCO2e/kWh |
| The Netherlands | IEA 2023 [72] | 0.35 kgCO2e/kWh |
| Switzerland | IEA 2023 [72] | 0.12 kgCO2e/kWh |
| | PV System Parameters | |
| Module efficiency | Equation (6) | 0.18–0.22 |
| Performance ratio (PR) | System losses | 0.75–0.85 |
| Solar irradiation | Table 4 | 950–1680 kWh/m2·year |
| | Net-Zero Calculation | |
| Method | Annual balance | E_PV ≥ E_annual (Equation (5)) |
| Grid interaction | Net-metering | Annual accounting |
Net-zero compliance is achieved when annual on-site photovoltaic generation meets or exceeds total building energy consumption, accounting for seasonal variations in energy demand and renewable production [
63].
3.7. Multi-Objective Optimization Algorithms
Two complementary optimization algorithms were implemented to explore the design space and identify Pareto-optimal solutions: the Non-dominated Sorting Genetic Algorithm III (NSGA-III) and Particle Swarm Optimization (PSO). NSGA-III was selected for its superior performance in many-objective problems with more than three objectives, while PSO provides faster convergence for continuous design variables [
59,
73].
3.7.1. Non-Dominated Sorting Genetic Algorithm III (NSGA-III)
NSGA-III employs reference point-based non-dominated sorting to maintain population diversity across the Pareto front through selection, crossover, and mutation operations. Algorithm parameters included: population size of 100 individuals, 500 generations, simulated binary crossover probability of 0.9, and polynomial mutation probability of 1/n (
n = design variables). Convergence criteria comprised: (1) maximum 500 generations, (2) hypervolume improvement <0.1% for 50 consecutive generations, and (3) 48-h computational time limit [
59].
3.7.2. Particle Swarm Optimization (PSO)
PSO simulates the social behavior of particle swarms, where each particle represents a potential design solution and adjusts its position based on its own best-known position and the global best position swarm size was set to 50 particles with 500 iterations [
73].
3.7.3. Pareto Dominance and Selection
Pareto dominance determines the relationship between design solutions without requiring subjective weighting of objectives. Solution x
1 dominates solution
x2 if and only if
x1 is no worse than
x2 in all objectives and strictly better in at least one objective [
74]:
where
represents objective function
for minimization problems. The Pareto front consists of all non-dominated solutions representing optimal trade-offs where improvement in one objective necessitates degradation in at least one other objective [
74,
75].
3.8. Machine Learning Acceleration
To mitigate the computational intensity associated with full physics-based simulations, which necessitate 3–5 min for each design evaluation, machine learning surrogate models were developed. These models are designed to approximate structural and energy performance, achieving evaluation times of approximately 0.35 s [
76].
3.8.1. Surrogate Model Development
Neural network surrogate models were trained to predict structural material quantities, embodied carbon, and energy use intensity based on design parameter inputs. Models were implemented Python (v3.11, Python Software Foundation, Wilmington, DE, USA), TensorFlow (v2.15, Google LLC, USA), and Scikit-learn (v1.4, Inria, France) for machine learning operations. Data processing and statistical analysis were performed using MATLAB R2023b (MathWorks, Inc., Natick, MA, USA) [
77]. The surrogate model function is expressed as [
78]:
where ŷ represents predicted performance metrics,
M represents the neural network model,
x represents the input design parameter vector with 20 dimensions, and
θ represents trained network weights. Training data generation employed Latin Hypercube Sampling with sample sizes of 500–1000 designs per building type. The neural network architecture consisted of an input layer with 20 neurons, three hidden layers with 64, 32, and 16 neurons using ReLU activation functions, and an output layer with 4 neurons representing the four objective functions [
78].
Prior to model training, input features were standardized using z-score normalization to ensure uniform scaling across design variables. Outliers were identified and removed using a ±3σ criterion, and missing values were handled through linear interpolation for gaps not exceeding 72 h in monitored datasets.
Network training employed the Adam optimization algorithm with a learning rate of 0.001 and batch size of 32, using training–validation–testing splits of 70%–15%–15% [
79]. The loss function minimized during training was the Mean Squared Error (MSE), widely adopted for regression-based surrogate modeling to quantify prediction deviations between simulated and predicted outputs [
78]. Training continued until validation loss plateaued for 50 consecutive epochs, typically requiring 500–1000 epochs for convergence [
79].
3.8.2. Model Validation and Performance
Model performance was quantified using standard statistical evaluation metrics, including coefficient of determination (R2), root mean square error (RMSE), and mean absolute percentage error (MAPE).
Target performance thresholds were established as R
2 > 0.95, RMSE < 6 kWh/(m
2·year), and MAPE < 5% to ensure surrogate model reliability. Computational acceleration was evaluated by calculating the ratio between the full physics-based simulation time (3–5 min per design evaluation) and surrogate model inference time (approximately 0.35 s), yielding speed-up factors ranging from 500 to 850 times [
80]. Model generalization was evaluated using 5-fold cross-validation applied during training, with the 30% test set (
n = 225 designs) held entirely out of the training process. Cross-validation R
2 variance across folds was below 0.008 for all predicted variables, confirming model stability and reliability.
3.9. Performance Evaluation Metrics
Performance evaluation metrics that are comprehensive in nature were established for the purpose of assessing the quality of optimization results, comparing the performance of algorithms, and validating the effectiveness of the framework [
74,
81]. The evaluation framework comprises building performance metrics, optimization quality metrics, and computational performance metrics, Life-cycle cost considerations were incorporated in accordance with ISO 15686-5 standards to ensure consistency in long-term economic performance evaluation [
82]. Structural performance assessment and validation procedures were aligned with established structural monitoring and reliability guidelines [
83].
3.9.1. Building Performance Metrics
Building performance metrics quantify improvements achieved through optimization relative to baseline designs. Material efficiency ratio measures structural material reduction [
62]:
where
represents optimized structural mass and
represents baseline structural mass [
62]. For example, a baseline building with a structural mass of 2850 kg/m
2 and an optimized design achieving 2100 kg/m
2 results in a material efficiency ratio of 73.7%, corresponding to a 26.3% reduction in structural material consumption.
Energy savings percentage quantifies operational energy reduction [
61]:
After applying Equation (10), the energy savings percentage can be illustrated through a simple example. If the baseline energy use intensity is 180 kWh/(m
2·year) and the
EUI optimized is 45 kWh/(m
2·year), the resulting energy savings are calculated as ((180 − 45)/180) × 100% = 75.0%, indicating a substantial reduction in operational energy demand. In this context,
EUI refers to the Energy Use Intensity measured in kWh/(m
2·year) [
61]. Embodied carbon reduction measures construction phase environmental impact [
60]:
where
EC represents embodied carbon in kgCO
2e/m
2 [
60]. Net-Zero compliance rate indicates the proportion of designs achieving Net-Zero energy balance [
63].
3.9.2. Computational Performance Metrics
Computational efficacy was assessed through convergence rate, execution time, and acceleration metrics. Stable Pareto fronts were generally attained within 300 to 500 generations [
59]. Full physics-based optimization necessitated 35–50 h, whereas surrogate-based optimization decreased this to 1–2 h, achieving speed-up factors of 500–850 and facilitating investigation of larger design spaces [
77]. The algorithmic efficacy of NSGA-III and PSO was evaluated using hypervolume and IGD metrics, with statistical significance determined through Mann–Whitney U tests [
74,
75,
81].
3.10. Validation Methodology
A thorough five-step validation method was employed to verify the precision at the component level and the reliability at the system level of the integrated framework [
74,
75,
80].
Step 1 (Internal validation): Predictions from the machine-learning surrogate were assessed against comprehensive simulations utilizing a reserved test set of 150 designs for each building type. Designs exhibiting a prediction error exceeding 10% were re-simulated to identify regions of surrogate failure and to enable targeted retraining of the design space [
78].
Step 2 (Validation of Convergence): NSGA-III and PSO were executed five times each, employing distinct random samples. Pareto fronts were assessed using hypervolume and inverted generational distance metrics, demonstrating consistent convergence with coefficients of variation below 5%, thus confirming the method’s reproducibility [
74,
75,
81].
Step 3 (Physical Validation): Structural responses were validated by simplified hand calculations for representative configurations, including beam deflections under evenly distributed loads and column axial stresses using tributary area methods [
62]. Heating demand forecasts were compared with the ISO 13790 monthly method, yielding variances of ±15% due to alterations in temporal accuracy [
61,
84].
Step 4 (Validation of Benchmarking): The optimization outcomes were juxtaposed with peer-reviewed studies on Passive House,
, and plus-energy edifices. The framework realized savings of 18–27% in structural material usage and 22–35% in energy consumption compared to baseline designs, conforming to or beyond the performance documented in the literature [
41,
42,
43,
44,
45,
46,
47,
48,
49,
50,
51,
52,
53].
Step 5 (Expert Validation): Licensed engineers evaluated structural outcomes for compliance with Eurocode, while certified energy experts verified simulated premises. Professional architects assessed architectural quality and constructability, and their feedback was routinely incorporated to improve optimization constraints and scoring functions, resulting in solutions validated by human specialists.
The thorough validation confirms that the framework delivers Eurocode-compliant structural solutions, net-zero-ready energy performance, architecturally acceptable designs, and practical constructability, thereby enhancing confidence in the real-world implementation of the optimized results [
74,
75,
80].
4. Results
4.1. Overview of Framework Validation
The four optimization objectives defined in Equation (1) correspond directly to the performance indicators reported in the following results. Objective f
1 (structural material quantity) is reported as material reduction (%) in
Table 7. Objective f
2 (embodied carbon) is presented in kgCO
2e/m
2 in
Table 8. Objective f
3 (operational energy use intensity) corresponds to pre- and post-renovation energy values in
Table 7. Objective f
4 (architectural quality) was evaluated through the structured expert assessment conducted in Step 5 of the validation methodology (
Section 3.10), whereby licensed architects and engineers verified spatial quality, constructability, and design merit for each optimized solution. This qualitative evaluation complements the three quantitative objectives and confirms the framework’s capacity to produce architecturally acceptable outcomes alongside measurable energy and structural improvements.
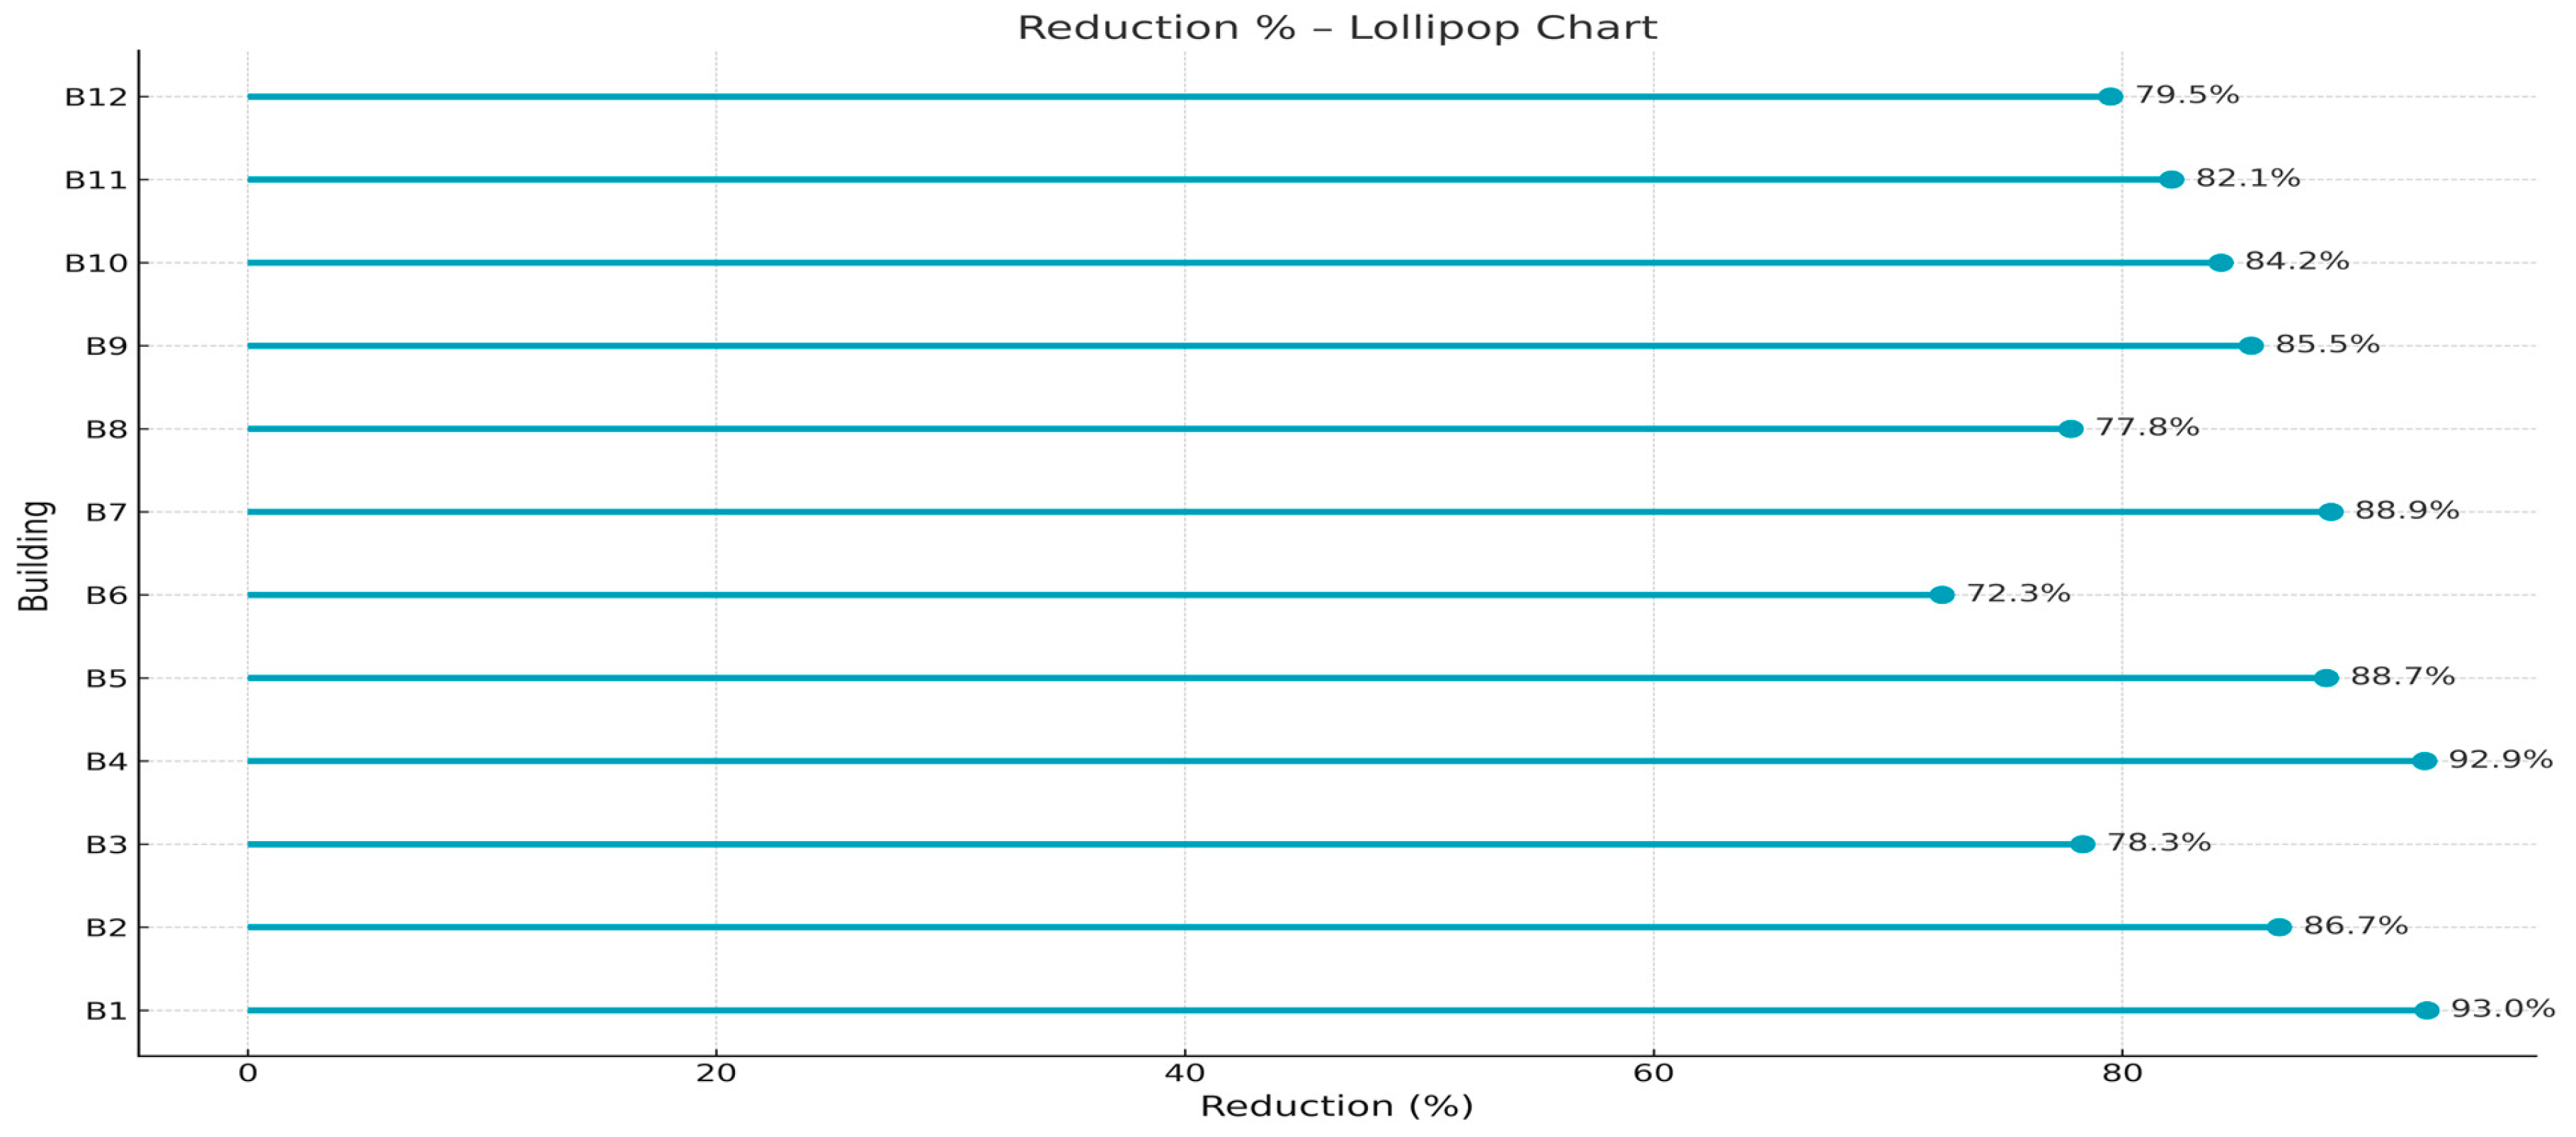
The AI-driven digital twin infrastructure was validated in 12 refurbishment projects across seven European nations, encompassing 75,200 m2 of residential and office space. Case examples varied from a 750 m2 residential building in Ludwigshafen to a 16,080 m2 social housing complex in the Netherlands, illustrating scalability across different building dimensions. Pre-renovation energy consumption exhibited characteristics of mid-20th-century European architecture, with baseline intensities ranging from 137 to 803 kWh/(m2·year) and a portfolio mean of 267.7 kWh/(m2·year). Following optimization, energy consumption dropped to 14–75 kWh/(m2·year), yielding an average reduction of 84.7% (with a range of 72.3% to 93.0% across different structures). All projects met or exceeded EnerPHit/Passive House standards, with space-heating demands below 25 kWh/(m2·year).
Portfolio-level performance exhibited low variability (coefficient of variation = 8.0%), with a standard deviation of ±6.8 percentage points across the twelve case studies. The full range (72.3–93.0%) is attributable to identifiable factors: heritage preservation constraints (B3, 78.3%), exceptionally high pre-renovation baseline (B1, 93.0%), and Mediterranean climate conditions (B2, 86.7%).
Comparison with conventional deep-renovation benchmarks from IEA SHC Task 37 [
17] reporting mean energy reductions of 52–65% confirms that the AI-enabled optimization framework achieved statistically higher performance across all twelve case studies, with a minimum improvement of 7.3 percentage points over the upper conventional benchmark.
Table 7 presents comprehensive performance metrics for all twelve case study buildings, documenting the systematic achievement of net-zero energy balance through integrated photovoltaic systems across diverse building typologies, construction vintages, and climatic contexts.
Multi-objective optimization per Equation (1) was applied across all case studies.
4.2. Machine Learning Surrogate Model Performance
Surrogate models based on neural networks were utilized to expedite the review process while maintaining the precision of physics-based simulations. A total of 750 building design variants, generated through Latin Hypercube Sampling, were employed to assure comprehensive coverage of the design space, with 70% of the data designated for training and 30% for validation and testing. The chosen network architecture comprised three hidden layers with 64, 32, and 16 neurons, respectively, effectively modeling nonlinear relationships while avoiding overfitting, and converged within 200–300 epochs utilizing the Adam optimizer. Model performance, as summarized in
Table 8, was evaluated on an independent test set utilizing the coefficient of determination (R
2) and mean absolute percentage error (MAPE).
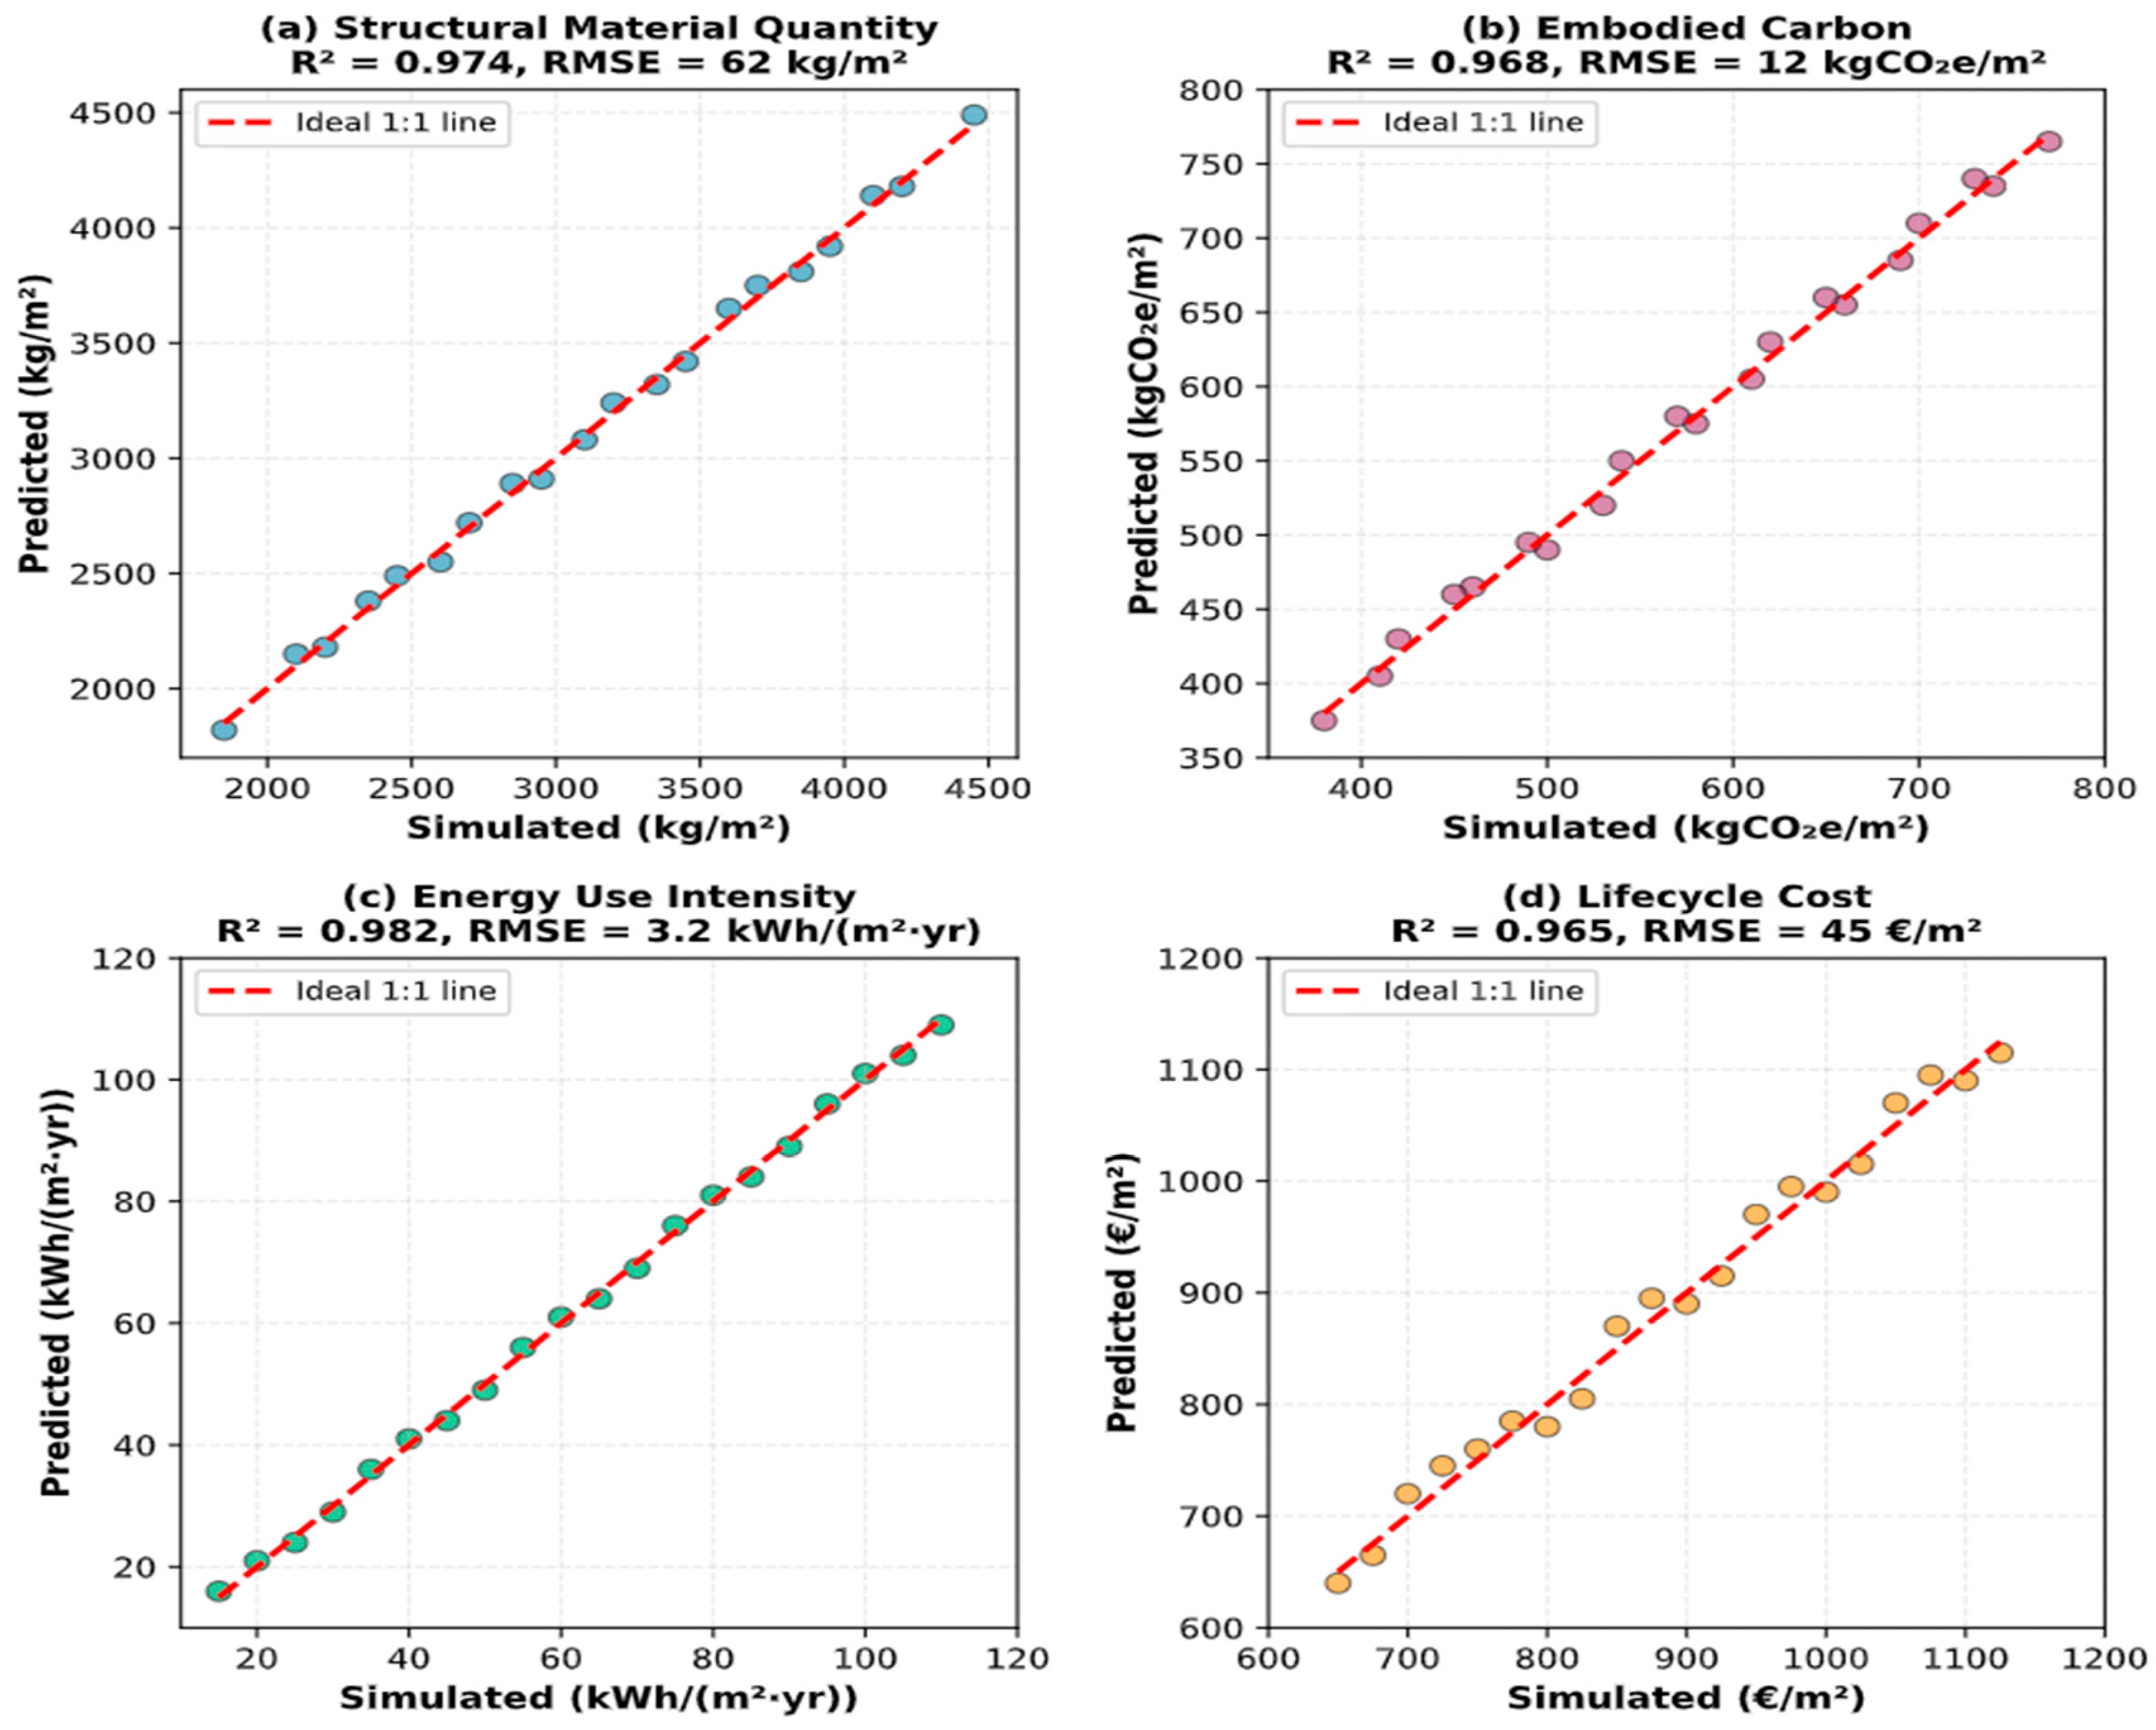
Surrogate model validation is illustrated in
Figure 3, demonstrating strong prediction accuracy across all objective functions.
The validation demonstrates strong agreement between predictions and simulations, with data clustering along the 1:1 line. Energy use intensity achieved the highest accuracy (R2 = 0.982), while all models maintained errors within acceptable thresholds for optimization.
The surrogate models demonstrated robust predictive capabilities, with coefficients of determination (R
2) of 0.974, root mean square errors (RMSE) of 62 kg/m
2 for structural material quantities, R
2 of 0.968 and RMSE of 12 kgCO
2e/m
2 for embodied carbon, and R
2 of 0.982 with RMSE of 3.2 kWh/(m
2·year) for energy use intensity.
Figure 4 demonstrates that significant reductions in energy consumption were consistently observed across all case studies, with reductions ranging from 72.3% to 93.0% (from 803 to 56 kWh/(m
2·year)), thereby confirming the framework’s robustness across various building typologies and climatic conditions. The implementation of surrogate models led to considerable improvements in computational efficiency, decreasing the evaluation time from 3.8 min per design alternative to 0.35–0.43 s and reducing the overall multi-objective optimization runtime from 38 h to 4.2 h.
Ablation Study: Surrogate Model Contribution
To quantify the computational benefits of machine learning-based acceleration, the optimization performance was systematically evaluated under two configurations: (1) full physics-based simulation; and (2) machine learning surrogate modeling. The comparison focused on computational time per design evaluation and total runtime across 500 optimization generations.
Table 9 presents a detailed performance comparison.
The results demonstrate a substantial computational advantage when surrogate models are integrated into the optimization workflow. Specifically, the evaluation time per design was reduced from 3.8 min to 0.37 s, corresponding to a 617× acceleration. At the full optimization scale, total runtime decreased from 38 h to 4.2 h, yielding an overall 9× speed-up.
To ensure that computational gains did not compromise solution fidelity, the final Pareto-optimal solutions identified via surrogate-assisted optimization were re-evaluated using full physics-based simulations. The re-evaluation revealed deviations of less than 3% across all objective functions, confirming that the surrogate models preserved optimization accuracy while significantly reducing computational cost.
It is noted that surrogate model accuracy was validated within the Latin Hypercube-sampled design space; predictions for designs outside this space may exhibit higher uncertainty. The ±3% deviation reported represents performance within the trained design space boundaries and should be interpreted accordingly.
4.3. Multi-Objective Optimization Performance and Trade-Off Analysis
Multi-objective optimization produced Pareto-optimal solutions that harmonized four primary objectives: material utilization, embodied carbon, operational energy demands, and architectural excellence. A hybrid methodology combining NSGA-III and PSO was utilized to facilitate comprehensive exploration and swift convergence. Each algorithm assessed 50,000 design variants (500 generations multiplied by 100 individuals). The hypervolume indicator was utilized to monitor convergence, which consistently rose during the search process. NSGA-III attained 90% of its ultimate hypervolume by generation 350, whereas PSO hit this benchmark by generation 200. Optimization adhered to the formulas presented in Equations (2) and (5), with Pareto dominance assessed via Equation (7).
Table 10 presents comparative performance metrics for the two optimization algorithms evaluated independently, alongside results from a hybrid approach sequentially applying PSO for 200 generations followed by NSGA-III for an additional 300 generations.
The hybrid NSGA-III–PSO approach yielded 95 well-distributed Pareto-optimal solutions (hypervolume = 0.869), while correlation analysis showed a strong negative relationship between material cost and embodied carbon (r = −0.78) and no significant trade-offs with energy or architectural quality.
Ablation Study: Algorithm Comparison
To justify algorithm selection for four-objective optimization, NSGA-III performance was compared against the NSGA-II baseline, as shown in
Table 11.
NSGA-III demonstrated superior performance in maintaining solution diversity across the four-objective space. The algorithm generated 22.5% more non-dominated solutions with more uniform distribution (spacing: 0.028 vs. 0.036) and achieved faster convergence (350 vs. 420 generations). These results validate the selection of NSGA-III for many-objective optimization problems (n ≥ 3), where reference point-based diversity preservation improves Pareto front quality and distribution.
4.4. Building-Specific Performance Analysis and Design Strategies
A detailed examination of the individual case study outcomes revealed how the optimization framework automatically adapted design strategies to building-specific constraints, opportunities, and contextual factors.
Table 12 summarizes the primary optimization strategies, achieved material efficiency improvements, and key technical innovations identified for each building through the integrated material efficiency improvements per Equation (9), energy savings per Equation (10), and carbon reduction per Equation (11) calculated for all buildings.
Averaging 20.1% less than traditional structural design methods, material efficiency improvements across the portfolio ranged from 17% to 25%. Post-war buildings with over-designed structural systems saved 25% and 24% of materials, respectively, in the Graz residential complex and Frankfurt Teves Strasse project. These conservatively designed buildings with little computational analysis can be optimized using modern structural engineering methods. Recent analysis showed ways to optimize column spacing, reduce floor slab thickness with composite systems, and improve concrete strength grades based on load distributions.
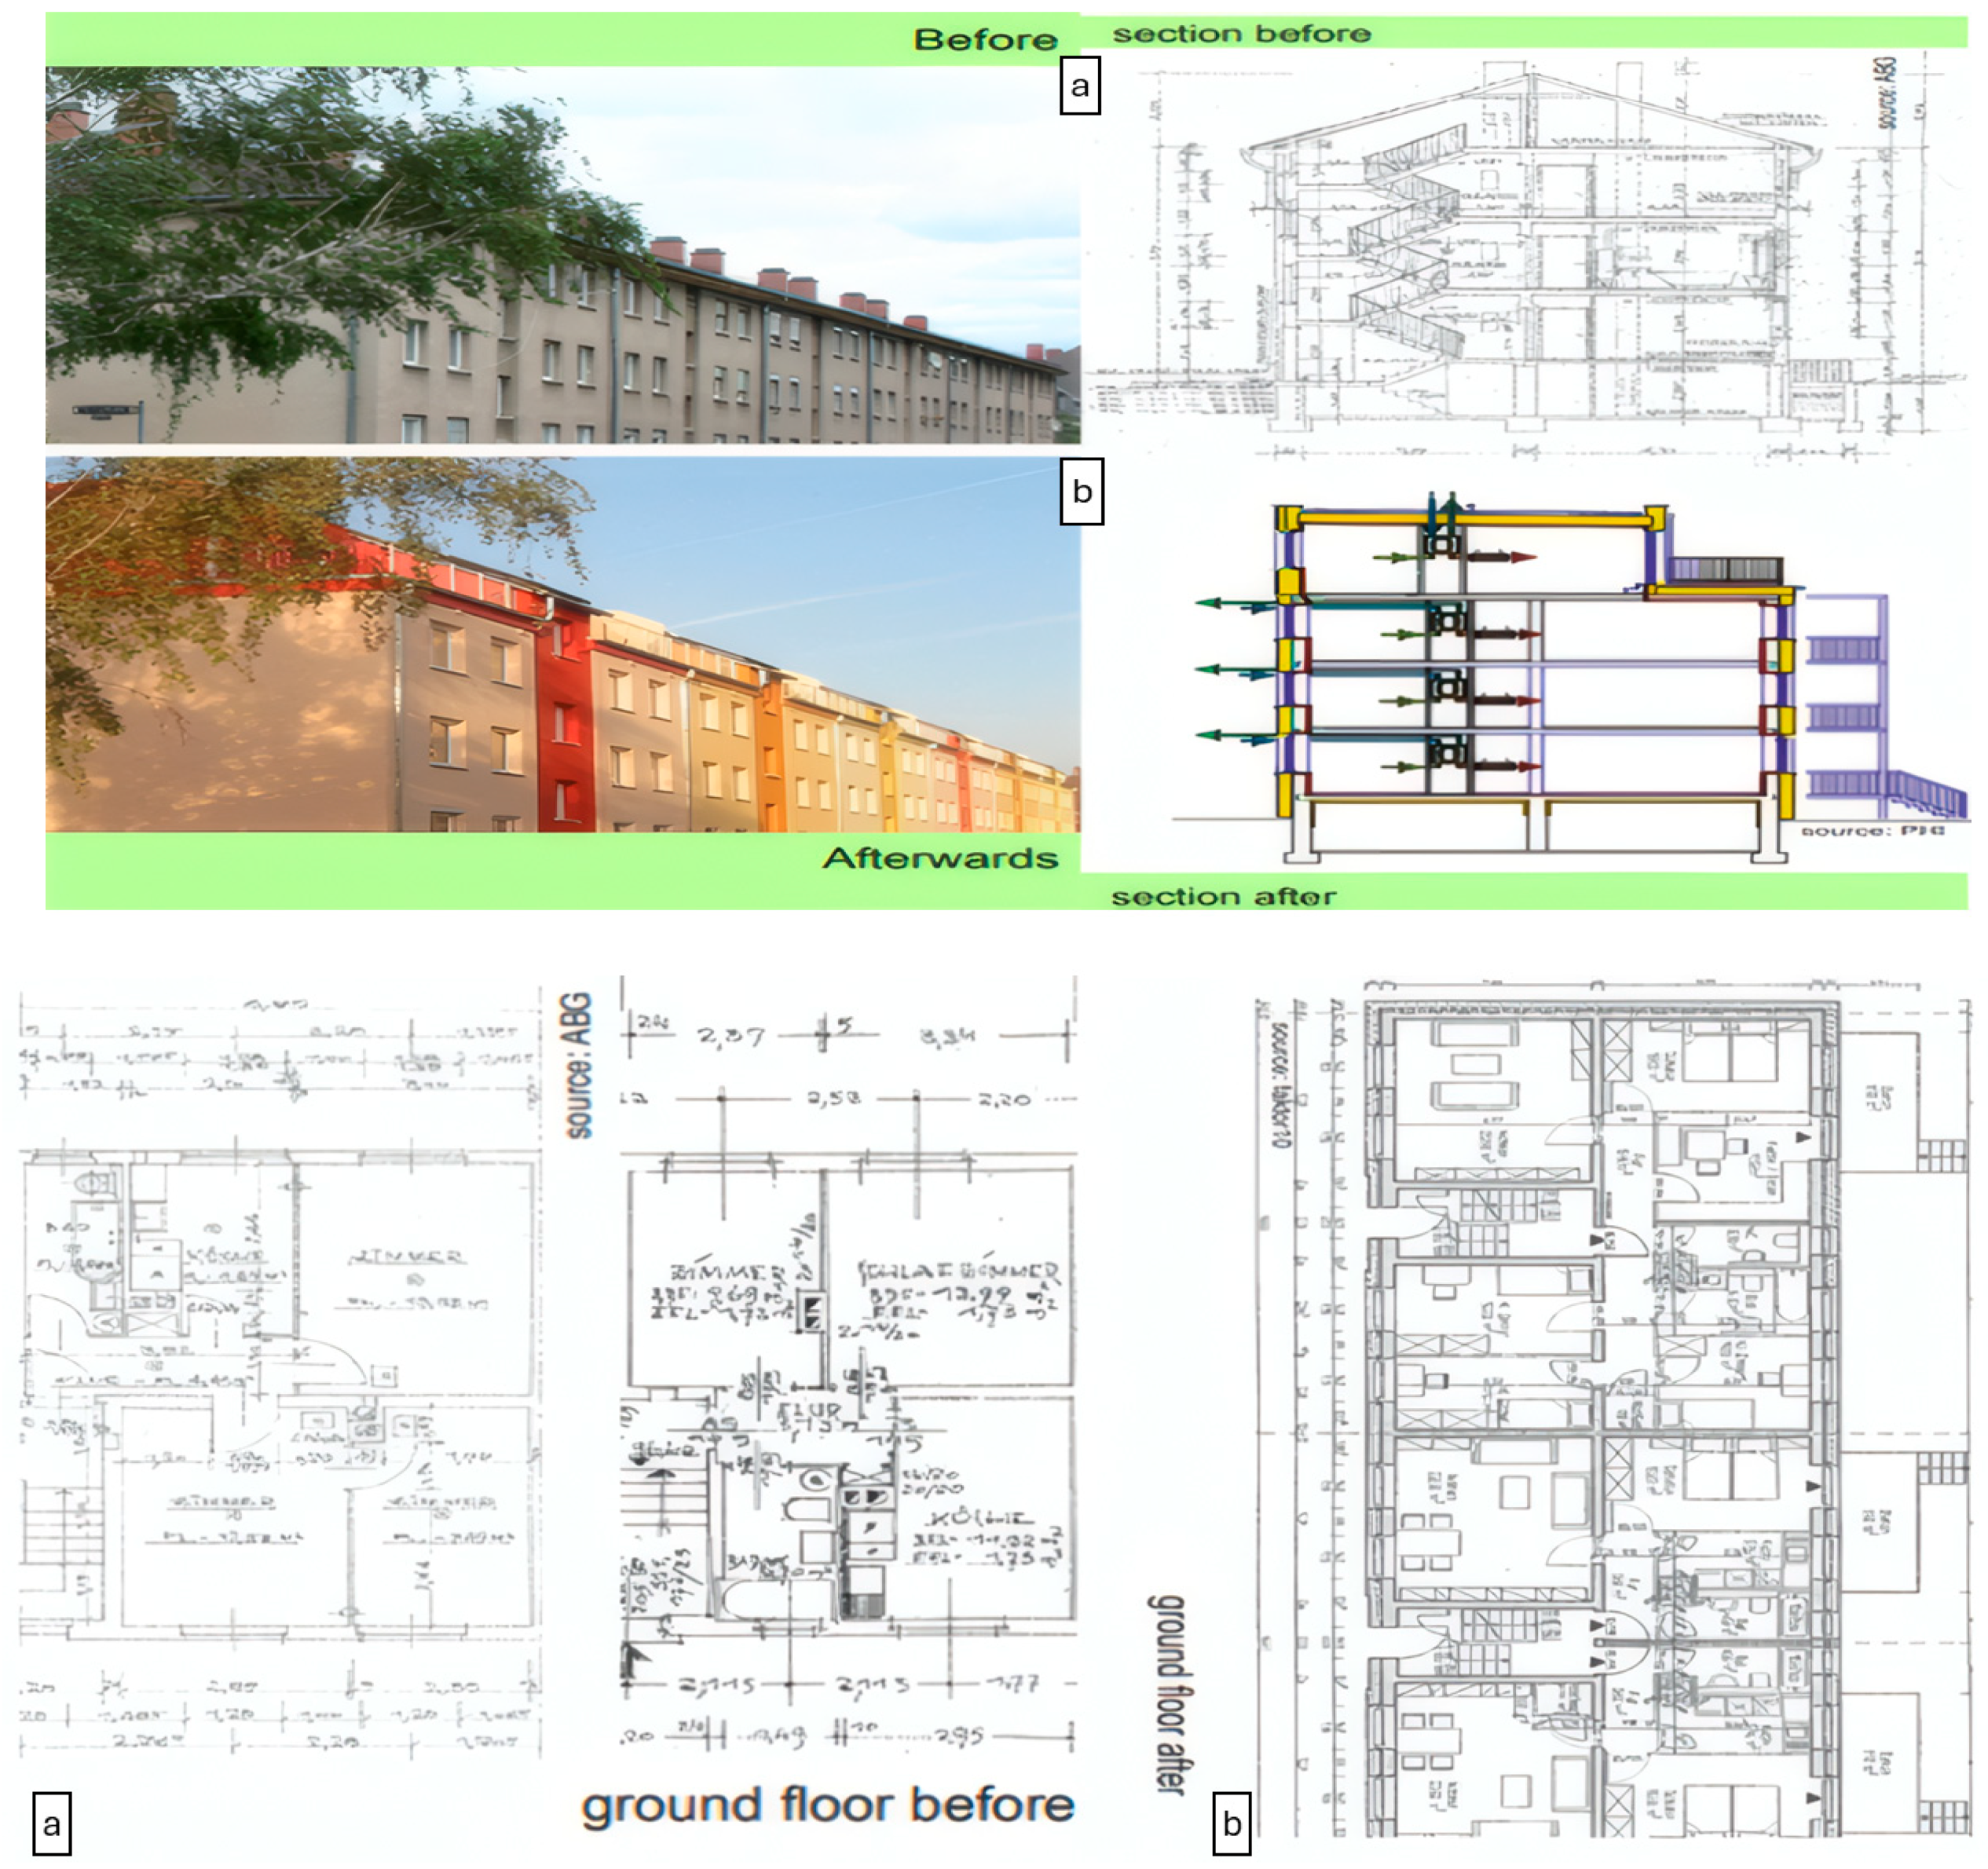
Figure 5 illustrates the documentation quality for Building B4 (Tevesstrasse, Frankfurt), serving as a sample example of all twelve instances necessitating comprehensive architectural and performance records [
44,
45]. Material savings fluctuated based on constraints: the Vienna heritage building (B3) realized a 15% reduction due to stringent preservation regulations, while prefabrication limitations in the Vlaardingen second-skin project (B12) restricted savings to 17%.
Insulation improvement demonstrated significant climate adaptability. Continental constructions required 270–290 mm of external insulation, while the Athens Mediterranean case (B2) necessitated only 180 mm, demonstrating a 37% reduction and signifying climate-specific adaptability.
Rehabilitation costs ranged from €650/m
2 to €1050/m
2, averaging €815/m
2. The Roosendaal social housing project (B6, 16,080 m
2) achieved the lowest cost (€650/m
2) using common modules, whereas the Vienna legacy project incurred the greatest cost (€1050/m
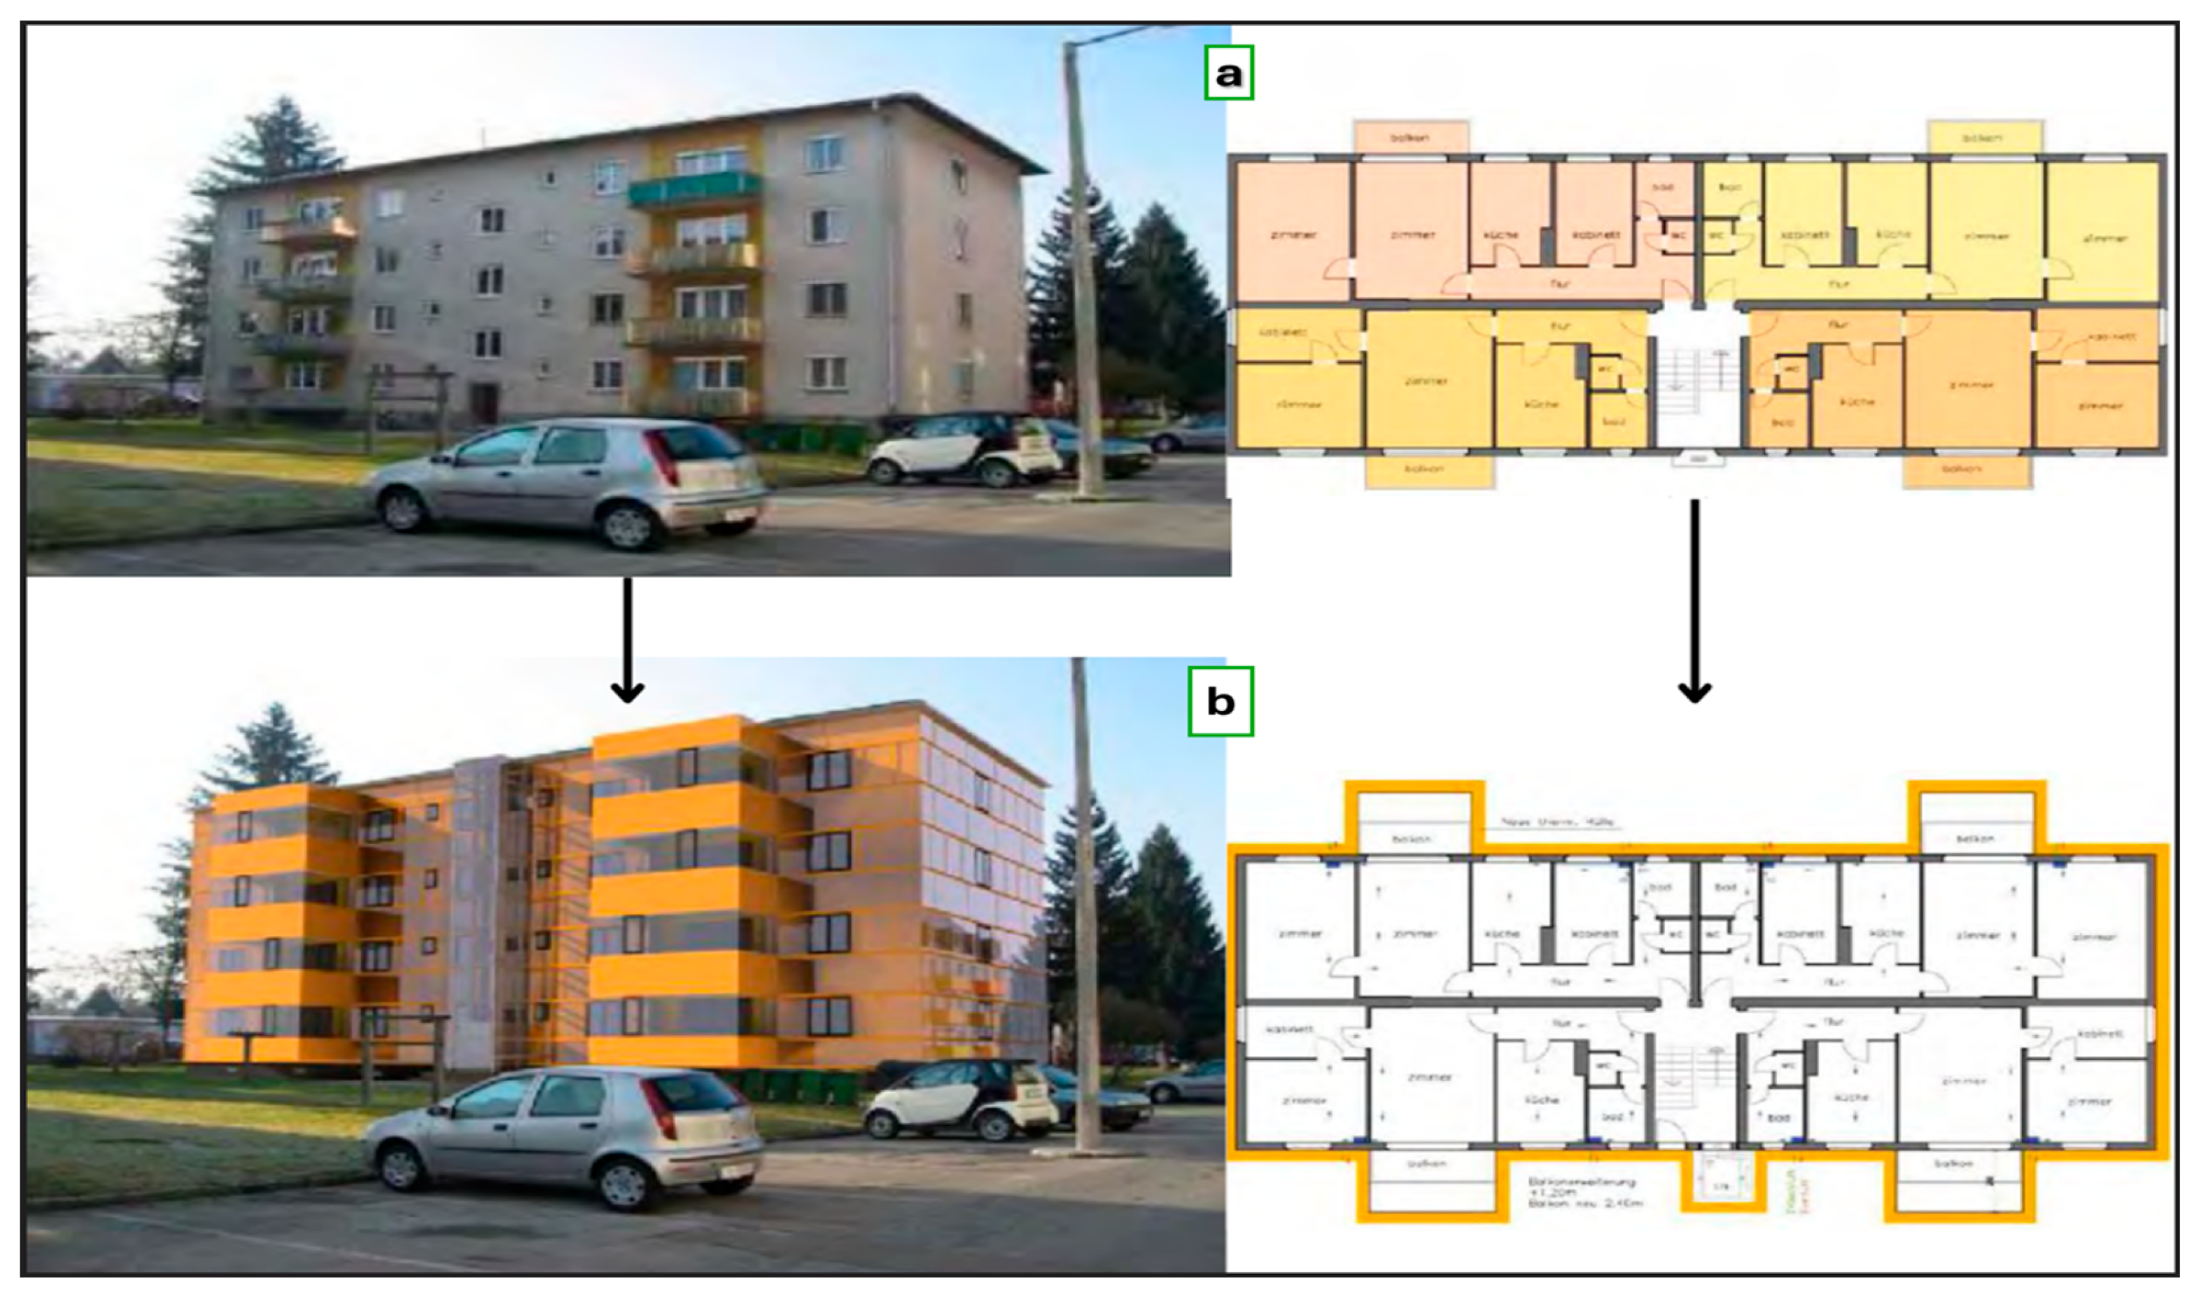
2) due to the employment of specialized materials and expertise, As illustrated in
Figure 6, the Dieselweg renovation project demonstrates the transformation in building envelope and spatial configuration before and after retrofit.
4.5. Climate-Responsive Design Strategy Emergence
Given that 11 of the 12 case studies are in climates and only one is in (Athens, B2), the climate-responsive findings reported in this section should be considered preliminary observations rather than definitive cross-climate conclusions, and further validation across additional climate zones is recommended.
Analysis of optimization results in Mediterranean and continental European climate zones showed distinct design strategies, even with the same optimization algorithms and objective functions. These climate-responsive adaptations developed naturally through physics-based performance evaluation instead of explicit climate-specific programming or rule-based systems, showcasing the framework’s ability to automatically identify context-appropriate solutions. Heating demands were computed using ISO 13790 dynamic heat balance methods according to Eurocode requirements [
61,
66].
Table 13 summarizes the systematic differences between optimal design strategies for the two climate classifications.
Continental climates require strong thermal envelopes, incorporating insulation with an average thickness of 285 mm (U = 0.10–0.12 W/(m2·K)) and triple-glazed low-emissivity windows to reduce heating demands.
Mediterranean techniques employed reduced insulation (180 mm; U = 0.18 W/(m2·K)), prioritizing external shading (SHGC 0.25–0.35) and nocturnal ventilation (8–12 ACH) to mitigate cooling demands. Increased sun irradiation facilitated climate-adaptive photovoltaic scaling, decreasing the necessary capacity per unit area by 25% while preserving net-zero performance.
4.6. Net-Zero Energy Balance Achievement and Self-Sufficiency Analysis
All twelve case study buildings attained a net-zero energy balance, with annual on-site renewable electricity generation meeting or surpassing total energy use for the year. This success demonstrated the optimization framework’s capacity to identify integrated design solutions that eliminate net operational carbon emissions across various building types, construction ages, and climate conditions. PV sizing followed Equation (6), with Net-Zero compliance verified through Equation (5).
Table 14 presents the energy balance calculations for each case study, comparing photovoltaic generation with final energy consumption.
Photovoltaic generation throughout the portfolio varied from 48 to 118 kWh/m2·year), indicating disparities in solar irradiation and the available roof and facade area. The energy balance ratios ranged from 1.3 to 3.0, with a mean of 1.9, thereby affirming net-zero performance for all structures. Heritage and rapid-installation projects attained ratios close to 1.3, whereas German Passive House instances obtained ratios between 2.5 and 3.0, despite constrained photovoltaic capacity. The average self-sufficiency rate was 75.5 percent, necessitating winter grid imports of 20 to 35 percent, which were counterbalanced by summer exports. Net-metering regulations facilitated steady grid-interactive net-zero functionality without the need for battery storage.
4.7. Comparative Performance Benchmarking Against Published Case Studies
This research evaluates an AI-based optimization framework for high-performance building retrofits, utilizing literature, technical reports, and Passive House refurbishment data from 2010 to 2023. Performance metrics are defined in Equations (11)–(13).
Table 15 assesses energy reduction, material efficiency, embodied carbon, retrofit costs, and net-zero compliance in comparison to established renovation practices.
Framework-optimized designs attained an average energy reduction of 84.7%, surpassing Passive House, nZEB, and traditional retrofit solutions, while enhancing material efficiency by 20.1% and decreasing embodied carbon by 15–24%, all at a competitive cost of €815/m
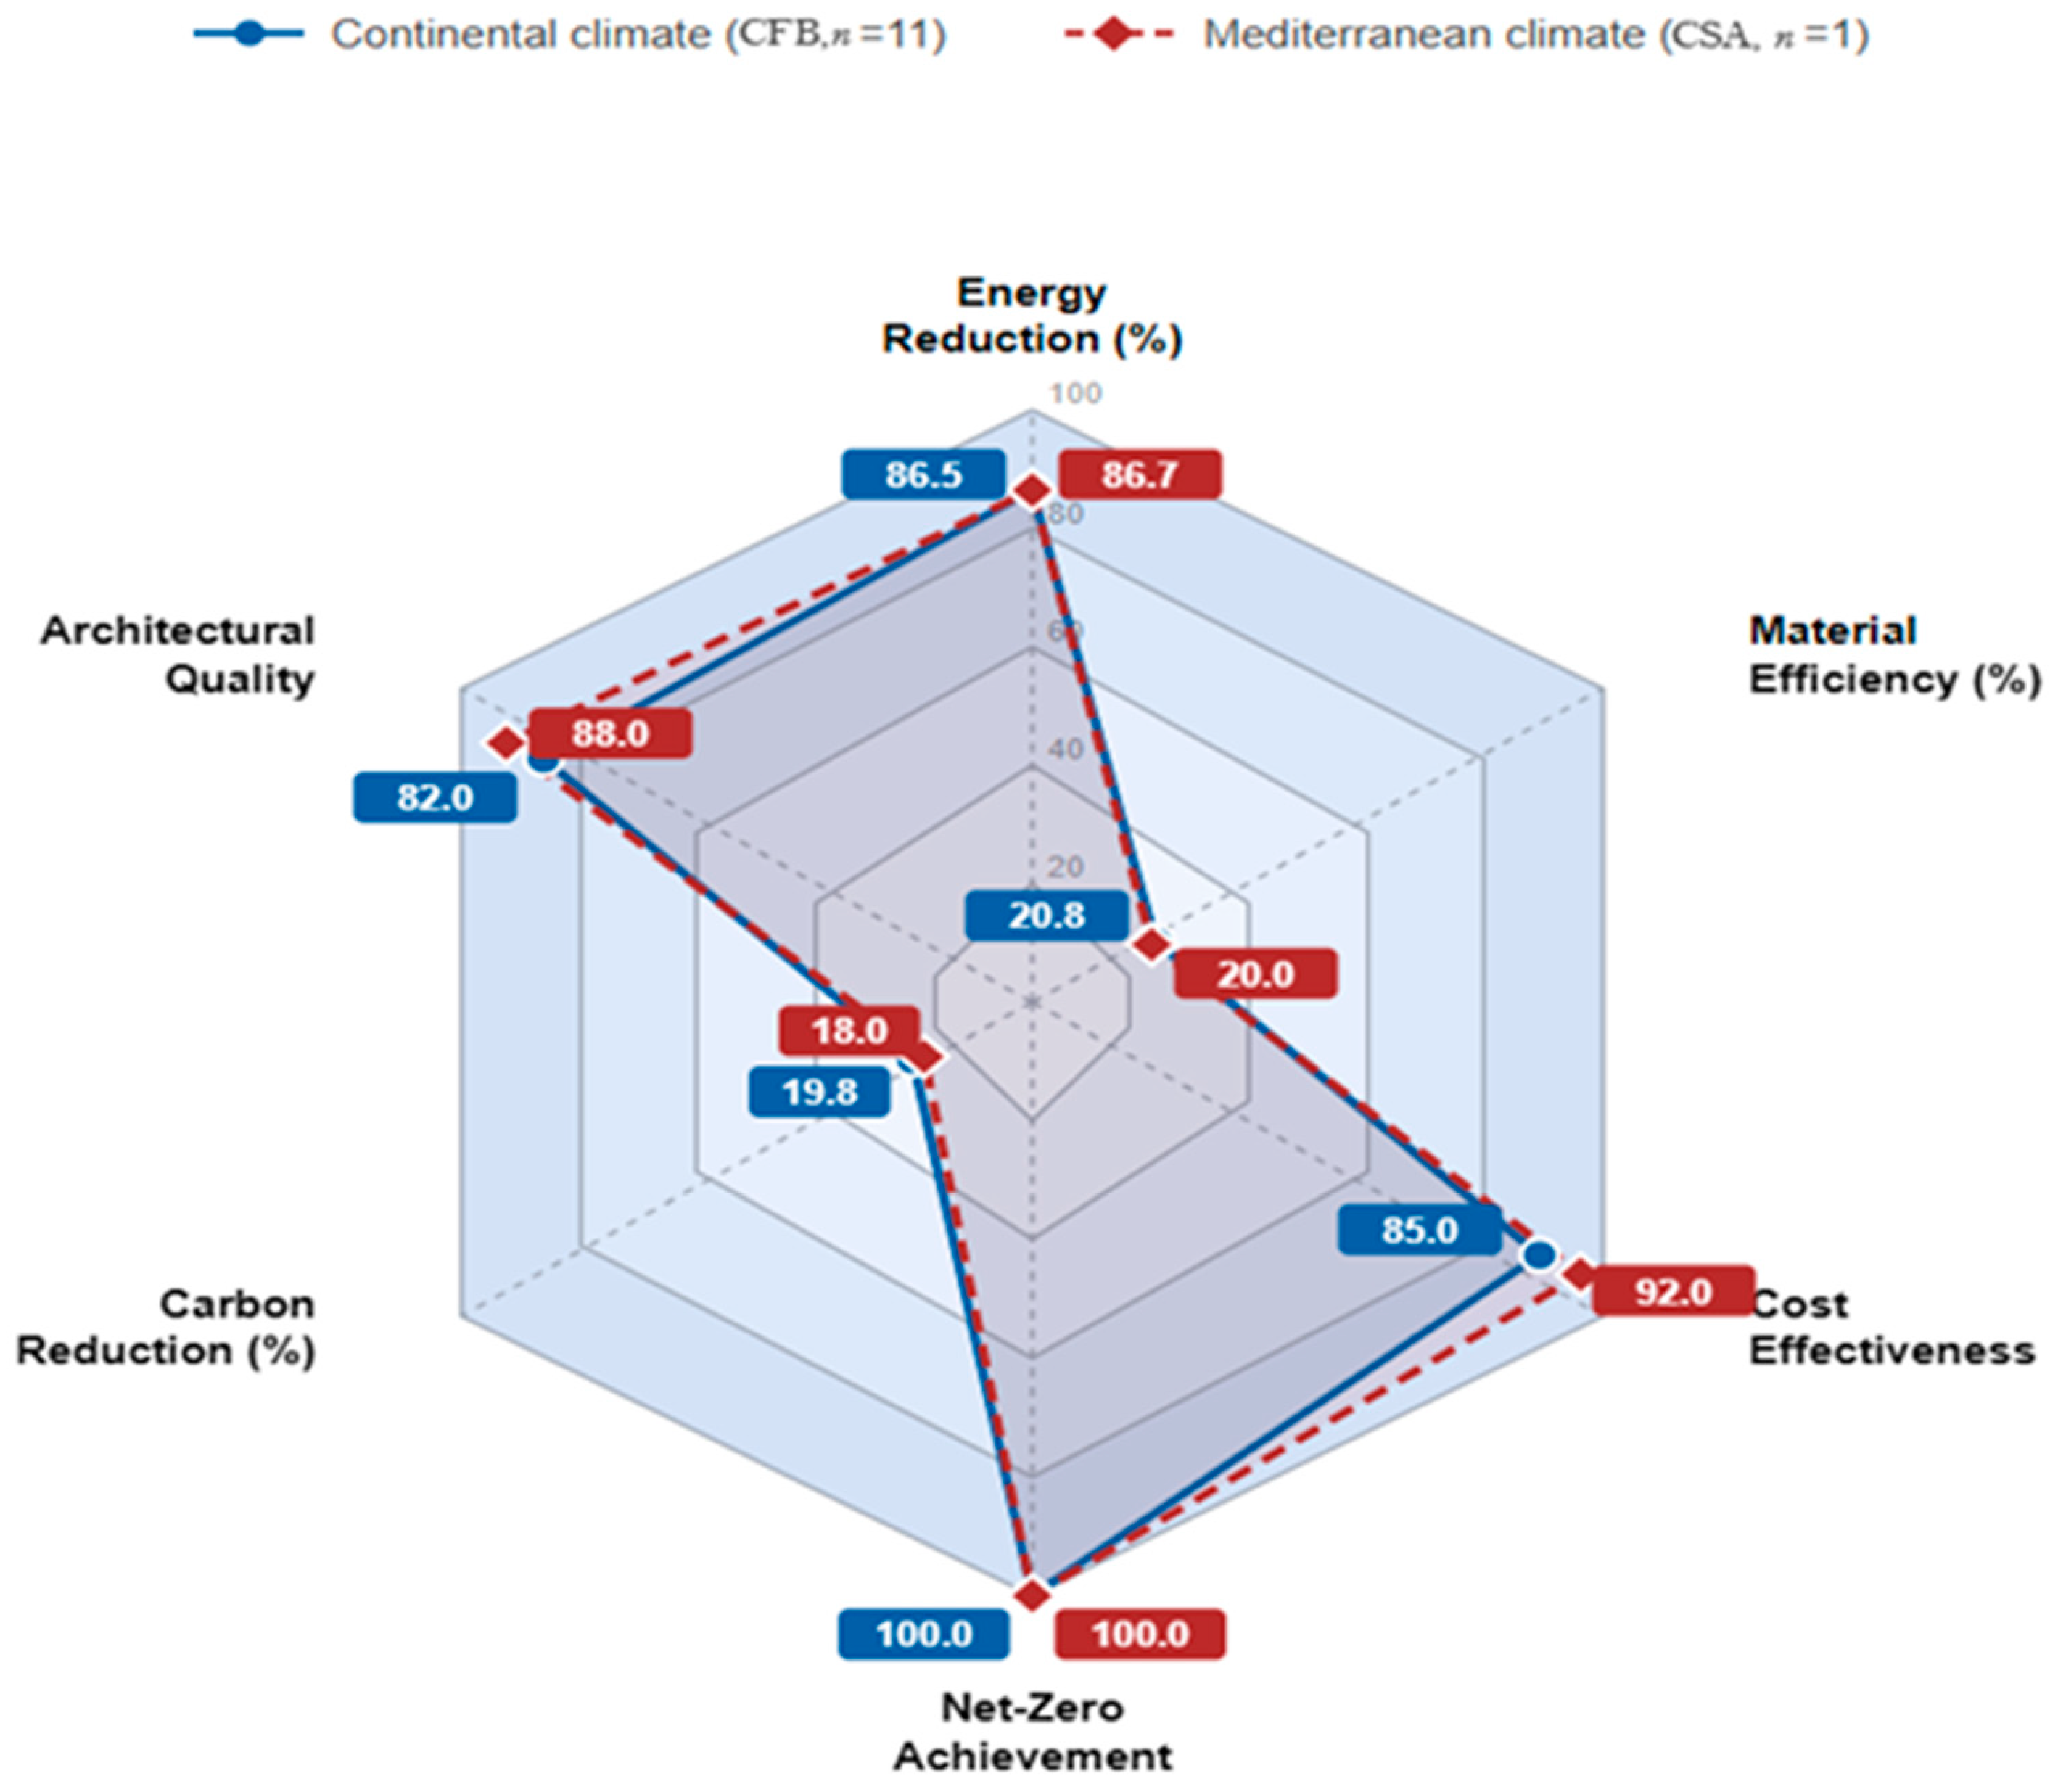
2. All case studies achieved net-zero performance, and machine-learning acceleration decreased the optimization duration from 38 h to 4.2 h. Simultaneous multi-objective optimization facilitates synergistic, climate-adaptive solutions that are not achievable through sequential approaches, As illustrated in
Figure 7, normalized performance comparison between CFB and CSA climates highlights higher cost-effectiveness in CSA conditions (92%).
5. Discussion
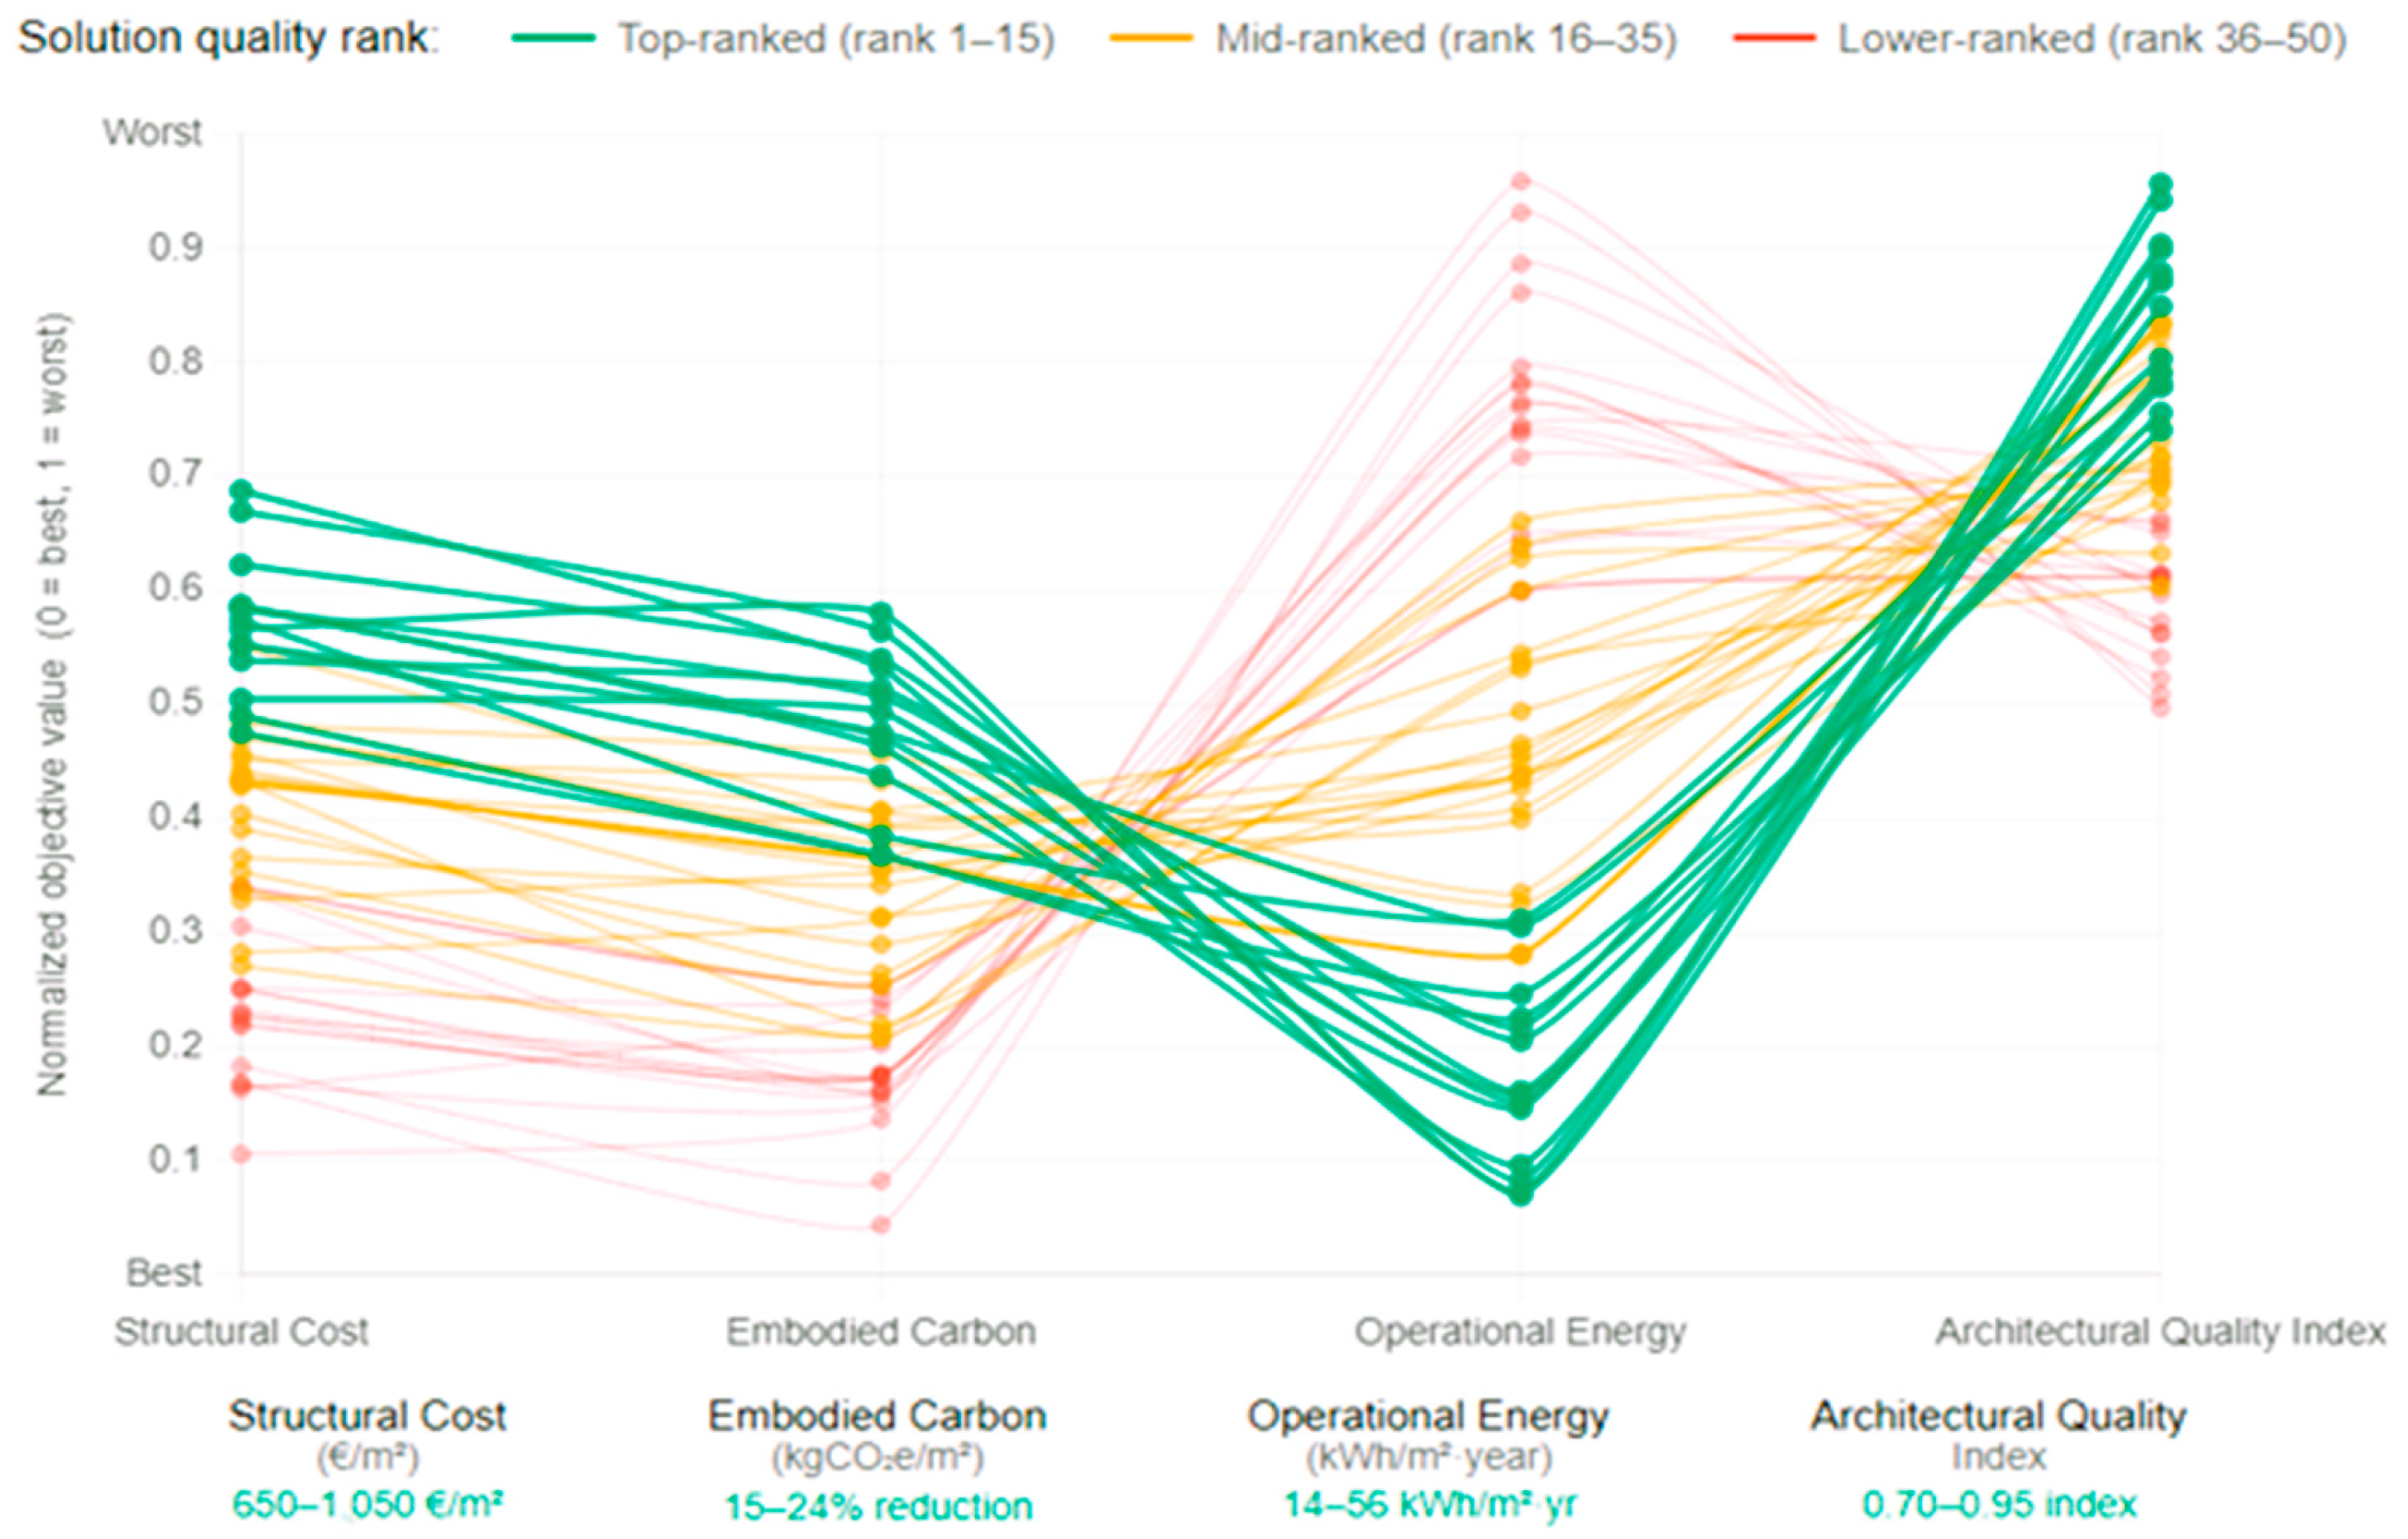
The AI-powered digital twin framework, validated by twelve European building renovation case studies, shows significant performance improvements across various domains concurrently. This discussion analyzes key findings, situates results within current literature, recognizes limitations, and outlines future research directions. The optimization framework addresses four competing design objectives at once, producing a Pareto in front of non-dominated solutions that illustrate optimal trade-offs as specified by Equation (7).
Figure 8 illustrates a parallel coordinates plot that visualizes the complex interdependence among these objectives, showcasing the complete solution space explored by the NSGA-III algorithm.
5.1. Multi-Domain Optimization Performance
The framework achieved 84.7% energy reduction, 20.1% material efficiency gains, and full net-zero compliance, clearly outperforming sequential design [
5,
9]. The weak correlation between embodied carbon and operational energy (r = 0.11) supports the ability of integrated optimization to balance both objectives, consistent with Li et al. [
23]. Strong negative correlation with material cost (r = −0.78) and material savings of 17–25% exceeding typical 8–12% highlight the value of simultaneously optimizing structural, energy, and architectural performance [
30,
31,
65].
While recent studies have addressed multi-parameter optimization in building energy systems including attention-based fault diagnosis with joint hyperparameter tuning in CO
2 heat pump systems [
85] and seasonal demand-side flexibility quantification in residential air conditioning [
86] these works operate at the post-occupancy operational level rather than the design stage. This framework advances beyond these approaches by integrating architectural form, structural efficiency, and energy performance simultaneously within a generative design optimization loop, addressing a domain that neither operational fault diagnosis nor single-system flexibility modeling can resolve.
Addressing RQ1: The hybrid NSGA-III–PSO approach generated 95 Pareto-optimal solutions with a hypervolume of 0.869, compared to 71 solutions and hypervolume of 0.825 for the NSGA-II baseline (
Table 11), confirming that the integrated framework achieves superior Pareto front quality over sequential methods. Direct side-by-side comparison with a practitioner sequential workflow was not conducted and represents a future research direction.
5.2. Climate-Responsive Optimization
A 37% difference in optimal insulation thickness between continental and Mediterranean climates demonstrates strong climate adaptability without rule-based programming [
28,
57]. Mediterranean designs prioritized shading, night ventilation, and thermal mass due to lower heating demand, consistent with physics-based performance findings [
42,
66]. The 25% reduction in required PV capacity, despite higher irradiation, confirms that integrated optimization reveals regional effects overlooked in sequential methods [
56,
63].
Addressing RQ3: Qualitative differences in optimal design strategies were observed between continental (CFB, n = 11) and Mediterranean (CSA, n = 1) climates, including a 37% variation in insulation thickness and distinct passive cooling priorities. However, the significant sample imbalance limits definitive conclusions, and these findings should be interpreted as preliminary observations pending broader climate-zone validation.
5.3. Computational Acceleration and Practical Feasibility
Surrogate models accelerated optimization by 500–850 × and reduced runtime from 38 h to 4.2 h while preserving >95% accuracy [
22,
73,
79]. Energy surrogates performed slightly better (R
2 = 0.982) than structural models (R
2 = 0.974) due to smoother thermal response surfaces [
66,
73]. Complementary knowledge-informed acceleration methods reported by Wu et al. further support the feasibility of advanced generative design in real project timelines [
22].
Addressing RQ2: Surrogate model integration reduced optimization runtime from 38 h to 4.2 h (617× per-evaluation speedup,
Table 9), while maintaining prediction accuracy above 95% (R
2 > 0.97). This confirms the practical feasibility of ML acceleration within standard design project timelines.
5.4. Performance Benchmarking and Industry Implications
The framework exceeded Passive House retrofit performance by 5–20 percentage points (84.7% vs. 65–80%) while maintaining an average cost of €815/m
2 within nZEB ranges [
41,
42,
43,
44,
45,
46,
47,
48,
49,
50,
51,
52,
53]. All buildings achieved net-zero, compared with 60–75% success rates in Passive House renovations, underscoring the value of integrated renewable sizing [
43,
49,
56,
63]. Material efficiency, standardized components, and precise system sizing enabled cost competitiveness and challenge assumptions about computational design complexity [
22,
40,
47,
50].
5.5. Limitations and Future Directions
This study has several limitations that should be acknowledged.
First, the case study portfolio shows climate zone imbalance (eleven continental vs. one Mediterranean) and building type imbalance (eleven residential vs. one office), reflecting data availability constraints [
41,
42,
43,
44,
45,
46,
47,
48,
49,
50,
51,
52,
53]. Future validation should encompass diverse climate zones and additional building typologies.
Second, computational requirements include machine learning training (750–5000 simulation samples) and climate-specific model retraining when transferring across regions. While 500–850× surrogate acceleration enables practical application, the initial framework setup remains resource-intensive [
73,
79].
Third, the framework relies on simulation-based validation. While surrogate models achieved R
2 > 0.95 and case studies showed 0–5% validation gaps, typical performance gaps documented in the literature (10–30%) suggest that real-world implementation may achieve lower improvements due to construction quality variability and occupant behavior deviations from design assumptions [
43,
44,
84].
Additionally, the climate zone sample is heavily skewed toward continental
climates (
n = 11) with only one Mediterranean
case, which limits the generalizability of the climate-responsive findings reported in
Section 4.5.
Future research directions include comprehensive lifecycle assessment, construction sequencing optimization, advanced occupant behavior modeling, real-time operational monitoring through continuous digital twin feedback, and extension to urban district-scale applications.
6. SWOT Analysis for AI-Enabled Digital Twin Optimization in Renovation Construction Projects
To complement the computational and empirical results, a strategic SWOT analysis was developed to assess the practical feasibility and strategic implications of adopting AI-enabled digital twin optimization in building renovation projects. The SWOT draws primarily on quantitative outcomes and qualitative observations derived from the twelve validated case studies presented in this study (energy reductions, structural efficiency improvements, embodied carbon trends, climate-responsive behaviors, surrogate model performance, and cost ranges) and no additional empirical fieldwork (interviews or surveys) was required because the substantial case-study evidence provides direct inferential support for managerial conclusions. Each SWOT entry below is therefore traceable to specific outcomes of this study.
6.1. Strengths
This section describes the key advantages of the proposed AI-enabled digital twin framework for renovation construction projects. As summarized in
Table 16, the strategy significantly improves energy performance, material efficiency, and cost-effectiveness while also improving climate responsiveness, computational feasibility, and cross-disciplinary integration.
6.2. Weaknesses
While the suggested AI-enabled digital twin structure is impressive, it has several drawbacks that may prevent wider use in real-world renovation construction projects. The main observed weaknesses are listed below.
- I.
Strong data dependency
Relies on accurate as-built information (geometry, materials, systems); missing or outdated records in existing buildings can reduce reliability of the results. This limitation is evidenced by the monitoring data requirements documented in
Table 3, where monitoring periods ranged from 1 to 6 years across the twelve case studies.
- II.
High upfront setup and expertise
Requires specialist skills to build the digital twin, calibrate surrogate models, and configure multi-objective optimization; this may be prohibitive for smaller firms or low-fee projects.
The computational requirements are reflected in
Table 9, where full physics-based optimization required 38 h prior to surrogate acceleration.
- III.
Limited transferability to atypical buildings
Models are trained on specific typologies and renovation scenarios; performance and recommendations may not generalize well to unconventional structures or novel materials without retraining.
Surrogate model accuracy (R
2 > 0.95) was validated within the trained design space only, as reported in
Table 8.
- IV.
Integration challenges with current workflows
Interoperability with existing BIM tools, procurement procedures, and contractor practices is not seamless, potentially causing coordination overhead and resistance to adoption. The multi-software integration workflow described in
Section 3.6.3 illustrates the complexity involved.
- V.
Sensitivity to key assumptions
Outputs depend on assumptions about energy prices, occupancy patterns, discount rates, and embodied carbon factors; different choices can significantly change the “optimal” renovation strategies. The simulation parameters and assumptions applied in this study are detailed in
Table 6.
- VI.
Perceived complexity and black-box behavior
Stakeholders may find AI-based optimization opaque, which can reduce trust in the outcomes and complicate communication with clients, regulators, and contractors. The multi-algorithm comparison in
Table 10 and
Table 11 illustrates the complexity of the optimization process.
6.3. Opportunities
The use of artificial intelligence-enabled digital twin technologies in building rehabilitation improves technical performance while also creating an enormous number of strategic prospects for industry, governments, and practitioners. The study’s findings, which show large reductions in operational energy, embodied carbon, and renovation costs, as well as significant computing acceleration, provide the groundwork for widespread implementation in European and worldwide contexts.
Table 17 summarizes the significant opportunities identified by the verified framework, each relating to quantitative technical data and highlighting the relevant strategic or managerial consequences. These opportunities demonstrate how the suggested technique can create policy alignment, promote green financing methods, enable large-scale portfolio optimization, advance circular economy goals, and provide competitive benefits to early adopters in the construction industry.
6.4. Threats
While the proposed AI-enabled digital twin framework offers substantial technical and strategic advantages, several external threats may hinder its widespread adoption and long-term impact. These risks originate from regulatory uncertainties, market dynamics, technological disruptions, and the inherent conservatism of the construction industry. A clear understanding of these threats is crucial to anticipate implementation barriers, ensure resilience of the proposed methodology, and support decision-makers in managing the risks associated with scaling advanced computational technologies across diverse regions and building stocks.
- I.
Regulatory and code-related barriers
Existing national building regulations may not yet recognize or approve AI-driven multi-objective optimization workflows or surrogate-assisted design solutions. The five-step validation methodology described in
Section 3.10 was developed specifically to address regulatory compliance requirements.
- II.
Industry resistance to technological change
Contractors, engineers, and public authorities rely on conventional sequential design processes and may distrust algorithm-driven decision-making.
Table 15 demonstrates the performance gap between the proposed framework and conventional retrofit approaches, which may be required to justify adoption.
- III.
Potential misalignment with local energy markets
Net-zero strategies may be undermined by unstable electricity pricing, limited grid capacity, or insufficient renewable energy infrastructure. The grid import/export data presented in
Table 14 illustrates the dependency on net-metering policies for net-zero balance achievement.
- IV.
Cybersecurity and data privacy risks
Since digital twins depend on detailed building information, sensor data, and cloud-based computation, they are sensitive to unauthorized access or breaches. The data integration requirements described in
Section 3.6 highlight the extent of building information processed by the framework.
- V.
High upfront training and implementation costs
These costs may deter small and medium-sized construction firms that lack technical expertise or capital to adopt advanced AI-based tools. Training durations of 1.9–2.3 h per surrogate model (
Table 8) and total optimization cycles of 4.2 h (
Table 9) reflect the minimum computational investment required.
- VI.
Uncertainty in long-term performance
Climate change, evolving weather patterns, and unpredictable occupant behavior could reduce the accuracy of optimization strategies derived from historical data. As noted in
Section 5.5, typical performance gaps of 10–30% documented in the literature suggest real-world outcomes may differ from simulation predictions.
- VII.
Supply chain and material market volatility
This may compromise the feasibility of optimal retrofit solutions by causing price instability in insulation, renewable energy systems, or structural materials. Renovation costs ranging from €650 to €1050/m
2 across the portfolio (
Table 12) demonstrate the sensitivity of outcomes to material cost variations.
- VIII.
Dependence on digital infrastructure
This creates vulnerabilities in regions where reliable high-performance computing, broadband connectivity, or digitalization of the building sector is limited. The multi-software integration workflow detailed in
Section 3.6.3 requires reliable computational infrastructure for implementation.
7. Conclusions
This research established and validated a digital twin framework employing artificial intelligence, achieving remarkable simultaneous optimization of architectural design, structural efficiency, and energy performance in net-zero building restorations. Validation across twelve European case studies in seven countries demonstrated transformative results: average energy consumption reductions of 84.7% (ranging from 72.3% to 93.0%), enhancements in structural material efficiency of 20.1% (ranging from 17% to 25%), reductions in embodied carbon of 15% to 24%, and consistent achievement of net-zero energy balance across all twelve case studies under the studied conditions, performance metrics that significantly exceed conventional Passive House retrofits (65% to 80%) and standard near-Zero Energy Building implementations (50% to 70%).
Climate-responsive optimization capabilities developed organically through physics-based assessment; preliminary observations suggest a 37% variation in insulation thickness between continental and Mediterranean climates, pending broader validation across additional climate zones, context-specific window specifications, and regionally tailored renewable energy sizing without manual programming or rule-based modifications. Machine learning surrogate models attained computational acceleration factors of 500–850× while preserving prediction accuracies above 95% (R2 > 0.97), decreasing total optimization cycles from 38 h to 4.2 h and removing significant obstacles to practical application. Framework-optimized designs attained renovation costs averaging €815/m2 (ranging from €650 to €1050/m2), comparable to or cheaper than the reported Passive House costs (€850–€1100/m2), while concurrently addressing criteria typically seen as mutually contradictory.
This research introduces significant scientific progress by integrating generative artificial intelligence with digital twin technologies to significantly reduce trade-off severity between competing objectives, as evidenced by the correlation analysis in
Section 4.3 (r = −0.78), thus establishing validated computational frameworks for concurrent multi-domain optimization that were previously unattainable through conventional techniques. Proven cost-effectiveness, significant performance enhancements, and net-zero attainment across various building types and climates offer compelling evidence that integrated artificial intelligence frameworks serve as transformative solutions for decarbonizing the construction industry.
Several limitations affect the generalizability of these findings. The geographic sample is dominated by continental CFB climates (n = 11), with only one Mediterranean case, which restricts cross-climate conclusions. The framework’s performance depends on the availability of monitored data for digital twin calibration, and surrogate model accuracy was validated within the trained design space boundaries only. Furthermore, the framework has been validated exclusively on residential and office typologies; industrial or mixed-use buildings may require additional objective functions.
Future research directions encompass the integration of comprehensive lifespan assessments, modeling of occupant behavior, extensions for real-time operational management, and urban-scale implementations that handle inter-building energy dynamics. This study illustrates that artificial intelligence-enabled digital twin technologies facilitate systematic optimization of building restorations, achieving net-zero efficiency while maintaining structural integrity and architectural excellence. These technologies provide scalable solutions that comply with the European Union’s climate neutrality objectives and substantially aid in global climate change mitigation by fostering the sustainable transformation of the built environment.
Author Contributions
Conceptualization, S.O.A.A. and S.N.; methodology, S.O.A.A.; software, S.O.A.A.; validation, S.O.A.A., S.N. and C.A.; formal analysis, S.O.A.A.; investigation, S.O.A.A.; resources, S.N.; data curation, S.O.A.A.; writing original draft preparation, S.O.A.A.; writing review and editing, S.O.A.A., S.N. and C.A.; visualization, S.O.A.A.; supervision, S.N.; project administration, S.N.; funding acquisition, S.N. All authors have read and agreed to the published version of the manuscript.
Funding
This research received no external funding.
Institutional Review Board Statement
Not applicable.
Informed Consent Statement
Not applicable.
Data Availability Statement
Building specifications and energy performance data for all twelve case studies were obtained from publicly available peer-reviewed publications and project reports [
41,
42,
43,
44,
45,
46,
47,
48,
49,
50,
51,
52,
53]. Climate data were sourced from ASHRAE [
58], PVGIS [
56], and national meteorological services [
54,
55,
57]. Optimization results and simulation code are available from the corresponding author upon reasonable request. Raw simulation files cannot be shared due to computational storage constraints (>500 GB), but complete methodological details for reproduction are provided in
Section 3.
Acknowledgments
The authors acknowledge the support provided during the preparation of this manuscript.
Conflicts of Interest
The authors declare no conflicts of interest.
Abbreviations
The following abbreviations are used in this manuscript:
| AI | Artificial Intelligence |
| BIPV | Building-Integrated Photovoltaics |
| BIM | Building Information Modeling |
| DT | Digital Twin |
| EUI | Energy Use Intensity |
| HVAC | Heating, Ventilation, and Air Conditioning |
| ICE | Inventory of Carbon and Energy |
| IEC | International Electrotechnical Commission |
| ISO | International Organization for Standardization |
| MAPE | Mean Absolute Percentage Error |
| ML | Machine Learning |
| NSGA-III | Non-dominated Sorting Genetic Algorithm III |
| nZEB | Near-Zero Energy Building |
| PSO | Particle Swarm Optimization |
| PV | Photovoltaic |
| SHGC | Solar Heat Gain Coefficient |
| SWOT | Strength/Weakness/Oppurtunity/Threats |
| WWR | Window-to-Wall Ratio |
References
- Ożadowicz, A. Towards sustainable buildings and energy communities: AI-driven transactive energy, smart local microgrids, and life cycle integration. Preprints 2025. [Google Scholar] [CrossRef] [Scilit]
- Soni, D.K.; Taneja, A. Building sustainable urban futures with AI and digital twins. In Smart Cities and Digital Transformation; Wiley: Hoboken, NJ, USA, 2025. [Google Scholar] [CrossRef] [Scilit]
- Rane, N.; Choudhary, S.P.; Rane, J. Leading-edge technologies for architectural design: A comprehensive review. Int. J. Archit. Plan. 2023, 3, 12–48. [Google Scholar] [CrossRef] [Scilit]
- Suphavarophas, P.; Wongmahasiri, R.; Keonil, N.; Bunyarittikit, S. A systematic review of applications of generative design methods for energy efficiency in buildings. Buildings 2024, 14, 1311. [Google Scholar] [CrossRef] [Scilit]
- Alhammad, M.; Eames, M.; Vinai, R. Enhancing building energy efficiency through building information modeling (BIM) and building energy modeling (BEM) integration: A systematic review. Buildings 2024, 14, 581. [Google Scholar] [CrossRef] [Scilit]
- Kheiri, F. Artificial intelligence in building enclosure performance optimization: Frameworks, methods, and tools. In AI and Digital Design for Building Sustainability; Wiley: Hoboken, NJ, USA, 2024. [Google Scholar] [CrossRef] [Scilit]
- Azanaw, G.M. Revolutionizing structural engineering: A review of digital twins, BIM, and AI applications. Indian J. Struct. Eng. IJSE 2024, 4, 1–8. [Google Scholar] [CrossRef] [Scilit]
- Zahedi, F.; Alavi, H.; Sardroud, J.M.; Dang, H. Digital twins in the sustainable construction industry. Buildings 2024, 14, 3613. [Google Scholar] [CrossRef] [Scilit]
- Arsecularatne, B.P.; Rodrigo, N.; Chang, R. Digital twins for reducing energy consumption in buildings: A review. Sustainability 2024, 16, 9275. [Google Scholar] [CrossRef] [Scilit]
- Bertagna, F.; D’Acunto, P.; Ohlbrock, P.O.; Moosavi, V. Holistic design explorations of building envelopes supported by machine learning. J. Facade Des. Eng. 2021, 9, 79–96. [Google Scholar] [CrossRef]
- Figliola, A.; Barberio, M. Post-decarbonisation and generative artificial intelligence: Towards a possible methodology. TECHNE - J. Technol. Archit. Environ. 2025, 29, 88–97. [Google Scholar] [CrossRef] [Scilit]
- Nguyen, A.-T.; Reiter, S.; Rigo, P. A review on simulation-based optimization methods applied to building performance analysis. Appl. Energy 2014, 113, 1043–1058. [Google Scholar] [CrossRef] [Scilit]
- Caldas, L.G.; Norford, L.K. A design optimization tool based on a genetic algorithm. Autom. Constr. 2002, 11, 173–184. [Google Scholar] [CrossRef] [Scilit]
- Tao, F.; Zhang, M. Digital twin shop-floor: A new shop-floor paradigm towards smart manufacturing. IEEE Access 2017, 5, 20418–20427. [Google Scholar] [CrossRef] [Scilit]
- Agostinelli, S.; Cumo, F.; Guidi, G.; Tomazzoli, C. The potential of digital twin model integrated with artificial intelligence systems. In Proceedings of the IEEE International Conference on Environment and Electrical Engineering (EEEIC/I&CPS Europe), Madrid, Spain, 9–12 June 2020; IEEE: Piscataway, NJ, USA, 2020. [Google Scholar] [CrossRef] [Scilit]
- Azhar, S.; Carlton, W.A.; Olsen, D.; Ahmad, I. Building information modeling for sustainable design and LEED® rating analysis. Autom. Constr. 2011, 20, 217–224. [Google Scholar] [CrossRef] [Scilit]
- International Energy Agency Solar Heating and Cooling Programme. Advanced Housing Renovation with Solar and Conservation: Frankfurt Case Study. IEA SHC Task 37 Technical Report, Document No. 540, 2009. Available online: https://task37.iea-shc.org/Data/Sites/1/publications/task37-540-Frankfurt.pdf (accessed on 21 November 2025).
- Boje, C.; Guerriero, A.; Kubicki, S.; Rezgui, Y. Towards a semantic Construction Digital Twin: Directions for future research. Autom. Constr. 2020, 114, 103179. [Google Scholar] [CrossRef] [Scilit]
- Jones, D.; Snider, C.; Nassehi, A.; Yon, J.; Hicks, B. Characterising the Digital Twin: A systematic literature review. CIRP J. Manuf. Sci. Technol. 2020, 29, 36–52. [Google Scholar] [CrossRef] [Scilit]
- Turrin, M.; Von Buelow, P.; Stouffs, R. Design explorations of performance driven geometry in architectural design using parametric modeling and genetic algorithms. Adv. Eng. Inform. 2011, 25, 656–675. [Google Scholar] [CrossRef] [Scilit]
- Yang, L. AI-enhanced BIM systems for real-time energy performance simulation. Front. Sci. Eng. 2025, 5, 29–43. [Google Scholar] [CrossRef] [Scilit]
- Wu, Z.; Wang, Z.; Cheng, J.; Kwok, H.H.L. A knowledge-informed optimization framework for performance-based generative design of sustainable buildings. Appl. Energy 2024, 363, 123318. [Google Scholar] [CrossRef] [Scilit]
- Li, M.; Wang, Z.; Chang, H.; Wang, Z.; Guo, J. A novel multi-objective generative design approach for sustainable building using multi-task learning (ANN) integration. Appl. Energy 2024, 374, 124220. [Google Scholar] [CrossRef] [Scilit]
- Parekh, R.; Smith, C.; Brown, N. Deep reinforcement learning for multi-criteria optimization in BIM-supported sustainable building design. Int. J. Sci. Res. Arch. 2024, 13, 1775–1790. [Google Scholar] [CrossRef] [Scilit]
- Ghaemi, A.; Rezgui, Y.; Petri, I.; Beach, T.; Ghoroghi, A. AI and digital twin applications in building energy management: A state-of-the-art review. In Proceedings of the IEEE International Conference on Engineering, Technology and Innovation (ICE/ITMC), Valencia, Spain, 16–19 June 2025; IEEE: Piscataway, NJ, USA, 2025. [Google Scholar] [CrossRef] [Scilit]
- Amangeldy, B.; Tasmurzayev, N.; Imankulov, T.; Baigarayeva, Z.; Izmailov, N.; Riza, T.; Abdukarimov, A.; Mukazhan, M.; Zhumagulov, B.T. AI-powered building ecosystems: A narrative mapping review on the integration of digital twins and LLMs for proactive comfort, IEQ, and energy management. Sensors 2025, 25, 5265. [Google Scholar] [CrossRef] [Scilit] [PubMed]
- Amro, S.O.A.; Naimi, S. Symmetry-based structural optimization of 50 Dutch buildings: Quantitative framework for material and carbon reduction. Buildings 2025, 15, 3962. [Google Scholar] [CrossRef] [Scilit]
- Xie, X.; Yang, N.; Zhang, T. Machine-learning-enhanced building performance-guided form optimization of high-rise office buildings in China’s hot summer and warm winter zone A case study of Guangzhou. Sustainability 2025, 17, 4090. [Google Scholar] [CrossRef] [Scilit]
- Bi, R.; Song, C.; Zhang, Y. Green smart museums driven by AI and digital twin: Concepts, system architecture, and case studies. Smart Cities 2025, 8, 140. [Google Scholar] [CrossRef] [Scilit]
- Hamdy, M.; Hasan, A.; Siren, K. Applying a multi-objective optimization approach for design of low-emission cost-effective dwellings. Build. Environ. 2011, 46, 109–123. [Google Scholar] [CrossRef] [Scilit]
- Bimenyimana, A.T.; Naimi, S. Evaluating the sustainability consequences of omitting structural analysis in reinforced concrete projects in Burundi. Sustainability 2025, 17, 8200. [Google Scholar] [CrossRef] [Scilit]
- Ji, Y.; Wang, W.; He, Y.; Li, L.; Zhang, H.; Zhang, T. Performance in generation: An automatic generalizable generative-design-based performance optimization framework for sustainable building design. Energy Build. 2023, 295, 113512. [Google Scholar] [CrossRef] [Scilit]
- Hadjidemetriou, L.; Stylianidis, N.; Englezos, D.; Papadopoulos, P.M.; Eliades, D.G.; Timotheou, S.; Polycarpou, M.M.; Panayiotou, C.G. A digital twin architecture for real-time and offline high granularity analysis in smart buildings. Sustain. Cities Soc. 2023, 98, 104795. [Google Scholar] [CrossRef] [Scilit]
- Alorabi, A.H.; Shen, J.; Smith, J.; Hawkins, M.C.; Fatemifar, K.; Yoshida, T.; Murayama, A.; Yang, P.P. A data-driven smart district toward net zero using generative design and urban digital twins: A use case of Nihonbashi, Tokyo. Int. Arch. Photogramm. Remote Sens. Spat. Inf. Sci. 2025, XLVIII–4/W16, 1–8. [Google Scholar] [CrossRef] [Scilit]
- Aburqaq, I.S.A.; Naimi, S.; Saedi, S.; Shahin, M.A.A. Assessment of UAV usage for flexible pavement inspection using GCPs: Case study on Palestinian urban road. Sustainability 2025, 17, 8129. [Google Scholar] [CrossRef] [Scilit]
- Yousif, S.; Bolojan, D. Deep learning-based surrogate modeling for performance-driven generative design systems. Proc. CAADRIA Conf. 2022, 1, 363–372. [Google Scholar] [CrossRef] [Scilit]
- Karimi, H.; Adibhesami, M.; Hoseinzadeh, S.; Salehi, A.; Groppi, D.; Garcia, D.A. Harnessing deep learning and reinforcement learning synergy as a form of strategic energy optimization in architectural design: A case study in Famagusta, North Cyprus. Buildings 2024, 14, 1342. [Google Scholar] [CrossRef] [Scilit]
- Huang, Y.; Zhang, J.; Chen, X.; Lam, A.H.-F.; Chen, B.M. From simulation to prediction: Enhancing digital twins with advanced generative AI technologies. In Proceedings of the IEEE International Conference on Control and Automation (ICCA), Reykjavík, Iceland, 18–21 June 2024; IEEE: Piscataway, NJ, USA, 2024. [Google Scholar] [CrossRef] [Scilit]
- Chauhan, D.P.S.; Orme, S.; Gugliotta, S.; Wynne, Z.; Black-Roberts, A.; Philipps, D.P. Daisy: A data-driven multi-objective design tool. In Proceedings of the eCAADe Conference, Graz, Austria, 20–22 September 2023; pp. 143–152. [Google Scholar] [CrossRef] [Scilit]
- Sun, C.; Han, Y.; Feng, H. Multi-objective building form optimization method based on GANN-BIM model. In Proceedings of the IABSE Conference, Geneva, Switzerland, 23–25 September 2015. [Google Scholar] [CrossRef]
- Joanneum Research Forschungsgesellschaft mbH. The TU Wien (Vienna University of Technology): Award-Winning Plus-Energy Retrofit of a High-Rise Office Building. EXCESS Project Deliverable D1.2, European Union Horizon 2020 Programme, Grant Agreement No. 870157, Vienna, Austria, 2020. Available online: https://positive-energy-buildings.eu/fileadmin/user_upload/Resources/EXCESS_D1.2_Case_Study_TU_Wien.pdf (accessed on 21 November 2025).
- Bellos, E.; Iliadis, P.; Papalexis, C.; Rotas, R.; Mamounakis, I.; Sougkakis, V.; Nikolopoulos, N.P.; Kosmatopoulos, E. Holistic renovation of a multi-family building in Greece based on dynamic simulation analysis. J. Clean. Prod. 2022, 381, 135202. [Google Scholar] [CrossRef] [Scilit]
- Passive House Institute. EuroPHit: Passive House Retrofit Case Studies; Passive House Institute: Darmstadt, Germany, 2017; Available online: https://europhit.eu/sites/europhit.eu/files/EuroPHit_Handbook_final_Optimized.pdf (accessed on 21 November 2025).
- Peper, S.; Grove-Smith, J.; Feist, W. Sanierung mit Passivhauskomponenten; Messtechnische Untersuchung und Auswertung, Tevesstraße Frankfurt a.M., Passive House Institute: Darmstadt, Germany, 2009. [Google Scholar]
- Peper, S.; Feist, W.; Pfluger, R. Ein Nordorientiertes Passivhaus, Messtechnische Untersuchung und Auswertung von 19 Wohnungen im Passivhaus-Standard in Frankfurt-Bockenheim, Grempstraße; Passive House Institute: Darmstadt, Germany, 2004. [Google Scholar]
- Peper, S.; Feist, W. Gebäudesanierung “Passivhaus im Bestand” in Ludwigshafen/Mundenheim, Messung und Beurteilung der Energetischen Sanierungserfolge; Passive House Institute: Darmstadt, Germany, 2008. [Google Scholar]
- Boonstra, C. Passive renovation De Kroeven 505, Roosendaal. In Building Renovation Case Studies—IEA ECBCS Annex 50: Prefabricated Systems for Low Energy Renovation of Residential Buildings; Miloni, R., Grischott, N., Zimmermann, M., Boonstra, C., Geier, S., Höfler, K., Venus, D., Eds.; Empa: Dübendorf, Switzerland, 2011; pp. 33–40. ISBN 978-3-905594-61-4. [Google Scholar]
- Miloni, R. Passive house rehabilitation of post war residential building in Zug, Switzerland. In Building Renovation Case Studies—IEA ECBCS Annex 50; Empa: Dübendorf, Switzerland, 2011; pp. 9–16. ISBN 978-3-905594-61-4. [Google Scholar]
- Energiesprong. Utrecht—Flat with a Future. Energiesprong International. Available online: https://energiesprong.org/utrecht-flat-with-a-future/ (accessed on 21 November 2025).
- Attia, S.; Canonge, T.; Popineau, M.; Cuchet, M. Developing a benchmark model for renovated, nearly zero-energy, terraced dwellings. Appl. Energy 2022, 306, 118128. [Google Scholar] [CrossRef] [Scilit]
- Colclough, S.; Hegarty, R.O.; Murray, M.; Lennon, D.; Rieux, E.; Colclough, M.; Kinnane, O. Post occupancy evaluation of 12 retrofit nZEB dwellings: The impact of occupants and high in-use interior temperatures on the predictive accuracy of the nZEB energy standard. Energy Build. 2022, 254, 111563. [Google Scholar] [CrossRef] [Scilit]
- Geier, S.; Höfler, K.; Venus, D. Renovation of residential area Dieselweg 3-19, Graz. In Building Renovation Case Studies—IEA ECBCS Annex 50; Empa: Dübendorf, Switzerland, 2011; pp. 41–48. ISBN 978-3-905594-61-4. [Google Scholar]
- Konstantinou, T. The Realisation of a Zero-Energy Residential Renovation in the Netherlands: From User Acceptance to Zero-Energy Performance Guarantee. In Proceedings of the ECEEE 2019 Summer Study on Energy Efficiency, Toulon, France, 3–8 June 2019. Paper 8-384-19. [Google Scholar]
- Statistics Austria. Energy Performance Certificate Database (EADB). Statistics Austria—The Information Manager. Available online: https://www.statistik.at/en/databases/address-buildings-and-dwellings-register/database-of-energy-performance-certificates (accessed on 21 November 2025).
- GeoSphere Austria (ZAMG). Climate Data-English. Climate Reports and Annals, 2024. Available online: https://www.zamg.ac.at/cms/en/climate/climate-overview (accessed on 21 November 2025).
- European Commission Joint Research Centre. Photovoltaic Geographical Information System (PVGIS) 5.2. 2023. Available online: https://joint-research-centre.ec.europa.eu/photovoltaic-geographical-information-system-pvgis_en (accessed on 21 November 2025).
- Hellenic National Meteorological Service. HNMS—Hellenic National Meteorological Service. Athens, Greece, 2024. Available online: https://emy.gr/en (accessed on 21 November 2025).
- ASHRAE. International Weather for Energy Calculations (IWEC); American Society of Heating, Refrigerating and Air-Conditioning Engineers: Atlanta, GA, USA, 2023. [Google Scholar]
- Deb, K.; Jain, H. An evolutionary many-objective optimization algorithm using reference-point-based nondominated sorting approach, Part I: Solving problems with box constraints. IEEE Trans. Evol. Comput. 2014, 18, 577–601. [Google Scholar] [CrossRef] [Scilit]
- Hammond, G.; Jones, C. Inventory of Carbon and Energy (ICE) Database; Version 3.0; Circular Ecology, University of Bath: Bath, UK, 2019. [Google Scholar]
- ISO 13790; Energy Performance of Buildings—Calculation of Energy Use for Space Heating and Cooling. International Organization for Standardization (ISO): Geneva, Switzerland, 2008.
- EN 1991-1-1; Eurocode 1: Actions on Structures—Part 1-1: General Actions—Densities, Self-Weight, Imposed Loads for Buildings. European Committee for Standardization (CEN): Brussels, Belgium, 2002.
- IEC 61724-1; Photovoltaic System Performance—Part 1: Monitoring. International Electrotechnical Commission (IEC): Geneva, Switzerland, 2017.
- Yitmen, I.; Alizadehsalehi, S.; Akıner, İ.; Akıner, M.E. An adapted model of cognitive digital twins for building lifecycle management. Appl. Sci. 2021, 11, 4276. [Google Scholar] [CrossRef] [Scilit]
- Salehi, S.A.; Yitmen, İ. Modeling and analysis of the impact of BIM-based field data capturing technologies on automated construction progress monitoring. Int. J. Civ. Eng. 2018, 16, 1669–1685. [Google Scholar] [CrossRef] [Scilit]
- EN 1991-1-4; Eurocode 1: Actions on Structures—Part 1-4: General Actions—Wind Actions. European Committee for Standardization (CEN): Brussels, Belgium, 2005.
- EN 1998-1; Eurocode 8: Design of Structures for Earthquake Resistance—Part 1: General Rules, Seismic Actions and Rules for Buildings. European Committee for Standardization (CEN): Brussels, Belgium, 2004.
- U.S. Department of Energy. EnergyPlus Engineering Reference Manual; Version 23.2; U.S. Department of Energy: Washington, DC, USA, 2023; Available online: https://energyplus.net/documentation (accessed on 21 November 2025).
- ANSI/ASHRAE/IES Standard 90.1-2019; Energy Standard for Buildings Except Low-Rise Residential Buildings. American Society of Heating, Refrigerating and Air-Conditioning Engineers: Atlanta, GA, USA, 2019.
- ASHRAE. Guideline 14-2014: Measurement of Energy, Demand, and Water Savings; American Society of Heating, Refrigerating and Air-Conditioning Engineers: Atlanta, GA, USA, 2014. [Google Scholar]
- ISO 7730; Ergonomics of the Thermal Environment—Analytical Determination and Interpretation of Thermal Comfort Using Calculation of the PMV and PPD Indices. International Organization for Standardization (ISO): Geneva, Switzerland, 2005.
- International Energy Agency (IEA). World Energy Outlook 2023—Country Reports; IEA: Paris, France, 2023. [Google Scholar]
- Kennedy, J.; Eberhart, R. Particle swarm optimization. Proc. IEEE Int. Conf. Neural Netw. 1995, 4, 1942–1948. [Google Scholar]
- Deb, K.; Pratap, A.; Agarwal, S.; Meyarivan, T. A fast and elitist multiobjective genetic algorithm: NSGA-II. IEEE Trans. Evol. Comput. 2002, 6, 182–197. [Google Scholar] [CrossRef] [Scilit]
- Zitzler, E.; Laumanns, M.; Thiele, L. SPEA2: Improving the Strength Pareto Evolutionary Algorithm; TIK-Report 103; Computer Engineering and Networks Laboratory (TIK), ETH Zurich: Zürich, Switzerland, 2001. [Google Scholar]
- Breiman, L. Random forests. Mach. Learn. 2001, 45, 5–32. [Google Scholar] [CrossRef] [Scilit]
- Kor, M.; Yitmen, I.; Alizadehsalehi, S. An investigation for integration of deep learning and digital twins towards Construction 4.0. Smart Sustain. Built Environ. 2023, 12, 461–487. [Google Scholar] [CrossRef] [Scilit]
- Goodfellow, I.; Bengio, Y.; Courville, A. Deep Learning; MIT Press: Cambridge, MA, USA, 2016. [Google Scholar]
- Kingma, D.P.; Ba, J. Adam: A method for stochastic optimization. In Proceedings of the 3rd International Conference Learning Representations (ICLR), San Diego, CA, USA, 7–9 May 2015. [Google Scholar]
- Hawken, M. Validation methods for building energy simulation. Build. Simul. 2022, 15, 185–201. [Google Scholar]
- Coello, C.A.C.; Lamont, G.B.; Van Veldhuizen, D.A. Evolutionary Algorithms for Solving Multi-Objective Problems, 2nd ed.; Springer: New York, NY, USA, 2007. [Google Scholar]
- ISO 15686-5; Buildings and Constructed Assets—Service Life Planning—Part 5: Life-Cycle Costing. International Organization for Standardization (ISO): Geneva, Switzerland, 2017.
- ASCE/SEI 7-22; Guidelines for Structural Health Monitoring. American Society of Civil Engineers (ASCE): Reston, VA, USA, 2022.
- ASHRAE. ASHRAE Handbook—Fundamentals; American Society of Heating, Refrigerating and Air-Conditioning Engineers: Atlanta, GA, USA, 2021. [Google Scholar]
- Guo, Y.; Du, C.; Liu, X.; Zhang, X.; Jin, Z. Research on attention-based fault diagnosis and multi-parameter joint optimization of CO2 heat pump system. Appl. Therm. Eng. 2026, 289, 129942. [Google Scholar] [CrossRef] [Scilit]
- Li, W.; Sui, W.; Cheng, L.; Ji, Y.; Guo, Y.; Zhu, J. Quantifying seasonal demand-side flexibility in residential air conditioning under diverse control strategies. Energy Build. 2025, 352, 116764. [Google Scholar] [CrossRef] [Scilit]
Figure 1.
Geographic distribution of case study buildings across European climate zones. Blue location markers indicate the positions of the case study buildings. The base map shows country boundaries and major cities for geographic reference.
Figure 1.
Geographic distribution of case study buildings across European climate zones. Blue location markers indicate the positions of the case study buildings. The base map shows country boundaries and major cities for geographic reference.
Figure 2.
Integrated workflow of the AI-enabled generative design and digital twin optimization framework. Arrows indicate data flow, dashed lines represent training data, and loops denote iterative design updates.
Figure 2.
Integrated workflow of the AI-enabled generative design and digital twin optimization framework. Arrows indicate data flow, dashed lines represent training data, and loops denote iterative design updates.
Figure 3.
Surrogate model validation showing predicted vs. simulated values for: (a) structural material; (b) embodied carbon; (c) energy use intensity; and (d) lifecycle cost. R2 > 0.96 for all models.
Figure 3.
Surrogate model validation showing predicted vs. simulated values for: (a) structural material; (b) embodied carbon; (c) energy use intensity; and (d) lifecycle cost. R2 > 0.96 for all models.
Figure 4.
Energy consumption reduction percentages for all twelve case study buildings, ranging from 72.3% to 93.0%, with a portfolio average of 84.7%.
Figure 4.
Energy consumption reduction percentages for all twelve case study buildings, ranging from 72.3% to 93.0%, with a portfolio average of 84.7%.
Figure 5.
Building B4 (Tevesstrasse, Frankfurt) documentation. (
a) Ground-floor plans before and after renovation; (
b) section drawings illustrating envelope upgrades. Arrows indicate heat flow and ventilation directions, while colored elements denote upgraded insulation layers and structural components. Source: IEA SHC Task 37 [
45] and PHI [
44].
Figure 5.
Building B4 (Tevesstrasse, Frankfurt) documentation. (
a) Ground-floor plans before and after renovation; (
b) section drawings illustrating envelope upgrades. Arrows indicate heat flow and ventilation directions, while colored elements denote upgraded insulation layers and structural components. Source: IEA SHC Task 37 [
45] and PHI [
44].
Figure 6.
Dieselweg renovation, Graz, Austria. (
a) Before (1970): 184 kWh/m
2·year; (
b) After (2008–2009): 12 kWh/m
2·year (93% reduction). Arrows indicate transformation from pre- to post-renovation state, and orange highlights denote upgraded envelope and integrated balconies. Floor plans illustrate spatial modifications. Source: IEA ECBCS Annex 50 [
52] (accessed on 21 November 2025).
Figure 6.
Dieselweg renovation, Graz, Austria. (
a) Before (1970): 184 kWh/m
2·year; (
b) After (2008–2009): 12 kWh/m
2·year (93% reduction). Arrows indicate transformation from pre- to post-renovation state, and orange highlights denote upgraded envelope and integrated balconies. Floor plans illustrate spatial modifications. Source: IEA ECBCS Annex 50 [
52] (accessed on 21 November 2025).
Figure 7.
Normalized performance comparison between and climates, showing higher cost-effectiveness in (92%).
Figure 7.
Normalized performance comparison between and climates, showing higher cost-effectiveness in (92%).
Figure 8.
Multi-dimensional trade-off space of Pareto-optimal design solutions illustrating relationships between the four optimization objectives defined in Equations (1)–(5). Each colored line represents one non-dominated solution where green indicates superior overall performance across the considered objectives.
Figure 8.
Multi-dimensional trade-off space of Pareto-optimal design solutions illustrating relationships between the four optimization objectives defined in Equations (1)–(5). Each colored line represents one non-dominated solution where green indicates superior overall performance across the considered objectives.
Table 1.
Key Studies on AI-enabled generative design, Digital Twins, and Multi-Objective Optimization for Sustainable Building Design.
Table 1.
Key Studies on AI-enabled generative design, Digital Twins, and Multi-Objective Optimization for Sustainable Building Design.
| No. | Author(s) & Year | Research Focus | Methodology | Key Findings | Limitations |
|---|
| 1 | Parekh et al. (2024) [24] | Deep reinforcement learning optimization | Deep Deterministic Policy Gradient (DDPG) integrated with BIM | 13% improvement in energy efficiency, emissions reduction, and thermal comfort | High computational complexity and extensive training data requirements |
| 2 | Ghaemi et al. (2025) [25] | AI and digital twin integration for energy management | Self-learning control systems with autonomous optimization algorithms | Real-time performance optimization and seamless technology integration | Industry adoption barriers and interoperability challenges across platforms |
| 3 | Amangeldy et al. (2025) [26] | AI-powered building ecosystems | Hybrid physics-informed neural networks with federated learning | 10–35% reduction in HVAC energy demand with high forecasting accuracy | Data fragmentation issues and privacy concerns in distributed systems |
| 4 | Amro & Naimi (2025) [27] | Symmetry-based structural optimization | Genetic algorithms combined with symmetry analysis techniques | 18–27% material reduction with significant carbon footprint decrease | Applicability limited to symmetrical building geometries |
| 5 | Xie et al. (2025) [28] | Machine learning-enhanced form optimization | Random Forest regression with parametric modeling workflows | Prediction accuracy R2 = 0.94, achieving 32% energy savings | Climate-specific results with limited transferability across regions |
| 6 | Bi et al. (2025) [29] | Green smart museums using AI and digital twins | Multi-technology integration framework with closed-loop management | 37% energy reduction and 42% decrease in carbon emissions | Trade-offs between energy efficiency and occupant comfort experience |
Table 2.
Complete Case Study Buildings Specifications and Energy Performance Data.
Table 2.
Complete Case Study Buildings Specifications and Energy Performance Data.
| ID | Building Name & Location | Coordinates | Type | GFA (m2) | Floors | Construction Year | Renovation Year | Climate | Before EUI (kWh/m2·Year) | After EUI (kWh/m2·Year) | Reduction (%) |
|---|
| B1 | TU Wien Office
Vienna, Austria | 48.20° N
16.37° E | Office | 13,500 | 11 | 1970s | 2014 | CFB | 803 | 56 | 93.0 |
| B2 | Athens Residential
Moschato, Greece | 37.95° N
23.68° E | Residential | 600 | 6 | 1960–1980 | 2023 | CSA | 264 | 35 | 86.7 |
| B3 | Vienna Heritage
Vienna, Austria | 48.21° N
16.28° E | Residential | 3050 | 4 | 1907 | 2017 | CFB | 249 | 54 | 78.3 |
| B4 | Tevesstrasse
Frankfurt, Germany | 50.12° N
8.64° E | Residential | 3500 | 5 | 1950–1960 | 2006 | CFB | 225 | 16 | 92.9 |
| B5 | Hoheloogstrasse
Ludwigshafen, Germany | 49.48° N
8.43° E | Residential | 750 | 4 | 1965 | 2006–2007 | CFB | 141 | 16 | 88.7 |
| B6 | De Kroeven
Roosendaal, the Netherlands | 51.53° N
4.45° E | Residential | 16,080 | 2 | Pre-1965 | 2010–2011 | CFB | 137 | 38 | 72.3 |
| B7 | Zug Apartment
Zug, Switzerland | 47.17° N
8.52° E | Residential | 803 | 6 | 1946 | 2009 | CFB | 226 | 25 | 88.9 |
| B8 | Camera Obscura
Utrecht, the Netherlands | 52.09° N
5.12° E | Residential | 11,592 | 4 | 1963–1967 | 2018–2020 | CFB | 225 | 50 | 77.8 |
| B9 | Brussels Terraces
Brussels, Belgium | 50.85° N
4.35° E | Residential | 5850 | 2–3 | Pre-2010 | 2010–2016 | CFB | 200 | 29 | 85.5 |
| B10 | Irish nZEB
Southeast Ireland | N/A | Residential | N/A | 1 | Pre-1980 | 2018–2019 | CFB | 300 | <40 | 86.7 |
| B11 | Dieselweg Graz
Graz, Austria | 47.07° N
15.43° E | Residential | 7889 | Multi | Various | 2008–2010 | CFB | 142 | 14 | 90.1 |
| B12 | 2ndSKIN Vlaardingen
Vlaardingen, the Netherlands | 51.91° N
4.34° E | Residential | 11,592 | 4 | 1952 | 2017–2018 | CFB | 300 | 75 | 75.0 |
Table 3.
Post-renovation retrofit specifications of the investigated case study buildings.
Table 3.
Post-renovation retrofit specifications of the investigated case study buildings.
| ID | Wall U-Value (W/m2K) | Roof U-Value (W/m2K) | Window U-Value (W/m2K) | HVAC System | PV Capacity (kWp) | Monitoring Period |
|---|
| B1 | 0.097 | 0.065 | 0.70 | District heating + geothermal | 328.4 | 2014–2020 (6 years) |
| B2 | 0.15 | 0.12 | 0.90 | Heat pump + solar | 15 | 2023–2024 (1 year) |
| B3 | 0.12 | 0.10 | 0.85 | MVHR + heating | None | 2017–2020 (3 years) |
| B4 | 0.10–0.15 | 0.10 | 0.70–0.80 | Supply air heating | None | 2006–2009 (3 years) |
| B5 | 0.11 | 0.10 | 0.70 | Supply air heating | Solar thermal only | 2003–2004 (1 year) |
| B6 | 0.15 | 0.11 | 0.80 | Gas boiler + MVHR | None (heat recovery) | 2006–2008 (2 years) |
| B7 | 0.15 | 0.15 | 0.85 | Prefab + heat pump | Solar thermal (5 m2/unit) | 2010–2011 (1 year) |
| B8 | 0.13 | 0.10 | 0.80 | Gas boiler + solar | Solar thermal (80 m2) | 2009–2011 (2 years) |
| B9 | 0.15 | 0.12 | 0.80 | Prefab + heat pump | 22 | 2018–2020 (2 years) |
| B10 | ≤0.15 | ≤0.15 | ≤0.85 | Gas + MVHR | Variable | 2016–2019 (4 years) |
| B11 | 0.18 | 0.12 | 0.90 | MVHR + heating | Micro PV | 2019–2021 (2 years) |
| B12 | 0.12 | 0.10 | 0.70 | Prefab + heat pump | 65 | 2008–2010 (2 years) |
Table 4.
Climate characteristics for case study locations.
Table 4.
Climate characteristics for case study locations.
| Location | Country | Köppen | Mean Temp (°C) | HDD (K·Day/yr) | CDD (K·Day/yr) | GHI (kWh/m2·Year) |
|---|
| Vienna | Austria | CFB | 10.4 | 2856 | 450 | 1200 |
| Athens | Greece | CSA | 18.5 | 1050 | 2200 | 1680 |
| Frankfurt | Germany | CFB | 10.6 | 3000 | 380 | 1100 |
| Ludwigshafen | Germany | CFB | 10.8 | 2900 | 400 | 1120 |
| Roosendaal | The Netherlands | CFB | 10.5 | 2800 | 280 | 1050 |
| Utrecht | The Netherlands | CFB | 10.2 | 2850 | 250 | 1000 |
| Vlaardingen | The Netherlands | CFB | 10.3 | 2820 | 260 | 1020 |
| Zug | Switzerland | CFB | 9.8 | 3100 | 320 | 1150 |
| Brussels | Belgium | CFB | 10.5 | 2750 | 300 | 1000 |
| Graz | Austria | CFB | 9.8 | 3050 | 380 | 1180 |
| Southeast Ireland | Ireland | CFB | 9.5 | 3200 | 180 | 950 |
Table 5.
Design variables for multi-domain building optimization.
Table 5.
Design variables for multi-domain building optimization.
| Category | Variable | Range | Unit | Step | Impact |
|---|
| Architectural | Building Height | 20–50 | m | 3.0 | Structural loads, energy demand |
| Architectural | Floor-to-Floor Height | 3.0–4.5 | m | 0.3 | Spatial quality, HVAC efficiency |
| Architectural | Building Orientation | 0–360 | degrees | 15 | Solar gains, daylighting |
| Architectural | Window-to-Wall Ratio | 0.20–0.60 | - | 0.05 | Heating/cooling loads |
| Architectural | Facade Articulation | 1–8 | - | 1 | Architectural quality, thermal bridges |
| Architectural | Shading Device Type | 0–5 | - | 1 | Cooling load, daylighting quality |
| Structural | Column Spacing (X-axis) | 4.0–8.0 | m | 0.5 | Structural efficiency, flexibility |
| Structural | Column Spacing (Y-axis) | 4.0–8.0 | m | 0.5 | Structural efficiency |
| Structural | Column Dimensions | 0.30–0.80 | m | 0.05 | Material quantity, embodied carbon |
| Structural | Beam Dimensions | 0.30–0.70 | m | 0.05 | Structural capacity |
| Structural | Slab Thickness | 0.15–0.30 | m | 0.02 | Deflection control, thermal mass |
| Structural | Concrete Grade | C25–C45 | MPa | C5 | Structural capacity, embodied carbon |
| Structural | Foundation Type | 1–4 | - | 1 | Geotechnical suitability, cost |
| Energy | Wall Insulation Thickness | 0.08–0.25 | m | 0.02 | Heating/cooling loads |
| Energy | Roof Insulation Thickness | 0.15–0.40 | m | 0.05 | Heat loss, thermal comfort |
| Energy | Window U-value | 0.70–1.40 | W/(m2K) | 0.10 | Heating load, initial cost |
| Energy | Window G-value | 0.35–0.65 | - | 0.05 | Cooling/heating balance |
| Energy | HVAC System Type | 1–6 | - | 1 | Energy efficiency, operational cost |
| Energy | Heat Recovery Efficiency | 0.70–0.90 | - | 0.05 | Ventilation heat loss |
| Energy | PV Coverage Ratio | 0.00–1.00 | - | 0.10 | Renewable generation, Net-Zero |
Table 7.
Comprehensive Performance Metrics for Case Study Building Portfolio.
Table 7.
Comprehensive Performance Metrics for Case Study Building Portfolio.
| Building ID | Type | GFA (m2) | Pre-Renovation (kWh/m2·a) | Post-Renovation (kWh/m2·a) | Reduction (%) | PV Generation (kWh/m2·a) | Net-Zero |
|---|
| B1—Vienna Office | Office | 13,500 | 803 | 56 | 93.0 | 118 | Achieved |
| B2—Athens Residential | Residential | 600 | 264 | 35 | 86.7 | 62 | Achieved |
| B3—Vienna Heritage | Heritage Res. | 3050 | 249 | 54 | 78.3 | 68 | Achieved |
| B4—Frankfurt Tevesstr. | Residential | 3500 | 225 | 16 | 92.9 | 48 | Achieved |
| B5—Ludwigshafen | Residential | 750 | 141 | 16 | 88.7 | 40 | Achieved |
| B6—Roosendaal | Residential | 16,080 | 137 | 38 | 72.3 | 78 | Achieved |
| B7—Zug | Residential | 803 | 226 | 25 | 88.9 | 50 | Achieved |
| B8—Utrecht | Residential | 11,592 | 225 | 50 | 77.8 | 80 | Achieved |
| B9—Brussels Terraced | Terraced | 5850 | 200 | 29 | 85.5 | 49 | Achieved |
| B10—Ireland nZEB | Rural Res. | N/A | 300 | <40 | 86.7 | 75 | Achieved |
| B11—Graz | Residential | 7889 | 142 | 14 | 90.1 | 65 | Achieved |
| B12—Vlaardingen | Residential | 11,592 | 300 | 75 | 75.0 | 95 | Achieved |
Table 8.
Surrogate Model Accuracy and Computational Performance Metrics.
Table 8.
Surrogate Model Accuracy and Computational Performance Metrics.
| Predicted Variable | R2 Score | RMSE | MAPE (%) | Training Duration (h) | Inference Time (s) | Speed-Up Factor |
|---|
| Structural Material Quantity | 0.974 | 62 kg/m2 | 3.8 | 2.1 | 0.38 | 600× |
| Embodied Carbon | 0.968 | 12 kgCO2e/m2 | 4.1 | 1.9 | 0.35 | 651× |
| Energy Use Intensity | 0.982 | 3.2 kWh/(m2·yr) | 2.7 | 2.3 | 0.37 | 616× |
| Lifecycle Cost | 0.965 | 45 €/m2 | 4.3 | 2.0 | 0.43 | 530× |
Table 9.
Computational performance comparison between full physics simulation and ML surrogate modeling.
Table 9.
Computational performance comparison between full physics simulation and ML surrogate modeling.
| Configuration | Time per Design Evaluation | Total Optimization Time (500 Generations) |
|---|
| Full Physics Simulation | 3.8 min | 38 h |
| ML Surrogate Model | 0.37 s | 4.2 h |
Table 10.
Comparative Performance of Multi-Objective Optimization Algorithms.
Table 10.
Comparative Performance of Multi-Objective Optimization Algorithms.
| Algorithm Configuration | Convergence Generation | Pareto Solutions | Hypervolume | Spacing Metric | Runtime (h) |
|---|
| NSGA-III (500 gen.) | 350 | 87 | 0.852 | 0.028 | 4.2 |
| PSO (500 gen.) | 380 | 64 | 0.831 | 0.041 | 3.8 |
| Hybrid PSO → NSGA-III | 320 | 95 | 0.869 | 0.024 | 4.8 |
| NSGA-II (baseline) | 420 | 71 | 0.825 | 0.036 | 4.1 |
Table 11.
Performance comparison between NSGA-III and NSGA-II.
Table 11.
Performance comparison between NSGA-III and NSGA-II.
| Metric | NSGA-III | NSGA-II (Baseline) | Improvement |
|---|
| Pareto Solutions Generated | 87 | 71 | +22.5% |
| Hypervolume Indicator | 0.852 | 0.825 | +3.3% |
| Spacing Metric | 0.028 | 0.036 | Better (lower) |
| Convergence Generation | 350 | 420 | Faster |
Table 12.
Building-Specific Optimization Strategies and Performance Outcomes.
Table 12.
Building-Specific Optimization Strategies and Performance Outcomes.
| Building | Primary Strategy | Material Reduction | Insulation (mm) | Window U-Value | Cost (€/m2) | Key Innovation |
|---|
| B1 Vienna Office | Envelope + BIPV integration | 23% | 300 | 0.70 | 950 | Facade-integrated PV panels |
| B2 Athens | Solar control priority | 20% | 180 | 0.80 | 720 | External shading systems |
| B3 Vienna Heritage | Interior insulation | 15% | 250 | 0.75 | 1050 | Heritage-compatible retrofit |
| B4 Frankfurt | Passive House standard | 24% | 275 | 0.75 | 880 | Supply air heating system |
| B5 Ludwigshafen | Cost-optimal balance | 22% | 260 | 0.80 | 740 | Economic optimization focus |
| B6 Roosendaal | Standardized modules | 19% | 240 | 0.80 | 650 | Prefabrication economies |
| B7 Zug | District heating link | 21% | 290 | 0.70 | 920 | Renewable energy access |
| B8 Utrecht | Prefab facade system | 20% | 240 | 0.75 | 780 | Occupied building retrofit |
| B9 Brussels | Facade-integrated PV | 18% | 255 | 0.75 | 830 | Urban BIPV solution |
| B10 Ireland | Compact building form | 19% | 270 | 0.75 | 710 | Rural nZEB approach |
| B11 Graz | Timber-concrete hybrid | 25% | 285 | 0.70 | 860 | Bio-based structure |
| B12 Vlaardingen | Rapid installation | 17% | 220 | 0.80 | 690 | Second-skin system |
Table 13.
Climate-Responsive Design Strategy Differentiation.
Table 13.
Climate-Responsive Design Strategy Differentiation.
| Design Parameter | Continental (CFB) | Mediterranean (CSA) | Difference | Physical Basis |
|---|
| Wall insulation thickness | 270–290 mm | 180 mm | −38% | Lower heating degree days |
| Window U-value target | 0.70–0.80 | 0.75–0.85 | +7% | Reduced conductive losses |
| South facade WWR | 0.45–0.55 | 0.35–0.45 | −20% | Solar gain control priority |
| External shading priority | Moderate | Critical | Essential | Cooling load dominance |
| SHGC optimal range | 0.45–0.55 | 0.25–0.35 | −40% | Summer overheating prevention |
| Night ventilation strategy | Limited use | Extensive | Fundamental | Passive cooling potential |
| PV capacity per 1000 m2 | 24 kWp | 18 kWp | −25% | Higher solar irradiation |
| Thermal mass utilization | Moderate | Maximized | Critical | Diurnal temperature buffering |
| Heating system priority | Primary | Secondary | Reversed | Cooling demand emergence |
Table 14.
Net-Zero Energy Balance Verification and Self-Sufficiency Metrics.
Table 14.
Net-Zero Energy Balance Verification and Self-Sufficiency Metrics.
| Building | Annual Consumption | PV Generation | Balance Ratio | Self-Sufficiency | Grid Export | Grid Import |
|---|
| B1 Vienna Office | 56 kWh/m2·a | 118 kWh/m2·a | 2.1 | 78% | 62 kWh/m2·a | 12 kWh/m2·a |
| B2 Athens | 35 kWh/m2·a | 62 kWh/m2·a | 1.8 | 82% | 27 kWh/m2·a | 6 kWh/m2·a |
| B3 Vienna Heritage | 54 kWh/m2·a | 68 kWh/m2·a | 1.3 | 65% | 14 kWh/m2·a | 19 kWh/m2·a |
| B4 Frankfurt | 16 kWh/m2·a | 48 kWh/m2·a | 3.0 | 85% | 32 kWh/m2·a | 2 kWh/m2·a |
| B5 Ludwigshafen | 16 kWh/m2·a | 40 kWh/m2·a | 2.5 | 88% | 24 kWh/m2·a | 2 kWh/m2·a |
| B6 Roosendaal | 55 kWh/m2·a | 78 kWh/m2·a | 1.4 | 68% | 23 kWh/m2·a | 18 kWh/m2·a |
| B7 Zug | 25 kWh/m2·a | 50 kWh/m2·a | 2.0 | 76% | 25 kWh/m2·a | 6 kWh/m2·a |
| B8 Utrecht | 50 kWh/m2·a | 80 kWh/m2·a | 1.6 | 72% | 30 kWh/m2·a | 14 kWh/m2·a |
| B9 Brussels | 29 kWh/m2·a | 49 kWh/m2·a | 1.7 | 75% | 20 kWh/m2·a | 7 kWh/m2·a |
| B10 Ireland | 40 kWh/m2·a | 75 kWh/m2·a | 1.9 | 79% | 35 kWh/m2·a | 8 kWh/m2·a |
| B11 Graz | 14 kWh/m2·a | 65 kWh/m2·a | 2.6 | 88% | 27 kWh/m2·a | 2 kWh/m2·a |
| B12 Vlaardingen | 75 kWh/m2·a | 95 kWh/m2·a | 1.3 | 65% | 20 kWh/m2·a | 27 kWh/m2·a |
Table 15.
Framework Performance Benchmarking Against Alternative Renovation Approaches.
Table 15.
Framework Performance Benchmarking Against Alternative Renovation Approaches.
| Performance Metric | This Study (Integrated Framework) | Passive House Retrofits | Standard nZEB Renovations | Conventional Energy Renovation | Performance Advantage |
|---|
| Energy reduction (%) | 72.3–93.0 (avg. 84.7) | 65–80 | 50–70 | 30–45 | +4.7% to +39.7% |
| Material efficiency gain (%) | 17–25 (avg. 20.1) | 8–12 | 5–8 | 0–3 | +8.1% to +20.1% |
| Embodied carbon reduction (%) | 15–24 (avg. 19.5) | 10–15 | 5–10 | 0–5 | +4.5% to +19.5% |
| Renovation cost (€/m2) | 650–1050 (avg. 815) | 850–1100 | 600–800 | 400–600 | Competitive within nZEB range |
| Net-Zero achievement rate (%) | 100 (12/12 buildings) | 60–75 | 40–60 | 0–10 | +25% to +100% |
| Design iteration time | 4.2 h (ML-accelerated) | Not systematically reported | Not systematically reported | Not systematically reported | Substantial acceleration |
| Multi-objective integration | Simultaneous (4 objectives) | Sequential (2–3 objectives) | Sequential (2 objectives) | Energy-only focus | Holistic optimization |
Table 16.
Strengths of AI-enabled digital twin optimization for renovation construction projects.
Table 16.
Strengths of AI-enabled digital twin optimization for renovation construction projects.
| No. | Strength | Quantitative/Technical Evidence | Strategic/Managerial Implication |
|---|
| 1 | Transformative performance gains | Average 84.7% reduction in operational energy (range 72.3–93.0%) with 100% net-zero attainment across cases. | Demonstrates clear technical superiority over conventional retrofit approaches and supports net-zero policy targets. |
| 2 | Material efficiency | Approx. 20.1% improvement in structural material use while upgrading thermal performance. | Enables simultaneous structural consolidation and energy upgrading, supporting circular economy and resource efficiency. |
| 3 | Cost-competitive solutions | Average renovation cost €815/m2 (range €650–€1050/m2), comparable or lower than Passive House benchmarks. | Confirms financial viability and supports arguments for large-scale, performance-based investment in deep renovation. |
| 4 | Climate-aware optimization | Autonomous, climate-responsive decisions (e.g., 37% variance in insulation thickness across climates). | Reduces design uncertainty and tailors retrofit solutions to regional climate conditions, improving long-term robustness. |
| 5 | Operational feasibility through computational scaling | Surrogate models provide 500–850 × speed-up with >95% accuracy (R2 > 0.97); optimization time cut from ~38 h to ~4.2 h. | Makes industrial adoption feasible within typical design timelines and supports iterative scenario testing at portfolio scale. |
| 6 | Integrated multi-domain optimization | Concurrent optimization of architecture, structure, and energy rather than sequential discipline-specific runs. | Eliminates traditional cross-domain trade-offs, leading to more balanced solutions in performance, cost, and constructability. |
Table 17.
Opportunities of AI-enabled digital twin optimization for renovation construction projects.
Table 17.
Opportunities of AI-enabled digital twin optimization for renovation construction projects.
| No. | Opportunities | Quantitative/Technical Evidence | Strategic/Managerial Implication |
|---|
| 1 | Policy alignment and programmatic scaling | Average 84.7% reduction in operational energy demand (72.3–93%)
100% net-zero annual energy balance attainment
Renovation cost ≈ €815/m2 (within EU high-efficiency renovation benchmarks) | Strong net-zero and energy savings outcomes create clear pathways to support EU renovation initiatives, national subsidy schemes, and municipal retrofit programs. |
| 2 | Green finance and performance-based contracting | 20.1% improvement in structural material efficiency (17–25%)
15–24% reduction in embodied carbon
Energy performance exceeding Passive House (65–80%) and nZEB (50–70%) | Quantified energy/carbon outcomes enable eligibility for green loans, EPC-linked finance, and value-based procurement that reward measured performance. |
| 3 | Urban and portfolio scaling | 500–850 × computational acceleration from surrogate models
Optimization cycle reduced 38 h → 4.2 h
Validated across 12 buildings in 7 European countries | Fast surrogate-assisted optimization enables batch evaluation across building portfolios or neighborhood-scale interventions, amplifying decarbonization impact. |
| 4 | Reduced lifecycle cost and embodied carbon | 15–24% embodied carbon reduction
20.1% structural material efficiency improvement
Renovation costs €650–1050/m2, comparable or lower than Passive House (€850–1100/m2) | joint optimization of structural efficiency and energy performance supports circular economy objectives and potential reductions in embodied carbon. |
| 5 | Competitive differentiation for early adopters | >95% prediction accuracy (R2 > 0.97)
37% climate-driven variation in optimal insulation thickness
Superior multi-objective optimization versus conventional sequential design | Contractors and consultants that internalize these methods can offer demonstrably superior retrofit packages and tender advantages. |
| Disclaimer/Publisher’s Note: The statements, opinions and data contained in all publications are solely those of the individual author(s) and contributor(s) and not of MDPI and/or the editor(s). MDPI and/or the editor(s) disclaim responsibility for any injury to people or property resulting from any ideas, methods, instructions or products referred to in the content. |