Abstract
While the debate on global and national carbon emission targets has dominated every major climate change conference, setting firm-level climate change mitigation targets has become an increasingly important issue. In this paper we present illustrative evidence on cross-country and cross-industry differences of the firm-level mitigation targets among some of the largest corporations in the European Union (EU) and the United States (US) with regard to five aspects, i.e., target adoption, target metric, target scope, target stringency, and target completion. We find that overall 25% of the firms have not set up emission targets. The EU firms are significantly more likely to use intensity targets than the US firms. The EU firms are twice as likely as the US firms to incorporate indirect emissions from the supply chain into the scope of their targets. The Energy and Materials sectors in the EU set significantly more stringent targets than their US counterparts. The energy sectors of the EU and the US in general have not made satisfactory progress toward accomplishment of the targets. Based on these findings, we discuss the most pressing issues that should be addressed by policymakers and firm managers in different regions and sectors with regard to target-setting.
1. Introduction
Climate change has been recognized as one of the greatest challenges for human society. In order to keep the average global temperature increase to no more than 2 °C or even 1.5 °C above pre-industrial levels, an objective set forth by the 2015 United Nations Climate Change Conference in Paris (COP21) [1], we have to limit the emissions of greenhouse gases (GHGs). A critical step to control GHG emissions is to set appropriate GHG emission mitigation targets. Target-setting has always been the most important and contentious issue at every major convention on climate change. A great amount of theoretical and empirical studies have been conducted to investigate the global, national and regional GHG mitigation target-setting problems [2,3,4]. However, in practice, striking a global, national or regional agreement to limit GHG emissions is normally a slow and difficult procedure [5].
From the economics perspective, the “first-best” solution to the problem of climate change is to impose a uniform price on carbon emissions through policy instruments like carbon tax [6,7]. In this first-best solution, voluntary actions by firms would not be needed. In reality, though, the feasibility of the first-best solution is severely undermined by many real-world complications, such as the conflicting interests of different countries and organizations. Indeed, many countries do not price carbon as of today [8,9]. In face of the predicament of the first-best solution in coping with climate change, we need to take a polycentric approach with many voluntary actions [10]. There is a growing argument among policymakers and researchers that firms, through voluntary actions, may play a more proactive and significant role in tackling climate change [5,11,12]. Voluntary action from firms is a critical element of the polycentric approach. For firms, voluntary target-setting is usually one of the initial steps and precedes the implementation of more specific mitigation initiatives [13,14]. Moreover, various voluntary environmental management certification programs (e.g., ISO 14001) have been set up to promote and guide environmental actions for firms, and target-setting is usually an integral part in the implementation of such programs. Target-setting for firms can serve multiple important purposes, including being the motivator for carbon abatement action, the indicator of mitigation commitments, the guideline to choose appropriate actions, and the standard to judge the progress of actions. Therefore, investigating firm-level target-setting is a critical research issue.
In this paper, we investigate the firm-level target-setting policies among the major firms in the European Union (EU) and the United States (US). The EU and the US are among the three largest national/regional GHG emitters in the world [15], emitting 4419 and 6870 million metric tons of CO2 equivalents respectively as of year 2014 [16,17]. Due to the importance of the two regions in international environmental politics [18], a great deal of research has been devoted to the EU and the US on issues related to climate change, including policy design, public opinion, and media coverage [19,20,21]. Compared to the US, the EU has adopted more advanced policies for climate change mitigation. The EU ratified the Kyoto Protocol, the first binding international agreement on GHG mitigation, in 2002. In 2008, the EU committed to reduce GHG emissions by at least 20% below the 1990 level. In compliance with the Kyoto Protocol and commitments, the EU Emissions Trading System (EU ETS) has been set up and remained operational since January 2005. The EU ETS is the biggest carbon market in the world, covering heavy emitting facilities from all EU members [22]. The US, although signing the Kyoto Protocol in 1998, did not ratify it. At the federal level in the US, regulations to directly control the quantity of GHG emissions never existed, are not available right now, and are not likely to be there in the near future [23]. The most notable federal policy is the Greenhouse Gas Reporting Program (GHGRP) of the US Environmental Protection Agency (EPA), a mandatory emission reporting program for facilities emitting more than 25,000 metric tons of CO2 equivalent per year [24]. There are advanced regulations enacted at the state level. Most notably, the Regional Greenhouse Gas Initiative (RGGI), a cap-and-trade system covering the electricity generators among ten northeastern states, launched trading operations in 2009. California initiated its statewide cap-and-trade system in 2012 [23]. The comparative studies on the firm-level responses to climate change in the EU and the US have been less common but have started to proliferate recently. In specific sectors (e.g., oil, electricity, retailing), the EU firms have been found to be more proactive than the US firms in responding to climate change [25,26,27,28].
Through this study, we aim to provide a comparative cross-country and cross-sector perspective on target-setting policies of some of the biggest firms in the EU and the US. We are interested in addressing the following questions. How common are targets set by firms in different regions and industrial sectors? What are the characteristics of the targets? How likely are firms to achieve the targets? To answer the aforementioned questions, we examine the targets from the following five aspects: adoption, metric, scope, stringency, and completion. The target adoption is a binary variable indicating whether a firm has set up an emission target. The target metric refers to either absolute target or intensity target, both of which have been widely adopted by firms in practice. The absolute target sets a cap on the GHG emissions of a firm, regardless of the amount of output of the firm. The intensity target puts a limit on the emissions per unit of output of a firm. Since the intensity target can tie total emissions to economic activities, it has been argued that at the country-level the intensity target provides a more flexible governing framework to accommodate economic growth than the absolute target [3]. The scope of the target specifies the breadth of emissions covered by the target. A firm’s scope 1 emissions refer to all emissions generated directly by sources controlled or owned by the firm itself. A firm’s scope 2 emissions arise indirectly from the generation of electricity, heat, and steam consumed or purchased by the firm. A firm’s scope 3 emissions cover all emissions generated by the firm’s activities from sources not owned or controlled by the firm itself, except the scope 2 emissions. In other words, scope 3 emissions refer to indirect emissions upstream and downstream in a firm’s supply chain [29]. A firm’s emission target can cover emissions from any of the three scopes. The target stringency refers to the magnitude of emission mitigation as specified by the target. A deeper emission cut from the reference year generally implies, ceteris paribus, a harder task for the firm to reach the target. Literature has shown that target stringency can positively and significantly impact the emission reduction in some sectors [30]. Therefore, stringency is an important attribute to track. Stringency does not reflect the whole picture of the effectiveness of the targets. We also introduce the target completion variable, which measures the progress toward the achievement of targets.
Our study draws on a sample of 989 firms in the EU and the US. The sample is extracted and constructed from the Carbon Disclosure Project (CDP: http://www.cdp.net), a non-profit organization based in London that maintains the currently largest database of firm-level climate change performance and policies. To the best of our knowledge, the CDP provides the most comprehensive and detailed data on firms’ internal carbon management activities of the major firms around the world. The firms in the sample are typically among the largest and most notable ones in each country. This distinguishes our study from research on small and medium-sized firms, which display significant difference in engagement with the climate change problem compared to the large firms [31].
Our study provides illustrative evidence on the use of emission targets among some of the most notable and largest firms in the EU and the US. We find that around 75% of the firms in the sample have established emission targets, and the EU and the US display little difference in overall target adoption. More than 50% of the EU firms have adopted targets based on intensity measures, and the fraction is significantly higher than the US firms. Firms in the EU and the US have similar adoption rates for scope 1 and scope 2 targets. But the EU firms are twice as likely to integrate scope 3 emissions into the targets as firms in the US. This shows that the EU firms pay more attention to emissions along the supply chain. We also delve into the analysis of targets across a spectrum of industrial sectors. The Energy and Materials sectors in the EU set significantly more stringent targets than the US firms. The Energy sector is relatively slow in accomplishing the target. The difference between the two regions can be caused by regulatory, economic and operational reasons.
The remainder of this study is organized as follows. Section 2 provides a brief review of related literature. Section 3 describes the data and the methods used in the study. Section 4 presents the results. We further discuss the significance and implications of the results in Section 5. Section 6 concludes with future research directions.
2. Literature Review
Our research is related to the broad category of literature on the firm-level environment and climate change management strategy. While national governments and regional organizations have traditionally been active players in responding to climate change risks, a burgeoning trend is that firms start to actively participate in climate change management. Prior literature has argued that firm-level climate strategies will be a key driving force toward a low-carbon future [32,33]. Further, empirical results point out that there is a growing willingness among business leaders to make bold investments on climate change mitigations [34], due to mounting consumer and investor pressures, regulatory requirements and increasing perceptions of opportunities associated with climate change. Indeed, empirical evidence has shown a spectrum of climate strategies employed by firms, including the voluntary disclosure of carbon footprints, the introduction of eco-design, the use of low-carbon energy, and the improvement of energy efficiency [35,36,37,38].
Despite the abundance of studies on firm-level climate strategies, target-setting, as a critical precondition to mitigation actions, has not received sufficient attention in the past. However, recently, there has appeared an emerging and rapidly growing stream of research on firm-level emission target-setting, including the development of target-setting methodology, the characterization of target-setting behaviors, and the motivations behind target-setting. Prior literature has used the CDP survey data in 2002 to analyze the corporate climate strategies of a broad sample of large multinational firms, and found that the target-setting process displayed great variations among firms in different sectors and more than half of the respondents had targets to reduce or stabilize the direct GHG emission [32]. There are also studies on the efficacy and reliability of firm-level emission target-setting as a response to climate change among the major supermarkets in the United Kingdom (UK) [39,40]. These studies found that the voluntary targets set by firms not only aligned with the goals of national governments, but also had a high likelihood of being achieved. Through content and data analysis of sustainability reports voluntarily published by firms and CDP responses, [25] compared the target-setting behaviors of representative UK and US retailers, and found that UK retailers were more prone than their US counterparts to setting ambitious emission reduction targets and addressing emissions along the supply chains. Researchers suggested that setting firm-level emission targets would be a critical step in attaining national and global climate goals, and proposed a methodology to derive the firm-level targets [5]. The target-setting procedure of firms has also been analyzed in detail under specific energy management and carbon accounting schemes [41]. The study argued that the target-setting process should be improved to incorporate well-defined criteria and complete conformity checks. Also, the link between target-setting and emission reduction has been examined based on CDP data of 2009–2010 [30]. Significantly positive associations were identified between target adoption and emission reduction for non-financial sectors, and between target stringency and emission reduction for dirty sectors and sectors under the EU ETS.
3. Data and Methods
The main data used in this study is provided by the CDP database. The CDP collects the data through an annual survey sent to major corporations worldwide at the end of each calendar year. The survey is very detailed, with more than 100 questions covering topics like management attitude toward climate change, incentive policy for carbon abatement, GHG emission level, and abatement activities implemented. For each question, CDP also provides very detailed reporting guidance on the answer, such as the type of information to be included and the format to be used.
Our sample consists of 989 firms extracted from the CDP 2013 survey. The data includes 598 firms in the EU (219 in the UK, 69 in France, and 68 in Germany among others) and 391 firms in the US. Almost all of the firms in the sample have been listed in one major stock index, such as FTSE 500, Global 500, S & P 500, and Russell 1000. The few exceptions are representative private companies, such as Cargill and Levi Strauss & Co. in the US, and British Airways in UK. To facilitate the analysis, the firms are further divided into 24 industry groups based on the Global Industry Classification Standard (GICS). The dataset is enclosed in supplementary materials.
We derive the relevant target-setting variables from the CDP survey data. Target adoption, target metric and target scope can be extracted from the survey directly. Target stringency is indicative of how difficult it is for a firm to accomplish the target. We define target stringency as the percentage reduction of emissions from the reference year in the target. We note that this definition has its limitations, since targeted percentage reduction from the reference year may not exactly reflect the efforts that a firm needs to make in order to achieve the target. For instance, other factors may also play a role in determining the difficulty of the target, including the choice of the base year, the time horizon of the target, and characteristics of the firm itself. However, as pointed out by previous literature [42], “the actual level of effort required to meet a given target may be difficult to measure.” Therefore, we use the percentage reduction as a proxy for target stringency. We note that this proxy is also used in existing literature [43].
While target stringency is an important indicator of a firm’s commitment to climate change, it remains unclear whether the firms have indeed made sufficient efforts to achieve the targets. Therefore, we need a measure to assess how well the firms have achieved the targets. To this end, we define target completion as the progress of the target scaled by the elapsed time since the establishment of the target. For instance, if the targeted mitigation has been achieved by 20% while time has elapsed by 25%, the target completion is 20%/25% = 0.8. The number shows whether the progress toward the target is on time or not. If target completion is less than 1, it means the progress is slower than elapse of time and the target will not be attained at the current pace of emission reduction. If target completion is greater than 1, it means that the firm may overachieve the target at the current reduction rate. We understand that mitigation does not happen at a homogeneous rate over time and the measure of target completion may be biased for some firms. For instance, it may take longer to initiate and build some carbon management programs so the mitigation may well happen at a later point in the target time horizon. However, it is impossible to gauge the exact target completion without detailed information of the mitigation actions and we have to approximate it with the aforementioned method.
Finally, in all computations, data entries with missing values have been ignored. It is also noteworthy that a mitigation target usually spans multiple years and consequently, features like target adoption, metric, scope and stringency, are unlikely to change frequently. The annual CDP survey yields a snapshot of the target-setting activities at a specific time point. In this study we focus on the 2013 survey data, which is the most recent data we obtained.
Similar to prior studies on firm-level target-setting [25,41], we examine the variables via content and data analysis. Various statistical methods are employed to analyze the difference between the EU firms and the US firms, including the nonparametric Wilcoxon rank sum test, the two-proportion z-test, and the t-test. The results are summarized in the next section.
4. Results
In this section we present the empirical evidence on five aspects of targets, i.e., adoption, metric, scope, stringency, and completion. For each aspect, we discuss the most remarkable distinctions between the EU and the US in both the overall pattern of target use and pattern in specific sectors.
4.1. Target Adoption and Target Metric
Table 1 shows the adoption of the emission targets in the two regions and the comparison based on two-proportion z-test. Overall, 748 of the 989 firms in sample have some emission targets in place, representing about three quarters of the sample. Among them, 317 firms have adopted intensity targets only, 249 firms have absolute targets only, and 182 firms have employed both absolute and intensity targets. The fraction of firms with targets is slightly higher for the EU firms (76.76%) than the US firms (73.91%), and the difference is insignificant. The relatively small gap between the EU and the US firms in target adoption rate indicates that firms in both regions display roughly the same degree of prevalence of emission targets. Since governmental pressures on US firms to take mitigation actions has been relatively weak in the past [26], the high adoption rate of mitigation targets in US may reflect pressures from other entities such as investors and consumers. Both regions have far greater adoption rates than the 51% record of year 2002 in early study [33]. With regard to target metric, the EU firms have a relatively higher fraction of using absolute and intensity targets jointly (21.74%) than the US firms (13.30%). The z-test shows the difference is strongly significant (p < 0.001). Furthermore, the EU firms are significantly more likely to employ intensity target than the US firms (p < 0.001), while the adoption rates of absolute target are roughly the same.

Table 1.
Distribution of targets in the EU and the US.
Table 2 presents the distribution of target metrics by industrial sectors. We rank the sectors based on adoption rate in the EU from high to low. In the EU, Semiconductors & Semiconductor Equipment, Diversified Financials, Consumer Durables & Apparel are the three sectors with the lowest target adoption rates (50.00%, 52.17%, and 54.17%, respectively), and all other sectors have adoption rates higher than 60%. In the US, Food & Staples Retailing, Software & Services, and Semiconductors & Semiconductor Equipment are the three sectors with the lowest target adoption rates (37.50%, 54.55%, and 56.25% respectively), and all other sectors have adoption rates higher than 60%. The pattern of target-setting across the sectors can be attributed to operational and regulatory factors pertaining to specific sectors. Sectors that are less carbon-intensive in operations (e.g., Diversified Financials, Consumer Durables & Apparel, Food & Staples Retailing, and Software & Services) are less likely to be threatened by regulatory and market pressures [44]. Since regulatory and market risks are instrumental in driving environmental practices [44,45], it can be expected that less carbon-intensive sectors lag behind in using emission targets. As to the semiconductor sector, most companies in the sample are design companies at the upstream of the semiconductor value chain. These design companies typically operate on the fabless business model to concentrate on research and development, by outsourcing the energy-intensive production to fabrication plants owned by other foundry companies in East Asia [46,47]. Consequently, semiconductor companies in the EU and the US are not significant contributors of direct GHG emissions.
Table 2.
Target adoption and metric by industrial sector.
It is also noteworthy that the Energy sector, as a heavy emitter of GHG, has a relatively low target adoption rate in both the EU and the US (63.64% and 62.50%), which reflects insufficient commitments from the energy firms. A high fraction of firms in the Utilities sectors of the EU (94.12%) have set emission targets, far above the adoption rate in the US (74.07%). The finding is in line with literature that indicates the EU utility firms are more progressive than their US counterparts in managing climate-related risk [48]. The utility firms in the EU are typically subject to EU ETS, under which participating firms have to acquire and submit emission allowances for GHG emissions they generate. In the US, utilities firms are free from cap-and-trade regulations except for those with operating facilities under regional programs, such as the RGGI in the northeast.
Notably, all firms in the Household & Personal Products sector have adopted emission targets in both the EU and the US. The Food, Beverage & Tobacco sector also has high target adoption rates (85.71% and 95.83%). Firms in these two sectors produce the final goods (e.g., cosmetics, food products, drinks) and hence are in closer contact with consumers than firms in the upstream value chain. Decreasing consumer demand for carbon-intensive products has been argued to be one of the primary risks for firms [44], and firms in closer contact with consumers naturally bear greater pressure from the consumers to improve environmental friendliness. Indeed, the literature has shown that being a final goods producer has a significant and positive effect on environmental practices [45]. Similarly, these firms show a great tendency to adopt emission targets. We also find that the preference for absolute or intensity target can be quite different in some sectors for the EU and the US firms. The Food & Staples Retailing and Utilities sectors in the EU employ significantly more intensity targets than their US counterparts (p < 0.01). The Transportation sector in the EU uses significantly more absolute targets than that in the US (p < 0.01).
4.2. Target Scope
The scopes of the targets reflect the focus of the mitigation actions along the firms’ value chains. The scope 1 emissions refer to all emissions generated directly by sources controlled or owned by the firm itself. The scope 2 emissions arise indirectly from the generation of electricity, heat, and steam consumed or purchased by the firm. The scope 3 emissions refer to indirect emissions upstream and downstream in a firm’s supply chain. Table 3 shows the distribution of target scopes by sectors, ranked based on scope 1 target in the EU from high to low. Overall and in most of the sectors, the adoption rates of scope 1 and scope 2 targets do not differ much. Scope 3 targets are much less common, with 250 of the 989 corporations using them. As pointed out in [29], “although scope 3 emissions are widely known to be important, they are rarely estimated because they are not well understood, and there is little motivation or technical capacity to do so in current carbon footprint protocols”. Moreover, scope 3 emissions are not subject to any direct regulatory measures such as the cap-and-trade scheme, so firms lack incentive to control them.
Table 3.
Target scope by industrial sectors.
It is worth noting that while the fractions of targets covering scope 1 and scope 2 emissions do not vary much for the EU and the US, the percentage of the EU firms with target on scope 3 emissions (30.77%) is almost twice that in the US (16.88%) and the difference is strongly significant (p < 0.001). This result is not only in line with but also greatly extends the finding in [25], which reports that the US retailers fall behind their UK counterparts in addressing supply chain emissions. In Table 3, the EU firms have higher scope 3 target adoption rates than the US firms in all but two sectors (i.e., Automobiles & Components, and Food, Beverage & Tobacco), and the differences in these two sectors are rather small. The higher adoption rate of scope 3 targets in the EU reflects the more proactive stance of the EU firms on carbon mitigation beyond their own boundaries in the supply chain.
The Utilities sector in the EU has a far greater adoption rate of scope 1 targets (94.12%) than the US (66.67%). This is not that surprising, given that the EU utilities are usually governed by EU ETS [48], while there are no similar cap-and-trade schemes in the US except for sub-national ones (e.g., RGGI in northeast US). In Consumer Durables & Apparel sector, the EU lags behind the US in the adoption of scope 1 and scope 2 targets. The following sectors have higher percentages of scope 2 targets adoption than scope 1 targets: Media, Retailing, Banks, Diversified Financials, Insurance, and Real Estate, Software & Services, Technology Hardware & Equipment. These sectors generate more scope 2 emissions via the consumption of electricity than the direct scope 1 emissions from their own activities. For instance, as a hardware producer, Cisco Systems reported that the quantity of its scope 2 emissions was usually more than 10 times that of its scope 1 emissions [49]. Therefore, setting targets on scope 2 emissions is a natural choice.
4.3. Target Stringency
Table 4 shows the target stringency distribution, including the 25th percentile, the median, the 75th percentile, the mean, the standard deviation and test of differences. The entries are sorted based on mean stringency in the EU. In computing the statistics, we include the firms without targets by assigning them stringency of zero. For all the EU firms, the average mitigation is a reduction of 13.54% from the reference year emissions. The median is only 6.00%, significantly lower than the average mitigation. Moving from the 25th percentile to the 75th percentile in the distribution of target stringency sees a significant increase of mitigation from 0.50% to 18.97%. Among the 24 sectors under study, Consumer Services, Commercial & Professional Services, and Diversified Financials are the three sectors with the lowest average mitigation. Household & Personal Products, Food & Staples Retailing, Telecommunication Services are the three sectors with the highest average mitigation. The EU firms set slightly more stringent targets (13.54% reduction) than the US firms (12.75% reduction), and the difference is insignificant. With no exception, the mean is always larger than the median regardless of the region and sector. Therefore, the distribution of target stringency is left skewed.
Table 4.
Target stringency by industrial sectors.
The Energy sector in the US has much lower stringency level than the EU and the difference is significant (p < 0.05) under both t-test and Wilcoxon rank sum test. The sector consists mostly of oil and gas companies, such as Chevron, Royal Dutch Shell, and BP. The sharp contrast in target stringency is a reflection of the significant difference in the strategies adopted by the companies in the two regions in response to climate change. The literature has shown that the oil and gas companies in the EU have taken more proactive policies, while the US companies have adopted more reactive strategies [28]. The proactive policies of the EU firms may drive them to set more aggressive targets. The reasons for the difference in climate strategies of the oil and gas firms may be found in the political, regulatory and societal contexts [28]. The Materials sector in the EU set significantly more stringent targets than the US (p < 0.01). The Transportation sector in the EU has an average stringency of 14.18%, which is almost three times that in the US. The Materials sector and part of the Transportation sector (i.e., aviation) in the EU are governed by EU ETS. The Consumer Services sector in the US sets significantly more stringent targets than the sector in the EU (p < 0.01). The sector mainly consists of hotel and restaurant companies, for which the GHG emissions primarily come from building operations.
4.4. Target Completion
The effectiveness of the targets rests on their fulfillment. Table 5 reports the distribution of the target completion (i.e., 25th, 50th and 75th percentiles, the mean, and the percentage of firms with target completion greater than one), and the t-test, Wilcoxon rank sum test and two proportion z-test results for the difference between the EU and the US. The sectors are sorted according to the mean completion in the EU from high to low. In computing target completion, we focus on those firms that have set up targets. Overall, the firms under study are making satisfactory progress toward achieving the targets with a mean completion rate of 1.16 in the EU and 1.22 in the US. The overall percentages of completion are very close in the two regions, with 71.05% of the targets for EU firms achieved on time and 72.12% of the targets for US firms achieved on time. The overall difference between the EU and the US in target completion is not significant under any of the tests.
Table 5.
Target completion by industrial sectors.
In the US, 23 of the 24 sectors have a median target completion larger than one. All the firms in the Consumer Durables & Apparel sector, the Media sector and the Real Estate sector in the US have target completion greater than one, implying that all of them will be able to accomplish the targets if their current pace of mitigation sustains. In the EU, 19 of the 24 sectors have a median target completion greater than one. Also notable is the performance of the Energy sector, which has the worst mean target completion of 0.80 among all the sectors in the EU and a mean target completion of 0.91 in the US. The progress made by the Semiconductors & Semiconductor Equipment sector is not satisfactory either, with a median target completion of 0.86 in the EU and a mean target completion of 0.65 in the US. In terms of sectoral comparison between the EU and the US, the differences are mostly insignificant under the t-test and the Wilcoxon rank sum test at p < 0.05, except for the Diversified Financials sector. Based on the two proportion z-test, we find that the following sectors in the US have significantly more firms (p < 0.05) that have made satisfactory progress toward target accomplishment than the EU: Energy, Materials, Capital Goods, Transportation, Consumer Durables & Apparel, Media, Real Estate, Utilities. It should be stressed that while the Energy and Materials sectors in the US have less stringent targets than the EU, they are better in target completion.
Furthermore, we would like to point out that the combining of target stringency and target completion still may not accurately embody the degree of commitment and endeavor made by the firms to cope with climate change. Even without climate concerns, for the purpose of cost saving and efficiency improvement, firms may still employ various initiatives that can reduce GHG emissions. In that case, target stringency and target completion spring from planned business activities as usual rather than climate-oriented efforts.
5. Discussions
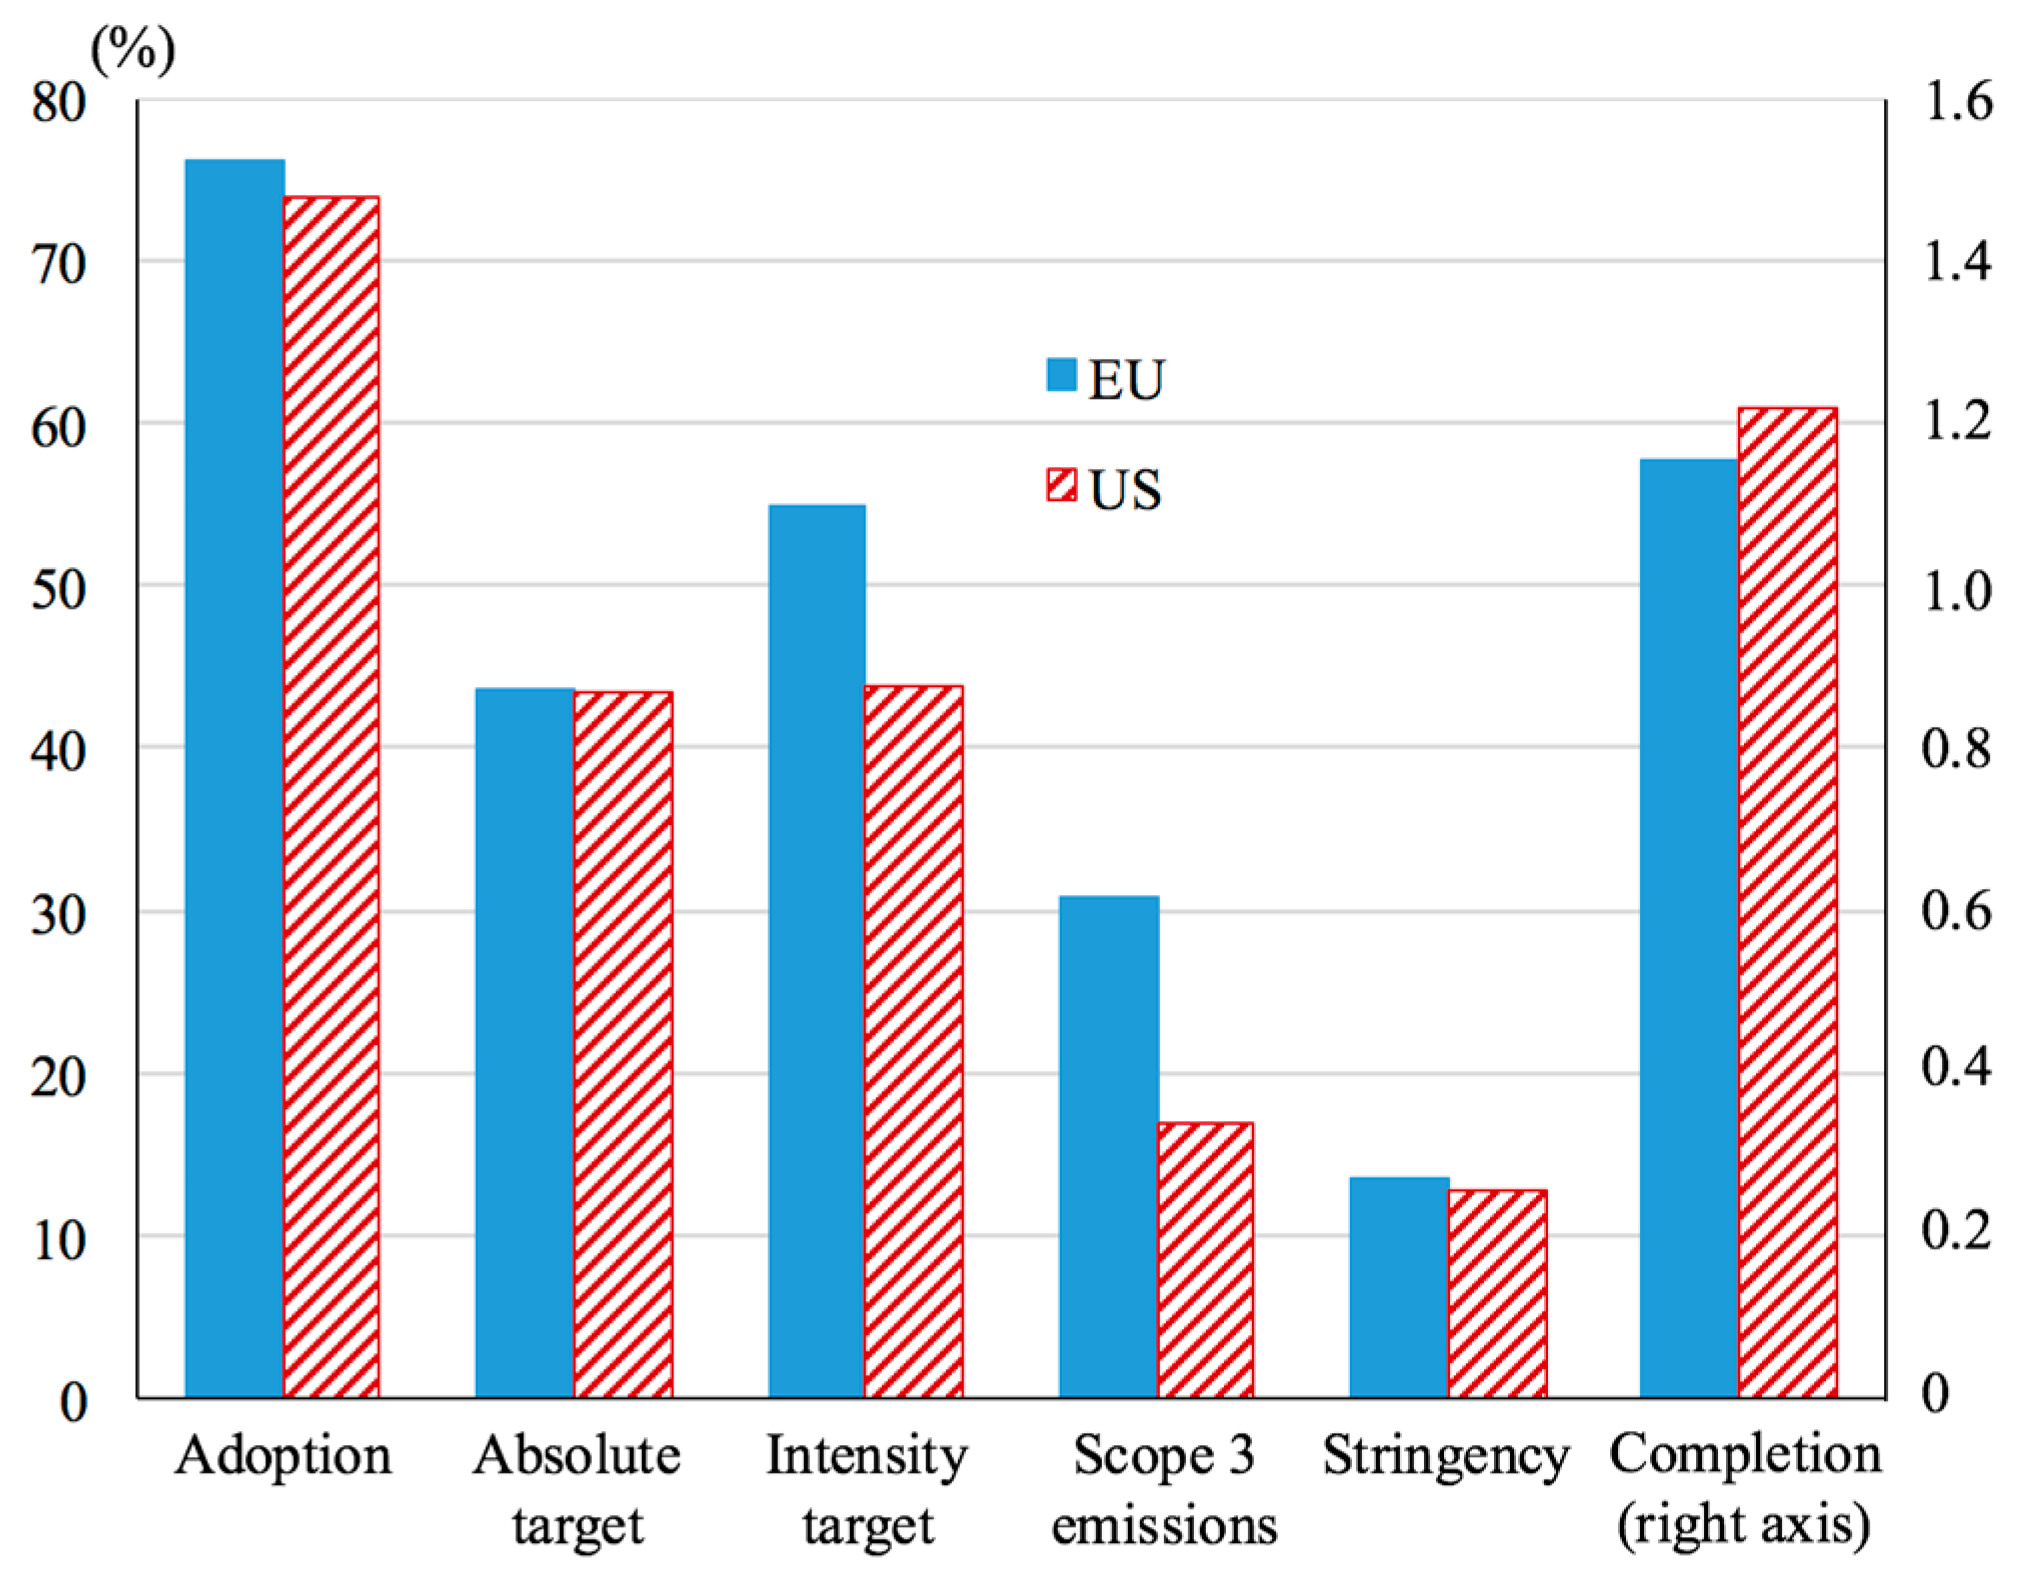
The analysis of the GHG emission targets in Section 4 indicates that different regions and industrial sectors should have different priorities in target-setting. We discuss the most urgent issues for the regions and industrial sectors below. For the ease of presentation, we summarize the overall performance for the two regions on key target features in Figure 1.
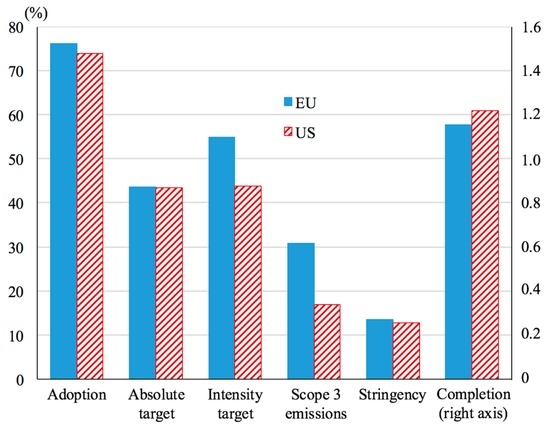
Figure 1.
Overall performance for the two regions.
As shown in Section 4 and Figure 1, the EU and the US firms are generally on par in adopting emission targets, and the adoption rate has substantially improved compared to earlier results [32]. However, there is still room for further improvements given that roughly 25% of the firms in the sample still do not have mitigation targets. To this end, we recommend that policymakers in both regions take actions to enhance the transparency and publicity of the targets set by the firms. Transparency and publicity can promote competitive pressure among the firms and surveillance of social responsibility by the general public. A brief search shows that firms in both regions, though having reported to CDP, are not likely to disclose their climate policy themselves through other channels such as annual reports or official websites. To encourage disclosure and achievement of target, policymakers may set up voluntary programs and awards that recognize the leading domestic firms in climate change mitigation, similar to the previous EPA Climate Leaders program in the US. Literature shows that participation in specific voluntary programs can lead to significant improvement in environmental performance, for pollutants like toxic chemicals [50]. Further, it has been argued that the voluntary programs work by providing “firms with a mechanism to acquire an environmentally friendly reputation and to credibly differentiate themselves from their competitors,” so firms have incentive to participate in the programs [45]. In light of earlier experience and literature, we anticipate that firm-level climate change performance can be improved with the introduction of properly designed voluntary programs. Meanwhile, since soft measures like voluntary programs have their limits, more radical approaches with legally binding terms may also be considered. For example, policymakers can enforce the disclosure of risks and goals related to climate change in firms’ regular filings through mandatory reporting rule and securities law. To the best of our knowledge, none of the countries in our sample have the climate disclosure rule in place.
The presence of scope 1 and scope 2 targets is more common than scope 3 targets. For firms in both regions, particularly in the US, increasing the coverage of scope 3 emissions in target-setting is important. This is due to three reasons. First, the scope 3 emissions account for a significant fraction of a sector’s carbon footprint (more than 75% as reported in [29]). Second, holding a firm accountable for GHG emissions beyond its own boundary will present opportunities to influence the mitigation actions of and collaborate with other firms upstream and downstream in the supply chain. Third, upstream and downstream emissions are determined by a firm’s decisions and thus it is natural to make the firm at least partially responsible for the emissions [51]. While prior research has highlighted the importance of scope 3 emissions [52], a great obstacle in dealing with the scope 3 emissions is how to measure the emissions in the scope [29]. Recently some protocols have been developed for estimating the emissions in the supply chain, such as the Corporate Value Chain Standards from the GHG Protocol (http://www.ghgprotocol.org/standards/scope-3-standard). Firm management may consult those protocols.
A target is ineffective in carbon mitigation if it does not come with proper levels of stringency and fulfillment. Overall, the EU and the US firms have no obvious difference in terms of target stringency and target completion. For the EU and the US policymakers, the priority should be on the stringency and accomplishment of mitigation targets in key sectors. The Energy and Materials sectors in the US should strengthen their targets with deeper emission cuts. According to [30], more stringent targets in these two dirty sectors can lead to higher emission reduction. Analysis in Section 4.4 highlights that the Energy sector and the Materials sector in the EU and the US are not making satisfactory progress toward target completion. Given the two sectors’ large volume of GHG emissions, it is important for the EU and the US policymakers to urge the sectors to take actions and accomplish the targets on schedule. A proper policy instrument is one that can pressure the firms to achieve the established targets without being too intimidating and forestalling the establishment of the voluntary targets. This may be achieved by rules that are specifically designed for the two sectors. For example, the Energy sector mainly consists of oil and natural gas companies, which emit GHGs in exploration, drilling, transmission, processing and distribution operations. Right now in the US, the EPA’s Greenhouse Gas Reporting Program, a mandatory emission reporting program for facilities emitting more than 25,000 metric tons of CO2 equivalent per year, covers many large oil and gas facilities. However, regulations that directly control the quantity of emissions in the sector are not available right now. Therefore, we resort to the reporting method. We suggest that the policymakers strengthen the reporting program by requesting the firms to report their targets along with the firm-level emission data. Reporting the target will put the emission data into the context of corporate climate policy. Moreover, it gives the regulatory body and general public a clearer picture of whether the firms have lived up to their promises. Since publicity puts reputation at stake, firms will try harder to attain their targets.
It would be intriguing to see if more stringent targets lead to inferior target completion or not. We find a positive and significant correlation (0.07, p < 0.01) between target stringency and target completion for the entire sample. This result is generally in line with [43] which finds that target stringency has a positive association with target completion. The reason, as argued in [43], may be that difficult targets motivate the firms to undertake more mitigation projects and invest more resources into tackling climate change. The positive relationship between target stringency and target completion implies that from the mitigation perspective, difficult targets are unlikely to backfire and policymakers in general should encourage firm management to set difficult targets.
While the focus of the paper is on regional and sectoral differences, it is also important to benchmark the target-setting activities for firms within the same sector. Take the Semiconductors & Semiconductor Equipment sector in the EU as an example. The targets set by the four firms in the sector are presented in Table 6. Clearly, ARM Holdings is the most proactive firm in using the emission targets. There is a significant level of variation among the firms in their target-setting policies. Similar great dispersions of target features can also be observed in many other sectors. The dispersions of target-setting, which is a specific form of environmental management practice, can be linked to firm-specific factors, such as the organizational structure of the firm, the financial leverage, and the management attitude toward climate change [45,53,54]. The topic may be explored in future research.
Table 6.
Targets set by the EU semiconductor firms.
6. Conclusions
Target-setting by firms as a voluntary action is an important and integral part of the global efforts against climate change. In practice, target-setting usually serves as a precondition for other GHG mitigation actions. In this study, we have examined the use of GHG mitigation targets at the firm level by analyzing a sample of 989 large corporations in the EU and the US. The results are based on five aspects of target-setting, i.e., target adoption, target metric (absolute target, intensity target), target scope (scope 1/2/3), target stringency, and target completion. For each aspect, we conduct cross-country and cross-industry comparisons to uncover the distinctive patterns of target-setting by firms in different regions and industrial sectors.
We find that while the adoption rate of emission targets has greatly improved since early 2000s, the targets are still absent in about 25% of the firms for both the EU and the US. The EU firms are significantly more likely to base the target on intensity measures than the US firms. Moreover, significantly more EU firms have targets for scope 3 emissions than the US firms. This reflects that the EU firms are more proactive in incorporating GHG emissions upstream and downstream in supply chain into their climate change strategies. Overall, the differences between the EU and the US firms in terms of target stringency and target completion are relatively small. Among the 24 industrial sectors under study, the Utilities sector in the US has a significantly lower target adoption rate than that in the EU. The Energy and Materials sectors in the EU set significantly more stringent targets than their US counterparts. The Energy sectors in both regions fail to make satisfactory progress to achieve the targets.
The aforementioned results shed light on some crucial issues in firm-level target-setting that policymakers and firms in the EU and the US should focus on. For example, there is still substantial room for policymakers and firm management in both regions to further the use of firm-level mitigation targets. The US policymakers and business leaders should make the US firms more accountable for emissions in the supply chain. Special attention should be paid to the Energy sector with regard to the achievement of the targets. Furthermore, we have discussed potential policy and management tools to address the issues with firm-level target-setting.
There are three interesting directions for future research. First, we would like to point out that target-setting is a dynamic process. In reality, firms can revise, repeal or replace the targets already established. It would be interesting to examine how the firms adjust the targets over time in response to changing political, economic and market conditions. Second, to get a better understanding of firm-level mitigation targets around the world, other major GHG-emitting countries, especially China, Russia and India, should be included in the study. However, the current CDP survey does not cover as many firms in those countries as the EU and the US. A more comprehensive study is possible when more data on other major emitting countries are available. Finally, this study documents illustrative evidence on regional and sectoral differences on target-setting, and the analysis is preliminary. Further and more rigorous analysis are needed to pin down the root causes behind the differences.
Acknowledgments
This work is supported by research program at China University of Political Science and Law.
Conflicts of Interest
The author declares no conflict of interest.
References
- Schellnhuber, H.J.; Rahmstorf, S.; Winkelmann, R. Why the right climate target was agreed in Paris. Nat. Clim. Chang. 2016, 6, 649–653. [Google Scholar] [CrossRef]
- Philibert, C.; Pershing, J. Considering the options: Climate targets for all countries. Clim. Policy 2001, 1, 211–227. [Google Scholar] [CrossRef]
- Pizer, W.A. The case for intensity targets. Clim. Policy 2005, 5, 455–462. [Google Scholar] [CrossRef]
- Lutsey, N.; Sperling, D. America’s bottom-up climate change mitigation policy. Energy Policy 2008, 36, 673–685. [Google Scholar] [CrossRef]
- Krabbe, O.; Linthorst, G.; Blok, K.; Crijns-Graus, W.; Van Vuuren, D.P.; Höhne, N.; Faria, P.; Aden, N.; Pineda, A.C. Aligning corporate greenhouse-gas emissions targets with climate goals. Nat. Clim. Chang. 2015, 5, 1057–1060. [Google Scholar] [CrossRef]
- Goulder, L.H.; Parry, I.W.H. Instrument choice in environmental policy. Rev. Environ. Econ. Policy 2008, 2, 152–174. [Google Scholar] [CrossRef]
- Aldy, J.E.; Stavins, R.N. The Promise and Problems of Pricing Carbon: Theory and Experience. J. Environ. Dev. 2012, 21, 152–180. [Google Scholar] [CrossRef]
- World Bank. Ecofys and Vivid Economics State and Trends of Carbon Pricing; The World Bank: Washington, DC, USA, 2016. [Google Scholar]
- Baranzini, A.; Carattini, S. Taxation of Emissions of Greenhouse Gases. In Global Environmental Change; Freedman, B., Ed.; Springer: Dordrecht, The Netherlands, 2014; Volume 1, pp. 543–560. [Google Scholar]
- Ostrom, E.A. Polycentric Approach for Coping with Climate Change. Soc. Sci. Electron. Publ. 2009, 15, 97–134. [Google Scholar]
- Blok, K.; Höhne, N.; van der Leun, K.; Harrison, N. Bridging the greenhouse-gas emissions gap. Nat. Clim. Chang. 2012, 2, 1–4. [Google Scholar] [CrossRef]
- Edenhofer, O.; Pichs-Madruga, R.; Sokona, Y.; Farahani, E.; Kadner, S.; Seyboth, K.; Adler, A.; Baum, I.; Brunner, S.; Eickemeier, P. (Eds.) Intergovernmental Panel on Climate Change Summary for Policymakers; Cambridge University Press: Cambridge, NY, USA, 2014. [Google Scholar]
- Kolk, A.; Pinkse, J. Towards strategic stakeholder management? Integrating perspectives on sustainability challenges such as corporate responses to climate change. Corp. Gov. 2007, 7, 370–378. [Google Scholar] [CrossRef]
- Hoffman, A.J. Carbon Strategies: How Leading Companies are Reducing Their Climate Change Footprint; University of Michigan Press: Ann Arbor, MI, USA, 2007; p. 175. [Google Scholar]
- Schreurs, M.A. The Paris Climate Agreement and the Three Largest Emitters: China, the United States, and the European Union. Politics Gov. 2016, 4, 219–223. [Google Scholar] [CrossRef]
- European Union. Greenhouse Gas Emission Statistics. Available online: http://ec.europa.eu/eurostat/statistics-explained/index.php/Greenhouse_gas_emission_statistics (accessed on 1 Sepetember 2016).
- United States Environmental Protection Agency. U.S. Greenhouse Gas Inventory Report: 1990–2014. Available online: https://www.epa.gov/ghgemissions/us-greenhouse-gas-inventory-report-1990-2014 (accessed on 1 Sepetember 2016).
- Kelemen, R.D.; Vogel, D. Trading Places: The Role of the United States and the European Union in International Environmental Politics. Comp. Polit. Stud. 2009, 43, 427–456. [Google Scholar] [CrossRef]
- Skjærseth, J.B.; Bang, G.; Schreurs, M.A. Explaining Growing Climate Policy Differences Between the European Union and the United States. Glob. Environ. Politics 2013, 13, 61–80. [Google Scholar] [CrossRef]
- Shehata, A.; Hopmann, D.N. Framing Climate Change. J. Stud. 2012, 13, 175–192. [Google Scholar] [CrossRef]
- Lorenzoni, I.; Pidgeon, N.F. Public views on climate change: European and USA perspectives. Clim. Chang. 2006, 77, 73–95. [Google Scholar] [CrossRef]
- European Commission. The EU Emissions Trading System. Available online: http://ec.europa.eu/clima/policies/ets_en (accessed on 1 February 2017).
- Olmstead, S.M.; Stavins, R.N. Three key elements of a post-2012 international climate policy architecture. Rev. Environ. Econ. Policy 2012, 6, 65–85. [Google Scholar] [CrossRef]
- Environmental Protection Agency. Greenhouse Gas Reporting Program. Available online: https://www.epa.gov/ghgreporting (accessed on 1 Febuary 2017).
- Sullivan, R.; Gouldson, A. Comparing the Climate Change Actions, Targets and Performance of UK and US Retailers. Corp. Soc. Responsib. Environ. Manag. 2016, 23, 129–139. [Google Scholar] [CrossRef]
- Sullivan, R.; Gouldson, A. The Governance of Corporate Responses to Climate Change: An International Comparison. Bus. Strateg. Environ. 2016. [Google Scholar] [CrossRef]
- Tschopp, D.J. Corporate social responsibility: A comparison between the United States and the European Union. Corp. Soc. Responsib. Environ. Manag. 2005, 12, 55–59. [Google Scholar] [CrossRef]
- Skjaerseth, J.B.; Skodvin, T. Climate Change and the Oil Industry: Common Problems, Different Strategies. Glob. Enviorn. Politics 2001, 1, 43–64. [Google Scholar] [CrossRef]
- Huang, Y.A.; Weber, C.L.; Matthews, H.S. Categorization of scope 3 emissions for streamlined enterprise carbon footprinting. Environ. Sci. Technol. 2009, 43, 8509–8515. [Google Scholar] [CrossRef] [PubMed]
- Doda, B.; Gennaioli, C.; Gouldson, A.; Grover, D.; Sullivan, R. Are Corporate Carbon Management Practices Reducing Corporate Carbon Emissions? Corp. Soc. Responsib. Environ. Manag. 2016, 23, 257–270. [Google Scholar] [CrossRef]
- Williams, S.; Schaefer, A. Small and Medium-Sized Enterprises and Sustainability: Managers’ Values and Engagement with Environmental and Climate Change Issues. Bus. Strateg. Environ. 2013, 22, 173–186. [Google Scholar] [CrossRef]
- Kolk, A.; Pinkse, J. Market strategies for climate change. Eur. Manag. J. 2004, 22, 304–314. [Google Scholar] [CrossRef]
- Levy, D.L. Business and the evolution of the climate regime: The dynamics of corporate strategies. In The Business of Global Environmental Governance; MIT Press: Cambridge, MA, USA, 2005; pp. 73–104. [Google Scholar]
- Persson, Å.; Rockström, J. Business leaders. Nat. Clim. Chang. 2011, 1, 426–427. [Google Scholar] [CrossRef]
- Cadez, S.; Czerny, A. Climate change mitigation strategies in carbon-intensive firms. J. Clean. Prod. 2016, 112, 4132–4143. [Google Scholar] [CrossRef]
- Tseng, M.L.; Chiu, A.S.F.; Tan, R.R.; Siriban-Manalang, A.B. Sustainable consumption and production for Asia: Sustainability through green design and practice. J. Clean. Prod. 2013, 40, 1–5. [Google Scholar] [CrossRef]
- Rexhäuser, S.; Löschel, A. Invention in energy technologies: Comparing energy efficiency and renewable energy inventions at the firm level. Energy Policy 2015, 83, 206–217. [Google Scholar] [CrossRef]
- Gerstlberger, W.; Præst Knudsen, M.; Stampe, I. Sustainable development strategies for product innovation and energy efficiency. Bus. Strateg. Environ. 2014, 23, 131–144. [Google Scholar] [CrossRef]
- Gouldson, A.; Sullivan, R. Long-term corporate climate change targets: What could they deliver? Environ. Sci. Policy 2013, 27, 1–10. [Google Scholar] [CrossRef]
- Gouldson, A.; Sullivan, R. Understanding the governance of corporations: An examination of the factors shaping UK supermarket strategies on climate change. Environ. Plan. A 2014, 46, 2972–2990. [Google Scholar] [CrossRef]
- Rietbergen, M.G.; Van Rheede, A.; Blok, K. The target-setting process in the CO2 Performance Ladder: Does it lead to ambitious goals for carbon dioxide emission reduction? J. Clean. Prod. 2015, 103, 549–561. [Google Scholar] [CrossRef]
- Herzog, T.; Baumert, K.A.; Pershing, J. Target: Intensity—An Analysis of Greenhouse Gas Intensity Targets; World Resources Institute: Washington, DC, USA, 2006. [Google Scholar]
- Ioannou, I.; Li, S.X.; Serafeim, G. The Effect of Target Difficulty on Target Completion: The Case of Reducing Carbon Emissions. Account. Rev. 2016, 91, 1467–1492. [Google Scholar] [CrossRef]
- Jones, C.A.; Levy, D.L. North American Business Strategies Towards Climate Change. Eur. Manag. J. 2007, 25, 428–440. [Google Scholar] [CrossRef]
- Anton, W.R.Q.; Deltas, G.; Khanna, M. Incentives for environmental self-regulation and implications for environmental performance. J. Environ. Econ. Manag. 2004, 48, 632–654. [Google Scholar] [CrossRef]
- Hurtarte, J.S.; Wolsheimer, E.A.; Tafoya, L.M. Understanding Fabless IC Technology; Newnes: Oxford, UK; Boston, MA, USA, 2007. [Google Scholar]
- Bartos, S.C.; Lieberman, D.; Burton, C.S. Estimating the Impact of Migration to Asian Foudry Production on Attaining the WSC 2010 PFC Reduction Goal. Available online: https://www.epa.gov/sites/production/files/2016-02/documents/foundry_impact.pdf (accessed on 1 Febuary 2017).
- Weinhofer, G.; Hoffmann, V.H. Mitigating Climate Change—How Do Corporate Strategies Differ? Bus. Strateg. Environ. 2010, 19, 77–89. [Google Scholar] [CrossRef]
- Cisco. Corporate Social Responsibility Report. Available online: http://www.cisco.com/assets/csr/pdf/CSR_Report_2015.pdf (accessed on 1 Febuary 2017).
- Khanna, M.; Damon, L. A EPA’s Voluntary 33/50 Program: Impact on Toxic Releases and Economic Performance of Firms. J. Environ. Econ. Manag. 1999, 37, 1–25. [Google Scholar] [CrossRef]
- Busch, T. Comment on “Corporate Carbon Performance Indicators Revisited”. J. Ind. Ecol. 2011, 15, 160–163. [Google Scholar] [CrossRef]
- Global Reporting Initiative Sustainability Reporting Guidelines. Available online: https://www.globalreporting.org/resourcelibrary/G3.1-Guidelines-Incl-Technical-Protocol.pdf (accessed on 1 Febuary 2017).
- Martin, R.; Muûls, M.; De Preux, L.B.; Wagner, U.J. Anatomy of a paradox: Management practices, organizational structure and energy efficiency. J. Environ. Econ. Manag. 2012, 63, 208–223. [Google Scholar] [CrossRef]
- Okereke, C. An Exploration of Motivations, Drivers and Barriers to Carbon Management: The UK FTSE 100. Eur. Manag. J. 2007, 25, 475–486. [Google Scholar] [CrossRef]
© 2017 by the author. Licensee MDPI, Basel, Switzerland. This article is an open access article distributed under the terms and conditions of the Creative Commons Attribution (CC BY) license (http://creativecommons.org/licenses/by/4.0/).