Abstract
The transnational area of Changbai Mountain (TACM) is crucial to sustainable development in Northeast Asia owing to its abundant forest, which helps in maintaining biodiversity and multiple ecosystem services. However, the spatiotemporal patterns of forest in the TACM have been poorly understood across the whole region. The objectives of this study were to quantify the spatiotemporal patterns of forest in the TACM from 1977 to 2015, investigate the causes of forest dynamics, and assess the impacts of forest dynamics on habitat quality. To do this, we first extracted the forest in the TACM from Landsat images acquired in 1977, 1988, 1999, 2007, and 2015 using visual interpretation. Then, we analyzed the spatiotemporal patterns of forest in the TACM from 1977 to 2015 using landscape metrics and compared the dynamics of forest between the area in China and the area in the Democratic People’s Republic of Korea (DPRK). After that, we investigated the driving forces of forest dynamics and the impacts of forest dynamics on habitat quality. We found that the TACM experienced a noticeable forest decrease—from 1.57 million ha in 1977 to 1.48 million ha in 2015, a decline of 5.78%—and underwent a forest fragmentation process. In particular, the sub-region in the DPRK had a much larger decrease (17.75%) than the sub-region in China (2.86%). We found that timber harvesting, urban expansion, agricultural reclamation, and typhoon disasters were the main driving forces behind forest decreases in the TACM. Specifically, agricultural reclamation was the most important factor in the DPRK sub-region, while urban expansion was the dominant factor in the Chinese sub-region. Furthermore, such forest loss and fragmentation has resulted in declines in habitat quality across both sides of the TACM. Thus, we suggest that more effective forest management with cooperation between China and DPRK is needed to maintain and improve forest coverage in the TACM.
1. Introduction
The transnational area of Changbai Mountain (TACM) mainly refers to the mountainous area that runs across southeastern Jilin province in China and the northern parts of Democratic People’s Republic of Korea (DPRK) [1]. Approximately 80% of the TACM is covered by forest; it constitutes one of the largest protected temperate forests in the world and serves as home to the last stands of virgin Korean pine and mixed hardwoods that include several endangered species [2,3,4]. In addition, the TACM includes the headwaters of the Tumen, Songhua, and Yalu Rivers, and it plays an indispensable role in maintaining biodiversity, water retention, soil conservation, carbon sequestration, and ecological security in the watersheds of these three rivers. Therefore, the TACM is crucial for sustainable development in China, the DPRK, and all of Northeast Asia [2,5,6,7].
Under the twin influences of human activities and natural disasters, the forest has undergone dramatic change in the TACM. Specifically, rapid socioeconomic development in China and the DPRK has promoted logging, reclamation, urbanization, and tourism, all of which have aggravated forest loss and fragmentation [8,9,10,11]. Additionally, the No. 15 typhoon “Vera” caused widespread damage to the TACM forest in 1986 that has not yet fully recovered, even after 30 years [12,13]. Forest loss and fragmentation have reduced the quality of natural habitat and pose a serious threat to regional biodiversity [14,15,16]. For example, the Siberian tiger has been absent from this region for decades [17]. To protect the forest and conserve regional biodiversity, quantifying the spatiotemporal patterns of forest in the TACM is an indispensable step that needs to be conducted urgently.
In recent years, some researchers have investigated the spatiotemporal patterns of forest in the TACM at local scales. For example, Zheng et al. [18] and Liu et al. [19] analyzed the dynamics of forest in China’s Changbai Mountain Nature Reserve during 1972–1988 and 1984–1997, respectively. Tang et al. [20] examined forest changes in China’s Changbai Mountain Nature Reserve and the DPRK’s Baekdu-san Nature Reserve between 1985 and 2007. Ma et al. [21] quantified the dynamics of forest on the Chinese side of the TACM from 1991 to 2010. However, the spatiotemporal patterns of forest in the entire TACM is still poorly understood because few studies have examined the spatial patterns and dynamics of forest across both sides of the TACM, which lie in different countries. In addition, previous studies mainly focused on the forest composition, ignoring the spatial configuration of forest in the TACM [18,19,20]. Recently, landscape metrics provided an efficient approach for measuring forest configuration [22,23]. These metrics are algorithms that quantify specific spatial characteristics of patches, classes of patches, or entire landscape mosaics [23]. Using these metrics, the isolation, shape, and connectivity of forest can be quantified [22].
In this study, our objectives were to quantify the spatiotemporal patterns of forest in the TACM from 1977 to 2015, investigate the causes of forest dynamics, and assess the impacts of forest dynamics on habitat quality. To do this, we first extracted the forest from 1977 to 2015 based on remotely sensed data. Then, we analyzed the dynamics of forest throughout the entire TACM including its two main sub-regions (i.e., the sub-region in China and the sub-region in the DPRK) using landscape metrics. Finally, we discussed the driving forces of forest dynamics and their influences on habitat quality in the TACM.
2. Materials and Methods
2.1. Study Area and Data
The TACM mainly includes the region around the volcanic cone of Changbai Mountain [24], which is located within 127°00′E–129°00′E and 41°20′N–42°40′N and covers an area of 1.84 million ha [25] (Figure 1). The northern and western parts of the TACM are located in China and cover 1.42 million ha (77% of the total area), whereas the southeastern part is located in the DPRK and covers 0.42 million ha (23% of the total area). The TACM has a temperate monsoon climate with typical vertical climatic zones and vegetation zones [26]. The mean annual temperature ranges from 3 °C to 7 °C, showing decreasing trend from low to high altitude. The mean annual precipitation varies from 700 to 1400 mm, having an increasing trend from northwest to southeast [27]. The growing season usually starts from late April and ends in early October, spanning five to six months in one year [28]. The growing season varied in terms of vegetation types and altitude. Generally, forests have a longer growing season than grassland and cropland [28]. Specifically, the TACM has four main types of forest along the elevation gradient, including broadleaf forest (300–700 m), mixed forest (700–1100 m), coniferous forest (1100–1800 m), and alpine birch forest (1800–100 m) with the decreasing growing season [21].
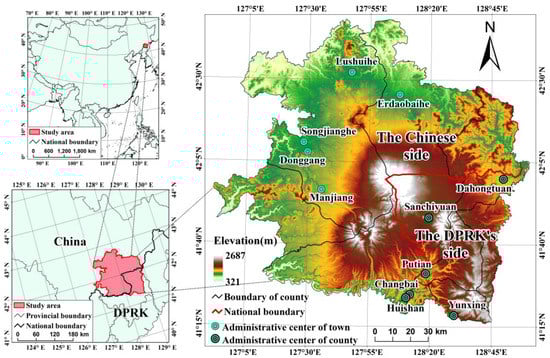
Figure 1.
The study area.
Landsat data were obtained from the Geospatial Data Cloud of the Computer Network Information Center of Chinese Academy of Sciences (http://www.gscloud.cn) and included 10 cloud-free images covering the entire TACM from circa 1977, circa 1988, 1999, 2007 and 2015 (Table 1). After obtaining these images, we mosaicked the two images in one year and resampled the resolution of Landsat MSS images to 30 m.

Table 1.
The remote sensing data used in this study.
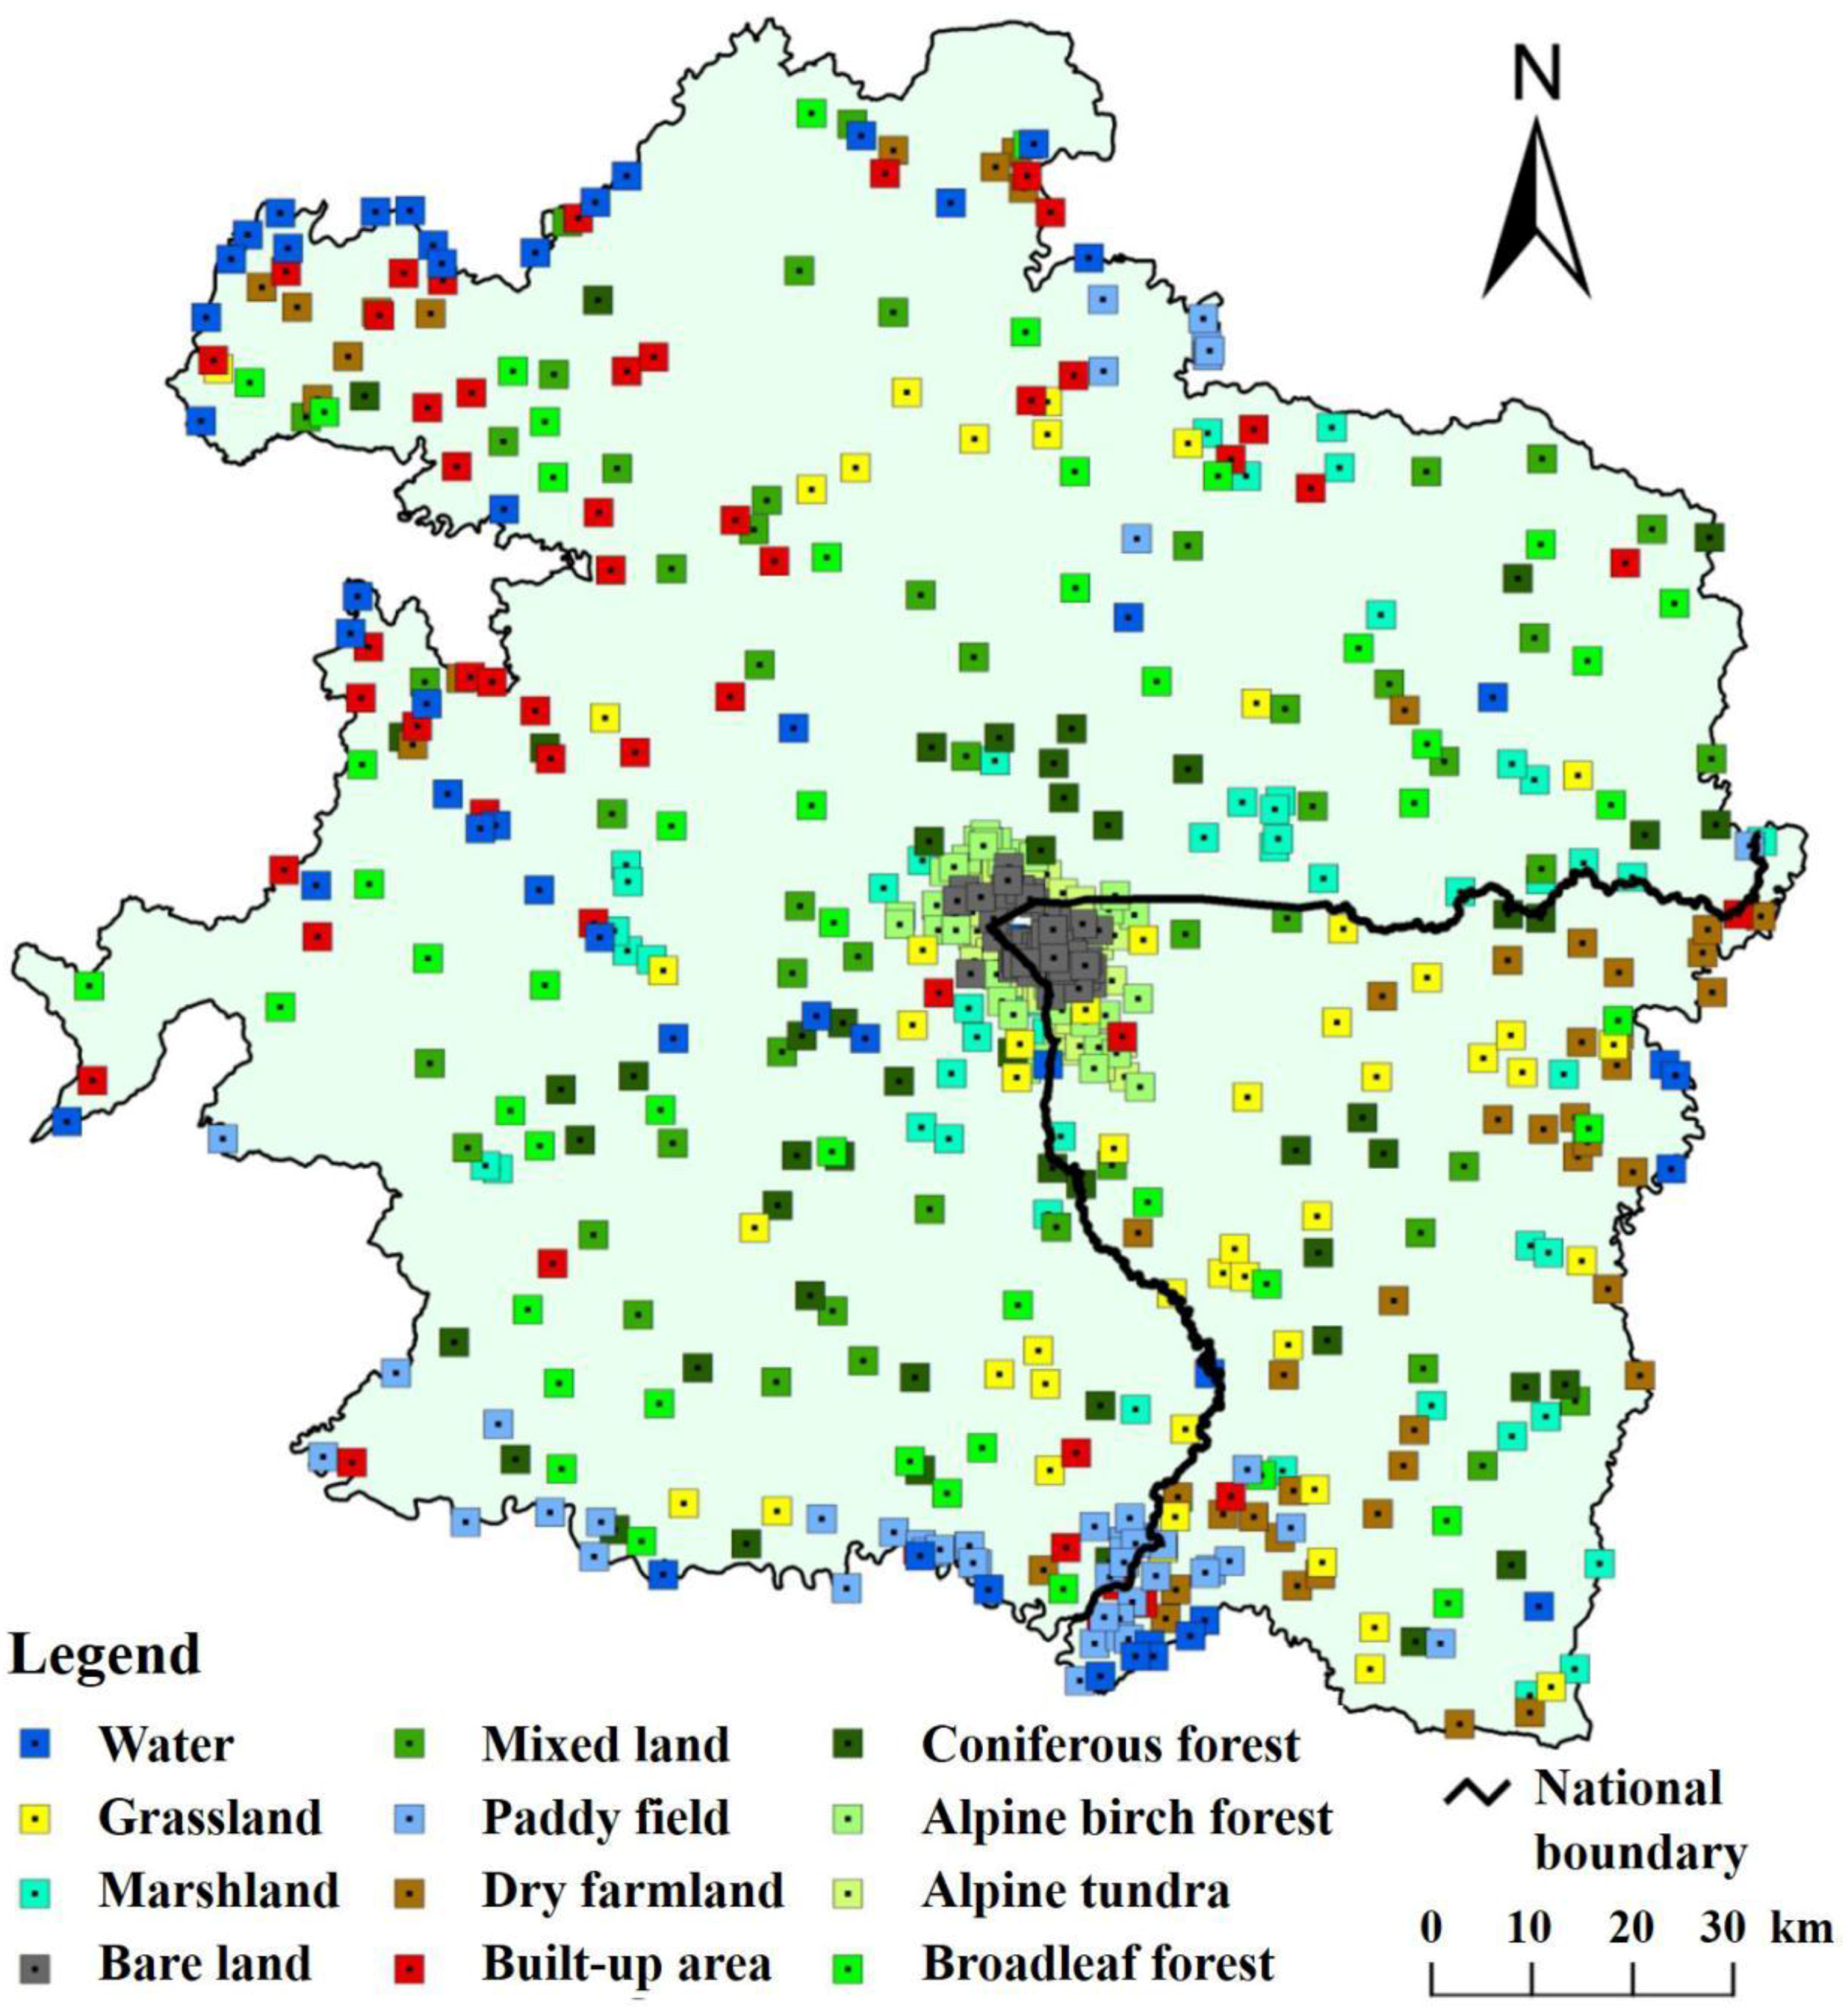
The administrative boundaries were obtained from the Chinese National Geographic Information Center (http://ngcc.sbsm.gov.cn) and the Global Administrative Boundaries Dataset (http://www.gadm.org/). The other data used include the 510 sampling points with the information on location and land use/cover type obtained from field survey across the TACM from 2007 to 2010 (Appendix A) and a regional forest resource map from the Changbai Mountain Management Committee.
2.2. Methods
2.2.1. Quantifying the Spatial Patterns of Forest
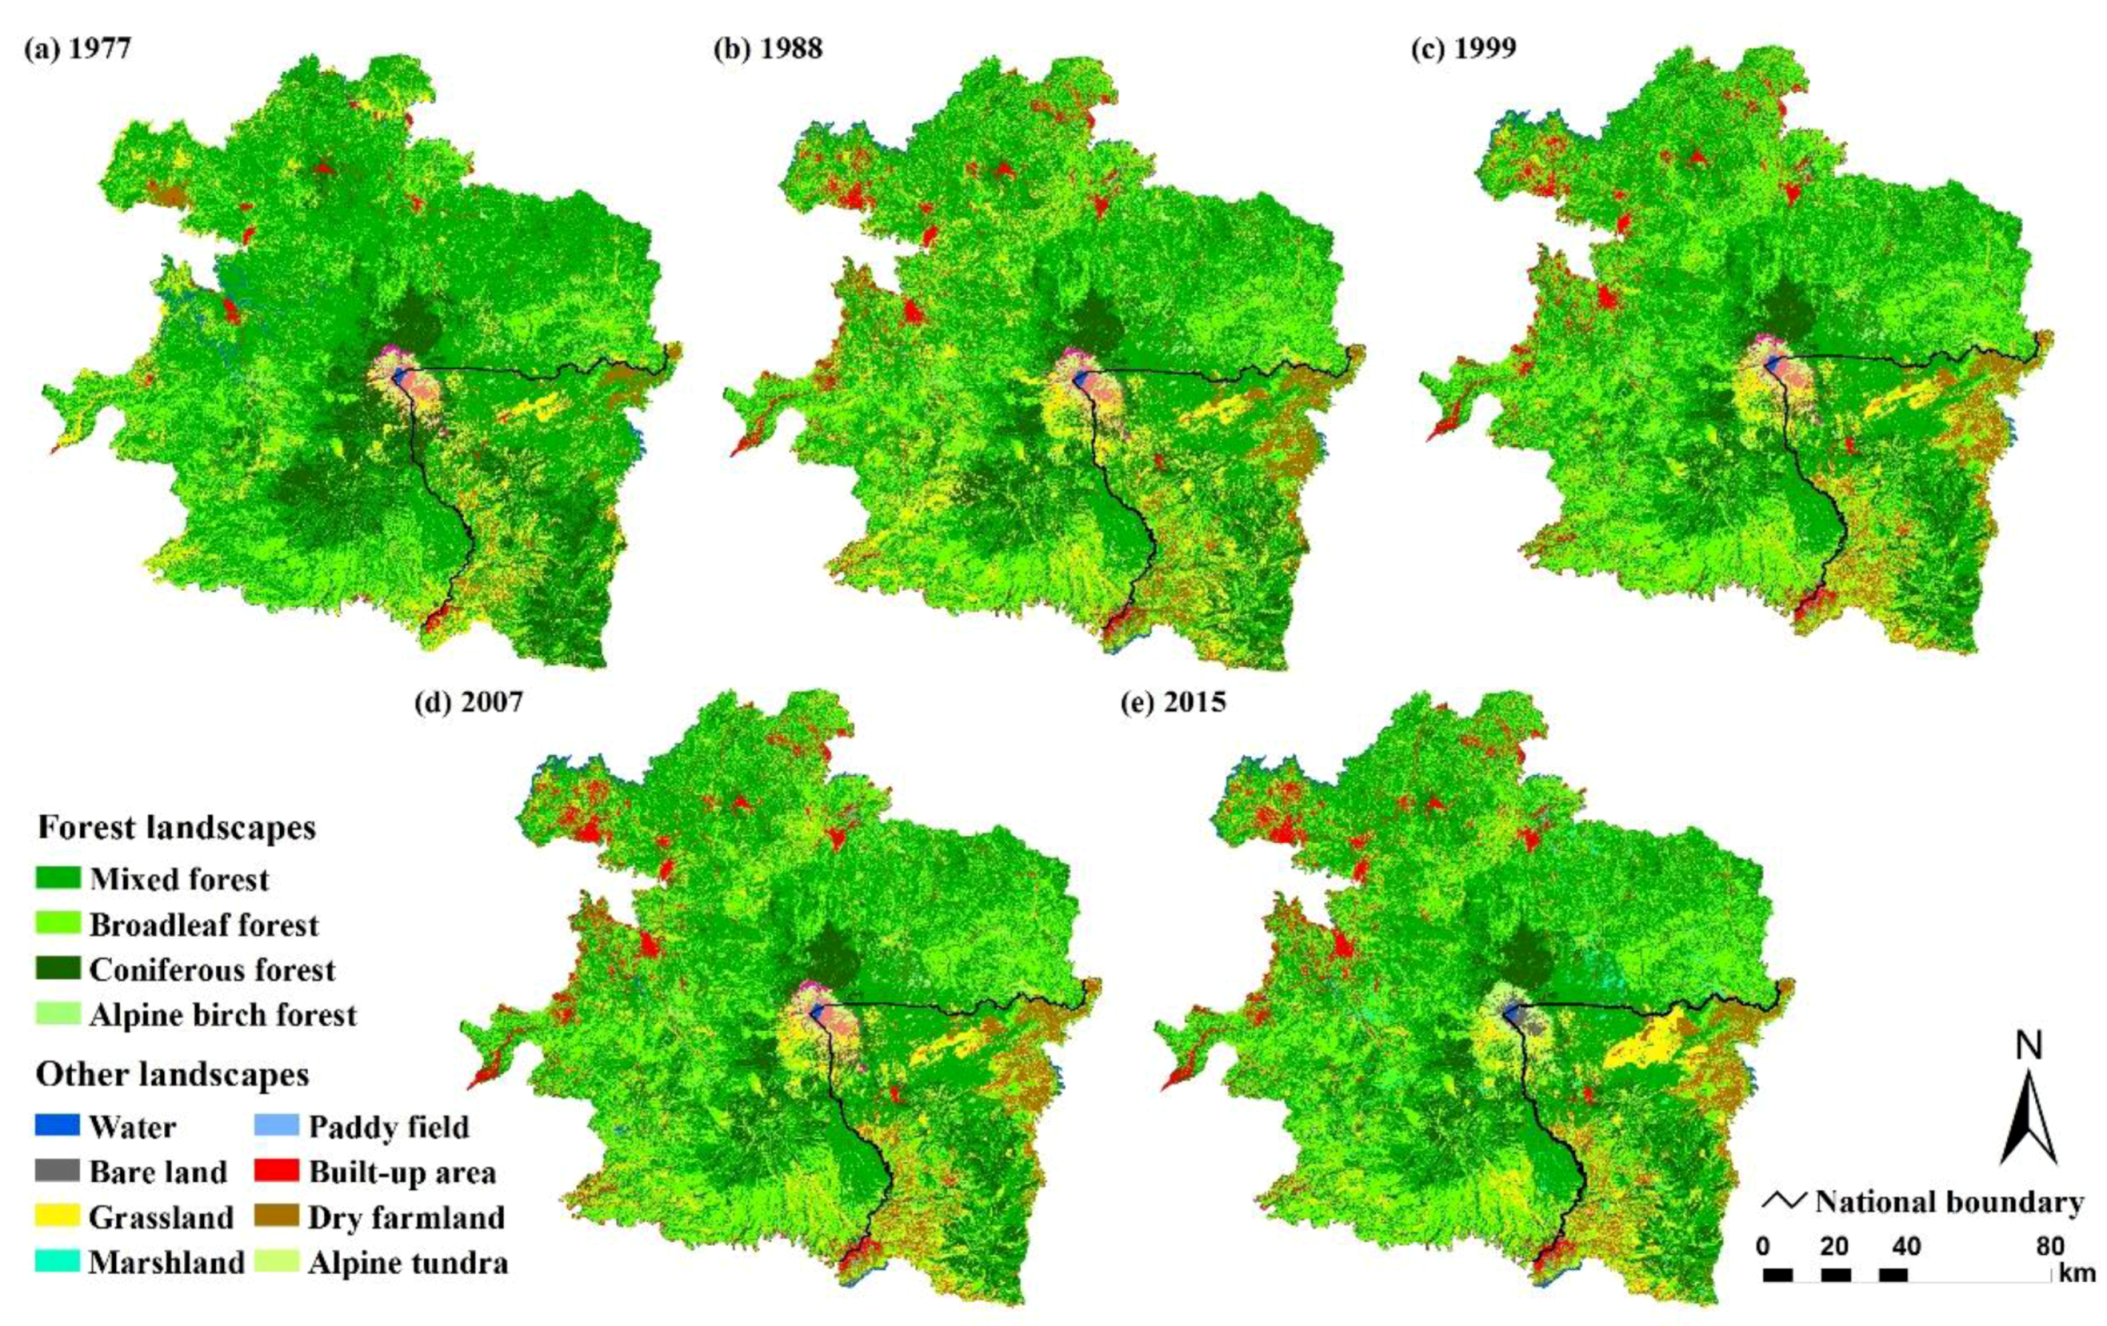
Presently, three main types of method are used to extract forest from remote sensing images, including unsupervised classification, supervised classification, and visual interpretation. Although the visual interpretation requires a large amount of human resources, it shows high accuracy and reliability [29]. Thus, we extracted forest from the Landsat data spanning 1977 to 2015 through visual interpretation. First, we developed interpretation criteria for each land use/cover type based on combination of Landsat bands, the sampling points from field survey data, and the regional forest resource map (Appendix A). These land use/cover types included coniferous forest, broadleaf forest, mixed forest, alpine birch forest, grassland, paddy field, dry farmland, water, marshland, bare land, built-up area, and alpine tundra. The interpretation criteria included the features on spectrum, shape, and texture as well as the mainly distributed area (Appendix A), and were developed by identifying such features of sampling points from field survey in terms of different land use/cover types. Second, we performed a visual-interpretation-based land use/cover classification of Landsat data using the interpretation criteria to obtain the spatial patterns of each land use/cover type in 1977, 1988, 1999, 2007, and 2015 (Figure 2). During the visual interpretation, the standard false color composite images based on green, red, and near-infrared bands were primarily used as references, while the information on short wave infrared band were used as supplement. In each year, we identified the land use/cover type pixel by pixel according to the differences on spectral characteristics and the shape and texture features among various land use/cover types (Appendix A). Finally, we assessed the overall forest distribution by integrating coniferous forest, broadleaf forest, mixed forest, and alpine birch forest from the obtained land use/cover data.
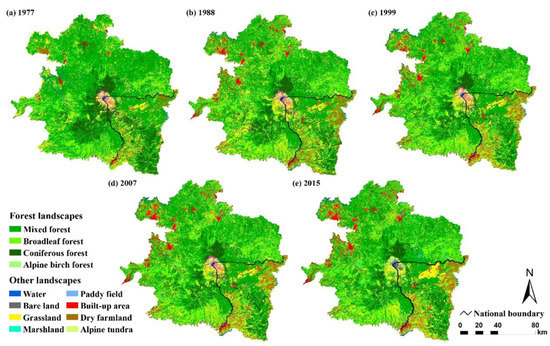
Figure 2.
The land use/cover maps in the TACM from 1977 to 2015: (a) the map in 1997; (b) the map in 1988; (c) the map in 1999; (d) the map in 2007; (e) the map in 2015.
After obtaining the land use/cover classifications, we evaluated their accuracy based on high-resolution remotely sensed data from Google Earth in 2015. First, we randomly selected 50 sampling points for each class using the stratified random sampling method, generating 600 random samples in total (Appendix B). Then, we acquired the real land use/cover type for all sampling points based on the images from the Google Earth and evaluated the accuracy of our results in 2015. Specifically, in the Google Earth images, the four forest types were distinguished according to their spectral characteristics and the textural information in terms of their different canopy. The accuracy assessment revealed an overall accuracy of 91% and a Kappa coefficient of 0.90, indicating that our results were highly accurate (Appendix C).
2.2.2. Analyzing the Dynamics of Forest
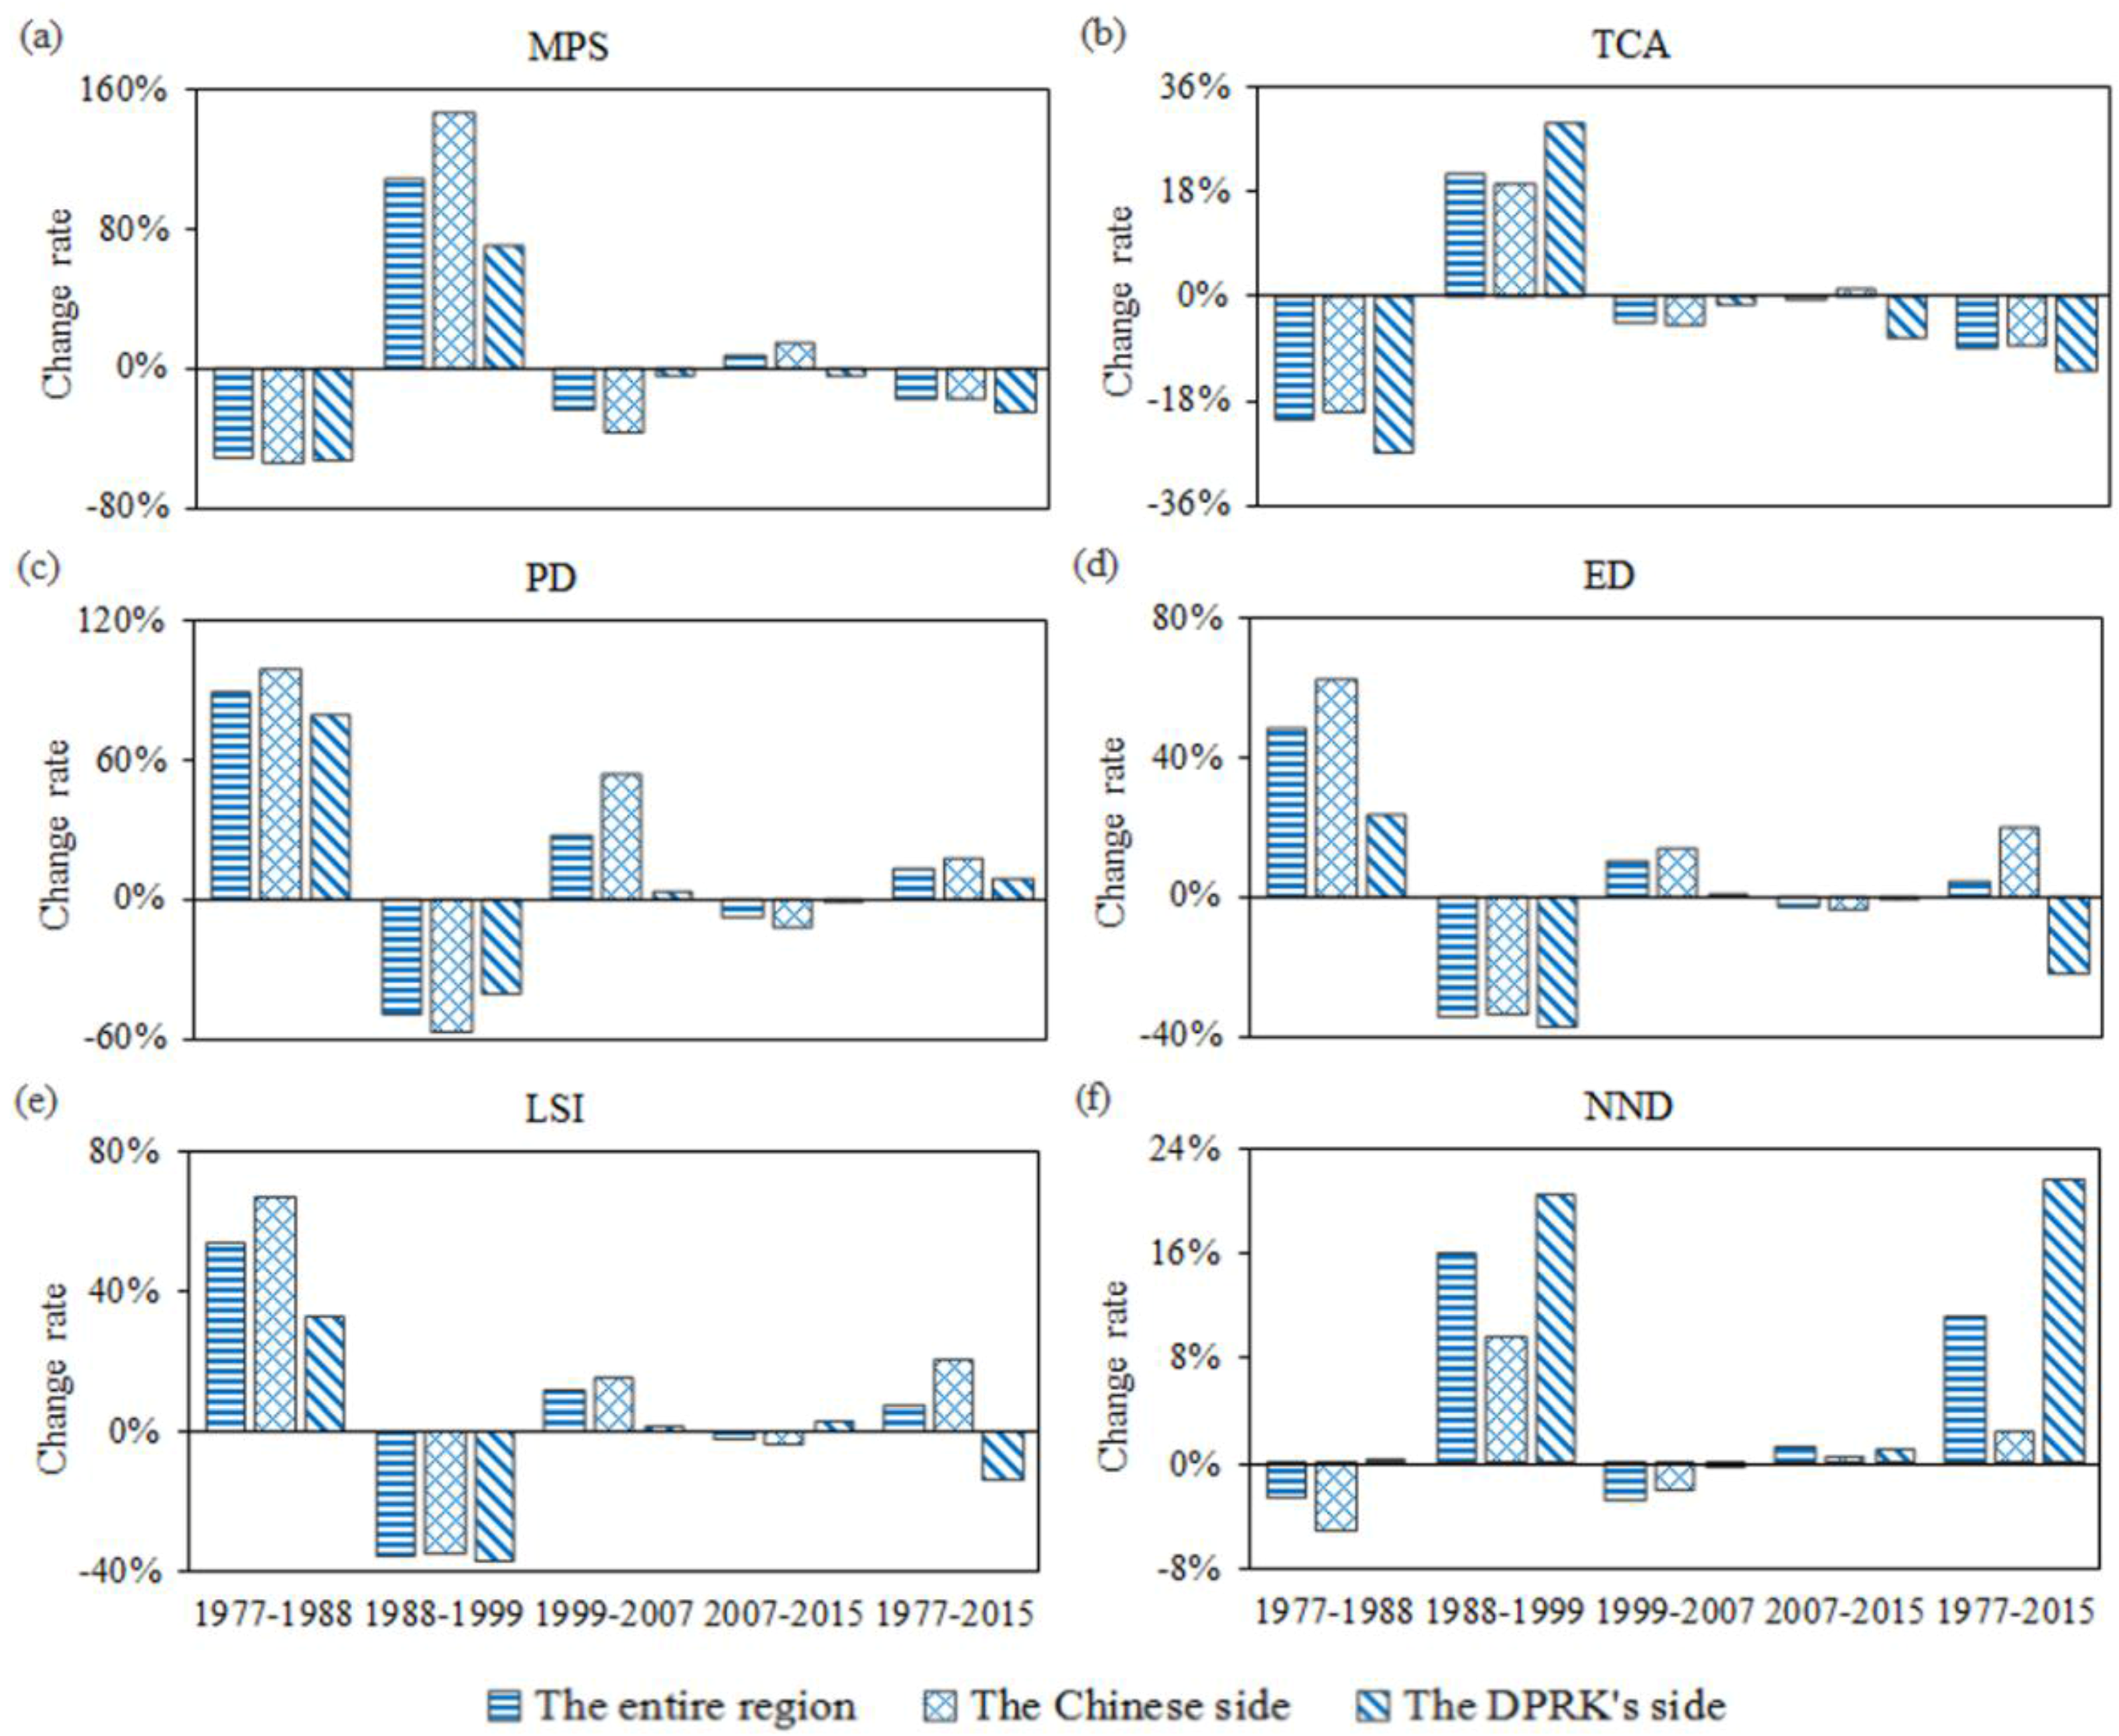
There were three steps for analyzing the dynamics of forest in the TACM from 1977 to 2015. First, we selected six landscape metrics for measuring composition and configuration of forest according to Wu et al. [22] and Liu et al. [30] (Table 2). Specifically, the six landscape metrics could be classified into four groups: (1) area metrics including mean patch size (MPS) and total core area (TCA); (2) density metrics including patch density (PD) and edge density (ED); (3) shape metrics, i.e., the landscape shape index (LSI); and (4) connectivity metrics, i.e., mean Euclidean nearest neighbor distance (NND) (Table 2) (Appendix D). Second, we calculated these landscape metrics for the forest in 1977, 1988, 1999, 2007, and 2015 at two scales: the entire TACM and the sub-regions separated by national boundaries, by using Fragstats 4.2 software [23]. Finally, we analyzed the spatiotemporal patterns of forest in the TACM from 1977 to 2015 by quantifying the changes of landscape metrics at two scales.
Table 2.
The landscape metrics used in this study.
2.2.3. Calculating the Habitat Quality
Following Hall et al. [32], the habitat quality refers to the ability of the ecosystem to provide conditions appropriate for individual and population persistence, and is considered a continuous variable in the model, ranging from low to medium to high, based on resources available for survival, reproduction, and population persistence, respectively. In this study, we used the Integrated Valuation of Ecosystem Services and Tradeoffs (InVEST) model to estimate habitat quality in the TACM [33]. The details can be found in Appendix E. The estimated habitat quality ranged from 0 to 1, representing lowest quality to highest quality [33].
3. Results
3.1. The Spatial Patterns of Forest in the TACM in 2015
The forest covered 1.48 million ha, approximately 80.65% of the total area of the TACM in 2015 and was dominated by mixed forest and broadleaf forest (Figure 3a, Table 3). Specifically, among the four types of forest, mixed forest had the largest area, 0.74 million ha, or 40.28% of the entire region, while broadleaf forest and coniferous forest occupied 0.55 million ha and 0.19 million ha, or 30.02% and 10.08% of the entire TACM area, respectively. Alpine birch forest occupied the smallest area, only 0.005 million ha or 0.27% of the entire TACM. In 2015, the MPS and the TCA for forest in the TACM were 83.00 ha and 1.11 million ha, respectively, and the PD and ED were 0.97 and 29.85 m/ha, respectively. In addition, the LSI was 114.12 and the NND was 97.78 m (Table 4).
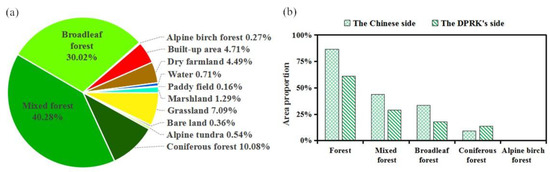
Figure 3.
The forest in the TACM in 2015: (a) the proportion of forest in the total area; and (b) the forest proportions on the Chinese and DPRK sides.
Table 3.
Changes in forested area in the TACM from 1977 to 2015.
Table 4.
The changes in landscape metrics for the forest in the TACM from 1977 to 2015.
The forest coverage on the Chinese side of the TACM was much higher than that on the DPRK’s side (Figure 3b, Table 3). On the Chinese side, the forested area occupied 1.23 million ha (Table 3), approximately 86.42% of the regional area, whereas the forested area and proportion on the DPRK’s side were 0.25 million ha and 60.84%, respectively. The forest coverage percentage on the Chinese side was 1.42 times greater than that on the DPRK’s side. Among the four types of forest, the proportions of mixed forest and broadleaf forest on the Chinese side were higher than that on the DPRK’s side. The total areas of mixed forest and broadleaf forest on the Chinese side were 0.62 million ha and 0.48 million ha or 43.60% and 33.80% of the regional area, respectively, while on the DPRK’s side, these two forest types covered 0.12 million ha and 0.07 million ha or 28.86% and 17.74% of the regional area, respectively (Table 3). The proportions of mixed and broadleaf forest on the Chinese side were 1.51 and 1.27 times those on the DPRK’s side, respectively.
The forest was more fragmented on the DPRK’s side than on the Chinese side (Figure 4, Table 4). The PD, ED and NND values for forest on the DPRK’s side (i.e., 1.90, 34.87 m/ha and 107.69 m, respectively) were 2.75, 1.23, and 1.20 times those on the Chinese side (0.69, 28.30 m/ha, and 89.41 m, respectively). Additionally, the MPS, TCA and LSI values for forest on the DPRK’s side (31.95 ha, 0.17 million ha, and 72.95, respectively) were 74.41%, 81.91%, and 20.91% lower than those on the Chinese side (124.88 ha, 0.94 million ha and 92.24, respectively).
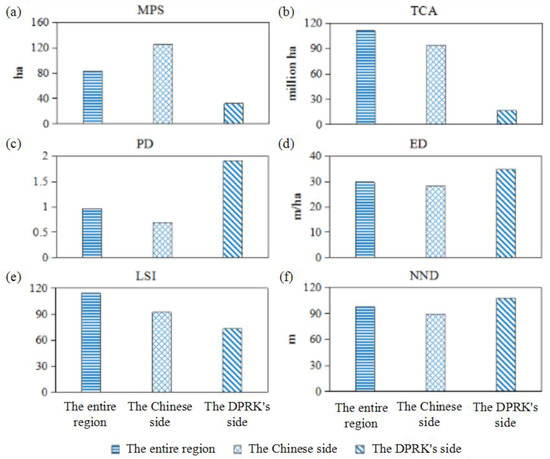
Figure 4.
The values of landscape metrics for forest in the TACM in 2015: (a) the value of MPS; (b) the value of TCA; (c) the value of PD; (d) the value of ED; (e) the value of LSI; (f) the value of NND.
3.2. The Dynamics of Forest in the TACM from 1977 to 2015
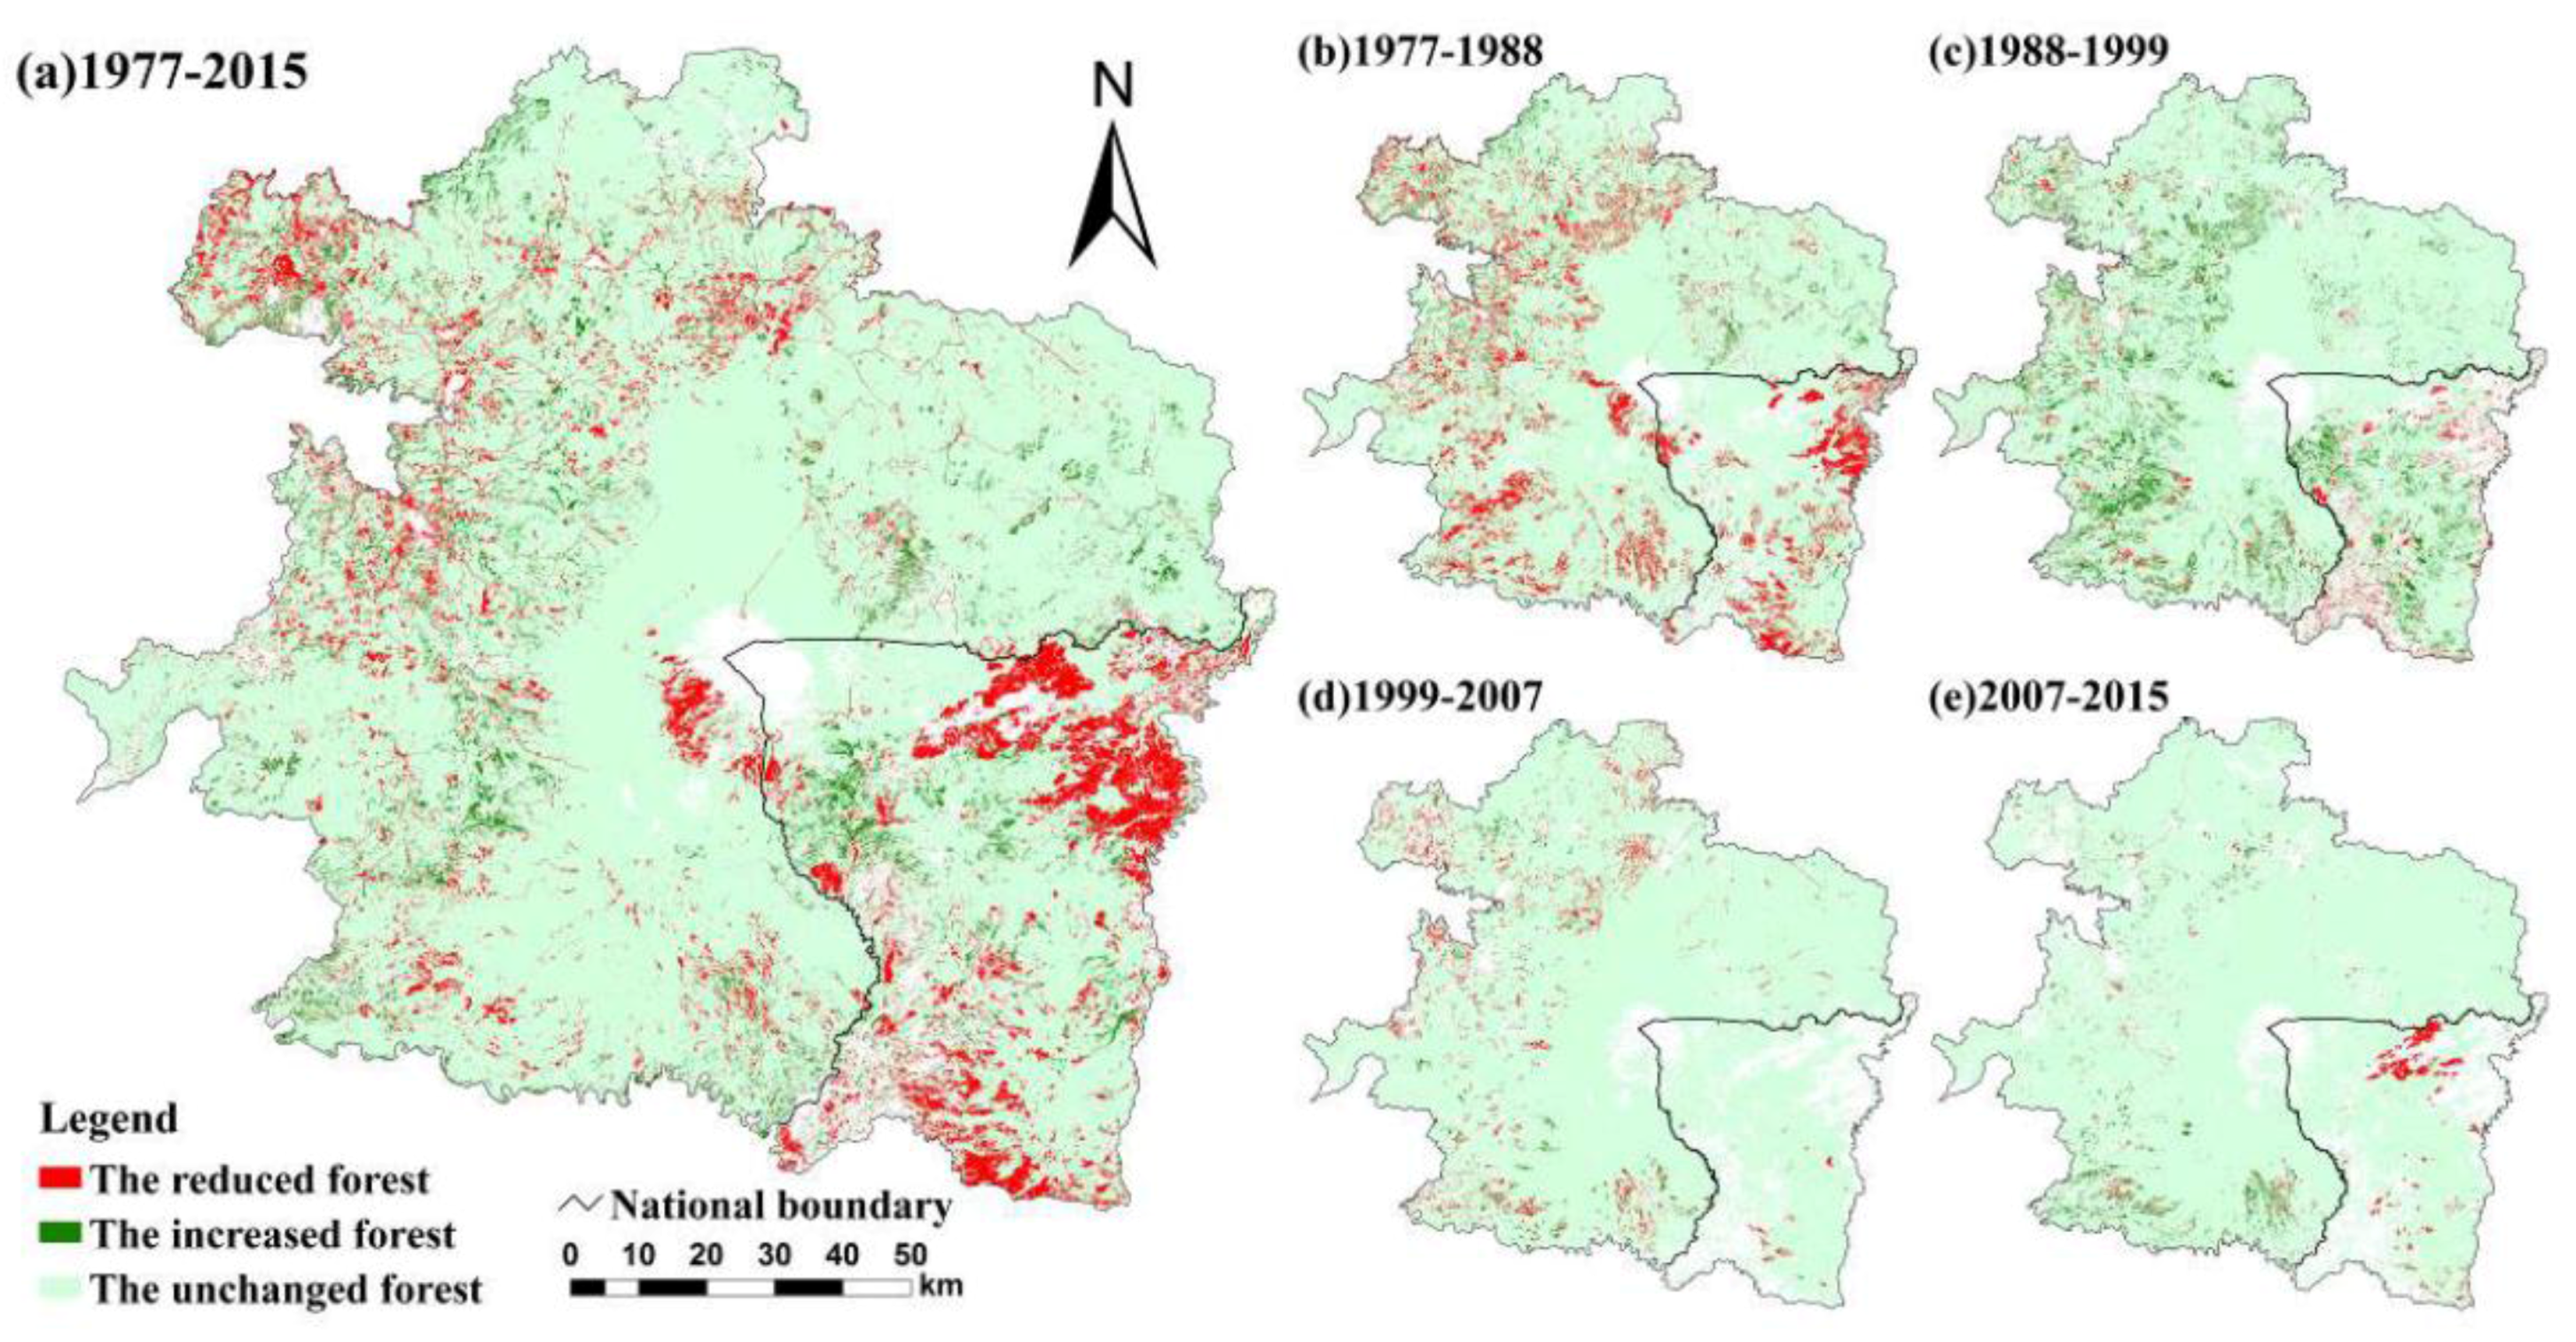
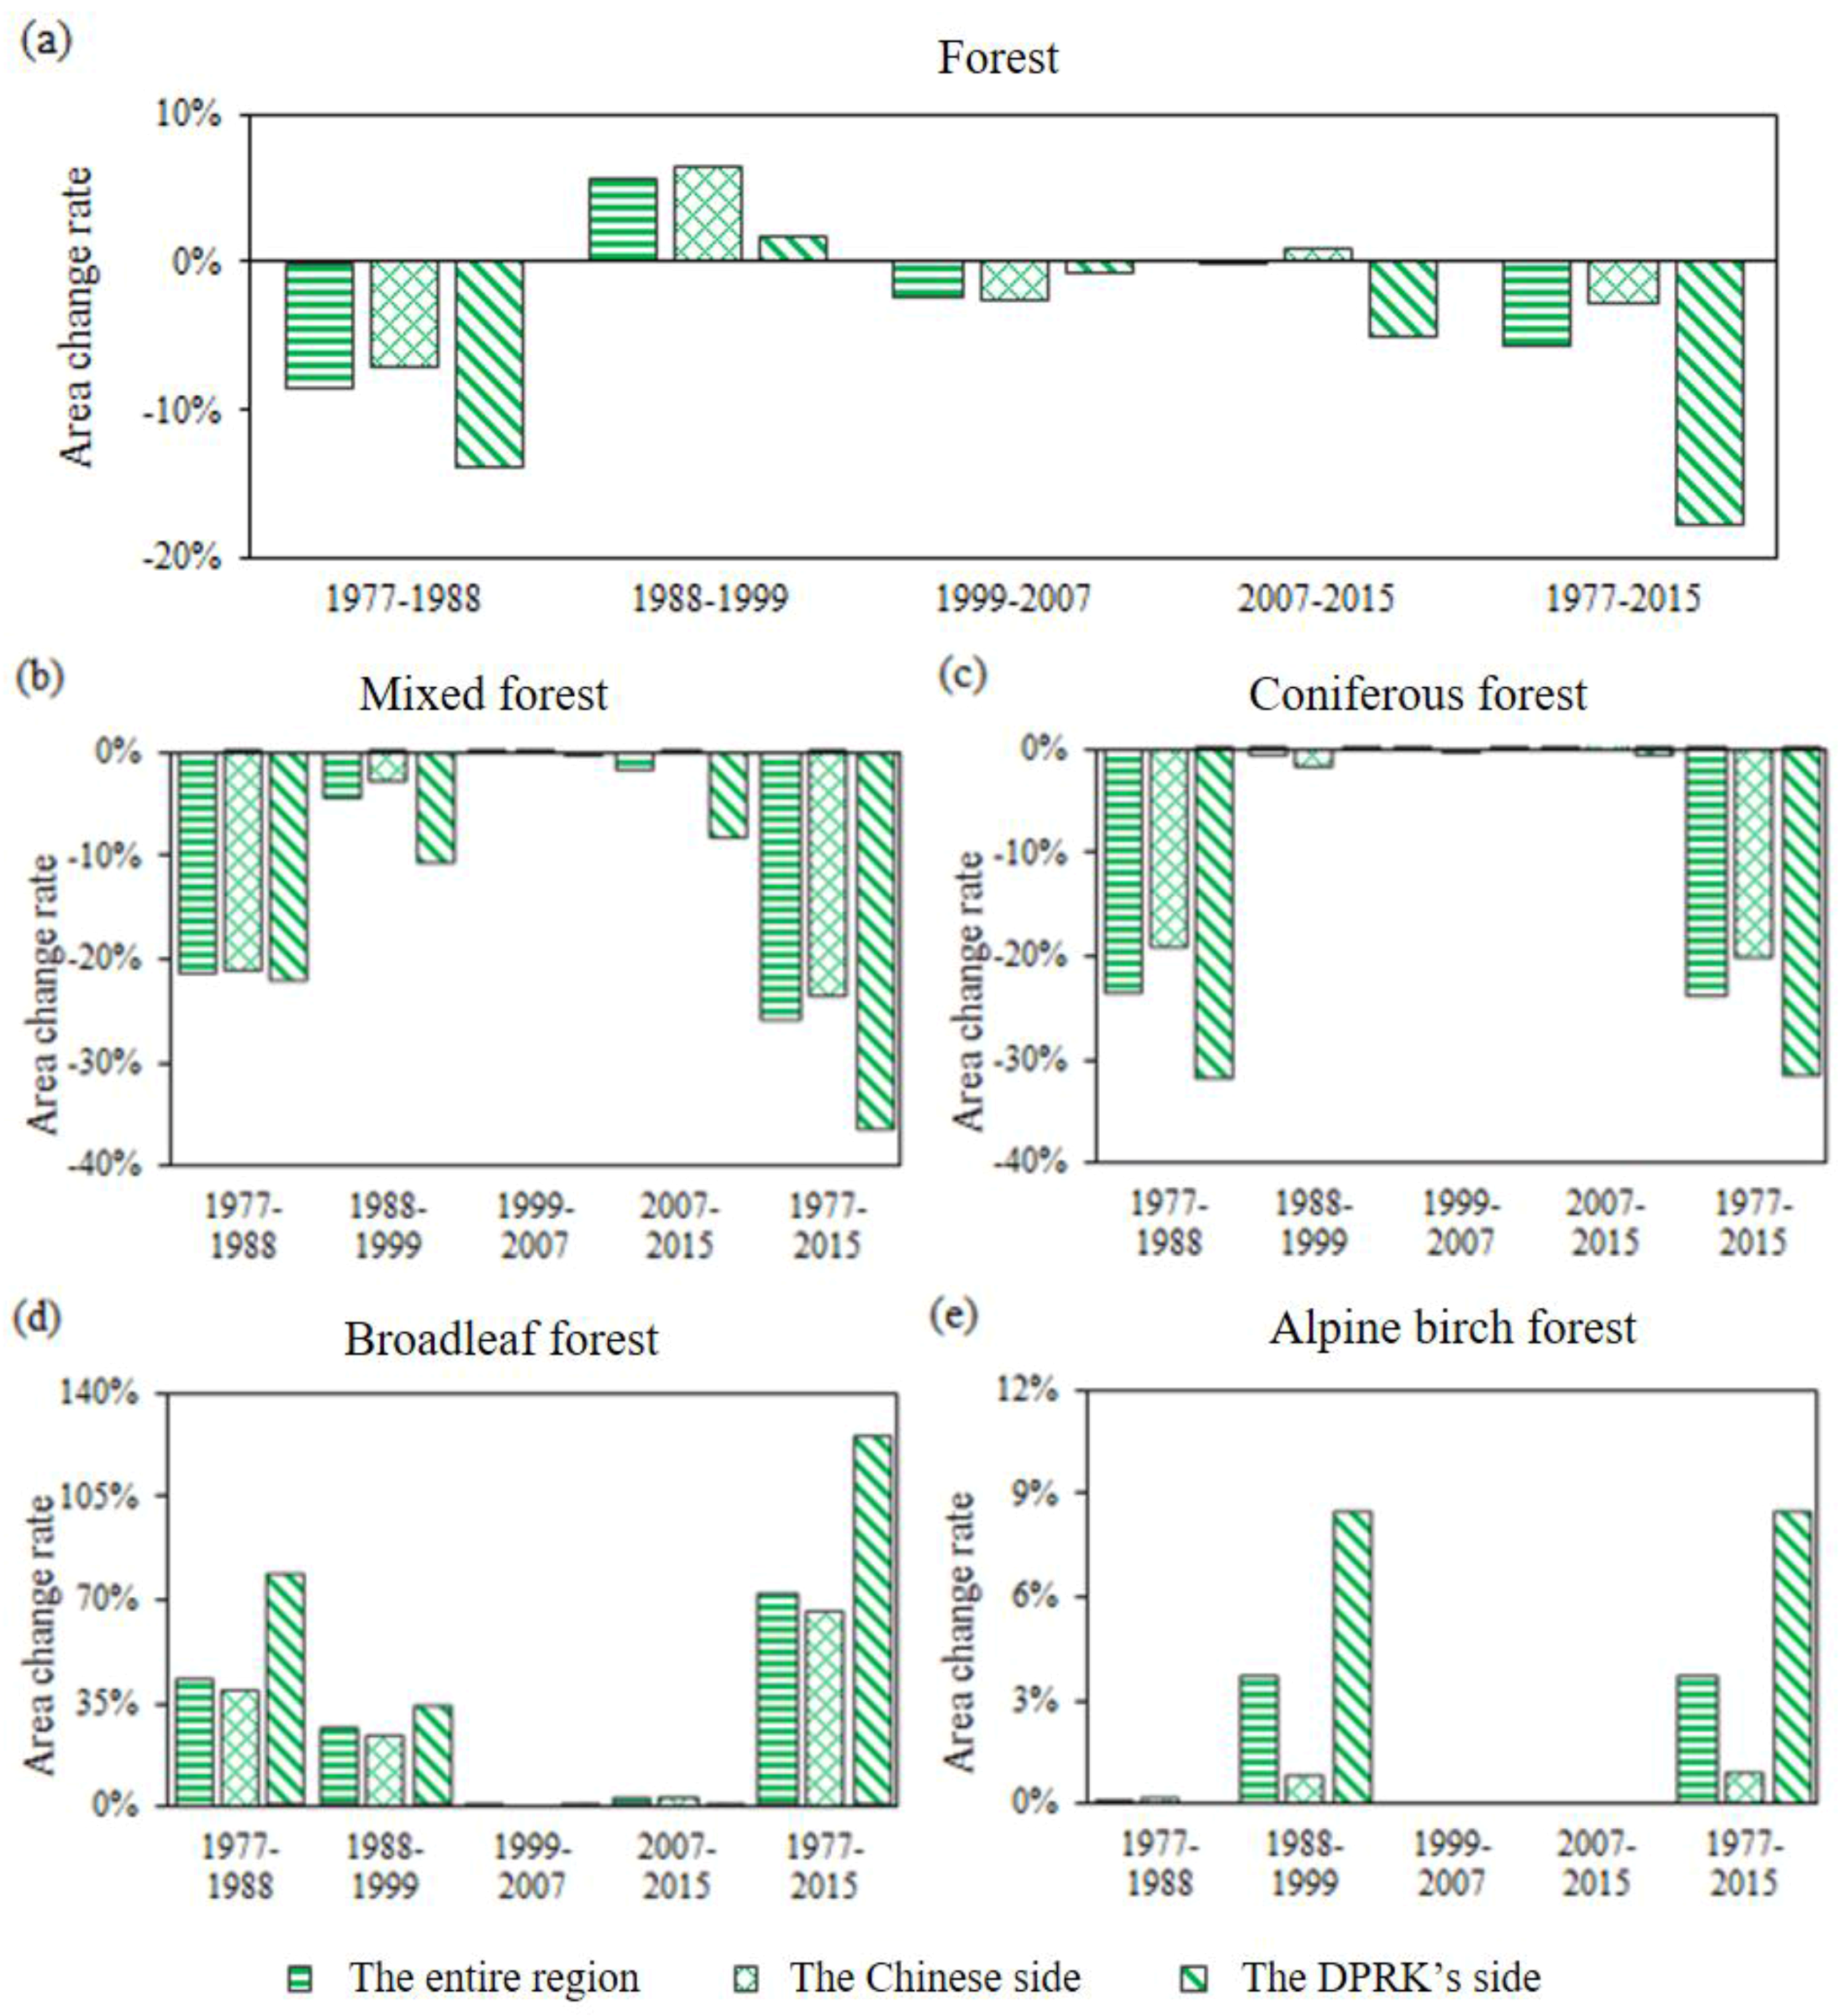
Between 1977 and 2015, the forest in the TACM showed an obvious decline—falling from 1.57 million ha to 1.48 million ha—a loss of 5.76% (Figure 5a and Figure 6a, Table 3). Moreover, the fastest rate of forest decline in the TACM occurred between 1977 and 1988, with a decrease from 1.57 million ha to 1.44 million ha, a loss of 8.47% (Figure 5a and Figure 6a). Among the four types of forest, mixed forest showed the fastest decline (from 1.00 million ha to 0.74 million ha—a loss of 26.14%) and was followed by coniferous forest (from 0.24 million ha to 0.19 million ha—a loss of 24.19%) (Figure 6b,c). In addition, the forest in the TACM experienced a fragmentation process in which PD, ED, LSI, and NND increased and MPS and TCA decreased from 1977 to 2015 (Figure 7, Table 4). The fastest growth of PD, ED, and LSI and the fastest decline of MPS and TCA occurred between 1977 and 1988. The fastest increase in NND occurred between 1988 and 1999.
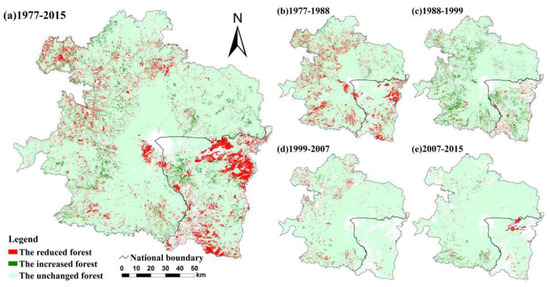
Figure 5.
The spatial dynamics of forest in the TACM from 1977 to 2015: (a) the dynamics from 1977 to 2015; (b) the dynamics from 1977 to 1988; (c) the dynamics from 1988 to 1999; (d) the dynamics from 1999 to 2007; (e) the dynamics from 2007 to 2015.
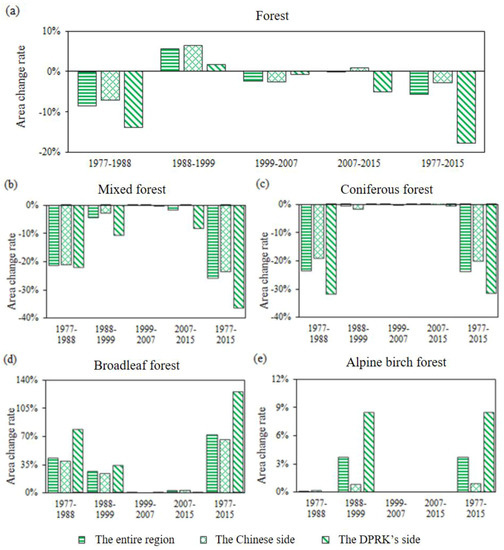
Figure 6.
Quantitative changes of forest in the TACM from 1977 to 2015: (a) the changes of forest; (b) the changes of mixed forest; (c) the changes of coniferous forest; (d) the changes of broadleaf forest; (e) the changes of alpine birch forest.
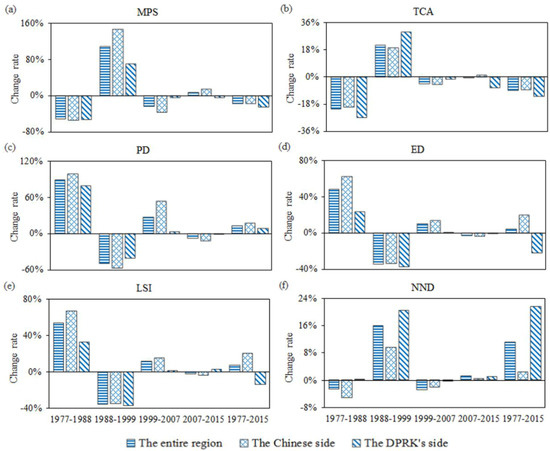
Figure 7.
Changes in the landscape metrics for the forest in the TACM from 1977 to 2015: (a) the value of MPS; (b) the value of TCA; (c) the value of PD; (d) the value of ED; (e) the value of LSI; (f) the value of NND.
While both sub-regions experienced forest decreases, the DPRK side had a higher rate of forest loss from 1977 to 2015 (Figure 6a). The forest on the DPRK’s side decreased from 0.31 million ha to 0.25 million ha (a decline of 17.75%), whereas the forest on the Chinese side decreased from 1.27 million ha to 1.23 million ha (a decline of 2.86%) (Table 3). The rate of decline of the forest on the DPRK’s side was 6.21 times greater than that on the Chinese side. Across the four periods, both sides experienced the fastest rate of forest decrease between 1977 and 1988 (Figure 6a). Among the four types of forest, mixed forest underwent the most obvious decrease on both sides, followed by coniferous forest (Figure 6b,c).
The DPRK’s side experienced faster declines of MPS and TCA as well as more rapid growth of NND than did the Chinese side (Figure 7). Specifically, the MPS and TCA on the DPRK’s side decreased by 24.68% (from 42.42 ha to 31.95 ha) and 12.86% (from 0.19 million ha to 0.17 million ha), respectively. On the Chinese side, MPS and TCA decreased by 16.91% (from 150.30 ha to 124.88 ha) and 8.22% (from 1.02 million ha to 0.94 million ha), respectively (Table 4). The decrease rates of MPS and TCA on the DPRK’s side were 1.46 and 1.56 times greater than those on the Chinese side, respectively. In addition, the growth of NND (21.67%, from 88.51 m to 107.69 m) on the DPRK’s side was 9.22 times that (2.35%, from 87.36 m to 89.41 m) on the Chinese side (Table 4).
3.3. The Main Causes of Forest Loss and Fragmentation
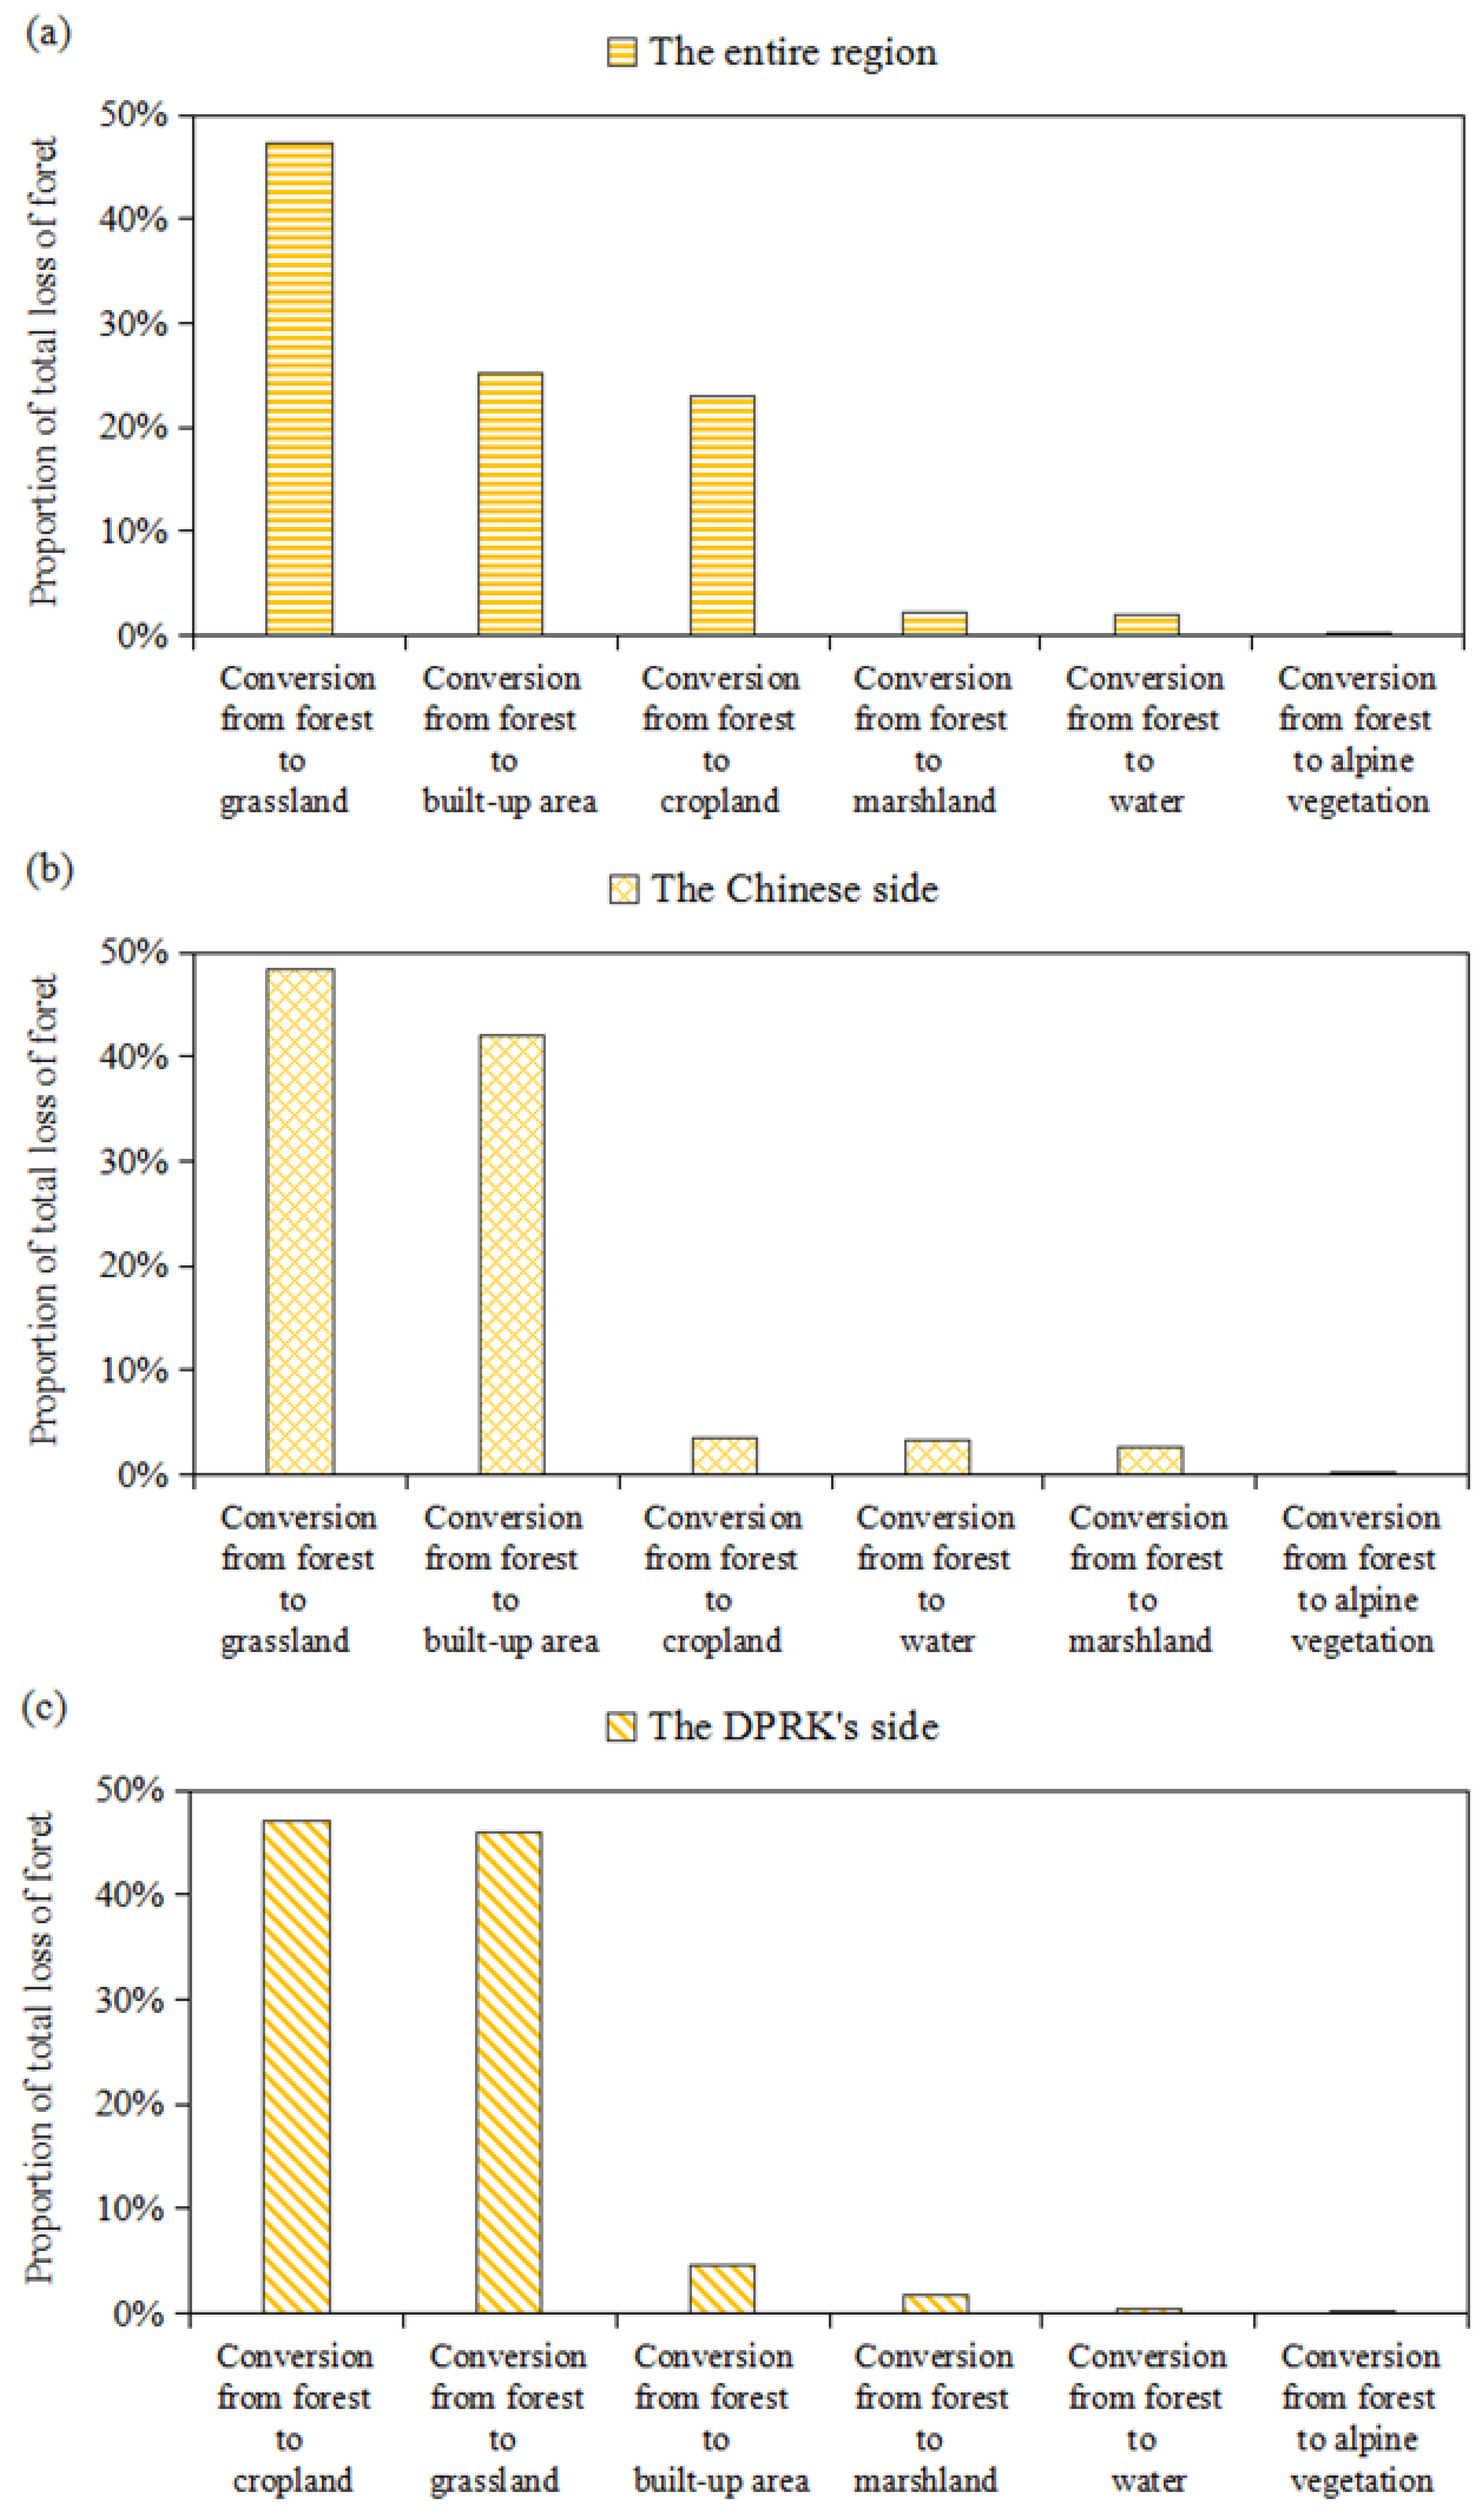
Forest loss and fragmentation in the TACM were mainly caused by timber harvesting, urban expansion, agricultural reclamation, and typhoon disasters. Specifically, the conversion from forest to grassland that occurred because of timber harvesting and typhoon disasters accounted for 0.08 million ha or 47.3% of the total forest loss in the TACM from 1977 to 2015 (Table 5, Figure 8 and Figure 9). Notably, the No. 15 typhoon “Vera” destroyed approximately 0.01 million ha of forest in 1986 [13] (Figure 9e). In addition, conversions from forest to built-up areas accounted for 0.04 million ha or 25.26% of the total forest loss and was followed by the conversion from forest to cropland (0.04 million ha or 23.10%) (Table 5, Figure 8 and Figure 9).
Table 5.
Conversion from forest to other land use/cover types in the TACM from 1977 to 2015.
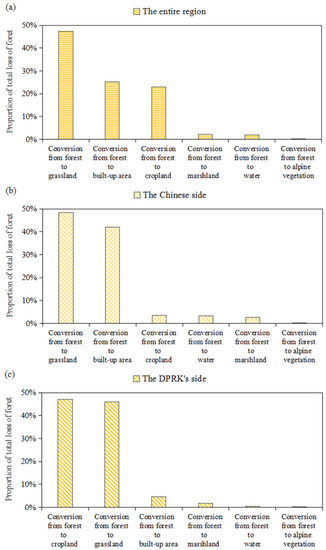
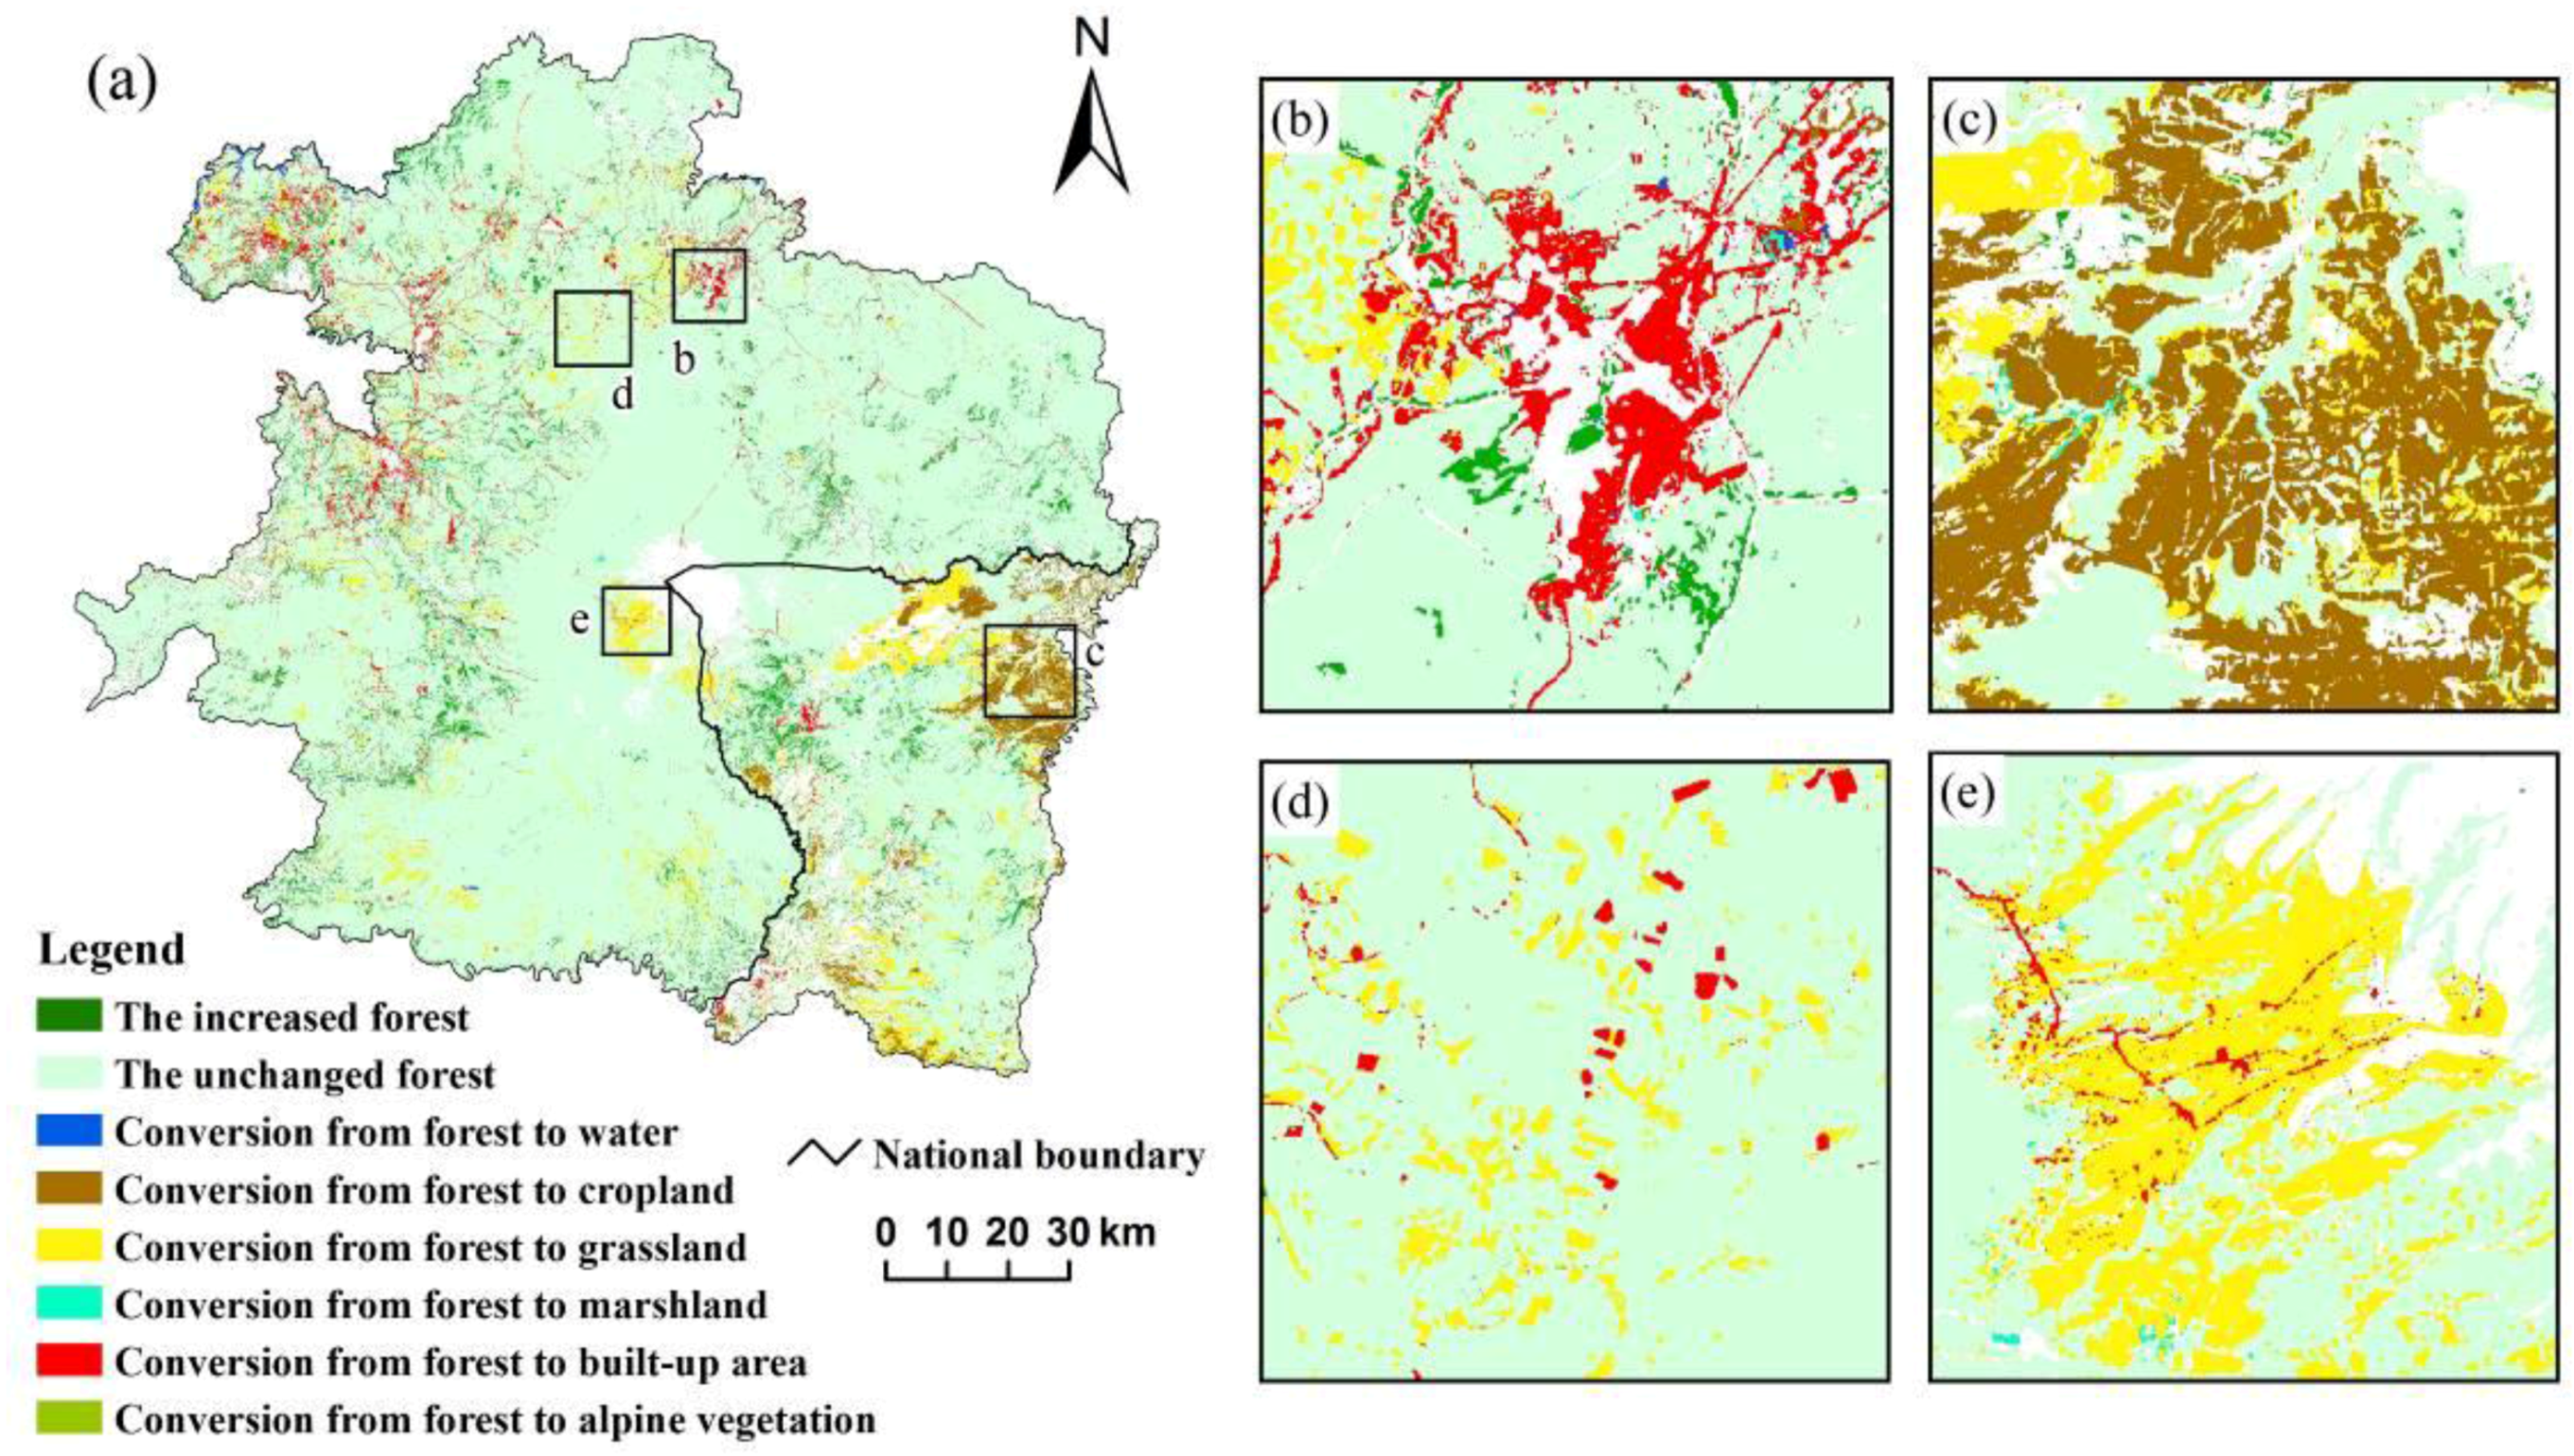
Figure 8.
Conversion from forest to other land use/cover types in the TACM from 1977 to 2015: (a) the conversion in the entire region; (b) the conversion in the Chinese side; (c) the conversion in the DPRK’s side.
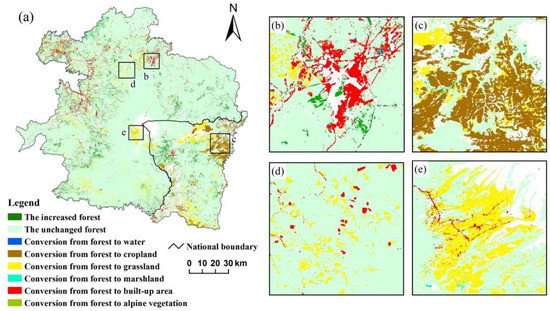
Figure 9.
The spatial patterns of the conversion from forest to other land use/cover types in the TACM from 1977 to 2015: (a) the entire region; (b) urban expansion; (c) agricultural reclamation; (d) timber harvesting; and (e) typhoon disaster induced-area.
In addition to conversions from forest to grassland, the DPRK’s side experienced large-scale conversion of forest to cropland while the Chinese side showed a wide range of forest converted to built-up areas (Table 5, Figure 8 and Figure 9). The DPRK’s side was dominated by the conversion of forest to croplands and grasslands; together, these accounted for 0.03 million ha (nearly half) of the total forest loss (Figure 8c, Table 5). The Chinese side was dominated by the conversion of forest to grasslands and built-up areas; together, these accounted for 0.04 million ha (again, nearly 50%) of the total forest loss (Figure 8b, Table 5).
3.4. The Impacts of Forest Loss and Fragmentation on Habitat Quality
Habitat quality showed a decreasing trend, from 0.76 in 1977 to 0.71 in 2015, a decrease of 7.10%, owing to the forest loss and fragmentation in the TACM (Figure 10, Table 6). The decrease in habitat quality was much higher on the DPRK’s side (9.44%, from 0.75 to 0.68) than on the Chinese side (6.44%, from 0.77 to 0.72) (Figure 10). In addition, the period from 1977 to 1988 showed the fastest decrease of habitat quality in the entire region and on both sides (Figure 10, Table 6).
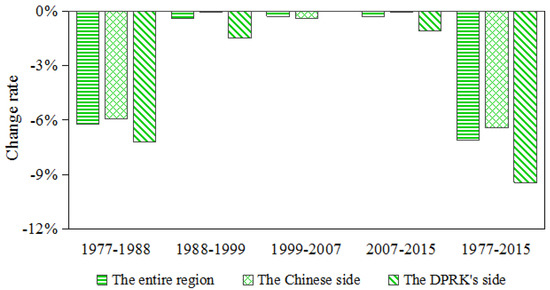
Figure 10.
Changes in habitat quality in the TACM from 1977 to 2015.
Table 6.
The changes in habitat quality in the TACM from 1977 to 2015.
4. Discussion
4.1. The Implications for Biodiversity Conservation
The habitat quality decline caused by forest loss and fragmentation poses an obvious threat to regional biodiversity. According to the Red List of Threatened Species published by the International Union for Conservation of Nature (IUCN), among the over 500 species surveyed in the TACM, 11 species (e.g., Mergus squamatus, Grus japonensis, and Bubo blakistoni) are endangered (EN), Tadorna cristata is critically endangered (CR), and Chaunoproctus ferreorostris has become extinct (EX) [34,35]. Declining habitat quality is the primary threat to these species [36]. In addition, Piao [17] found that the Siberian tiger went extinct in the TACM in the 1980s, the period during which the habitat quality experienced the fastest decline. Wang et al. [37] found that road construction in the TACM between 2007 and 2014 led to 7910 amphibian deaths, most of which involved Rana chensinensis, Bombina orientalis, and Bufo gargarizans. Wang et al. [38] showed that there was a considerable decrease in the biodiversity of soil nematodes because of cropland reclamation, which caused habitat destruction in the Jinchuan Wetland in the TACM.
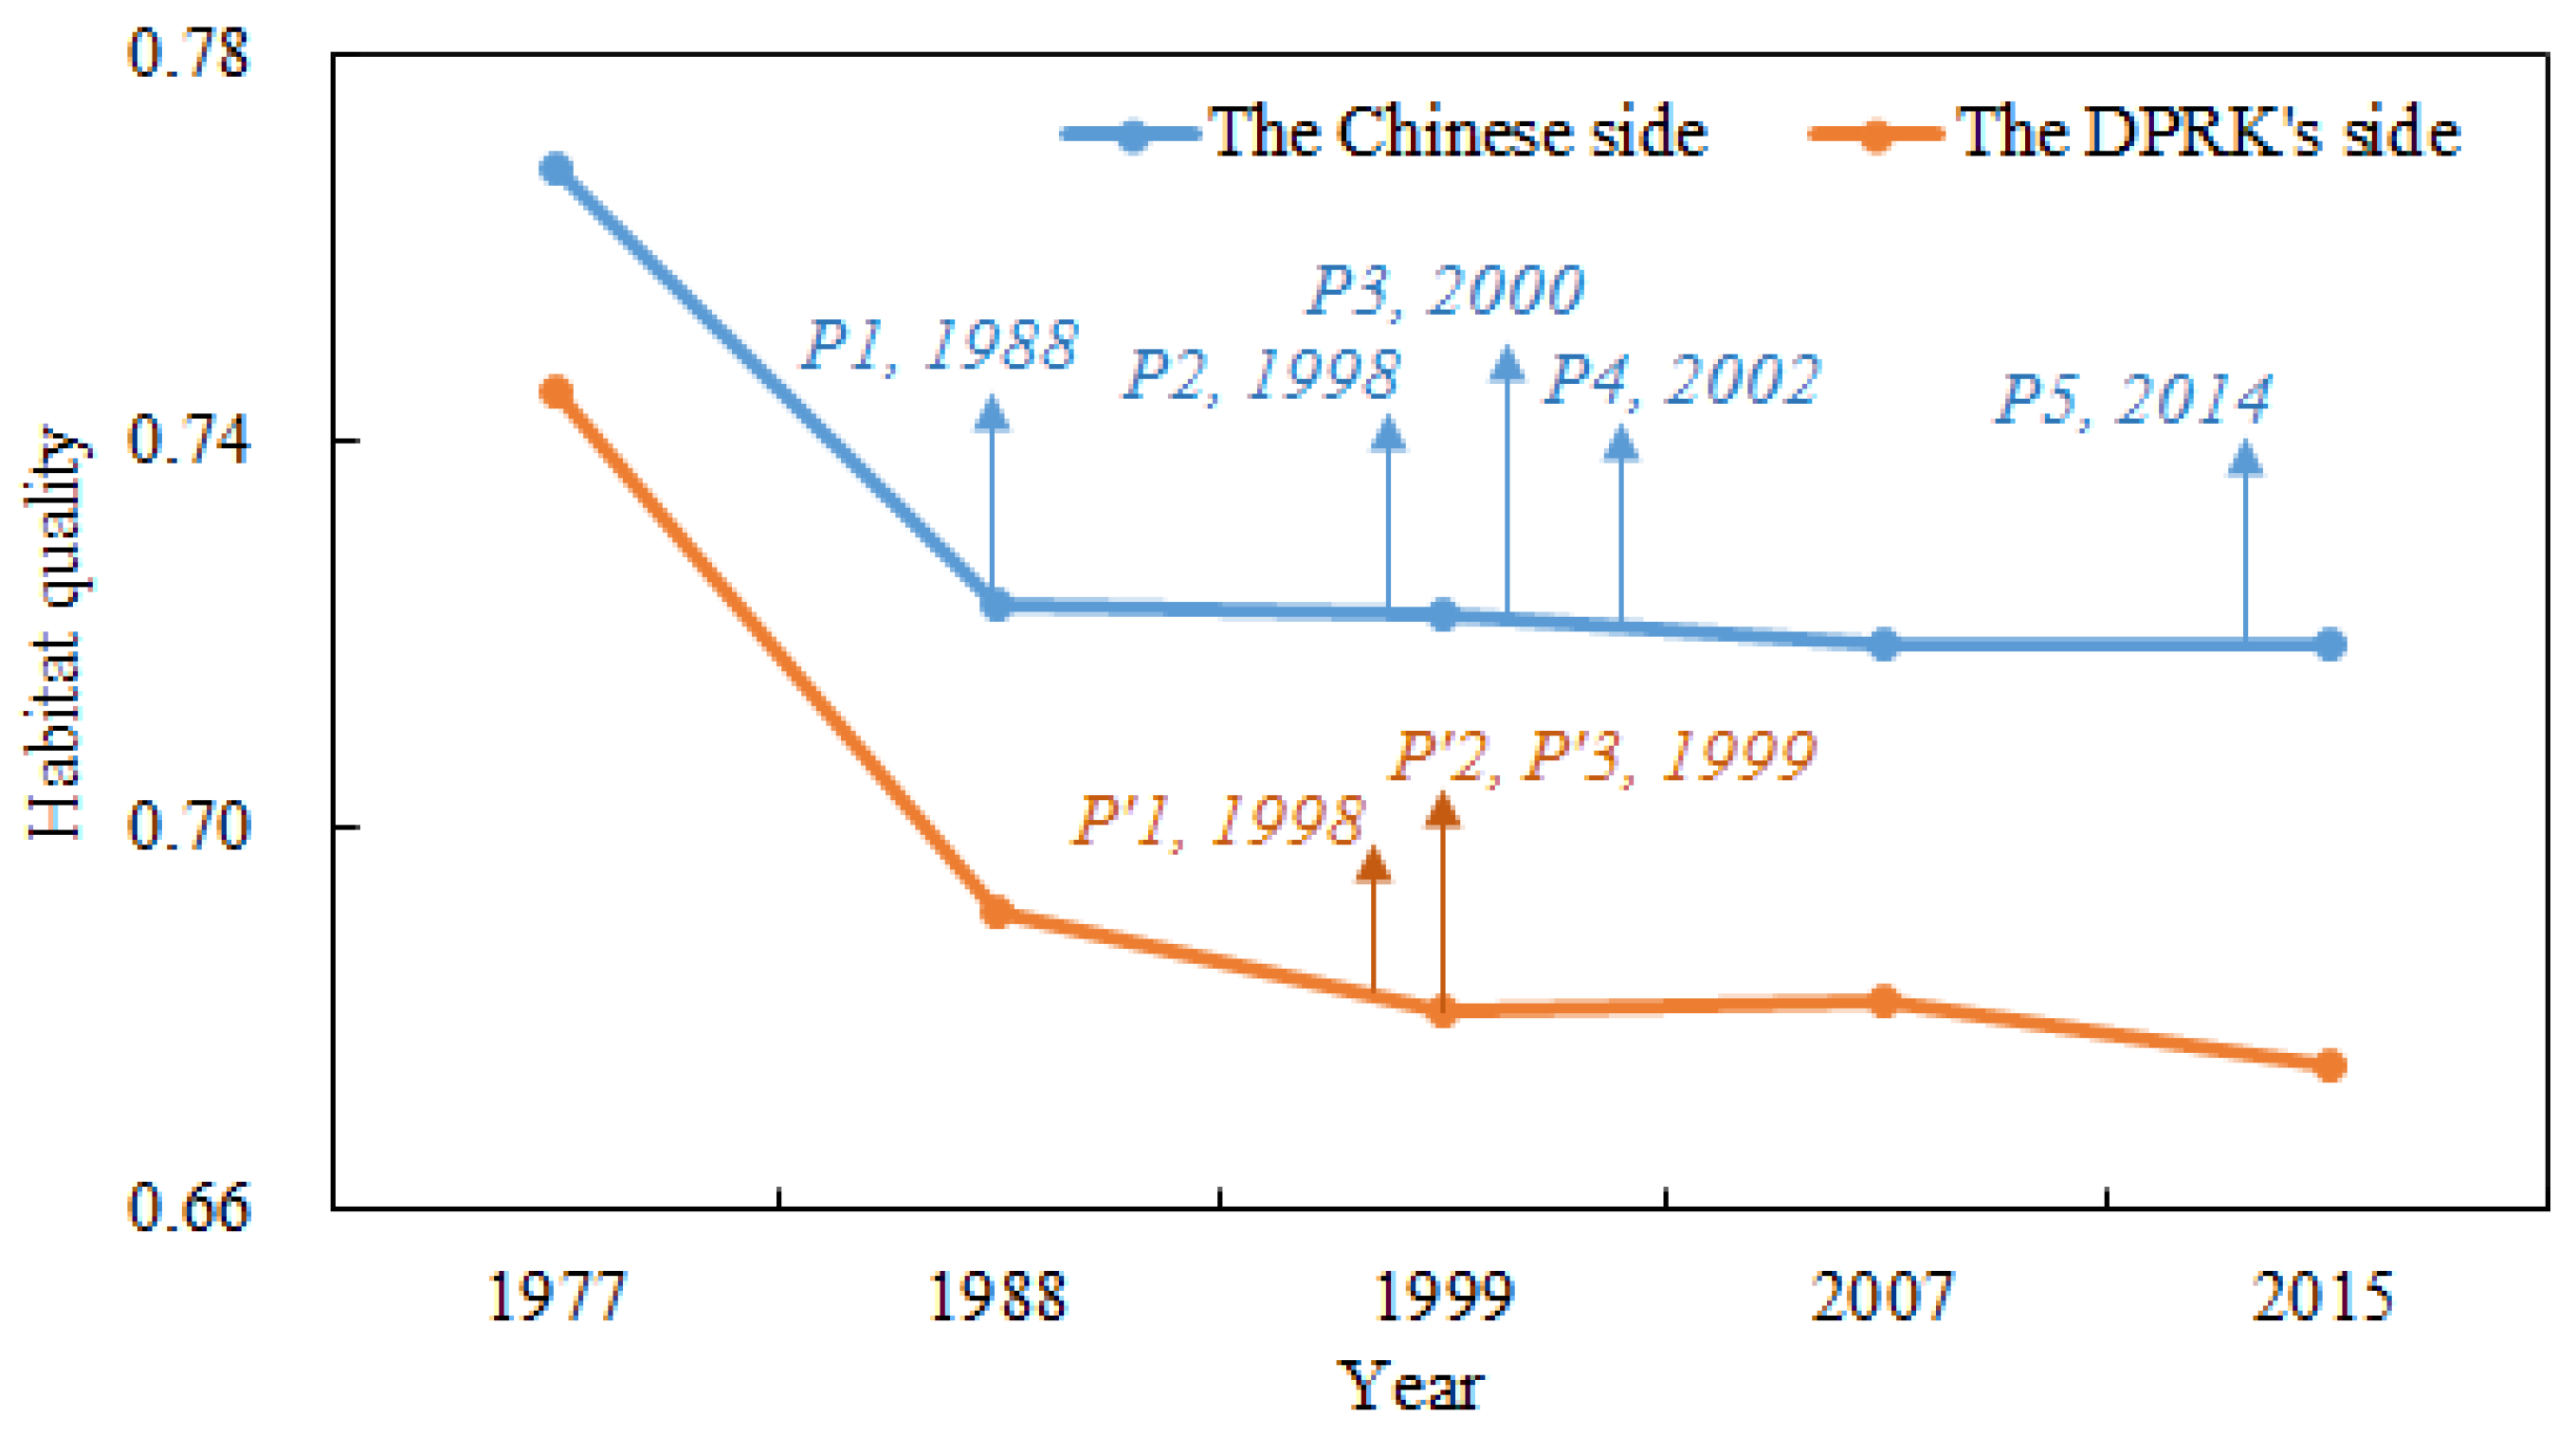
At present, both China and the DPRK have developed a series of policies and regulations to protect the forest and habitat quality in the TACM (Figure 11). For example, China issued the “Changbai Mountain National Nature Reserve Management Regulations in Jilin Province” directive in 1988, the amended “Land Management Law of the People’s Republic of China” in 1998, the “Implementation program for the Northeast, Inner Mongolia and other key state-owned forest natural resources protection project” in 2000, “a number of opinions on further improving the policy of Grain for Green” in 2002, and “a new round for the overall program of Grain for Green” in 2014 [21,39]. Simultaneously, the DPRK developed the “Land and Environmental Conservation Management Law” in 1998 and amended its “Forest Law” and “Environmental Protection Law” in 1999. As a result of the implementation of these policies and regulations, the decline rate of habitat quality obviously slowed after 1988 in the Chinese side and 1999 in the DPRK’s side, respectively (Figure 11).
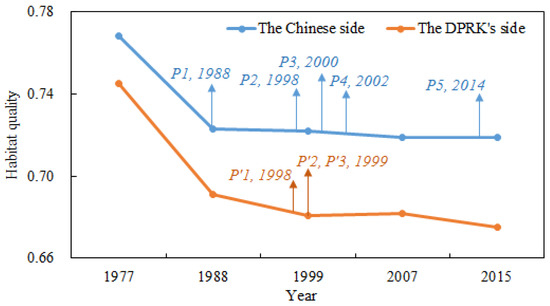
Figure 11.
The implication of conservation policy on habitat quality in the two sub-regions. Name of policy: P1 (Changbai Mountain National Nature Reserve Management Regulations in Jilin Province); P2 (Land Management Law of the People’s Republic of China); P3 (Implementation program for the Northeast, Inner Mongolia and other key state-owned forest natural resources protection project); P4 (a number of opinions on further improving the policy of Grain for Green); P5 (a new round for the overall program of Grain for Green); P’1 (Land and Environmental Conservation Management Law); P’2 (Forest Law); and P’3 (Environmental Protection Law).
However, the large-scale development of tourism facilities and increasing urbanization on the Chinese side and the continuous cropland reclamation in response to food shortages on the DPRK’s side have led to continuous forest losses and increased fragmentation in the TACM [40]. Moreover, the cooperation between China and the DPRK is insufficient in terms of the time period and spatial extent on the implementation of these policies and regulations, leading to low efficiency and conflicts on forest conservation [2]. For example, the “new round for the overall program of Grain for Green” was implemented in China after 2014, with the target to further improve habitat quality. However, the benefits from such program on biodiversity conservation in the entire TACM are constrained since the corresponding policy was not developed in the DPRK.
Therefore, we suggest that China and the DPRK should strengthen their cooperation [2,41,42] and conduct rational and effective measures to alleviate the conflicts between socio-economic development and environmental protection [9,43] with the goal of improving regional forest coverage to maintain and promote sustainability in the TACM.
4.2. Limitations and Future Perspectives
There are some limitations to our research. For example, we only analyzed the dynamics of forest changes in the TACM and did not consider the changes in their ecosystem functions and services. Limited by the data availability, we only assessed the accuracy of land use/cover map in 2015. However, we found that our results were consistent with relevant research. According to Zheng et al. [18] and Ma et al. [21], the proportion of forest decreased from 84.40% to 71.05% in the Changbai Mountain region, showing a consistent trend with our results. Such consistency evidenced that our measurement of forest dynamics was reliable.
In future studies, we plan to measure the forest ecosystem functions and services in the TACM to further reveal the relationships between forest ecosystem services and regional human well-being [44,45]. In addition, the combination of Landsat time-series data and LiDAR data can help us to understand the dynamics of forest ecosystem functions and services more frequently and accurately [46].
5. Conclusions
The TACM underwent forest loss and fragmentation from 1977 to 2015 but at much higher levels on the DPRK side than on the Chinese side. Forest losses and fragmentation were caused mainly by timber harvesting, urban expansion, agricultural reclamation, and typhoon disasters. Timber harvesting and agricultural reclamation constituted the main reasons on the DPRK’s side, while urban expansion, typhoon disasters, and timber harvesting were the dominant factors on the Chinese side. In addition, forest shrinkage and fragmentation in the TACM have led to an obvious decline in habitat quality, resulting in regional extinction of several species (e.g., Siberian tiger) and threatening biodiversity over large extents. To protect biodiversity and promote sustainable development, we suggest that China and the DPRK should collaborate to implement rational and efficient strategies to relieve the conflict between socio-economic development and environmental protection and improve regional forest coverage in the TACM.
Acknowledgments
We would like to thank Li Jingwei and Ding Meihui from Beijing Normal University for their helpful suggestions and revisions. We also want to express our respects and gratitude to the anonymous reviewers and editors for their professional comments and suggestions. This work has been supported in part by the National Natural Science Foundation of China [Grant Number 41501195 and 41071333].
Author Contributions
Hui Tao and Zhi-Feng Liu collected and processed the data, performed analysis and wrote the paper. Ying Nan and Zhi-Feng Liu conceived and designed the study and wrote the paper. All authors reviewed and edited the draft, approved the submitted manuscript, agreed to be listed and accepted the version for publication.
Conflicts of Interest
The authors declare no conflict of interest.
Appendix A. The Field Survey Routes and Interpretation Criteria

Figure A1.
The field survey routes.
Figure A1.
The field survey routes.
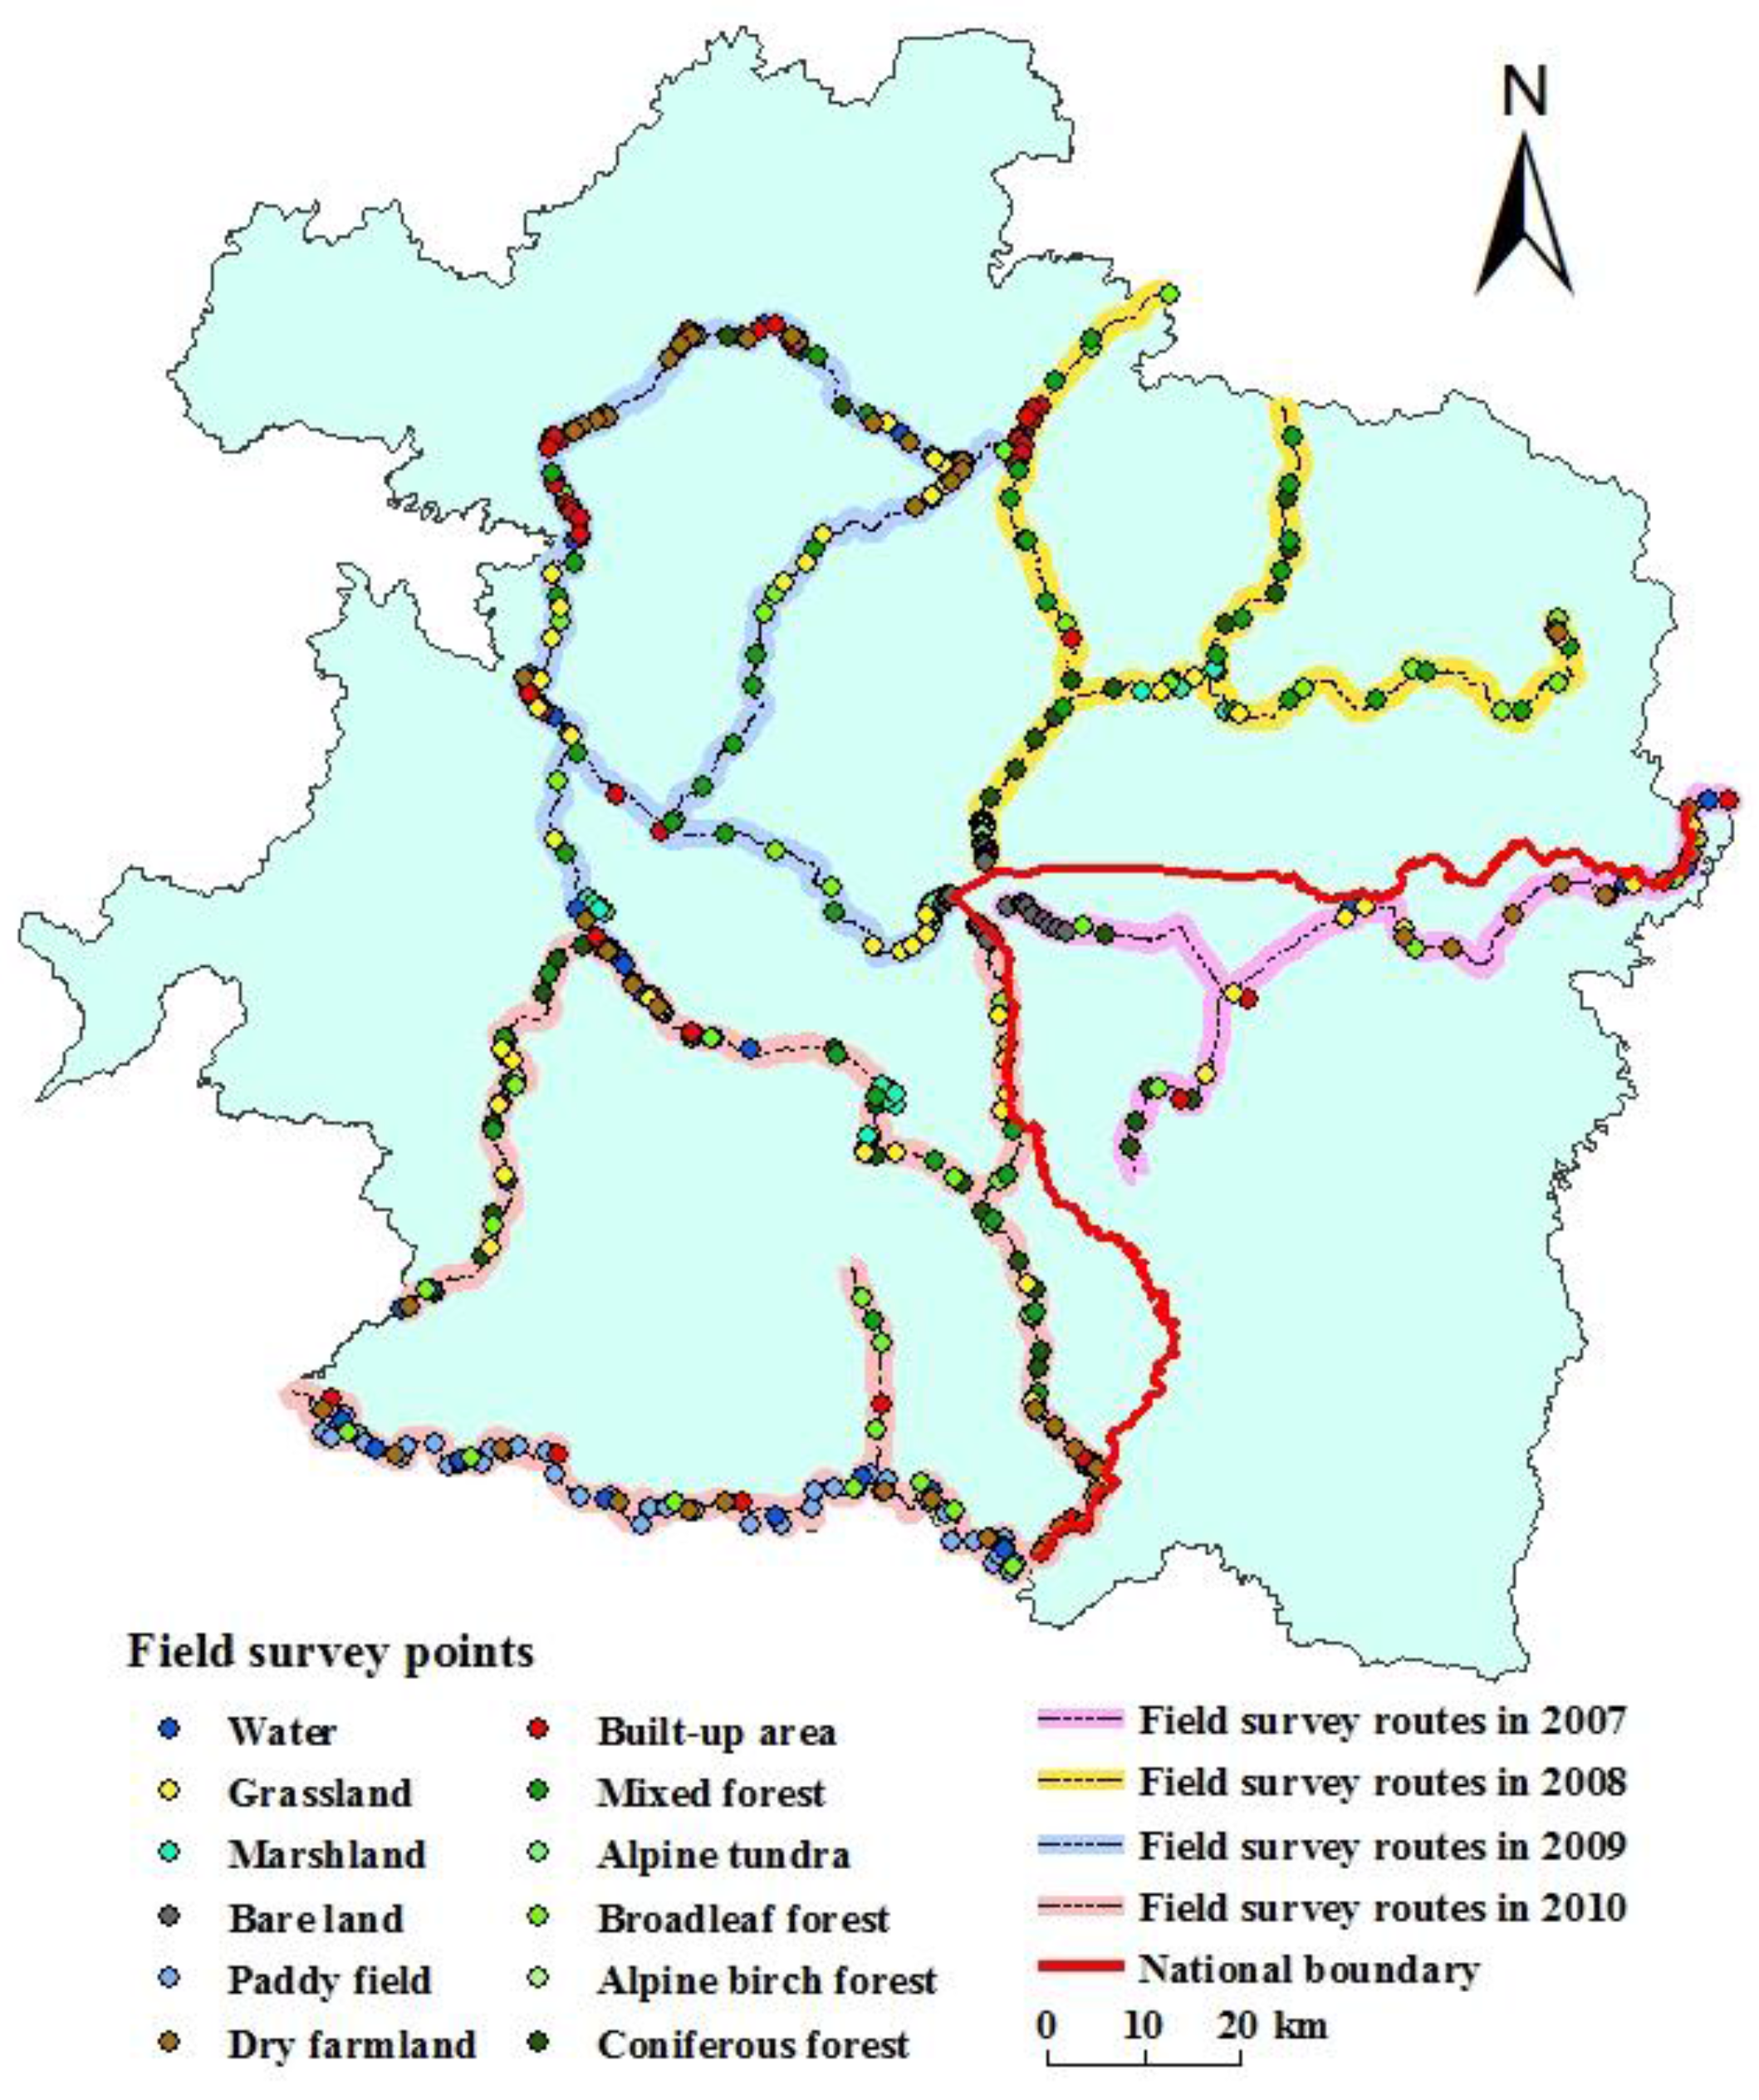
Table A1.
The interpretation criteria.
Table A1.
The interpretation criteria.
| Land Use/Cover Types | Standard False Color Composite of Landsat Images * | Color | Shape and Texture Features | Mainly Distributed Area |
|---|---|---|---|---|
| Built-up area | 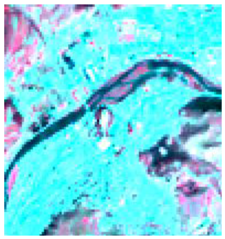 | Aqua or white | Irregular shape and rougher texture | Urban residential areas on both the Chinese and the DPRK’s side |
| Dry farmland |  | Aqua, light red or cyan | Regular block shape, homogeneous texture | The northwest part of the China and the southwest and northeast parts of the DPRK |
| Water | 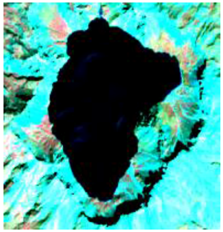 | Blue or deep blue | Irregular shape and homogeneous texture | Changbai Mountain Heavenly Lake and parts of the Tumen, Yalu, and Songhua rivers |
| Paddy field |  | Aqua or light red | Regular block shape, homogeneous texture | On the edge of the Tumen, Yalu and Songhua Rivers |
| Marshland | 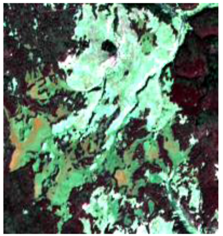 | Light blue or light green | Irregular shape and rougher texture | The Antu, Fusong and Changbai County of the side of China |
| Grassland |  | Light pink or light green | Irregular shape and less homogeneous texture | Distributed over the whole region |
| Bare land | 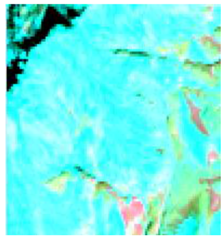 | Aqua | Irregular shape and rougher texture | Around the Changbai Mountain Heavenly Lake |
| Coniferous forest |  | Dark red | Irregular shape and rough texture | Located at an altitude of 1100–1800 m in the region |
| Coniferous and broadleaf mixed forest | 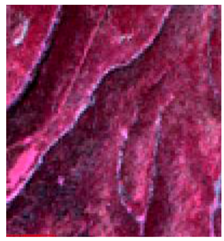 | Deep red or red | Irregular shape and rough texture | Located at an altitude of 700–1100 m in the region |
| Broadleaf forest | 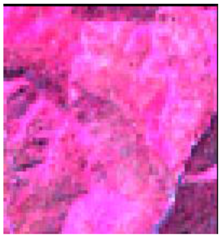 | Bright red | Irregular shape and rougher texture | Located at an altitude of 300–700 m in the region |
| Alpine birch forest | 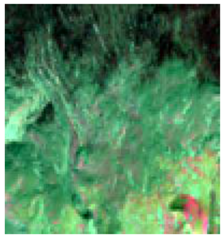 | Light red or dark green | Irregular shape and rougher texture | Located at an altitude of 1800–2100 m in the region |
| Alpine tundra | 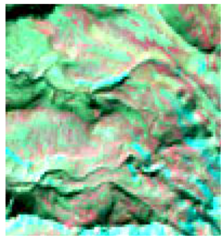 | Light pink or light green | Irregular shape and less homogeneous texture | Located at an altitude over 2100 m in the region |
* Red (Band 5 for OLI, Band 4 for TM/ETM+, Band 3 for MSS), Green (Band 4 for OLI, Band 3 for TM/ETM+, Band 2 for MSS), Blue (Band 3 for OLI, Band 2 for TM/ETM+, Band 1 for MSS).
Appendix B
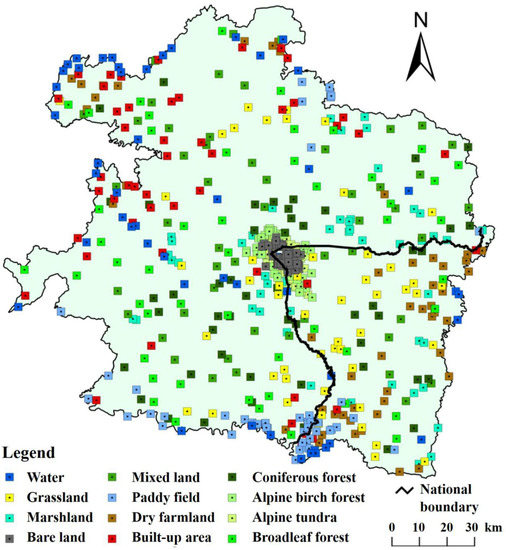
Figure A2.
The randomly selected sampling points in the accuracy assessment.
Figure A2.
The randomly selected sampling points in the accuracy assessment.
Appendix C
Table A2.
The results of the accuracy assessment.
Table A2.
The results of the accuracy assessment.
| Land Use/Cover Type | Built-Up Area | Dry Farmland | Water | Paddy Field | Marsh Land | Grass Land | Bare Land | Coniferous Forest | Mixed Forest | Broadleaf Forest | Alpine Birch Forest | Alpine Tundra | Total | Commission Error | User Accuracy |
|---|---|---|---|---|---|---|---|---|---|---|---|---|---|---|---|
| Built-up area | 46 | 1 | 0 | 0 | 0 | 1 | 0 | 0 | 1 | 1 | 0 | 0 | 50 | 8.00% | 92.00% |
| Dry Farmland | 0 | 44 | 0 | 0 | 0 | 3 | 0 | 1 | 0 | 2 | 0 | 0 | 50 | 12.00% | 88.00% |
| Water | 1 | 2 | 43 | 0 | 0 | 2 | 0 | 2 | 0 | 0 | 0 | 0 | 50 | 14.00% | 86.00% |
| Paddy field | 1 | 3 | 0 | 42 | 0 | 2 | 0 | 1 | 0 | 1 | 0 | 0 | 50 | 16.00% | 84.00% |
| Marshland | 0 | 0 | 0 | 0 | 45 | 3 | 0 | 0 | 0 | 2 | 0 | 0 | 50 | 10.00% | 90.00% |
| Grassland | 2 | 0 | 0 | 0 | 0 | 45 | 0 | 0 | 0 | 3 | 0 | 0 | 50 | 10.00% | 90.00% |
| Bare land | 0 | 0 | 0 | 0 | 0 | 1 | 46 | 2 | 0 | 0 | 0 | 1 | 50 | 8.00% | 92.00% |
| Coniferous forest | 0 | 0 | 0 | 0 | 0 | 0 | 0 | 46 | 3 | 1 | 0 | 0 | 50 | 8.00% | 92.00% |
| Mixed forest | 0 | 0 | 0 | 0 | 0 | 0 | 0 | 1 | 48 | 1 | 0 | 0 | 50 | 4.00% | 96.00% |
| Broadleaf forest | 0 | 0 | 0 | 0 | 0 | 1 | 0 | 0 | 1 | 48 | 0 | 0 | 50 | 4.00% | 96.00% |
| Alpine birch forest | 0 | 0 | 0 | 0 | 0 | 3 | 0 | 0 | 0 | 0 | 46 | 1 | 50 | 8.00% | 92.00% |
| Alpine tundra | 0 | 0 | 0 | 0 | 0 | 2 | 0 | 1 | 0 | 0 | 0 | 47 | 50 | 6.00% | 94.00% |
| Total | 50 | 50 | 43 | 42 | 45 | 63 | 46 | 54 | 53 | 59 | 46 | 49 | 600 | ||
| Omission error | 8.00% | 12.00% | 16.28% | 19.05% | 11.11% | 7.94% | 8.70% | 7.41% | 3.77% | 3.39% | 8.70% | 6.12% | |||
| Producer accuracy | 92.00% | 88.00% | 83.72% | 80.95% | 88.89% | 92.06% | 91.30% | 92.59% | 96.23% | 96.61% | 91.30% | 93.88% |
Overall accuracy: 91.00%; Kappa coefficient: 0.90.
Appendix D
Table A3.
The explanation of six landscape metrics [23,31].
Table A3.
The explanation of six landscape metrics [23,31].
| Landscape Metric | Calculation Formula | Description |
|---|---|---|
| Mean patch size (MPS) | is the sum area of all forest patches; N is the amount of forest patches. | |
| Total core area (TCA) | is core area of forest patch j based on specified edge depths. | |
| Patch density (PD) | A is the total area of landscape; N is the amount of forest patches. | |
| Edge density (ED) | A is the total area of landscape; E is the total length of forest patch boundary. | |
| Landscape shape index (LSI) | A is the total area of landscape; E is the total length of forest patch boundary. | |
| Mean Euclidean nearest neighbor distance (NND) | is the distance from forest patch j to the nearest neighboring patch of forest, based on shortest edge-to-edge distance; N is the amount of forest patches. |
Appendix E. The Process of Calculating Habitat Quality
The Methods of Calculating Habitat Quality
The habitat quality on pixel x in land use/cover j type can be expressed as follows:
where and are the habitat quality on pixel x and habitat suitability in j type of land use/cover, respectively; is the pixel x in the j type of land use/cover suffering from a threat level; k is a half-saturation constant, whose value is usually half the maximum value of ; and z is a normalized constant, which generally takes the value of 2.5. The is calculated using the following formula:
where R and y are the number of stress factors and the number of pixels in threat layer r , respectively; is the quantity of pixels occupied by the threat factor; Wr is the weight of the threat factor (ranging from 0 to 1); is the value of the threat factor in pixel y; is the threat level of pixel x in the land use/cover type suffering from pixel y in the threat factor layer; βx is the accessibility of pixel x; and is the sensitivity of the j type of land use/cover to threat factor r, the value of which is between 0 and 1. The closer is to 1, the more sensitive it is. Among these, is calculated by the following formula:
where is the linear distance between pixel x in the land use/cover layer and pixel y in the threat factor layer, and is the maximum influence distance of the threat factor r. When there is a linear relationship between pixel y in the threat factor layer and pixel x in the land use/cover layer, Equation (A3) is used to calculate the threat level. By contrast, when pixel y in the threat factor layer is exponential to pixel x in the land use/cover layer, Equation (A4) is used to calculate the threat level.
Table A4.
Threat Factors.
Table A4.
Threat Factors.
| Threat Factors | Weight | Maximum Distance/km | Decay |
|---|---|---|---|
| Cropland | 0.7 | 1 | linear |
| Built-up area | 1 | 3 | exponential |
Table A5.
The sensitivity of habitat to threat factors.
Table A5.
The sensitivity of habitat to threat factors.
| LULC Types | Habitat Suitability | Cropland | Built-Up Area |
|---|---|---|---|
| Built-up area | 0 | 0 | 0 |
| Dry Farmland | 0.4 | 0.3 | 0.5 |
| Water | 0.9 | 0.7 | 0.8 |
| Paddy field | 0.4 | 0.3 | 0.5 |
| Marshland | 0.9 | 0.6 | 0.7 |
| Grassland | 0.6 | 0.4 | 0.6 |
| Bare land | 0.1 | 0.1 | 0.2 |
| Coniferous forest | 0.9 | 0.3 | 0.4 |
| Mixed forest | 0.8 | 0.4 | 0.5 |
| Broadleaf forest | 0.7 | 0.5 | 0.6 |
| Alpine birch forest | 0.9 | 0.1 | 0.2 |
| Alpine tundra | 0.9 | 0.1 | 0.2 |
References
- Changbai Mountain Management Committee. Geographic Profile [EB/OL]. Available online: http://www.changbai shan.gov.cn/ (accessed on 19 March 2016).
- Stone, R. A Threatened Nature Reserve Breaks Down Asian Borders. Science 2006, 313, 1379–1380. [Google Scholar] [CrossRef] [PubMed]
- Yu, D.D.; Han, S.J. Ecosystem service status and changes of degraded natural reserves—A study from the Changbai Mountain Natural Reserve, China. Ecosyst. Ser. 2016, 20, 56–65. [Google Scholar] [CrossRef]
- Hansen, K.; Malmaeus, M. Ecosystem services in Swedish forests. Ecosyst. Ser. Swed. 2016, 31, 626–640. [Google Scholar] [CrossRef]
- Zhou, L.; Dai, L.M.; Wang, S.X.; Huang, X.T.; Wang, X.C.; Qi, L.; Wang, Q.W.; Li, G.W.; Wei, Y.W.; Shao, G.F. Changes in carbon density for three old-growth forests on Changbai Mountain, Northeast China: 1981–2010. Ann. For. Sci. 2011, 68, 953–958. [Google Scholar] [CrossRef]
- Richards, W.H.; Koeck, R.; Gersonde, R.; Kuschnig, G.; Fleck, W.; Hochbichler, E. Landscape-Scale Forest Management in the Municipal Watersheds of Vienna. Nat. Areas J. 2012, 32, 199–207. [Google Scholar] [CrossRef]
- Ni, X.J.; Nan, Y.; Zhao, G.Z.; Cui, Y.X. On ecological security assessment in Changbai Mountain region based on RS&GIS approaches. J. Saf. Environ. 2015, 15, 342–349. [Google Scholar]
- Wang, S.Y.; Zhang, X.X.; Zhu, D.; Yang, W.; Zhao, J.Y. Assessment of ecological environment quality in the Changbai Mountain Nature Reserve based on remote sensing technology. Prog. Geogr. 2016, 35, 1269–1278. [Google Scholar]
- Zhao, J.Z.; Li, Y.; Wang, D.Y.; Xu, D. Tourism-induced deforestation outside Changbai Mountain Biosphere Reserve, northeast China. Ann. For. Sci. 2011, 68, 935–941. [Google Scholar] [CrossRef]
- Zhang, J.L.; Liu, F.Z.; Cui, G.F. The Efficacy of Landscape-Level Conservation in Changbai Mountain Biosphere Reserve, China. PLoS ONE 2014, 9, e95081. [Google Scholar] [CrossRef] [PubMed]
- Wang, Y.; Guan, L.; Piao, Z.G.; Wang, Z.C.; Kong, Y.P. Monitoring wildlife crossing structures along highways in Changbai Mountain, China. Trans. Res. 2017, 50, 119–128. [Google Scholar] [CrossRef]
- Niu, L.J.; Liang, Y.; Wang, S.X.; Xu, J.W.; Zhang, R.; Wu, Y.; Guo, W. Evaluation of vegetation restoration in wind disaster area in Changbai Mountains Nature Reverse, Northeast China. Chin. J. Ecol. 2013, 32, 2375–2381. [Google Scholar]
- Guo, X.Y.; Zhang, H.Y.; Wang, Y.Q.; Clark, J. Mapping and assessing typhoon-induced forest disturbance in Changbai Mountain National Nature Reserve using time series Landsat imagery. J. Mt. Sci. 2015, 12, 404–416. [Google Scholar] [CrossRef]
- Nan, Y.; Liu, Z.F.; Dong, Y.H.; Li, X.X.; Ji, Z. The Responses of Vegetation Cover to Climate Change in the Changbai Mountain Area from 2000 to 2008. Sci. Geogr. Sin. 2010, 30, 921–928. [Google Scholar]
- Ciccarese, L.; Mattsson, A.; Pettenella, D. Ecosystem services from forest restoration: Thinking ahead. New For. 2012, 43, 543–560. [Google Scholar] [CrossRef]
- Fang, O.Y.; Wang, Y.; Shao, X.M. The effect of climate on the net primary productivity (NPP) of Pinus koraiensis in the Changbai Mountains over the past 50 years. Trees 2016, 30, 281–294. [Google Scholar] [CrossRef]
- Piao, Z.J. How to restore the Siberian tiger population in Changbai Mountain? Annu. Rep. Environ. Development China. 2014. Available online: http://www.pishu.com.cn/skwx_ps/initDatabaseDetail?siteId=14&contentId=2247227&contentType=literature&type=%25E6%258A%25A5%25E5%2591%258A (accessed on 16 June 2017).
- Zheng, D.L.; Wallin, D.O.; Hao, Z.Q. Rates and patterns of landscape change between 1972 and 1988 in the Changbai mountain area of China and North Korea. Landsc. Ecol. 1997, 12, 241–254. [Google Scholar] [CrossRef]
- Liu, Q.J.; Li, X.R.; Ma, Z.Q.; Takeuchi, N. Monitoring forest dynamics using satellite imagery–A case study in the natural reserve of Changbai Mountain in China. For. Ecol. Manag. 2005, 210, 25–37. [Google Scholar] [CrossRef]
- Tang, L.N.; Li, A.X.; Shao, G.F. Landscape-level forest ecosystem conservation on Changbai Mountain, China and North Korea (DPRK). Mt. Res. Dev. 2011, 31, 169–175. [Google Scholar] [CrossRef]
- Ma, L.; Gao, C.D.; Zhang, Y.B.; Wang, M.Z.; Li, J.Q. Analysis of Dynamics of Forest Landscape Pattern, Changbai Mountain. J. Sichuan Agric. Univ. 2014, 32, 177–184. [Google Scholar]
- Wu, J.; Shen, W.; Sun, W.; Tueller, P.T. Empirical patterns of the effects of changing scale on landscape metrics. Landsc. Ecol. 2002, 17, 761–782. [Google Scholar] [CrossRef]
- McGarigal, K.; Cushman, S.A.; Neel, M.C.; Ene, E. FRAGSTATS: Spatial Pattern Analysis Program for Categorical Maps, 3.1st ed.; University of Massachusetts: Amherst, MA, USA, 2002. [Google Scholar]
- Zhang, M.L.; Guo, Z.F.; Cheng, Z.H.; Zhang, L.H.; Liu, J.Q. Late Cenozoic intraplate volcanism in Changbai volcanic field, on the border of China and North Korea: Insights into deep subduction of the Pacific slab and intraplate volcanism. J. Geol. Soc. 2016, 172, 648–663. [Google Scholar] [CrossRef]
- Jin, B.L.; Zhang, X.Y. Study on Volcanic Geology of Changbai Mountain; Korean National Education Press in Northeast China: Yanji, China, 1994. [Google Scholar]
- Cao, W.; Li, Y.Y. Vertical pattern of flora from Changbai Mountain, China. J Beijing For. Univ. 2008, 30, 53–58. [Google Scholar]
- Ni, X.J.; Nan, Y.; Cui, Y.X.; Liu, G.M.; Liu, C.; Yao, K. Study on comprehensive assessment of ecological security in Changbai Mountain Region based on multi-hazard natural disasters risk. Geogr. Res. 2014, 33, 1348–1360. [Google Scholar]
- Li, M.; Wu, Z.F.; Du, H.B.; Zong, S.W.; Meng, X.J.; Zhang, L.Z. Growing-season Trends Determined from SPOT NDVI in Changbai Mountains, China, 1999–2008. Sci. Geogr. Sin. 2011, 31, 1242–1248. [Google Scholar]
- Liu, J.; Liu, M.; Tian, H.; Zhuang, D.; Zhang, Z.; Zhang, W.; Tang, X.; Deng, X. Spatial and temporal patterns of china’s cropland during 1990–2000: An analysis based on Landsat TM data. Remote Sens. Environ. 2005, 98, 442–456. [Google Scholar] [CrossRef]
- Liu, Z.F.; He, C.Y.; Wu, J.G. The Relationship between Habitat Loss and Fragmentation during Urbanization: An Empirical Evaluation from 16 World Cities. PLoS ONE 2016, 11, e0154613. [Google Scholar] [CrossRef] [PubMed]
- Wu, J.; Jenerette, G.D.; Buyantuyev, A.; Redman, C.L. Quantifying spatiotemporal patterns of urbanization: The case of the two fastest growing metropolitan regions in the United States. Ecol. Complexity 2011, 8, 1–8. [Google Scholar] [CrossRef]
- Hall, L.S.; Krausman, P.R.; Morrison, M.L. The habitat concept and a plea for standard terminology. Wildl. Soc. Bull. 1997, 25, 173–182. [Google Scholar]
- Sharp, R.; Tallis, H.T.; Ricketts, T.; Guerry, A.D.; Wood, S.A.; Chaplin-Kramer, R.; Nelson, E.; Ennaanay, D.; Wolny, S.; Olwero, N.; et al. InVEST User Guide. 2016. Available online: http://data.naturalcapitalproject.org/nightly-build/invest-users-guide/html/ (accessed on 16 June 2017).
- Wang, Y.; Piao, Z.J.; Guan, L.; Li, H.F.; Li, Q.L.; Lu, Y.Y.; Gao, Lei.; Chen, J.D. Wildlife Crossing Zones along the Ring Changbai Mountain Scenic Highway, China. J. Life Sci. 2012, 12, 1420–1427. [Google Scholar]
- International Union for Conservation of Nature (IUCN). The IUCN Red List of Threatened Species. 2016. Available online: http://www.iucnredlist.org/ (accessed on 9 December 2016).
- Piao, Z.J.; Sui, Y.C.; Cui, Z.G.; Zhang, G.L.; Wang, Q.; Fu, X.K. The History and Current Status of Felid Population in Changbai Mountain Nature Reserve. Chin. J. Zool. 2011, 46, 78–84. [Google Scholar]
- Wang, Z.C.; Wang, Y.; Wang, C.; Luo, Y.M.; Huang, L.Y.; Zhang, R.; Tai, Z.J.; Piao, Z.J. Traffic Death of Amphibian on Tourism Highway in Changbai Mountain National Nature Reaerve. Chin. J. Zool. 2015, 50, 866–874. [Google Scholar]
- Wang, Y.B.; Jiang, H.B.; He, C.G.; Wang, Z.Q.; Wang, X.F.; Sheng, L.X.; Chen, F.Z. Effect of paddy cultivation on nematode community in Jinchuan Wetland of Changbai Mountain area, China. Ecol. Eng. 2016, 96, 20–25. [Google Scholar] [CrossRef]
- Kuang, W.H.; Zhang, S.W.; Zhang, Y.Z.; Li, Y.; Hou, W. Changes of forest landscape and its driving mechanism during the last fifty years in the eastern mountain area of Jilin Province. J. Beijing For. Univ. 2006, 28, 38–45. [Google Scholar]
- Nam, S. The Legal Development of the Environmental Policy in the Democratic People’s Republic of Korea. Acta Chir. Lugoslav. 2003, 31, 67–71. [Google Scholar]
- Dai, L.; Shao, G.; Xiao, B. Ecological classification for mountain forest sustainability in northeast China. For. Chron. 2003, 79, 233–236. [Google Scholar] [CrossRef]
- Tang, L.N.; Shao, G.F.; Piao, Z.G.; Dai, L.M.; Jenkins, M.A.; Wang, S.X.; Wu, G.; Wu, J.G.; Zhao, J.Z. Forest degradation deepens around and within protected areas in East Asia. Biol. Conserv. 2010, 143, 1295–1298. [Google Scholar] [CrossRef]
- Liu, Q.J.; Kondoh, A.; Takeuchi, N. The forest vegetation and its differentiation under disturbance in a temperate mountain, China. J. For. Res. 1998, 3, 111–117. [Google Scholar] [CrossRef]
- Wu, J.G.; Hobbs, R. Key issues and research priorities in landscape ecology: An idiosyncratic synthesis. Landsc. Ecol. 2002, 17, 355–365. [Google Scholar] [CrossRef]
- Zhang, N.; Yu, Z.L.; Yu, G.R.; Wu, J.G. Scaling up ecosystem productivity from patch to landscape: A case study of Changbai Mountain Nature Reserve, China. Landsc. Ecol. 2007, 22, 303–315. [Google Scholar] [CrossRef]
- Deo, R.K.; Russell, M.B.; Domke, G.M.; Woodall, C.W.; Falkowski, M.J.; Cohen, W.B. Using Landsat Time-Series and LiDAR to Inform Aboveground Forest Biomass Baselines in Northern Minnesota, USA. Can. J. Remote Sens. 2017, 43, 28–47. [Google Scholar] [CrossRef]


© 2017 by the authors. Licensee MDPI, Basel, Switzerland. This article is an open access article distributed under the terms and conditions of the Creative Commons Attribution (CC BY) license (http://creativecommons.org/licenses/by/4.0/).