Abstract
The purpose of this study is to explore how consumers perceive eco-friendliness in their brand experiences and how this can be measured cross-nationally. This is a replication-extension study based on an existing brand experience scale. Data were collected in India and Finland from smartphone users (N = 1008). The fitness of the brand experience model is validated cross-nationally with structural equation modeling. The empirical data consisting of consumers’ responses on the Apple, Samsung, and Nokia brands confirm that there is a unique dimension of eco-friendliness in the general brand experiences of consumers, and it is generalizable cross-nationally in India and Finland. The study presents a consumer-focused measure of sustainable development that could be used to track how consumers perceive the eco-friendliness of brands. The paper links consumer experiences that guide sustainable consumption behavior to the macro-level management of sustainable development. This paper extends previous research on brand experience measurement by testing cross-nationally a scale including a dimension for measuring eco-friendliness. The brand experience measurement scale could aid companies in tracking the success of their sustainable development initiatives on the brand level.
1. Introduction
Companies have had minimal impact on decreasing the pace of environmental degradation [1,2,3], as their main targets are business growth and increasing consumption [4]. More research is still needed to find effective measures for guiding companies and consumers towards sustainability, for example, with objective nonfinancial measures for comparing the environmental and social performance of companies and industrial sectors as well as the outcomes of their marketing efforts [5,6]. The linkages between the consumer and market levels that lead to both sustainable consumption and production (SCP) as well as market change on the macro level need to be understood so that sustainable development can be promoted on a large scale. Hence, we maintain that in order to drive sustainable consumption we need to measure micro-level phenomena on the consumer level and link them to the level where companies have an impact on sustainable development.
More measures have been called for to help companies monitor consumers and understand their consumption experiences so that the companies can better support consumers’ sustainable consumption and also achieve their own triple bottom line (TBL) goals for sustainability [7]. For consumers, it is critical that eco-friendly products can be used properly for what they have been designed [8]. Some of the goals that consumers have set for products can also be abstract, such as being able to consume products in an eco-friendly manner [8]. The implementation of SCP requires the involvement of different stakeholders, including consumers, with a systemic approach as well as more cooperation among the stakeholders [9]. In particular, the role of consumers in the implementation of SCP has been highlighted [10]. “Pro-environmental behavior change” has been called for both by research and policymakers, as consumers are expected to change their consumption habits into a more sustainable direction [11,12]. In the 1990s, governments, companies, and consumer-citizens became increasingly concerned about environmental protection, which accelerated the research efforts in the field of societal and environmental marketing. However, research has been fragmented and needs to develop further [13].
In brand management research, very few brand constructs include an aspect of eco-friendliness, and most of them have not been operationalized into scales [14]. However, there are several indications from earlier studies that the brand satisfaction and brand loyalty of consumers can be associated with the eco-friendliness and green values represented by the brand [15,16]. Thus, eco-friendly branding could help companies to promote sustainable development and motivate consumers to make more sustainable consumption decisions. Brand eco-friendliness means that the brand does not harm the environment, and in connection with SCP, the assumption is that the manufacturers have eco-friendly production processes and consumers’ consumption habits are eco-friendly [17].
The aim of this study is to explore how the brand experience scale of Brakus et al. [18], with an extension for measuring the eco-friendliness of brand experiences [19], can be applied cross-nationally. More replication and extension research has been called for, to discover empirical generalizations instead of focusing only on the creation of new concepts that result in isolated studies [20,21,22,23,24,25,26]. We concentrate on exploring micro-level sustainable behaviors in the consumer markets, and in doing so we shed light on the possibilities to link the micro and the macro levels [27] in a balanced approach to sustainable development. We focus on individual consumers who are end users of products, not other stakeholders, for example, in the supply chain.
This paper makes a number of contributions: We investigate how different aspects of eco-friendliness in consumers’ brand experiences are perceived cross-nationally in India and Finland and whether these aspects can be measured cross-nationally with an extended brand experience scale based on Brakus et al. [18] and Saari [19]. The possible perceptions of eco-friendliness consumers associate with the brand experiences they have with consumer electronics brands have not been previously measured and investigated cross-nationally. In addition, we propose how in the theoretical microfoundations model [27] a consumer-level measure could drive sustainable consumption and sustainable development initiatives in companies, using the management of e-waste as an example.
Considering brands as decisive elements for consumers in their consumption behavior, and consumers’ brand experiences as important input to companies for managing brands, we examine how brands are associated with sustainability and the role of global brands in supporting sustainable development. Then, we introduce how consumers’ brand experiences regarding the eco-friendliness of brands could help to drive sustainable development. We show empirically that consumers in different national contexts experience brands differently in terms of the eco-friendliness dimension. Finally, we present and discuss the results, which inform corporations on consumers’ attitudes towards eco-friendly and sustainable consumption, thus facilitating the implementation of eco-innovations and sustainable development initiatives that promote SCP.
2. Theoretical Background
Brand experiences are individual consumers’ subjective and internal responses to brand stimuli that are partly generated by the company, in the form of, for example, marketing communications, brand design, packaging, and sales environments. However, a large portion of brand stimuli can be outside the conventional company controlled channels, such as in the news and social media [18]. Brand stimuli are not always necessarily associated with the actual products consumers are using [28]. They can also be associated with news related to the company’s reputation, for example, how the company handles its e-waste. When consumers buy and use brands they are directly in contact with product attributes that are utilitarian, but they are also in contact with other aspects of the brand that can generate specific sensations, feelings, and perceptions as well as have behavioral impacts [29,30]. Consumers use marketing messages as well as other sources of information, such as information on supply chains and product innovations, to form their personal and communal brand experiences in an “experience space”, where brand experiences are co-created [31].
2.1. Branding and Sustainability
Branding is one of the most important means of marketing and selling products to consumers, and brands are one of the most important purchase selection criteria among consumers [32,33], especially in the case of electronics products [34]. Brands are reflections of the companies’ reputations and business success in the minds of consumers, including from an environmental perspective [16,35]. Corporate image has an important impact on how stakeholders, including consumers, appreciate the company, and it can be based on the way a company manages its social and environmental responsibilities [36]. Corporate image is also used to differentiate how companies commit to being sustainable [3].
Branding research reports on the benefits of associating the Corporate and Social Responsibility (CSR) activities of a company with its brand, as it links consumers’ and other stakeholders’ brand evaluations and choices to actual CSR initiatives [37,38]. When referring to CSR it is also understood to incorporate the pro-environmental activities executed by the corporation [39]. When the sustainability and environmental development activities of a company are linked to its brand, the brand value is increased, which can influence some customers positively [15,16]. However, some customers may be skeptical and not trust the sustainability reports of companies, and thus they do not base their purchase decisions on this information [40,41]. Consumers may lack clear and comprehensible product information including details on the eco-friendliness of many companies’ products [42,43,44,45], and they may not trust public CSR and environmental reports [4]. Consumers can resent a brand if there is any reason to believe that the manufacturer ignores human rights or environmental responsibility [28], for example, in the case of BP after its major oil spill in the Gulf of Mexico in 2010 [46].
A critical view of the way multinational brands are dealing with sustainability requirements is that they do not necessarily conform to all sustainability standards. Instead, they can export socially irresponsible practices to countries with looser regulations and less stakeholder pressure [47]. Currently, companies can avoid expensive sustainability and environmental development activities simply by hiding their noncompliance by moving their practices further away from their headquarters [48]. The current e-waste management practices prevailing in the electronics business are causing grave health risks to children [49], e-waste recyclers [50], and increasingly to the large populations in China, India, and Africa [51,52,53]. For example, in China, the amount of e-waste produced is growing continuously, and the recycling of e-waste of global brands is handled predominantly by informal sectors that do not have knowledge about the risks of handling such waste [54].
2.2. Role of Global Brands in Sustainable Development
Major global brands are owned by companies that have CSR activities implemented and reported publicly. However, sustainability is still not considered a priority in the companies’ strategies, as the main drivers for global brands are brand business models [4]. Global companies have a reputation for taking advantage of the varying environmental legislation in different countries so that they can have more polluting operations in countries where the environmental legislation is the most lax [4,55]. Global consumer electronics brands dominate the market and control the supply chains globally, and they also control the sourcing of materials and implementation of waste handling practices [4].
The brand of a company is the key link between all the actors participating in the production and consumption processes, especially in the case of global electronics brands. The eco-friendliness of brands can be built on the CSR activities of companies [39], and this can be associated with the way an electronics company handles its e-waste. Global brands have significant power over the global supply chains, and they are transforming sustainability into true business value by lowering costs and re-evaluating quality and performance [4]. As the environmental impacts of consumption increase, brand companies will have a greater competitive advantage from being sustainable and eco-friendly, and they will want to take advantage of the growing green consumer markets [4,56]. Global corporations are also beginning to incorporate CSR into their branding strategies [38].
The activities implemented in corporate functions and the results seen in the markets and at the environmental level are hard to understand and measure, and for this reason there are contradictory research findings in this area [48]. This has raised doubts about what the companies are actually doing to develop their sustainability and raised suspicion about possible greenwashing attempts [1,2]. The sustainable development goal #12 set by the United Nations in the New Sustainable Development Agenda [12] with regard to ensuring responsible consumption and production requires follow up on the level of global brands that are highly visible in the consumer markets [4].
With the illegal export of e-waste from the production sites and largest locations of use [57], the e-waste problem is moved away from the backyards of the producers and the majority of consumer electronics users. The private authority of global brand companies has crucial significance in the governance systems globally. Change should be driven on all the different levels of consumption practices so that companies and consumers are involved and the technological and cultural aspects of introducing more sustainable consumption practices are taken into account [58]. As the overall climate and environmental change, including the accumulation of e-waste, is potentially drastic and enormous, the role and ability of consumers to drive sufficient change on their own should be reassessed [59,60].
2.3. Sustainable Consumption Driven by Consumers’ Brand Experiences
Sustainable consumption can be considered as consumption that focuses on optimizing the results of the purchase, usage, and disposal of products from the environmental, social, and economic perspectives, taking into account future generations [12,17]. When referring to sustainable and ethical consumption, the assumption is that consumers’ consumption experiences are influenced by their ethical and environmental concerns [61]. When selecting a suitable brand, consumers do not necessarily only consider functional and affective criteria but also the CSR of a company [62]. In the EU, according to the 2013 Eurobarometer, 26% of consumers frequently purchase eco-friendly products and 54% purchase them occasionally [63]. These numbers could be growing, as in 2015 nearly 75% of millennials were reported to be interested in paying more for eco-friendly products [64]. Sustainable consumption is already driven by brands in many industrial sectors, for example, Fairtrade brands in the food and textile industry and Seventh Generation products in household and care products, and in general, brand reputation is one of the most significant selection criteria for consumers [65,66]. (Seventh Generation is an American brand and company that was established in 1988. Its products consist of nontoxic cleaning and personal care products, and its product development focuses on sustainability and the conservation of natural resources [67]. The company and brand was acquired in September 2016 by Unilever [68].) Fairtrade products currently own over 20% of the market share for certain products in 23 countries [69]. Sales of fair trade and organic products are increasing, and even if only 10 percent of consumers were to change their purchasing behavior in favor of eco-friendly products, it would make a meaningful difference in the marketplace and have a positive impact on company profits [70]. Consumers in the US have been reported to be increasingly interested in eco-friendly, healthy, and safe product choices. However, they are not regularly buying such products since they are not available on the mass markets and are more expensive [71]. Recently, some global brands have been offering more green mainstream options (e.g., Unilever acquisition of The Seventh Generation) [68]. Nevertheless, in the consumer electronics sector, eco-friendliness and CSR are not actively promoted by the companies in the positioning or branding of their products [72].
Green consumer trends can have an influence on the industry producing consumer goods [33,62,67,73,74]. Green consumerism has already had a clear impact on, for example, the automobile and fast moving consumer goods (FMCG) industries, which have deployed more sustainable operations and offer more eco-friendly product and brand choices to consumers than before [33,67]. With regard to electronics products, environmentally conscious consumers do not currently have many eco-friendly options if they wish to be true to their environmental values [72]. Individual consumers have an important role in the transformation of consumption habits so that they are less harmful to the environment, and the numbers of environmentally conscious consumers have been growing [62,65,73,74].
As consumers become more conscious of their purchasing behavior and start searching for eco-friendly products, they will have a critical impact on companies’ sustainability and environmental development activities [7]. Consumers participate in the process of value co-creation by giving feedback to companies [75]. Consumers have a focal role in creating meaningful interactions within an “experience environment” consisting of an ecosystem of companies and various consumer communities that together have an influence on consumers’ personal brand experiences [31]. The brand experiences that consumers have can be both communal (associated with society and the environment) and individualistic (having personal value) [76,77], and both kinds of experiences are important for creating brand value [78]. In the case of eco-friendliness, consumers are becoming more influential and informed, and this needs to be taken into account in corporations [79].
Large global companies are publicly driving CSR programs directed towards sustainability-related improvements in their supply chains [80,81] to improve their reputations and corporate brand equity [82] and build consumer trust [83]. Brand equity plays a critical role in transmitting brand messages to consumers [78]. The brand equity that is also inherent in the branded product helps consumers select products for purchase, as consumers expect that a product with higher brand equity guarantees a good corporate reputation and higher user satisfaction [84].
Consumers who regularly take into account the environmental qualities of available products in purchasing situations can be considered to have sustainable and green consumption habits [85]. When consuming eco-friendly products consumers can have varying levels of abstractions for the targets they wish to achieve with the products, which in turn has an impact on the individual consumer’s subjective experience of the products [8]. For environmentally conscious consumers it is not necessarily the product attributes themselves that weigh the most in their purchasing decisions but rather the environmental impact of their choice and its symbolic value [86].
So-called citizen-consumers, who take their social responsibilities seriously, are active change agents within society and on the commercial markets [59,87]. Citizen-consumers are socially aware of the wider social and environmental consequences of products, and they support corporations’ business cases for CSR. Citizen-consumers can be divided into different types of roles depending on their stances towards environmental change, and the majority does not feel empowered by the globalization of environmental politics. On the contrary there is distrust of the organizations handling environmental affairs, even on the political level [88]. For example, in 2011, market research indicated that the majority of U.S. consumers want to be doing good in the world through their purchasing, and 87% of them expected corporations to have a balance between societal interests and business interests [89]. To promote more sustainable consumption, the positive emotional energy that citizen-consumers get from products and services that have an eco-friendly or green symbolic value can drive change toward more sustainable consumption on an everyday level [58]; for example, feelings of pride and guilt have been found to influence consumers’ sustainable product choices [90]. Individual consumers’ environmental values generally can be very similar in different cultures, although their general beliefs and levels of environmental concern can differ to a greater degree [91].
Shobeiri et al. [92] have created a model for socially responsible consumption based on Schmitt’s [93] five experiential aspects of marketing, which consist of sensory, cognitive, affective, behavioral, and social experiences. Brakus et al. [18] confirmed only four of Schmitt’s five dimensions in their Brand Experience Scale (BXS): the sensory, affective, intellectual, and behavioral dimensions. The fifth, social or relational dimension in Schmitt’s [93] model consists of social and relational experiences that consumers could have regarding society and the environment. The BXS has been extended with a dimension for eco-friendliness, but this dimension has only been confirmed in one Western country [19].
2.4. Conceptual Model
The measurement of consumers’ experiences on the micro level to understand macro phenomena has been presented in sociology as a preferred approach instead of focusing purely on macro-level assumptions [27,94]. From the consumer perspective, the driver for sustainable development is the link between consumers and companies that leads to changes in companies and accelerates sustainable development in the long run. The results of consumer-focused measurements (i.e., the views of individual consumers) can have an impact on the macro level and lead to market change and sustainable development in society, as outcomes on the macro level usually result from the interdependence of actors on different levels [94].
Environmental change is also forcing the markets to change to accommodate the environmental consciousness of consumers and thus leading to sustainable development. Sustainable consumption is occurring on the micro level, and it can have an effect on the change of markets [58] and create pressure for companies to change their offerings on the meso level [62]. The critical link is from the micro level and consumers who are buying more eco-friendly products at the meso level, and companies need to consider new and more eco-friendly offerings based on the demand from consumers, who are thereby pushing products and brands to change.
A balanced approach to the governance of environmental change and sustainable development that takes into account both individual consumer behavior and the perspective of technological infrastructures with a systemic approach guiding industry behavior is presented below [58,95]. The links between the micro level (where the consumers are), the meso level (where companies operate), and the macro level (where markets evolve on a global scale) all have an impact on sustainable development; in particular, the micro-macro link is of crucial importance, as it is needed for the implementation of sustainable strategies [96]. The micro level of sustainable behaviors in consumer markets can be linked to the macro level so that the behavior of individual consumers is monitored and treated as feedback on consumers’ perceptions of macro-level sustainable development [27]. This forms a multilevel micro-to-macro transition path for promoting sustainable consumption on the individual level as a result of the decisions made on the company level [27,97,98].
In this study, we concentrate on individual consumers (i.e., end users of products) and show in the theoretical microfoundations model [27] how a consumer-level measure of brand experiences could drive sustainable consumption and sustainable development initiatives in companies and be reflected on the macro level. To promote sustainable consumption, micro-level phenomena on the consumer level should be measured and linked to the companies and their brands that have an impact on sustainable development (see Figure 1).
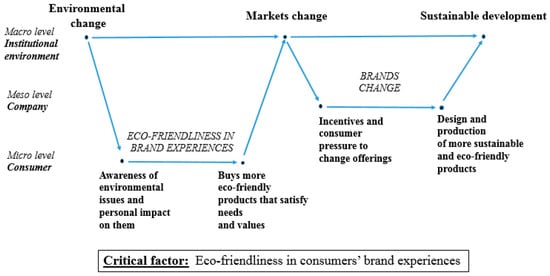
Figure 1.
Micro-level activities on the consumer level can drive market change, which in turn can steer companies to change their design and production so that sustainable development becomes more prevalent. Information on brands influences the eco-friendliness in consumers’ brand experiences, which in turn could be measured in order to create more eco-friendly products that satisfy the values and needs of consumers.
External pressure may be caused by political, economic, social, or environmental reasons, and internal change is initiated by mismatches that are recognized in the macro systems and micro activities as well as inconsistencies in institutional frameworks that result in poor performance compared to expectations [99]. The microfoundations of sustainable consumption are formed by the individual consumers’ conditions for action and actual actions, and these link to the macro level and are projected as the outcomes of consumers’ consumption behavior on the societal level [97]. To promote sustainable development on the macro level, companies need to track the kinds of experiences consumers’ have of the conditions and actions related to purchasing on the micro level [27].
The brand experience measure fits in the frame of institutional theory and also combines the three dimensions of corporate sustainability measures: economic (marketing practices that are based on sustainability), social (customer satisfaction and feedback process), and environmental (association with environmental aspects, such as materials management and waste management, monitoring of suppliers) [5]. Institutions are often understood to represent stability and order; however, institutions still change for external and internal reasons.
In line with the objective of this study, when sustainable development is promoted, it is also essential to measure how consumers are experiencing the eco-friendliness of products and brands in order to get feedback on whether the companies’ sustainable development and marketing initiatives related to sustainability have been impactful on the brand level. The manner in which, for example, an electronics company manages its e-waste could be reflected in the way consumers perceive the eco-friendliness of the company and its brand. In this study, we focus on testing the levels on which consumers perceive eco-friendliness in their brand experiences and whether brands differ based on how consumers rate the eco-friendliness of their brand experiences in two very different kinds of countries.
The original brand experience scale (BXS) of Brakus et al. [18] has four dimensions: the intellectual, sensory, affective, and behavioral dimensions. As the measurement items in the original BXS have been proven to be in the general brand experiences of consumers, and as the eco-friendliness dimension has been tested in a Western country [19], we explore in this study whether the BXS including the eco-friendliness dimension is applicable cross-nationally in India and Finland.
Below we present the conceptualization of the four aspects of eco-friendliness in consumers’ brand experiences that we use in this study to measure the eco-friendliness of three global mobile phone brands in India and Finland. The four levels of the eco-friendliness dimension are: (1) the eco-intellectual; (2) the eco-sensory; (3) the eco-affective, and (4) the eco-behavioral levels [19]. The four levels of eco-friendliness in brand experiences can be defined in the following manner.
When consumers need to decide on major purchases, such as automobiles, household appliances, or expensive consumer electronics, they consider factual product- or brand-related information on the eco-intellectual level. This information may include details on the environmental performance (e.g., energy efficiency), manufacturing (materials, chemicals, recyclability, or reparability), and availability of second-hand products [34].
The eco-sensory level is critical for eco-friendly products, as the look and feel of sustainable and eco-friendly products can differ from mainstream models. Eco-friendly products are often produced from low-impact or recycled materials, and the materials are reduced to the minimum following eco-design principles that consider the impacts of the full lifecycles of the products [100].
The eco-affective level is linked to the overall emotional experience of eco-friendliness. Consumers tend to have positive feelings when they participate in good environmental causes. For example, green energy advertisements can generate feelings of self-satisfaction when people feel that their selection supports a good environmental cause [101].
Finally, the eco-behavioral level is associated with the ways in which consumers consider a brand to help them to act and consume in a sustainable manner. A brand that is perceived to be eco-friendly supports consumers to be more sustainable in their consumption habits and follow an ecologically conscious lifestyle [102]. When a brand is perceived to be sustainable and environmentally responsible, it helps ecologically conscious consumers use brands to build their identities [103,104,105] and boosts their pro-environmental self-identity [106].
3. Research Method and Data
In this study we replicate the extended BXS [19] cross-nationally to measure differences in the ways consumers experience the eco-friendliness of global smartphone brands in a cross-national context. The survey items were selected from the previously developed and extended BXS [18,19,107]. We assess the four items measuring eco-friendliness as well as the other four brand experience dimensions from the BXS by conducting structural equation modeling (SEM) and confirmatory factor analysis (CFA) following the same steps that Brakus et al. [18] undertook.
The applicability of a measurement framework developed for one country in the context of another country can be evaluated with CFA, which is used to analyze the relationships between the observed variables and hypothesized constructs [108]. The minimum requirement for stating that a construct can be similarly conceptualized cross-nationally is that the factor loadings follow the same pattern [108].
Testing of the scales is required, especially if the compared countries are in different economic stages, and the scales should also be tested in non-Western contexts [109] since this will enable more reliable generalization of the findings [20]. Consumer research has concentrated predominantly on Western countries, and more specifically on the middle class in the United States [108,110]. We have studied the eco-friendliness of brand experiences among consumers in an emerging economy (India) and in an advanced economy (Finland) [111,112]. In this study, India represents a non-Western country while Finland represents a Western country with reference to their economic situation and demographics [111,112]. Measurement scales created for business and market research should be tested in cross-national settings to ensure their validity and reliability and to build more robust frameworks [108,113,114].
The development of the extended BXS has followed the guidelines of Churchill [115] and Nunnally [116] based on Saari [19], and it has been aligned with the guidelines of Mowen and Voss [117] to further ensure the validity of the construct. To assess the validity of a model, one needs to assess the content and criterion validity, which indicate overall construct validity [118]. Construct validity indicates that the measurement scale is actually measuring what it has been designed to measure, which is essential when developing and testing theories [115,119]. The construct validity of a model can be verified from several aspects: concept validity, convergent validity, discriminant validity, and nomological validity [120]. Concept validity needs to be assessed to ensure that the abstract concepts have been similarly understood by all of the respondents; this is critical for assessing how well the factors and collected data correspond to the concepts of the study [121] and how possible differences in the results reflect real-life differences that are characteristic of what is being measured [115]. Convergent validity shows how well the measure correlates with other similar measures designed for similar concepts [115,120]. When the item loadings are high it is an indication of high convergent validity [120]. Discriminant validity indicates whether a measure is sufficiently different when compared to similar measures [115]. The discriminant validity of the eco-friendliness construct is tested by CFA, and the fit is studied by checking the model fit indices. Nomological validity means that a scale can measure what it has been designed for theoretically, and the focus is on larger theoretical frameworks rather than individual concepts [120]. One of the targets of this study is to increase the nomological validity of the conceptual model in a cross-national context. In order to avoid duplication of existing dimensions, the items measuring eco-friendliness were tested both as additional items in the existing four BXS dimensions as well as a separate fifth dimension. The validity and reliability in this study was assessed from the results of the CFA and item loading sizes and from the Average Variance Extracted (AVE) and Composite Reliability (CR) [121]. The measurement model was based on earlier research on the BXS and its extension [18,19] that had already been validated, which means that this study reinforces the validity of previous research. The model fit indices for both models are reported for both of the countries in Section 4.
The way respondents respond to surveys can differ depending on their national backgrounds, and the response style should be taken into account when comparing the results in cross-national research [122,123]. The response options here followed a 7-point Likert scale, with the addition of an 8th option, “Do not know”, to help the respondents continue with the survey in case they did not have any views on the brand. All the Likert scale response options were anchored, ranging from 1 = Strongly disagree to 7 = Strongly Agree. In the analyses, the “Do not know” options were treated as missing data, and the missing-at-random (MAR) approach [124] was used to analyze the data. With the MAR method the responses were reweighted and calculated with unbiased estimates when the response rates differed per item [125]. We used IBM SPSS and Amos software for the analysis.
In this study we concentrated on three smartphone brands, Samsung (using the Android Operating System (OS)), Apple (using the iOS), and Nokia (using the Windows Phone OS), which were the three largest smartphone brands in 2013 according to global market share [126]. Nokia was acquired in 2013 by Microsoft, but, at the time of the research, it was still producing Nokia branded smartphones. We did not focus on the possible differences between specific smartphone models, as brand experiences are the result of different kinds of brand stimuli that include, in addition to the actual product model, marketing messages, information retrieved from the Internet, or other people’s experiences heard by word of mouth [18,127].
The survey questionnaire used in Finland was translated into Finnish, while in India the study used the original English versions of the BXS and the eco-friendliness items. The equivalency of the Finnish translations was verified first by an English language expert, and they were also tested in a pilot survey that was conducted for both the English and Finnish versions. The pilot was conducted with respondents from both Finland and India. Based on the pilot results, we confirmed that the translation of the survey questionnaire was similarly understood by the respondents.
The survey was conducted in India and Finland in September 2013 with the help of trained field researchers. These countries were selected because in India, the penetration of smartphones was still fairly low, while in Finland, on the contrary, the penetration of smartphones was one of the highest in Europe. To ascertain that the sample was also representative of the smartphone users in the two countries, participants for the survey were selected from different parts of the two countries and from different age groups that had been identified to include potential smartphone users. In India, 10% of the population had a smartphone in 2012, and the owners of smartphones mostly resided in large cities that had a population of at least four million inhabitants [128]. The respondents in this study are from the top five metropolitan areas in India—Mumbai, Delhi, Kolkata, Chennai, and Bangalore—based on statistics from the census held in 2011 [129]. The Indian urban population was 31% of the total population in 2011. In India, 18–24 year olds and individuals a few years above 24 years of age own the most smartphones [128], which is reflected in the respondents of the survey, a higher proportion of which were younger adults. The participants in India were randomly selected from phone directory listings. In 2013, nearly 100% of Finnish households had a mobile phone and 56% had a smartphone [130]. In Finland, the respondents were randomly selected from four different regions from a national online contact directory. The coverage of the participants corresponds to the distribution of the population in Finland. The distribution of the respondents in the age groups that use smartphones is divided fairly closely to the age distribution among the whole population of Finland [131]. Both genders were nearly evenly represented in both of the countries (Table 1).

Table 1.
Demographic characteristics of respondents in India (N = 502) and Finland (N = 506).
The sample sizes were over 500 in both of the countries, which is sufficient to test and develop a scale and find a suitable fit and solution for a model [132]. The data were collected via a web survey in Finland (N = 506) and phone interviews in India (N = 502). The multiple-mode survey approach allowed us to study populations that fit the scope of the survey [133]. In Finland, the response rate was 11%, and, in India, it was 7%. As the number of online surveys has grown in recent years, non-response rates have also grown, but the non-response rate does not necessarily indicate non-response bias [125], and we did not find non-response bias in the results. As the samples in this study are representative of the populations that use smartphones in the countries, systematic differences between the respondents and non-respondents should be minimal (Table 1).
4. Results
4.1. Comparing Smartphone Brands on the Eco-Friendliness Dimension
In India, 36.5% of the respondents had a Samsung phone, 25.5% had a Nokia phone, and only 5.4% had an Apple phone. The majority of the Finnish respondents, 65.8%, had a Nokia branded phone, while 17.4% had a Samsung branded phone and 9.3% had an Apple branded phone. In the case of Finland, the high proportion of Nokia brand owners represents some home country bias, as Nokia originates from Finland [134].
t-tests were conducted to analyze whether there were significant differences for the individual items per brand in the two countries. A p-value indicates whether there is an effect, but it does not indicate the size of the effect. Thus, in addition to the p-value (statistical significance), we report the Cohen’s d value, which is used to measure effect size (i.e., substantive significance). Cohen classified effect sizes as small (d = 0.2), medium (d = 0.5), and large (d ≥ 0.8) [135]. A MANOVA with country as an independent factor and post hoc tests were conducted, but post hoc tests could not be performed, as there are fewer than three country groups. The Wilk’s Lambda, however, indicated that there were significant differences between the two country groups (p < 0.001).
We compared the means for each of the eco-friendliness items per brand in both of the countries separately to verify that the respondents understood the items in the scale in the same way. Response styles in different countries are dependent on the cultural context [123,136]. When assessing the differences in the means for the eco-friendliness dimension in the two countries, one can see that the Indian respondents gave systematically higher ratings for the items (Table 2) than did the Finnish respondents (Table 3). All the effect sizes (Cohen’s d) are very small (<0.2) in the India data, which indicates that the differences between the brands are not substantively significant. However, in Finland the effect sizes (Cohen’s d) for all the eco-friendliness items in the case of Nokia compared to the two other brands are over the threshold of being small, except for the eco-behavioral dimension, where the magnitude of the effect size is very small for Samsung and Nokia.
Table 2.
t-test results for the differences in the eco-friendliness of the brands in India.
Table 3.
t-test results for the differences in the eco-friendliness of the brands in Finland.
There were significant differences in the eco-friendly brand experiences for some individual dimensions for the different smartphone brands between the genders. In India, the score for the eco-sensory dimension for the Nokia brand was the only dimension that was rated significantly higher among men than among women (Table 4; p = 0.019).
Table 4.
Differences in the perceptions of eco-friendliness of the brands in India among females and males.
In Finland, there were significant differences in the way men experienced the Samsung brand more negatively on the eco-intellectual dimension compared to the way women did (Table 5; p = 0.092). For the Apple brand, the women in Finland rated all of the four eco-friendly brand dimensions significantly higher than did the men (Table 5; eco-intellectual p = 0.017, eco-sensory p = 0.001, eco-affective p = 0.000, eco-behavioral p = 0.008).
Table 5.
Differences in the perceptions of eco-friendliness of the brands in Finland among females and males.
The results indicate that consumers recognize the existence of the eco-friendliness dimension, and it can be used to measure brands. We demonstrate this in more detail in the following part of our research, where we test with SEM that the eco-friendliness construct is also a dimension in the overall brand experience scale.
4.2. Model Estimation
We further investigated whether eco-friendliness-driven brand experiences are a part of the original BXS model (see Appendix A for a list of all the items included in the extended BXS). After thorough analysis, however, we found that the negative statements and the intellectual dimension in the original BXS model extended with eco-friendly statements caused issues, especially with the India data, and consequently the model fit indices were very low for the models tested. We compared the model fit indices for both countries: (A) for the original BXS model (without the dimension for eco-friendliness); (B) for a model where the individual eco-friendliness items were included in the related four dimensions of the original BXS; and (C) for a model in which the eco-friendliness dimension was a separate fifth dimension in the model (see Table 6). Model C best fit the data collected in Finland, but, for the India data, this model was not appropriate.
Table 6.
Model fit indices for three models tested with the combined data set consisting of the three brands: (A) the original BXS; (B) extended BXS with eco-friendliness embedded in the four dimensions; and (C) extended BXS with eco-friendliness as a fifth dimension.
In the India data, the factor loadings in model C for the item “I engage in a lot of thinking when I encounter this brand” were below the recommended threshold of 0.4 for nearly all of the three brands (0.33 for Samsung, 0.35 for Nokia, 0.44 for Apple, and 0.38 for the combined data set including responses for Samsung, Apple, and Nokia). In Finland, the loadings for this dimension are all above 0.40, ranging from 0.58 to 0.73. In addition, in the India data, all the loadings for the negatively worded statements were very low, ranging from −0.10 to 0.23, which clearly indicates that even reverse coding would not be helpful in this situation. As a result, we introduced a revised model consisting of four experiential dimensions—sensory, affective, behavioral, and eco-friendliness—without the negatively worded items. We tested the revised model with a data set consisting of the combined responses for the three brands together for each of the countries separately. We tested that the model fit the data with SEM in SPSS and Amos Graphics.
The Tucker Lewis Index (TLI) and Comparative Fit Index (CFI) are considered to be among the most reliable indices, and when they return values larger than 0.90, the model can be considered to fit well [137]. For both India and Finland, the TLI was over 0.90, which indicates a good fit: 0.912 for India, and 0.904 for Finland. When the CFI is near 0.95, the model can be considered to fit even better [132], which is the case for both of the countries: 0.953 for India, and 0.949 for Finland. The chi square is sensitive to the number of respondents in the sample, so a model that fits well has a chi square near the sample size [132]. For both of the countries, the sample was slightly over 500, which means that the chi square for both the countries indicates a very good fit: 499.53 for India, and 492.08 for Finland.
We then reevaluated the items that proved to have acceptable loadings in the CFA with the reliability coefficient Cronbach’s alpha, which also indicates the internal consistency of the measurement items. For the subscale measuring eco-friendliness in the revised scale (four last items in the SEM model in Figure 2), the Cronbach’s Alpha is 0.851 with the India data. In the case of Finland, the Cronbach’s Alpha is 0.899 for the eco-friendliness subscale. The values for the Cronbach’s Alpha factors are very good, as they are in both cases larger than 0.80 [137], which supports the construct validity of the eco-friendliness cross-nationally in India and Finland.
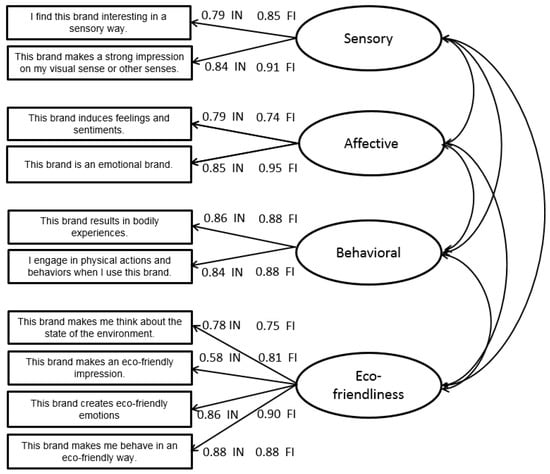
Figure 2.
Factor loadings in the SEM for the revised BXS extended with items on eco-friendliness. (IN = India, FI = Finland).
The average variance extracted (AVE) and composite reliability (CR) were used to test the validity and reliability of the scale items [121]. For the eco-friendliness subscale with the India data, the AVE is 0.62 and the CR is 0.86. With the Finland data, the AVE for the eco-friendliness subscale is 0.70 and the CR is 0.90. The required threshold for AVE is 0.50 and for CR it is 0.70 [121]. Thus, the validity and reliability of the subscale have been confirmed.
The factor loadings in the revised and extended BXS for the eco-friendliness items in both countries are all above 0.50, which means that the variables are aligned with the factors [138]. The factor loadings also indicate that the eco-friendliness dimension is as strong as the other dimensions (see Figure 2) in the revised brand experience scale tested in a previous study [107]. Our results highlight the usability of the revised model in both monitoring the eco-friendly experiences of citizen-consumers and grouping corporate brands based on their eco-friendly reputations.
When assessing the construct validity of the extended BXS model, one should first verify the concept validity to ensure that the abstract concepts of the construct have been understood in the same way by all of the participants. In this study, this is reflected in the response patterns of the participants for the different items, and it can be seen that they are very similar in the countries individually. Convergent validity is indicated in this study by high factor loadings in the revised BXS model: all of the items are above 0.50, which is significant and required for convergent validity. The discriminant validity of the model was analyzed based on the CFA and the model fit indices. The TLI and CFI are larger than 0.90 for both countries, which means that the model fit well. The nomological validity of the conceptual model was verified, and the construct measuring eco-friendliness was found to be valid in the revised BXS model in both countries and not a duplicate of any of the existing BXS dimensions, as can be seen in the factor loadings in Figure 2.
5. Discussion
Our research responds to the call for more consumer-focused nonfinancial measures for better understanding the sustainable consumption behavior and brand experiences of consumers [7]. In addition, we introduce a systemic approach for tracking the implementation of sustainable development on the microfoundations level, as the role of consumers in the implementation of SCP has been highlighted [10]. In this exploratory research, we focus on testing cross-nationally the eco-friendliness of consumers’ brand experiences with a brand experience scale [18] that has been extended with a dimension for eco-friendliness [19]. The measurement scale can be deployed by companies for comparing the experiences consumers have of their brand in comparison with their competitors’ brands. The validity and reliability of the scale is demonstrated in India, representing a non-Western country, and Finland, representing a Western country. This indicates that the scale is generalizable cross-nationally.
There were differences in the way consumers perceived the brands in the two countries. The response styles in India and Finland are different, so the Indian respondents systematically gave higher scores to all of the brands. In Finland, the response style is more modest and the ratings for the brands are more negative than in India. The respondents in Finland generally rated the brands with scores closer to option 3 (somewhat disagree). This suggests that the Finnish respondents are not fully confident with regard to how well the claims in the statements apply to the brands included in the survey. The Indian respondents demonstrated slightly more trust in the eco-friendliness of the companies, but they fully did not fully agree with the statements on eco-friendliness of the smartphone brands, as the mean of their responses is closest to response option 5 (somewhat agree). The response style of Indians is dependent on the national context, which is very different from that in Finland [123,136,139,140]. In the case of Indian respondents, one needs to take into account that India has been found to be a high-power-distance country, where people have authoritarian values that are reflected in the way people support conformity and accept authorities [141]. However, the environmental values of individual consumers can be similar in different countries [91], even though they manifest themselves in the results differently due to varying response styles and national level differences in the people’s respect for authority.
When analyzing the differences in the eco-friendliness of the respondents’ brand experiences on the country level, it can be clearly seen that in Finland the home country bias [134] is strong and the ratings for all of the eco-friendliness dimensions are higher for the Nokia brand. The respondents in Finland gave significantly lower ratings for the Apple brand compared to the Samsung brand for the eco-sensory and eco-behavioral dimensions, which could be interpreted to mean that the Apple brand is not supporting the respondents’ eco-friendly behavior and its design does not appear to be eco-friendly. In India, the brands are rated differently: Apple received the highest ratings of the three brands for the eco-intellectual and eco-affective dimensions, which shows that the Apple brand has created positive interest in India. However, it should be noted that only a very small percentage of respondents personally owned an Apple branded smartphone (5.4%) at the time of the survey. In addition, in India both the Samsung and Apple brands received significantly higher ratings for the eco-behavioral dimension than Nokia. This seems to indicate that the Nokia brand has not managed to sustain and deliver a perception of enabling eco-friendly behavior among consumers in India.
The differences in the responses for men and women respondents vary slightly in India and Finland on some of the dimensions measuring the eco-friendliness of brand experiences. In India, the fact that men rate the eco-friendliness of the Nokia brand significantly higher on the sensory level than women could indicate that the design, look, and feel of the brand are more convincing to the men. On the other hand, in Finland the men rated the eco-intellectual aspects of the Samsung brand significantly lower than did the women respondents, which indicates that when the Finnish men respondents think of the Samsung brand they do not find it cognitively as eco-friendly as do the women. In Finland, the men also gave significantly lower ratings for the Apple brand on all of the measured eco-friendliness dimensions, which could indicate that the men are more critical than women with regard to what can be considered eco-friendly in brand experiences, and Apple has not been convincing them in Finland. The eco-intellectual dimension is supported by the findings in both countries, even though the intellectual dimension in the original brand experience scale is not confirmed in India.
The factor loadings for the negatively worded items in the original BXS model revealed major issues in the model, especially in the case of India. However, also for Finland, the negatively worded items had smaller loadings than the other items. The negative items were not applicable for the BXS in this case, and thus they were excluded from the revised version of the model. According to the psychometric literature, negatively worded items can be excluded from scales when the content is already covered by affirmative statements [142]. It has also been argued that alternating positively and negatively worded items could distort the respondents’ response styles [136,143,144]. Most brand measurement scales do not have negative items [14]. Concise measurement models, such as the revised BXS model, have been called for because they can be applied and extended more easily than longer and more complicated models [142,145].
For smartphone brands, the intellectual dimension in the brand experiences differs the most in the two countries. The intellectual dimension was excluded from the revised scale because the factor loadings for the India data for one of the measurement items (“I engage in a lot of thinking when I encounter this brand”) and the model fit indices were under the recommended thresholds. There could be national differences related to the intellectual dimension, and thus it is not generalizable cross-nationally. In addition, it should be taken into account that not only intellectual but also affective aspects are associated with decision-making in purchasing and consumption experiences [146]. In consumer-psychology, the intellectual dimension of brand experiences has been also associated with the affective dimension, so the experiencing of brands happens on three levels: sensory, affective-cognitive, and behavioral [147].
5.1. Theoretical Implications
The findings of our study indicate that the eco-friendliness dimension can be generalized in two countries with very different demographics and economic situations. Therefore, there is external validity in the revised extended version of the brand experience construct of Brakus et al. [18]. The theoretical implication of this finding is that the eco-friendly dimension in the BXS should be taken into account when measuring brand experiences. We propose that the eco-friendliness dimension that manifested itself in consumers’ brand experiences associated with smartphone brands is a relevant dimension that companies could use to monitor the brand experiences of their consumers. When Brakus et al. [18] created their brand experience measurement model, they initially included a dimension for a relational level, which had been created based on an earlier conceptualization of the experiential marketing elements created by Schmitt [93]. The relational level has further been linked to socially responsible consumption by Shobeiri et al. [92]. There could be a temporal effect in the way the relational dimension is supported by the data, so that, in the beginning of 2000, when Brakus et al. [18] were constructing the measure, it was not supported in their surveys. However, in our study, it is supported, which might indicate that consumers have become more environmentally conscientious of their product choices during these years and now consider the social and environmental impacts of those choices.
5.2. Managerial Implications
The main managerial implication of our findings is that global corporations could concentrate on creating a branding approach that has aspects of eco-friendliness in addition to sensory, affective, and behavioral aspects. It is critical that the different brand experience dimensions are tested locally in the target markets before they are implemented. However, based on our study the dimensions for eco-friendly, sensory, affective, and behavioral brand experiences are generalizable cross-nationally in India and Finland. Even so, our findings suggest that the intellectual aspects of the brand experience should be localized with special expertise of the consumer groups in the target country. When corporations focus on creating positive brand experiences, they should also make the experiences appealing on a sensory, affective, and behavioral level [148] and ensure that the brand experiences are eco-friendly.
Based on the measurement results companies could develop more eco-friendly products and manage the eco-friendliness of their brands. Providing more eco-friendly products that consumers experience as being eco-friendly on the brand level would help to reinforce the sustainable consumption behavior of consumers on the micro level and promote sustainable development on the macro level. Consumers trust that companies who have CSR activities are doing their best to develop the sustainability of their product design, manufacturing, and production processes to create more eco-friendly products, which the consumers also experience as truly eco-friendly, and it is crucial for companies to realize this is one of the consumer requirements [79,149]. Electronics companies could use the measures to monitor, for example, how their e-waste management activities are reflected in consumers’ brand experiences. Consumers cannot drive change on their own to prevent environmental change and the accumulation of e-waste [59,60].
The linking of the microfoundations on the consumer level to the decision-making processes of senior managers on the meso level could benefit and improve the performance of companies, as it enables a consumer-oriented business environment [149]. Organizations could create conditions for more open dialogue between the decision-makers and lower level employees, who are closer to consumers on a daily basis [98] and who can also track and report on consumers’ brand experiences. The way consumers perceive the eco-friendliness and sustainability of a corporation offers an invaluable source of information to managers regarding what they should focus on in their sustainability and environmental development activities [150]. The extended BXS with a dimension for eco-friendliness could be used to measure the experiential consumption benefits that consumers perceive on the brand level.
The findings of this study may also encourage managers to invest in brand management and green marketing strategies that are merely “greenwashing” initiatives to promote their products and services, as the design of new products is more costly in the short term. For this reason, it is critical that governments and policymakers also track the CSR and eco-friendly initiatives of corporations.
5.3. Policy Implications
Our results could be used to advance a balanced approach to environmental governance leading to the integration of the microfoundations to the institutional framework. On the citizen-consumer side of the balanced approach, one way to monitor the reputation of a company from the environmental perspective is to monitor the brand experiences of consumers and how those consumers rate the eco-friendliness of the brands. In the case of consumer electronics, the reputation of the companies may be rated by the way they handle their e-waste. We need multiple stakeholders and disciplines to advance and support consumer-citizens in their sustainable consumption practices: public authorities, NGOs, companies, and research organizations as well as MDs, engineers, and social scientists [53,60,95]. In a balanced approach, policymakers have a critical role in setting the agenda, coordinating the change plans, finding better ways to incentivize consumer electronics corporations, and implementing follow-up measures [60,95] to protect populations from the negative health impacts of e-waste globally.
In order to promote sustainable development on the macro level, policymakers and companies could track consumers’ experiences of the conditions and actions related to purchasing on the micro-level [27]. In 2014, less than half of the EU member states had incorporated the WEEE Directive in their national legislation, and Extended Producer Responsibility had been implemented in varying ways in the countries [151]. In the United States, there is no comprehensive legislation on e-waste management on the federal level [152]. Even though the United States has signed the Basel Convention on the Control of Transboundary Movements of Hazardous Wastes and Their Disposal, the country has not ratified the convention [152]. Policymakers could use the brand measurement results to develop policies and plan interventions that promote more eco-friendly and sustainable electronics products. Policies are required to reduce the volumes of e-waste produced so that the electronics industry would achieve the sustainable development goal on responsible consumption.
5.4. Limitations and Future Research
One limitation of this study is that in the sample from Finland the majority of the respondents owned a Nokia branded phone, which affected the means and standard deviations in the responses due to home country bias [134]. This was apparent in the way the Finnish respondents experienced the Nokia brand to be the least unfavorable on the eco-friendliness subscale among the three brands. However, in the second part of the research, the factor loadings are not necessarily affected by the country bias, as the loadings for the India data are very similar to those for the Finland data. Another limitation of this study is that only a small portion of the respondents in India had an Apple branded phone, which may also have had an impact on some of the ratings given to the three brands in India.
Even though, with the data in this specific study, we cannot directly infer whether eco-friendliness in consumers’ brand experiences of smartphone brands impacts their future product selections, the results indicate that people recognize an eco-friendly dimension in their brand experiences. Thus, consumers seem to understand that consumer electronics brands can offer eco-friendly brand experiences, and the degree to which they are considered to be eco-friendly by consumers can be measured with the eco-friendliness subscale in the BXS.
This study is the first step in the development of an eco-friendliness brand experience scale but it remains for future research to verify the scale items further. Future research should study whether there are some unique characteristics in the items measuring eco-friendliness. It should also be investigated if there are other variations and levels for describing eco-friendliness than the ones created based on the BXS model created by Brakus et al. [18,19]. Moreover, it would be worthwhile to verify whether the eco-friendliness dimension that manifested itself in consumers’ brand experiences associated with smartphone brands is also a relevant dimension for other consumer products. Future studies should also control for the participants’ level of experience and ownership of a particular brand to see how much this affects their brand experiences.
There is a need to conduct more cross-national research to further ensure the validity and reliability of the eco-friendliness subscale globally. There are fruitful potential research avenues, especially in regard to investigating how the revised BXS including the eco-friendliness dimension could be used for monitoring and devising a balanced approach to environmental governance, incorporating both corporations and policymakers, who track the experiences for consumers.
Green et al. [150] understood the term “consumer” to also encompass the organizations that, for example, are included in the supply chain. However, in the context of this paper, we have referred to consumers as individuals who select, use, and dispose of products or services produced by companies, and we have excluded other organizations and processes from this analysis [40]. In future research, it would be worthwhile to use the wider meaning of the term “consumer” and focus on other stakeholders that consume the products and services of branded companies, such as organizations and suppliers in the companies’ supply chains and business ecosystem.
6. Conclusions
We have replicated and tested cross-nationally an existing BXS [18] that has been extended with an eco-friendliness subscale [19] and measured how consumers in India and Finland experienced the eco-friendliness of three major smartphone brands. The respondents recognized that there are four levels of eco-friendliness in brand experiences: eco-sensory, eco-affective, eco-behavioral, and eco-intellectual. We also used these measurement items to compare how consumers in India and Finland experience the eco-friendliness of global smartphone brands (Samsung, Apple, and Nokia). We show with SEM that the items measuring eco-friendliness form just as strong a dimension as the other dimensions in the revised BXS and the data collected in two different countries fit the model, which confirms that the revised model is applicable cross-nationally. We found that the four different levels of eco-friendliness in brand experiences are valid for measuring the eco-friendliness of global smartphone brands in India and Finland.
When companies design commercial communication to support their marketing and after-sales services offered to consumers, it is linked to the brand. Consumers form personal brand experiences from different information sources and consumption practices, which may also be related to the eco-friendliness of the brand. Thus, it is justifiable to use the brand as the focal point for tracking the success of a company’s environmental initiatives and how these are reflected in the consumers’ experiences of the eco-friendliness of the brand. In the case of consumer electronics, the reputation of the companies may be rated by the way they handle their e-waste. Companies could benefit from tracking consumers’ eco-friendly brand experiences with the revised BXS including the dimension for eco-friendliness and thus reinforce SCP. There could be meaningful impacts both societally and environmentally when consumers are able to make their product choices confidently based on the brand-related environmental information and their experiences of the eco-friendliness of brands.
Acknowledgments
This work was partly supported by the Academy of Finland (grant number 279087). We thank Jouni J. K. Jaakkola (Center for Environmental and Respiratory Health Research, Faculty of Medicine, University of Oulu, Oulu, Finland) for his valuable comments and suggestions, which helped to develop this paper.
Author Contributions
Ulla A. Saari and Saku J. Mäkinen conceived and designed the survey; Ulla A. Saari coordinated the survey; Ulla A. Saari and Saku J. Mäkinen analyzed the data; Ulla A. Saari, Saku J. Mäkinen, and Rupert J. Baumgartner contributed to the theoretical background and discussion; and Ulla A. Saari, Saku J. Mäkinen, and Rupert J. Baumgartner wrote the paper.
Conflicts of Interest
The authors declare no conflict of interest.
Appendix A
Below is a list of all dimensions and measurement items included in the original BXS (including the negatively worded statements in italics) and the extended items measuring eco-friendliness.
- Original BXS scale:
- Affective dimension
- This brand induces feelings and sentiments.
- This brand is an emotional brand.
- I do not have strong emotions for this brand.
- Intellectual dimension
- This brand stimulates my curiosity and problem solving.
- I engage in a lot of thinking when I encounter this brand.
- This brand does not make me think.
- Sensory dimension
- I find this brand interesting in a sensory way.
- This brand makes a strong impression on my visual sense or other senses.
- This brand does not appeal to my senses.
- Behavioral dimension
- This brand results in bodily experiences.
- I engage in physical actions and behaviors when I use this brand.
- This brand is not action oriented.
- Dimension included in the extended BXS scale:
- Eco-friendliness dimension
- This brand makes me think about the state of the environment.
- This brand makes an eco-friendly impression. (eco-friendly = not environmentally harmful).
- This brand creates eco-friendly emotions.
- This brand makes me behave in an eco-friendly way.
References
- Dauvergne, P.; Lister, J. The Prospects and Limits of Eco-Consumerism: Shopping Our Way to Less Deforestation? Organ. Environ. 2010, 23, 132–154. [Google Scholar] [CrossRef]
- Bowen, F.; Aragon-Correa, J.A. Greenwashing in Corporate Environmentalism Research and Practice: The Importance of What We Say and Do. Organ. Environ. 2014, 27, 107–112. [Google Scholar] [CrossRef]
- Dyllick, T.; Muff, K. Clarifying the Meaning of Sustainable Business: Introducing a Typology from Business-as-Usual to True Business Sustainability. Organ. Environ. 2016, 29, 156–174. [Google Scholar] [CrossRef]
- Dauvergne, P.; Lister, J. Big brand sustainability: Governance prospects and environmental limits. Glob. Environ. Chang. 2012, 22, 36–45. [Google Scholar] [CrossRef]
- Antolin-Lopez, R.; Delgado-Ceballos, J.; Montiel, I. Deconstructing corporate sustainability: A comparison of different stakeholder metrics. J. Clean. Prod. 2016, 136, 5–17. [Google Scholar] [CrossRef]
- Montiel, I.; Delgado-Ceballos, J. Defining and Measuring Corporate Sustainability: Are We There Yet? Organ. Environ. 2014, 27, 113–139. [Google Scholar] [CrossRef]
- Tang, C.S.; Zhou, S. Research advances in environmentally and socially sustainable operations. Eur. J. Oper. Res. 2012, 223, 585–594. [Google Scholar] [CrossRef]
- Ramirez, E.; Jimenez, F.R.; Gau, R. Concrete and abstract goals associated with the consumption of environmentally sustainable products. Eur. J. Mark. 2015, 49, 1645–1665. [Google Scholar] [CrossRef]
- Lukman, R.K.; Glavic, P.; Carpenter, A.; Virtic, P. Sustainable consumption and production—Research, experience, and development—The Europe we want. J. Clean. Prod. 2016, 138, 139–147. [Google Scholar] [CrossRef]
- Roy, V.; Singh, S. Mapping the business focus in sustainable production and consumption literature: Review and research framework. J. Clean. Prod. 2017, 150, 224–236. [Google Scholar] [CrossRef]
- Geels, F.W.; McMeekin, A.; Mylan, J.; Southerton, D. A critical appraisal of Sustainable Consumption and Production research: The reformist, revolutionary and reconfiguration positions. Glob. Environ. Chang. 2015, 34, 1–12. [Google Scholar] [CrossRef]
- United Nations. Sustainable Development Knowledge Platform—GOAL 12: Ensure Sustainable Consumption and Production Patterns. 2016. Available online: https://sustainabledevelopment.un.org/sdg12 (accessed on 12 March 2017).
- Leonidou, C.N.; Leonidou, L.C. Research into environmental marketing/management: A bibliographic analysis. Eur. J. Mark. 2011, 45, 68–103. [Google Scholar] [CrossRef]
- Lehmann, D.; Keller, K.; Farley, J. The Structure of Survey-Based Brand Metrics. J. Int. Mark. 2008, 16, 29–56. [Google Scholar] [CrossRef]
- Chen, Y.; Lai, S.; Wen, C. The influence of green innovation performance on corporate advantage in Taiwan. J. Bus. Ethics 2006, 67, 331–339. [Google Scholar] [CrossRef]
- Chen, Y. The Drivers of Green Brand Equity: Green Brand Image, Green Satisfaction, and Green Trust. J. Bus. Ethics 2010, 93, 307–319. [Google Scholar] [CrossRef]
- Phipps, M.; Ozanne, L.K.; Luchs, M.G.; Subrahmanyan, S.; Kapitan, S.; Catlin, J.R.; Gau, R.; Naylor, R.W.; Rose, R.L.; Simpson, B.; et al. Understanding the inherent complexity of sustainable consumption: A social cognitive framework. J. Bus. Res. 2013, 66, 1227–1234. [Google Scholar] [CrossRef]
- Brakus, J.J.; Schmitt, B.H.; Zarantonello, L. Brand Experience: What Is It? How Is It Measured? Does It Affect Loyalty? J. Mark. 2009, 73, 52–68. [Google Scholar] [CrossRef]
- Saari, U. Eco-Friendliness in the Brand Experience of High-Tech Products. Ph.D. Thesis, Tampere University of Technology, Tampere, Finland, 2016. [Google Scholar]
- Hubbard, R.; Lindsay, R. How the emphasis on ‘original’ empirical marketing research impedes knowledge development. Mark. Theor. 2002, 2, 381–402. [Google Scholar] [CrossRef]
- Armstrong, J. Discovery and communication of important marketing findings: Evidence and proposals. J. Bus. Res. 2003, 56, 69–84. [Google Scholar] [CrossRef]
- Reid, L.; Soley, L.; Wimmer, R. Replication in Advertising Reasearch: 1977, 1978, 1979. J. Advert. 1981, 10, 3–13. [Google Scholar] [CrossRef]
- Madden, C.S.; Easley, R.W.; Dunn, M.G. How journal editors view replication research. J. Advert. 1995, 24, 77–87. [Google Scholar] [CrossRef]
- Mezias, S.; Regnier, M. Walking the walk as well as talking the talk: Replication and the normal science paradigm in strategic management research. Strateg. Organ. 2007, 5, 283–296. [Google Scholar] [CrossRef]
- Evanschitzky, H.; Armstrong, J. Research with In-built replications: Comment and further suggestions for replication research. J. Bus. Res. 2013, 66, 1406–1408. [Google Scholar] [CrossRef]
- Uncles, M.; Kwok, S. Designing research with in-built differentiated replication. J. Bus. Res. 2013, 66, 1398–1405. [Google Scholar] [CrossRef]
- Coleman, J.S. Microfoundations and Macrosocial Behavior. In The Micro-Macro Link; Alexander, J.C., Giesen, B., Münch, R., Smelser, N.J., Eds.; University of California Press: Berkeley, CA, USA, 1987; pp. 153–173. [Google Scholar]
- Romani, S.; Grappi, S.; Dalli, D. Emotions that drive consumers away from brands: Measuring negative emotions toward brands and their behavioral effects. Int. J. Res. Mark. 2012, 29, 55–67. [Google Scholar] [CrossRef]
- Schmitt, B. ‘Superficial out of profundity’: The branding of customer experiences. J. Brand Manag. 1997, 5, 92–98. [Google Scholar] [CrossRef]
- Fournier, S. Consumers and their brands: Developing relationship theory in consumer research. J. Consum. Res. 1998, 24, 343–373. [Google Scholar] [CrossRef]
- Prahalad, C.K.; Ramaswamy, V. The new frontier of experience innovation. MIT Sloan Manag. Rev. 2003, 44, 12–22. [Google Scholar]
- Keller, K.; Lehmann, D. Brands and branding: Research findings and future priorities. Mark. Sci. 2006, 25, 740–759. [Google Scholar] [CrossRef]
- Aaker, D.A. Brand Relevance. Making Competitors Irrelevant; John Wiley & Sons: San Francisco, CA, USA, 2011; p. 381. [Google Scholar]
- Young, W.; Hwang, K.; McDonald, S.; Oates, C. Sustainable Consumption: Green Consumer Behaviour when Purchasing Products. Sustain. Dev. 2010, 18, 20–31. [Google Scholar] [CrossRef]
- Grimmer, M.; Bingham, T. Company environmental performance and consumer purchase intentions. J. Bus. Res. 2013, 66, 1945–1953. [Google Scholar] [CrossRef]
- Russo, M.; Fouts, P. A resource-based perspective on corporate environmental performance and profitability. Acad. Manag. J. 1997, 40, 534–559. [Google Scholar] [CrossRef]
- Klein, J.; Dawar, N. Corporate social responsibility brand evaluations in and consumers’ attributions and a product-harm crisis. Int. J. Res. Mark. 2004, 21, 203–217. [Google Scholar] [CrossRef]
- Lindgreen, A.; Xu, Y.; Maon, F.; Wilcock, J. Corporate social responsibility brand leadership: A multiple case study. Eur. J. Mark 2012, 46, 965–993. [Google Scholar] [CrossRef]
- Orlitzky, M.; Siegel, D.; Waldman, D. Strategic Corporate Social Responsibility and Environmental Sustainability. Bus. Soc. 2011, 50, 6–27. [Google Scholar] [CrossRef]
- Hawkins, D.I.; Mothersbaugh, D.L. Consumer Behavior, Building Marketing Strategy, 11th ed.; McGraw-Hill: New York, NY, USA, 2010. [Google Scholar]
- Kumar, V.; Christodoulopoulou, A. Sustainability and branding: An integrated perspective. Ind. Mark. Manag. 2014, 43, 6–15. [Google Scholar] [CrossRef]
- De Pelsmacker, P.; Janssens, W.; Sterckx, E.; Mielants, C. Consumer preferences for the marketing of ethically labelled coffee. Int. Mark. Rev. 2005, 22, 512–530. [Google Scholar] [CrossRef]
- Moisander, J. Motivational Complexity of Green Consumerism. Int. J. Consum. Stud. 2007, 31, 404–409. [Google Scholar] [CrossRef]
- Shao, J.; Taisch, M.; Ortega-Mier, M. A grey-DEcision-MAking Trial and Evaluation Laboratory (DEMATEL) analysis on the barriers between environmentally friendly products and consumers: Practitioners’ viewpoints on the European automobile industry. J. Clean. Prod. 2016, 112, 3185–3194. [Google Scholar] [CrossRef]
- Shao, J.; Taisch, M.; Ortega Mier, M. Influencing factors to facilitate sustainable consumption: From the experts’ viewpoints. J. Clean. Prod. 2017, 142, 203–216. [Google Scholar] [CrossRef]
- Matejek, S.; Gossling, T. Beyond Legitimacy: A Case Study in BP′s “Green Lashing”. J. Bus. Ethics 2014, 120, 571–584. [Google Scholar] [CrossRef]
- Surroca, J.; Tribo, J.A.; Zahra, S.A. Stakeholder pressure on MNEs and the transfer of socially irresponsible practices to subsidiaries. Acad. Manag. J. 2013, 56, 549–572. [Google Scholar] [CrossRef]
- Wijen, F. Means versus ends in opaque institutional fields: Trading off compliance and achievement in sustainability standard adoption. Acad. Manag. Rev. 2014, 39, 302–323. [Google Scholar] [CrossRef]
- Chen, A.M.; Dietrich, K.N.; Huo, X.; Ho, S.M. Developmental Neurotoxicants in E-Waste: An Emerging Health Concern. Environ. Health Perspect. 2011, 119, 431–438. [Google Scholar] [CrossRef] [PubMed]
- Amegah, A.K.; Jaakkola, J.J.K. Street vending and waste picking in developing countries: A long-standing hazardous occupational activity of the urban poor. Int. J. Occup. Environ. Health 2016, 22, 187–192. [Google Scholar] [CrossRef] [PubMed]
- Schmidt, C.W. Unfair trade e-Waste in Africa. Environ. Health Perspect. 2006, 114, 232–235. [Google Scholar] [CrossRef]
- Cai, T.J.; Luo, W.J.; Ruan, D.Y.; Wu, Y.J.; Fox, D.A.; Chen, J.Y. The History, Status, Gaps, and Future Directions of Neurotoxicology in China. Environ. Health Perspect. 2016, 124, 722–732. [Google Scholar] [CrossRef] [PubMed]
- Heacock, M.; Kelly, C.B.; Asante, K.A.; Birnbaum, L.S.; Bergman, Å.L.; Bruné, M.N.; Buka, I.; Carpenter, D.O.; Chen, A.; Huo, X.; et al. E-Waste and Harm to Vulnerable Populations: A Growing Global Problem. Environ. Health Perspect. 2016, 124, 550–555. [Google Scholar] [CrossRef] [PubMed]
- Wang, Z.; Guo, D.; Wang, X. Determinants of residents’ e-waste recycling behaviour intentions: Evidence from China. J. Clean. Prod. 2016, 137, 850–860. [Google Scholar] [CrossRef]
- Christmann, P. Multinational companies and the natural environment: Determinants of global environmental policy standardization. Acad. Manag. J. 2004, 47, 747–760. [Google Scholar] [CrossRef]
- Ormond, J.; Goodman, M.K. A new regime of carbon counting: The practices and politics of accounting for everyday carbon through CO2e. Glob. Environ. Chang. 2015, 34, 119–131. [Google Scholar] [CrossRef]
- Breivik, K.; Armitage, J.M.; Wania, F.; Sweetman, A.J.; Jones, K.C. Tracking the Global Distribution of Persistent Organic Pollutants Accounting for E-Waste Exports to Developing Regions. Environ. Sci. Technol. 2016, 50, 798–805. [Google Scholar] [CrossRef] [PubMed]
- Spaargaren, G. Theories of practices: Agency, technology, and culture: Exploring the relevance of practice theories for the governance of sustainable consumption practices in the new world-order. Glob. Environ. Chang. 2011, 21, 813–822. [Google Scholar] [CrossRef]
- Barr, S.; Gilg, A.; Shaw, G. Citizens, consumers and sustainability: (Re) Framing environmental practice in an age of climate change. Glob. Environ. Chang. 2011, 21, 1224–1233. [Google Scholar] [CrossRef]
- Akenji, L. Consumer scapegoatism and limits to green consumerism. J. Clean. Prod. 2014, 63, 13–23. [Google Scholar] [CrossRef]
- Davies, I.A.; Gutsche, S. Consumer motivations for mainstream “ethical” consumption. Eur. J. Mark. 2016, 50, 1326–1347. [Google Scholar] [CrossRef]
- Kotler, P. Reinventing Marketing to Manage the Environmental Imperative. J. Mark. 2011, 75, 132–135. [Google Scholar] [CrossRef]
- European Commission. Single Market for Green Products. Available online: http://ec.europa.eu/environment/eussd/smgp/facts_and_figures_en.htm (accessed on 24 May 2017).
- The Nielsen Company. Green Generation: Millennials Say Sustainability Is a Shopping Priority. Available online: http://www.nielsen.com/us/en/insights/news/2015/green-generation-millennials-say-sustainability-is-a-shopping-priority.html (accessed on 28 March 2017).
- Ottman, J.A. The New Rules of Green Marketing: Strategies, Tools, and Inspiration for Sustainable Branding; Berrett-Koehler Publishers: San Francisco, CA, USA, 2011. [Google Scholar]
- Czinkota, M.; Kaufmann, H.R.; Basile, G. The relationship between legitimacy, reputation, sustainability and branding for companies and their supply chains. Ind. Mark. Manag. 2014, 43, 91–101. [Google Scholar] [CrossRef]
- The Seventh Generation. The Seventh Generation: Corporate Consciousness Reports. Available online: https://www.seventhgeneration.com/corporate-consciousness-reports (accessed on 28 June 2017).
- O’Brien, S.A. Unilever Goes Green, Buys Seventh Generation. Available online: http://money.cnn.com/2016/09/19/technology/unilever-buying-seventh-generation/index.html (accessed on 28 June 2017).
- Fairtrade International. Selling Fairtrade. Available online: https://www.fairtrade.net/about-fairtrade/fairtrade-and-you/selling-fairtrade.html (accessed on 28 June 2017).
- Scammell, M. Citizen consumers: Towards a new marketing of politics? In Media and the Restyling of Politics: Consumerism, Celebrity, Cynicism; Corner, J., Pels, D., Eds.; Sage: Thousand Oaks, CA, USA, 2003. [Google Scholar]
- Packaged Facts. Green Household Cleaning and Laundry Products in the U.S., 3rd Edition. Available online: https://www.packagedfacts.com/Green-Household-Cleaning-8825323/ (accessed on 28 June 2017).
- McDonald, S.; Oates, C.; Thyne, M.; Alevizou, P.; McMorland, L. Comparing sustainable consumption patterns across product sectors. Int. J. Consum. Stud. 2009, 33, 137–145. [Google Scholar] [CrossRef]
- Chatterjee, I.; Küpper, J.; Mariager, C.; Moore, P.; Reis, S. Consumer Package Goods Practice. In The Decade Ahead: Trends That Will Shape the Consumer Goods Industry; McKinsey & Company: New York, NY, USA, 2010; p. 18. [Google Scholar]
- Accenture and UN Global Compact. The Consumer Study: From Marketing to Mattering. Available online: https://www.accenture.com/us-en/insight-un-global-compact-consumer-study-marketing-mattering (accessed on 28 November 2016).
- Baron, S.; Warnaby, G. Individual customers’ use and integration of resources: Empirical findings and organizational implications in the context of value co-creation. Ind. Mark. Manag. 2011, 40, 211–218. [Google Scholar] [CrossRef]
- Cova, B.; Pace, S. Brand community of convenience products: New forms of customer empowerment—The case “my Nutella The Community”. Eur. J. Mark. 2006, 40, 1087–1105. [Google Scholar] [CrossRef]
- Simmons, G. Marketing to postmodern consumers: Introducing the internet chameleon. Eur. J. Mark. 2008, 42, 299–310. [Google Scholar] [CrossRef]
- Ding, C.G.; Tseng, T.H. On the relationships among brand experience, hedonic emotions, and brand equity. Eur. J. Mark. 2015, 49, 994–1015. [Google Scholar] [CrossRef]
- Simpson, B.J.K.; Radford, S.K. Situational variables and sustainability in multi-attribute decision-making. Eur. J. Mark. 2014, 48, 1046–1069. [Google Scholar] [CrossRef]
- Wittstruck, D.; Teuteberg, F. Understanding the Success Factors of Sustainable Supply Chain Management: Empirical Evidence from the Electrics and Electronics Industry. Corp. Soc. Responsib. Environ. Manag. 2012, 19, 141–158. [Google Scholar] [CrossRef]
- Chopra, S.; Wu, P.J. Eco-activities and operating performance in the computer and electronics industry. Eur. J. Oper. Res. 2016, 248, 971–981. [Google Scholar] [CrossRef]
- Hur, W.M.; Kim, H.; Woo, J. How CSR Leads to Corporate Brand Equity: Mediating Mechanisms of Corporate Brand Credibility and Reputation. J. Bus. Ethics 2014, 125, 75–86. [Google Scholar] [CrossRef]
- Kang, J.; Hustvedt, G. Building Trust between Consumers and Corporations: The Role of Consumer Perceptions of Transparency and Social Responsibility. J. Bus. Ethics 2014, 125, 253–265. [Google Scholar] [CrossRef]
- Aaker, D.A. Building Strong Brands; The Free Press: New York, NY, USA, 1996. [Google Scholar]
- Stern, P. Toward a coherent theory of environmentally significant behavior. J. Soc. Issues 2000, 56, 407–424. [Google Scholar] [CrossRef]
- Noppers, E.H.; Keizer, K.; Bolderdijk, J.W.; Steg, L. The adoption of sustainable innovations: Driven by symbolic and environmental motives. Glob. Environ. Chang. 2014, 25, 52–62. [Google Scholar] [CrossRef]
- Spaargaren, G.; Mol, A.P.J. Greening global consumption: Redefining politics and authority. Glob. Environ. Chang. 2008, 18, 350–359. [Google Scholar] [CrossRef]
- Spaargaren, G.; Oosterveer, P. Citizen-Consumers as Agents of Change in Globalizing Modernity: The Case of Sustainable Consumption. Sustainability 2010, 2, 1887–1908. [Google Scholar] [CrossRef]
- Kaplan, A. 2011: Year of the Citizen Consumer. Available online: http://www.huffingtonpost.com/auren-kaplan/2011-year-of-the-citizen-_b_779606.html (accessed on 28 June 2017).
- Wang, J.; Wu, L. The impact of emotions on the intention of sustainable consumption choices: Evidence from a big city in an emerging country. J. Clean. Prod. 2016, 126, 325–336. [Google Scholar] [CrossRef]
- Steg, L.; Perlaviciute, G.; Van der Werff, E.; Lurvink, J. The Significance of Hedonic Values for Environmentally Relevant Attitudes, Preferences, and Actions. Environ. Behav. 2014, 46, 163–192. [Google Scholar] [CrossRef]
- Shobeiri, S.; Rajaobelina, L.; Durif, F.; Boivin, C. Experiential motivations of socially responsible consumption. Int. J. Mark. Res. 2016, 58, 119–139. [Google Scholar] [CrossRef]
- Schmitt, B. Experiential Marketing. J. Mark. Manag. 1999, 15, 53–67. [Google Scholar] [CrossRef]
- Raub, W.; Buskens, V.; Van Assen, M. Micro-Macro Links and Microfoundations in Sociology. J. Math. Sociol. 2011, 35, 1–25. [Google Scholar] [CrossRef]
- Keller, M.; Halkier, B.; Wilska, T.A. Policy and Governance for Sustainable Consumption at the Crossroads of Theories and Concepts. Environ. Policy Gov. 2016, 26, 75–88. [Google Scholar] [CrossRef]
- Liedtke, C.; Buhl, J.; Ameli, N. Microfoundations for Sustainable Growth with Eco-Intelligent Product Service-Arrangements. Sustainability 2013, 5, 1141–1160. [Google Scholar] [CrossRef]
- Abell, P.; Felin, T.; Foss, N. Building micro-foundations for the routines, capabilities, and performance links. Manag. Decis. Econ. 2008, 29, 489–502. [Google Scholar] [CrossRef]
- Hahn, T.; Aragon-Correa, J.A. Toward Cognitive Plurality on Corporate Sustainability in Organizations: The Role of Organizational Factors. Organ. Environ. 2015, 28, 255–263. [Google Scholar] [CrossRef]
- Scott, W.R. Approaching adulthood: The maturing of institutional theory. Theor. Soc. 2008, 37, 427–442. [Google Scholar] [CrossRef]
- Vallet, F.; Eynard, B.; Millet, D.; Mahut, S.G.; Tyl, B.; Bertoluci, G. Using eco-design tools: An overview of experts’ practices. Des. Stud. 2013, 34, 345–377. [Google Scholar] [CrossRef]
- Hartmann, P.; Apaolaza-Ibanez, V. Consumer attitude and purchase intention toward green energy brands: The roles of psychological benefits and environmental concern. J. Bus. Res. 2012, 65, 1254–1263. [Google Scholar] [CrossRef]
- Yankelovich, D.; Meer, D. Rediscovering market segmentation. Harv. Bus. Rev. 2006, 84, 122–131. [Google Scholar] [PubMed]
- Keller, K.L. Conceptualizing, Measuring, and Managing Customer-Based Brand Equity. J. Mark. 1993, 57, 1–22. [Google Scholar] [CrossRef]
- Aaker, J.; Fournier, S.; Kardes, F.; Sujan, M. Brand as a character, a partner and a person: Three perspectives on the question of brand personality. Adv. Consum. Res. 1995, 22, 391–395. [Google Scholar]
- Stokburger-Sauer, N.; Ratneshwar, S.; Sen, S. Drivers of consumer-brand identification. Int. J. Res. Mark. 2012, 29, 406–418. [Google Scholar] [CrossRef]
- Whitmarsh, L.; O’Neill, S. Green identity, green living? The role of pro-environmental self-identity in determining consistency across diverse pro-environmental behaviours. J. Environ. Psychol. 2010, 30, 305–314. [Google Scholar] [CrossRef]
- Saari, U.A.; Mäkinen, S.J. Measuring brand experiences cross-nationally. J. Brand Manag. 2017, 24, 86–104. [Google Scholar] [CrossRef]
- Steenkamp, J.; Baumgartner, H. Assessing measurement invariance in cross-national consumer research. J. Consum. Res. 1998, 25, 78–90. [Google Scholar] [CrossRef]
- Jafari, A.; Firat, F.; Suerdem, A.; Askegaard, S.; Dalli, D. Non-western contexts: The invisible half. Mark. Theor. 2012, 12, 3–12. [Google Scholar] [CrossRef]
- Askegaard, S.; Linnet, J. Towards an epistemology of consumer culture theory: Phenomenology and the context of context. Mark. Theor. 2011, 11, 381–404. [Google Scholar] [CrossRef]
- IMF. World Economic Outlook. April 2013. Available online: http://www.imf.org/external/pubs/ft/weo/2013/01/pdf/text.pdf (accessed on 23 September 2013).
- IMF. World Economic Outlook. April 2016. Available online: http://www.imf.org/external/pubs/ft/weo/2016/01/pdf/text.pdf (accessed on 23 May 2016).
- Walsh, G.; Northington, W.M.; Hille, P.; Dose, D. Service employees’ willingness to report complaints scale: Cross-country application and replication. J. Bus. Res. 2015, 68, 500–506. [Google Scholar] [CrossRef]
- Evanschitzky, H.; Baumgarth, C.; Hubbard, R.; Armstrong, J. Replication research’s disturbing trend. J. Bus. Res. 2007, 60, 411–415. [Google Scholar] [CrossRef]
- Churchill, G.A. Paradigm for Developing Better Measures of Marketing Constructs. J. Mark. Res. 1979, 16, 64–73. [Google Scholar] [CrossRef]
- Nunnally, J.C.; Bernstein, I.H. Psychometric Theory, 3rd ed.; McGraw-Hill, Inc.: New York, NY, USA, 1994. [Google Scholar]
- Mowen, J.C.; Voss, K.E. On Building Better Construct Measures: Implications of a General Hierarchical Model. Psychol. Mark. 2008, 25, 485–505. [Google Scholar] [CrossRef]
- Cook, D.A.; Beckman, T.J. Current concepts in validity and reliability for psychometric instruments: Theory and application. Am. J. Med. 2006, 119. [Google Scholar] [CrossRef] [PubMed]
- Peter, J.P. Construct Validity: A review of basic issues and marketing practices. J. Mark. Res. 1981, 18, 133–145. [Google Scholar] [CrossRef]
- Ketokivi, M. Tilastollinen Päättely Ja Tieteellinen Argumentointi; Gaudeamus Helsinki University Press: Helsinki, Finland, 2009; p. 251. [Google Scholar]
- Hair, J.F.; Black, W.C.; Babin, B.J.; Anderson, R.E. Multivariate Data Analysis: A Global Perspective, 7th ed.; Pearson: Upper Saddle River, NJ, USA, 2010. [Google Scholar]
- Johnson, T.; Kulesa, P.; Cho, Y.I.; Shavitt, S. The relation between culture and response styles: Evidence from 19 countries. J. Cross-Cult. Psychol. 2005, 36, 264–277. [Google Scholar] [CrossRef]
- Diamantopoulos, A.; Reynolds, N.L.; Simintiras, A.C. The impact of response styles on the stability of cross-national comparisons. J. Bus. Res. 2006, 59, 925–935. [Google Scholar] [CrossRef]
- Bentler, P.M. SEM with simplicity and accuracy. J. Consum. Psychol. 2010, 20, 215–220. [Google Scholar] [CrossRef] [PubMed]
- Nishimura, R.; Wagner, J.; Elliott, M. Alternative Indicators for the Risk of Non-response Bias: A Simulation Study. Int. Stat. Rev. 2016, 84, 43–62. [Google Scholar] [CrossRef] [PubMed]
- International Data Corporation. Smartphone OS Market Share, Q3 2013. Available online: http://www.idc.com/prodserv/smartphone-os-market-share.jsp (accessed on 1 September 2013).
- Keller, K. Brand synthesis: The multidimensionality of brand knowledge. J. Consum. Res. 2003, 29, 595–600. [Google Scholar] [CrossRef]
- Nielsen. 27 Million Smartphone Users in Urban India. Available online: http://www.nielsen.com/in/en/press-room/2012/smartphone-incidence.html (accessed on 1 September 2012).
- Census Organization of India, 2011. City Census 2011 in India. Available online: http://www.census2011.co.in/city.php (accessed on 27 September 2013).
- Official Statistics of Finland. Consumer Barometer: Landline and Mobile Phones in Households. Available online: http://www.stat.fi/til/kbar/2013/09/kbar_2013_09_2013-09-27_kuv_016_fi.html (accessed on 27 September 2013).
- Official Statistics of Finland. Population by Age, Year and Sex in 2012. Available online: http://pxweb2.stat.fi/database/StatFin/databasetree_en.asp (accessed on 1 September 2012).
- Iacobucci, D. Structural equations modeling: Fit Indices, sample size, and advanced topics. J. Consum. Psychol. 2010, 20, 90–98. [Google Scholar] [CrossRef]
- Ansolabehere, S.; Schaffner, B.F. Does Survey Mode Still Matter? Findings from a 2010 Multi-Mode Comparison. Political Anal. 2014, 22, 285–303. [Google Scholar] [CrossRef]
- Riefler, P. Why consumers do (not) like global brands: The role of globalization attitude, GCO and global brand origin. Int. J. Res. Mark. 2012, 29, 25–34. [Google Scholar] [CrossRef]
- Cohen, J. Statistical Power Analysis for the Behavioral Sciences, 2nd ed.; Lawrence Earlbaum Associates: Hillsdale, NJ, USA, 1988. [Google Scholar]
- Baumgartner, H.; Steenkamp, J. Response styles in marketing research: A cross-national investigation. J. Mark. Res. 2001, 38, 143–156. [Google Scholar] [CrossRef]
- Janssens, W.; Wijnen, K.; de Pelsmacker, P.; Van Kenhove, P. Marketing Research with SPSS; Pearson Education Limited: Essex, UK, 2008; p. 441. [Google Scholar]
- Bagozzi, R.; Yi, Y. Specification, evaluation, and interpretation of structural equation models. J. Acad. Mark. Sci. 2012, 40, 8–34. [Google Scholar] [CrossRef]
- Hofstede, G.; McCrae, R.R. Personality and culture revisited: Linking traits and dimensions of culture. Cross-Cult. Res. 2004, 38, 52–88. [Google Scholar] [CrossRef]
- Hofstede, G.; Hofstede, G.J. Cultures and Organizations: Software of the Mind, 2nd ed.; McGraw-Hill: London, UK, 2005. [Google Scholar]
- Hofstede, G. Cultural Dimensions: India in Comparison with Finland. Available online: https://geert-hofstede.com/india.html (accessed on 1 November 2016).
- Stanton, J.M.; Sinar, E.F.; Balzer, W.K.; Smith, P.C. Issues and strategies for reducing the length of self-report scales. Pers. Psychol. 2002, 55, 167–194. [Google Scholar] [CrossRef]
- Barnette, J.J. Effects of Stem and Likert Response Option Reversals on Survey Internal Consistency: If you feel the need, there is a better alternative to using those negatively worded stems. Educ. Psychol. Meas. 2000, 60, 361–370. [Google Scholar] [CrossRef]
- Dodeen, H. The Effects of Positively and Negatively Worded Items on the Factor Structure of the UCLA Loneliness Scale. J. Psychoeduc. Assess. 2015, 33, 259–267. [Google Scholar] [CrossRef]
- Nenkov, G.Y.; Morrin, M.; Ward, A.; Schwartz, B.; Hulland, J. A short form of the Maximization Scale: Factor structure, reliability and validity studies. Judgm. Decis. Mak. 2008, 3, 371–381. [Google Scholar]
- Jantzen, C.; Fitchett, J.; Ostergaard, P.; Vetner, M. Just for fun? The emotional regime of experiential consumption. Mark. Theor. 2012, 12, 137–154. [Google Scholar] [CrossRef]
- Schmitt, B. The consumer psychology of brands. J. Consum. Psychol. 2012, 22, 7–17. [Google Scholar] [CrossRef]
- Schmitt, B.; Brakus, J.J.; Zarantonello, L. From experiential psychology to consumer experience. J. Consum. Psychol. 2015, 25, 166–171. [Google Scholar] [CrossRef]
- Pekovic, S.; Rolland, S. Customer orientation and firm’s business performance: A moderated mediation model of environmental customer innovation and contextual factors. Eur. J. Mark. 2016, 50, 2162–2191. [Google Scholar] [CrossRef]
- Green, K.; Morton, B.; New, S. Greening organizations: Purchasing, consumption, and innovation. Organ. Environ. 2000, 13, 206–225. [Google Scholar] [CrossRef]
- Corsini, F.; Rizzi, F.; Frey, M. Extended producer responsibility: The impact of organizational dimensions on WEEE collection from households. Waste Manag. 2017, 59, 23–29. [Google Scholar] [CrossRef] [PubMed]
- Seeberger, J.; Lister, J. E-Waste Management in the United States and Public Health Implications. J. Environ. Health 2016, 79, 8–16. [Google Scholar]


© 2017 by the authors. Licensee MDPI, Basel, Switzerland. This article is an open access article distributed under the terms and conditions of the Creative Commons Attribution (CC BY) license (http://creativecommons.org/licenses/by/4.0/).