Abstract
Geostationary satellite remote sensing systems are a useful tool for forest fire detection and monitoring because of their high temporal resolution over large areas. In this study, we propose a combined 3-step forest fire detection algorithm (i.e., thresholding, machine learning-based modeling, and post processing) using Himawari-8 geostationary satellite data over South Korea. This threshold-based algorithm filtered the forest fire candidate pixels using adaptive threshold values considering the diurnal cycle and seasonality of forest fires while allowing a high rate of false alarms. The random forest (RF) machine learning model then effectively removed the false alarms from the results of the threshold-based algorithm (overall accuracy ~99.16%, probability of detection (POD) ~93.08%, probability of false detection (POFD) ~0.07%, and 96% reduction of the false alarmed pixels for validation), and the remaining false alarms were removed through post-processing using the forest map. The proposed algorithm was compared to the two existing methods. The proposed algorithm (POD ~ 93%) successfully detected most forest fires, while the others missed many small-scale forest fires (POD ~ 50–60%). More than half of the detected forest fires were detected within 10 min, which is a promising result when the operational real-time monitoring of forest fires using more advanced geostationary satellite sensor data (i.e., with higher spatial and temporal resolutions) is used for rapid response and management of forest fires.
1. Introduction
Forest fires can have a significant impact on terrestrial ecosystems and the atmosphere, as well as on society in general. In order for a site to recover from a forest fire, a lot of time and effort are required. According to the 2015 forest standard statistics, forest areas in South Korea cover 6,335,000 ha, accounting for 63.2% of the national land. This forest-to-land ratio of South Korea is the fourth largest among the Organization for Economic Co-operation and Development (OECD) countries [1]. Since forests in South Korea are densely distributed, a forest fire can easily spread outwards, resulting in huge amounts of damage. The forest growing stock of South Korea is 146 m3/ha, which is higher than the average of OECD countries (131 m3/ha) [1]. Approximately 36.9% of forest in South Korea are coniferous, and their growing stock reaches 172.7 m3/ha. Since coniferous forests have a large amount of branches and leaves, those under the canopy dry easily. Thus, when a forest fire occurs, it can easily develop into a large one if early extinguishment fails, resulting in huge amounts of damage [2]. In 2017 in South Korea, the total area damaged by forest fires was 1,480 ha with the amount of damage totaling 80,150,000,000 KRW (71,594,462 USD), while the number of casualties was 16 [3]. Most forest fires that occur in South Korea are caused by anthropogenic factors and are thus unpredictable and hard to control. To minimize forest fire damage, South Korea has been conducting forest fire monitoring through tower systems and closed-circuit television (CCTV) [2]. An alternative to such field monitoring is satellite-based monitoring, which can cover vast areas including inaccessible regions with fine temporal resolution [4]. Satellite data have been widely used in forest fire management, such as pre-fire condition management, forest fire hot spot detection, smoke detection, and burn severity mapping [5]. Various satellite sensors have been used for forest fire detection, such as polar-orbiting satellite sensors (Moderate Resolution Imaging Spectroradiometer (MODIS), Advanced Very High Resolution Radiometer (AVHRR), the Landsat series, and the Visible Infrared Imaging Radiometer Suite (VIIRS)), and geostationary satellite sensor systems (Geostationary Operational Environmental Satellite (GOES), Spinning Enhanced Visible and Infrared Imager (SEVIRI), Communication, Ocean and Meteorological Satellite (COMS), and Himawari-8).
Fires are typically detected through their high surface temperature, which is easily distinguishable in mid-infrared and thermal remote sensing data [5]. One of the most widely used methods for detecting forest fires is a simple threshold-based algorithm, which distinguishes fire pixels based on given empirical threshold values applied to band radiance, brightness temperature (BT), or the band ratio of specific wavelengths. However, this method produces a relatively high number of false alarms and often misses fires because of the varied characteristics of forests, topography, and climate between different regions [4]. Contextual algorithms, which were developed from the threshold-based algorithm, use local maxima and other multispectral criteria based on the difference between fire pixels and the background temperature [6,7,8,9,10,11,12,13,14,15]. Furthermore, the modeling of the fire pixel diurnal temperature cycle (DTC), which shows a diurnal variation of the brightness temperature of the pixel, has been also used [16,17,18,19]. Other ways to detect forest fires include using artificial neural networks (ANN)-based modeling [20] and hierarchical object-based image analysis (OBIA), which classifies active fire pixels using a ruleset based on image-specific object values [21]. Most existing forest fire detection and monitoring algorithms along with their related products have been developed and tested over Europe and the US. For example, MODIS active fire data is one of the most widely used products for fire management in many countries [4]. However, these algorithms often produce a very high false alarm rate in East Asia including South Korea. Collection 5 MODIS fire products struggle to detect small fires because of the overly high global thresholds of regions such as East Asia. Although the Collection 6 MODIS fire products slightly increased the probability of detection (POD) ~1% [9], it is still not enough to detect small forest fires in South Korea. When we calculated the accuracy of the Collection 6 MODIS active fire products (M*D14) in South Korea from March to May (i.e., dry season) in 2017 (Appendix A), only 22 of the 145 forest fires were detected (POD ~ 15.2%). In addition, 266 forest fires were falsely alarmed among the 288 MODIS-detected forest fires (false alarm rate (FAR) ~ 92.4%). Consequently, the algorithms are not good at detecting small forest fires, which frequently occur over rugged terrain in South Korea. Thus, there is a strong need to develop a novel forest fire detection and monitoring algorithm suitable for South Korea.
Several studies have been conducted to develop forest fire detection algorithms focusing on fires in South Korea. [22] developed an algorithm for detecting missed sub-pixel scale forest fires in MODIS active fire data using a spectral mixed analysis. While it showed a POD ~ 70% and a FAR ~ 40%, it was only tested with data in April for 2004 and 2005. [2] developed a forest fire detection model for South Korea using the COMS Meteorological Imager (MI) data, which modifies the MODIS algorithm [8] based on the spectral characteristics of MI. This algorithm was able to detect small-scale forest fires with damaged areas ~1 ha at 15-min intervals, but resulted in a relatively high mis-detection rate. Another forest fire detection method has been proposed, which is based on the negative relationship between vegetation density and land surface temperature with a contextual approach using MODIS [23]. This method improves the previous MODIS contextual forest fire detection algorithm, but still has a low temporal resolution.
In this study, we used Himawari-8 geostationary satellite data to detect and monitor forest fires in South Korea. It is suitable for continuous forest fire monitoring and early detection because of its high temporal resolution (<= 10 min), even though its spatial resolution is not as good as polar-orbiting satellite sensor systems. Early detection and monitoring of forest fires are crucial to reduce damage and save human lives and property. Recently, some researchers have used Himawari-8 to detect forest fires over Asia and Australia using its multiple spectral bands and high temporal resolution [10,13,15,19]. These studies were based on contextual algorithms targeting large forest fires in East Asia and Australia, which were not evaluated for detecting small fires in South Korea.
There is no official definition for small-scale forest fires in South Korea. In this study, we defined small-scale forest fires considering the damaged areas and the spatial resolution of input Himawari-8 satellite data (4 km2 = 400 ha). Forest fires damaging areas measuring less than 8 ha (2% of the Himawari-8 pixel size) were defined as ‘small-scale’ in this study. It should be noted that the real-time detection of such small forest fires (<8 ha) using Himawari-8 data is possible because of the spread of fire-induced heat and gaseous materials to the much larger surrounding area of a fire than the damaging area recorded by the expert after the fire. Although small-scale forest fires are dominant in South Korea, they often have a significant effect on people, infrastructure, and the environment. Since the population density of South Korea is very high and many fires occur near farmhouses and roads, even small-scale forest fires can result in costly damages. Thus, the detection and monitoring of small-scale forest fires is crucial in South Korea. For example, on 19 April 2018, a small forest fire (the damaged area ~3 ha) that occurred in Yangyang, Gangwon-do, required not only 387 firefighters and 41 units of equipment to be mobilized, but also 9 evacuation helicopters to be dispatched to the scene to extinguish and monitor the forest fire [24].
The forest fire detection algorithm proposed in this study consists of three steps: a threshold-based algorithm, machine learning modeling, and post processing. First, we developed a threshold-based algorithm optimized for detecting small forest fires in South Korea with the tradeoff of a relatively high false alarm rate from Himawari-8 data. The proposed threshold-based algorithm adopted a thresholding approach adaptive to corresponding satellite imagery to detect small-scale forest fires considering the diurnal cycle and seasonality. Then, machine learning and post processing approaches were applied to the potential fire pixels to effectively reduce false alarms. Existing threshold-based forest fire detection algorithms often miss small forest fires, resulting in too many false alarms due to the fixed thresholds. Our proposed approach is focused on increasing the detection of small-scale forest fires and significantly reducing false alarms.
The objectives of this study were to (1) develop a machine learning-combined approach for detecting small to large-scale forest fires in South Korea, (2) examine the feasibility of early detection of forest fires based on the approach, and (3) monitor forest fires using Himawari-8 satellite data at high temporal resolution. This study can provide a basis for the geostationary satellite-based operational monitoring of forest fires in South Korea.
2. Data
2.1. Study Area
South Korea has an area of 10,030,000 ha, with forests covering 6,335,000 ha (about 63.2% of the total area) [1,25]. South Korea has suffered forest fires every year especially during the spring and fall seasons because of the large number of visitors to forests in May and October and the high frequency of agricultural incinerations in Spring [3,26]. It belongs to the mid-latitude cold temperate region and has a continental climate. When compared to other regions with similar latitudes, the range of annual temperature is large. The average lowest monthly temperature is −6 to 3 °C, the average highest temperature is 23 to 26 °C, and the annual average rainfall is 1000–1900 mm [27]. Approximately 200–800 forest fires have occurred annually in South Korea and many of them were small-scale fires. For example, 94% of the areas damaged by forest fires in 2017 were smaller than 1 ha [3]. Over the last 10 years, more than 60% of forest fires have occurred in the spring season (March to May). More than 80% of the forest fires that occurred in 2017 were caused by humans, for reasons including the carelessness of hikers, and agricultural and waste incineration [3]. The study period is from July 2015 to December 2017 when Himawari-8 satellite data are available.
2.2. Forest Fire Reference Data
In situ forest fire occurrence data provided by the Korea Forest Service were used as reference data in this study (Appendix B). Each forest fire case contains information about the starting and extinguishing date/time, location (specific address), damaged area, and cause. When a forest fire occurs in a region, the public officials in charge of the region confirm and report the fire in detail. Damaged areas are calculated by trained forest fire experts based on visual observations, actual measurements using Global Positioning System (GPS) survey equipment, aerial photographs, and/or topographic maps with a scale of 1:25,000 [28]. Small forest fires damaging less than 0.7 ha of land were not considered in this study because most of them did not show little spectral difference in the Himawari-8 time-series data based on visual inspection of the images. It should be noted, though that pixel radiance is affected by not only a fire, but also many other factors. Among the 114 forest fires that resulted in damaged areas of over 0.7 ha during the study period, 64 cases that were clearly distinguishable from the satellite data without being blocked by clouds were selected as reference data, resulting in 2165 fire pixels and 18,085 non-fire pixels between 2015 and 2017. Note that the non-fire pixels were randomly extracted from the forested areas from the images after excluding fire and cloud pixels.
2.3. Himawari-8 AHI Satellite Data
Himawari-8, launched in October 2014, is the geostationary satellite sensor system operated by the Japan Meteorological Agency (JMA), the latest line of Multifunctional Transport Satellite (MTSAT) series. The Advanced Himawari Imager (AHI) sensor onboard Himawari-8 collects data every 10 min as full disk images in 16 bands from visible to infrared wavelengths at a 500 m–2 km resolution, covering from East Asia to Australia. From a monitoring perspective, geostationary satellite data with a very high temporal resolution may be a better option than polar-orbiting satellite data even though its spatial resolution is typically not as good. Table 1 and Table 2 summarize Himawari-8 derived input variables used in the threshold-based algorithm and machine learning modeling, respectively.

Table 1.
Himawari-8 AHI-derived input variables used in the threshold-based algorithm.
Table 2.
Himawari-8 AHI bands and variables used in machine learning modeling in this study (Ch is the radiance of each band and BT is the brightness temperature of each band).
2.4. Land Cover Data and Forest Map
Land cover data obtained from the Ministry of Environment of South Korea was used to identify forest areas (Figure 1). The land cover data were produced using Landsat TM images collected in 2010 and the overall accuracy is reported as 75% [29]. It has 7 classes—built-up, agricultural land, forest, grassland, wetland, barren land and water—at 30 m resolution. The land cover map was upscaled to 2 km corresponding to the spatial resolution of the input AHI data using a majority filtering. Considering many forest fires occurred along roads or agricultural land in the boundaries of forests, one pixel (2 km)-buffered areas from the forest pixels were used as the forest mask.
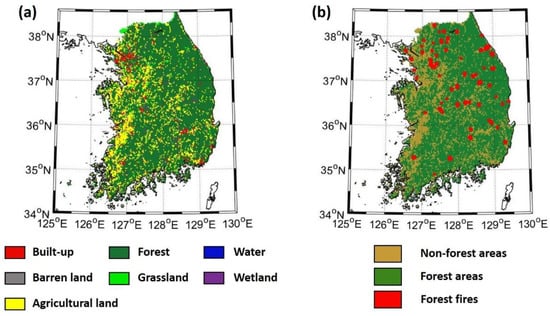
Figure 1.
The study area of this research (South Korea) and (a) land cover map from the Ministry of Environment of South Korea and (b) forest region map with forest fires occurred during the study period.
3. Methodology
3.1. Forest Fire Detection Aalgorithm
The forest fire detection model proposed in this study consists of 3 steps. Figure 2 shows the process flow diagram of the proposed approach. The first step is to identify the candidate pixels of forest fires using infrared bands based on a threshold-based algorithm. The proposed threshold-based algorithm uses multi-temporal analysis to consider the stationary heat sources and varied thermal signals from the surface due to the diurnal cycle of forest fires. This first step tries to focus on identifying potential fire pixels, regardless of a high false alarm rate. The following machine learning and post-processing approaches, then, try to reduce false alarms effectively from the results of the first step.
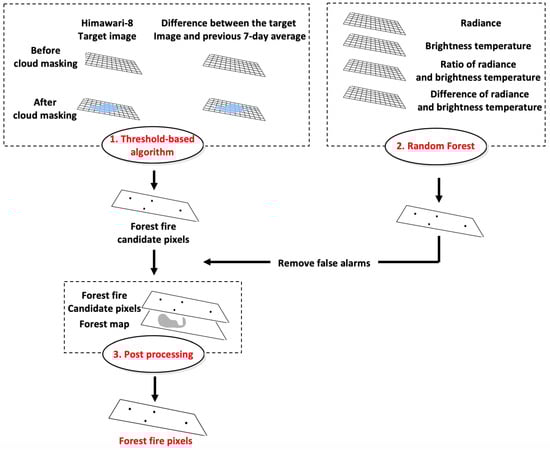
Figure 2.
The process flow of detecting forest fire pixels based on the threshold-based algorithm, machine learning, and post-processing approaches.
3.2. Threshold-Based Algorithm
To increase the probability of detection of small-scale forest fires, the threshold-based algorithm of this study modified the existing threshold-based forest fire detection algorithms, which used 4 and 11 µm bands [9,13], considering the characteristics of forest fires in South Korea. Since average temperatures of active fires range from 800 K to 1200 K, the fires are detectable in the mid-infrared and thermal bands with high intensities [5]. Himawari-8 AHI band 5 (1.61 µm), 7 (3.85 µm) and 14 (11.2 µm) data were used in the threshold-based algorithm in this study (Table 1).
Figure 3 summarizes the proposed threshold-based algorithm with multiple AHI channels and their time series. In the first condition of the threshold-based algorithm, the band 7 radiance was used to distinguish forest fire candidate pixels. The MIR band (i.e., band 7) is effective in observing radiative emissions from objects radiating at temperatures similar to those of forest fires [13]. Thus, it has been used in most existing fire detection algorithms [10,11,13,15,30]. Many factors such as land cover type, topographic characteristics, time of day, and day of the year affect the threshold [4]. Unlike with existing algorithms, the threshold in the proposed algorithm was not fixed to better identify small-scale forest fires. Instead, the top 7% value in the forest region buffered by one-pixel in South Korea for each image was assigned as an adaptive threshold through multiple empirical tests. In order to identify heat sources other than forest fires, a multi-temporal component was considered in the threshold-based algorithm. The multi-temporal component uses the difference between the radiance of the target image and the averaged radiance for 7 days before the target image. In this way, it can effectively remove stationary heat sources (e.g., industrial facilities), radiometrically bright objects (e.g., hot and reflective rooftops such as solar cells on the roof) and other unique structures such as solar farms, which can be classified as potential forest fire pixels. The other step in the threshold-based algorithm is cloud masking. The cloud pixels usually have a negative effect on the multi-temporal analysis and are classified as forest fires, because clouds have high albedo or reflectance in visible and near infrared bands [15]. As Himawari-8 has not provided a publicly available cloud mask product yet, cloud pixels were defined by the cloud masking algorithm developed by [31]. When the operational Himawari-8 cloud mask product is available in the future, the proposed algorithm will be able to use the product to more effectively remove clouds from images.
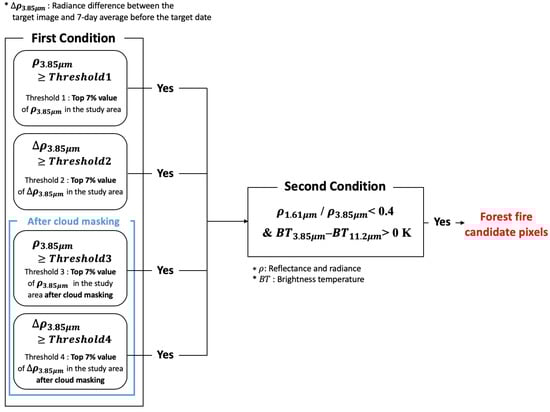
Figure 3.
The threshold-based algorithm proposed in this study.
Secondly, the pixels which were classified as potential forest fire pixels in the first condition were checked against another series of empirically selected parameters and thresholds that reflect forest fire characteristics (Figure 3). Shortwave infrared (1.58–1.64 µm) bands are used in cloud, sun glint and water distinction in the existing fire detection algorithms [11]. The ratio of band 5 reflectance to band 7 radiance was the most distinct parameter among several ratios and differences of bands based on the reference data (forest fire vs. non-forest fire pixels). An optimum threshold for the ratio was determined through empirical testing of multiple thresholds. Another parameter is the difference between BTs of bands 7 and 14. The large difference between the BTs in the shortwave (3–4 µm) and longwave (~11 µm) bands is related to fires [32]. Thus, it has been widely used in other fire detection algorithms [9,15,33,34]. The threshold value of this parameter was also defined by empirical tests using the reference data.
3.3. Random Forest
RF is widely used in various remote sensing applications for both classification and regression [35,36,37,38,39]. RF is based on Classification and Regression Tree (CART) methodology [40], which is a rule-based decision tree. RF adopts two randomization strategies to produce many independent CARTs: a random selection of training samples for each tree, and a random selection of input variables at each node of a tree [41,42,43]. Final output from RF is achieved through an ensemble of individual CARTs. This ensemble approach can mitigate overfitting and the sensitivity to training data configurations, which are major limitations of CART [44,45,46]. Using many independent decision trees, RF makes a final decision by (weighted) averaging and majority voting approaches for regression and classification, respectively. RF also provides useful information on the contribution of input variables to the model, which is based on relative variable importance using out-of-bag (OOB) data [47,48,49]. OOB errors are the differences between the actual value and the decision value that is estimated using data not used in training.
In this study, the 64 forest fire reference cases between 2015 and 2017 (2165 fire pixels and 18,085 non-fire pixels) were divided into two groups considering their damaged area, time and location: 50 fire cases (80%; 1775 fire pixels and 15,043 non-fire pixels) to develop an RF model and the remaining 14 cases (20%; 390 fire pixels and 3042 non-fire pixels) to validate the model.
First, a total of 191 input variables—band radiance, BT, band ratios, BT differences and BT ratios of bands 4–16—(Appendix C) were used as the input parameters of the RF model. We used a simple feature selection based on the relative variable importance provided by RF through iterative testing with different sets of input variables. Finally, 26 parameters were selected (Table 2), which were used to develop the RF model for effectively removing false alarms of forest fire detection.
3.4. Post Processing
In order to further refine forest fire detection results, additional post processing was applied. The post processing was designed to effectively remove salt-and-pepper noise and fires from non-forest areas. We applied a buffer to the forest boundary to effectively detect almost all forest fires that occurred near roads or areas between agricultural land and forests (Section 2.4), but the buffered area inevitably contains non-forest regions which results in salt-and-pepper noise (mostly fires from agricultural land or hot spots in urban areas). We used the forest map (refer to the Ministry of Environment of South Korea) in the post processing. If more than three out of the eight surrounding pixels of a pixel classified as forest fire by the RF model were forest, they were then considered to be forest fire pixels. Otherwise, the pixels were removed as non-forest area fires (e.g., agricultural fires).
3.5. Accuracy Assessment
The performance of the proposed approach was evaluated using the probability of detection (POD; ), the probability of false detection (POFD; ) and the overall accuracy (OA; ).
The accuracy of the proposed algorithm was further compared to those of the two existing forest fire detection algorithms and the Collection 6 MODIS fire products (M*D14; [9]). One is the COMS algorithm, which was proposed by [2]. The COMS algorithm is threshold-based, and is based on the MODIS wildfire detection algorithm using COMS MI sensor data. It classified the forest fire candidate pixels by the two thresholds and surrounding statistical values using the 3.7 and 10.8 µm wavelength bands of COMS MI. The other algorithm is an AHI Fire Surveillance Algorithm (AHI-FSA), which was developed by [13]. The AHI-FSA algorithm is based on three different wavelengths (RED-band 3; NIR-band 4; MIR-band 7) of Himawari-8 AHI sensor to detect burnt areas and smoke.
4. Results and Discussion
4.1. Forest Fire Detectioin
The forest fire detection algorithm was evaluated using 14 reference forest fire cases among a total of 64 reference cases (Section 2.2). More than 90% of the forest fires (i.e., 46 out of 50 in calibration cases, and 14 out of 14 in validation cases) were detected by the threshold-based algorithm, and an additional 5 forest fires were detected which were not included in the reference data due to their small damage areas. Although the threshold-based algorithm detected most forest fires, it resulted in a high rate of false alarms.
The final RF model was constructed using the 26 input variables (Table 2), which were selected based on variable importance identified by RF among over 191 variables (Appendix C). When using both BT differences and ratios, the RF model produced higher accuracy (OA = 98.75%, POD = 89.74%, and POFD = 0.10%) than using either one of the sets (OA = 96.44%, POD = 70%, and POFD = 0.16% when using only BT differences; OA = 98.60%, POD = 88.97%, and POFD = 0.16% when using only BT ratios). Many of the selected input variables were related to band 7 (MIR band), which was used in the threshold-based algorithm. This corresponds to the literature in that the MIR band (i.e., band 7) is sensitive to forest fire temperature [13]. BT differences and ratios between band 7 and thermal bands were considered important variables. While the peak radiation at thermal wavelengths (8–12 µm) is related to a normal environmental temperature, hot temperature by forest fires can be detected at a shorter wavelength than the Earth’s surface, especially 3–4 µm (band 7) [5]. The large BT difference between the shortwave (3–4 µm) and thermal bands can be observed in fire pixels, and thus the BT difference has been used in other fire detection algorithms [9,15,33,34]. High radiance values of band 5 are related to near the center of fires [12], and 2.2 µm (band 6) wavelength is sensitive to hot targets [50]. The NIR (0.846–885 µm; band 4) and the shortwave infrared (1.58–1.64 µm; band 5) regions are used to discriminate cloud, sun glint and water in the fire detection algorithm [9,11]. The reflectance values of band 4 are used to remove highly reflective surface and sun glint characteristics from non-fire pixels [30]. These wavelengths (bands 4–6) are also used in existing wildfire detection algorithms [11,12,50].
Figure 4 summarizes the relative variable importance of the selected 26 input variables provided by the RF model. The difference between bands 5 and 7 was identified as the most contributing variable to the model, followed by the difference between bands 6 and 7, and that between bands 4 and 7. The BT ratios and differences between bands 13 (10.45 µm) and 15 (12.35 µm) were also identified as contributing variables. These variables are known to be effective for separating active fires from fire-free background [11,30]. The usefulness of Himawari-8 AHI sensor data for forest fire detection is largely unassessed because of the relatively young age of the sensor and the minimal existing published work [17]. Thus, it is desirable to test various variable combinations to find an optimum set of Himawari-8 derived input variables for forest fire detection.
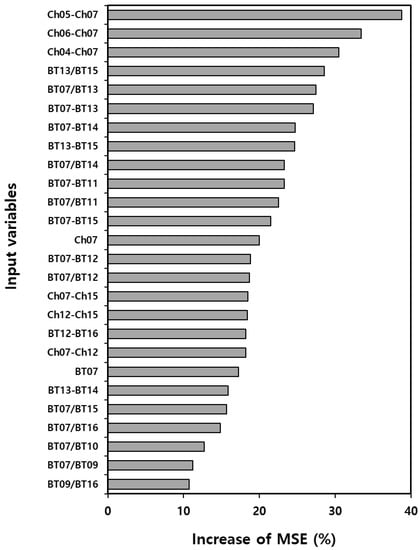
Figure 4.
Variable importance for removal of false alarms using the RF model. Increase of mean squared error (MSE) was calculated using out of bag (OOB) data. More detailed information about the increase of MSE%) is given in Section 3.3.
Table 3 shows the accuracy assessment results of the RF model using the calibration and validation data. The RF model resulted in 100% training accuracy. The validation accuracy was also high (OA = 99.16%, POD = 93.08%, and POFD = 0.07%) with 27 forest fire pixels (7% of reference forest fire pixels) being classified as non-fire pixels. From this result, one of the 14 forest fires (validation cases) detected by the threshold algorithm were removed after the RF model was combined. Figure 5 shows that the RF model effectively removed false alarms for the validation forest fire cases (Figure 5b,f) when compared to the results of the threshold-based algorithm (Figure 5a,e,i,m). However, a few false alarms (Figure 5j,n) still remained. For the validation cases, about 96% of the false alarmed pixels from the thresholding results were successfully removed by RF.
Table 3.
Accuracy assessment results of best combinations of RF based on variable importance. (OA = Overall accuracy (%); POD = Probability of detection (%)).
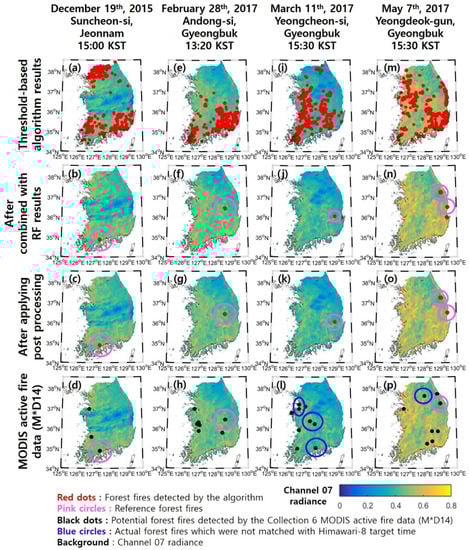
Figure 5.
The maps of detected forest fires after each step: the threshold-based algorithm (a,e,i,m), RF modeling (b,f,j,n), and post processing (c,g,k,o) and the MODIS active fire data (M*D14; d,h,l,p). (1) the forest fire (Suncheon-si, Jeonnam; from 13:13 to 16:00 (KST) on 19th October 2015) occurred by shaman rituals with the damaged area ~1 ha (a,b,c,d); (2) the forest fire (Andong-si, Gyeongbuk; from 13:10 to 15:20 (KST) on 28th February 2017) occurred due to an unknown reason with the damaged area ~ 0.8 ha (e,f,g,h); (3) forest fire (Yeongcheon-si, Gyeongbuk; from 15:13 to 18:30 (KST) on 11th March 2017) occurred due to the incineration of agricultural waste with the damaged area ~5.2 ha (i,j,k,l); and (4) the forest fire (upper; Gangneung-si, Gangwon; from 15:32 on 6th to 6:34 (KST) on 9th May 2017) occurred for an unknown reason with the damaged area ~252 ha and the forest fire (lower; Yeongdeok-gun, Gyeongbuk; from 14:45 on 7th to 7:00 (KST) on 8th May 2017) occurred due to a cigarette with the damaged area ~5.9 ha (m,n,o,p). The red dots are the potential forest fire pixels detected by the proposed algorithm, pink circles show actual forest fire cases from the reference data, black dots are the potential forest fire pixels detected by the Collection 6 MODIS active fire data, blue circles show actual forest fire cases which were not matched with Himawari-8 target time, and the band 7 radiance of Himawari-8 AHI of each image is used as a background image. These five forest fire cases of four dates come from the validation data, which were not used in training of the RF model.
Finally, after the post processing using the forest region map, 13 of the 14 forest fires (validation cases) were detected using the 3-step forest fire detection algorithm, and an additional 5 small-scale forest fires (damaged areas were 0.02–0.3 ha), which were not included in the reference data, were detected. About 64% of the remaining false alarms were further removed by incorporating the post processing with the results of the threshold-based and RF approaches. Among 50 calibration forest fire cases, two forest fires were removed when the post-processing was applied. The location of these two fire cases were very close to the dense urban areas, and thus, removed due to the coarse resolution of the AHI images. In addition, since the forest map used in this study is not 100% accurate, there might be false alarms or mis-detection of forest fires caused by using the map. Nonetheless, the post processing based on the forest map resulted in an increase in POD and a decrease in false alarms. If more accurate and higher resolution forest data can be used, the performance of the proposed approach could be further enhanced.
The final results of forest fire detection were compared to two existing algorithms (refer to Section 3.5; Table 4). Among 14 validation forest fires, 13 forest fires were detected using the proposed approach, while 7 and 8 forest fires were detected by the COMS algorithm and the AHI-FSA algorithm, respectively (Table 4). Among the 12 validation small-scale forest fires (damaged area < 8 ha), 11 forest fires were detected using the proposed 3-step algorithm, while 5 and 6 forest fires were detected by the two existing algorithms respectively. The POD of the proposed 3-step algorithm was higher than the two existing algorithms. Two of the five additional small-scale forest fires detected by the proposed approach were also detected by the AHI-FSA algorithm. However, none of them was detected by the COMS algorithm. This implies that the proposed approach works well for small-scale fires when compared to the existing algorithms. The same Himawari-8 AHI sensor was used to detect the same forest fire cases, but the algorithm proposed in this study detected the forest fires better than the AHI-FSA algorithm. The final results of the proposed 3-step algorithm were also compared to the Collection 6 MODIS fire products (Figure 5d,h,l,p). Among 14 validation data, 6 forest fires (5 small-scale forest fires) were detected by MODIS. Among 8 forest fires which were not detected by MODIS, 3 forest fires were not detected because MODIS didn’t pass at the time of forest fires. This implies that the use of geostationary satellite data has great potential in the real time monitoring of forest fires.
Table 4.
The number of detected forest fire and the detection rate of the proposed 3-step algorithm, the COMS algorithm, and the AHI-FSA algorithm.
We further applied the 3-step algorithm to the Himawari-8 data collected from January to February in 2018 (i.e., more recent than the research period used in the study), and the results were compared to the Collection 6 MODIS active fire data (Table S1). Among new 18 reference forest fires, 12 forest fires were detected using the proposed approach (the detection rate was 66.7%), while 6 forest fires were detected by the Collection 6 MODIS active fire data (the detection rate was 33.3%). Among detected 12 forest fires, 9 forest fire cases were clearly detected without false alarms. Four of the 6 undetected forest fires were detected by the threshold-based algorithm, but they were excluded when the RF model was applied. The relatively lower detection rate of the proposed model when compared to its results for the previous years can be explained by the fact that only a few training samples from January and February were used to train the model. The detection rate can increase when the RF model is improved with more training data. Please note that forest fires in other months in 2018 were not tested because Himawari-8 time-series data were not always available to the public. The proposed 3-step algorithm was also applied to the East Asia and it detected reference fires well (pink circle in Figure S1) and compared with the Collection 6 MODIS active fire data (M*D14). We got the information about the reference forest fires in China from the website of the China Forest Fire Management [51]. The first forest fire (Figure S1b,c; [52]) was detected by both 3-step algorithm (Himawari-8 target time was 17:50 (UTC)) and MODIS/Aqua active fire data (passing time was 17:55 (UTC)). The second forest fire (Figure S1d,e; [53]) was detected by 3-step algorithm (Himawari-8 target time was 18:30 (UTC)) but not by MODIS/Aqua active fire data (passing time was 18:30 (UTC)). Other forest fires detected by the 3-step algorithm and MODIS data have no reference data, and thus, their accuracy is unknown.
4.2. Monitoring of Forest Fires
Since time series data with a 10 min interval (Himawari-8 AHI sensor) were used, the lead time on how early the proposed algorithm detected fires was examined. Among the 52 forest fires detected by the proposed approach, shows the number of forest fires with respect to initial detection time, and 25 forest fires were detected within 10 min after fires occurred and 39 forest fires were detected within 30 min. The Samcheok forest fire, which is the largest forest fire from the reference data (i.e., the damaged area was 765.12 ha and the duration was longer than 3 days), and other forest fires (with a damaged area range from 0.8 to 252 ha) were detected within 10 min. This shows that detection is generally possible within a short period of time after a forest fire has broken out. The average initial detection time using the proposed approach was about 24 min (median value was 20 min). The averaged initial detection time increased due to several forest fires with detection times of more than 30 min. There was no significant correlation between the initial detection time and the starting time, location, and size of the forest fires. When we carefully examined the high resolution Google Earth images before and after the forest fires, many late-detected (with the initial detection time of longer than 30 min) forest fires had little difference between the before and after images, which implies that the forest fires occurred mostly under the canopy and did not show significant difference in remotely sensed images at the canopy level during the initial period of fires. It should be noted that Himawari-8 can scan the focus area including Japan and Korea about every 2 min, and thus, there is a greater chance of reducing the initial detection time in the future using more dense time series data.
4.3. Novelty and Limitations
This study proposed an integrated approach for the detection of small to large-scale forest fires in South Korea. The proposed algorithm detected forest fires in South Korea better than the other two existing algorithms, especially for small-scale forest fires. The proposed approach consists of three steps. In the threshold-based algorithm, as the first step, an adaptive thresholding approach was adopted for each image considering the diurnal cycle and seasonality, unlike the existing threshold-based algorithm. While the first step resulted in very high POD and false alarms, the following RF model and post processing effectively removed the false alarms (Figure 5). In particular, the post processing using the forest map and the filtering approach was very useful for South Korea, which has a complex and rugged terrain with small patches of land cover. This study showed promising results that more advanced geostationary satellite sensor systems with higher spatial (<1 km) and temporal (~few minutes) resolutions can be used to monitor even small forest fires, i.e., less than 1 ha. Since high temporal resolution geostationary satellite data are used in the proposed approach, the early detection and spreading direction of fires can be identified by the monitoring results (Figure 6), which can be used to provide appropriate information for rapid response. [54] calculated a wildfire spread rate and burned area using Himawari-8 satellite data and active fire data developed by [15]. They defined the burned area and fire center using active fire data. This method demonstrates Himawari-8 data is useful for computing the fire spread rate. The burned area mapping and fire spread rate calculation can be combined with active fire data produced by our proposed 3-step algorithm to better manage forest fires. When approximately two-minute interval images by Himawari-8 or Geo-Kompsat-2A (GK-2A) satellite sensor systems (rapid scan mode; GK2 satellite successfully launched on 5 December 2018) are available, the proposed approach can contribute to faster initial detection and monitoring of forest fires.
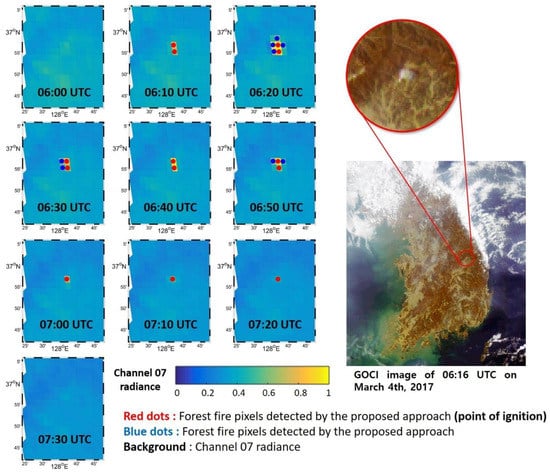
Figure 6.
Forest fire in Yeongju-si, Gyeongbuk and Geostationary Ocean Color Imager (GOCI) image on the 4th March 2017. The fire monitoring results from 6:00 to 7:20 UTC by the proposed algorithm (red and blue dots) are shown with the band 7 radiance of Himawari-8 AHI as the background.
However, there are some limitations in this study. First, clouds are always problematic when optical sensor data are used, as is the case in the proposed approach. Second, adaptive threshold values in the threshold-based algorithm might not work well for very small fires when large forest fires occur at the same time. Local tuning of the adaptive thresholding should be conducted before applying the proposed approach to different areas. Providing a certain range of the thresholds might improve the performance of forest fire detection. Third, although the RF model showed good performance in reducing false alarms, it did not detect a few forest fires. Such mis-detection by the RF model can be improved by using additional forest fire and non-forest fire samples for training because the RF model is an empirical model, and requires new training when applied to different areas. Although the locally optimized algorithm has the disadvantage of being a time-consuming process, it can produce high accuracy in the target study area. Fourth, two forest fires were not detected and were removed by the post processing because they were not included in the forest map. Considering the complex terrain and patched land cover in the small size of South Korea, a more precise forest map with a higher level of accuracy can mitigate such a problem. Finally, very small forest fires (i.e., damaged areas less than 0.7 ha) are hard to detect due to the limitation of spatial resolution of input geostationary satellite data. Higher spatial resolution (e.g., 500 m) thermal data from geostationary satellite sensor systems than Himawari-8 may further improve the detection of very small forest fires especially from an operational forest fire monitoring perspective in South Korea where small-scale forest fires frequently occur.
5. Conclusions
In this study, a combined 3-step algorithm (threshold-based algorithm, RF model, and post processing) was proposed to detect and monitor forest fires in South Korea using Himawari-8 geostationary satellite data. Existing forest fire detection algorithms using satellite data are not used in the operational monitoring system in South Korea due to the high rate of false alarms, mis-detection of small-scale forest fires, and the low temporal resolution of satellite data. This proposed 3-step algorithm using geostationary satellite data provides a basis for use in the operational forest fire monitoring system. The early detection and spreading direction of fires using high temporal resolution of geostationary satellite data enables efficient rapid response. The active fire data resulting from the 3-step algorithm can be used to calculate the size of the burned area and fire spread rates. Such information is of great help for efficient forest fire monitoring, extinguishment, and recovery management. Although the 3-step algorithm proposed in this study is locally optimized, it is necessary to effectively detect and monitor forest fires in a study area such as South Korea, where the environmental characteristics are unique in terms of land cover, topography, and climate. This algorithm can be extended to the rest of East Asia after refining all three steps (i.e., tuning adaptive threshold values, RF modeling with additional samples, and post-processing using a fine resolution forest map of East Asia).
More than half of the detected forest fires were detected within 10 min, which is a promising result when the operational real-time monitoring of forest fires using more advanced geostationary satellite sensor data is considered for the rapid response and management of forest fires. The algorithm proposed in this study can be optimized and used for the Geo-Kompsat-2 Advanced Meteorological Imager (AMI), a new geostationary meteorological satellite, which was successfully launched on 4th December 2018 by the Korean Meteorological Administration. The satellite has similar specifications to the Himawari-8 AHI sensor, and provides data every 10 min in full disk, and approximately every 2 min in the focusing area around the Korean peninsula, which can be useful for continuous forest fire detection and monitoring.
Supplementary Materials
The following are available online at http://www.mdpi.com/2072-4292/11/3/271/s1.
Author Contributions
E.J. and Y.K. equally contributed to the paper. They led manuscript writing and contributed to the data analysis and research design. J.I. supervised this study, contributed to the research design and manuscript writing, and served as the corresponding author. D.-W.L., J.Y., and S.-K.K. contributed to the discussion of the results.
Acknowledgments
This study was supported by grants from the Space Technology Development Program and the Basic Science Research Program through the National Research Foundation of Korea (NRF) funded by the Ministry of Science, ICT, & Future Planning and the Ministry of Education of Korea, respectively (NRF-2017M1A3A3A02015981; NRF-2017R1D1A1B03028129); from the National Institute of Environmental Research (NIER), funded by the Ministry of Environment (MOE) of the Republic of Korea (NIER-2017-01-02-063). This work was also supported by the Development of Geostationary Meteorological Satellite Ground Segment (NMSC-2014-01) program, funded by the National Meteorological Satellite Centre (NMSC) of the Korea Meteorological Administration (KMA).
Conflicts of Interest
The authors declare no conflict of interest.
Appendix A
List of Collection 6 MODIS fire products in South Korea from March to May in 2017.
| Date | Actual Fires | Detected Fires by MODIS | Correctly Detected by MODIS | Falsely Detected by MODIS | Miss Detected Fires |
| 2nd March | 0 | 1 | 0 | 1 | 0 |
| 4th March | 1 | 14 | 0 | 14 | 1 |
| 5th March | 0 | 4 | 0 | 4 | 0 |
| 6th March | 0 | 2 | 0 | 2 | 0 |
| 7th March | 0 | 13 | 0 | 13 | 0 |
| 8th March | 1 | 0 | 0 | 0 | 1 |
| 9th March | 2 | 6 | 1 | 5 | 1 |
| 10th March | 8 | 4 | 0 | 4 | 8 |
| 11th March | 7 | 12 | 5 | 7 | 2 |
| 12th March | 3 | 1 | 0 | 1 | 3 |
| 13th March | 2 | 7 | 0 | 7 | 2 |
| 14th March | 3 | 11 | 0 | 11 | 3 |
| 15th March | 4 | 2 | 1 | 1 | 3 |
| 16th March | 5 | 6 | 0 | 6 | 5 |
| 17th March | 4 | 4 | 0 | 4 | 4 |
| 18th March | 2 | 4 | 1 | 3 | 1 |
| 19th March | 10 | 4 | 1 | 3 | 9 |
| 21st March | 1 | 4 | 0 | 4 | 1 |
| 22nd March | 1 | 3 | 0 | 3 | 1 |
| 23rd March | 2 | 1 | 0 | 1 | 2 |
| 26th March | 1 | 0 | 0 | 0 | 1 |
| 27th March | 1 | 2 | 0 | 2 | 1 |
| 28th March | 1 | 0 | 0 | 0 | 1 |
| 29th March | 3 | 0 | 0 | 0 | 3 |
| 30th March | 3 | 7 | 0 | 7 | 3 |
| 1st April | 1 | 1 | 0 | 1 | 1 |
| 3rd April | 1 | 13 | 0 | 13 | 1 |
| 4th April | 6 | 2 | 0 | 2 | 6 |
| 5th April | 1 | 0 | 0 | 0 | 1 |
| 6th April | 0 | 1 | 0 | 1 | 0 |
| 7th April | 1 | 3 | 0 | 3 | 1 |
| 8th April | 1 | 4 | 0 | 4 | 1 |
| 9th April | 0 | 2 | 0 | 2 | 0 |
| 10th April | 3 | 3 | 0 | 3 | 3 |
| 11th April | 0 | 1 | 0 | 1 | 0 |
| 12th April | 2 | 4 | 1 | 3 | 1 |
| 13th April | 4 | 1 | 0 | 1 | 4 |
| 15th April | 1 | 2 | 0 | 2 | 1 |
| 19th April | 0 | 14 | 0 | 14 | 0 |
| 21th April | 0 | 1 | 0 | 1 | 0 |
| 22th April | 1 | 1 | 0 | 1 | 1 |
| 23th April | 3 | 2 | 0 | 2 | 3 |
| 24th April | 1 | 8 | 1 | 7 | 0 |
| 26th April | 3 | 4 | 0 | 4 | 3 |
| 27th April | 2 | 0 | 0 | 0 | 2 |
| 28th April | 3 | 16 | 1 | 15 | 2 |
| 29th April | 3 | 2 | 0 | 2 | 3 |
| 30th April | 6 | 7 | 1 | 6 | 5 |
| 1st May | 1 | 3 | 0 | 3 | 1 |
| 2nd May | 1 | 4 | 0 | 4 | 1 |
| 3rd May | 5 | 7 | 1 | 6 | 4 |
| 4th May | 1 | 0 | 0 | 0 | 1 |
| 5th May | 1 | 3 | 0 | 3 | 1 |
| 6th May | 6 | 2 | 2 | 0 | 4 |
| 7th May | 4 | 10 | 2 | 8 | 2 |
| 8th May | 3 | 2 | 0 | 2 | 3 |
| 9th May | 1 | 0 | 0 | 0 | 1 |
| 11th May | 0 | 1 | 0 | 1 | 0 |
| 14th May | 0 | 14 | 0 | 14 | 0 |
| 15th May | 0 | 1 | 0 | 1 | 0 |
| 17th May | 0 | 4 | 0 | 4 | 0 |
| 18th May | 0 | 1 | 0 | 1 | 0 |
| 19th May | 1 | 5 | 1 | 4 | 0 |
| 20th May | 1 | 2 | 1 | 1 | 0 |
| 21th May | 3 | 3 | 1 | 2 | 2 |
| 23th May | 0 | 2 | 0 | 2 | 0 |
| 24th May | 0 | 2 | 0 | 2 | 0 |
| 25th May | 1 | 1 | 0 | 1 | 1 |
| 26th May | 2 | 4 | 0 | 4 | 2 |
| 27th May | 2 | 2 | 0 | 2 | 2 |
| 28th May | 1 | 10 | 1 | 9 | 0 |
| 29th May | 1 | 0 | 0 | 0 | 1 |
| 30th May | 2 | 1 | 0 | 1 | 2 |
| Total | 145 | 288 | 22 | 266 | 123 |
Appendix B
List of forest fires used as reference data in this study provided by the Korea Forest Service.
| Location | Ignition Date | Ignition Time (UTC) | Extinguished Date | Extinguished Time (UTC) | Cause | Damaged Area (ha) |
| 64 reference forest fires | ||||||
| Yeongok-myeon, Gangneung-si, Gangwon-do | 17th October 2015 | 0:20 | 17th October 2015 | 6:00 | Unknown cause | 0.8 |
| Byeollyang-myeon, Suncheon-si, Jeollanam-do | 19th October 2015 | 4:20 | 19th October 2015 | 6:10 | Shaman rituals | 1 |
| Dong-myeon, Chuncheon-si, Gangwon-do | 4th February 2016 | 4:40 | 4th February 2016 | 6:50 | Other | 1 |
| Ucheon-myeon, Hoengseong-gun, Gangneung-si, Gangwon-do | 5th February 2016 | 7:00 | 5th February 2016 | 8:50 | Waste incineration | 0.8 |
| Buseok-myeon, Yeongju-si, Gyeongsangbuk-do | 7th February 2016 | 6:30 | 7th February 2016 | 7:20 | Agricultural Waste Incineration | 1.5 |
| Jungbu-myeon, Gwangju-si, Gyeonggi-do | 26th February 2016 | 1:00 | 26th February 2016 | 3:20 | Arson | 2.7 |
| Geumgwang-myeon, Anseong-si, Gyeonggi-do | 16th March 2016 | 6:50 | 16th March 2016 | 8:00 | Waste incineration | 2 |
| Yeongyang-eup, Yeongyang-gun, Gyeongsangbuk-do | 27th March 2016 | 7:20 | 27th March 2016 | 8:10 | Agricultural Waste Incineration | 0.7 |
| Gimhwa-eup, Cheorwon-gun, Gangwon-do | 28th March 2016 | 4:10 | 28th March 2016 | 5:40 | Climber accidental fire | 2 |
| Namdong-gu, Incheon Metropolitan City | 29th March 2016 | 21:00 | 29th March 2016 | 22:30 | The others | 1 |
| Hwado-eup, Namyangju-si, Gyeonggi-do | 30th March 2016 | 3:50 | 30th March 2016 | 6:30 | Agricultural Waste Incineration | 0.8 |
| Oeseo-myeon, Sangju-si, Gyeongsangbuk-do | 30th March 2016 | 5:50 | 31th March 2016 | 9:40 | Paddy field incineration | 92.6 |
| Sanae-myeon, Hwacheon-gun, Gangwon-do | 31th March 2016 | 4:00 | 31th March 2016 | 5:00 | The others | 1.5 |
| Jangheung-myeon, Yangju-si, Gyeonggi-do | 31th March 2016 | 5:30 | 31th March 2016 | 9:30 | The others | 8.3 |
| Nam-myeon, Yanggu-gun, Gangwon-do | 1st April 2016 | 3:50 | 1st April 2016 | 5:50 | The others | 14.4 |
| Gonjiam-eup, Gwangju-si, Gyeonggi-do | 1st April 2016 | 2:20 | 1st April 2016 | 5:30 | Paddy field incineration | 2.6 |
| Seolseong-myeon, Icheon-si, Gyeonggi-do | 1st April 2016 | 4:00 | 1st April 2016 | 6:40 | Waste incineration | 1 |
| Kim Satgat myeon, Yeongwol-gun, Gangwon-do | 2nd April 2016 | 6:30 | 2nd April 2016 | 7:50 | The others | 1 |
| Seo-myeon, Hongcheon-gun, Gangwon-do | 2nd April 2016 | 5:20 | 2nd April 2016 | 7:50 | Work place accidental fire | 3.9 |
| Gapyeong-eup, Gapyeong-gun, Gyeonggi-do | 2nd April 2016 | 6:00 | 2nd April 2016 | 9:00 | The others | 7 |
| Opo-eup, Gwangju-si, Gyeonggi-do | 2nd April 2016 | 4:20 | 3rd April 2016 | 7:50 | Ancestral tomb visitor accidental fire | 2 |
| Chowol-eup, Gwangju-si, Gyeonggi-do | 2nd April 2016 | 5:50 | 2nd April 2016 | 8:00 | The others | 1 |
| Dong-gu, Daejeon Metropolitan City | 2nd April 2016 | 6:00 | 3rd April 2016 | 8:00 | The others | 4.8 |
| Mosan-dong, Jecheon-si, Chungcheongbuk-do | 2nd April 2016 | 5:40 | 2nd April 2016 | 8:00 | Ancestral tomb visitor accidental fire | 4.7 |
| Suanbo-myeon, Chungju-si, Chungcheongbuk-do | 5th April 2016 | 6:10 | 6th April 2016 | 9:40 | Waste incineration | 53.8 |
| Nam-myeon, Jeongson-Gun, Gangwon-do | 14th May 2016 | 6:20 | 14th May 2016 | 7:50 | Work place accidental fire | 2 |
| Yeongchun-myeon, Danyang-gun, Chungcheongbuk-do | 22th May 2016 | 3:00 | 23th May 2016 | 12:20 | Wild edible greens collector accidental fire | 13 |
| Dongi-myeon, Okcheon-gun, Chungcheongbuk-do | 22th May 2016 | 4:40 | 22th May 2016 | 10:20 | The others | 1 |
| Jinbu-myeon, Pyeongchang-gun, Gangwon-do | 30th May 2016 | 4:50 | 22th May 2016 | 6:50 | Waste incineration | 1 |
| Jipum-myeon, Yeongdeok-gun, Gyeongsangbuk-do | 4th February 2017 | 4:10 | 4th February 2017 | 7:10 | The others | 0.98 |
| Iljik-myeon, Andong-si, Gyeongsangbuk-do | 28th February 2017 | 4:10 | 4th February 2017 | 6:20 | The others | 0.8 |
| Buseok-myeon, Yeongju-si, Gyeongsangbuk-do | 4th March 2017 | 6:00 | 4th March 2017 | 7:20 | Agricultural Waste Incineration | 2 |
| Jangseong-eup, Jangseong-gun, Jeollanam-do | 6th March 2017 | 8:00 | 4th March 2017 | 8:00 | The others | 1 |
| Okgye-myeon, Gangneung-si, Gangwon-do | 9th March 2017 | 1:30 | 10th March 2017 | 13:30 | The others | 160.41 |
| Saengyeon-dong, Dongducheon-si, Gyeonggi-do | 11th March 2017 | 1:30 | 11th March 2017 | 4:00 | Waste incineration | 0.72 |
| Hwanam-myeon, Yeongcheon-si, Gyeongsangbuk-do | 11th March 2017 | 6:20 | 11th March 2017 | 7:40 | Paddy field incineration | 5.2 |
| Wolgot-myeon, Gimpo-si, Gyeonggi-do | 18th March 2017 | 6:30 | 18th March 2017 | 7:20 | Paddy field incineration | 3 |
| Seojong-myeon, Yangpyeong-gun, Gyeonggi-do | 18th March 2017 | 8:00 | 18th March 2017 | 8:50 | Waste incineration | 2 |
| Hanam-myeon, Hwacheon-gun, Gangwon-do | 19th March 2017 | 2:00 | 19th March 2017 | 5:50 | Agricultural Waste Incineration | 1.5 |
| Buk-myeon, Gapyeong-gun, Gyeonggi-do | 19th March 2017 | 5:40 | 19th March 2017 | 7:30 | Agricultural Waste Incineration | 2 |
| Baekseok-eup, Yangju-si, Gyeonggi-do | 19th March 2017 | 4:10 | 19th March 2017 | 6:30 | Climber accidental fire | 0.9 |
| Beopjeon-myeon, Bonghwa-gun, Gyeongsangbuk-do | 22th March 2017 | 7:10 | 22th March 2017 | 7:10 | The others | 2.2 |
| Dain-myeon, Uiseong-gun, Gyeongsangbuk-do | 23th March 2017 | 5:30 | 23th March 2017 | 6:00 | Paddy field incineration | 1.5 |
| Namyang, Hwaseong-si, Gyeonggi-do | 3rd April 2017 | 5:50 | 3rd April 2017 | 8:00 | Waste incineration | 2.5 |
| Noseong-myeon, Nonsan-si, Chungcheongnam-do | 3rd April 2017 | 7:30 | 3rd April 2017 | 9:10 | The others | 0.8 |
| Buk-myeon, Gapyeong-gun, Gyeonggi-do | 23th April 2017 | 3:40 | 23th April 2017 | 7:30 | Climber accidental fire | 1.5 |
| Goesan-eup, Goesan-gun, Chungcheongbuk-do | 26th April 2017 | 8:20 | 26th April 2017 | 13:10 | The others | 2 |
| Gonjiam-eup, Gwangju-si, Gyeonggi-do | 28th April 2017 | 2:20 | 28th April 2017 | 6:50 | The others | 1 |
| Jojong-myeon, Gapyeong-gun, Gyeonggi-do | 29th April 2017 | 5:10 | 29th April 2017 | 7:20 | Climber accidental fire | 2 |
| Dogye-eup, Samcheok-si, Gangwon-do | 6th May 2017 | 2:50 | 9th May 2017 | 13:30 | The others | 765.12 |
| Seongsan-myeon, Gangneung-si, Gangwon-do | 6th May 2017 | 6:40 | 9th May 2017 | 17:30 | The others | 252 |
| Tongjin-eup, Gimpo-si, Gyeonggi-do | 6th May 2017 | 6:50 | 6th May 2017 | 7:50 | The others | 1 |
| Sabeol-myeon, Sangju-si, Gyeongsangbuk-do | 6th May 2017 | 5:10 | 8th May 2017 | 13:30 | Agricultural Waste Incineration | 86 |
| Gaeun-eup, Mungyeong-si, Gyeongsangbuk-do | 6th May 2017 | 7:30 | 6th May 2017 | 9:30 | Agricultural Waste Incineration | 1.5 |
| Yeonghae-myeo, Yeongdeok-gun, Gyeongsangbuk-do | 7th May 2017 | 5:50 | 7th May 2017 | 9:00 | Cigarette accidental fire | 5.9 |
| Seonnam-myeon Seongju-gun, Gyeongsangbuk-do | 4th June 2017 | 3:10 | 4th June 2017 | 11:50 | Waste incineration | 2 |
| Munui-myeon, Sangdang-gu, Cheongju-si, Chungcheongbuk-do | 11th June 2017 | 14:30 | 11th June 2017 | 17:50 | The others | 3.12 |
| Miwon-myeon, Sangdang-gu, Cheongju-si, Chungcheongbuk-do | 14th June 2017 | 12:10 | 14th June 2017 | 15:10 | The others | 0.7 |
| Hwanam-myeon, Yeongcheon-si, Gyeongsangbuk-do | 23th November 2017 | 20:40 | 23th November 2017 | 23:50 | The others | 0.8 |
| Hyeonbuk-myeon, Yangyang-gun, Gangwon-do | 4th December 2017 | 10:40 | 4th December 2017 | 12:10 | House fire spread | 1.86 |
| Sicheon-myeon, Sancheong-gun, Gyeongsangnam-do | 5th December 2017 | 21:30 | 5th December 2017 | 3:50 | The others | 5 |
| Buk-gu, Ulsan Metropolitan City | 12th December 2017 | 14:50 | 12th December 2017 | 23:40 | The others | 18 |
| Gogyeong-myeon, Yeongcheon-si, Gyeongsangbuk-do | 16th December 2017 | 8:30 | 16th December 2017 | 10:50 | The others | 1.89 |
| Gaejin-myeon, Goryeong-gun, Gyeongsangbuk-do | 19th December 2017 | 5:00 | 19th December 2017 | 7:30 | Climber accidental fire | 1.5 |
| 5 additionally detected forest fires | ||||||
| Bibong-myeon, Wanju-gun, Jeollabuk-do | 16th March 2016 | 6:20 | 16th March 2016 | 8:30 | Agricultural Waste Incineration | 0.2 |
| Dosan-myeon, Andong-si, Gyeongsangbuk-do | 30th March 2016 | 8:47 | 30th March 2016 | 10:00 | Paddy field incineration | 0.02 |
| Sari-myeon, Goesan-gun, Chungcheongbuk-do | 1st April 2016 | 5:10 | 1st April 2016 | 7:45 | The others | 0.3 |
| Sosu-myeon, Goesan-gun, Chungcheongbuk-do | 5th April 2016 | 7:20 | 5th April 2016 | 8:50 | Waste incineration | 0.1 |
| Hyeonsan-myeon, Haenam-gun, Jeollanam-do | 19th March 2017 | 3:55 | 19th March 2017 | 5:25 | Agricultural Waste Incineration | 0.03 |
Appendix C
List of 191 input variables—band radiance, BT, band ratios, BT differences and BT ratios of bands 4–16—which were used for identifying input data to the RF model.
| Band radiance (13) | Ch04 | Ch05 | Ch06 | Ch07 |
| Ch08 | Ch09 | Ch10 | Ch11 | |
| Ch12 | Ch13 | Ch14 | Ch15 | |
| Ch16 | ||||
| Band ratios (78) | Ch04/Ch05 | Ch04/Ch06 | Ch04/Ch07 | Ch04/Ch08 |
| Ch04/Ch09 | Ch04/Ch10 | Ch04/Ch11 | Ch04/Ch12 | |
| Ch04/Ch13 | Ch04/Ch14 | Ch04/Ch15 | Ch04/Ch16 | |
| Ch05/Ch06 | Ch05/Ch07 | Ch05/Ch08 | Ch05/Ch09 | |
| Ch05/Ch10 | Ch05/Ch11 | Ch05/Ch12 | Ch05/Ch13 | |
| Ch05/Ch14 | Ch05/Ch15 | Ch05/Ch16 | ||
| Ch06/Ch07 | Ch06/Ch08 | Ch06/Ch09 | Ch06/Ch10 | |
| Ch06/Ch11 | Ch06/Ch12 | Ch06/Ch13 | Ch06/Ch14 | |
| Ch06/Ch15 | Ch06/Ch16 | |||
| Ch07/Ch08 | Ch07/Ch09 | Ch07/Ch10 | Ch07/Ch11 | |
| Ch07/Ch12 | Ch07/Ch13 | Ch07/Ch14 | Ch07/Ch15 | |
| Ch07/Ch16 | ||||
| Ch08/Ch09 | Ch08/Ch10 | Ch08/Ch11 | Ch08/Ch12 | |
| Ch08/Ch13 | Ch08/Ch14 | Ch08/Ch15 | Ch08/Ch16 | |
| Ch09/Ch10 | Ch09/Ch11 | Ch09/Ch12 | Ch09/Ch13 | |
| Ch09/Ch14 | Ch09/Ch15 | Ch09/Ch16 | ||
| Ch10/Ch11 | Ch10/Ch12 | Ch10/Ch13 | Ch10/Ch14 | |
| Ch10/Ch15 | Ch10/Ch16 | |||
| Ch11/Ch12 | Ch11/Ch13 | Ch11/Ch14 | Ch11/Ch15 | |
| Ch11/Ch16 | ||||
| Ch12/Ch13 | Ch12/Ch14 | Ch12/Ch15 | Ch12/Ch16 | |
| Ch13/Ch14 | Ch13/Ch15 | Ch13/Ch16 | ||
| Ch14/Ch15 | Ch14/Ch16 | |||
| Ch15/Ch16 | ||||
| BT (10) | BT07 | BT08 | BT09 | BT10 |
| BT11 | BT12 | BT13 | BT14 | |
| BT15 | BT16 | |||
| BT differences (45) | BT07-BT08 | BT07-BT09 | BT07-BT10 | BT07-BT11 |
| BT07-BT12 | BT07-BT13 | BT07-BT14 | BT07-BT15 | |
| BT07-BT16 | ||||
| BT08-BT09 | BT08-BT10 | BT08-BT11 | BT08-BT12 | |
| BT08-BT13 | BT08-BT14 | BT08-BT15 | BT08-BT16 | |
| BT09-BT10 | BT09-BT11 | BT09-BT12 | BT09-BT13 | |
| BT09-BT14 | BT09-BT15 | BT09-BT16 | ||
| BT10-BT11 | BT10-BT12 | BT10-BT13 | BT10-BT14 | |
| BT10-BT15 | BT10-BT16 | |||
| BT11-BT12 | BT11-BT13 | BT11-BT14 | BT11-BT15 | |
| BT11-BT16 | ||||
| BT12-BT13 | BT12-BT14 | BT12-BT15 | BT12-BT16 | |
| BT13-BT14 | BT13-BT15 | BT13-BT16 | ||
| BT14-BT15 | BT14-BT16 | |||
| BT15-BT16 | ||||
| BT ratios (45) | BT07/BT08 | BT07/BT09 | BT07/BT10 | BT07/BT11 |
| BT07/BT12 | BT07/BT13 | BT07/BT14 | BT07/BT15 | |
| BT07/BT16 | ||||
| BT08/BT09 | BT08/BT10 | BT08/BT11 | BT08/BT12 | |
| BT08/BT13 | BT08/BT14 | BT08/BT15 | BT08/BT16 | |
| BT09/BT10 | BT09/BT11 | BT09/BT12 | BT09/BT13 | |
| BT09/BT14 | BT09/BT15 | BT09/BT16 | ||
| BT10/BT11 | BT10/BT12 | BT10/BT13 | BT10/BT14 | |
| BT10/BT15 | BT10/BT16 | |||
| BT11/BT12 | BT11/BT13 | BT11/BT14 | BT11/BT15 | |
| BT11/BT16 | ||||
| BT12/BT13 | BT12/BT14 | BT12/BT15 | BT12/BT16 | |
| BT13/BT14 | BT13/BT15 | BT13/BT16 | ||
| BT14/BT15 | BT14/BT16 | |||
| BT15/BT16 |
References
- Shin, W. 2015 Forest Standard Statistics; Ryu, G., Ed.; Korea Forest Service: Daejeon Metropolitan City, Korea, 2016. [Google Scholar]
- Kim, G. A Study on Wildfire Detection Using Geostationary Meteorological Satellite. Master’s Thesis, Pukyoung National University, Busan Metropolitan City, Korea, 2015. [Google Scholar]
- Lee, J.; Park, D. 2017 Statistical Yearbook of Forest Fire; Kim, J., Lee, S., Nam, M., Eds.; Korea Forest Service: Daejeon Metropolitan City, Korea, 2018. [Google Scholar]
- Leblon, B.; San-Miguel-Ayanz, J.; Bourgeau-Chavez, L.; Kong, M. Remote sensing of wildfires. In Land Surface Remote Sensing; Elsevier: Amsterdam, The Netherlands, 2016; pp. 55–95. [Google Scholar]
- Leblon, B.; Bourgeau-Chavez, L.; San-Miguel-Ayanz, J. Use of remote sensing in wildfire management. In Sustainable Development-Authoritative and Leading Edge Content for Environmental Management; InTech: London, UK, 2012. [Google Scholar]
- Di Biase, V.; Laneve, G. Geostationary sensor based forest fire detection and monitoring: An improved version of the SFIDE algorithm. Remote Sens. 2018, 10, 741. [Google Scholar] [CrossRef]
- Filizzola, C.; Corrado, R.; Marchese, F.; Mazzeo, G.; Paciello, R.; Pergola, N.; Tramutoli, V. RST-FIRES, an exportable algorithm for early-fire detection and monitoring: Description, implementation, and field validation in the case of the MSG-SEVIRI sensor. Remote Sens. Environ. 2017, 192, e2–e25. [Google Scholar] [CrossRef]
- Giglio, L.; Descloitres, J.; Justice, C.O.; Kaufman, Y.J. An enhanced contextual fire detection algorithm for MODIS. Remote Sens. Environ. 2003, 87, 273–282. [Google Scholar] [CrossRef]
- Giglio, L.; Schroeder, W.; Justice, C.O. The collection 6 MODIS active fire detection algorithm and fire products. Remote Sens. Environ. 2016, 178, 31–41. [Google Scholar] [CrossRef] [PubMed]
- Na, L.; Zhang, J.; Bao, Y.; Bao, Y.; Na, R.; Tong, S.; Si, A. Himawari-8 satellite based dynamic monitoring of grassland fire in China-Mongolia border regions. Sensors 2018, 18, 276. [Google Scholar] [CrossRef] [PubMed]
- Schroeder, W.; Oliva, P.; Giglio, L.; Csiszar, I.A. The new VIIRS 375 m active fire detection data product: Algorithm description and initial assessment. Remote Sens. Environ. 2014, 143, 85–96. [Google Scholar] [CrossRef]
- Schroeder, W.; Oliva, P.; Giglio, L.; Quayle, B.; Lorenz, E.; Morelli, F. Active fire detection using Landsat-8/OLI data. Remote Sens. Environ. 2016, 185, 210–220. [Google Scholar] [CrossRef]
- Wickramasinghe, C.H.; Jones, S.; Reinke, K.; Wallace, L. Development of a multi-spatial resolution approach to the surveillance of active fire lines using Himawari-8. Remote Sens. 2016, 8, 932. [Google Scholar] [CrossRef]
- Wickramasinghe, C.; Wallace, L.; Reinke, K.; Jones, S. Implementation of a new algorithm resulting in improvements in accuracy and resolution of SEVIRI hotspot products. Remote Sens. Lett. 2018, 9, 877–885. [Google Scholar] [CrossRef]
- Xu, G.; Zhong, X. Real-time wildfire detection and tracking in Australia using geostationary satellite: Himawari-8. Remote Sens. Lett. 2017, 8, 1052–1061. [Google Scholar] [CrossRef]
- Hally, B.; Wallace, L.; Reinke, K.; Jones, S. Assessment of the utility of the advanced Himawari imager to detect active fire over Australia. Int. Arch. Photogramm. Remote Sens. Spat. Inf. Sci. 2016, 41, 65–71. [Google Scholar] [CrossRef]
- Hally, B.; Wallace, L.; Reinke, K.; Jones, S.; Skidmore, A. Advances in active fire detection using a multi-temporal method for next-generation geostationary satellite data. Int. J. Digit. Earth 2018, 1–16. [Google Scholar] [CrossRef]
- Roberts, G.; Wooster, M. Development of a multi-temporal Kalman filter approach to geostationary active fire detection & fire radiative power (FRP) estimation. Remote Sens. Environ. 2014, 152, 392–412. [Google Scholar]
- Xie, Z.; Song, W.; Ba, R.; Li, X.; Xia, L. A spatiotemporal contextual model for forest fire detection using Himawari-8 satellite data. Remote Sens. 2018, 10, 1992. [Google Scholar] [CrossRef]
- Miller, J.; Borne, K.; Thomas, B.; Huang, Z.; Chi, Y. Automated wildfire detection through Artificial Neural Networks. In Remote Sensing and Modeling Applications to Wildland Fires; Springer: New York, NY, USA, 2013; pp. 293–304. [Google Scholar]
- Atwood, E.C.; Englhart, S.; Lorenz, E.; Halle, W.; Wiedemann, W.; Siegert, F. Detection and characterization of low temperature peat fires during the 2015 fire catastrophe in Indonesia using a new high-sensitivity fire monitoring satellite sensor (FireBird). PLoS ONE 2016, 11, e0159410. [Google Scholar] [CrossRef]
- Kim, S. Development of an Algorithm for Detecting Sub-Pixel Scale Forest Fires Using MODIS Data. Ph.D. Thesis, Inha University, Incheon Metropolitan City, Korea, 2009. [Google Scholar]
- Huh, Y.; Lee, J. Enhanced contextual forest fire detection with prediction interval analysis of surface temperature using vegetation amount. Int. J. Remote Sens. 2017, 38, 3375–3393. [Google Scholar] [CrossRef]
- Seoul Broadcasting System (SBS) News Website. Available online: http://news.sbs.co.kr/news/endPage.do?news_id=N1004722267&plink=ORI&cooper=NAVER (accessed on 9 January 2019).
- Korean Statistical Information Service Home Page. Available online: http://kosis.kr/statHtml/statHtml.do?orgId=101&tblId=DT_2KAA101&conn_path=I2 (accessed on 10 January 2019).
- Lee, C. 2018 National Park Standard Statistics; Ryu, G., Ed.; Korea National Park Service: Gangwon-do, Korea, 2018. [Google Scholar]
- Korea Meteorological Administration. Available online: http://www.weather.go.kr/weather/climate/average_south.jsp (accessed on 27 August 2018).
- Korea Forest Service Home Page. Available online: http://www.forest.go.kr/newkfsweb/html/HtmlPage.do?pg=/policy/policy_0401.html&mn=KFS_38_05_04 (accessed on 17 January 2019).
- Environmental Geographic Information Service Home Page. Available online: http://www.index.go.kr/search/search.jsp (accessed on 9 January 2019).
- Peterson, D.; Wang, J.; Ichoku, C.; Hyer, E.; Ambrosia, V. A sub-pixel-based calculation of fire radiative power from MODIS observations: 1: Algorithm development and initial assessment. Remote Sens. Environ. 2013, 129, 262–279. [Google Scholar] [CrossRef]
- Lee, S.; Han, H.; Im, J.; Jang, E.; Lee, M.-I. Detection of deterministic and probabilistic convection initiation using Himawari-8 Advanced Himawari Imager data. Atmos. Meas. Tech. 2017, 10, 1859–1874. [Google Scholar] [CrossRef]
- Koltunov, A.; Ustin, S.L.; Quayle, B.; Schwind, B.; Ambrosia, V.G.; Li, W. The development and first validation of the GOES Early Fire Detection (GOES-EFD) algorithm. Remote Sens. Environ. 2016, 184, 436–453. [Google Scholar] [CrossRef]
- Amraoui, M.; DaCamara, C.; Pereira, J. Detection and monitoring of African vegetation fires using MSG-SEVIRI imagery. Remote Sens. Environ. 2010, 114, 1038–1052. [Google Scholar] [CrossRef]
- Polivka, T.N.; Wang, J.; Ellison, L.T.; Hyer, E.J.; Ichoku, C.M. Improving nocturnal fire detection with the VIIRS day–night band. IEEE Trans. Geosci. Remote Sens. 2016, 54, 5503–5519. [Google Scholar] [CrossRef]
- Forkuor, G.; Dimobe, K.; Serme, I.; Tondoh, J.E. Landsat-8 vs. Sentinel-2: Examining the added value of Sentinel-2’s red-edge bands to land-use and land-cover mapping in Burkina Faso. GISci. Remote Sens. 2018, 55, 331–354. [Google Scholar] [CrossRef]
- Jang, E.; Im, J.; Park, G.-H.; Park, Y.-G. Estimation of fugacity of carbon dioxide in the East Sea using in situ measurements and Geostationary Ocean Color Imager satellite data. Remote Sens. 2017, 9, 821. [Google Scholar] [CrossRef]
- Liu, T.; Abd-Elrahman, A.; Morton, J.; Wilhelm, V.L. Comparing fully convolutional networks, random forest, support vector machine, and patch-based deep convolutional neural networks for object-based wetland mapping using images from small unmanned aircraft system. GISci. Remote Sens. 2018, 55, 243–264. [Google Scholar] [CrossRef]
- Richardson, H.J.; Hill, D.J.; Denesiuk, D.R.; Fraser, L.H. A comparison of geographic datasets and field measurements to model soil carbon using random forests and stepwise regressions (British Columbia, Canada). GISci. Remote Sens. 2017, 54, 573–591. [Google Scholar] [CrossRef]
- Zhang, C.; Smith, M.; Fang, C. Evaluation of Goddard’s lidar, hyperspectral, and thermal data products for mapping urban land-cover types. GISci. Remote Sens. 2018, 55, 90–109. [Google Scholar] [CrossRef]
- Breiman, L. Random forests. Mach. Learn. 2001, 45, 5–32. [Google Scholar] [CrossRef]
- Guo, Z.; Du, S. Mining parameter information for building extraction and change detection with very high-resolution imagery and GIS data. GISci. Remote Sens. 2017, 54, 38–63. [Google Scholar] [CrossRef]
- Park, S.; Im, J.; Park, S.; Yoo, C.; Han, H.; Rhee, J. Classification and mapping of paddy rice by combining Landsat and SAR time series data. Remote Sens. 2018, 10, 447. [Google Scholar] [CrossRef]
- Yoo, C.; Im, J.; Park, S.; Quackenbush, L.J. Estimation of daily maximum and minimum air temperatures in urban landscapes using MODIS time series satellite data. ISPRS J. Photogramm. Remote Sens. 2018, 137, 149–162. [Google Scholar] [CrossRef]
- Park, S.; Im, J.; Park, S.; Rhee, J. Drought monitoring using high resolution soil moisture through multi-sensor satellite data fusion over the Korean peninsula. Agric. For. Meteorol. 2017, 237, 257–269. [Google Scholar] [CrossRef]
- Sonobe, R.; Yamaya, Y.; Tani, H.; Wang, X.; Kobayashi, N.; Mochizuki, K.-I. Assessing the suitability of data from Sentinel-1A and 2A for crop classification. GISci. Remote Sens. 2017, 54, 918–938. [Google Scholar] [CrossRef]
- Zhang, D.; Liu, X.; Wu, X.; Yao, Y.; Wu, X.; Chen, Y. Multiple intra-urban land use simulations and driving factors analysis: A case study in Huicheng, China. GISci. Remote Sens. 2018, 1–27. [Google Scholar] [CrossRef]
- Georganos, S.; Grippa, T.; Vanhuysse, S.; Lennert, M.; Shimoni, M.; Kalogirou, S.; Wolff, E. Less is more: Optimizing classification performance through feature selection in a very-high-resolution remote sensing object-based urban application. GISci. Remote Sens. 2018, 55, 221–242. [Google Scholar] [CrossRef]
- Rhee, J.; Im, J. Meteorological drought forecasting for ungauged areas based on machine learning: Using long-range climate forecast and remote sensing data. Agric. For. Meteorol. 2017, 237, 105–122. [Google Scholar] [CrossRef]
- Sim, S.; Im, J.; Park, S.; Park, H.; Ahn, M.H.; Chan, P.W. Icing detection over East Asia from geostationary satellite data using machine learning approaches. Remote Sens. 2018, 10, 631. [Google Scholar] [CrossRef]
- Murphy, S.W.; de Souza Filho, C.R.; Wright, R.; Sabatino, G.; Pabon, R.C. HOTMAP: Global hot target detection at moderate spatial resolution. Remote Sens. Environ. 2016, 177, 78–88. [Google Scholar] [CrossRef]
- China Forest Fire Management Home Page. Available online: http://www.slfh.gov.cn (accessed on 10 January 2019).
- China Forest Fire Management Home Page. Available online: http://www.slfh.gov.cn/Item/24197.aspx (accessed on 10 January 2019).
- China Forest Fire Management Home Page. Available online: http://www.slfh.gov.cn/Item/25469.aspx (accessed on 10 January 2019).
- Liu, X.; He, B.; Quan, X.; Yebra, M.; Qiu, S.; Yin, C.; Liao, Z.; Zhang, H. Near real-time extracting wildfire spread rate from Himawari-8 satellite data. Remote Sens. 2018, 10, 1654. [Google Scholar] [CrossRef]


© 2019 by the authors. Licensee MDPI, Basel, Switzerland. This article is an open access article distributed under the terms and conditions of the Creative Commons Attribution (CC BY) license (http://creativecommons.org/licenses/by/4.0/).