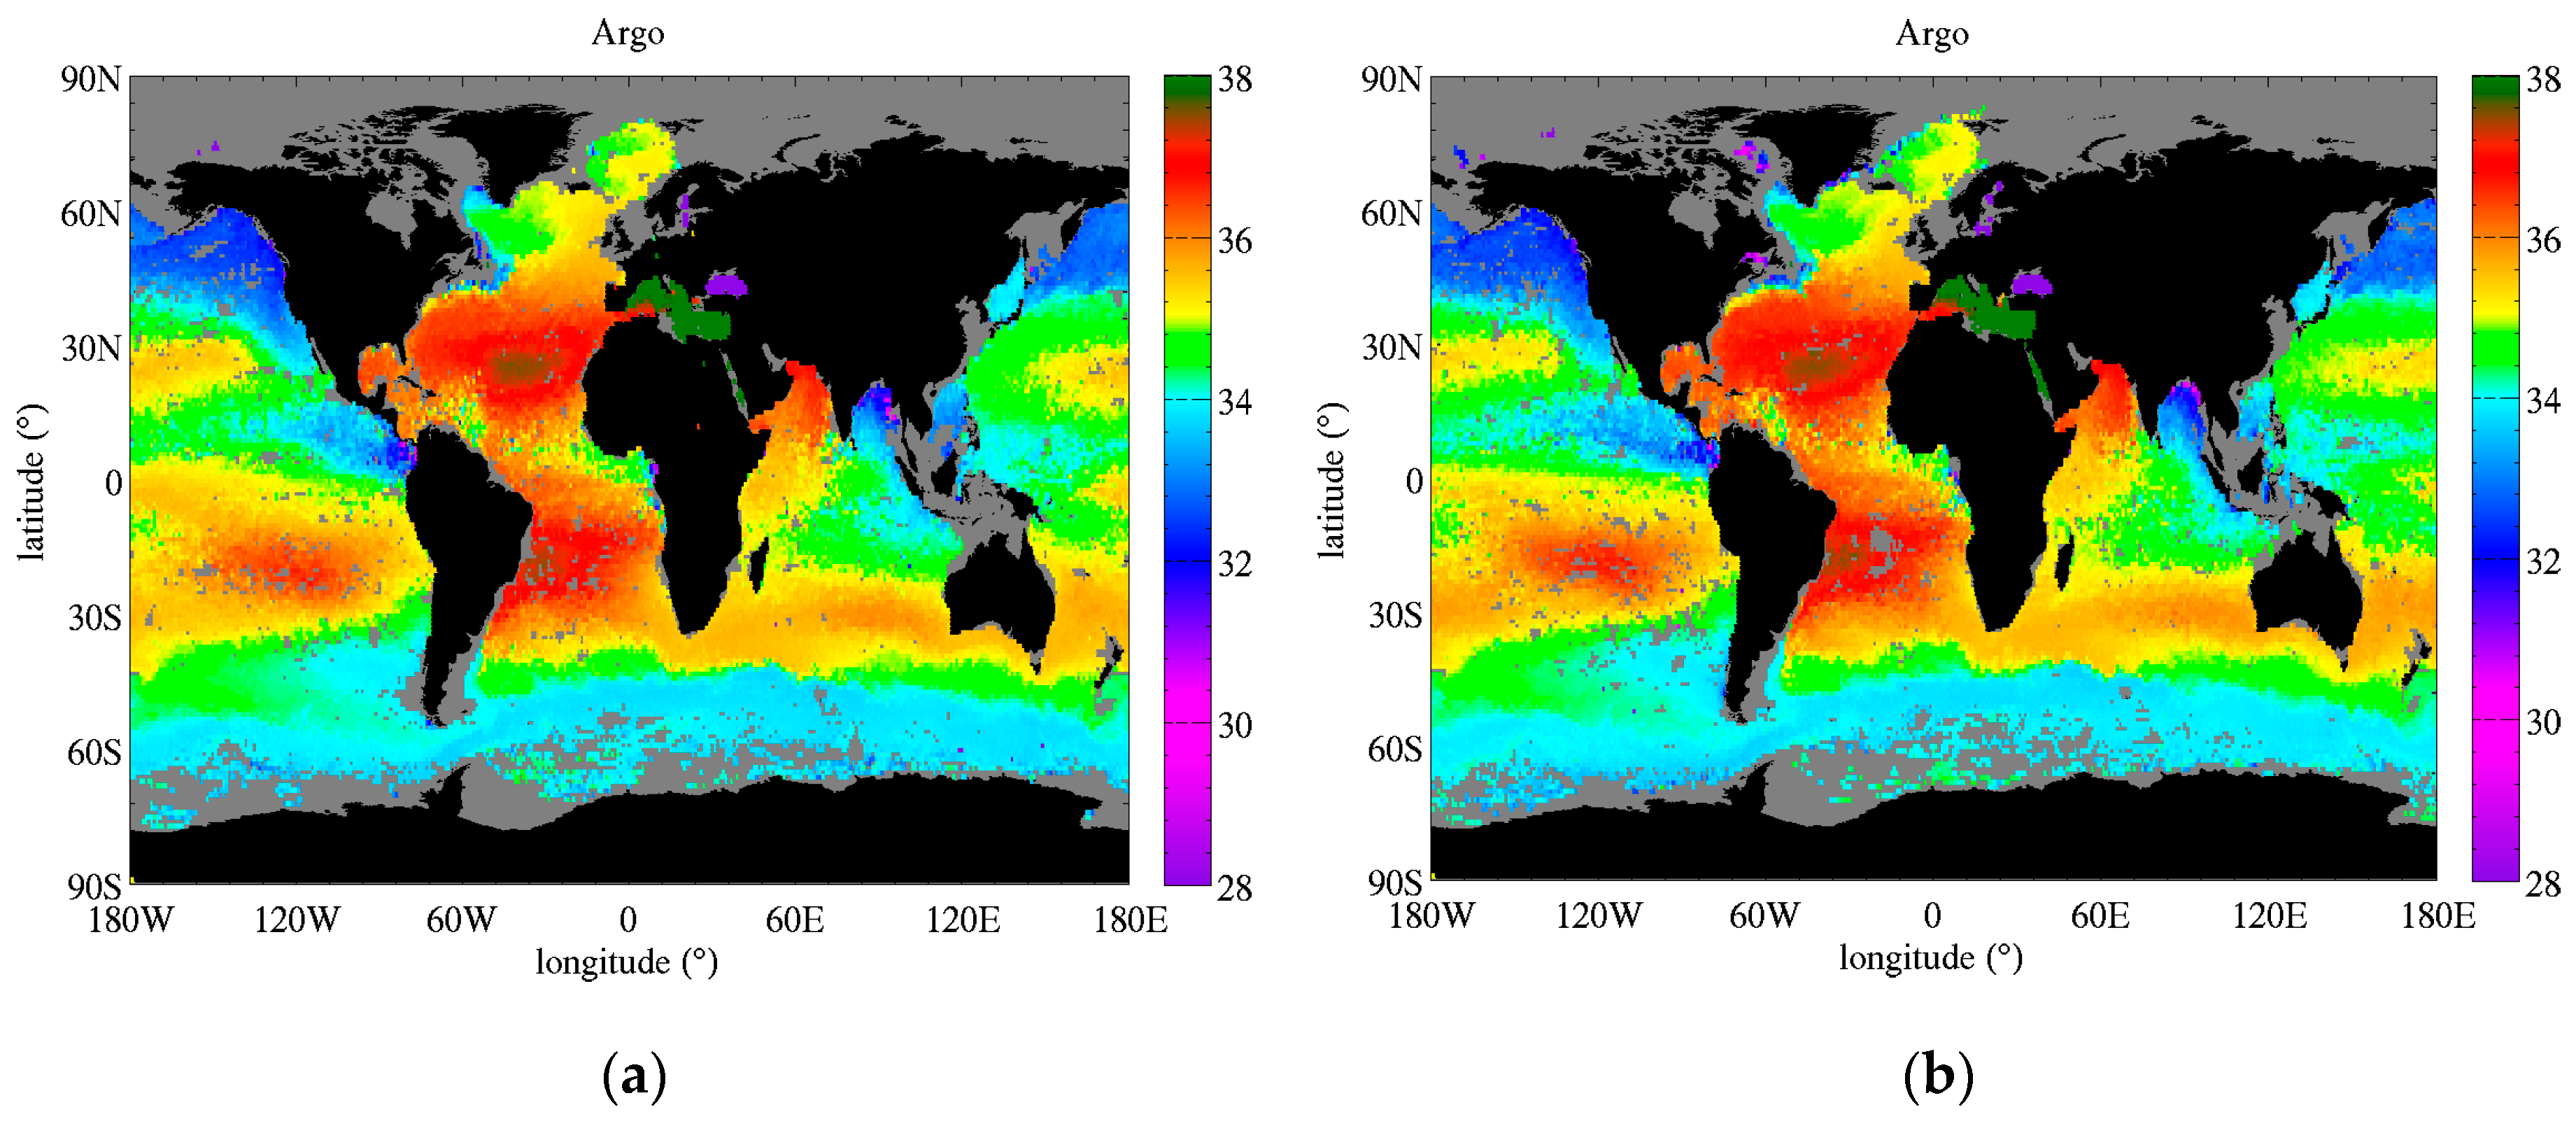
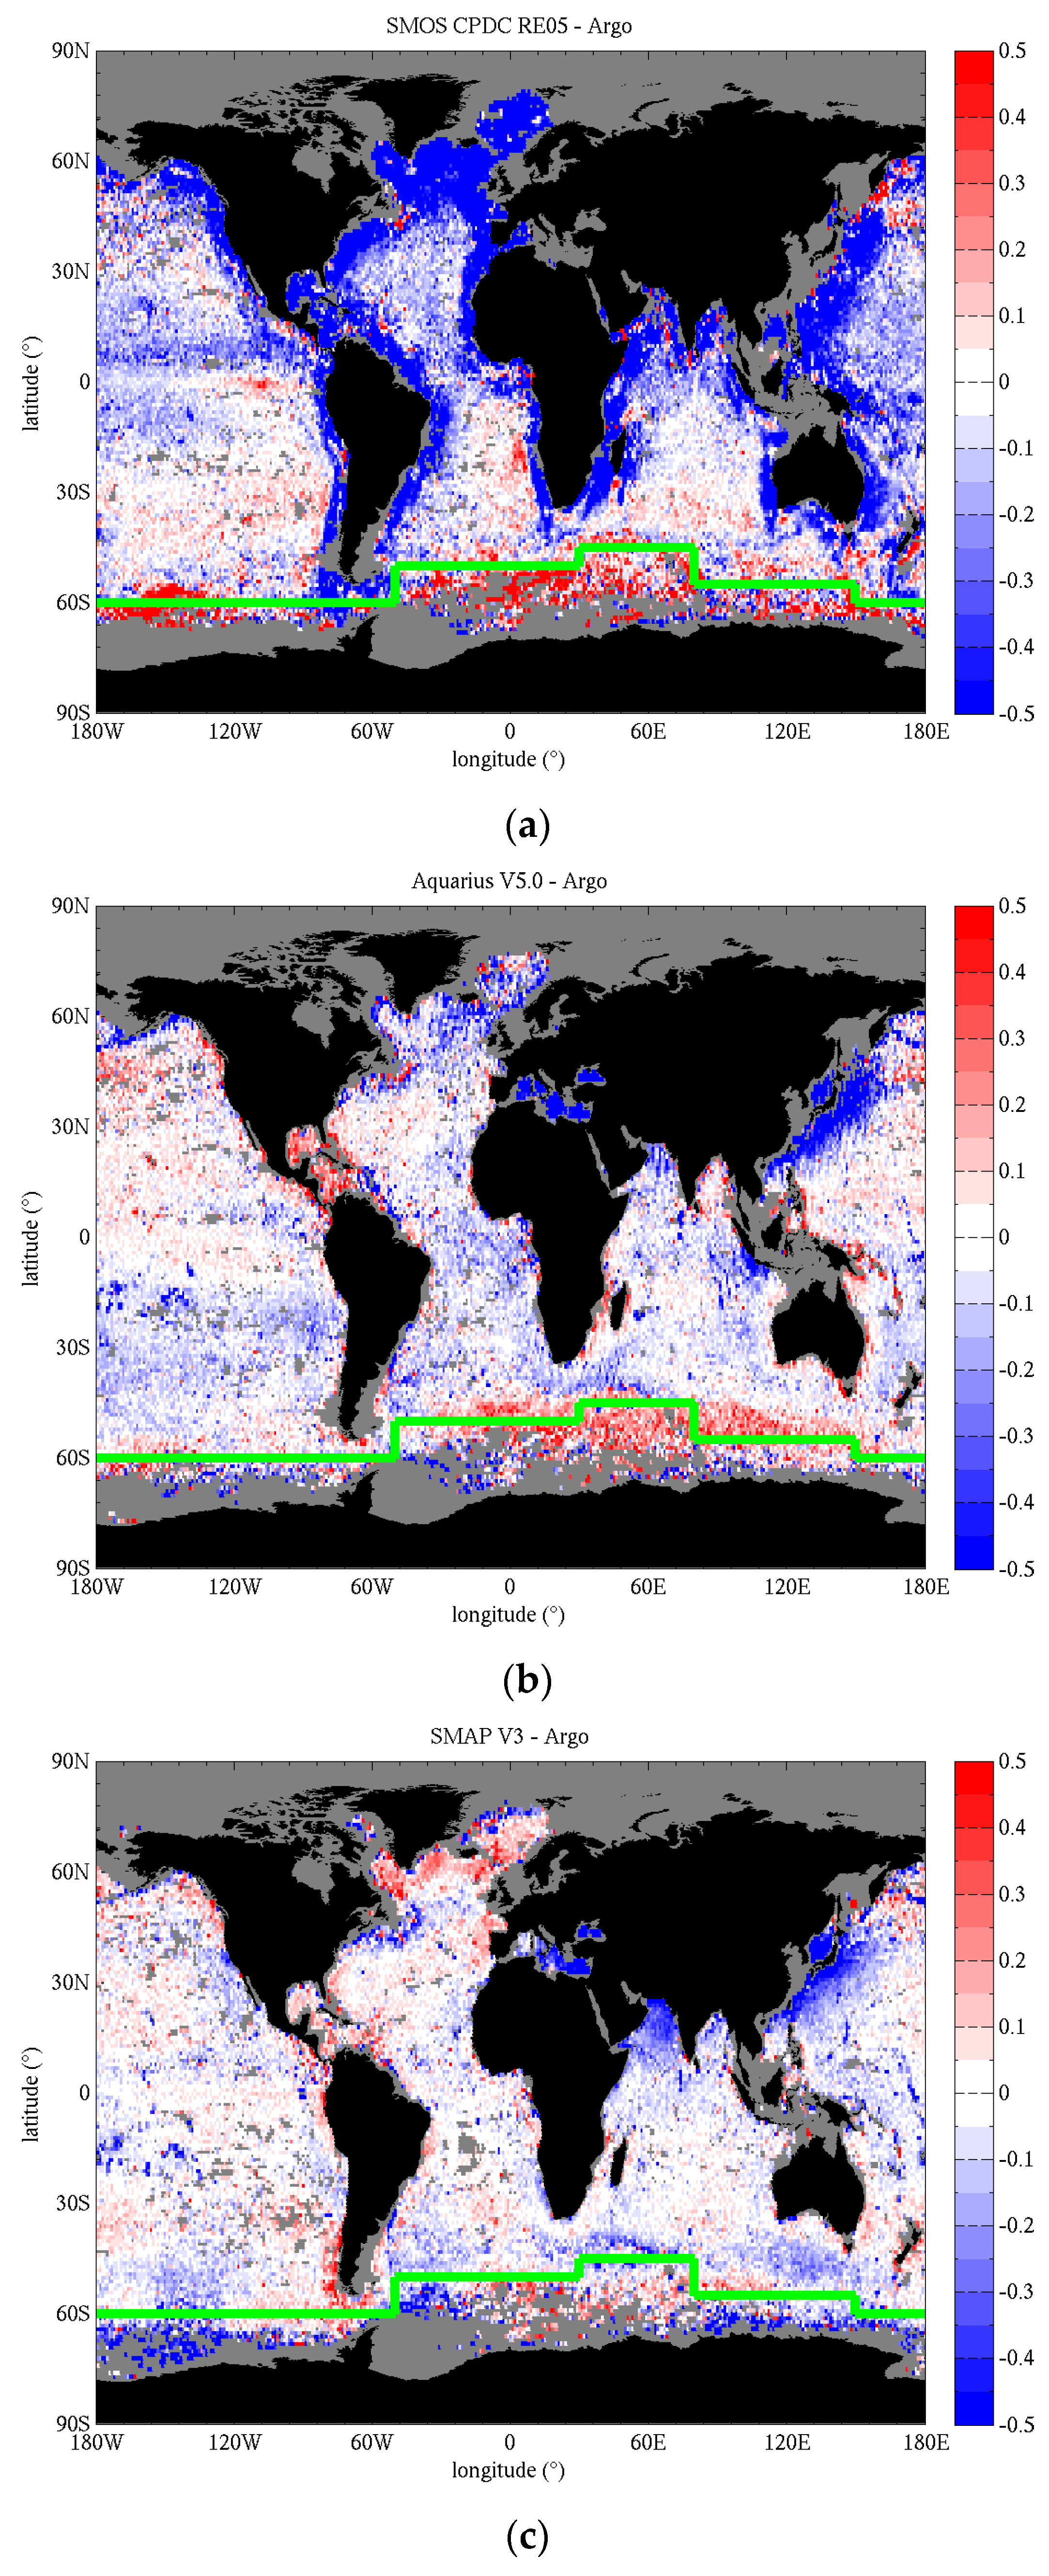
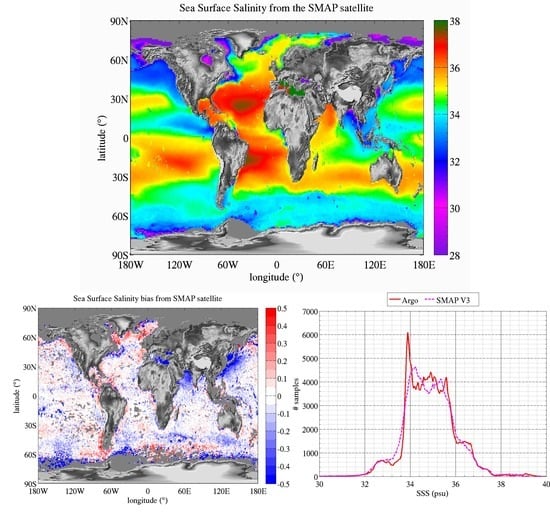
We selected 12 regions of interest (ROI) in which we average the monthly SSS from Argo and the satellite products. The boundaries of the ROI are reported in
Table 5. Because the coverage of an ROI by Argo will change in time, we compute the satellite average using only grid cells in the ROI that have a corresponding Argo sample. The ROI are reported in
Figure 2 over a map of Argo SSS (top) long term average and (bottom) standard deviation over the period 01/2011–06/2018. They cover various SSS and SST average value, as well as various temporal variability (
Table 6). The five oceanic gyres in the Atlantic (#1, 2), Pacific (#5, 6) and South Indian (#8) oceans have SSS which is relatively high (35.3–37.5 psu) and stable (STD 0.07–0.11 psu). Highly variable regions, such as the equatorial Pacific upwelling region (#4), the Amazon plume (#3) and the Tropical Indian Ocean (#10) show seasonal variations of about 0.5–1.0 psu driven by changing fresh water influx from river outflow and large precipitations, and advection by coastal currents and the South Equatorial Current in the Indian Ocean. Low SSS (32.7–33.9 psu) are persistently observed in cold waters at high latitudes (#7, 11, 12), and occur seasonally in big river mouths and plumes (#3). The time series of Argo, SMOS, Aquarius and SMAP SSS in the ROI are reported in
Figure 12 and
Figure 13. The SMAP and Aquarius SSS are those distributed at the PO.DAAC (
Section 2.1).The temporal average and standard deviation of the difference between satellite and Argo SSS are reported for each region in
Table 7 and
Table 8, respectively. Because SMAP V3 was recently released, we also report results for V2 to emphasize the changes in the latest version of the product. This is discussed at the end of the section. The first paragraph focusses on the latest SMAP, Aquarius and SMOS products.
In both Atlantic gyres (#1, #2,
Figure 12a,b), SSS seasonal variations are of the order of 0.2–0.3 psu. SMAP V3 and Aquarius show the best performances with overall good agreement in timing and amplitude of the cycles. In the North Atlantic gyre (#1,
Figure 12a) SMOS peaks too early in the year compared to Argo and is biased fresh, with too strong freshening events in winter. In the South Atlantic gyre (#2,
Figure 12b), SMOS timing is better but the signal is noisier. It does not exhibit excessive freshening like in the North, but there are a few salty peaks (e.g., April 2013) that are not consistent with Argo. The noise is likely due, in part, to our averaging only grid cells where Argo samples exist. Averaging SMOS SSS over the whole ROI would likely smooth out the curves. All the satellites products manage to capture sharp variations, such as the 0.5 psu drop in May–Aug 2014 and 0.4 psu increase in Dec 2014–Apr 2015. Smaller features, such as the peak in Oct 2014, are also reproduced by both SMOS and Aquarius. The Pacific gyres (#5, #6,
Figure 12e,f) have smaller seasonal variations, of the order of 0.1 psu, but show larger interannual variations. In the Southern Pacific gyre (#5,
Figure 12e), SSS drops twice by 0.25 psu, once in the second half of 2011 and once in 2015. After both drops, SSS follows an increasing trend over a few years. Both the drops and trends are well captured by the satellite products. SMOS in particular shows good agreement with Argo in 2011 and limited bias over the whole time series. Aquarius is biased fresh by almost 0.1 psu. SMAP V3 has a good match in phase and amplitude, albeit with a little noise in the signal. In the Northern Pacific gyre (#6,
Figure 12f), the seasonal cycles are also small (~0.1 psu) and the largest signal is a 0.35 psu drop in between November 2014 and April 2015. SMOS and Aquarius reproduce accurately the timing of the drop, but the amplitude differs slightly. Both satellites show larger seasonal cycles than Argo, and SMOS is biased fresh (0.1 psu) and tends to peak ahead of Argo during the period 2011–2013. SMAP V3 has the best match to Argo with very small bias (0.02 psu) and good agreement in the seasonal cycles. In the South Indian gyre (#8,
Figure 13b), Argo shows similar seasonal cycles almost every year (excluding 2015 and 2016) with peaks early in the year, and peak to peak variations ~0.12 psu. SMOS exhibits a small bias (0.01 psu) but large discrepancies in seasonal variations, except in 2014 and during the 0.2 psu increase from 2016 to 2017. Aquarius has much better seasonal variations, peaking early in the year when Argo does, but is freshly biased by 0.09 psu. SMAP V3 shows the best overall agreement with a small bias and good seasonal variations, although it shows amplified peaks in 2015 and 2016. In the highly variable regions that are the Amazon Plume (#3,
Figure 12c), the Equatorial Pacific (#4,
Figure 12d) and the Tropical Indian Ocean (#10,
Figure 13d), where seasonal variations commonly reach and exceed 0.5 psu, satellite products agree well with Argo overall. In the Amazon Plume (#3,
Figure 12c), which shows the largest variations up to 2.5 psu, the timing between satellite and in situ is good with a few exceptions. SMOS tends to be fresh compared to Argo, it has lower SSS peaks and much larger freshening events (up to 1 psu fresher) in the periods July-October. SMAP agrees well with Argo except for the 2017 freshening where it shows a much larger freshening. Overall, Aquarius bias is the smallest and it appears to track seasonal changes the best (e.g., peaks in May and Sept 2013). In a region where SSS is so variable in space and time, it is likely that mismatches between satellite and in situ observation times, locations and scales are causing some of the discrepancies being observed. In the Equatorial Pacific (#4,
Figure 12d), seasonal changes are about 0.5 psu, with a larger change of 1 psu in early 2012. All the variations are well captured by SMAP and Aquarius. SMOS tends to overestimate the peak SSS, but the cycles timing is good. The Tropical Indian Ocean (#10,
Figure 13d) has a seasonal variation of 0.5 psu–1 psu. All satellites show a very good match to Argo both in timing and amplitude. However, SMOS performances appear to decline starting in 2015 when it starts to underestimate the peaks by 0.1–0.2 psu. All high latitudes ROI (#7, #9, #11, #12,
Figure 13a,c,e,f) show decreased performances of the satellite products, with increased bias or standard deviation of the differences with Argo. In the North Pacific high latitudes (#7,
Figure 13a), SMAP and Aquarius reproduce well the timing of the seasonal cycles, but the peaks are too high by a few tenths of a psu. SMOS hardly shows seasonal cycles, except maybe in 2011, 2012 and 2016, with large errors in timing or amplitude. In the high latitudes of the South Pacific (#9,
Figure 13c) and South Atlantic (#11,
Figure 13e), both timing and amplitude of the satellite cycles show significant discrepancies with Argo and SSS is biased by −0.1–+0.2 psu depending on the product. In the high latitudes of the Indian Ocean (#12,
Figure 13f), the agreement in the timing and amplitude of the seasonal cycles of all satellites is much better than in the other Southern high latitudes, especially for SMAP V3, but some biases and too salty peaks still occur.
The latest version of the SMAP RSS product (V3) shows improvements over V2 on multiple aspects. Both versions generally have a good agreement with Argo regarding the phase of seasonal variations, including small seasonal cycles in the gyres (#1, #6,
Figure 12a,f) and the larger variations in the meanders of the Amazon plume (#3,
Figure 12c). However, V2 tends to overestimate the amplitude of these variations at several locations (Gyres #1, #2 and equatorial Pacific #4,
Figure 12a,d,f), with peaks too salty by ~0.1 psu. V3 shows substantial improvement in the agreement of the peaks with Argo. In the North Pacific Gyre (#6,
Figure 12f), V2 is freshly biased (0.08 psu) and exhibits too large drops in SSS during the first half of the year. V3 improves the bias by 0.06 psu (now slightly too salty) and substantially improves the dynamic range of the seasonal variation by mitigating the drops. In the Amazon Plume (#3,
Figure 12c), both versions are generally in agreement, but V2 over-estimates the high salinities in the first half of the year, where V3 matches Argo better. However, the drops in V3 in July and October 2017 are still too large with SSS too low by more than 1 psu compared to Argo. As discussed previously, it is likely that differences in space and time sampling between satellite and in situ observations contribute to the differences in this highly variable region. The Tropical Indian Ocean (#10,
Figure 13d) is another variable region and V3 improves on the seasonal variations with SSS decreasing faster and lower after reaching peak value compared to V2 which has peaks that are too wide and underestimates the freshening early in the year by ~0.15 psu. There are a few locations where the seasonal cycles differ between satellite and in situ. In the South Pacific gyre (#5,
Figure 12e), V2 exhibits large peaks (Apr 2016, March 2017) not present in Argo. V3 improves SMAP SSS here, but there are still some large variations (e.g., 0.25 psu drop in May 2017) not agreeing with Argo. In the North Pacific high latitude region (#7,
Figure 13a), V2 seasonal cycles peak too late compared to V3 and Argo. V3 cycles are in better phase but peaks are too salty. The South Indian gyre (#8,
Figure 13b) also shows very substantial improvements in the seasonal cycles of V3 compared to V2 that shows largely overestimated drops in SSS during the southern hemisphere spring, and too fresh peaks early in the year. Finally, all the southern high latitude locations exhibit a significant discrepancy between SMAP SSS (both versions) and Argo, with satellite SSS more variable than in situ. V3 improves on V2 in the high latitudes of the Atlantic (#11,
Figure 13e) and Indian (#12,
Figure 13f) oceans in terms of bias and slightly in terms of variations. Over all the ROI, V3 reduces the average difference between SMAP SSS and Argo by 0.02–0.11 psu compared to V2 (
Table 7), with the mean reduction being 0.07 psu. Its impact on the standard deviation of the difference between SMAP and Argo is relatively small, a reduction of ~0.01 psu on average with larger reductions of 0.023 and 0.033 psu in the North Pacific High latitudes (#7) and Tropical Indian Ocean (#10). This small value is to be compared to the small natural variation of SSS itself, which shows standard deviations of less than 0.2 psu at most locations. In addition, SMAP V3 either improves peaks and troughs, that involve few data points, or corrects biases, limiting its impact on a metric like the standard deviation.


