Article

Quantitative Evaluation of Spatial and Temporal Variation of Soil Salinization Risk Using GIS-Based Geostatistical Method

1
Key Laboratory of Wisdom City and Environment Modeling of Higher Education Institute, College of Resources and Environmental Science, Xinjiang University, Urumqi 830046, China
2
Key Laboratory of Oasis Ecology, Xinjiang University, Urumqi 830046, China
3
Commonwealth Scientific and Industrial Research Organization Land and Water, Canberra, ACT 2601, Australia
4
School of Humanities, University Sains Malaysia, George Town 11800, Penang, Malaysia
5
Department of Earth Sciences, the University of Memphis, Memphis, TN 38152, USA
*
Author to whom correspondence should be addressed.
Remote Sens. 2020, 12(15), 2405; https://doi.org/10.3390/rs12152405
Submission received: 4 June 2020 / Revised: 17 July 2020 / Accepted: 24 July 2020 / Published: 27 July 2020

Abstract

:
Soil salinization is one of the environmental threats affecting the sustainable development of arid oases in the northwest of China. Thus, it is necessary to assess the risk of soil salinity and analyze spatial and temporal changes. The objective of this paper is to develop a temporal and spatial soil salinity risk assessment method based on an integrated scoring method by combining the advantages of remote sensing and GIS technology. Based on correlation coefficient analysis to determine the weights of risk evaluation factors, a comprehensive scoring system for the risk of salinity in the dry and wet seasons was constructed for the Ebinur Lake Wetland National Nature Reserve (ELWNNR), and the risk of spatial variation of soil salinity in the study area was analyzed in the dry and wet seasons. The results show the following: (1) The risk of soil salinity during the wet season is mainly influenced by the plant senescence reflectance index (PSRI), deep soil water content (D_wat), and the effect of shallow soil salinity (SH_sal). The risk of soil salinity during the dry season is mainly influenced by shallow soil salinity (SH_sal), land use and land cover change (LUCC), and deep soil moisture content (D_wat). (2) The wet season was found to have a high risk of salinization, which is mainly characterized by moderate, high, and very high risks. However, in the dry season, the risk of salinity is mainly characterized by low and moderate risk of salinity. (3) In the ELWNNR, as the wet season changes to dry season (from May to August), moderate-risk area in the wet season easily shifts to low risk and risk-free, and the area of high risk in the wet season easily shifts to moderate risk. In general, the overall change in salinity risk of the ELWNNR showed a significant relationship with changes in lake water volume, indicating that changes in water volume play an important role in the risk of soil salinity occurrence. Ideally, the quantitative analysis of salinity risk proposed in this study, which takes into account temporal and spatial variations, can help decision makers to propose more targeted soil management options.

Graphical Abstract

1. Introduction

As the world’s population grows, there will be increased demand for land available for agricultural production to meet human needs in the future. For arid regions, saline soil areas are important agricultural soil reserves [1,2]. However, soil salinization is a serious problem, limiting agricultural productivity and plant distribution to the detriment of the ecosystem, resulting in the deterioration of water quality and the reduction of biodiversity in the surrounding waters [3]. Soil salinity formation falls into two broad categories: natural primary salinization and anthropogenic secondary salinization [4]. Natural primary salinization is the mobilization of salts from the soil or groundwater to the surface by some or a combination of factors, resulting in a high-salinity environment [5]. Anthropogenic secondary salinization is the result of improper agricultural water use, which increases the salt levels in the soil surface layer [4]. The two soil surface salinity processes are similar, while the causes of formation and risk-driving mechanisms are different [6]. Remarkably, anthropogenic secondary salinization can mitigate irrigation salinity through improved human agricultural production management systems [7]. The drivers of natural primary salinization, however, exhibit variability across time and space, which affects the assessment and management of soil salinity [8].
Prior to the 1970s, soil salinization was investigated primarily through sampling in the field, a time-consuming and laborious task [2]. However, with the rise of remote sensing and geographic information technology, more options became available for monitoring saline lands [9]. In the absence of sufficient data, such as surface temperature, vegetation cover, etc., remote sensing (RS) data can acquire and collect contemporaneous surface information to analyze spatial and temporal variations in surface information at the regional scale [10]. RS and geographic information system (GIS) technologies can detect variations in soil salinity, providing important technical support for the dynamic monitoring and quantitative assessment of soil salinity risk, as they can produce effective information in a macro, dynamic, and rapid manner [10,11]. Using the advantages of RS and GIS, researchers have done a great deal of work on salinized soil monitoring and have developed highly accurate and time-sensitive methods for monitoring salinization [9,12,13,14]. This has greatly facilitated the development of soil salinity monitoring over large areas.
Salinity mapping can objectively characterize salinity distribution, but reference to soil distribution mapping alone is of limited assistance to decision makers [15]. When assessing the capacity of agricultural practices and environmental impacts, the comprehensive consideration of saline soil formation mechanisms and influencing factors is more conducive to enhancing the sustainable use of natural resources [16]. As a result, many researchers have proposed multiple indicators to quantify the risk of salinization [17,18], providing a basis for evaluating the possible impact of factors with uncertainty on the soil salinization process. Ren et al. [15] analyzed the spatial and temporal characteristics and influencing factors of soil salinity at three scales based on sampling data, remote sensing, geostatistical analysis, and model simulations. They found that, at the regional scale, the distribution of soil salinity is mainly influenced by topography and groundwater depth. Castrignanò et al. [8] used a probabilistic method based on multivariate ground statistics to model the spatial variation of soil salinity risk and to delineate areas of high soil salinity risk. Zhou et al. [6] developed a soil salinity risk assessment method and showed that salinity risk in the Yinchuan Plain is mainly influenced by subsoil and groundwater salinity, land use, distance from irrigation canals, and groundwater depth. Of these, the concept of comprehensive soil salinization grading method has been mentioned several times: it is a scientific method that uses a linear model to weigh and sum a set of risk factors to generate a salinity risk index and a salinity risk map [8,16,19]. Overall, the composite index approach is based on the following assumptions: (1) The process of soil salinization is influenced by multiple factors, known as “driving factors” (or “influencing factors”). We believe that there is a functional relationship between the “driving factor” and the degree of salinization. (2) Factors can be assigned different weights depending on the degree to which they drive the salinization process. (3) The weighting of the driving factors yields values (dimensionless) that can express the degree of risk of salinization [6].
Following the proposal of the comprehensive soil salinization grading method, the method has been widely used in soil risk assessment in various countries and regions [18]. However, soil salinity is driven by different factors in different study areas, depending on climatic and topographic conditions [16]. In addition, the analysis of salinity risk in the area is inadequate if the data are only available for one period and do not take into account dynamic factors such as different seasons, vegetation cover, and water volume [19]. Risk analysis of soil salinity based on temporal and spatial variation provides a better explanation of landscape characteristics, the interaction of physical attributes of the landscape, and changes in land use and management [6]. This paper attempts to answer the following questions: What are the different sources of risk of soil salinity in the wet and dry seasons? Does the risk of salinization vary with the season? Does the growth of vegetation have an influence on soil salinization? This paper is focused on these questions and their answers.
In this study, for ELWNNR as a study area, with a combination of fieldwork and laboratory experiments, soil surface salinity content was used as an important indicator for salinity risk assessment. Furthermore, RS and GIS techniques were used to obtain spatial datasets of evaluation factors, and a variety of factors were selected for analysis as drivers of soil salinity. Based on the correlation coefficient analysis to determine the risk weights of evaluation factors, the comprehensive soil salinization grading method was introduced to construct a comprehensive risk scoring system, in order to build a soil salinization risk evaluation model and analyze the spatial variation risk of salinization. It is a logical next step to explore the risk relationship between dry and wet seasons, so that the temporal and spatial causality between risk factors and soils can be better understood. Additionally, since ELWNNR is located in the “wind channel” of Alashankou, the salt dust generated poses a threat to the ecological environment and agricultural production, with the constant northwesterly winds transporting the salt dust to reach the oasis in the northern Tianshan Mountains [20]. Exploring the risk of salinization in the ELWNNR region is of vital importance for ecological improvement and sustainable development of natural resources.
Ideally, a quantitative analysis of salinity risk that takes into account temporal and spatial variation, as presented in this study, could help decision makers propose more targeted soil management options. In the present study, the proposed method was applied to the case of natural primary salinity in arid regions. However, the natural primary and anthropogenic secondary salts are identical in terms of landscape formation, except for differences in formation and driving mechanisms. The method could be applied to irrigated areas with secondary salinity with a view to supporting sustainable development of agriculture and water resources.
Specifically, this study aimed: (1) to analyze the relationship between soil salinity influencing factors and surface soil salinity to obtain ELWNNR soil salinity risk; (2) to explore the advantages of Sentinel-2 MSI and Landsat-8 OLI data in soil salinity factor inversion; (3) to monitor and map soil salinity risk in wet and dry seasons in Ebinur Lake region; and (4) to compare the differences between wet and dry season soil salinity risk drivers and analyze their causes.

2. Study Area

Located in the southwest of Junggar Basin, ELWNNR is the convergence center of Bortala and other inland rivers. It is also one of the important wetlands in Xinjiang Uygur Autonomous Region [21,22]. The landscape types are diverse, with biological rich species that have strong response characteristics in the evolution of the regional environment [23]. It is not only one of the few concentration areas of desert species in China’s inland deserts, but also the key area of eco-environment changes in Junggar Basin [23]. The shrinking water area of ELWNNR and the intensified damage to the eco-environment have caused a series of environmental problems, which are mainly due to the rapid increase in population and expansion of the economy in the area around Ebinur Lake basin in recent years, the increase of water consumption and other factors [22]. With the action of wind, frequent salt dust storms occur in ELWNNR, making the lake area the main salt accumulation area. Increasingly, soil salinization has gradually become one of the main forms of environmental degradation in the ELWNNR [21] (Figure 1).

3. Data and Methodology

3.1. Investigation and Analysis of Field Data

Based on the spatial distribution characteristics of the ELWNNR landscape and spatial differences in soil salinity, field samples were collected in May 2018 (wet season) and August 2018 (dry season), respectively. Soil samples of topsoil (0–10 cm), shallow soil (20–40 cm), and deep soil (60–80 cm) were collected and the relevant parameters were measured (soil salt content and soil water content). In total, 42 soil samples were collected in May 2018 and 45 soil samples were collected in August 2018. Soil samples were sealed in plastic bags and taken back to the laboratory. Then, the soil was dried naturally, ground, and sifted using a 2-mm hole sifter. The ground sample was made into an extract with a ratio of 1:5 soil water mass, and the total salt content of the sample was determined by a TZS-EC-I soil salinity meter (Zhejiang Top Instrument Co, Ltd., Hangzhou, China). The soil salinity value was divided into five grades according to the “working outline of Xinjiang county-level salinization land improvement and utilization planning” issued by the Xinjiang water resources department and the soil salinity data of samples [24] (Table 1). Soil moisture was measured by oven drying method. During field sampling, soil samples were collected using an aluminum specimen box and weighed. The soil moisture in the aluminum box was then dried in a drying oven. Finally, the dried aluminum specimen box was weighed and calculated to obtain the water content of the soil (in percent).

3.2. Acquisition of Remote Sensing and Digital Elevation Model Data

Optical remote sensing data from the concurrent field surveys Landsat-8 OLI and Sentinel-2 MSI were selected for this study to invert the drivers of soil salinity risk. Sentinel-2 MSI image data were acquired in the wet season (20 May 2018) and dry season (28 August 2018), and Landsat-8 image data were acquired in the wet season (27 May 2018) and dry season (31 August 2018). Landsat-8 OLI and Sentinel-2 MSI data were obtained from https://earthexplorer.usgs.gov/ and https://scihub.copernicus.eu/, respectively. Sentinel-2 data and Landsat-8 have their advantages (File S1). Among them, Sentinel-2 MSI has a higher spectral resolution, while Landsat-8 OLI has a thermal infrared band. The RS data were pre-processed by means of radiometric calibration, atmospheric correction, stitching, cropping, and geometric correction to obtain images of the study area. In addition, Digital Elevation Model (DEM) data were downloaded with LocaSpaceViewer4 (Suzhou Zhongketuxin Network Technology Co. LTD., Suzhou, China) software to provide high-precision data source for slope and aspect direction inversion (12 m).
Terrain variables derived from DEM indicate the direction of water movement in the soil directly or indirectly as well as the change of accumulation mode and location of soil salt [25]. Therefore, it is reliable to take elevation, slope, and aspect (DEM, S_slo, and S_asp) as some of the influencing factors of salinization process. The elevation, slope, and slope direction of the study area do not vary with the seasons, and the spatial distribution topographic map is shown in Figure 2. As can be seen in the map below, Ebinur Lake is at the lowest elevation, while the northern and southeastern parts of the lake are mountainous and higher. In addition, the slopes in the lake area are less steep, while the mountains are steeper.

3.3. Selection of Risk Sources for Salinization

On the basis of the existing research results and referring to the actual situation and historical data of the research area [26,27,28], the intensity and range of various salinization risk sources were summarized, and the risk factors that represent the actual situation of the research area were selected. Considering many factors such as the integrity of the data in the study area and its representativeness, the authors chose the surface temperature, the surface elevation, the surface slope, the surface aspect, the normalized differential vegetation index, the plant senescence reflectance index, the land-use and land-cover change, the surface soil water content, the shallow soil salt content (20–40 cm, g/kg), the shallow soil water content (20–40 cm, %), the deep soil salt content (60–80 cm, g/kg), and the deep soil water content (60–80 cm, %) as risk sources, for a total of 12 factors. The surface soil water content, the land-use and land-cover change, the soil salt content of soil in shallow depth, the soil water content in shallow depth, the soil salt content of soil in deep depth and the soil water content in deep depth, i.e. a total of 12 salinization risk sources, were used to establish salinization risk evaluation index system (Table 2).

3.4. Experimental Research Methods

3.4.1. Correlation Coefficient Analysis and Test Method

Correlation analysis is the traditional method of studying correlations between the random variables, that is, examining whether there is a dependency between the phenomenon and discussing linearly the direction and extent of the correlation [34]. The T-test can be used to test whether the correlation coefficient is Significant [35]. The specific calculation formula is as follows:
ρ X , Y = CON ( X , Y ) σ X σ Y = E ( ( X μ X ) ( Y μ Y ) ) σ X σ Y
t = n 2 × ρ X , Y 1 ( ρ X , Y ) 2
In the Formula (1): X and Y represent different variables, ρ X , Y is the value that describes the correlation between X and Y variables. The numerator is the covariance of X and Y , and the denominator is the product of the standard deviations of the two variables. In the Formula (2):   N represents the total number of variables X and   Y . When   T < T ( n 2 ) , the correlation coefficient is significant. MATLAB-R2014b (The Mathworks Inc., Natick, MA, USA) software was used to analyze the experimental data and draw a correlation map.

3.4.2. The Land Use Degree Index

Land use index is a parameter used to quantify land use/land cover change (LUCC), which mainly reflects the breadth and depth of land use [36]. The degree of land use is divided into several grades according to the natural balance state of the land natural complex, and the grading index is given. Quantitative expression of the land use degree index:
L = 100 × i = 1 n ( A i × C i )
In the formula:   L is the index of soil utilization degree; A i is the i grade land use degree grading index of the study area; C i is the percentage of land use grading area in the region; n is the gradation number of land use degree.

3.4.3. Spatial Interpolation Method

There are two main classifications of spatial interpolation methods: deterministic interpolation methods and geostatistical methods [37]. Kriging’s method is a geostatistical method that gives the best linear unbiased prediction (BLUP) and is therefore also known as a spatially optimal unbiased estimator in geo-statistics [37,38]. This method is commonly used in soil science and geology. The spatial variation of soil regionalization variables is caused by structural factors and random factors, and structural factors (climate, terrain, soil parent material, hydrogeological conditions, etc.) are the reasons for the spatial continuity of variables [39]. In this study, Kriging’s geo-statistics method is used to express the physical properties of soil spatially, which not only has the function of producing prediction surface, but also can provide some measure for the certainty or accuracy of prediction (File S2).

3.4.4. Comprehensive Soil Salinization Grading Method

The soil salinization comprehensive score method is a comprehensive evaluation system that takes into account multiple driving factors [6]. The continuous summation operation in the soil salinization comprehensive score method reflects the interaction between the evaluation indicators and the minimum factor limiting rate law. The model also takes into account the influence of the values of the evaluation indicators, the weights of the evaluation indicators, the interactions between the evaluation indicators, and the minimum factor limiting rate law on soil quality, which is more realistic [40]. The formula is as follows:
SQ = i = 0 n ( K i × Q i )
SQ = ( SQ     SQ _ min )   /   ( SQ _ max     SQ _ min )
In Formula (4), SQ is the soil salinization risk score, K i is the weight, and Q i is the different driving factors. In formula (5), SQ is the soil salinization risk score after normalization, with SQ _ min as the minimum and SQ _ max as the maximum. In this paper, Q i is a different driving factor of soil salinization. By establishing the evaluation standard of each element, the risk level is divided by the normalization method.

4. Results and Analysis

4.1. Statistical Analysis of Soil Samples

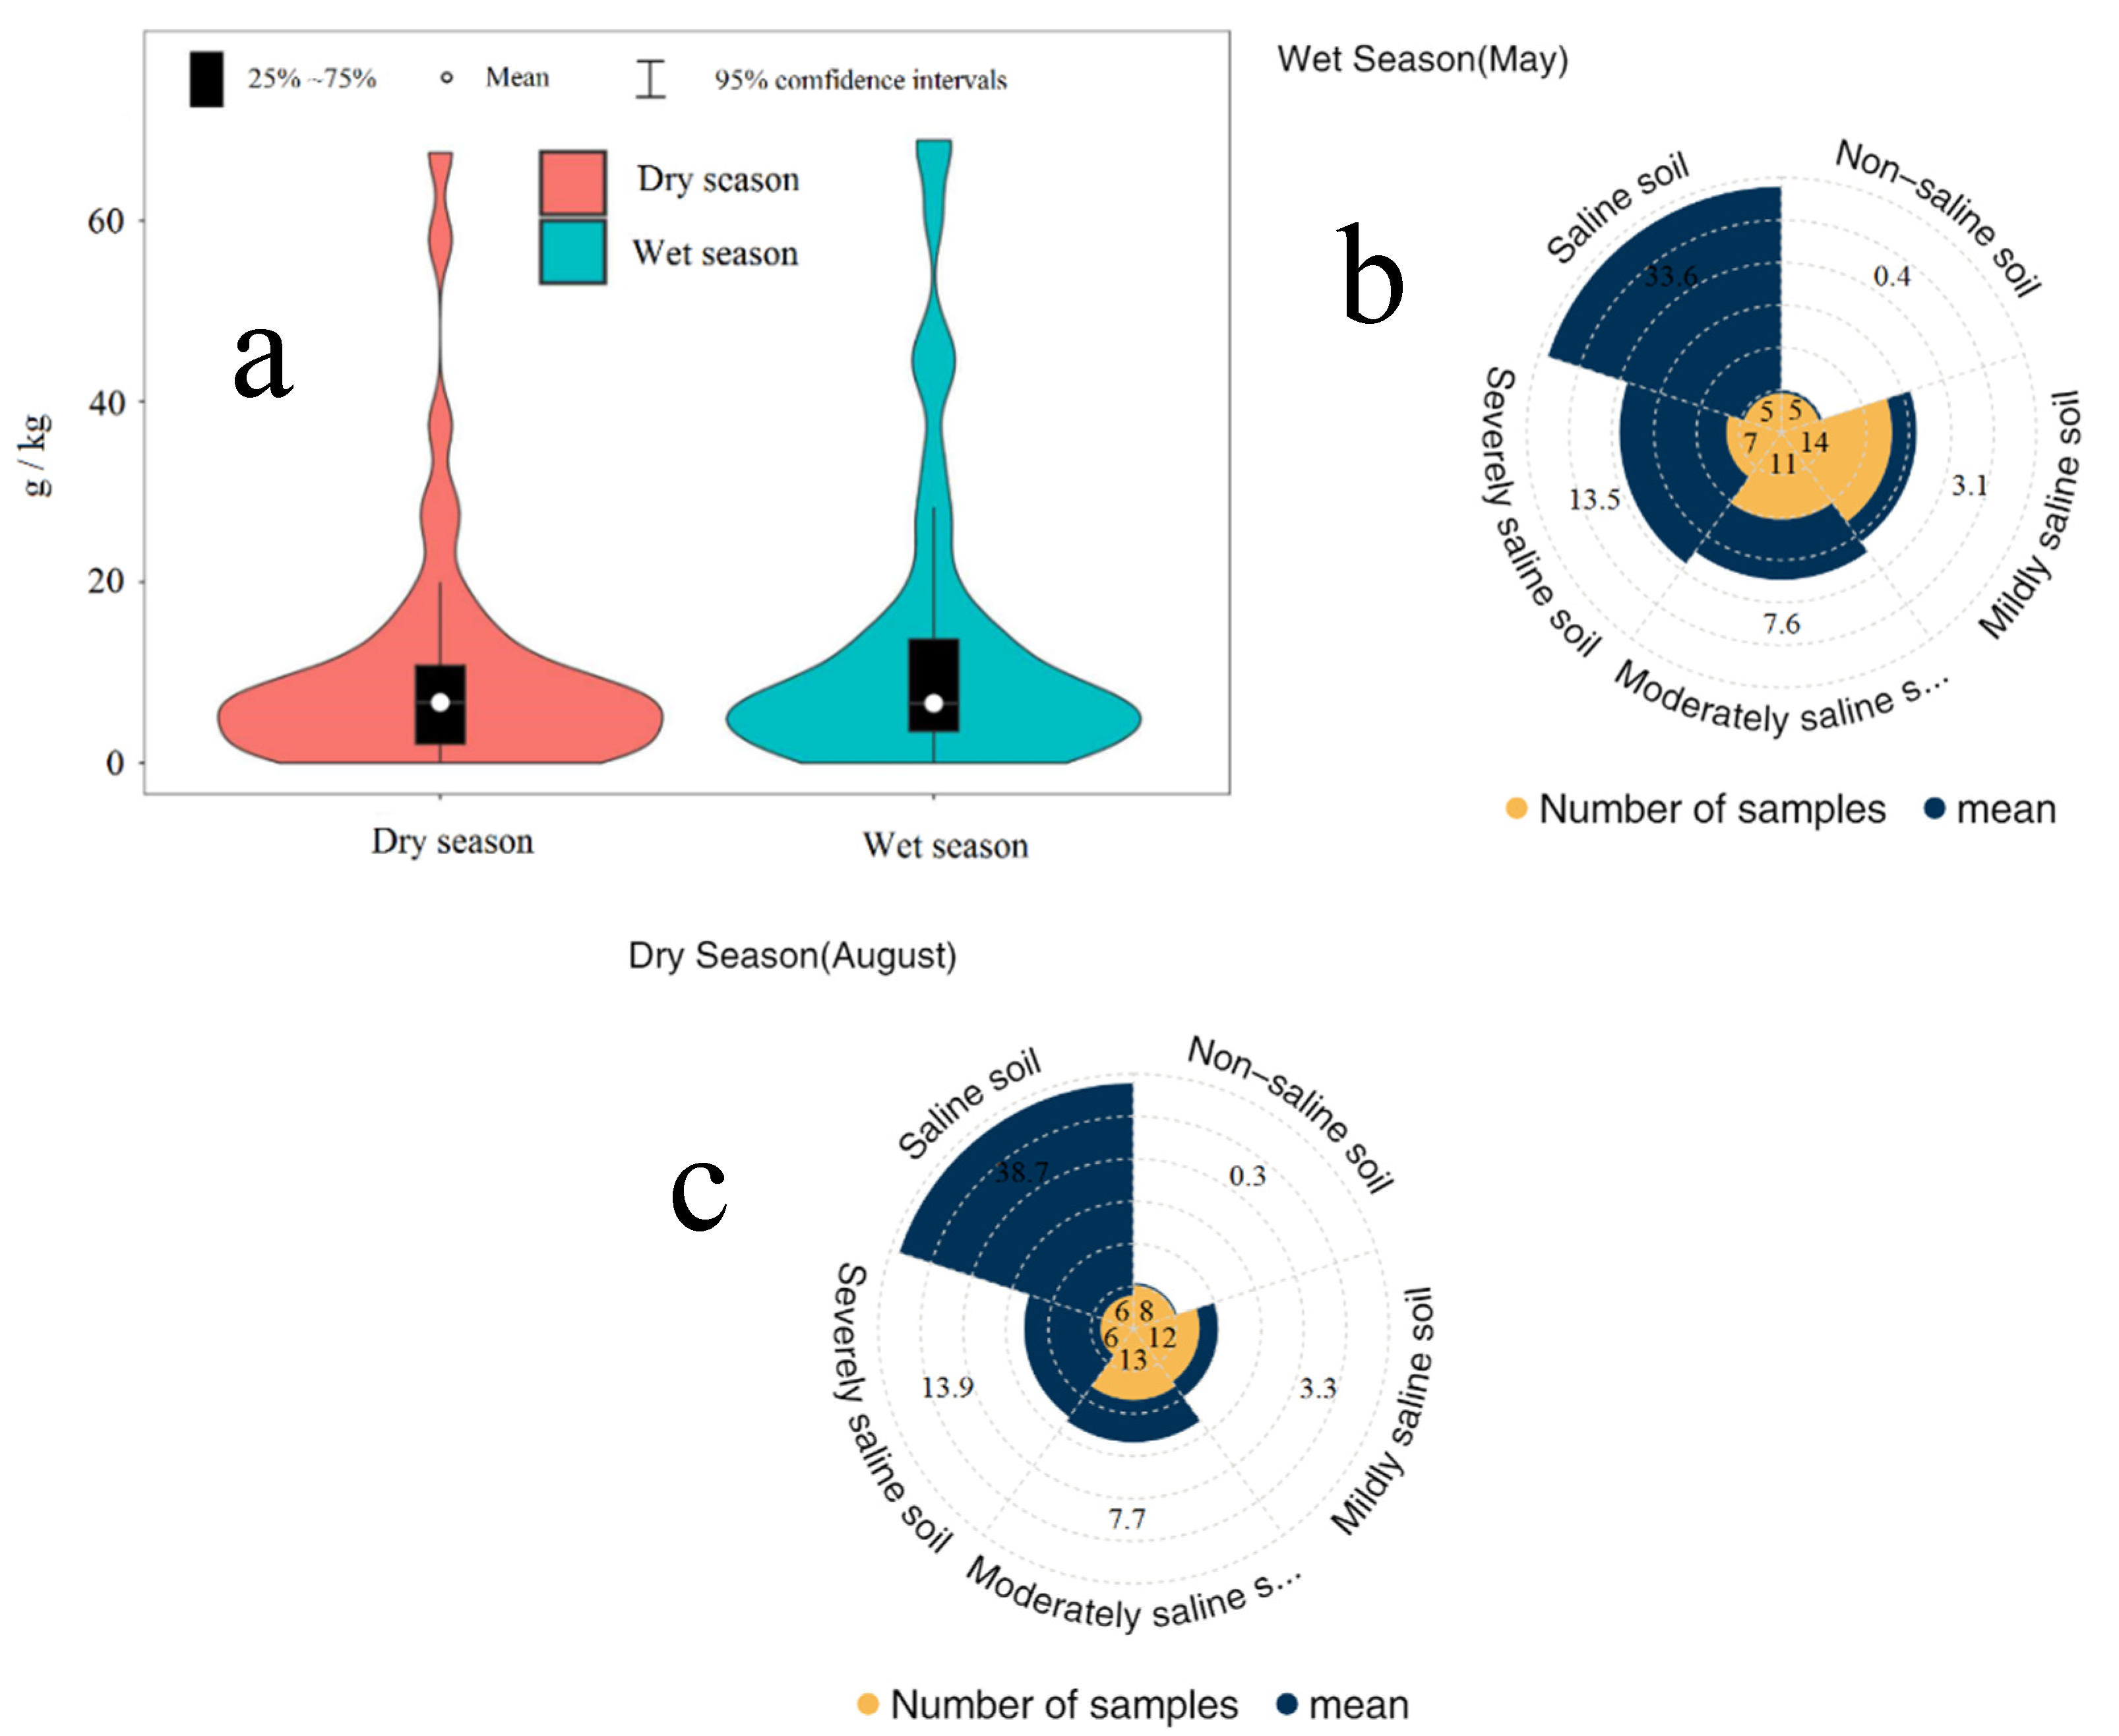
The salt content of the soil surface is the first factor in characterizing the risk of soil salinity; therefore, the statistical results of the surface salinity data are shown in Figure 3. Violin diagrams combine the characteristics of box diagrams and density diagrams and are mainly used to represent the distribution patterns of the data. The thick black line in the middle indicates the interquartile range and the thin black line in the middle indicates the 95% confidence interval. On the whole, there was little difference in the distribution of salinity between the dry and wet seasons, but the maximum value of surface salinity in the wet season was greater than in the dry season. The pie chart shows the distribution of the different types of salinized soils during the wet and dry seasons according to the salinized soil classification criteria in Table 1. The distribution of the values basically conforms to the normal distribution law. In the wet season, the number of mildly saline soil samples was the most, 14 in total, with an average of 3.1; in the dry season, the number of moderately saline soil samples was the most, 13 in total, with an average of 7.7.

4.2. Spatial Distribution of Salinization Influencing Factors

4.2.1. Vector Factor Analysis

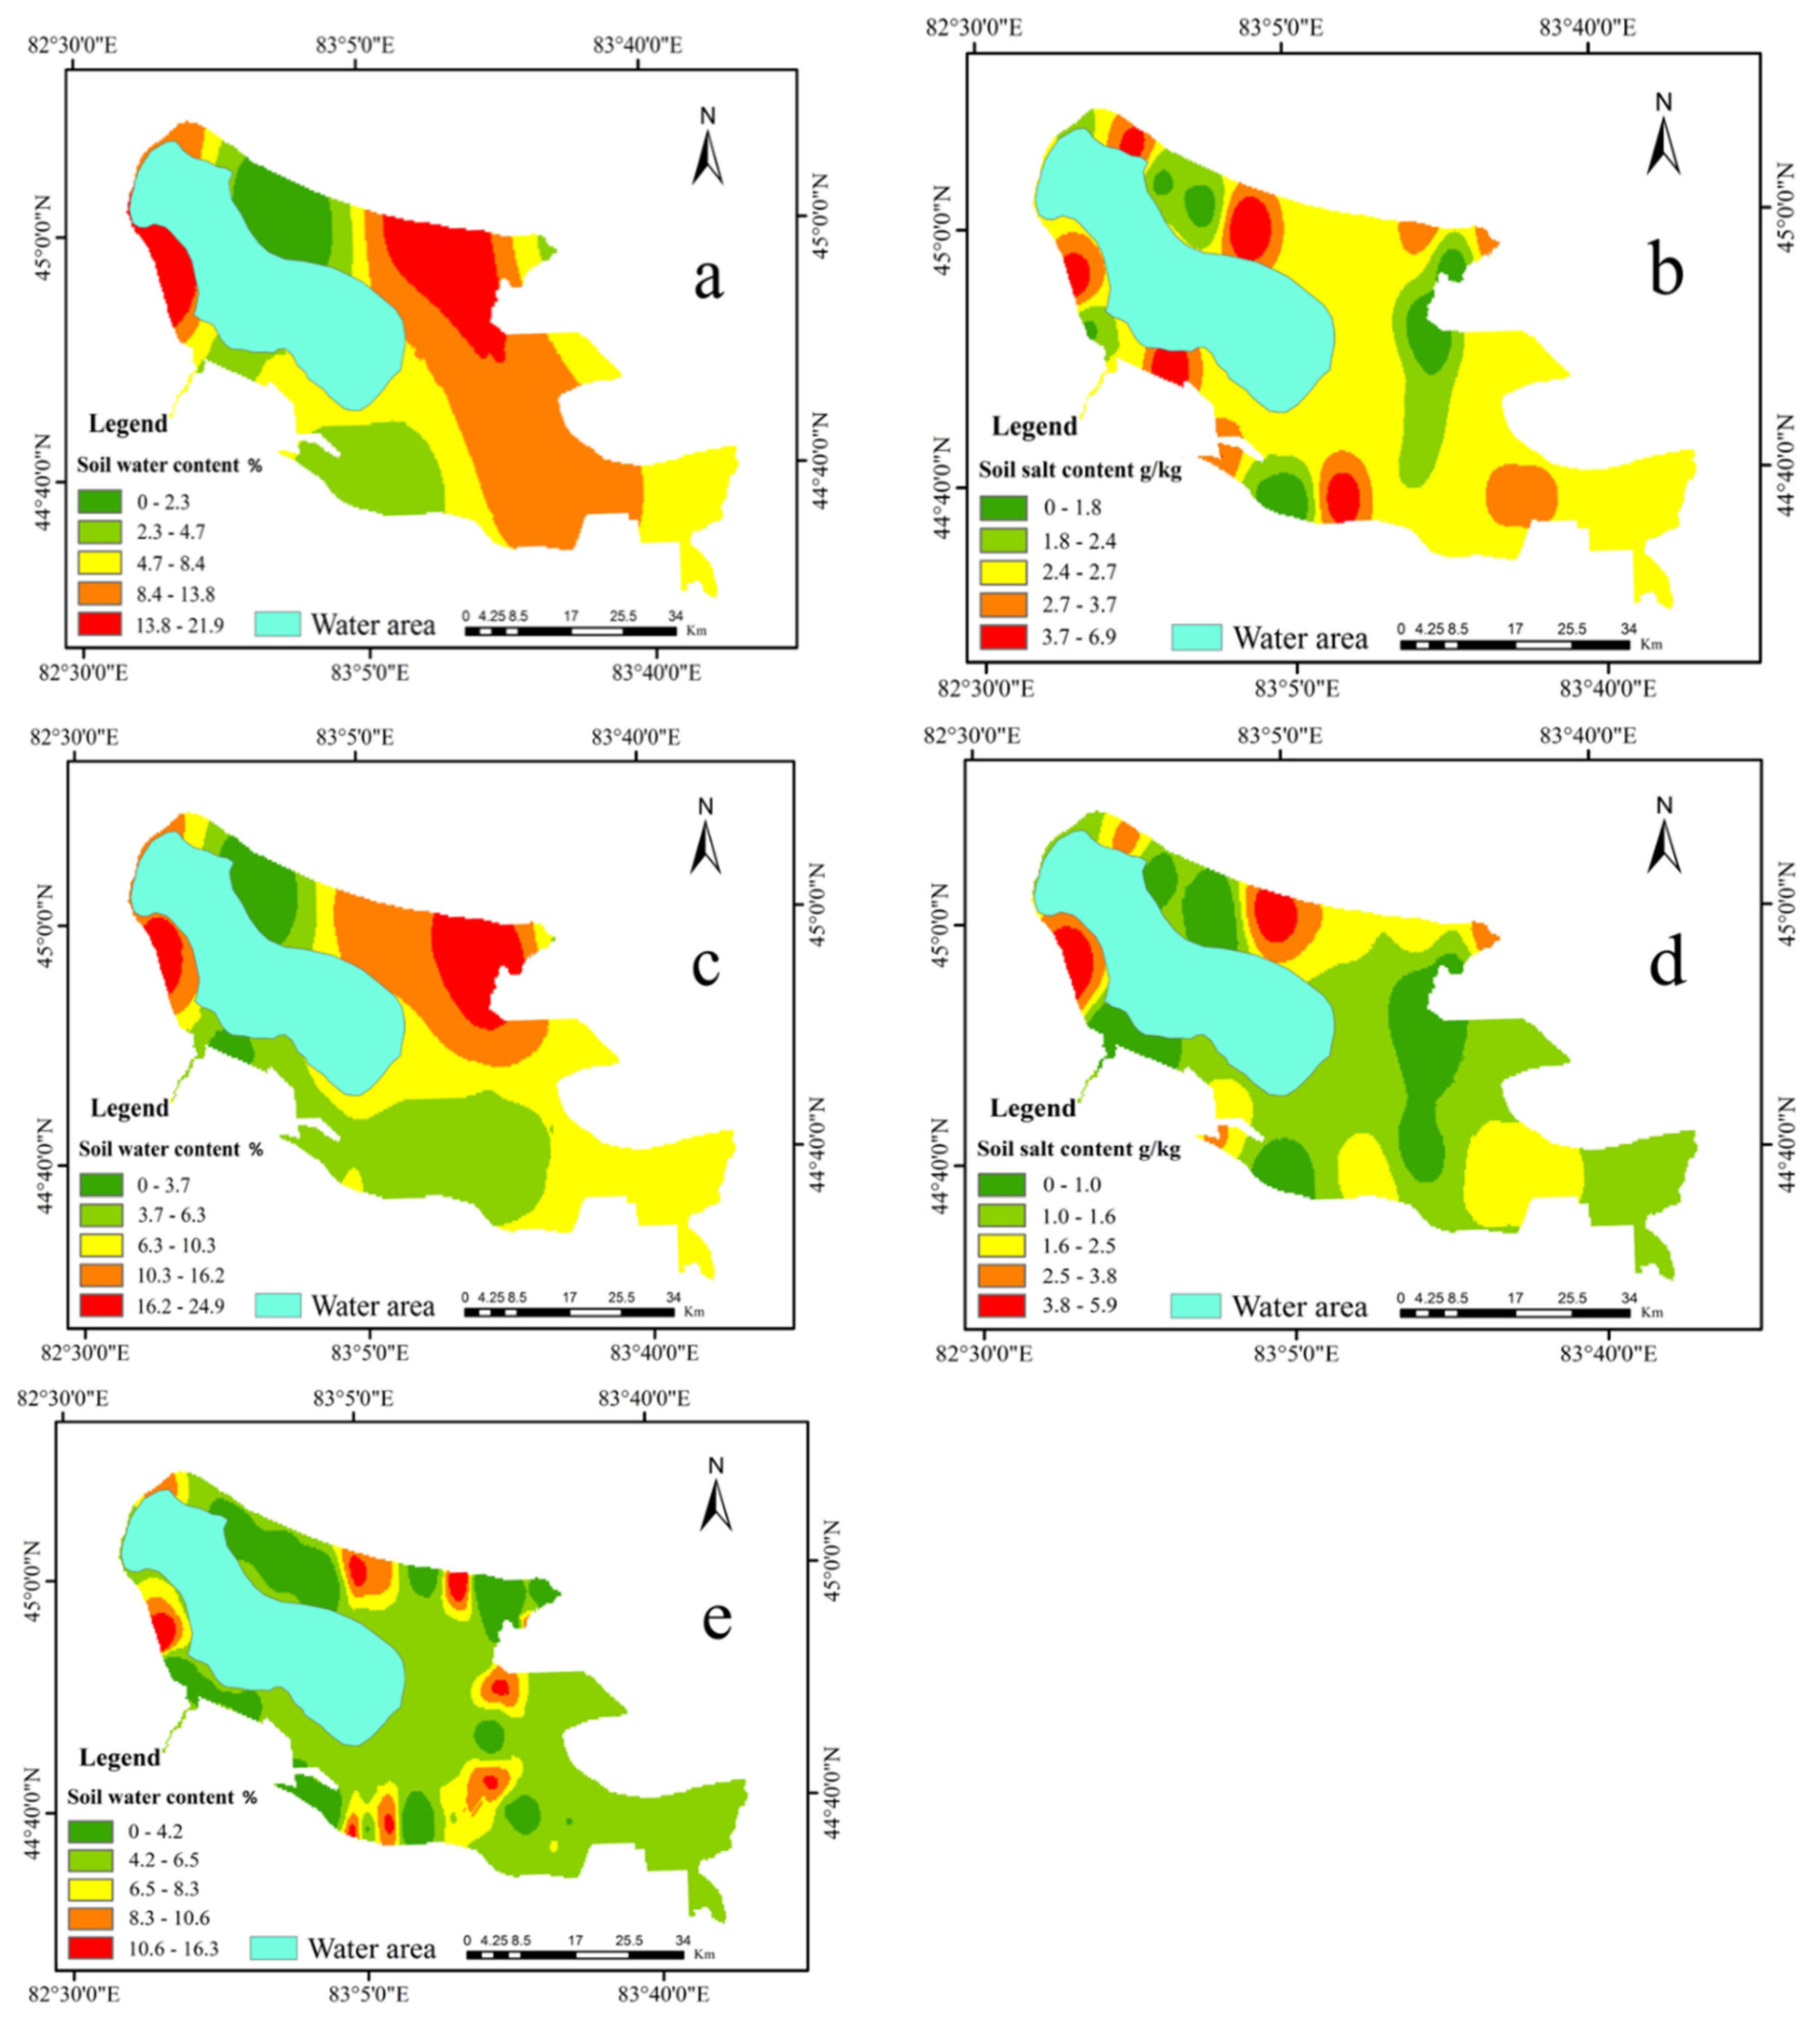
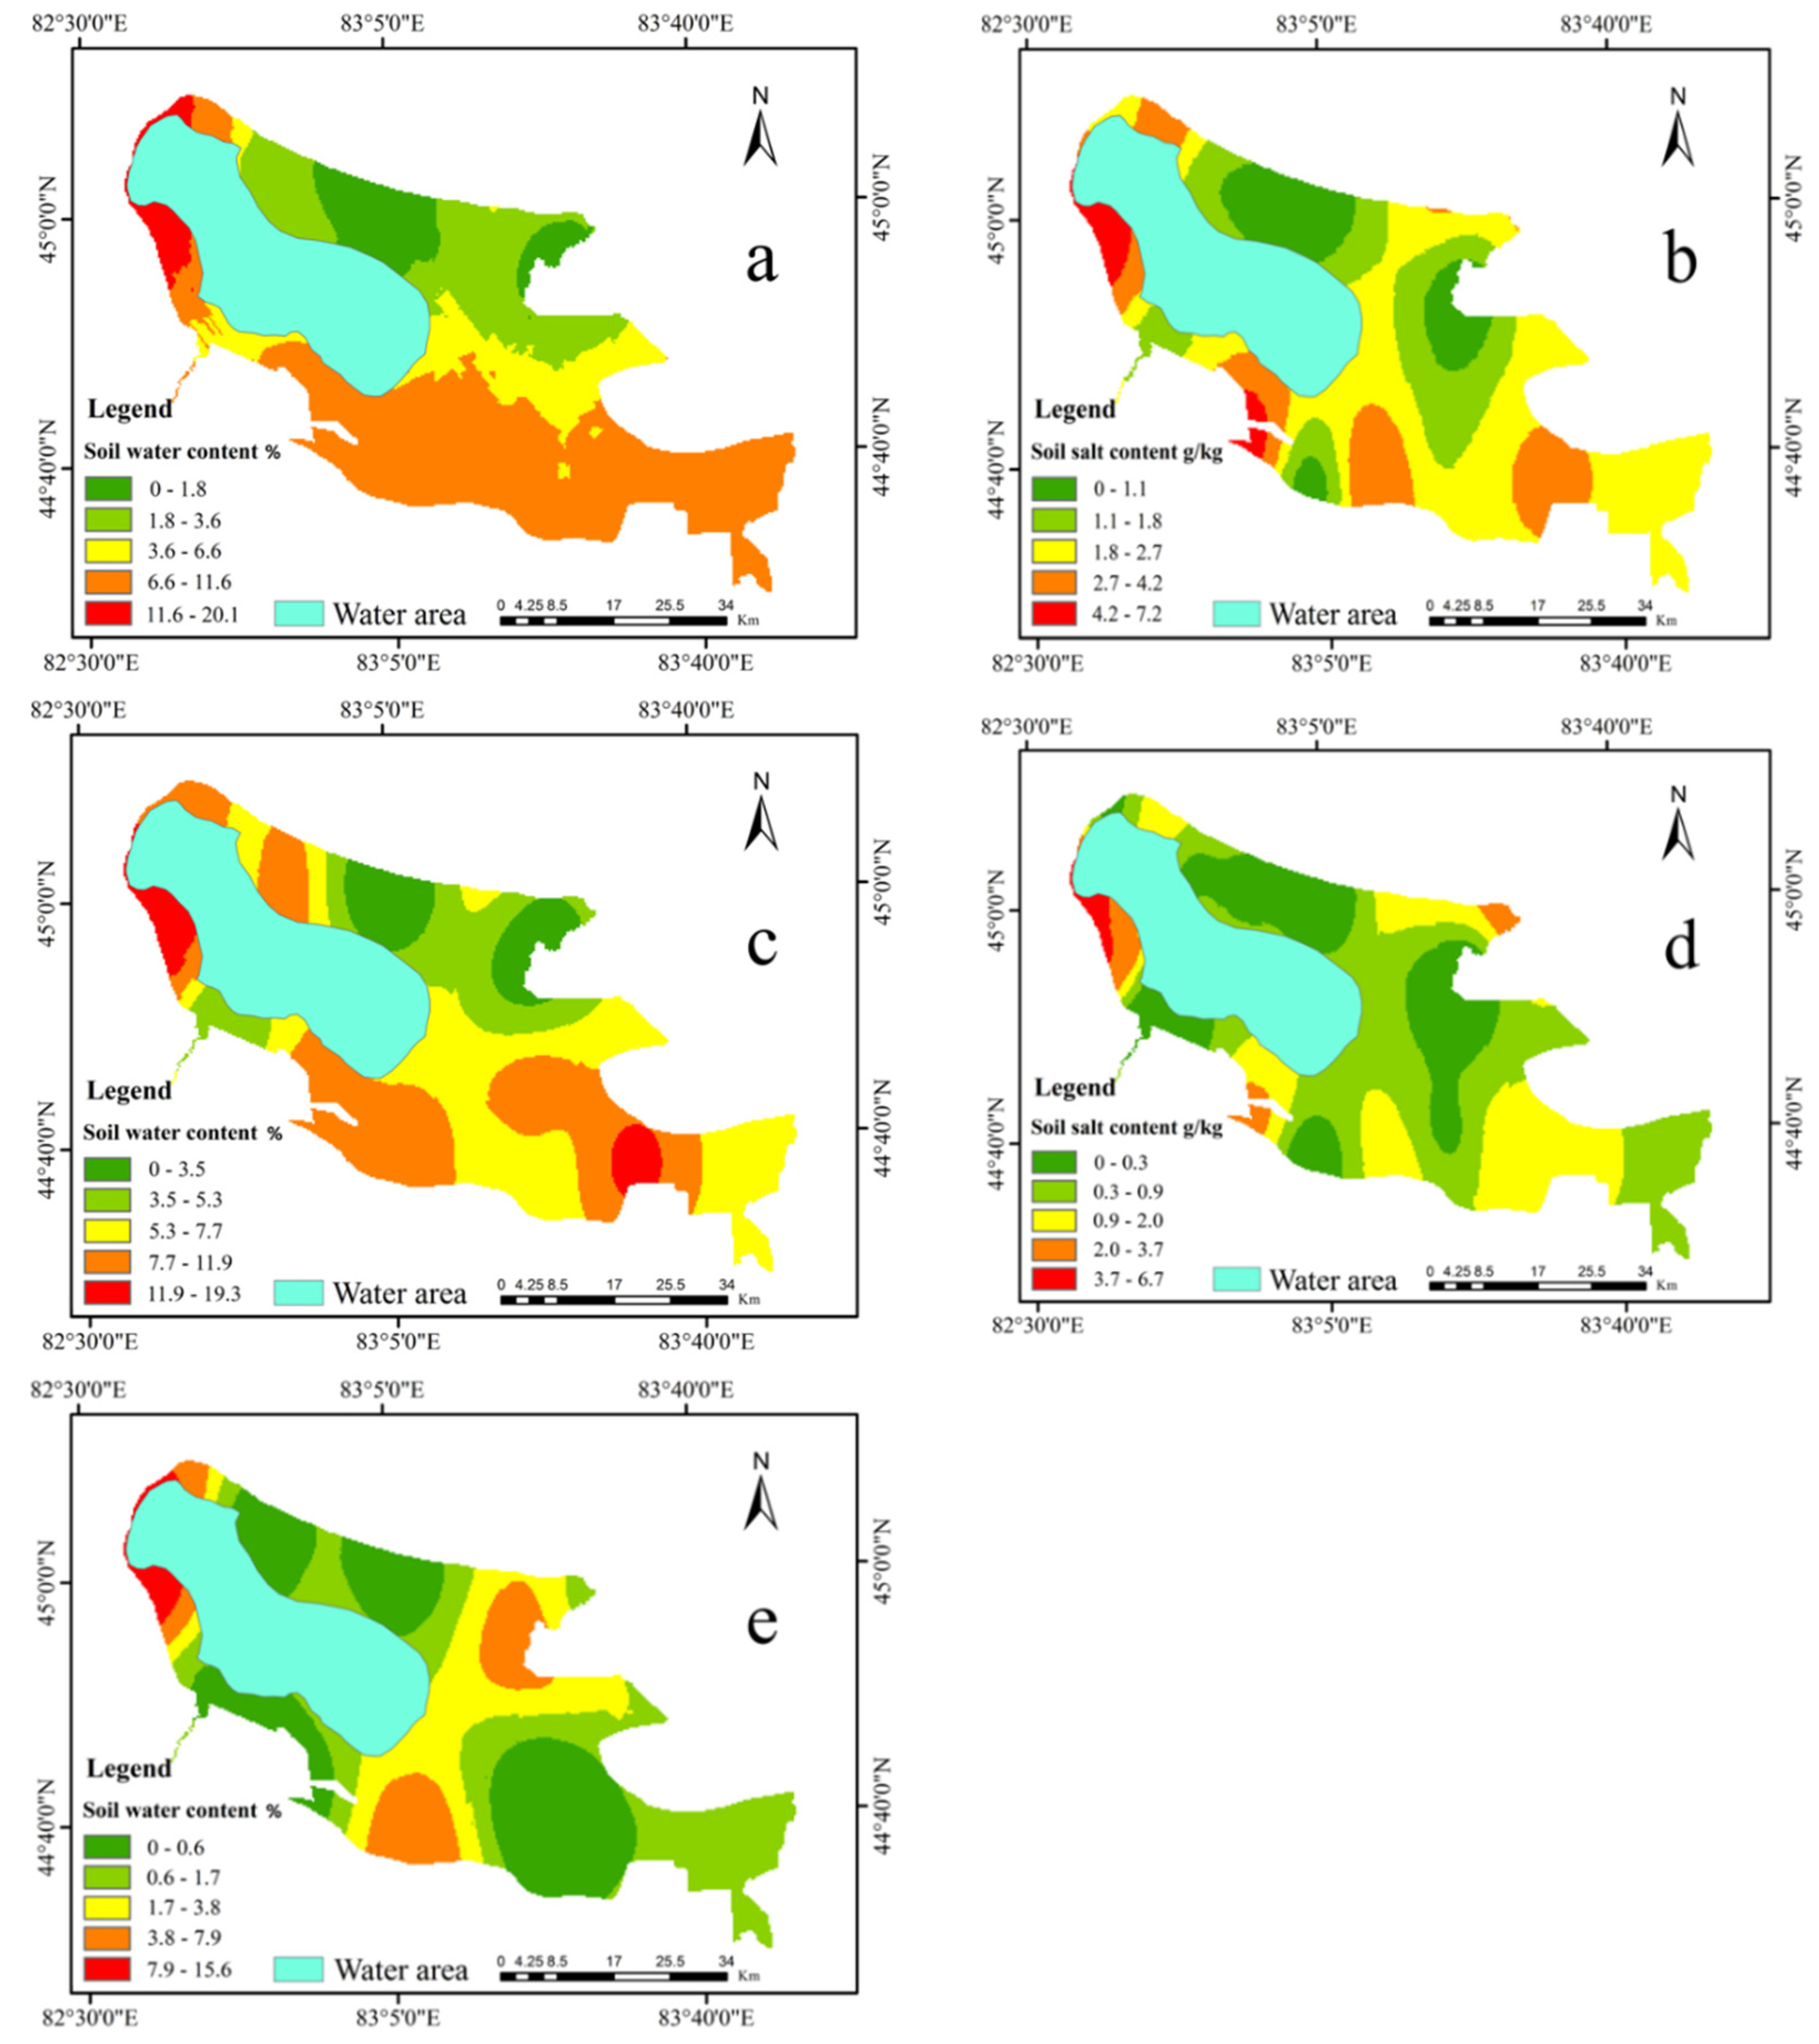
To generate visual spatial maps of salinity risk parameters, spatial interpolation of salinity risk factor data in the study area was used to transform point data into spatial data using the kriging spatial interpolation method. As the spatial expression of the kriging method on the physical properties of the soil provides predictive accuracy, selected kriging methods are suitable to reflect the spatial variation in the physical properties of the soil [11]. In this work, the root-mean-square and standardized median errors of the spatial distribution plots were less than 5.5 and −0.28, respectively. The spatial distribution diagram of influencing factors of salinization by GIS interpolation in wet season is shown in Figure 4. The spatial distribution diagram of influencing factors of salinization by GIS interpolation in dry season is shown in Figure 5.

4.2.2. Remote Sensing Factor Analysis

In this study, optical remote sensing data of pre-processed Landsat-8 and Sentinel-2 data (radiometric calibration, atmospheric correction, etc.) were selected to invert soil salinization risk factors including NDVI, S_tem, PSRI, and LUCC. As is known, NDVI is an index of planting, and its sensitivity will be reduced when Leaf Area Index (LAI) value is high, that is, when vegetation is dense [41,42]. PSRI is used to maximize the sensitivity of carotenoids to chlorophyll ratios (e.g., α-beta-carotene and β-beta-carotene). The increase of PSRI predicted the increase of canopy stress, the onset of vegetation senescence, and the maturation of plant fruits, indicating the health and degree of stress of vegetation to some extent [43]. Previous studies have shown that it was reliable to take NDVI, S_tem, and LUCC as the risk factors of salinization [44]. Maximum likelihood method was used to obtain the land-use/land-cover (LUCC) raster-plot of the study area [45]. To ensure its reliability, the precision of remote sensing inversion results was verified by combining the confusion matrix method and field investigation. The spatial distribution diagram of influencing factors of salinization by remote sensing in wet season is shown in Figure 6. The spatial distribution diagram of influencing factors of salinization by remote sensing in dry season is shown in Figure 7.
The main land cover types of ELWNNR are water, vegetation, lakeside area, mountain area, bare area, and desert area. Land-use type maps were obtained through field surveys and visual interpretation using the maximum likelihood method, and the accuracy of land-use type maps was assessed using the confusion matrix method [46]. Kappa accuracy of 94.58% for wet season land use type maps and 90.64% for dry season land use type maps were obtained. It was found from the two land use maps that the lake body area of Ebinur Lake has significantly decreased from the wet season [37] to the dry season (August), and there is a significant difference in water quantity between the dry season and the wet season, which is consistent with the research findings of Wang et al. [47]. The change of water quantity will lead to the change of other types of features, such as the increase of lakeside area. The vegetation growth environment will also be affected by the weakening effect of Ebinur Lake water on groundwater recharge [48].

4.3. Spatial Data Analysis

According to the different risk assessment factors selected, the statistical results of soil surface salinity and salinization risk assessment factors of all samples are listed. Specific values for soil physical property data are given in the Supplementary Materials (S_sal, S_wat, SH_sal, SH_wat, D_sal, and D_wat) (File S3), where the values in the LUCC represent only different feature types. The results are shown in the Table 3.
Table 3 shows that the numerical distribution of all salinization influencing factors is relatively uniform. In terms of terrain factor data, elevation ranges from 182 m to 269 m at wet season sampling sites and from 187 m to 289 m at dry season sampling sites, with maximum elevation differences do not exceed 102 m; the mean slope values at the sampling points were all less than 1.5; and there was little difference in mean slope orientation between the dry and wet season soil sampling sites, with slope orientations ranging from -1 to 360 (see the legend in Figure 2 for specific directions). In terms of vector factor data, the average wet season surface water content is 6.98% and the average dry season surface water content is 3.23%, indicating that wet season surface water content is higher than dry season surface water content; the mean values of SH_sal and D_sal are much lower than the mean value of S_sal (both wet and dry seasons); the regularity of the distribution of soil water content is that the mean value of D_wat is greater than SH_wat than S_wat (both wet and dry seasons). In terms of remote sensing factor data, the vegetation is in an active growth phase during the wet season with abundant precipitation. It can be seen from the data that the mean values of NDVI and PSRI are both higher in the wet season than in the dry season (the mean values of NDVI and PSRI were 0.38 and 0.18 in the wet season and 0.12 and 0.04 in the dry season, respectively); the mean value of S_tem in the wet season is higher than the mean value of S_tem in the dry season; and the soil use types distributed at the sampling sites were mainly vegetated areas, lakefront areas, mountainous areas, and bare areas.

4.4. Risk Weighting Analysis of Driving Factors

The magnitude of the role of risk evaluation factors in the overall composition of soil salinization risk is called the risk weight [49]. To assess the risk level of soil salinization in the study area, it is first necessary to consider the risk weights of the evaluation factors. With the aim of minimizing the excessive involvement of human subjective factors, this study used the correlation coefficient method to determine the weights of each evaluation factor for salinization risk [34]. Furthermore, the land use degree index was used to quantify the LUCC and to perform correlation analysis, which can further improve the reliability of the model. The correlation between soil salinization driving factors and surface salt was then established, and the correlation charts of dry and wet seasons were obtained, respectively (Figure 8).
In the wet season, the high correlation between SH_sal and D_sal reached 0.780; NDVI and LUCC were the next highest at −0.675; and LUCC and S_tem also reached 0.650. In the dry season, the correlation between SH_sal and D_sal was highest at 0.855; the correlation between PSRI and NDVI was next at 0.764; and the correlation between SH_sal and SH_wat also reached 0.647. Overall, the relevance of LUCC to NDVI was higher in both the dry and wet seasons, suggesting that, when land use patterns change, the vegetation cover changes accordingly. In addition, the D_sal and SH_sal correlations were higher in both the dry and wet seasons, indicating to some extent the spatial continuity of soil physical properties. Surface soil salinity (S_sal) is the main form of spatial expression of soil salinization risk and can serve as the primary sequence for evaluating soil salinization risk [15]. Thus, correlation coefficients and absolute values between the driving factor and S_sal were obtained. The weighting coefficient of salinization risk of 12 evaluation factors was obtained after the standardized treatment, as shown in Table 4.
In the wet season, the weight coefficients of salinization risk assessment factors were in the order: PSRI > D_wat > SH_sal > NDVI > SH_wat > LUCC > S_tem > S_slo > D_sal > S_wat > S_ele > S_asp. From the experimental results, the PSRI has the highest weight among the risk drivers of soil salinization in the wet season. In the dry season, the weight coefficients of salinization risk assessment factors were in the order: SH_sal > LUCC > D_sal > D_wat > PSRI > S_slo > SH_wat > NDVI > S_tem > S_ele > S_wat. The SH_sal has the highest weight among the risk drivers of soil salinization in the dry season. In general, LUCC, SH_sal, SH_wat, and D_wat are important drivers in both the dry and wet seasons. LUCC with a weight of 10.25% in the wet season and 13.45% in the dry season goes some way to suggest that changing the utilization mode of soil in the study area would be a means of improving salinized soils. SH_sal has a weight of 12.83% in the wet season and 18.24% in the dry season. From the experimental results, it was found that SH_sal has a greater effect on the soil salinization process relative to D_sal. For soil water, both SH_wat and D_wat have an important influence on the salinization process occurring on the surface. Furthermore, for the study area, S_tem and S_wat have a small weighting share and are not the main drivers of soil salinization in the area. Furthermore, the results show that the S_ele, S_slo, and S_asp directions have little effect on the soil salinization process in the study area. This may be due to the flat terrain of the ELWNNR areas, which does not play a major role in driving the process of soil salinization in the ELWNNR areas.

4.5. Spatial Distribution and Accuracy Verification of Soil Salinization Risk

The risk of soil salinization indicates the potential for soil salinization hazards and can provide early warning of soil salinization erosion [49]. In view of the soil salinization degree, distribution status and eco-environment status of the ELWNNR, the classification method adopted by relevant research is more suitable for the classification standard of soil salinization risk [6,44,50]. The risk level of salinization is mainly divided into five levels: risk-free area, low-risk area, moderate-risk area, high-risk area, and very high-risk area (Table 5).
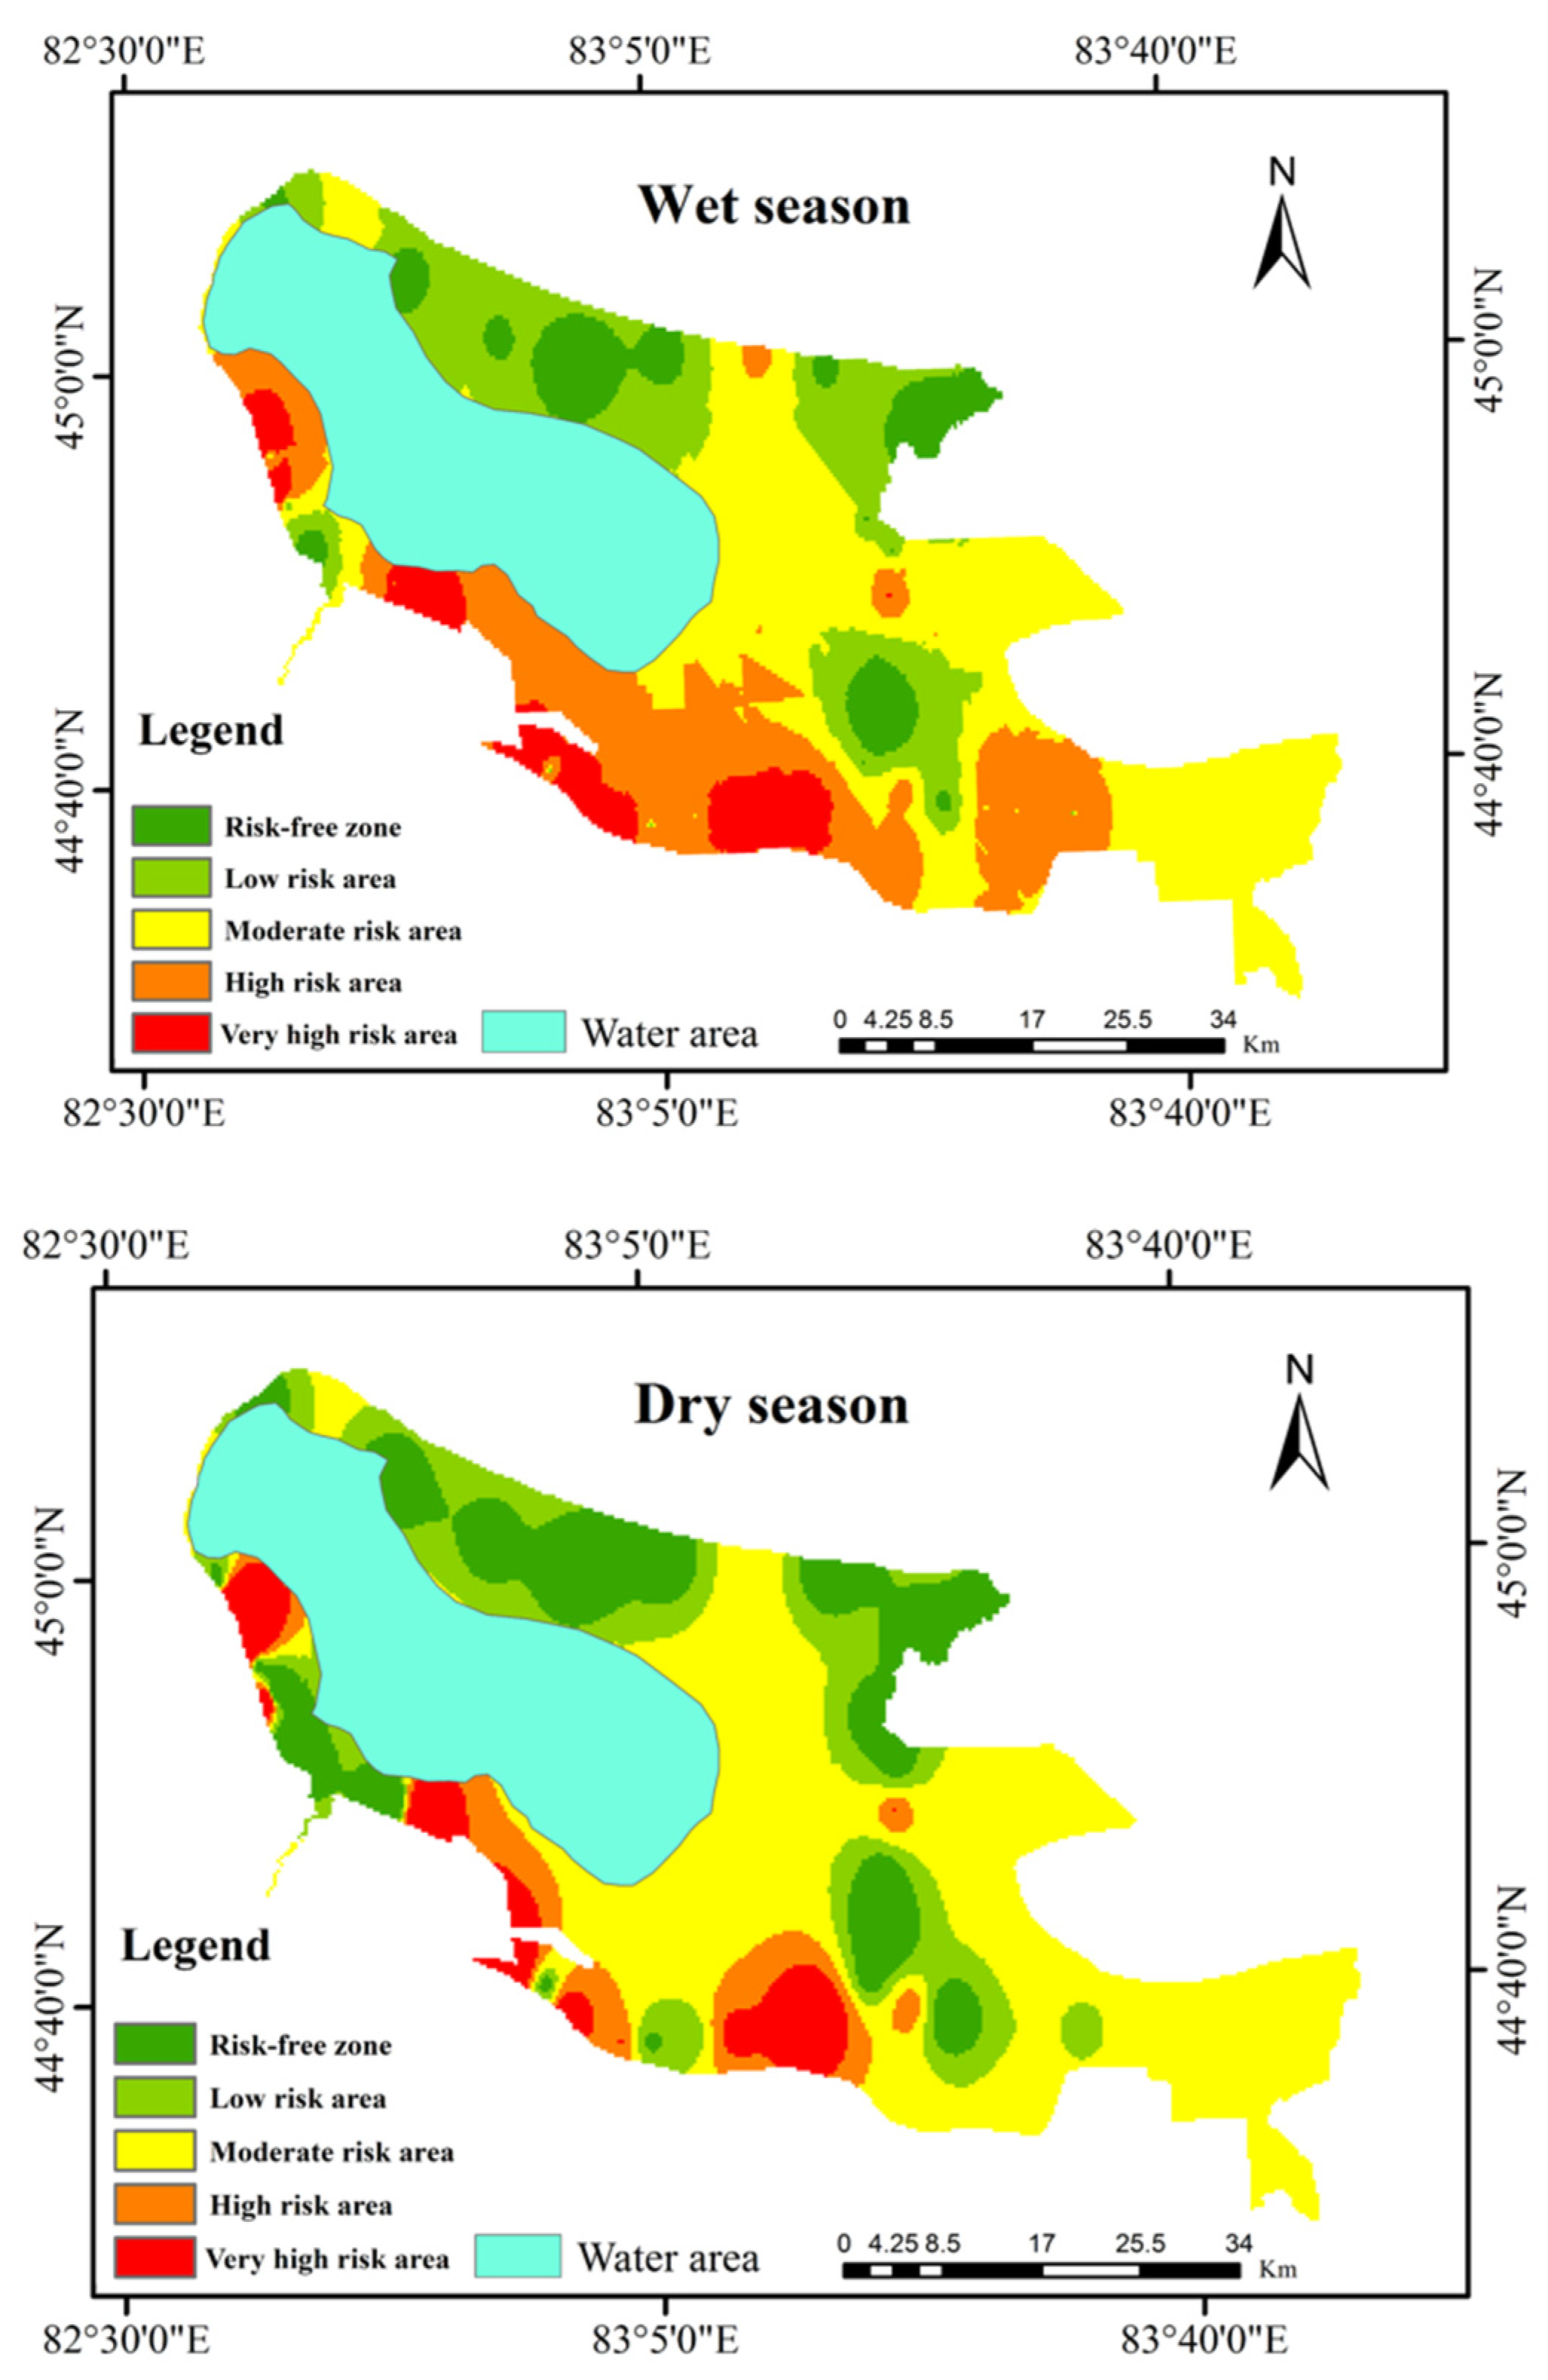
Table 5 shows that the largest area at risk of salinization in the wet season is the moderate-risk area with 36.96% of the area. The moderate-risk area is also the largest in the dry season with 57.79% of the area. To visualize the area at risk of salinization, the soil salinization evaluation model was established by the integrated soil quality scoring method, and the spatial distribution of the soil salinization risk was obtained using the kriging interpolation method. Finally, the spatial distribution of soil salinization risk was mapped according to the classification criteria.
Figure 9 shows that there are significant spatial differences in the risk of soil salinity in different areas of the study area. The ELWNNR is primarily at moderate risk. The high-risk and very high-risk areas are concentrated in the southern and western parts of the lake. Compared to other areas, the area has flat topography, low groundwater hydraulic gradients, and high groundwater content, creating a saline aggregate environment. The mountain region is primarily a risk-free area in the northern part of the study area. The main reason for this is the high terrain in the mountains and the very low water content of the shallow subsurface soil, which makes soil salinization less likely. In addition, the area is located in the inlet of the Atasu-Alazan Pass, where the ground surface is mostly sharply grained and lacks soil conditions for soil salinity. The results indicate that the risk of soil salinity is higher in the wet season than in the dry season.
Soil surface salinity (S_sal) is an important feature to verify the distribution of soil salinity risk, and the correlation between salinity risk and surface soil salinity can explain the reliability of the model (Ali et al., 2012). Therefore, surface soil salinity values (S_sal) and soil quality composite score (SQ) values were correlated (Spearman correlation) using SPSS software (International Business Machines Corporation, USA) for the dry and wet season sampling sites, as shown in Table 6.
Based on fieldwork and correlation test results, the risk of salinization in the study area has a high temporal and spatial correlation with soil salinity. This indicates the credibility of the soil quality scoring method assessment analysis constructed in this study. In further research in this study area, the thinking and research methodology of this study can be referenced and salinization risk weights considered to provide an a priori empirical and technical reference for analysis in predicting soil salinization risk.

4.6. Soil Salinization Risk Transfer in Dry and Wet Season

How does the risk of regional salinization vary from the wet season (May) to the dry season (August)? To further analyze the trends in soil salinity shifts during the wet and dry seasons, we depicted Sankey diagrams capable of highlighting changes in the risk of soil salinity during the wet and dry seasons (Figure 10). Sankey diagrams, a mapping method with the advantage of visual representation, can show changes in risk levels of soil salinity over the wet and dry seasons through changes in flow between different categories over time.
Figure 10 shows how the risk of soil salinity in the ELWNNR varies from one category to another, and the flow of the lines indicates the direction of change in salinity risk. Additionally, the risk of salinity in the wet season is dominated by moderate, high, and very high risk, while the risk of salinity in the dry season is dominated by low and moderate risk. Some of the moderate-risk areas in the wet season changed to no-risk and low-risk areas in the dry season, while the high-risk areas in the wet season mainly changed to moderate-risk areas in the dry season. Overall, the risk of soil salinization is higher during the wet season and decreases with the transition to the dry season.

5. Discussion

5.1. Influence of Lake Water Volume on Soil Salinization

The ELWNNR area has a wide variation in lake water volume during the dry and wet seasons, with the wet season lake water volume significantly higher than the dry season lake water volume. To explore the influence of the water volume of Ebinur Lake on the risk of salinization, the water volume change and salinization risk transfer in the dry and wet seasons of Ebinur Lake wetland reserve were analyzed as follows (Figure 11).
During the transition from wet season to dry season, the amount of water in the lake decreased by about 100 km2. At the same time, the risk of soil salinization has changed. The risk-free, low-risk and moderate-risk areas showed an upward trend, among which the risk-free and low-risk areas increased by about 100 km2. The regions of high-risk and very high-risk regions showed a downward trend, among which the very high-risk region decreased by about 100 km2. The decrease of lake water reduces the “water action” of salt accumulation environment in the ELWNNR. In addition, Table 3 shows that the S_sal in the dry season is higher than that in the wet season, indicating that the surface salinity from wet season to dry season is a process of accumulation and increase, but the risk of salinization is gradually reduced. The ELWNNR area was reduced to 1070 km2 of lake water at one point before 1950 due to climate change. Following 1950 and the impact of human activities, the lake continued to shrink, reaching a minimum of 500 km2 in 1987 [48]. Changes in the volume of water in the lake have caused increased soil salinization and dramatic ecological changes [51]. The area became a national nature reserve in April 2007, and the ecological and salinization status of the area has improved as a result of policy and human protection. The present results demonstrate the direct role of changes in water volume on the risk of salinity in the ELWNNR. This indirectly shows that, through macro-regulation of water for human production and consumption in the Ebinur Lake basin, it is possible not only to play an important role in ecological conservation, but also to significantly reduce the risk of salinization in the region.

5.2. Effects of Soil Salinity on Eco-Environment

Soil salinization is one of the main causes of land degradation in arid and semi-arid areas of the world, which affects vegetation growth and increases ecological risks [52]. The causes of soil salinization vary from season to season. Therefore, understanding the drivers of soil salinization is important for improving soil quality and ecology and increasing crop yields. The salinized environment has multiple effects on vegetation such as permeation, oxidation, and ionotoxicity [53]. Salt acts as a growth inhibitor for most plants because excess salt ions in the soil solution cause indirect loss of vegetative nutrients in addition to direct toxicity [54]. The degree of soil salinization directly affects crop yields and traits and is one of the main causes of reduced agricultural yields. In addition, the accumulation of salt on the surface of the ELWNNR has become the main cause of salt dust weather in the area north of Tianshan, causing air pollution and other problems. Therefore, understanding the main drivers of soil salinization and mapping the distribution of soil salinization risk can help to understand the extent of local soil salinization and provide theoretical support for land use planning and soil salinization control, thus ensuring environmental protection and agricultural development in the ELWNNR.

5.3. Applicability of Risk Factors

This study successfully constructed an assessment model of salinization risk, but there are still some deficiencies and the uncertainty of the assessment results. Soil salinization is usually caused by the combined action of nature and human activities. ELWNNR is a restricted area with few people, so the researchers did not select the human factor as a driving factor. In addition, the main driving factors of salinization will be different due to the different geological conditions, natural conditions, and human conditions in different regions. The generalization ability of the assessment model of salinization risk constructed needs to be further verified. The data sources were relatively complex, including raster data, vector data, attribute data, and point, line, and surface data in this study. Some of them were obtained by remote sensing quantitative inversion and the others were generated by GIS spatial interpolation. Therefore, there may be some uncertainty about the effective assimilation of these data. Future research will further improve the data to reduce the interference of human influence, as well as further improve the assimilation mechanism of these data. The further optimization of the quantitative assessment model of salinization risk is expected to provide a data basis for the management of land resources and the protection of eco-environment in the oasis in arid areas, and provide a reference for the risk decision in the sustainable development of the region.

6. Conclusions

Based on the risk weight of evaluation factors determined by correlation coefficient analysis method, this paper introduces a comprehensive scoring method to construct a comprehensive scoring system of salinization risk in the study area and constructs the soil salinization risk evaluation model. The following conclusions can be drawn from this study.
  • The correlation coefficients of risk assessment factors of salinization in the study area were obtained. During the wet season, the weighting factor of the soil salinization risk evaluation factor was greatest with the plant senescence reflectance index (PSRI), followed by the deep soil water content (D_wat) and the shallow soil salinity content (SH_sal). During the dry season, the weighting factor for the salinization risk evaluation factor was highest for shallow soil salinity content (SH_sal), followed by land use and land cover change (LUCC) and deep soil water content (D_wat).
  • The risk of salinization differs between the wet and dry seasons in the study area. The wet season is characterized by a relatively high risk of salinization, mainly in the form of moderation risk, high risk, and very high risk. Among them, moderate-risk areas account for 36.96% of the ELWNNR area, followed by high-risk areas at 32.12%. In contrast, the dry season experiences mainly low to moderate risk of salinization. Among them, moderate-risk areas account for 57.79% of the protected area, followed by low-risk areas at 15.98%. These results show that the dry season is better for agricultural production than the wet season due to lower risk of soil salinity.
  • From the Sankey diagram’s transfer matrix, it was found that, as the season moves from wet to dry (from May to August), moderate-risk area (in the wet season) shifts to low risk and risk-free (in the dry season). Similarly, the area of high risk in the wet season shifts to moderate risk in the dry season. This is mainly because the reduction in the volume of water in the lakes decreases the “water action” of the salt-accumulating environment from wet to dry seasons.

Supplementary Materials

The following are available online at https://www.mdpi.com/2072-4292/12/15/2405/s1, File S1: Band comparison between Sentinel-2 data and Landsat-8 remote sensing data, File S2: Additional information on the kriging approach, File S3: Vector data of soil sampling points in dry and wet seasons.

Author Contributions

Conceptualization, Z.W. and X.Z. (Xianlong Zhang); formal analysis, X.Z. (Xianlong Zhang) and X.Z. (Xiaohong Zhou); Investigation, X.Z. (Xianlong Zhang); Methodology, Z.W.; Project administration and Resources, F.Z.; Software, X.Z. (Xiaohong Zhou); Validation, Y.W.; Visualization, N.W.C.; Writing—original draft, Z.W.; Writing—review & editing, N.W.C. and H.-t.K. All authors have read and agree to the published version of the manuscript.

Funding

This research was supported by the National Natural Science Foundation of China (U1603241); the National Natural Science Foundation of China (Xinjiang Local Outstanding Young Talent Cultivation) (Grant No. U1503302); Group supporting project for study abroad sent by the people’s Government of the Autonomous Region (L06); Tianshan talent project of Xinjiang Uygur Autonomous region (400070010209); and Strategic Priority Program of the CAS, Pan-Third Pole Environment Study for a Green Silk Road (XDA20040400). We want to thank the editor and anonymous reviewers for their valuable comments and suggestions to this paper.

Acknowledgments

The authors would like to thank Ngai Weng Chan and Hsiang-te Kung for their help in refining the language of this paper, and the editor-in-chief and reviewers of remote sensing for their comments on the paper, which helped to improve it.

Conflicts of Interest

The authors declare no conflict of interest.

References

  1. Rengasamy, P. World salinization with emphasis on Australia. J. Exp. Bot. 2006, 57, 1017–1023. [Google Scholar] [CrossRef] [Green Version]
  2. D’Odorico, P.; Bhattachan, A.; Davis, K.F.; Ravi, S.; Runyana, C.W. Global desertification: Drivers and feedbacks. Adv. Water Res. 2013, 51, 326–344. [Google Scholar] [CrossRef]
  3. Barradas, J.M.M.; Abdelfattah, A.; Matula, S.; Dolezal, F. Effect of Fertigation on Soil Salinization and Aggregate Stability. J. Irrig. Drain. Eng. 2015, 141. [Google Scholar] [CrossRef]
  4. Li-Xian, Y.; Guo-Liang, L.; Shi-Hua, T.; Sulewski, G.; He, Z.H. Salinity of animal manure and potential risk of secondary soil salinization through successive manure application. Sci. Total Environ. 2007, 383, 106–114. [Google Scholar] [CrossRef] [PubMed]
  5. Shaddad, S.M.; Buttafuoco, G.; Castrignanò, A. Assessment and Mapping of Soil Salinization Risk in an Egyptian Field Using a Probabilistic Approach. Agronomy 2020, 10, 85. [Google Scholar] [CrossRef] [Green Version]
  6. Zhou, D.; Lin, Z.; Liu, L.; Zimmermann, D. Assessing secondary soil salinization risk based on the PSR sustainability framework. J. Environ. Manag. 2013, 128, 642–654. [Google Scholar] [CrossRef]
  7. Ali, R.R.; Abdel Kawy, W.A.M. Land degradation risk assessment of El Fayoum depression, Egypt. Arab. J. Geosci. 2012, 6, 2767–2776. [Google Scholar] [CrossRef]
  8. Castrignanò, A.; Buttafuoco, G.; Puddu, R. Multi-scale assessment of the risk of soil salinization in an area of south-eastern Sardinia (Italy). Precis. Agric. 2008, 9, 17–31. [Google Scholar] [CrossRef]
  9. Yang, J.X.; Zhao, J.; Zhu, G.F.; Wang, Y.; Ma, X.; Wang, J.; Guo, H.; Zhang, Y. Soil salinization in the oasis areas of downstream inland rivers -Case Study: Minqin oasis. Quat. Int. 2020, 537, 69–78. [Google Scholar] [CrossRef]
  10. Ayad, Y.A. Remote sensing and GIS in modeling visual landscape change: A case study of the northwestern and coast of Egypt. Landsc. Urban Plan. 2005, 73, 307–325. [Google Scholar] [CrossRef]
  11. Nas, B.; Berktay, A. Groundwater quality mapping in urban groundwater using GIS. Environ. Monit. Assess. 2010, 160, 215–227. [Google Scholar] [CrossRef] [PubMed]
  12. Wang, X.; Zhang, F.; Ding, J.; Latif, A.; Johnson, V.C. Estimation of soil salt content (SSC) in the Ebinur Lake Wetland National Nature Reserve (ELWNNR), Northwest China, based on a Bootstrap-BP neural network model and optimal spectral indices. Sci. Total Environ. 2018, 615, 918–930. [Google Scholar] [CrossRef]
  13. Chi, Y.; Sun, J.K.; Liu, W.Q.; Wang, J.; Zhao, M. Mapping coastal wetland soil salinity in different seasons using an improved comprehensive land surface factor system. Ecol. Indic. 2019, 107. [Google Scholar] [CrossRef]
  14. Solangi, K.A.; Siyal, A.A.; Wu, Y.Y.; Abbasi, B.; Solangi, F.; Ali Lakhiar, I.; Zhou, G. An Assessment of the Spatial and Temporal Distribution of Soil Salinity in Combination with Field and Satellite Data: A Case Study in Sujawal District. Agronomy 2019, 9, 869. [Google Scholar] [CrossRef] [Green Version]
  15. Ren, D.Y.; Wei, B.Y.; Xu, X.; Engel, B.; Li, G.; Huang, Q.; Xiong, Y.; Huang, G. Analyzing spatiotemporal characteristics of soil salinity in arid irrigated agro-ecosystems using integrated approaches. Geoderma 2019, 356, 113935. [Google Scholar] [CrossRef]
  16. Seydehmet, J.; Lv, G.-H.; Abliz, A.; Shi, Q.D.; Abliz, A.; Turup, A. Irrigation Salinity Risk Assessment and Mapping in Arid Oasis, Northwest China. Water 2018, 10, 966. [Google Scholar] [CrossRef] [Green Version]
  17. Abou Samra, R.M.; Ali, R.R. The development of an overlay model to predict soil salinity risks by using remote sensing and GIS techniques: A case study in soils around Idku Lake, Egypt. Environ. Monit. Assess 2018, 190, 706. [Google Scholar] [CrossRef]
  18. Zhaoyong, Z.; Abuduwaili, J.; Yimit, H. The occurrence, sources and spatial characteristics of soil salt and assessment of soil salinization risk in Yanqi basin, northwest China. PLoS ONE 2014, 9, e106079. [Google Scholar] [CrossRef]
  19. Libutti, A.; Cammerino, A.; Monteleone, M. Risk Assessment of Soil Salinization Due to Tomato Cultivation in Mediterranean Climate Conditions. Water 2018, 10, 1503. [Google Scholar] [CrossRef] [Green Version]
  20. Abuduwailli, J.; Gabchenko, M.V.; Xu, J. Eolian transport of salts—A case study in the area of Lake Ebinur (Xinjiang, Northwest China). J. Arid Environ. 2008, 72, 1843–1852. [Google Scholar] [CrossRef]
  21. Liu, D.; Abuduwaili, J.; Wang, L. Salt dust storm in the Ebinur Lake region: Its 50-year dynamic changes and response to climate changes and human activities. Nat. Hazards 2015, 77, 1069–1080. [Google Scholar] [CrossRef]
  22. Wang, J.; Ding, J.; Abulimiti, A.; Cai, L. Quantitative estimation of soil salinity by means of different modeling methods and visible-near infrared (VIS-NIR) spectroscopy, Ebinur Lake Wetland, Northwest China. PeerJ 2018, 6. [Google Scholar] [CrossRef] [PubMed] [Green Version]
  23. Zhou, J.; Wu, J.; Ma, L.; Qiang, M. Late Quaternary lake-level and climate changes in arid central Asia inferred from sediments of Ebinur Lake, Xinjiang, northwestern China. Quat. Res. 2019, 92, 416–429. [Google Scholar] [CrossRef]
  24. Water Resources Department of Xinjiang Uygur Autonomous Region. Work Outline of County-Level Saline-Alkali Land Improvement and Utilization Planning in Xinjiang; Water Resources Department of Xinjiang Uygur Autonomous Region: Urumqi, China, 2005.
  25. Bakr, N.; Ali, R.R. Statistical relationship between land surface altitude and soil salinity in the enclosed desert depressions of arid regions. Arab. J. Geosci. 2019, 12. [Google Scholar] [CrossRef]
  26. Chen, T.; Niu, R.; Li, P.; Zhang, L.; Du, B. Regional soil erosion risk mapping using RUSLE, GIS, and remote sensing: A case study in Miyun Watershed, North China. Environ. Earth Sci. 2010, 63, 533–541. [Google Scholar] [CrossRef]
  27. Buchanan, S.; Huang, J.; Triantafilis, J. Salinity risk assessment using fuzzy multiple criteria evaluation. Soil Use Manag. 2017, 33, 216–232. [Google Scholar] [CrossRef]
  28. Wang, Z.; Fan, B.; Guo, L. Soil salinization after long-term mulched drip irrigation poses a potential risk to agricultural sustainability. Eur. J. Soil Sci. 2019, 70, 20–24. [Google Scholar] [CrossRef] [Green Version]
  29. French, A.N.; Norman, J.M.; Anderson, M.C. A simple and fast atmospheric correction for spacebome remote sensing of surface temperature. Remote Sens. Environ. 2003, 87, 326–333. [Google Scholar] [CrossRef]
  30. Chen, Z.; Wang, J. Landslide hazard mapping using logistic regression model in Mackenzie Valley, Canada. Nat. Hazards 2007, 42, 75–89. [Google Scholar] [CrossRef]
  31. Defries, R.S.; Townshend, J.R.G. NDVI-derived land cover classifications at a global scale. Int. J. Remote Sens. 2007, 15, 3567–3586. [Google Scholar] [CrossRef]
  32. Ren, S.; Chen, X.; An, S. Assessing plant senescence reflectance index-retrieved vegetation phenology and its spatiotemporal response to climate change in the Inner Mongolian Grassland. Int. J. Biometeorol. 2017, 61, 601–612. [Google Scholar] [CrossRef] [PubMed]
  33. Nutini, F.; Boschetti, M.; Brivio, P.A.; Natarajan, S.; Sivasamy, R.; Poongodi, C. Land-use and land-cover change detection in a semi-arid area of Niger using multi-temporal analysis of Landsat images. Int. J. Remote Sens. 2013, 34, 4769–4790. [Google Scholar] [CrossRef]
  34. Rodenbeck, C.; Houweling, S.; Gloor, M.; Heimann, M. CO2 flux history 1982–2001 inferred from atmospheric data using a global inversion of atmospheric transport. Atmos. Chem. Phys. 2003, 3, 1919–1964. [Google Scholar] [CrossRef] [Green Version]
  35. Pum, J.K.W. Evaluating sample stability in the clinical laboratory with the help of linear and non-linear regression analysis. Clin. Chem. Lab. Med. 2020, 58, 188–196. [Google Scholar] [CrossRef] [PubMed]
  36. Guo, Q.; Luo, L.; Zhao, H.; Pan, Y.; Bing, Q. Study on Spatio-Temporal Change of Land Use in Tianjin Urban Based on Remote Sensing Data. Commun. Comput. Inf. Sci. 2016, 228–237. [Google Scholar] [CrossRef]
  37. Mulder, V.L.; de Bruin, S.; Schaepman, M.E.; Mayr, T.R. The use of remote sensing in soil and terrain mapping—A review. Geoderma 2011, 162, 1–19. [Google Scholar] [CrossRef]
  38. Webster, R.; Oliver, M. Geostatistics for Environmental Scientists; John Wiley & Sons: Chichester, UK, 2007; p. 330. ISBN 9780470028582. [Google Scholar]
  39. Castrignano, A.; Giugliarini, L.; Risaliti, R.; Martinelli, N. Study of spatial relationships among some soil physico-chemical properties of a field in central Italy using multivariate geostatistics. Geoderma 2000, 97, 39–60. [Google Scholar] [CrossRef]
  40. Mohanty, M.; Painuli, D.K.; Misra, A.K.; Ghosh, P.K. Soil quality effects of tillage and residue under rice-wheat cropping on a Vertisol in India. Soil Tillage Res. 2007, 92, 243–250. [Google Scholar] [CrossRef]
  41. Ceccato, P.; Flasse, S.; Tarantola, S.; Jacquemoud, S.; Grégoire, J.-M. Detecting vegetation leaf water content using reflectance in the optical domain. Remote Sens. Environ. 2001, 77, 22–33. [Google Scholar] [CrossRef]
  42. Chaves, M.M.; Flexas, J.; Pinheiro, C.; Novitskaya, L.; Foyer, C.H. Photosynthesis under drought and salt stress: Regulation mechanisms from whole plant to cell. Ann. Bot. 2009, 103, 551–560. [Google Scholar] [CrossRef] [Green Version]
  43. Zhang, Z.; Liu, M.; Liu, X.; Zhou, G. A New Vegetation Index Based on Multitemporal Sentinel-2 Images for Discriminating Heavy Metal Stress Levels in Rice. Sensors 2018, 18, 2172. [Google Scholar] [CrossRef] [Green Version]
  44. Ilyas, N.; Shi, Q.D.; Abdulla, A.; Xia, N.; Wang, J. Quantitative evaluation of soil salinization risk in Keriya Oasis based on grey evaluation model. Trans. Chin. Soc. Agric. Eng. 2019, 35, 176–184. (In Chinese) [Google Scholar]
  45. Weng, Q.H.; Lu, D.S.; Schubring, J. Estimation of land surface temperature-vegetation abundance relationship for urban heat island studies. Remote Sens. Environ. 2004, 89, 467–483. [Google Scholar] [CrossRef]
  46. Foody, G.M. Status of land cover classification accuracy assessment. Remote Sens. Environ. 2002, 80, 185–201. [Google Scholar] [CrossRef]
  47. Wang, J.; Ding, J.; Li, G.; Liang, J.; Yu, D.; Asishan, T.; Zhang, F.; Yang, J.; Abulimiti, A.; Liu, J. Dynamic detection of water surface area of Ebinur Lake using multi-source satellite data (Landsat and Sentinel-1A) and its responses to changing environment. Catena 2019, 177, 189–201. [Google Scholar] [CrossRef]
  48. Scanlon, B.R.; Keese, K.E.; Flint, A.L.; Flint, L.E.; Gaye, C.B.; Edmunds, W.M.; Simmers, I. Global synthesis of groundwater recharge in semiarid and arid regions. Hydrol. Process. 2006, 20, 3335–3370. [Google Scholar] [CrossRef]
  49. Wijitkosum, S.; Sriburi, T. Fuzzy AHP Integrated with GIS Analyses for Drought Risk Assessment: A Case Study from Upper Phetchaburi River Basin, Thailand. Water 2019, 11, 939. [Google Scholar] [CrossRef] [Green Version]
  50. Wiebe, B.H.; Eilers, R.G.; Eilers, W.D.; Brierley, J.A. Application of a risk indicator for assessing trends in dryland salinization risk on the Canadian Prairies. Can. J. Soil Sci. 2007, 87, 213–224. [Google Scholar] [CrossRef]
  51. Yang, J.M.; Ma, L.G.; Li, C.Z.; Liu, Y.; Ding, J.L.; Yang, S.T. Temporal-spatial variations and influencing factors of Lakes in inland arid areas from 2000 to 2017: A case study in Xinjiang. Geomat. Nat. Hazards Risk 2019, 10, 519–543. [Google Scholar] [CrossRef]
  52. Gorji, T.; Sertel, E.; Tanik, A. Monitoring soil salinity via remote sensing technology under data scarce conditions: A case study from Turkey. Ecol. Indic. 2017, 74, 384–391. [Google Scholar] [CrossRef]
  53. Rozema, J.; Flowers, T. Ecology Crops for a Salinized World. Science 2008, 322, 1478–1480. [Google Scholar] [CrossRef] [PubMed]
  54. Ramoliya, P.J.; Pandey, A.N. Effect of salinization of soil on emergence, growth and survival of Albizzia lebbek seedlings. Trop. Ecol. 2006, 47, 27–36. [Google Scholar] [CrossRef]
Figure 1. Location maps of the study area: (a) location map of Ebinur Lake basin in China, where the map of China uses the network base map that comes with Arcgis 10.3; (b) Ebinur Lake basin; (c) the wet season of ELWNNR; (d) the dry season of ELWNNR; (e) large areas of salinized soil; (f) halophytic vegetation grows in salinized soil; and (g) a large salt crust. ELWNNR, Ebinur Lake Wetland National Nature Reserve.
Remotesensing 12 02405 g001
Figure 2. Topographic map of the study area: (a) The DEM data of the study area; (b) the surface aspect of the study area; and (c) the surface slope of the study area.
Remotesensing 12 02405 g002
Figure 3. Description of sampling point data distribution of the salt content of soil surface: (a) violin plots showing the descriptive statistics of soil salinity for the wet and dry seasons; and (b,c) pie chart showing the distribution of salt values at different levels (five levels).
Remotesensing 12 02405 g003
Figure 4. Data of salinization risk factors obtained by GIS interpolation in wet season: (a) spatial distribution of the SH_wat risk factors; (b) spatial distribution of the SH_sal risk factors; (c) spatial distribution of the D_wat risk factors; (d) spatial distribution of the D_sal risk factors; and (e) spatial distribution of the S_wat risk factors.
Remotesensing 12 02405 g004
Figure 5. Data of salinization risk factors obtained by GIS interpolation in dry season: (a) spatial distribution of the SH_wat risk factors; (b) spatial distribution of the SH_sal risk factors; (c) spatial distribution of the D_wat risk factors; (d) spatial distribution of the D_sal risk factors; and (e) spatial distribution of the S_wat risk factors.
Remotesensing 12 02405 g005
Figure 6. Data of salinization risk factors obtained by remote sensing in wet season: (a) spatial distribution of the LUCC risk factors; (b) spatial distribution of the NDVI risk factors; (c) spatial distribution of the PSRI risk factors; and (d) spatial distribution of the S_tem risk factors. NDVI, normalized difference vegetation index; S_tem, land surface temperature; PSRI, plant senescence reflectance index; LUCC, land-use/land-cover.
Remotesensing 12 02405 g006
Figure 7. Data of salinization risk factors obtained by remote sensing in dry season: (a) spatial distribution of the LUCC risk factors; (b) spatial distribution of the NDVI risk factors; (c) spatial distribution of the PSRI risk factors; and (d) spatial distribution of the S_tem risk factors. The abnormal area is due to the distribution of a few cloud areas in the spatial distribution of the dry season temperature in the Landsat-8 image (August 2018). NDVI, normalized difference vegetation index; S_tem, land surface temperature; PSRI, plant senescence reflectance index; LUCC, land-use/land-cover.
Remotesensing 12 02405 g007
Figure 8. Correlation of salinization risk in wet season and dry seasons. * significantly correlated at the level of 0.05 (unilateral); ** significantly correlated at the level of 0.01 (unilateral).
Remotesensing 12 02405 g008
Figure 9. Spatial risk profile in wet and dry seasons.
Remotesensing 12 02405 g009
Figure 10. Salinization risk transfer diagram.
Remotesensing 12 02405 g010
Figure 11. Relationship between lake water volume and soil salinization risk transfer.
Remotesensing 12 02405 g011
Table 1. Degree of soil salinization.
Degree of Soil SalinizationNon-Saline SoilMildly Saline SoilModerately Saline SoilSeverely Saline SoilSaline Soil
soil salt content g/kg<11–66–1010–20>20
Table 2. Data acquisition of soil salinization risk sources in the study area.
Salinization Risk SourceAbbreviationsUnitData SourcesData AcquisitionResolution of the DataData TypeReference
Surface temperatureS_tem°CLandsat-8 OLI Inversion30 mVector data[29]
Surface elevationS_elemField acquisitionSpatial interpolation-Vector data[30]
Surface slopeS_slo%DEMInversion12 mRaster data[30]
Surface aspectS_asp-DEMInversion12 mRaster data[30]
Normalized differential vegetation indexNDVI-Sentinel-2 MSIInversion10 mRaster data[31]
Plant senescence reflectance indexPSRI-Sentinel-2 MSIInversion20 mRaster data[32]
Land-Use and Land-Cover ChangeLUCC-Sentinel-2 MSIInversion10 mRaster data[33]
Surface soil water contentS_wat%Field acquisitionSpatial interpolation-Vector data
Soil salt content at shallow depthsSH_salg/kgField acquisitionSpatial interpolation-Vector data
Soil water content at shallow depths SH_wat%Field acquisitionSpatial interpolation-Vector data
Soil salt content at deep depths D_salg/kgField acquisitionSpatial interpolation-Vector data
Soil water content at deep depths D_wat%Field acquisitionSpatial interpolation Vector data
DEM data were downloaded with LocaSpaceViewer4 (Suzhou zhongketuxin network technology co. LTD., China) software.
Table 3. Statistical characteristic values of risk assessment factors of salinization in dry and wet seasons.
May 2018 (Wet Season)
Salinization Risk SourceMeanMedianStandard deviationVarianceMinimumMaximum
S_sal8.446.87.9463.140.164.4
S_ele219.85207.565.86438.61182269
S_wat6.923.4615.0326.030.2816.54
S_slo1.251.081.131.2904.76
S_asp143.15112.5136.2818,572.86−1353.66
LUCC4.3351.091.225
PSRI0.180.160.040.0020.140.31
NDVI0.380.340.120.0150.290.78
S_tem49.1351.315.5931.2932.5855.13
SH_sal2.592.31.803.2706.9
D_sal2.071.951.482.1905.9
SH_wat7.096.564.8723.740.3521.93
D_wat8.868.105.8033.720.5124.93
August 2018 (Dry Season)
Salinization Risk SourceMeanMedianStandard DeviationVarianceMinimumMaximum
S_sal10.186.713.46181.28062
S_ele211.9120524.74612.35187289
S_wat3.232.093.4311.790.0215.64
S_slo1.370.951.291.6804.76
S_asp153.81135127.2116,184−1355.66
LUCC4.2451.131.2825
PSRI0.040.020.060.004−0.030.29
NDVI0.120.090.120.0160.010.59
S_tem31.2931.613.149.924.9137.14
SH_sal2.572.224.01507.2
D_sal2.021.81.622.6506.7
SH_wat5.744.734.4619.920.5220.02
D_wat8.796.6512.75162.70.3235.87
The numbers in LUCC: 1 is water; 2 is vegetation; 3 is lakeside area; 4 is mountain area; 5 is bare area; and 6 is desert area. A value of −1 in S_asp indicates no slope and the sampling point is flat.
Table 4. Weight of soil salinization risk assessment factors in dry and wet seasons.
Wet SeasonDry Season
Correlation ValueAbsolute ValueWeight %Correlation ValueAbsolute ValueWeight %
S_ele−0.0260.0261.19−0.0760.0763.50
S_wat−0.1070.1074.920.0650.0652.99
S_slo−0.0260.0261.19−0.0580.0582.67
S_asp−0.1280.1285.88−0.1530.1537.04
LUCC−0.2230.22310.25−0.2920.29213.45
PSRI0.3040.30413.980.1580.1587.27
NDVI0.2550.25511.720.1460.1466.72
S_tem−0.1750.1758.040.130.135.98
SH_wat0.2460.24611.310.1470.1476.77
D_wat0.2870.28713.200.2890.28913.31
SH_sal0.2790.27912.830.3960.39618.24
D_sal0.1180.1185.420.2610.26112.02
Account 2.1741 2.1711
Table 5. Criteria of soil salinity risk classification and area-statistics at each risk rating in study area.
Risk LevelDegree of RiskRisk-Value RangeWet SeasonDry Season
Acreage/m2Proportion of Area/%Acreage/m2Proportion of Area/%
1Risk-free area<0.1301.148.86477.0614.04
2Low-risk area0.1–0.3405.0311.92542.915.98
3Moderate-risk area0.3–0.41255.2736.961962.757.79
4High-risk area0.4–0.51090.932.12245.57.22
5Very high-risk area>0.5343.910.12168.054.94
3396.2413396.211
Table 6. Accuracy verification of soil salinization risk.
NumberMean Value of S_salStandard Deviation of S_salMean Value of SQStandard Deviation of SQCorrelation
879.796812.680.460.280.703 **
** Significantly correlated at the level of 0.01 (unilateral).