Article

RAINBOW: An Operational Oriented Combined IR-Algorithm

1
CNR-ISAC, Consiglio Nazionale delle Ricerche, Roma, Via del Fosso del Cavaliere 100, 00133 Roma, Italy
2
Department of Civil Protection, Presidency of the Council of Ministers, Via Vitorchiano 2, 00189 Rome, Italy
*
Author to whom correspondence should be addressed.
Remote Sens. 2020, 12(15), 2444; https://doi.org/10.3390/rs12152444
Submission received: 8 June 2020 / Revised: 21 July 2020 / Accepted: 27 July 2020 / Published: 30 July 2020
(This article belongs to the Special Issue Remote Sensing of Precipitation: Part II)

Abstract

:
In this paper, precipitation estimates derived from the Italian ground radar network (IT GR) are used in conjunction with Spinning Enhanced Visible and InfraRed Imager (SEVIRI) measurements to develop an operational oriented algorithm (RAdar INfrared Blending algorithm for Operational Weather monitoring (RAINBOW)) able to provide precipitation pattern and intensity. The algorithm evaluates surface precipitation over five geographical boxes (in which the study area is divided). It is composed of two main modules that exploit a second-degree polynomial relationship between the SEVIRI brightness temperature at 10.8 µm TB10.8 and the precipitation rate estimates from IT GR. These relationships are applied to each acquisition of SEVIRI in order to provide a surface precipitation map. The results, based on a number of case studies, show good performance of RAINBOW when it is compared with ground reference (precipitation rate map from interpolated rain gauge measurements), with high Probability of Detection (POD) and low False Alarm Ratio (FAR) values, especially for light to moderate precipitation range. At the same time, the mean error (ME) values are about 0 mmh−1, while root mean square error (RMSE) is about 2 mmh−1, highlighting a limited variability of the RAINBOW estimations. The precipitation retrievals from RAINBOW have been also compared with the European Organization for the Exploitation of Meteorological Satellites (EUMETSAT) Satellite Application Facility on Support to Operational Hydrology and Water Management (H SAF) official microwave (MW)/infrared (IR) combined product (P-IN-SEVIRI). RAINBOW shows better performances than P-IN-SEVIRI, in terms of both detection and estimates of precipitation fields when they are compared to the ground reference. RAINBOW has been designed as an operational product, to provide complementary information to that of the national radar network where the IT GR coverage is absent, or the quality (expressed in terms of Quality Index (QI)) of the RAINBOW estimates is low. The aim of RAINBOW is to complement the radar and rain gauge network supporting the operational precipitation monitoring.

Graphical Abstract

1. Introduction

Accurate precipitation measurements are essential for the validation of global climate models and for understanding the natural variability of the earth’s climate. Moreover, rainfall monitoring can serve as an important element for risk management of severe precipitation events.
Although the importance of quantitative determination of rainfall is well recognized, reliable retrieval of precipitation is often difficult. First, precipitation represents one of the most difficult atmospheric variables to be accurately measured due to its high temporal and spatial variability. Furthermore, the only instruments that guarantee direct measurements of precipitation are rain gauges and disdrometers. Both types of instruments, although, have a quite high temporal resolution, and provide point-like measurements, ensuring a low spatial resolution. On the other hand, ground-based radars provide measurements of rainfall with a relatively high spatial and temporal resolution. Although they represent a valuable source of information, they provide an indirect measurement of precipitation. In addition, radar observations are affected by several uncertainty sources, including miscalibration, ground clutter, beam blocking, attenuation, Wireless Local Area Network (W-LAN) interferences [1,2,3,4].
Space-borne monitoring of clouds and precipitation all around the globe has been gaining growing interest from the international scientific community as a primary contribution to the improvement of global precipitation measurement and to the determination and detection of the global climatic changes. Most of the space-borne monitoring systems take advantage of passive instrumentation, (e.g., radiometers), using both infrared (IR) and microwave (MW) emissions to retrieve cloud properties and precipitation estimation. However, it is difficult to establish an exact quantitative relationship between surface rain rate and the cloud physical quantities (e.g., brightness temperatures) measured by the various sensors [5,6,7,8]).
IR-based estimates of rainfall exploit the sensitivity of the IR measurements to the uppermost layers of clouds, but the measured cloud-top brightness temperatures do not provide sufficient information to retrieve the actual intensity of surface rainfall with high reliability. However, the relevance of IR estimates lie in the wide coverage of the earth at relatively high spatial and temporal resolution provided by geosynchronous satellites [9,10,11,12,13]), being IR sensors, mainly mounted on geostationary (GEO) satellites (e.g., the Spinning Enhanced Visible and InfraRed Imager (SEVIRI) onboard of Meteosat Second Generation (MSG) and the Geostationary Operational Environmental Satellite (GOES) Imagers).
However, rainfall estimates based on IR and VIS measurements are constantly evolving thanks also to the improved performance of the sensors. In this regard, it should be noted that the IR and VIS based rainfall retrievals have obtained an important improvement by the exploitation of optical and microphysical clouds parameters (e.g., optical thickness, particle radius), thanks to the higher enhanced spectral resolution of the new generation of geostationary sensors (e.g., MSG SEVIRI and GOES Imagers) [14,15,16,17,18]. In addition, the use of optical and microphysical cloud parameters, the use of classification schemes of convective and stratiform precipitation areas has also contributed to improving the accuracy of rainfall estimates [18,19]. Therefore, while the cloud-top temperature is a primary reference to detect deep convection and precipitation, the use of microphysics parameters and of the cloud classification schemes helps to solve the ambiguities in the retrieval and to identify more accurately the rainy area at the ground [20]. It is also worth mentioning that the combined use of both IR and VIS radiation to provide meteorological products supporting nowcasting activities has been widely studied in the EUMETSAT program—Satellite Application Facilities on Support to Nowcasting and Very Short Range Forecasting (NWC SAF) [20,21,22]. Furthermore, significant progresses are being made in the field of hyperspectral IR detection and substantial impacts are expected on the Numerical Weather Prediction (NWP) [23,24,25].
On the other hand, MW-based observations have the great advantage of providing a more direct measurement of the precipitation due to the ability of MW radiation to penetrate precipitating clouds and interact with its liquid and ice hydrometeors [26,27,28,29,30]). At the same time, they suffer of the insufficient temporal frequency of Low Earth Orbit (LEO) satellite overpasses (which carry MW instruments), with respect to the high variability of the precipitation in time and space.
To reduce the evidenced limitations and obtain satisfactory precipitation measurements in terms of accuracy, spatial, and temporal resolution, researchers have increasingly moved to using combinations of sensors. The joint use of MW and IR measurements has long been recognized as very effective as it combines the accuracy of the instantaneous MW data and the repetition and coverage characteristics of the IR geostationary measurements [12,31,32,33,34]).
The higher number of LEO-GEO satellites orbiting around the globe has made available a significant amount of precipitation estimates. The availability of these estimates are useful to build accurate and reliable multi-satellite datasets. The goal is to provide products with the best short-range estimates, called High Resolution Precipitation Products (HRPP). The Tropical Rainfall Measuring Mission’s (TRMM) Multisatellite Precipitation Analysis (TMPA) was produced according to this line, since it combines precipitation estimates from multiple satellites, as well as from rain gauges, where feasible, to generate rainfall data [35,36].
The Climate Prediction Center morphing method (CMORPH) uses motion vectors from dynamic GEO-IR images to fill the temporal gaps between two available Passive Microwave (PMW) rainfall estimates [37]. The Japanese Global Precipitation Measurement (GPM) standard product Global Satellite Mapping of Precipitation (GSMaP) is a PMW–IR precipitation product. The algorithm integrates PMW data with infrared radiometer data to achieve high temporal and spatial resolution global precipitation estimates [38]. The National Oceanic and Atmospheric Administration (NOAA) Self-Calibrating Multivariate Precipitation Retrieval (SCaMPR) algorithm estimates rainfall at a fine temporal resolution using PMW (SSM/I––Special Sensor Microwave/Imager) and GEO (GOES) satellites. It uses SSM/I data for rain/no-rain pixels classification, and then GOES data to calibrate the relationship between brightness temperature and rain rate via linear regression for the precipitating pixels [39,40]. The PERSIANN (Precipitation Estimation from Remotely Sensed Information using Artificial Neural Networks) algorithm of the Center for Hydrometeorology and Remote Sensing (CHRS) is an adaptive, multi-platform precipitation estimation algorithm, based on an artificial neural network approach. It merges high quality data from National Aeronautics and Space Administration (NASA), National Oceanic and Atmospheric Administration (NOAA), and Defense Meteorological Satellite Program (DMSP) low-altitude polar-orbit satellites with sampled data from geosynchronous satellites [41,42,43]. The Integrated Multi-satellitE Retrievals for GPM (IMERG) is a merged precipitation product developed by the US GPM science team. This algorithm is intended to produce fine time- and space-scale estimates for the entire globe using inter-calibrated, merged, and interpolated data from all available PMW satellites, together with microwave-calibrated infrared (IR) satellite estimates, precipitation gauge analyses, and other precipitation estimators [44].
The combination of MW and IR measurements generally follows two main techniques—the so-called “blended” or “microwave-calibrated” and “morphing”. The first one is based on a calibration of IR cloud top temperatures measurements using the MW (namely Passive MW-PMW) precipitation estimates, in order to generate local relationships between the IR and PMW observations [31,32,35,43,45,46,47,48,49,50]). The derived relationships are then applied to the IR data, increasing the spatial and temporal extent of the precipitation estimation with respect to the PMW overpasses. The “morphing” technique is based on the evidence that IR data, locally updated using PMW-based rainfall measurements, can be employed to measure cloud movement, propagating forward in time the rain field, between the consecutive LEO PMW satellite overpasses [37,51,52,53,54]. Basically, this technique derives estimates of precipitation from infrared data when passive microwave information is unavailable.
This paper describes an algorithm, named RAINBOW (RAdar INfrared Blending algorithm for Operational Weather monitoring) combining the data collected by SEVIRI and by the Italian ground-based radars network, coordinated by the Italian Department of Civil Protection (IT GR) to provide precipitation estimation over Italy. The main objective of the algorithm is to provide rainfall estimates from SEVIRI observations, by exploiting the portion of IT GR data with the highest quality. The algorithm has been developed by using the “blended” approach taking using the Surface Rainfall Intensity (SRI) composite product obtained by combining the measurements from all the radars of the network. The Italian ground radar network represents a valuable monitoring system for the detection and warning of severe weather and related hydro-geological risks. As a matter of fact, Italy, and more generally the Mediterranean basin, is affected by severe weather events of different nature (e.g., deep convective systems, cyclones, tropical-like cyclones, etc.) hitting coastal as well as inland areas, causing serious damages and casualties [55,56,57,58,59,60,61,62]).
The IT GR is also currently an important part of the ground reference system for the Precipitation Product Validation Group of the EUMETSAT Satellite Application Facility for Support to Operational Hydrology and Water Management project [63]. However, the spatial heterogeneity of the data quality, related to orography and spatial coverage of the IT GR network, imposes the selection of the data to be used for blending.
The RAINBOW algorithm presented in this paper has been developed within the agreement between the Italian Department of Civil Protection and the Institute of Atmospheric Sciences and Climate (ISAC) of the National Research Council of Italy (CNR). The concept is to design an operational product to complement the radar monitoring of relevant precipitation events by covering both sea areas (not covered by IT GR) and areas where the quality of IT GR data is lower due to limited coverage and orographic obstruction. One of the request that has to be satisfied by RAINBOW is the as short as possible running time in order to provide precipitation estimates as soon as the SEVIRI acquisition is available.
This paper is organized as follows. Section 2 presents the instrumentation and methodology used in the design of the algorithm. Section 3 reports the results obtained by the algorithm when it is applied to selected case studies with the relative discussion. The conclusions are then reported in Section 4.

2. Instrumentation and Methods

Two-and-a-half years of data (from 1 July 2015 to 31 December 2017) collected by the IT GR network, and by the SEVIRI radiometer, have been used to develop the RAINBOW algorithm. The algorithm combines the SEVIRI brightness temperature and the precipitation rate estimated from the ground radars (GRs) to derive a relationship between these two quantities to be applied to each SEVIRI acquisition (i.e., every fifteen minutes). The area of interest is centered on the Italian peninsula, namely between 36–48°N and 6–20°E.

2.1. IT GR Network

At the time of the work, the Italian ground radar (GR) network includes 20 C-band and 3 X-band radar, managed by 11 administrations. Moreover, 7 C-band and 3 X-band systems (all with dual-polarization capability) are managed by the Department of Civil Protection (DPC), which is also the developer and distributor of the national precipitation product. The spatial distribution of the IT GR network with the associated Quality Index (QI) is depicted on Figure 1. The processing architecture is basically composed of two main steps, where the radar measurements are first locally processed by a unique software system, then all the products are centralized to generate the national level products.
There are different sources that can increase the uncertainty in the radar precipitation estimation [64]. The main errors can be identified by contamination by non-weather returns (clutter), partial beam blocking, beam broadening at increasing distances, vertical variability of precipitation [32,65,66], and rain path attenuation [1,67,68,69]. Due to the morphology of the Italian territory, the uncertainty can be mainly associated to the orography-related effects, especially in southern Italy where the radar coverage as well as the radar overlapping is poor [3,70]. Another error source is the Radio Local Area Network (RLAN) interferences, which are properly dealt with and filtered out using an effective algorithm based on a multi-parameter fuzzy logic approach that also make use of the Signal Quality Index (SQI).
The processing system aims at identifying most of the uncertainty sources in order to compensate them, whenever it is possible, before estimating precipitation. As described in [71], the data quality index results from the combination of the partial QIs associated to each identified error source. A point-by-point description of the operational radar processing chain can be found in [72]. A sensitivity analysis, previously conducted, compared hourly rain gauge and radar data for increasing QI values. The results evidenced that the error (i.e., the difference between radar and rain gauges estimates) has its minimum value for QI = 0.60. At higher QI values, the error increased because of the presence of outliers together to a marked decrease of the sample size [72]. Following this analysis, only QI values equal or greater than 0.60 are considered reliable and are used within RAINBOW algorithm.
Furthermore, a filtering process is applied to the GR data by comparing them with the data collected by the Italian rain gauges network. The radar data showing marked differences with respect to the rain gauges measurements are discarded. The analysis is based on the ratio between the rain gauges and ground radars hourly cumulated data. Namely, the GR data are discarded if the ratio is less than 0.1, being this value chosen because it is much smaller than the average value that the ratio assumes close to the location of a calibrated polarimetric weather radar [73]. At the end of this operational process chain, the Surface Rainfall Intensity (SRI) product is provided over a 1 × 1 km2 grid with a temporal resolution of 10 min. The SRI is obtained taking into account the orography (and the clutter associated), the technical characteristics of the radar (e.g., the various elevation angles and the scanning time frequency, the correction of the partial beam blocking [74,75]. In particular, the single-site SRI is estimated considered the whole radar volume in polar coordinates, then the national composite is computed in Cartesian coordinates. For a given geographical location, the single site SRI is retrieved combining the radar observations at all elevation scans θ k , through a quality-weighted average [71,75,76]. Finally, the national SRI composite is built by combining the single-radar rainfall maps through a quality-weighted approach. In case in a given geographical location two or more radar SRI estimates are available, the one with the highest quality weights more.

2.2. SEVIRI Radiometer

The Spinning Enhanced Visible and InfraRed Imager (SEVIRI) radiometer [77] is the main instrument onboard of Meteosat Second Generation (MSG). The MSG is a geostationary satellite located at about 36,000 km above the Earth surface at 0°N, 0°E. SEVIRI is a passive microwave instrument collecting radiation from a target area and focusing it on detectors sensitive to 12 different bands of the electromagnetic spectrum. The twelve channels are distributed among visible part of electromagnetic spectrum (channels VIS 0.6 µm and VIS 0.8 µm), near-infrared (channel NIR 1.6 µm), infrared (channels IR 3.9 to IR 13.4 µm—for a total of eight channels) and High Resolution Visible (channel HRV 0.75 µm). The SEVIRI nominal time resolution is 15 min, of which twelve minutes are allocated to collect images, while the remaining three minutes are used for calibration, retrace, and stabilization. The SEVIRI spatial resolutions ranges from 1 km for the HRV channel to 3 km for VIS-NIR-IR channels at sub-satellite point (i.e., at 0°N, 0°E). The spatial resolution decreases moving away from the sub-satellite point (e.g., over the study area, the Italian peninsula, it is around 4 km for the VIS-NIR-IR channels).
SEVIRI measures the radiation emitted by a target located along the radiometer field of view (i.e., the total radiation emitted by clouds). Depending on the considered channel, the amount of measured radiation is representative of different cloud characteristics. While the measurement in the VIS channels gives an indication about the optical depth of the cloud, the measurement in the IR channels are generally indicative of different cloud properties. In this study, we focused only on three IR channels, namely channels 5, 6, and 9. Channels 5 and 6 are centered in the emission spectrum of the water vapor (WV) at wavelengths at 6.25 and 7.35 μm, respectively, giving an indication about the cloud optical depth other than to determine the water vapor distribution in two distinct layers of the atmosphere. The IR 10.8 μm channel provides continuous observation of the cloud top temperature. For these channels, the final output of SEVIRI is the brightness temperature (TB) that is defined as the temperature of a black body, which emits the same amount of radiation as observed.

2.3. P-IN-SEVIRI

P-IN-SEVIRI is a precipitation product developed in the Satellite Application Facility on Support to Operational Hydrology and Water Management (H SAF) project [78], providing instantaneous precipitation rate at spatial and temporal SEVIRI resolution. It is provided by EUMETSAT, and it is based on an underlying collection of time and space overlapping overpasses from SEVIRI IR imagers and surface rain rate estimates (through the use of algorithms based on Low Earth Orbit-Passive Microwave (LEO PMW) radiometers), which constitutes a look up table of geo-located relationships between rain rate and TB at 10.8 µm, updated as soon as new overlapping SEVIRI IR and LEO PMW overpasses are available. The processing method is called “Rapid Update” (RU) blending technique [79].
As new input datasets (MW and IR) are available in the processing chain, the MW-derived rain rat (RR) pixels are paired with their time and space-coincident geostationary 10.8 μm IR TB data, using a 10-min maximum allowed time offset between the pixel acquisition times and a maximum space offset of 10 km between the pixel coordinates. Each co-located data increments the histograms of TB and RR within a latitude-longitude box 2.5° wide (i.e., a 2.5° × 2.5° box), as well as the eight surrounding boxes (this overlap ensures a fairly smooth transition in the histogram shape between neighboring boxes). The rationale behind these threshold values for time collocation and box size is discussed by [80].
In order to set-up a meaningful statistical ensemble, the method can look at older MW-IR slot intersections (no older than 24 h), until a certain (75%) box coverage is reached and a minimum number of coincident observations are gathered for a 2.5° × 2.5° region (at present 400 points, this is a tunable parameter in the procedure). Thus, the RU technique requires an initial start-up time period (~24 h), to allow for establishing meaningful, initial relationships all over the considered area.
As soon as a box is refreshed with new data, a probabilistic histogram matching relationship is updated using the MW RR and IR TB probability distribution functions (PDF), and an updated lookup table (histogram file) is created.

2.4. GRISO

The Random Generator of Spatial Interpolation from uncertain Observations (GRISO) [81,82] is an improved kriging-like technique implemented by the International Centre on Environmental Monitoring (CIMA Research Foundation) to provide rainfall rate estimates. As input, GRISO uses the data from the Italian rain gauge network composed by roughly 3000 tipping bucket gauges (the number can change because of new instrument installation or malfunctioning of the available ones). While, in general, the rain gauge temporal sampling can change, instrument-by-instrument, ranging between 1 to 60 min (the minimum sampling time for Italian rain gauges is set to 15 min), the minimum detectable rain amount is equal to 0.2 mm. The GRISO technique preserves the rainfall rate values measured at the gauge location, allowing for a dynamical definition of the covariance structure associated with each rain gauge by the interpolation procedure. Each correlation structure depends both on the rain gauge location and on the accumulation time considered. Furthermore, GRISO is adopted in the H SAF validation procedure in comparison with European ground data [63] and respect to Dual-frequency Precipitation Radar (DPR) precipitation product [72]. The GRISO data available are provided over a regular grid (1 km × 1 km) with an hourly time step.

2.5. Parallax Correction

As highlighted in Section 2.1 and Section 2.2, IT GR has higher spatial resolution than SEVIRI (i.e., 1 km versus to 4 km). The first step to correctly match ground-based radar and satellite observation is the upscale of the IT GR data to the SEVIRI resolution. Preliminarily, it has to be highlighted that satellite observations of the top surface of clouds is affected by the parallax effect (parallax error), which results in a dislocation of the ground mapped position. The parallax error is a function of three factors that is latitude, longitude, and height of the cloud other than the radius of Earth. While latitude and longitude of the cloud and radius of Earth are known, the height of the cloud has to be determined.
To this end, the TB measured by SEVIRI channel 9 (TB10.8) is matched with the vertical profiles of temperature provided by European Centre for Medium-Range Weather Forecasts (ECMWF) Re-Analysis (ERA-Interim) data [83,84,85]. The ERA-Interim data are provided on the same grid of SEVIRI over 37 not equi-spaced pressure levels (from 10 to 1000 hPa corresponding to altitudes ranging from 0 to 16 km about with spatial resolution between 240 and 1400 m about) with a time resolution of six hours (i.e., four runs of the model per day). For each SEVIRI instantaneous field of view (IFOV), the TB10.8 is compared with the corresponding and closest in time vertical profile of temperature provided by ERA-Interim in order to estimate the cloud top height. At this point, the formula reported by Equation (1) can be applied to quantify the parallax displacement as function of longitude and latitude:
Δ γ ( λ , ϕ ) = P · 1 c o s 2 λ · c o s 2 ϕ P · c o s λ · c o s ϕ 1 · h R
where P = 1 + H R with H distance between satellite and Earth surface (~36,000 km), R radius of Earth, h height of cloud top, λ and ϕ longitude and latitude, respectively. Once that Δγ(λ,ϕ) is calculated, it can be converted in number of SEVIRI IFOV displacement both in longitude and latitude. The cloud is then moved to the correct position. The parallax displacement can be marked over the Mediterranean area depending on the cloud top height.
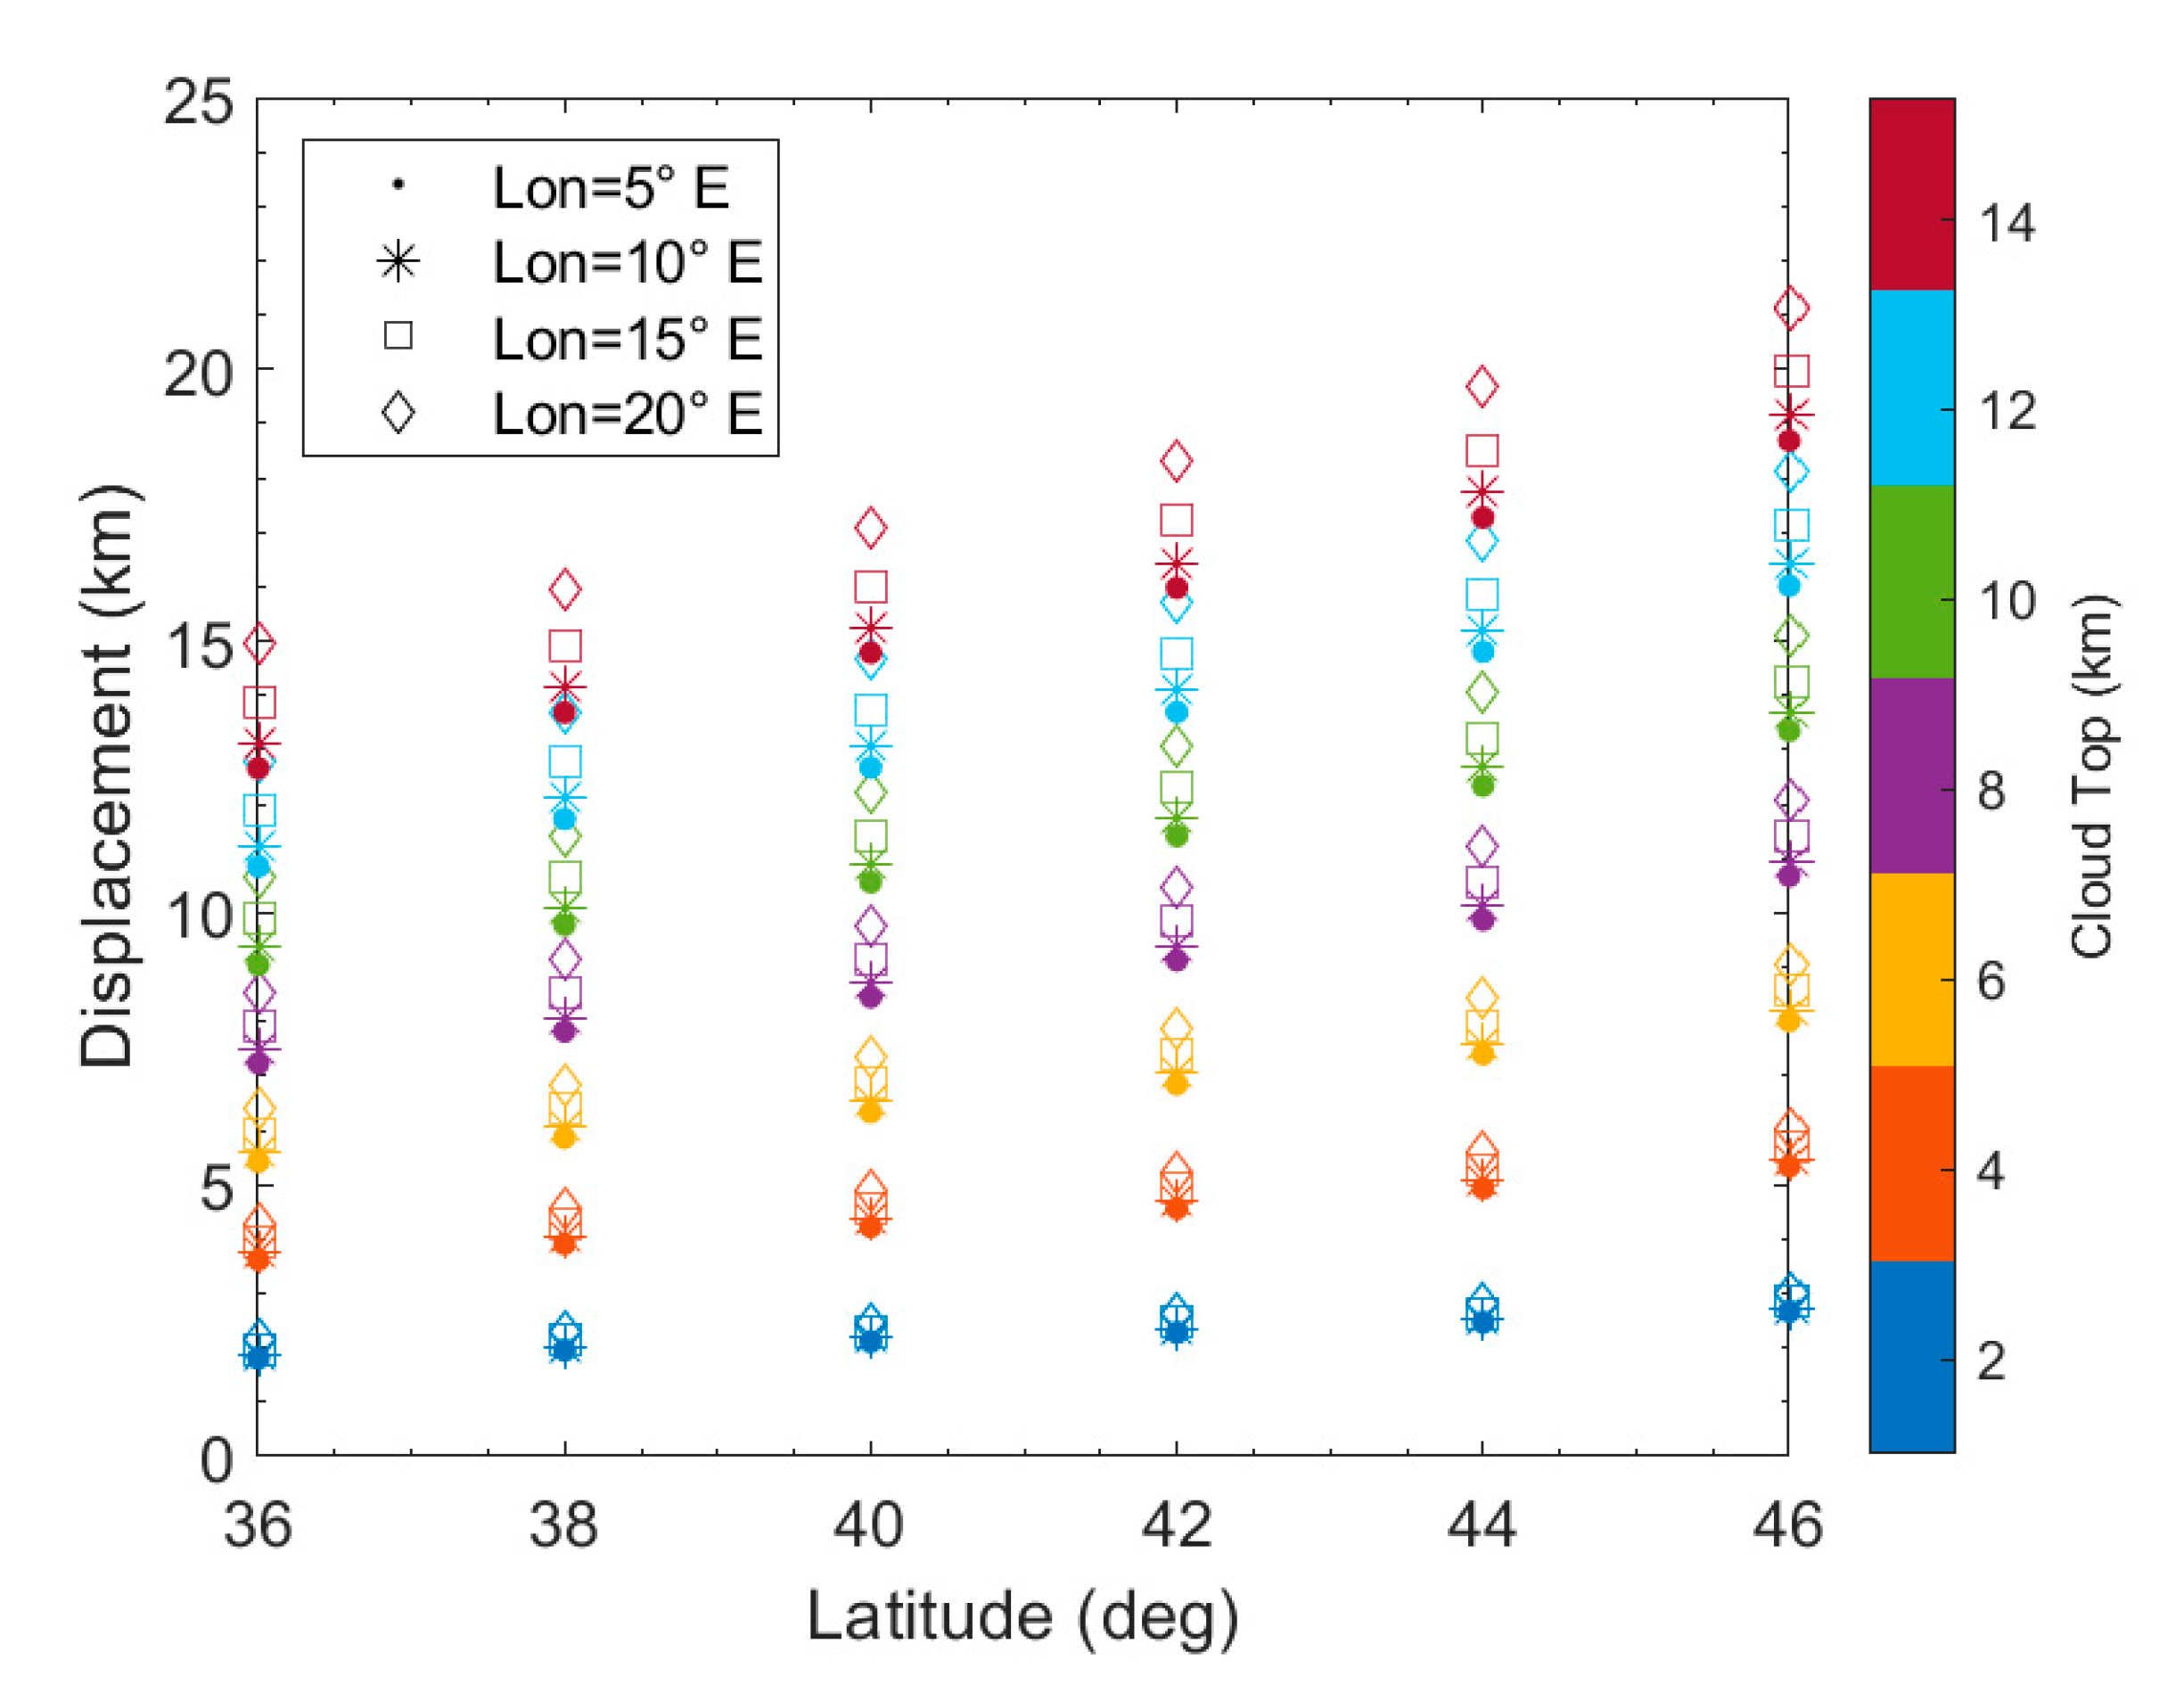
Figure 2 shows the parallax displacement (in km) as function of latitude, longitude and cloud top height. The parallax displacement for low clouds is almost constant around 2.3 km, regardless of the coordinates (latitude, longitude) of the measurement point. For higher cloud top, the displacement becomes significant (up to 15–20 km), depending also on the geographical position. The displacement varies by about 5/6 km for cloud heights of 11/14 km moving from south to north (i.e., from 36°N to 46°N and at a given longitude). Moving from west to east (and, therefore, at the same latitude), the variability of the parallax displacement is more limited (from about 1.5 to 2 km).

2.6. RAINBOW Algorithm

The RAINBOW algorithm is composed by a static module, which has been developed using historical data, and a dynamic module, which continuously updates the data to be used.
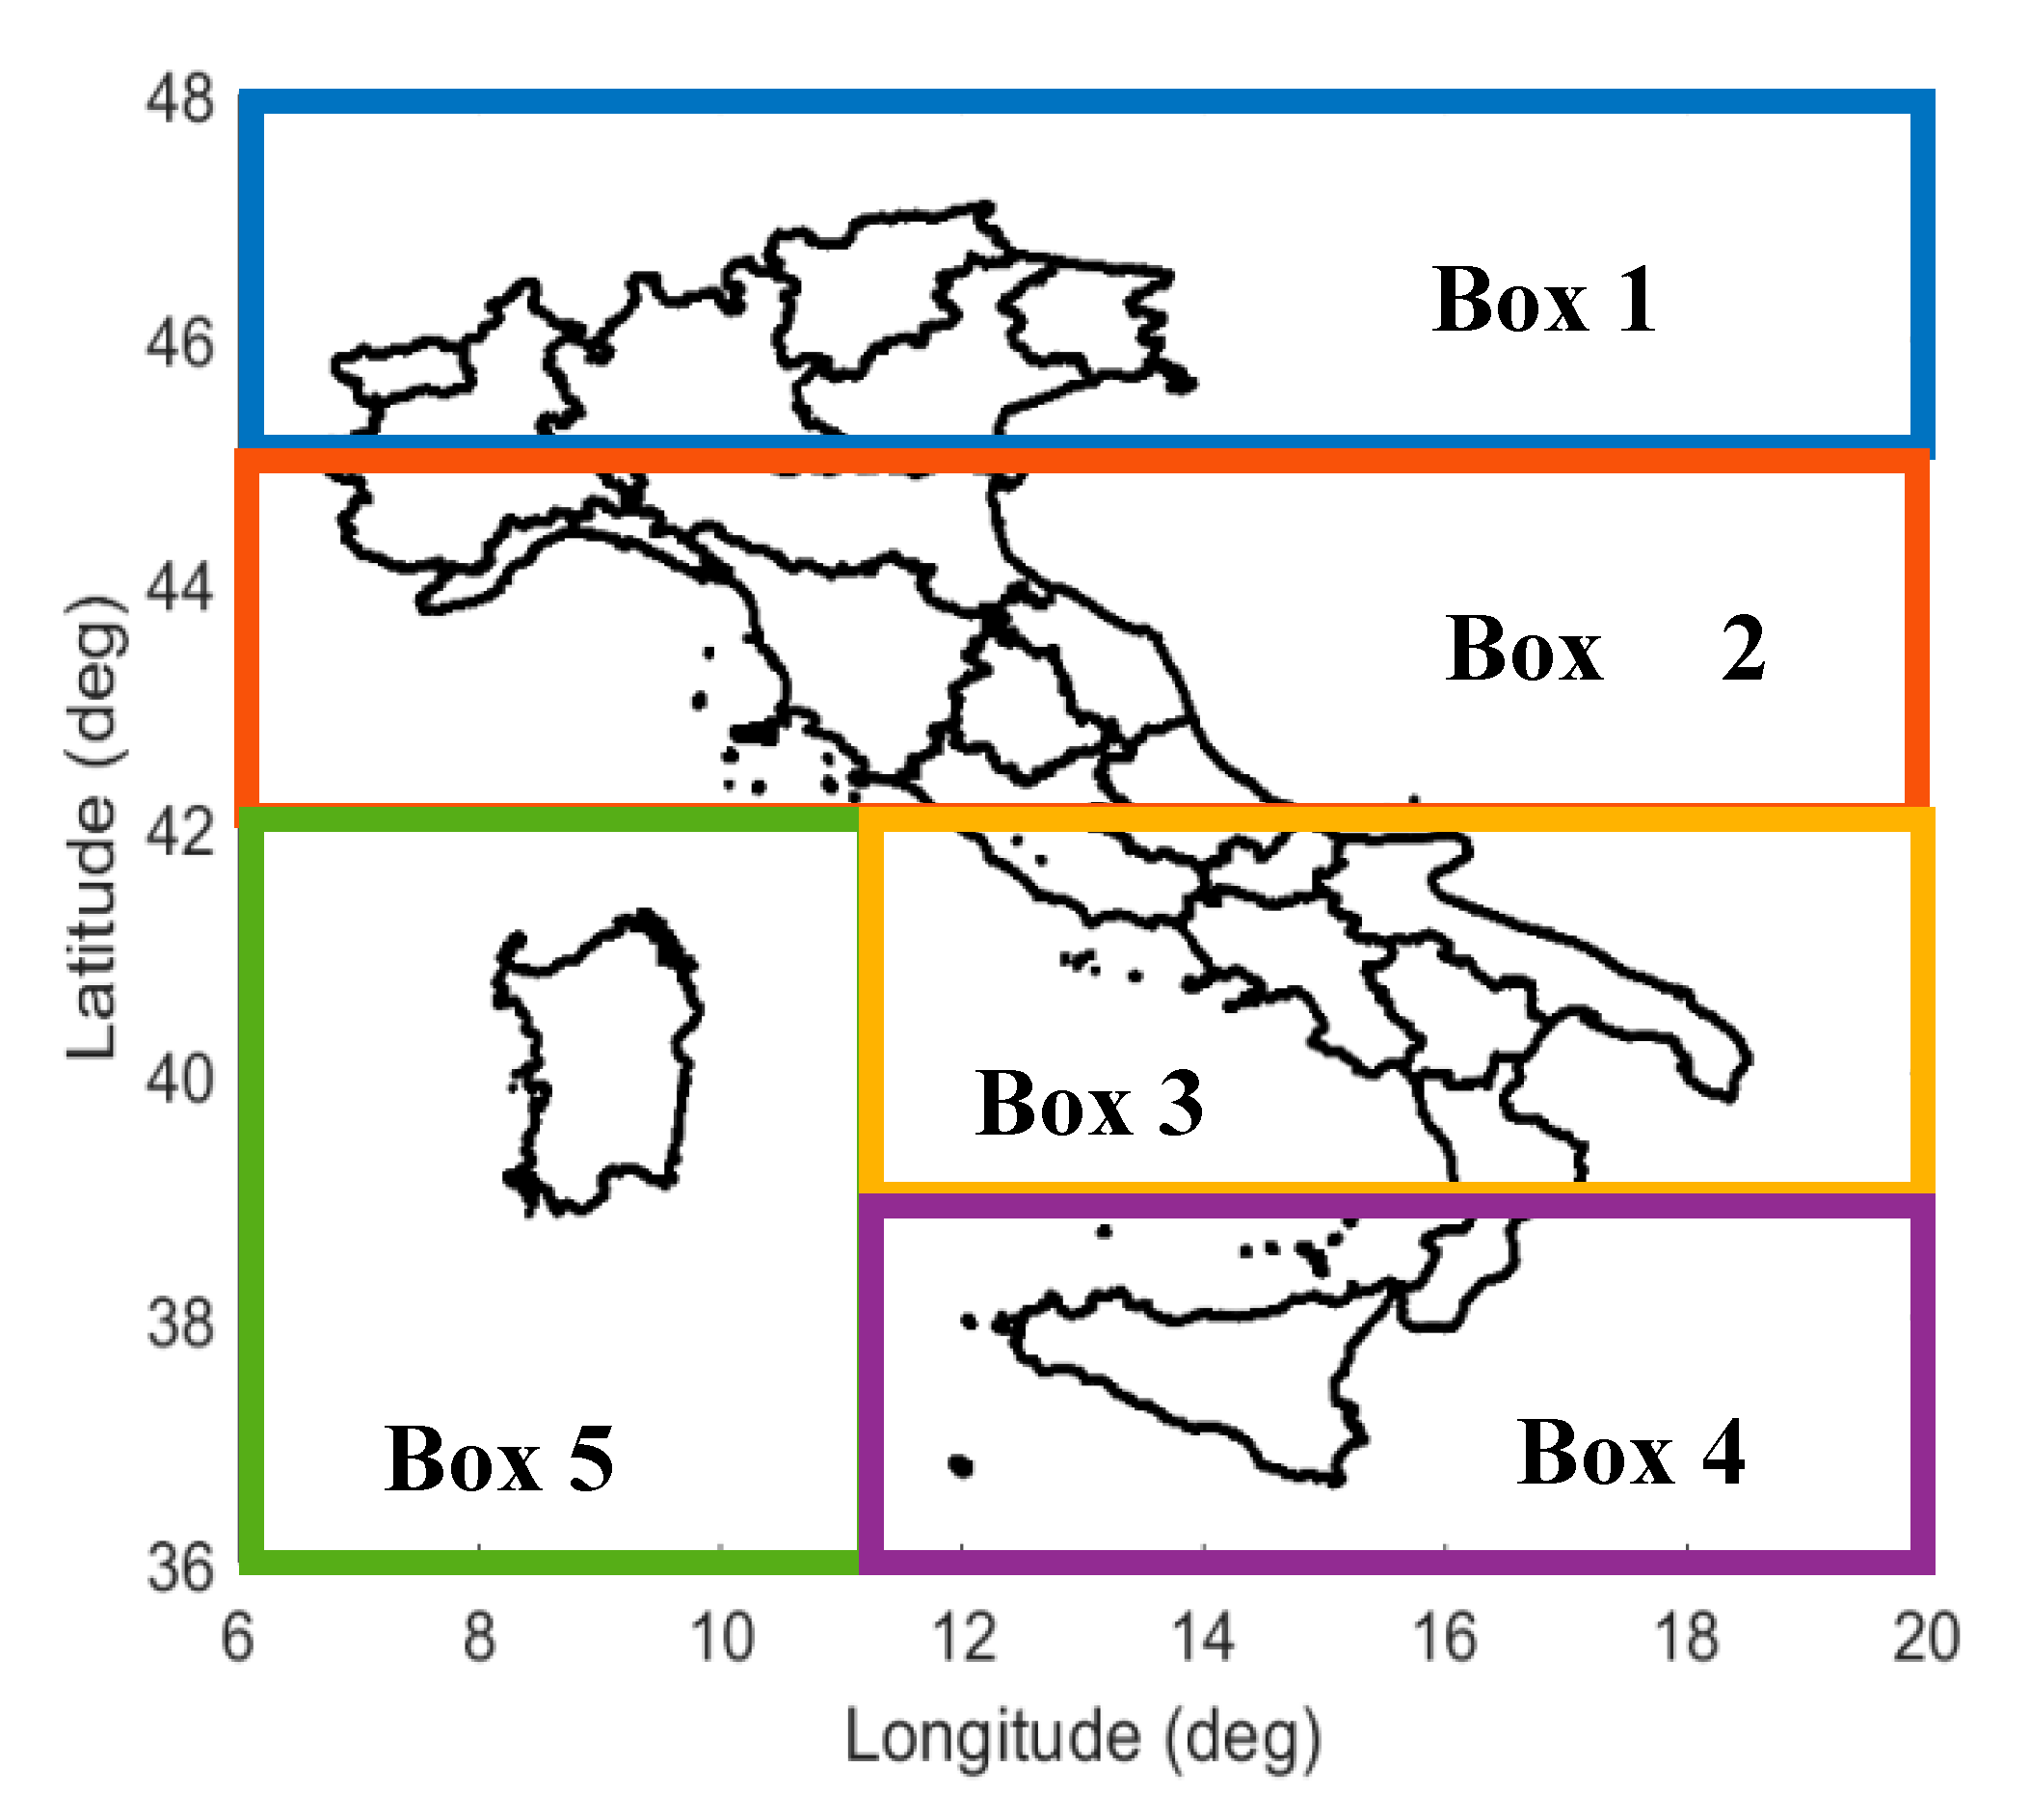
Both static and dynamic modules of RAINBOW have been developed for each of the five geographical boxes in which the area of interest has been divided (Figure 3). The choice to divide the area of study in geographical boxes is mainly related to the fact that precipitations with different microphysics properties can occurred over the Italian territory (e.g., a precipitation over the Alps may have different characteristics of a simultaneous precipitation over sea and/or in proximity of the coast). In addition, the precipitation occurring at the same time in different locations could be at different stage of its evolution. Dividing the area of study in geographical boxes mitigates the problems deriving from the situations just above described. In general, the smaller the box the better is the characterization of the precipitation. However, the box size has to be large enough to ensure an adequate number of samples in order to perform a reliable calibration. At the same time, an excessive number of geographical boxes can create discontinuities in the transition zones (i.e., on the line connecting two adjacent boxes). It was found that a good trade-off for the Italian country was to divide the country in five boxes.
The RAINBOW algorithm works with data at SEVIRI spatial and temporal resolution and provides the output at the same spatial and temporal resolution. Thus, the first step is to downscale the SRI data at SEVIRI resolution. The SRI pixels selected for each SEVIRI IFOV have to satisfy two different thresholds:
The mean QI is calculated considering all the IT GR pixels within a SEVIRI IFOV. To consider the IFOV useful, the mean QI has to be higher than 60%.
If the threshold of 60% for the mean QI is overcome, the mean SRI (i.e., the mean precipitation rate for a SEVIRI IFOV) is calculated by considering only the pixel with QI ≥ 80%. The threshold at 80% allows to discard the pixels affected by any possible spurious signal (e.g., noise, beam blockage, etc.). At the same time, the maximum SRI value is stored.
At this point, RAINBOW decides if to use the static or dynamic part of the algorithm. The decision is based on the number of useful IFOVs in each geographical box (i.e., the IFOVs with both RR and TB data) collected both in the last hour with respect to the running time and in the last SEVIRI acquisition (we recall that GR data have higher temporal resolution than SEVIRI, ten versus 15 min, respectively). In particular, if the number of useful IFOVs in the last hour is higher (or equal) than 50% and, the number of useful IFOVs in the last acquisition is higher (or equal) than 10% or lower than 10% but the maximum RR exceed 3 mmh−1, the dynamic module of RAINBOW algorithm is applied. On the other hand, if these conditions are not satisfied, the static module of RAINBOW algorithm is used. The thresholds are defined through sensitivity tests changing both the percentage of useful IFOVs and the maximum RR value. The final output of both dynamic and static part of RAINBOW is a RR-TB10.8 relationship, for each geographical box, to be applied to the SEVIRI data in order to give precipitation estimation. The main difference between the two modules is that the dynamic one updates and changes the RR-TB10.8 relationship at each new SEVIRI acquisition, while the static one makes use of RR-TB10.8 relationships obtained by considering the whole dataset available (i.e., from 1 July, 2015 to 31 December, 2017). Furthermore, a RR-TB10.8 relationship for each meteorological season is derived in the static module. The RR-TB10.8 relationship is obtained by sampling the TB10.8 between 200 K and 270 K in 35 bins 2 K width. For each bin, the mean rainfall rate and the mean of maxima rainfall rates are calculated. More specifically, the TB10.8 spectrum is split in two parts, one between 200 K and 220 K and one between 220 K and 270 K, and two RR-TB10.8 relationships are derived. A second degree polynomial RR-TB10.8 relationship is derived for the first part of TB10.8 spectrum (200 ≤ TB10.8 ≤ 220 K), while a first degree polynomial RR-TB10.8 relationship is derived for the first part of TB10.8 spectrum (220 < TB10.8 ≤ 270 K).
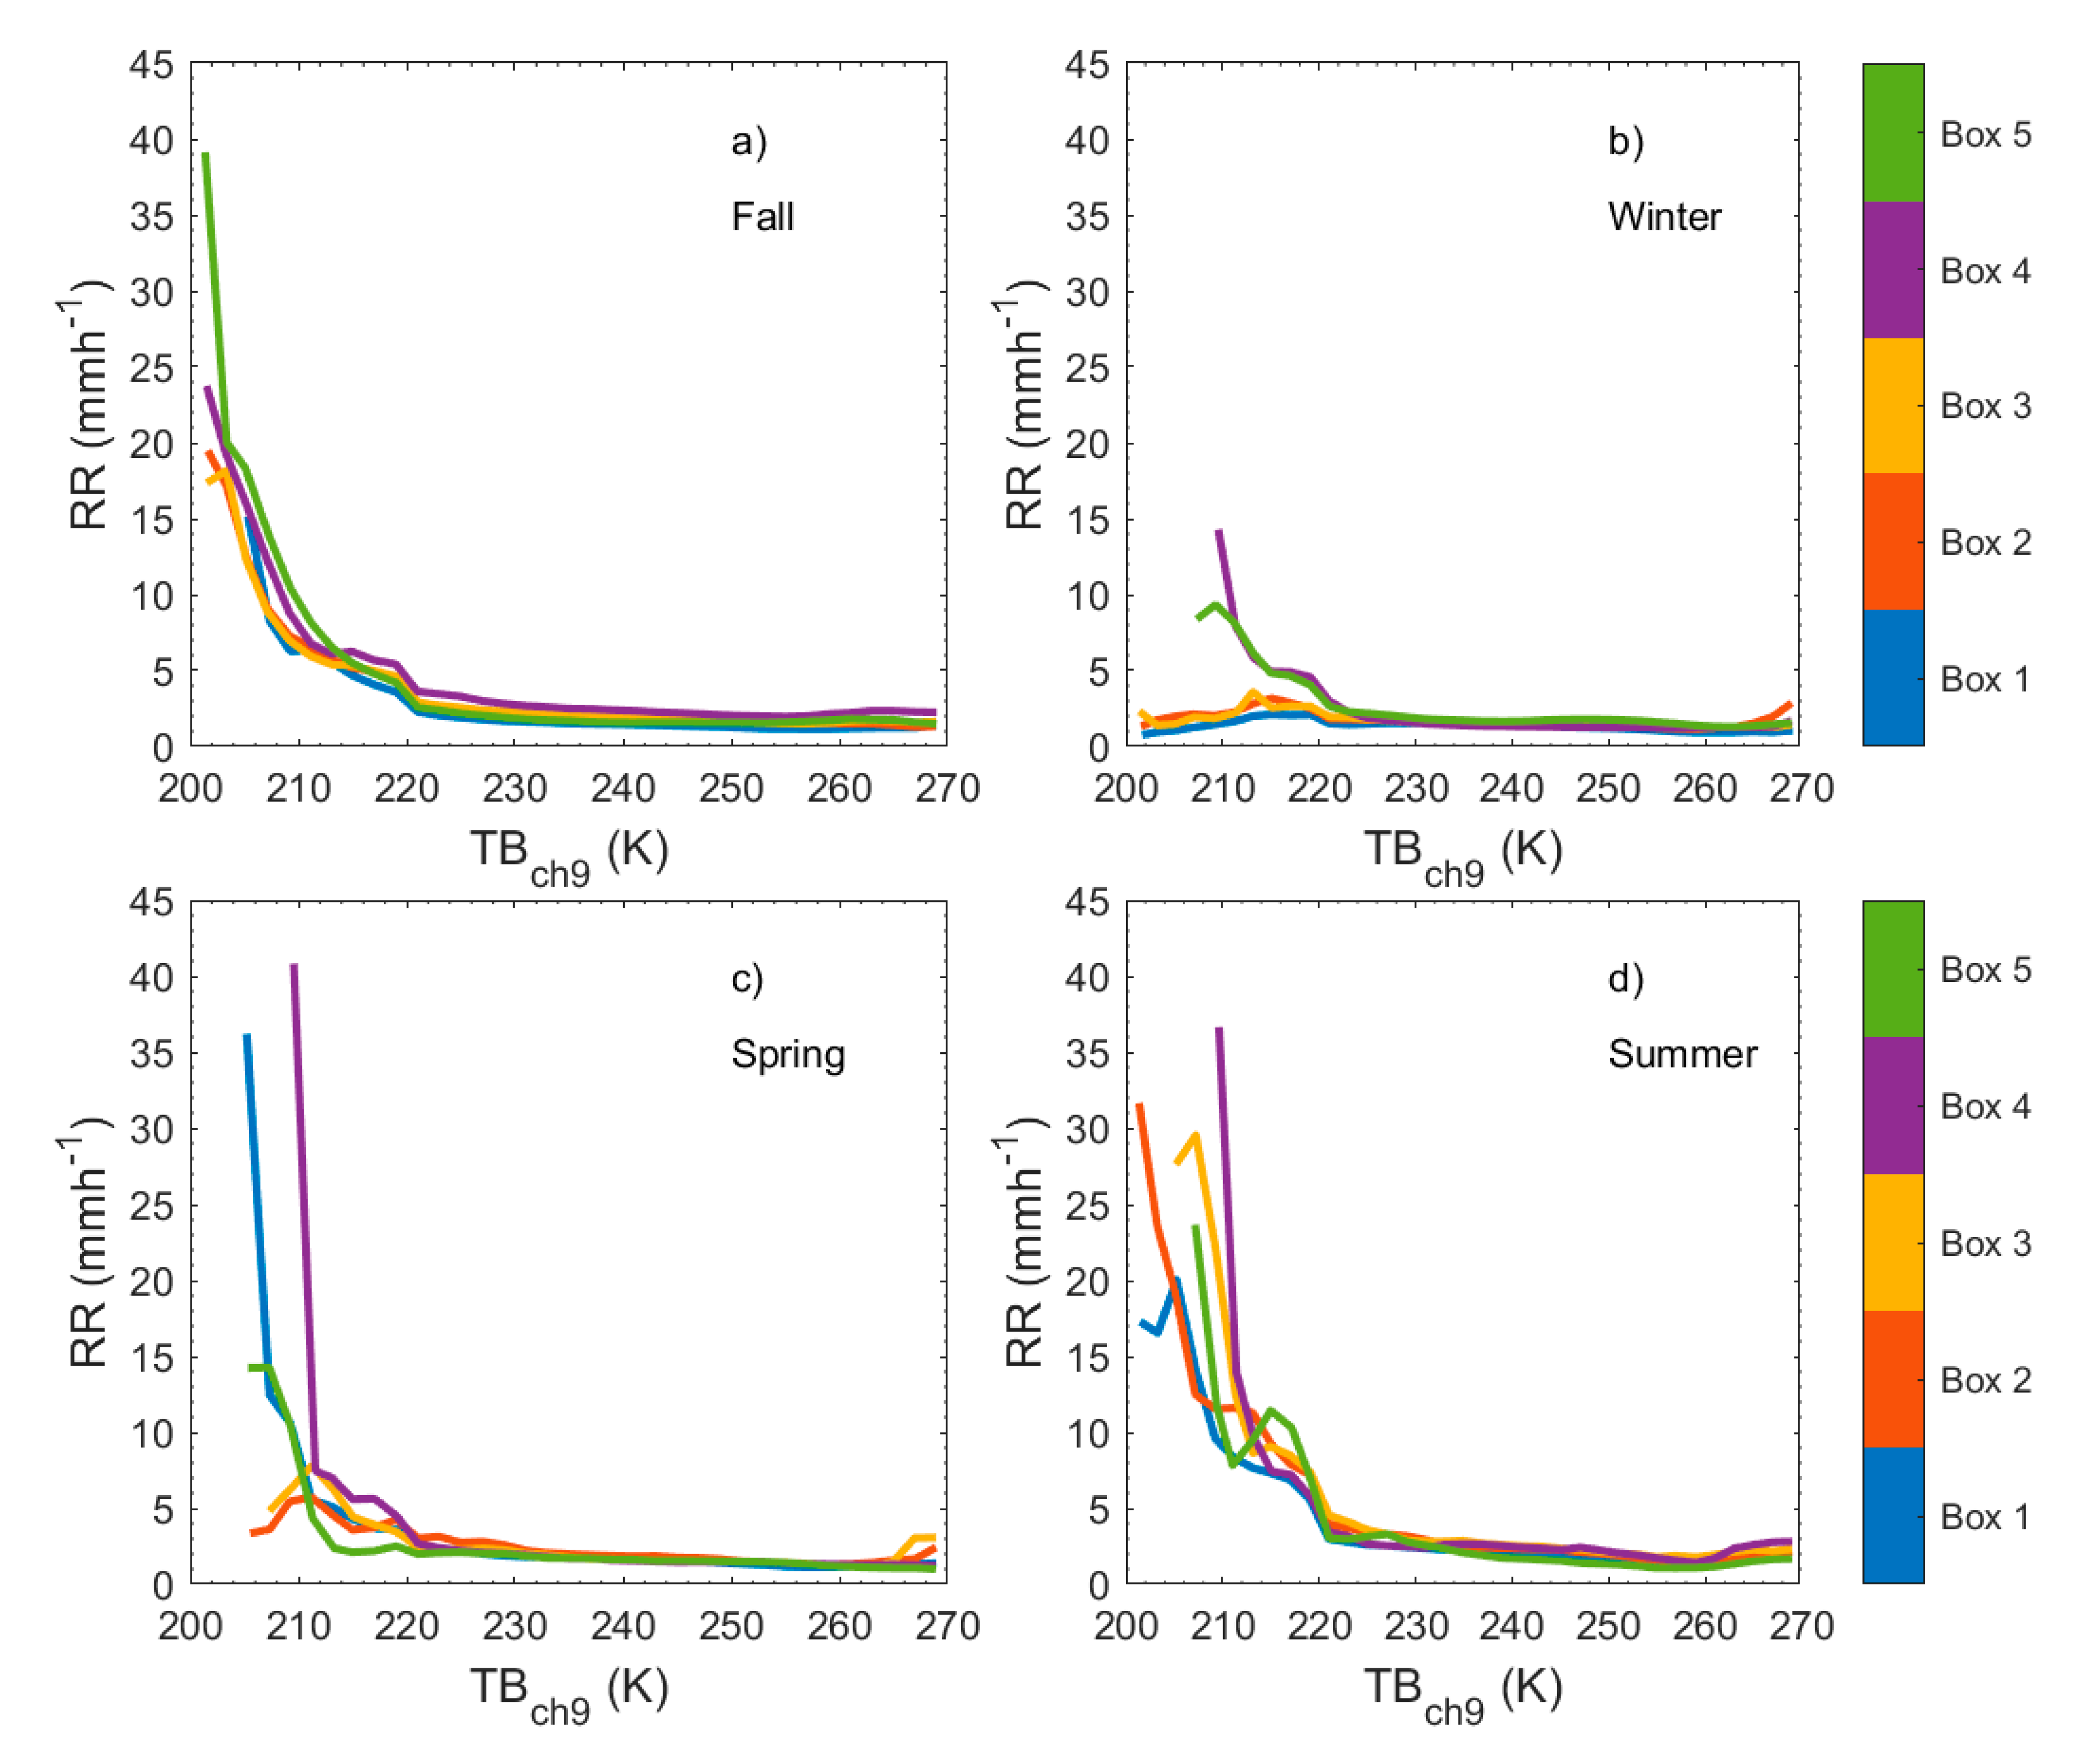
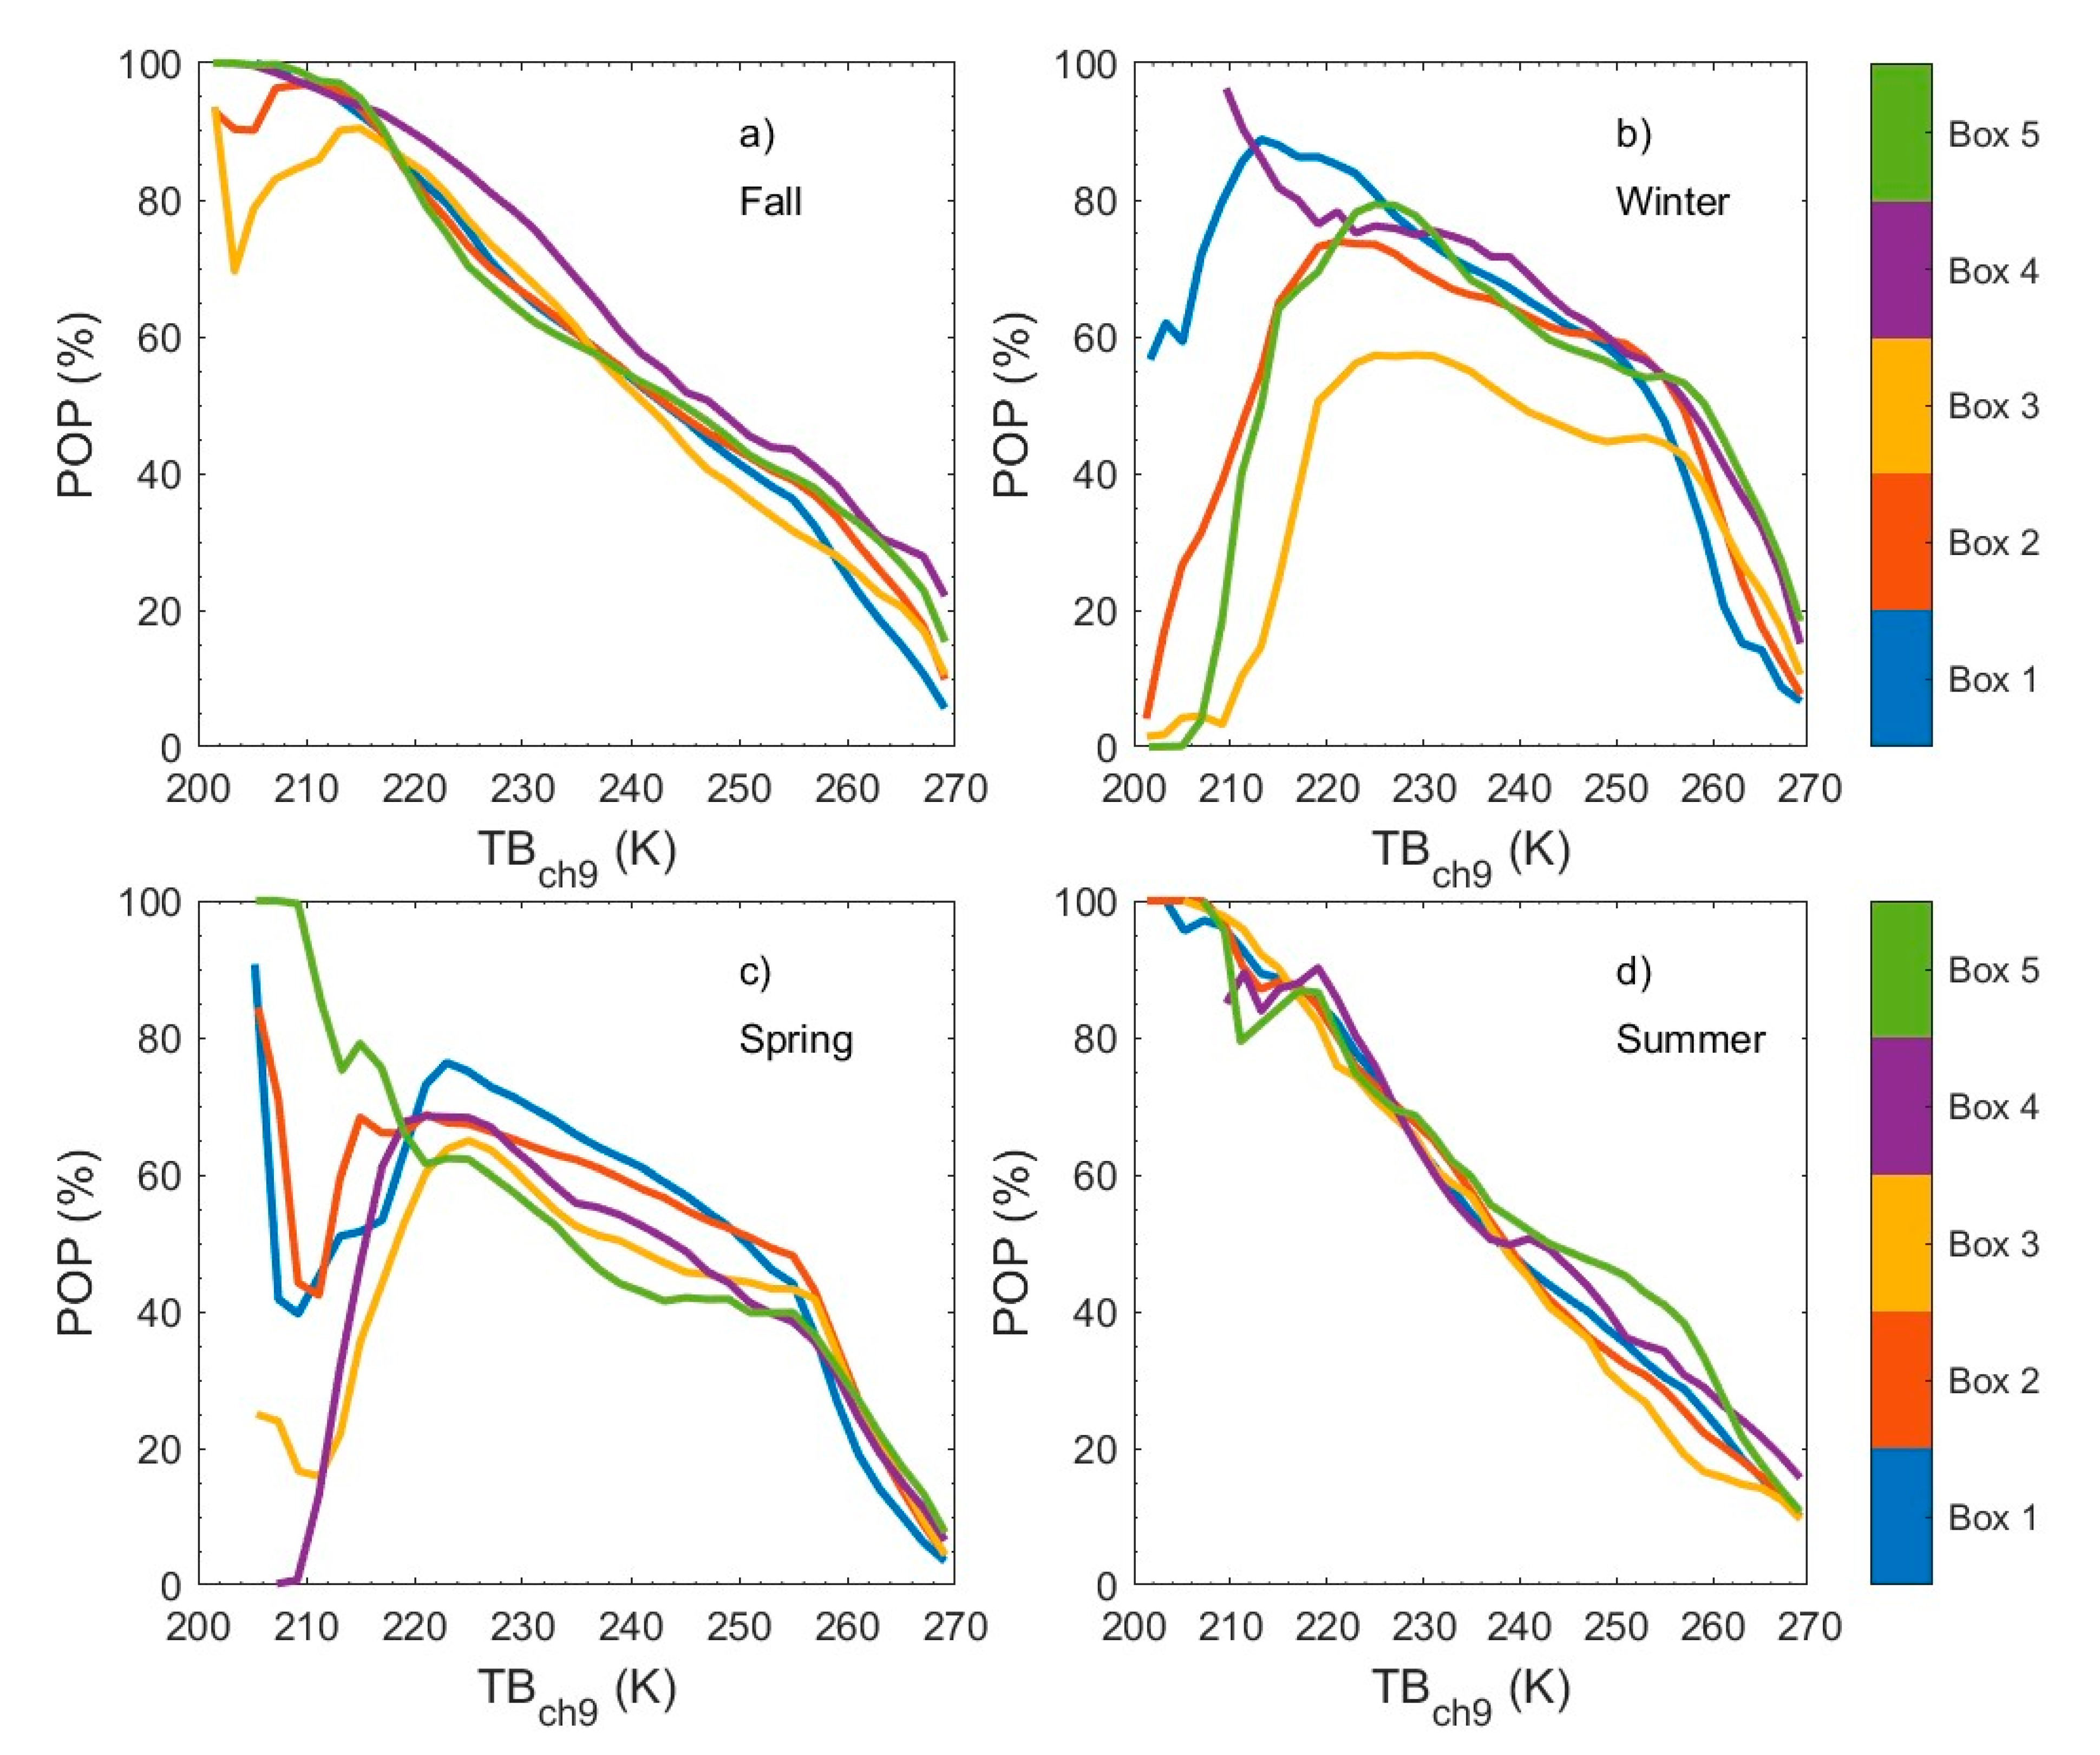
Figure 4 shows, as an example, the RR-TB10.8 relationship obtained from the whole dataset for each season and each box used by the static module of the algorithm. It outlines how the higher rainfall rates are associated to the lower TB10.8. Fall and summer (Figure 4a–d) are the seasons where this relationship is more straightforward for all the considered geographical boxes. At the same time, winter (Figure 4b) is the season with the lowest precipitation rate (as could be expected) and with a very light relationship between RR and TB10.8. Together to the RR-TB10.8 relationship, the probability of precipitation (POP) is calculated for each TB10.8 bin and the corresponding POP-TB10.8 relationship is derived. The POP is defined as the ratio between the number of SEVIRI IFOVs with precipitation (RR ≥ 0.25 mmh−1) and the number of SEVIRI IFOVs with no precipitation (RR < 0.25 mmh−1). As for the RR-TB10.8 relationship, the dynamic module of RAINBOW updates and changes the POP-TB10.8 relationship at each SEVIRI acquisition, while the static module again takes advantages of the POP-TB10.8 relationship (for each box and each season) built by using the whole available dataset.
Figure 5 reports the POP-TB10.8 relationships derived for each season and each box. The POP clearly increases decreasing the TB10.8 during fall and summer season (Figure 5a–d), reaching the 100% for TB10.8 as low as 210 K (boxes 2 and 3 show a decrease of POP for TB10.8 < 210 K during fall season—Figure 5a). Not as straightforward as for fall/summer is the POP-TB10.8 relationship for spring/winter (Figure 5b–c). There is a sharp decrease of POP at TB10.8 higher than 255 K. At the same time, POP increases decreasing TB10.8 up to 220 K about; then, the trend diversifies among the boxes, with most of them showing a marked decrease of POP for TB10.8 lower than 220 K. Among these, someone present a sharp increase when TB10.8 reaches values lower than 210K. The decrease of POP at lower TB10.8 values is mainly related to the presence of cirrus clouds, which are no-precipitating clouds with very low cloud top temperature. The occurrence of cirrus clouds reaches a maximum (minimum) in winter (summer) [86]. This aspect is related to the lower temperature in the troposphere during winter that favors both the formation and the maintenance of ice crystals, which are the constituents of this type of clouds [87].

3. Results

The methodology described above has been applied to several case studies. The algorithm performances were analyzed by comparing the RAINBOW precipitation retrievals with the outputs of GRISO and P-IN-SEVIRI on a regular grid (0.25° × 0.25°) for ten selected case studies (occurred in 2016 and 2017). Furthermore, the potentialities and limitations of RAINBOW are discussed for two outputs of the algorithm considering two different case studies.
The first considered event occurred in the night between 9 and 10 September, 2017, causing a flash flood which hit the coastal city of Livorno (43.5°N, 10.3°E), in the Tuscany region. In the area around the city, three rain gauges measured more than 230 mm of accumulated precipitation in six hours (00:00–06:00 UTC), with peaks of 150 mm h−1 registered between 01:00 and 03:00 UTC.
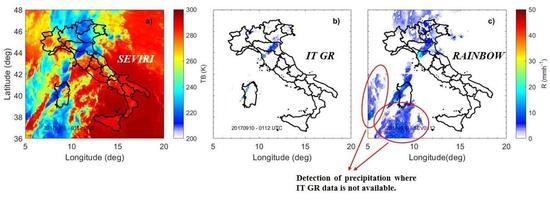
Regarding the event observed on 10 September 2017, Figure 6 shows the TB10.8 as measured by SEVIRI (Figure 6a), the instantaneous rainfall rate as estimated by IT GR network at SEVIRI spatial resolution (Figure 6b) and by RAINBOW (Figure 6c) at 01:12 UTC, respectively. The SEVIRI TB10.8 (Figure 6a) highlights the presence of a V-shaped thunderstorm hitting mainly the north part of Tuscany region. The updraft core developed over sea, just offshore of the coastal line remained stationary for several hours (roughly between 18:00 UTC of 9 September and the 03:00 UTC of 10 September). Values of TB10.8 as low as about 210 K are measured in the updraft core corresponding to a cloud top height around 12 km. The plot also outlines the presence of a storm line across the Sardinia region. The IT GR network estimated rainfall rate values up to 50 mmh−1 (Figure 6b) within a SEVIRI IFOV (i.e., around 4 km × 4 km). At the same time, the spatial extension of the storm is quite limited both in terms of cloud and precipitation coverage. The same can be said for the precipitation across the Sardinia even if the estimated rainfall rates reach lower values up to 40 mmh−1. Finally, lighter precipitation is detected in the northern part of Italy. The RAINBOW rainfall rate estimation (Figure 6c) captures well the two most intense precipitation zones (i.e., the area around Livorno and over Sardinia) but tends to detect precipitation over a larger area than radar. At the same time, the precipitation peak is well identified in both location and intensity, with a slight underestimation of the most intense cells.
Figure 7 shows a snapshot relative to the 04:12 UTC for the case study of 14 October, 2016. Although the storm involved the same region (at least at that time), different properties of RAINBOW can be highlighted by the analysis if this case study. The case study reported in Figure 7 presents different characteristics showing two convective cells, one between Tuscany and Emilia Romagna regions, and one out of the Italian territory over south France (partially over sea and partially over land). Both convective cells have bigger spatial extension and even colder TB10.8 values up to 205 K about (Figure 7a). To the big cloud extension does not correspond an equal precipitation extension; in fact, the IT GR network shows scattered and small precipitation clusters with a quite wide range of intensity from few mmh−1 to almost 50 mmh−1 (Figure 7b). Analyzing the precipitation estimated by RAINBOW, it is possible to note significant differences with respect to SRI (Figure 7c):
The rainfall rate peak estimated by RAINBOW is weaker than that estimated by IT GR, with maximum values around 20 mmh−1. This can be mainly attributed to the limited number of IFOVs with intense rainfall rate considered in the calibration process.
RAINBOW is able to estimate precipitation for the convective cell over France and for the small cell on the border between Tuscany and Umbria region (red circle in Figure 7c). However, the precipitation corresponding to this latter cell is slightly overestimated, in terms of spatial extension, by RAINBOW. On the other hand, the precipitation cluster centered on the coastal line of Tuscany is well detected by RAINBOW. In the operational frame in which the algorithm is intended, this case study highlights the potentialities of RAINBOW. The precipitation detection of the two cells can be considered as warning of a possible event moving toward the Italian territory and as complementary to the SRI estimation, respectively.

4. Discussion

The algorithm performances were assessed by comparing the RAINBOW outputs with the GRISO data (taken as reference) on a regular 0.25° × 0.25° grid for 10 case studies. Since both RAINBOW and GRISO are provided at higher but different spatial resolutions, they are up-scaled to a regular 0.25° × 0.25° grid. Both categorical scores (Probability of Detection (POD), False Alarm Ratio (FAR), Heidke Skill Score (HSS)) and continuous scores (mean error (ME) and root mean square error (RMSE)) have been considered [88]. The analysis has been done on an hourly basis (mm of rain fell in this time interval) considering the entire event of each case study. Furthermore, a minimum cumulative hourly rainfall threshold of 0.25 mm and three different intervals of cumulated rain are considered: light 0.25–1 mm, moderate 1–10 mm, and heavy 10–100 mm. The statistical scores above reported have been calculated even between P-IN-SEVIRI and GRISO in order to compare the RAINBOW and P-IN-SEVIRI performances.
The results shown in Figure 8 evidence excellent algorithm performance especially for moderate and heavy precipitation intensity. The Probability of Detection (POD)—Figure 8a) ranges between 0.8 and 1, except for light precipitation (0.25–1 mm); the False Alarm Ratio (FAR)—Figure 8b) has a specular trend with respect to the POD, with higher values for light precipitation and lower for the other rain intervals, while the Heidke Skill Score (HSS)—Figure 8c) follows the trend of the POD with values up to 0.8. It should be noted that the values of POD, FAR, and HSS are almost constant for all 10 case studies, underlining an excellent stability of the algorithm. In particular, HSS increases with time, highlighting that the continuous update of DPR GR network plays a crucial role in the RAINBOW performance by supplying ever-higher quality data input.
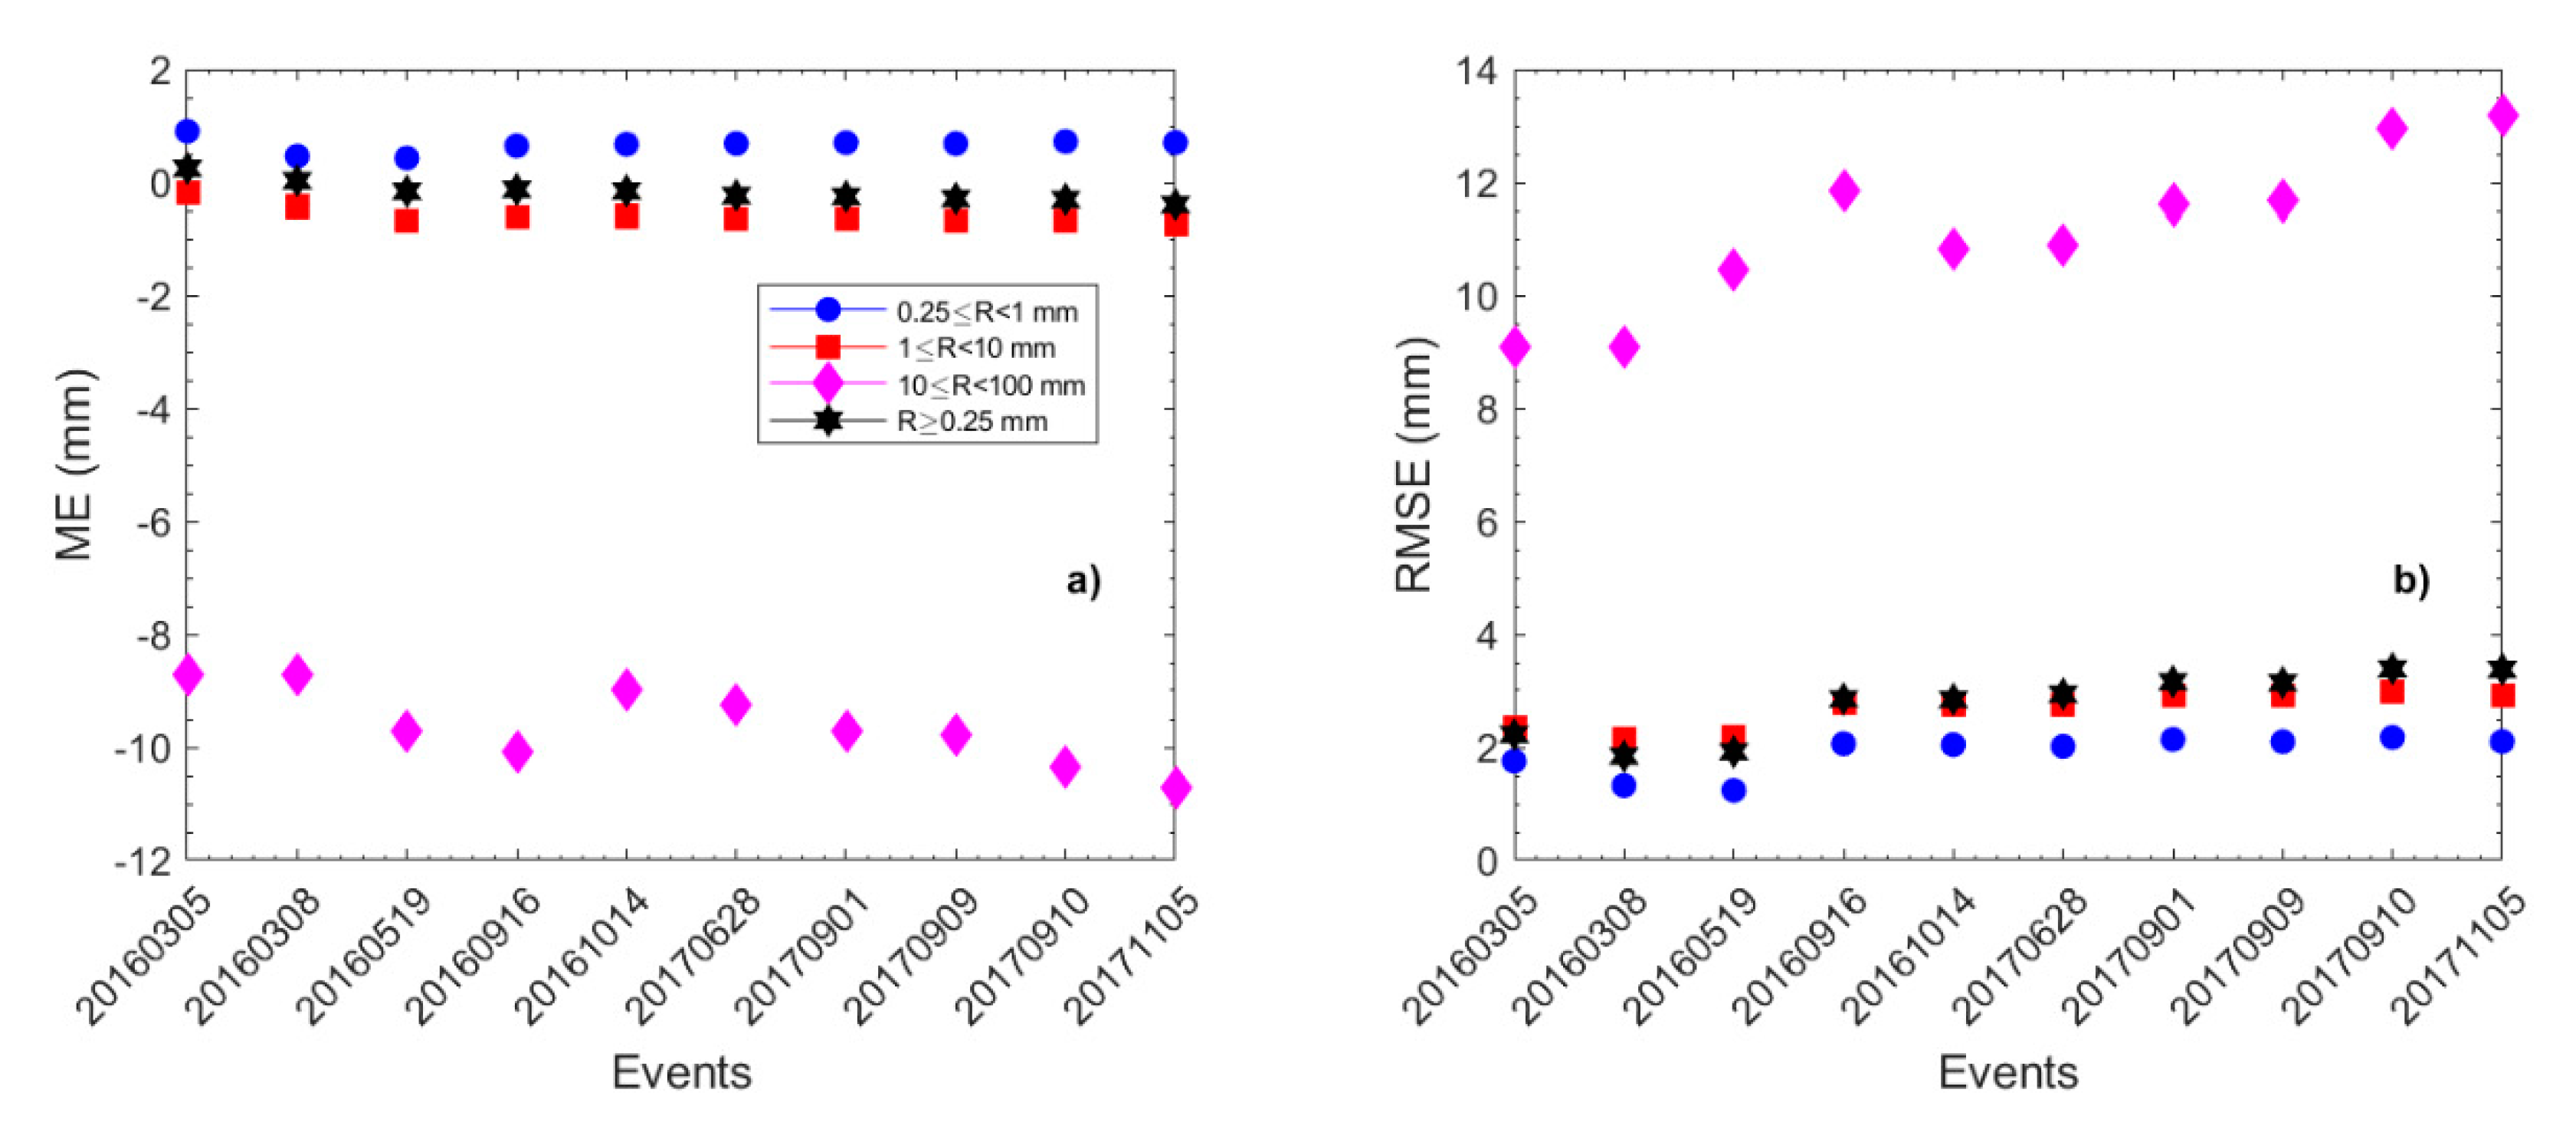
The algorithm error in estimating the precipitation rate is quantified with respect to GRISO by calculating the mean error (ME) and the root mean square error (RMSE). Figure 9a shows that the ME oscillates around 0 mm for all cases and for all precipitation intervals except for heavy intensity where the values range between −7 and −9 mm indicating a clear underestimation of the higher intensities by the algorithm. The good results are confirmed by the RMSE (Figure 9b), which never exceeds 3 mm except for intense rainfall.
A sensitivity study has been conducted in order to evaluate the performance of RAINBOW as a function of the resolution of the regular grid. To this end, four different grids have been chosen ranging from 0.1° × 0.1° to 0.25° × 0.25°. The analysis has been always done on an hourly basis considering only the minimum cumulative hourly rainfall threshold of 0.25 mm.
The results shown in Figure 10 evidence very stable values for the categorical scores as a function of the resolution of the grid. In particular, POD (Figure 10a) has constant values slightly higher than 0.8, while both FAR and HSS (Figure 10b,c, respectively) show a more irregular trend only for the 0.1° × 0.1° grid with higher and lower values, respectively, than the other grids.
The continuous scores in Figure 11 confirm the results shown in Figure 10. The ME (Figure 11a) is always negative, around −0.4 mm, except for the first two case studies of 0.1° × 0.1° grid. On the other hand, the RMSE (Figure 11b) has very limited variations around 3.2 (mm), while for 0.1° × 0.1° grid, it shows an irregular trend with values dropping down up to 1.8 mm.
The same analyses, shown in Figure 8 and Figure 9, have been carried out by comparing the statistical scores calculated for RAINBOW with those one calculated for P-IN-SEVIRI product (always taking GRISO as reference). The results are ported in Figure 10 and Figure 11 for categorical and continuous scores, respectively.
Figure 12 evidences the better performances of RAINBOW in detecting precipitation. The PODRAINBOW is always higher than PODP-IN-SEVIRI (Figure 12a) regardless the intensity of precipitation (different marker shape in the plot) and the different events (labeled by different colors). For light precipitation (circle markers), the PODP-IN-SEVIRI does not exceed 0.3, while PODRAINBOW ranges between 0.5 and 0.7. At moderate and heavy precipitation (and even not considering any rain intervals), while PODRAINBOW is always above 0.8, PODP-IN-SEVIRI shows a wide range of values between 0.2 and 1. At the same time, the FAR is very similar between the two algorithms with most of the points on the one-to-one line and at values generally lower than 0.4 (Figure 12b). The combination of POD and FAR results in constantly higher values oh HSSRAINBOW with respect to P-IN-SEVIRI (Figure 12c). The very good performances of RAINBOW in detecting the precipitation are confirmed by continuous scores, which refer to the precipitation rate estimation.
Figure 13a shows that MERAINBOW and MEP-IN-SEVIRI are very similar for heavier precipitation intensity, while MERAINBOW and MEP-IN-SEVIRI assume values around 0 mm and slightly negative, respectively, for light to moderate precipitation intensity. On the other hand, RMSERAINBOW is generally lower than RMSEP-IN-SEVIRI regardless the precipitation rate (Figure 13b).

5. Conclusions

A new algorithm (RAINBOW) based on the combination of the data collected by SEVIRI onboard of MSG) and by the Italian ground-based radars network (IT GR) to provide precipitation estimation over Italy has been described. The algorithm, consisting of two main modules and operating over five geographical boxes in which the study area is divided, derives and updates (whenever it is possible) second degree polynomial RR-TB10.8 relationships. These relationships are applied to each acquisition of SEVIRI in order to provide a precipitation map. The results, based on a number of case studies, show good performance of the algorithm when it is compared with ground reference (i.e., GRISO precipitation pattern and intensity derived from rain gauge measurements), with high/low values for POD/FAR especially for light to moderate precipitation range. At the same time, the ME values are close to 0 mmh−1, while RMSE is about 2 mmh−1, highlighting a remarkable accuracy of RAINBOW estimates, whereas the capability to detect the precipitation pattern and intensity decreases for severe phenomena. It has to be remarked that severe events could be characterized by high spatial variability, which cannot be accomplished by RAINBOW (due to the SEVIRI instrument characteristics). It is worth noting that the performance of RAINBOW are quite constant through the different case studies with a slight improvement of the performance over time. This is related to the fact that RAINBOW relies on the high quality precipitation rate estimates from IT GR network, which are constantly maintained and upgraded. Furthermore, RAINBOW shows better performance than P-IN-SEVIRI (i.e., the H SAF product based on IR-derived precipitation estimation) when both products are compared to GRISO.
RAINBOW was conceived as an operational product to supply data where the IT GR coverage is absent or it presents low QI values. In this regard, the main aim of RAINBOW is the detection of extreme events that are barely observed by IT GR network in order to support the pre-alarm system for the hydro-geological risks and the life threatening conditions related to the incoming extreme events. Furthermore, the algorithm has to comply with short running time and with ease of management, which are fundamental aspects in a pre-alarm system. RAINBOW ensures running time comparable (or even shorter) with the IT GR running time and significantly shorter than P-IN-SEVIRI running time.
The next launch (scheduled in December 2021) of Flexible Combined Imager (FCI) on board of Meteosat Third Generation (MTG), will be useful to further improve the performance of RAINBOW. The higher number of channels available, the higher spatial and temporal resolution will provide higher quality data to characterize, also, very local severe events.

Author Contributions

Conceptualization, L.P.D. and S.D.; Methodology, L.P.D., P.S., and S.D.; Validation, L.P.D.; Formal Analysis, L.P.D.; Investigation, L.P.D.; Resources, S.D., S.P., G.V., and M.P.; Data Curation, L.P.D. and M.P.; Writing—Original Draft Preparation, L.P.D.; Writing—Review & Editing, P.S., S.D., G.V., and M.P.; Visualization, L.P.D.; Supervision, L.P.D. and S.D. All authors have read and agreed to the published version of the manuscript.

Funding

This work was partially funded by the agreement between CNR-ISAC and the Italian Department of Civil Protection.

Conflicts of Interest

The authors declare no conflict of interest.

References

  1. Bringi, V.N.; Chandrasekar, V. Polarimetric Doppler Weather Radar: Principles and Applications; Cambridge University Press: Cambridge, UK; New York, NY, USA, 2001; ISBN 978-0-521-62384-1. [Google Scholar]
  2. Kirstetter, P.-E.; Delrieu, G.; Boudevillain, B.; Obled, C. Toward an error model for radar quantitative precipitation estimation in the Cévennes–Vivarais region, France. J. Hydrol. 2010, 394, 28–41. [Google Scholar] [CrossRef]
  3. Vulpiani, G.; Montopoli, M.; Passeri, L.D.; Gioia, A.G.; Giordano, P.; Marzano, F.S. On the use of Dual-Polarized C-Band radar for operational rainfall retrieval in mountainous areas. J. Appl. Meteorol. Climatol. 2012, 51, 405–425. [Google Scholar] [CrossRef]
  4. Derin, Y.; Anagnostou, E.; Anagnostou, M.N.; Kalogiros, J.; Casella, D.; Marra, A.C.; Panegrossi, G.; Sano, P. Passive microwave rainfall error analysis using high-resolution X-Band Dual-Polarization radar observations in complex terrain. IEEE Trans. Geosci. Remote Sens. 2018, 56, 2565–2586. [Google Scholar] [CrossRef]
  5. Bennartz, R.; Thoss, A.; Dybbroe, A.; Michelson, D.B. Precipitation analysis using the Advanced Microwave Sounding Unit in support of nowcasting applications. Meteorol. Appl. 2002, 9, 177–189. [Google Scholar] [CrossRef]
  6. Stephens, G.L.; Kummerow, C.D. The Remote Sensing of Clouds and Precipitation from Space: A Review. J. Atmos. Sci. 2007, 64, 3742–3765. [Google Scholar] [CrossRef]
  7. Kidd, C.; Matsui, T.; Chern, J.; Mohr, K.; Kummerow, C.; Randel, D. Global precipitation estimates from cross-track passive microwave observations using a physically based retrieval scheme. J. Hydrometeorol. 2016, 17, 383–400. [Google Scholar] [CrossRef] [Green Version]
  8. Levizzani, V.; Cattani, E. Satellite remote sensing of precipitation and the terrestrial water cycle in a changing climate. Remote Sens. 2019, 11, 2301. [Google Scholar] [CrossRef] [Green Version]
  9. Arkin, P.A.; Meisner, B.N. The relationship between large-scale convective rainfall and cold cloud over the Western Hemisphere during 1982-84. Mon. Weather Rev. 1987, 115, 51–74. [Google Scholar] [CrossRef] [Green Version]
  10. Rickenbach, T.M. Cloud-top evolution of tropical oceanic squall lines from radar reflectivity and infrared satellite data. Mon. Weather Rev. 1999, 127, 2951–2976. [Google Scholar] [CrossRef]
  11. Amorati, R.; Alberoni, P.P.; Levizzani, V.; Nanni, S. IR-based satellite and radar rainfall estimates of convective storms over northern Italy. Meteorol. Appl. 2000, 7, 1–18. [Google Scholar] [CrossRef]
  12. Levizzani, V.; Schmetz, J.; Lutz, H.J.; Kerkmann, J.; Alberoni, P.P.; Cervino, M. Precipitation estimations from geostationary orbit and prospects for METEOSAT Second Generation. Meteorol. Appl. 2001, 8, 23–41. [Google Scholar] [CrossRef]
  13. Lazri, M.; Ameur, S.; Brucker, J.M.; Testud, J.; Hamadache, B.; Hameg, S.; Ouallouche, F.; Mohia, Y. Identification of raining clouds using a method based on optical and microphysical cloud properties from Meteosat second generation daytime and nighttime data. Appl. Water Sci. 2013, 3, 1–11. [Google Scholar] [CrossRef]
  14. Capacci, D.; Porcù, F. Evaluation of a satellite multispectral VIS–IR daytime statistical rain-rate classifier and comparison with passive microwave rainfall estimates. J. Appl. Meteorol. Climatol. 2009, 48, 284–300. [Google Scholar] [CrossRef]
  15. Kühnlein, M.; Thies, B.; Nauß, T.; Bendix, J. Rainfall-rate assignment using MSG SEVIRI Data—A promising approach to spaceborne rainfall-rate retrieval for midlatitudes. J. Appl. Meteorol. Climatol. 2010, 49, 1477–1495. [Google Scholar] [CrossRef]
  16. Kühnlein, M.; Appelhans, T.; Thies, B.; Nauß, T. Precipitation estimates from MSG SEVIRI daytime, nighttime, and twilight data with random forests. J. Appl. Meteorol. Climatol. 2014, 53, 2457–2480. [Google Scholar] [CrossRef] [Green Version]
  17. Feidas, H.; Giannakos, A. Identifying precipitating clouds in Greece using multispectral infrared Meteosat Second Generation satellite data. Theor. Appl. Climatol. 2011, 104, 25–42. [Google Scholar] [CrossRef]
  18. Thies, B.; Nauß, T.; Bendix, J. Precipitation process and rainfall intensity differentiation using Meteosat Second Generation Spinning Enhanced Visible and Infrared Imager data. J. Geophys. Res. 2008, 113, D23. [Google Scholar] [CrossRef]
  19. Anagnostou, E.N.; Kummerow, C. Stratiform and convective classification of rainfall using SSM/I 85-GHz brightness temperature observations. J. Atmos. Ocean. Technol. 1997, 14, 570–575. [Google Scholar] [CrossRef]
  20. Tapiador, F.; Marcos, C.; Sancho, J. The convective rainfall rate from cloud physical properties algorithm for meteosat second-generation satellites: Microphysical basis and intercomparisons using an object-based method. Remote Sens. 2019, 11, 527. [Google Scholar] [CrossRef] [Green Version]
  21. Jurczyk, A.; Szturc, J.; Otop, I.; Ośródka, K.; Struzik, P. Quality-based combination of multi-source precipitation data. Remote Sens. 2020, 12, 1709. [Google Scholar] [CrossRef]
  22. NWC SAF. Algorithm Theoretical Basis Document for the Precipitation Product Processors of the NWC/GEO. 2019. Available online: http://www.nwcsaf.org/Downloads/GEO/2018/Documents/Scientific_Docs/NWC-CDOP2-GEO-AEMET-SCI-ATBD-Precipitation_v2.1.pdf (accessed on 30 July 2020).
  23. Kummerow, C.D.; Tanelli, S.; Takahashi, N.; Furukawa, K.; Klein, M.; Levizzani, V. Plans for Future Missions. In Satellite Precipitation Measurement; Advances in Global Change Research; Levizzani, V., Kidd, C., Kirschbaum, D.B., Kummerow, C.D., Nakamura, K., Turk, F.J., Eds.; Springer International Publishing: Cham, Switzerland, 2020; Volume 67, pp. 99–119. ISBN 978-3-030-24567-2. [Google Scholar]
  24. Bernard, F.; Pasternak, F.; Davancens, R.; Baldit, E.; Luitot, C.; Penquer, A.; Calvel, B.; Buil, C. Overview of IASI-NG the new generation of infrared atmospheric sounder. In Proceedings of the International Conference on Space Optics—ICSO, Tenerife, Spain, 6–10 October 2014; Cugny, B., Sodnik, Z., Karafolas, N., Eds.; SPIE: Tenerife, Spain, 2017; p. 41. [Google Scholar]
  25. Andrey-Andrés, J.; Fourrié, N.; Guidard, V.; Armante, R.; Brunel, P.; Crevoisier, C.; Tournier, B. A simulated observation database to assess the impact of the IASI-NG hyperspectral infrared sounder. Atmos. Meas. Tech. 2018, 11, 803–818. [Google Scholar] [CrossRef] [Green Version]
  26. Mugnai, A.; Cooper, H.J.; Smith, E.A.; Tripoli, G.J. Simulation of microwave brightness temperatures of an evolving hailstorm at SSM/I frequencies. Bull. Am. Meteorol. Soc. 1990, 71, 2–13. [Google Scholar] [CrossRef] [Green Version]
  27. Wilheit, T.; Adler, R.; Avery, S.; Barrett, E.; Bauer, P.; Berg, W.; Chang, A.; Ferriday, J.; Grody, N.; Goodman, S.; et al. Algorithms for the retrieval of rainfall from passive microwave measurements. Remote Sens. Rev. 1994, 11, 163–194. [Google Scholar] [CrossRef]
  28. Weng, F.; Grody, N.C. Retrieval of Ice cloud parameters using a microwave imaging radiometer. J. Atmos. Sci. 2000, 57, 1069–1081. [Google Scholar] [CrossRef]
  29. Bennartz, R.; Petty, G.W. The sensitivity of microwave remote sensing observations of precipitation to ice particle size distributions. J. Appl. Meteorol. 2001, 40, 345–364. [Google Scholar] [CrossRef]
  30. Bauer, P.; Moreau, E.; Di Michele, S. Hydrometeor retrieval accuracy using microwave window and sounding channel observations. J. Appl. Meteorol. 2005, 44, 1016–1032. [Google Scholar] [CrossRef]
  31. Kidd, C.; Kniveton, D.R.; Todd, M.C.; Bellerby, T.J. Satellite rainfall estimation using combined passive microwave and infrared algorithms. J. Hydrometeorol. 2003, 4, 1088–1104. [Google Scholar] [CrossRef]
  32. Marzano, F.S.; Palmacci, M.; Cimini, D.; Giuliani, G.; Turk, F.J. Multivariate statistical integration of Satellite infrared and microwave radiometric measurements for rainfall retrieval at the geostationary scale. IEEE Trans. Geosci. Remote Sens. 2004, 42, 1018–1032. [Google Scholar] [CrossRef]
  33. Kidd, C.; Huffman, G. Global precipitation measurement: Global precipitation measurement. Meteorol. Appl. 2011, 18, 334–353. [Google Scholar] [CrossRef]
  34. Tapiador, F.J.; Turk, F.J.; Petersen, W.; Hou, A.Y.; García-Ortega, E.; Machado, L.A.T.; Angelis, C.F.; Salio, P.; Kidd, C.; Huffman, G.J.; et al. Global precipitation measurement: Methods, datasets and applications. Atmos. Res. 2012, 104–105, 70–97. [Google Scholar] [CrossRef]
  35. Huffman, G.J.; Bolvin, D.T.; Nelkin, E.J.; Wolff, D.B.; Adler, R.F.; Gu, G.; Hong, Y.; Bowman, K.P.; Stocker, E.F. The TRMM Multisatellite Precipitation Analysis (TMPA): Quasi-Global, Multiyear, Combined-Sensor Precipitation Estimates at Fine Scales. J. Hydrometeorol. 2007, 8, 38–55. [Google Scholar] [CrossRef]
  36. Gebremichael, M.; Hossain, F. (Eds.) Satellite Rainfall Applications for Surface Hydrology; Springer: Dordrecht, The Netherlands; New York, NY, USA, 2010; ISBN 978-90-481-2914-0. [Google Scholar]
  37. Joyce, R.J.; Janowiak, J.E.; Arkin, P.A.; Xie, P. CMORPH: A method that produces global precipitation estimates from passive microwave and infrared data at high spatial and temporal resolution. J. Hydrometeorol. 2004, 5, 487–503. [Google Scholar] [CrossRef]
  38. Kubota, T.; Aonashi, K.; Ushio, T.; Shige, S.; Takayabu, Y.N.; Kachi, M.; Arai, Y.; Tashima, T.; Masaki, T.; Kawamoto, N.; et al. Global Satellite Mapping of Precipitation (GSMaP) products in the GPM Era. In Satellite Precipitation Measurement; Advances in Global Change Research; Levizzani, V., Kidd, C., Kirschbaum, D.B., Kummerow, C.D., Nakamura, K., Turk, F.J., Eds.; Springer International Publishing: Cham, Switzerland, 2020; Volume 67, pp. 355–373. ISBN 978-3-030-24567-2. [Google Scholar]
  39. Hsu, K.-L.; Karbalee, N.; Braithwaite, D. Improving PERSIANN-CCS Using Passive Microwave Rainfall Estimation. In Satellite Precipitation Measurement; Advances in Global Change Research; Levizzani, V., Kidd, C., Kirschbaum, D.B., Kummerow, C.D., Nakamura, K., Turk, F.J., Eds.; Springer International Publishing: Cham, Switzerland, 2020; Volume 67, pp. 375–391. ISBN 978-3-030-24567-2. [Google Scholar]
  40. Kuligowski, R.J.; Li, Y.; Hao, Y.; Zhang, Y. Improvements to the GOES-R Rainfall Rate Algorithm. J. Hydrometeorol. 2016, 17, 1693–1704. [Google Scholar] [CrossRef]
  41. Hsu, K.; Gao, X.; Sorooshian, S.; Gupta, H.V. Precipitation estimation from remotely sensed information using artificial neural networks. J. Appl. Meteorol. 1997, 36, 1176–1190. [Google Scholar] [CrossRef]
  42. Hsu, K.; Gupta, H.V.; Gao, X.; Sorooshian, S. Estimation of physical variables from multichannel remotely sensed imagery using a neural network: Application to rainfall estimation. Water Resour. Res. 1999, 35, 1605–1618. [Google Scholar] [CrossRef]
  43. Sorooshian, S.; Hsu, K.-L.; Gao, X.; Gupta, H.V.; Imam, B.; Braithwaite, D. Evaluation of PERSIANN system satellite–based estimates of tropical rainfall. Bull. Am. Meteorol. Soc. 2000, 81, 2035–2046. [Google Scholar] [CrossRef] [Green Version]
  44. Huffman, G.J.; Bolvin, D.T.; Braithwaite, D.; Hsu, K.-L.; Joyce, R.J.; Kidd, C.; Nelkin, E.J.; Sorooshian, S.; Stocker, E.F.; Tan, J.; et al. Integrated Multi-satellite Retrievals for the Global Precipitation Measurement (GPM) Mission (IMERG). In Satellite Precipitation Measurement; Advances in Global Change Research; Levizzani, V., Kidd, C., Kirschbaum, D.B., Kummerow, C.D., Nakamura, K., Turk, F.J., Eds.; Springer International Publishing: Cham, Switzerland, 2020; Volume 67, pp. 343–353. ISBN 978-3-030-24567-2. [Google Scholar]
  45. Adler, R.F.; Negri, A.J.; Keehn, P.R.; Hakkarinen, I.M. Estimation of monthly rainfall over japan and surrounding waters from a combination of low-orbit microwave and geosynchronous IR data. J. Appl. Meteorol. 1993, 32, 335–356. [Google Scholar] [CrossRef] [Green Version]
  46. Levizzani, V.; Porcú, F.; Marzano, F.S.; Mugnai, A.; Smith, E.A.; Prodi, F. Investigating a SSM/I microwave algorithm to calibrate Meteosat infrared instantaneous rainrate estimates. Meteorol. Appl. 1996, 3, 5–17. [Google Scholar] [CrossRef]
  47. Porcú, F.; Borga, M.; Prodi, F. Rainfall estimation by combining radar and infrared satellite data for nowcasting purposes. Meteorol. Appl. 1999, 6, 289–300. [Google Scholar] [CrossRef]
  48. Bellerby, T.; Todd, M.; Kniveton, D.; Kidd, C. Rainfall estimation from a combination of TRMM precipitation radar and GOES multispectral satellite imagery through the use of an artificial neural network. J. Appl. Meteorol. 2000, 39, 2115–2128. [Google Scholar] [CrossRef]
  49. Todd, M.C.; Kidd, C.; Kniveton, D.; Bellerby, T.J. A combined satellite infrared and passive microwave technique for estimation of small-scale rainfall. J. Atmos. Ocean. Technol. 2001, 18, 742–755. [Google Scholar] [CrossRef]
  50. Turk, F.J.; Miller, S.D. Toward improved characterization of remotely sensed precipitation regimes with MODIS/AMSR-E blended data techniques. IEEE Trans. Geosci. Remote Sens. 2005, 43, 1059–1069. [Google Scholar] [CrossRef]
  51. Kubota, T.; Shige, S.; Hashizume, H.; Aonashi, K.; Takahashi, N.; Seto, S.; Hirose, M.; Takayabu, Y.N.; Ushio, T.; Nakagawa, K.; et al. Global Precipitation Map Using Satellite-Borne Microwave Radiometers by the GSMaP Project: Production and Validation. IEEE Trans. Geosci. Remote Sens. 2007, 45, 2259–2275. [Google Scholar] [CrossRef]
  52. Bellerby, T.; Hsu, K.; Sorooshian, S. LMODEL: A Satellite Precipitation Methodology Using Cloud Development Modeling. Part I: Algorithm Construction and Calibration. J. Hydrometeorol. 2009, 10, 1081–1095. [Google Scholar] [CrossRef] [Green Version]
  53. Kidd, C.; Bauer, P.; Turk, J.; Huffman, G.J.; Joyce, R.; Hsu, K.-L.; Braithwaite, D. Intercomparison of high-resolution precipitation products over Northwest Europe. J. Hydrometeorol. 2012, 13, 67–83. [Google Scholar] [CrossRef] [Green Version]
  54. Di Paola, F.; Casella, D.; Dietrich, S.; Mugnai, A.; Ricciardelli, E.; Romano, F.; Sanò, P. Combined MW-IR Precipitation Evolving Technique (PET) of convective rain fields. Nat. Hazards Earth Syst. Sci. 2012, 12, 3557–3570. [Google Scholar] [CrossRef] [Green Version]
  55. Porcú, F.; Caracciolo, C.; Prodi, F. Cloud systems leading to flood events in Europe: An overview and classification. Meteorol. Appl. 2003, 10, 217–227. [Google Scholar] [CrossRef]
  56. Miglietta, M.M.; Laviola, S.; Malvaldi, A.; Conte, D.; Levizzani, V.; Price, C. Analysis of tropical-like cyclones over the Mediterranean Sea through a combined modeling and satellite approach: TLC ANALYSIS THROUGH A COMBINED APPROACH. Geophys. Res. Lett. 2013, 40, 2400–2405. [Google Scholar] [CrossRef]
  57. Manzato, A.; Davolio, S.; Miglietta, M.M.; Pucillo, A.; Setvák, M. 12 September 2012: A supercell outbreak in NE Italy? Atmos. Res. 2015, 153, 98–118. [Google Scholar] [CrossRef]
  58. Panegrossi, G.; Casella, D.; Dietrich, S.; Marra, A.C.; Sano, P.; Mugnai, A.; Baldini, L.; Roberto, N.; Adirosi, E.; Cremonini, R.; et al. Use of the GPM constellation for monitoring heavy precipitation events over the Mediterranean Region. IEEE J. Sel. Top. Appl. Earth Obs. Remote Sens. 2016, 9, 2733–2753. [Google Scholar] [CrossRef]
  59. Roberto, N.; Adirosi, E.; Baldini, L.; Casella, D.; Dietrich, S.; Gatlin, P.; Panegrossi, G.; Petracca, M.; Sanò, P.; Tokay, A. Multi-sensor analysis of convective activity in central Italy during the HyMeX SOP 1.1. Atmos. Meas. Tech. 2016, 9, 535–552. [Google Scholar] [CrossRef] [Green Version]
  60. Silvestro, F.; Rebora, N.; Giannoni, F.; Cavallo, A.; Ferraris, L. The flash flood of the Bisagno Creek on 9th October 2014: An “unfortunate” combination of spatial and temporal scales. J. Hydrol. 2016, 541, 50–62. [Google Scholar] [CrossRef] [Green Version]
  61. Silvestro, F.; Rebora, N.; Rossi, L.; Dolia, D.; Gabellani, S.; Pignone, F.; Trasforini, E.; Rudari, R.; De Angeli, S.; Masciulli, C. What if the 25 October 2011 event that struck Cinque Terre (Liguria) had happened in Genoa, Italy? Flooding scenarios, hazard mapping anddamage estimation. Nat. Hazards Earth Syst. Sci. 2016, 16, 1737–1753. [Google Scholar] [CrossRef] [Green Version]
  62. Marra, A.C.; Porcù, F.; Baldini, L.; Petracca, M.; Casella, D.; Dietrich, S.; Mugnai, A.; Sanò, P.; Vulpiani, G.; Panegrossi, G. Observational analysis of an exceptionally intense hailstorm over the Mediterranean area: Role of the GPM Core Observatory. Atmos. Res. 2017, 192, 72–90. [Google Scholar] [CrossRef]
  63. Puca, S.; Porcu, F.; Rinollo, A.; Vulpiani, G.; Baguis, P.; Balabanova, S.; Campione, E.; Ertürk, A.; Gabellani, S.; Iwanski, R.; et al. The validation service of the hydrological SAF geostationary and polar satellite precipitation products. Nat. Hazards Earth Syst. Sci. 2014, 14, 871–889. [Google Scholar] [CrossRef]
  64. Friedrich, K.; Hagen, M.; Einfalt, T. A Quality control concept for radar reflectivity, polarimetric parameters, and Doppler Velocity. J. Atmos. Ocean. Technol. 2006, 23, 865–887. [Google Scholar] [CrossRef] [Green Version]
  65. Joss, J.; Lee, R. The Application of Radar–gauge comparisons to operational precipitation profile corrections. J. Appl. Meteorol. 1995, 34, 2612–2630. [Google Scholar] [CrossRef] [Green Version]
  66. Germann, U.; Joss, J. Mesobeta profiles to extrapolate radar precipitation measurements above the alps to the ground level. J. Appl. Meteorol. 2002, 41, 542–557. [Google Scholar] [CrossRef]
  67. Carey, L.D.; Rutledge, S.A.; Ahijevych, D.A.; Keenan, T.D. Correcting propagation effects in C-Band polarimetric radar observations of tropical convection using differential propagation phase. J. Appl. Meteorol. 2000, 39, 1405–1433. [Google Scholar] [CrossRef] [Green Version]
  68. Testud, J.; Le Bouar, E.; Obligis, E.; Ali-Mehenni, M. The Rain Profiling Algorithm Applied to Polarimetric Weather Radar. J. Atmos. Ocean. Technol. 2000, 17, 332–356. [Google Scholar] [CrossRef]
  69. Vulpiani, G.; Tabary, P.; Parent du Chatelet, J.; Marzano, F.S. Comparison of advanced radar polarimetric techniques for operational attenuation correction at C Band. J. Atmos. Ocean. Technol. 2008, 25, 1118–1135. [Google Scholar] [CrossRef] [Green Version]
  70. Crisologo, I.; Vulpiani, G.; Abon, C.C.; David, C.P.C.; Bronstert, A.; Heistermann, M. Polarimetric rainfall retrieval from a C-Band weather radar in a tropical environment (The Philippines). Asia-Pacific J. Atmos. Sci. 2014, 50, 595–607. [Google Scholar] [CrossRef]
  71. Rinollo, A.; Vulpiani, G.; Puca, S.; Pagliara, P.; Kaňák, J.; Lábó, E.; Okon, L.; Roulin, E.; Baguis, P.; Cattani, E.; et al. Definition and impact of a quality index for radar-based reference measurements in the H-SAF precipitation product validation. Nat. Hazards Earth Syst. Sci. 2013, 13, 2695–2705. [Google Scholar] [CrossRef] [Green Version]
  72. Petracca, M.; D’Adderio, L.P.; Porcù, F.; Vulpiani, G.; Sebastianelli, S.; Puca, S. Validation of GPM Dual-Frequency Precipitation Radar (DPR) Rainfall Products over Italy. J. Hydrometeorol. 2018, 19, 907–925. [Google Scholar] [CrossRef]
  73. Sebastianelli, S.; Russo, F.; Napolitano, F.; Baldini, L. On precipitation measurements collected by a weather radar and a rain gauge network. Nat. Hazards Earth Syst. Sci. 2013, 13, 605–623. [Google Scholar] [CrossRef] [Green Version]
  74. Tabary, P. The new french operational radar rainfall product. Part I: Methodology. Weather Forecasting 2007, 22, 393–408. [Google Scholar] [CrossRef]
  75. Martins Costa do Amaral, L.; Barbieri, S.; Vila, D.; Puca, S.; Vulpiani, G.; Panegrossi, G.; Biscaro, T.; Sanò, P.; Petracca, M.; Marra, A.; et al. Assessment of Ground-reference data and validation of the H-SAF precipitation products in Brazil. Remote Sens. 2018, 10, 1743. [Google Scholar] [CrossRef] [Green Version]
  76. Vulpiani, G.; Baldini, L.; Roberto, N. Characterization of Mediterranean hail-bearing storms using an operational polarimetric X-band radar. Atmos. Meas. Tech. 2015, 8, 4681–4698. [Google Scholar] [CrossRef] [Green Version]
  77. Schmetz, J.; Pili, P.; Tjemkes, S.; Just, D.; Kerkmann, J.; Rota, S.; Ratier, A. Supplement to an introduction to Meteosat Second Generation (MSG): SEVIRI CALIBRATION. Bull. Amer. Meteor. Soc. 2002, 83, 992. [Google Scholar] [CrossRef]
  78. Mugnai, A.; Casella, D.; Cattani, E.; Dietrich, S.; Laviola, S.; Levizzani, V.; Panegrossi, G.; Petracca, M.; Sanò, P.; Di Paola, F.; et al. Precipitation products from the hydrology SAF. Nat. Hazards Earth Syst. Sci. 2013, 13, 1959–1981. [Google Scholar] [CrossRef] [Green Version]
  79. Turk, F.J.; Rohaly, G.; Hawkins, J.; Smith, E.A.; Marzano, F.S.; Mugnai, A.; Levizzani, V. Meteorological applications of precipitation estimation from combined SSM/I, TRMM and geostationary satellite data. In Microwave Radiometry and Remote Sensing of the Earth’s Surface and Atmosphere; Pampaloni, P., Paloscia, S., Eds.; VSP International Science Publisher: Florence, Italy, 2000; pp. 353–363. [Google Scholar]
  80. Turk, F.J.; Sohn, B.-J.; Oh, H.-J.; Ebert, E.E.; Levizzani, V.; Smith, E.A. Validating a rapid-update satellite precipitation analysis across telescoping space and time scales. Meteorol. Atmos. Phys. 2009, 105, 99–108. [Google Scholar] [CrossRef]
  81. Pignone, F.; Rebora, N.; Silvestro, F.; Castelli, F. GRISO (Generatore Random di Interpolazioni Spaziali da Osservazioni Incerte)-Piogge; 2010; p. 353. [Google Scholar]
  82. Feidas, H.; Porcu, F.; Puca, S.; Rinollo, A.; Lagouvardos, C.; Kotroni, V. Validation of the H-SAF precipitation product H03 over Greece using rain gauge data. Appl. Climatol. 2018, 131, 377–398. [Google Scholar] [CrossRef]
  83. Hersbach, H.; de Rosnay, P.; Bell, B.; Schepers, D.; Simmons, A.; Soci, C.; Abdalla, S.; Alonso-Balmaseda, M.; Balsamo, G.; Bechtold, P.; et al. Operational Global Reanalysis: Progress, Future Directions and Synergies with NWP. 2018. Available online: https://www.ecmwf.int/node/18765 (accessed on 30 July 2020).
  84. Berrisford, P.; Dee, D.P.; Poli, P.; Brugge, R.; Fielding, M.; Fuentes, M.; Kallberg, P.W.; Kobayashi, S.; Uppala, S.M.; Simmons, A. The ERA-Interim Archive Version 2.0. 2011. Available online: https://www.ecmwf.int/node/8174 (accessed on 30 July 2020).
  85. Dee, D.P.; Uppala, S.M.; Simmons, A.J.; Berrisford, P.; Poli, P.; Kobayashi, S.; Andrae, U.; Balmaseda, M.A.; Balsamo, G.; Bauer, P.; et al. The ERA-Interim reanalysis: Configuration and performance of the data assimilation system. Q. J. R. Meteorol. Soc. 2011, 137, 553–597. [Google Scholar] [CrossRef]
  86. Zhao, F.; Tang, C.; Dai, C.; Wu, X.; Wei, H. The Global Distribution of Cirrus Clouds Reflectance Based on MODIS Level-3 Data. Atmosphere 2020, 11, 219. [Google Scholar] [CrossRef] [Green Version]
  87. Lynch, D. (Ed.) Cirrus; Oxford University Press: Cambridge, UK; New York, NY, USA, 2002; ISBN 978-0-19-513072-0. [Google Scholar]
  88. Nurmi, P. Recommendations on the Verification of local Weather Forecasts. Available online: https://www.ecmwf.int/node/11401 (accessed on 30 July 2020).
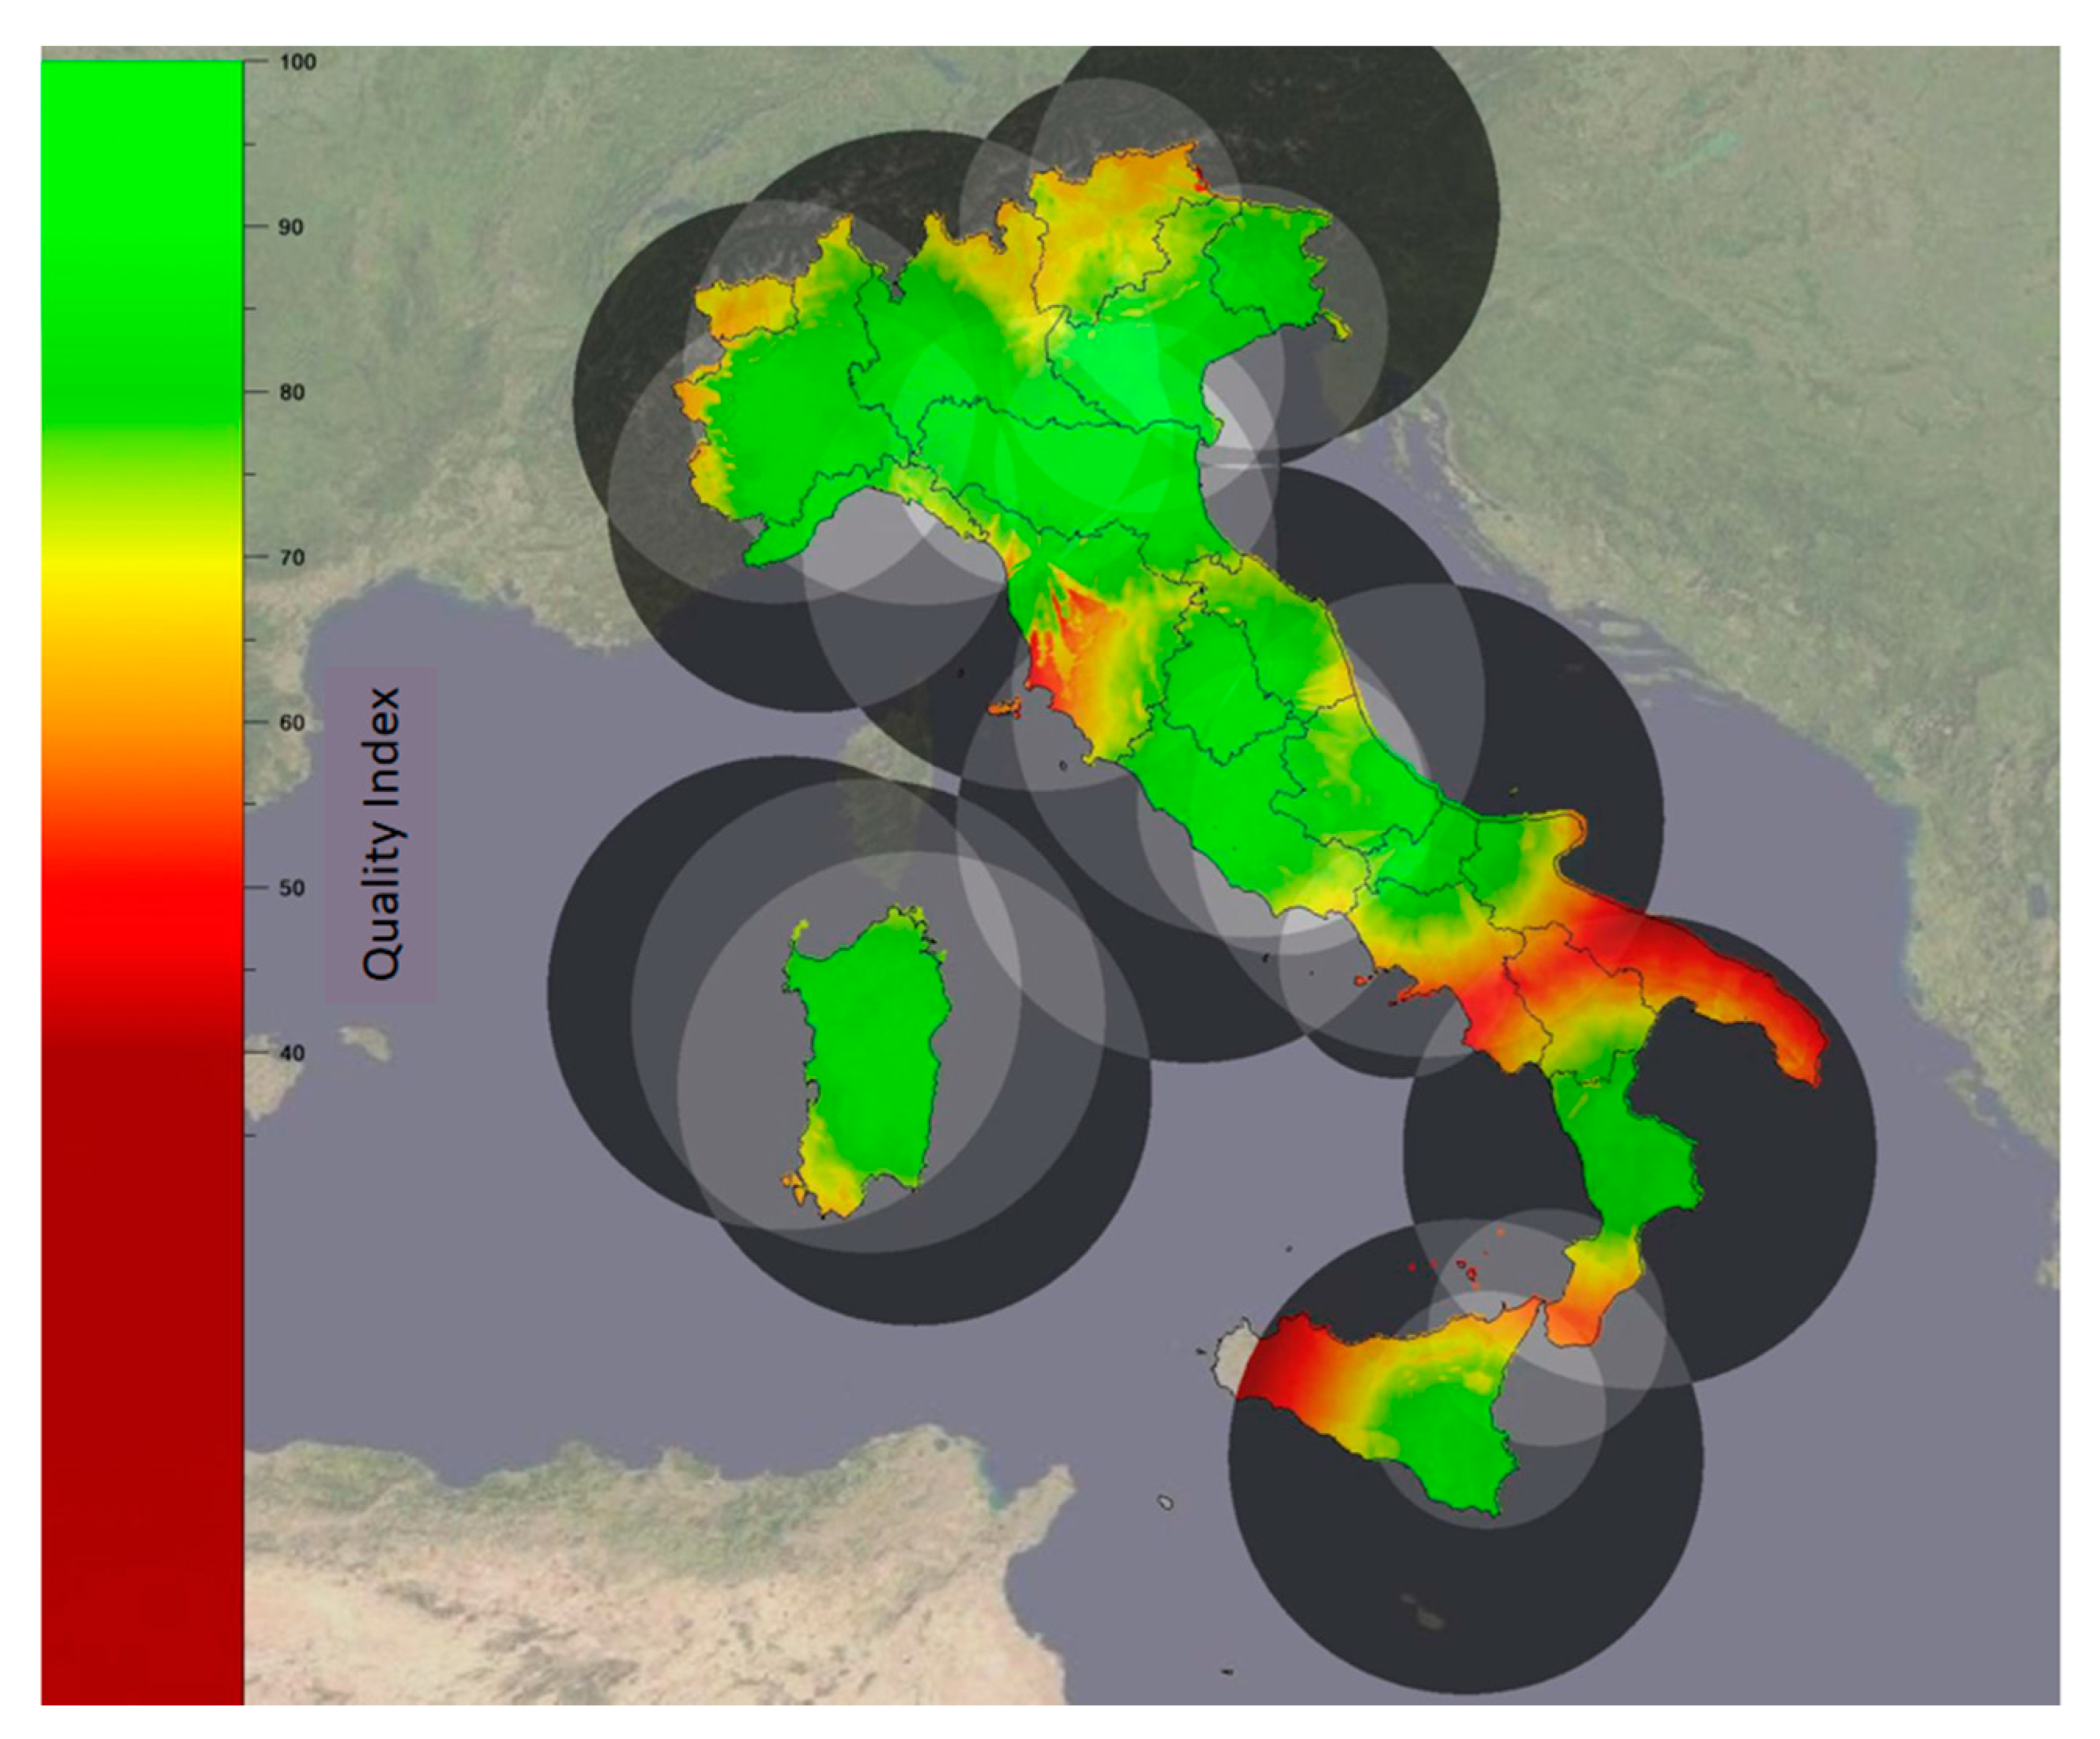
Figure 1. Italian ground radar network (IT GR) spatial coverage and its associated Quality Index (QI).
Remotesensing 12 02444 g001
Figure 2. Parallax displacement as function of latitude, longitude, and cloud top height.
Remotesensing 12 02444 g002
Figure 3. Geographical boxes division of the area of study.
Remotesensing 12 02444 g003
Figure 4. RR-TB10.8 relationship obtained from the whole dataset (i.e., from 1 July, 2015 to 31 December, 31, 2017) for each box for (a) fall, (b) winter, (c) spring, and (d) summer season, respectively.
Remotesensing 12 02444 g004
Figure 5. POP-TB10.8 relationship obtained from the whole dataset (i.e., from 1 July, 2015 to 31 December, 2017) for each box for (a) fall, (b) winter, (c) spring, and (d) summer season, respectively.
Remotesensing 12 02444 g005
Figure 6. Snapshot relative to the 01:12 UTC of 10 September, 2017. Panel (a) shows the TB10.8 as measured by Spinning Enhanced Visible and InfraRed Imager (SEVIRI), (b) the instantaneous rainfall rate as estimated by Italian ground radar network (IT GR) network at SEVIRI spatial resolution and (c) by RAdar INfrared Blending algorithm for Operational Weather monitoring (RAINBOW).
Remotesensing 12 02444 g006
Figure 7. Snapshot relative to the 04:12 UTC of 14 October, 2016. Panel (a) shows the TB10.8 as measured by SEVIRI, (b) the instantaneous rainfall rate as estimated by IT GR network at SEVIRI spatial resolution and (c) by RAINBOW.
Remotesensing 12 02444 g007
Figure 8. (a) Probability of Detection (POD), (b) False Alarm Ratio (FAR), and (c) Heidke Skill Score (HSS) scores calculated by comparing the RAINBOW outputs with the Random Generator of Spatial Interpolation from uncertain Observations (GRISO) data (taken as reference) on a regular 0.25° × 0.25° grid for 10 case studies. A minimum cumulated rain threshold is set at 0.25 mm and three different intervals of cumulated rain are considered: light 0.25–1 mm, moderate 1–10 mm, and heavy 10–100 mm.
Remotesensing 12 02444 g008
Figure 9. (a) Mean error (ME) and (b) root mean square error (RMSE) scores calculated by comparing the RAINBOW outputs with the GRISO data (taken as reference) on a regular 0.25° × 0.25° grid for 10 case studies. A minimum cumulated rain threshold is set at 0.25 mm and three different intervals of cumulated rain are considered: light 0.25–1 mm, moderate 1–10 mm, and heavy 10–100 mm.
Remotesensing 12 02444 g009
Figure 10. (a) POD, (b) FAR, and (c) HSS scores calculated by comparing the RAINBOW outputs with the GRISO data (taken as reference) on different regular grids for 10 case studies. A minimum cumulated rain threshold is set at 0.25 mm.
Remotesensing 12 02444 g010
Figure 11. (a) ME and (b) RMSE scores calculated by comparing the RAINBOW outputs with the GRISO data (taken as reference) on different regular grids for 10 case studies. A minimum cumulated rain threshold is set at 0.25 mm.
Remotesensing 12 02444 g011
Figure 12. Comparison of (a) POD, (b) FAR, and (c) HSS scores calculated for RAINBOW and P-IN-SEVIRI outputs with respect to the GRISO data (taken as reference) on a regular 0.25° × 0.25° grid for 10 case studies. A minimum cumulated rain threshold is set at 0.25 mm and three different intervals of cumulated rain are considered: light 0.25–1 mm, moderate 1–10 mm, and heavy 10–100 mm.
Remotesensing 12 02444 g012
Figure 13. Comparison of (a) ME and (b) RMSE scores calculated for RAINBOW and P-IN-SEVIRI outputs with respect to the GRISO data (taken as reference) on a regular 0.25° × 0.25° grid for 10 case studies. A minimum cumulated rain threshold is set at 0.25 mm and three different intervals of cumulated rain are considered: light 0.25–1 mm, moderate 1–10 mm, and heavy 10–100 mm.
Remotesensing 12 02444 g013