Quantifying Land Use Land Cover Changes in the Lake Victoria Basin Using Satellite Remote Sensing: The Trends and Drivers between 1985 and 2014

 , ,
, ,  , and
, and
Abstract
:1. Introduction
2. Data and Methods
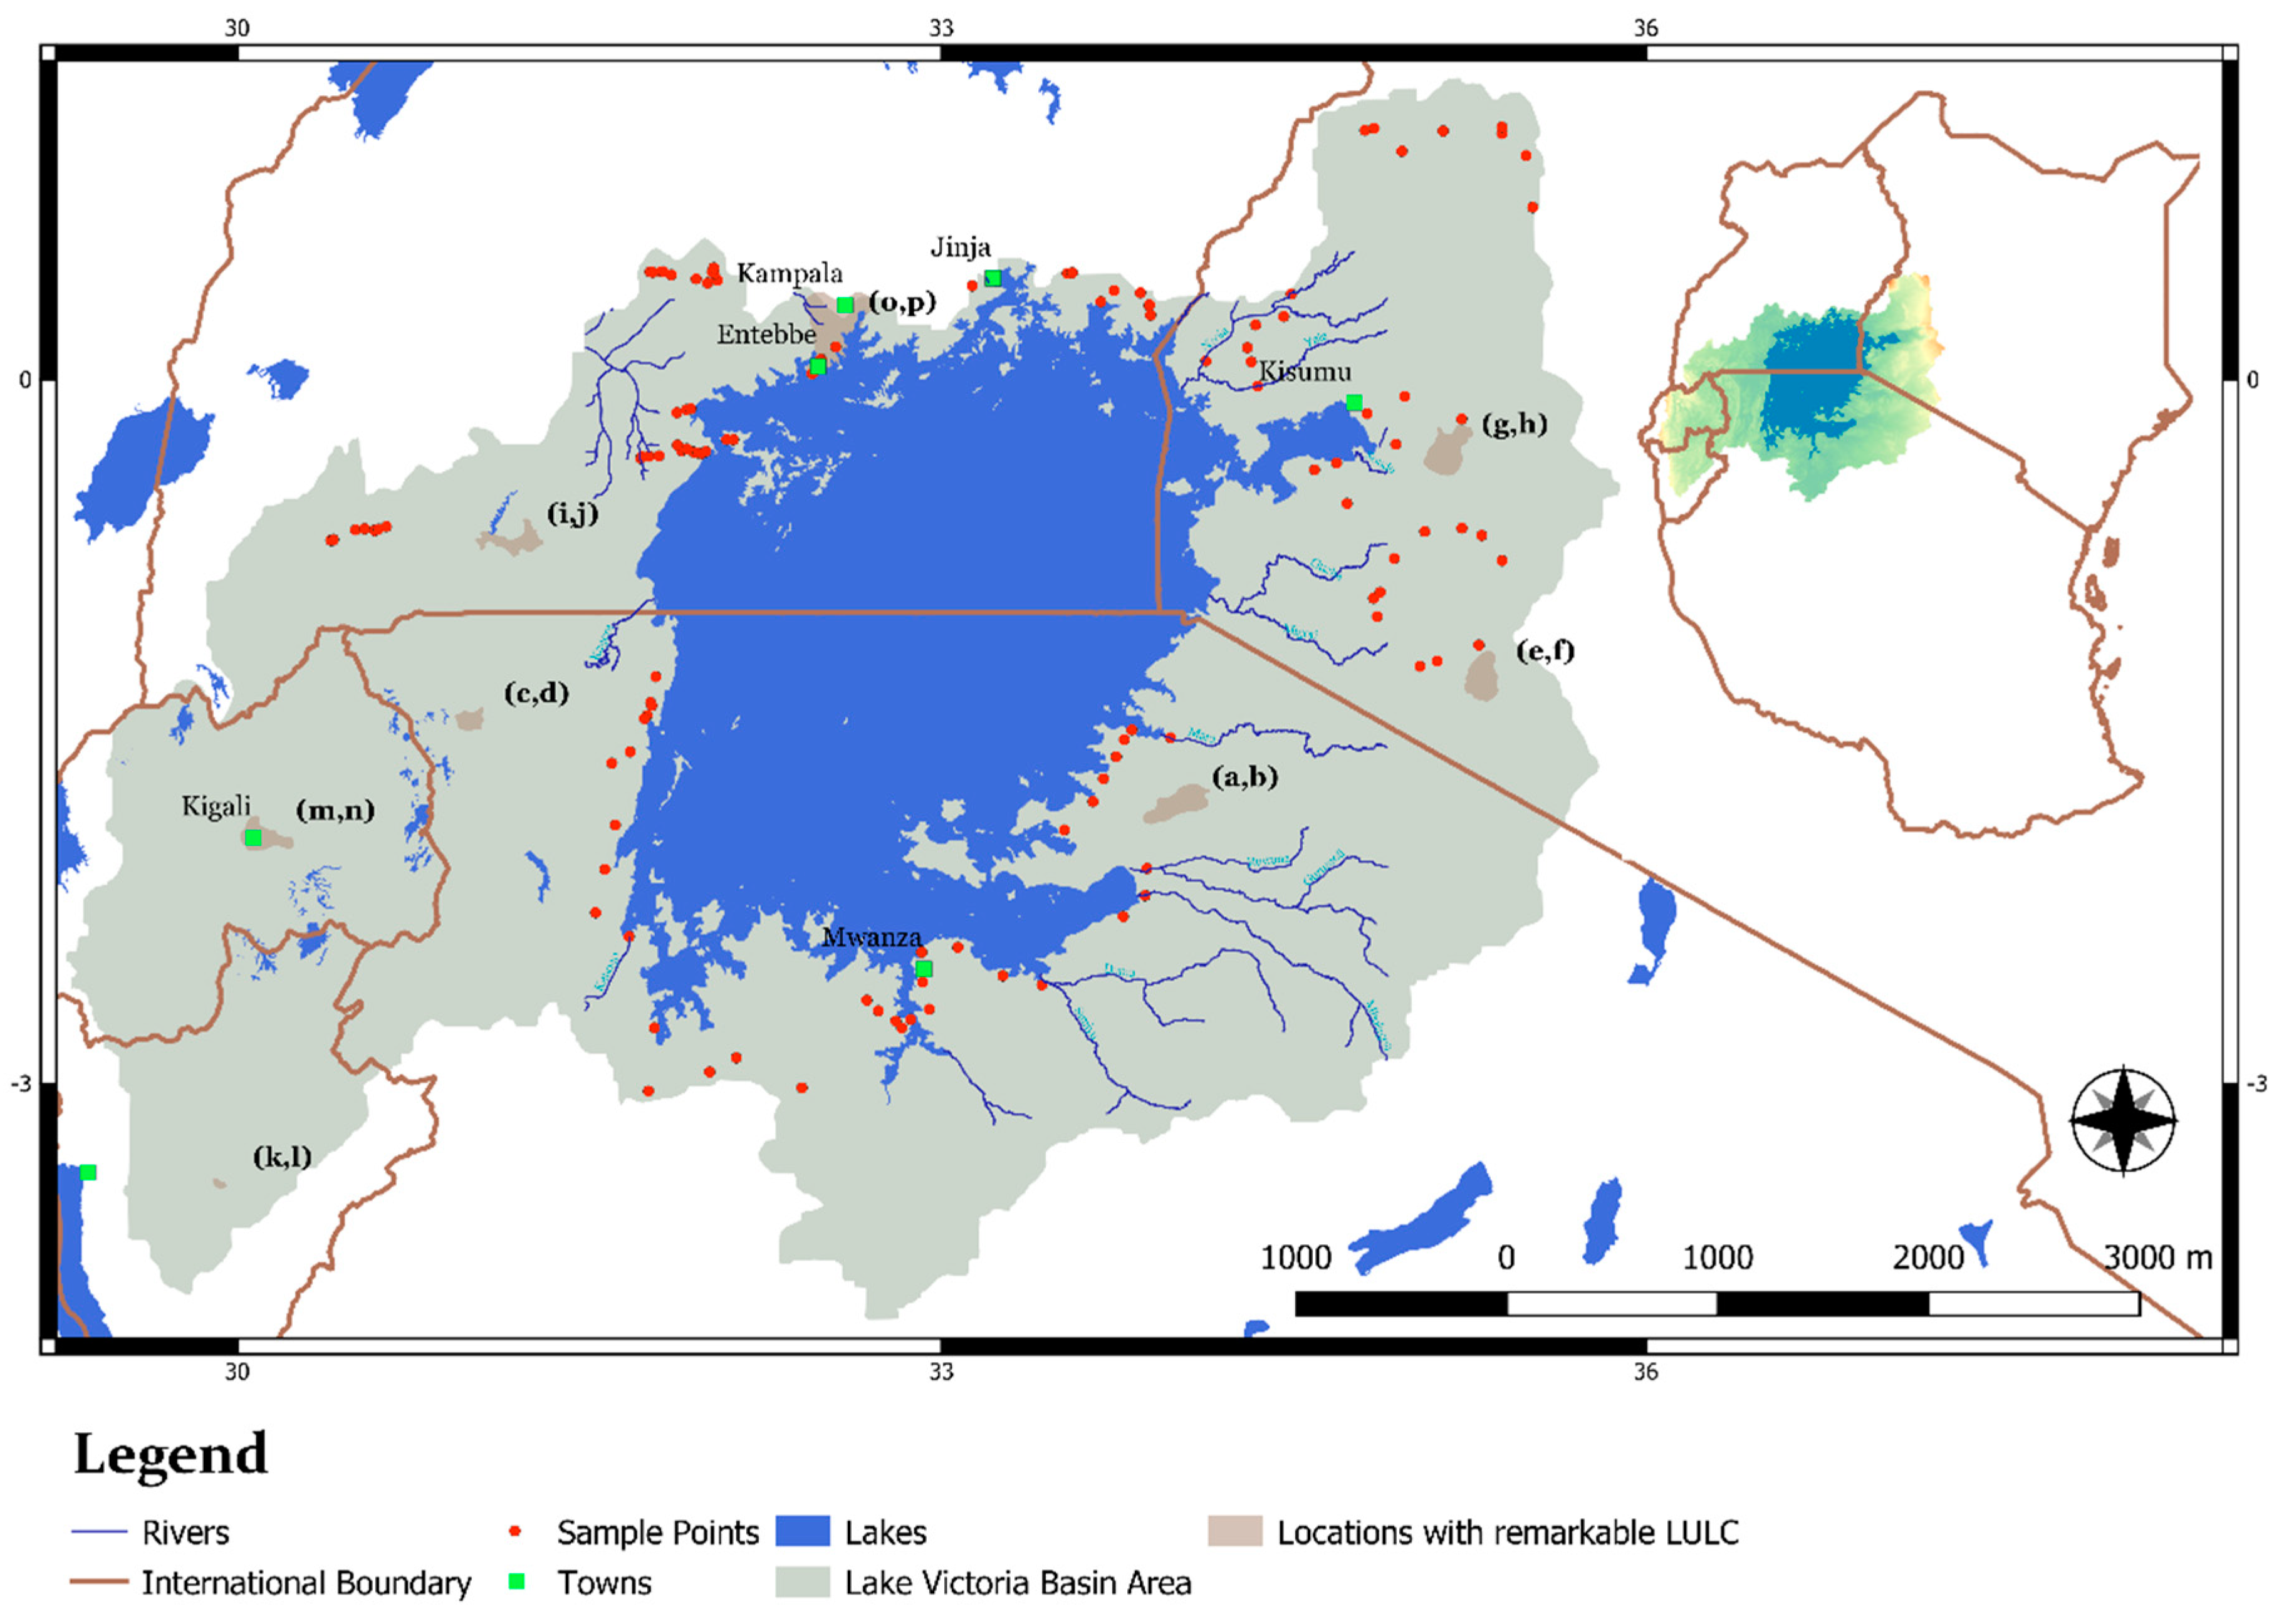
2.1. Study Area
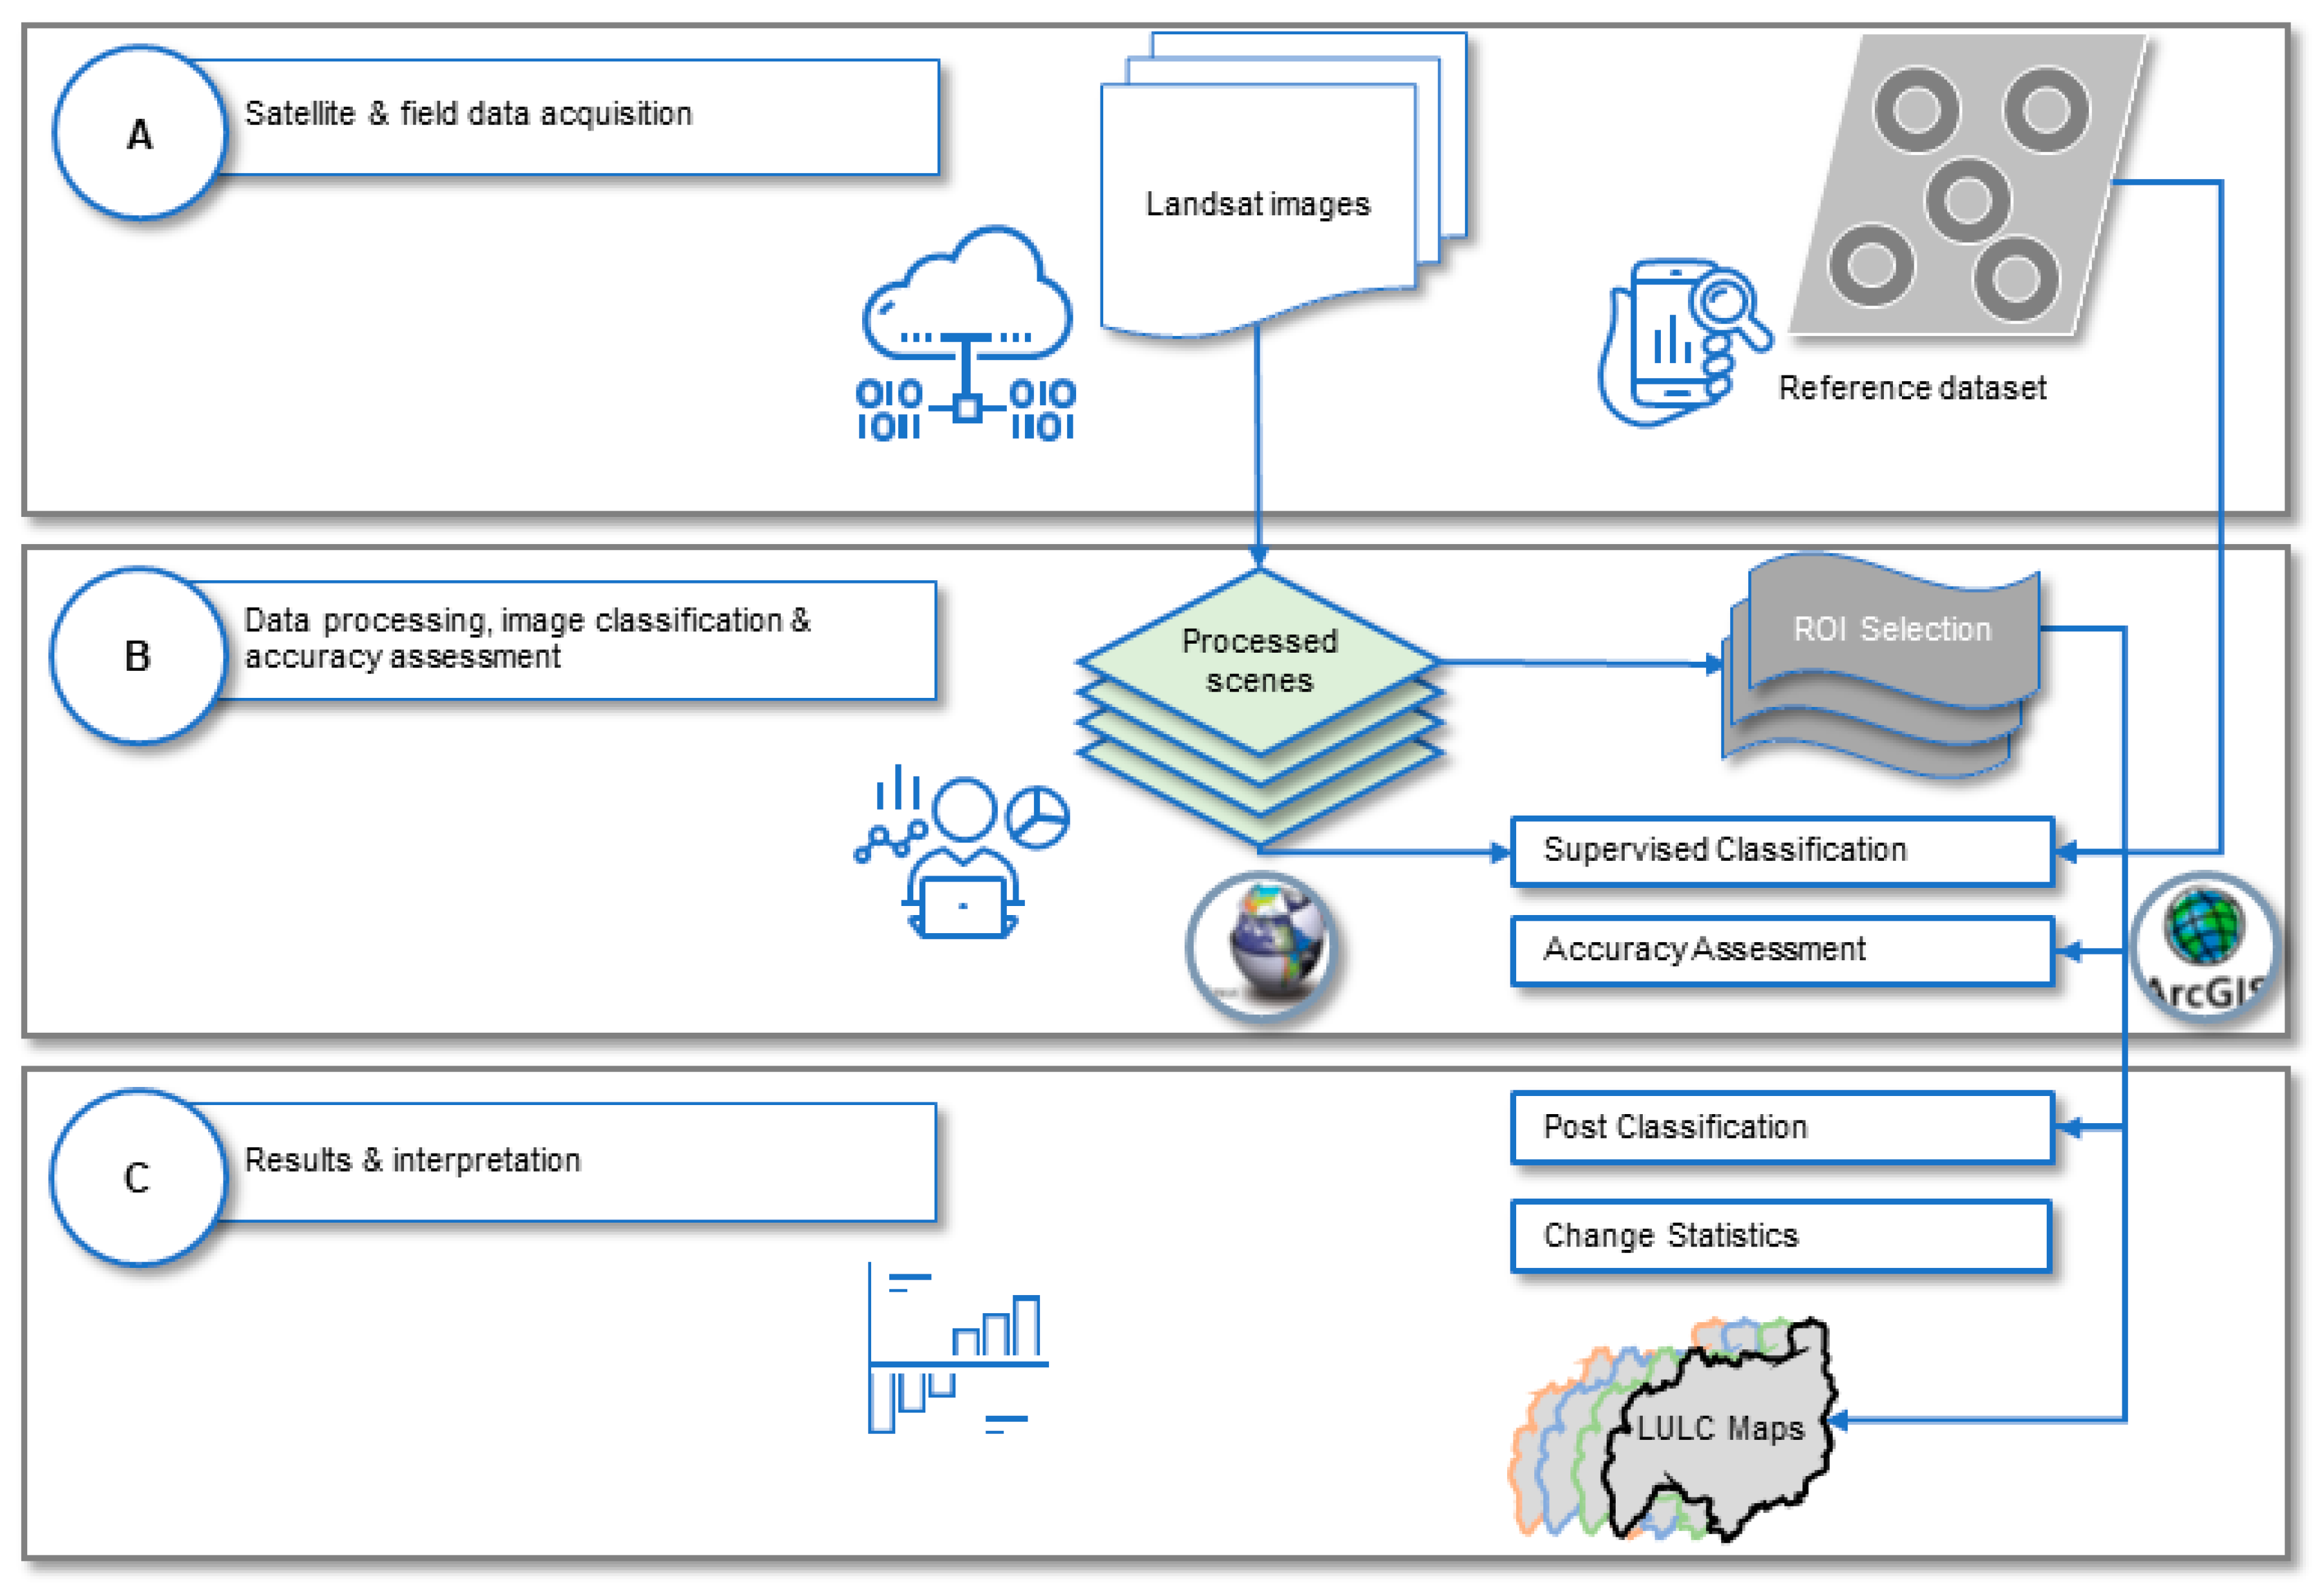
2.2. Earth Observation Data Analysis
2.3. Reference Data Collection and Accuracy Assessment
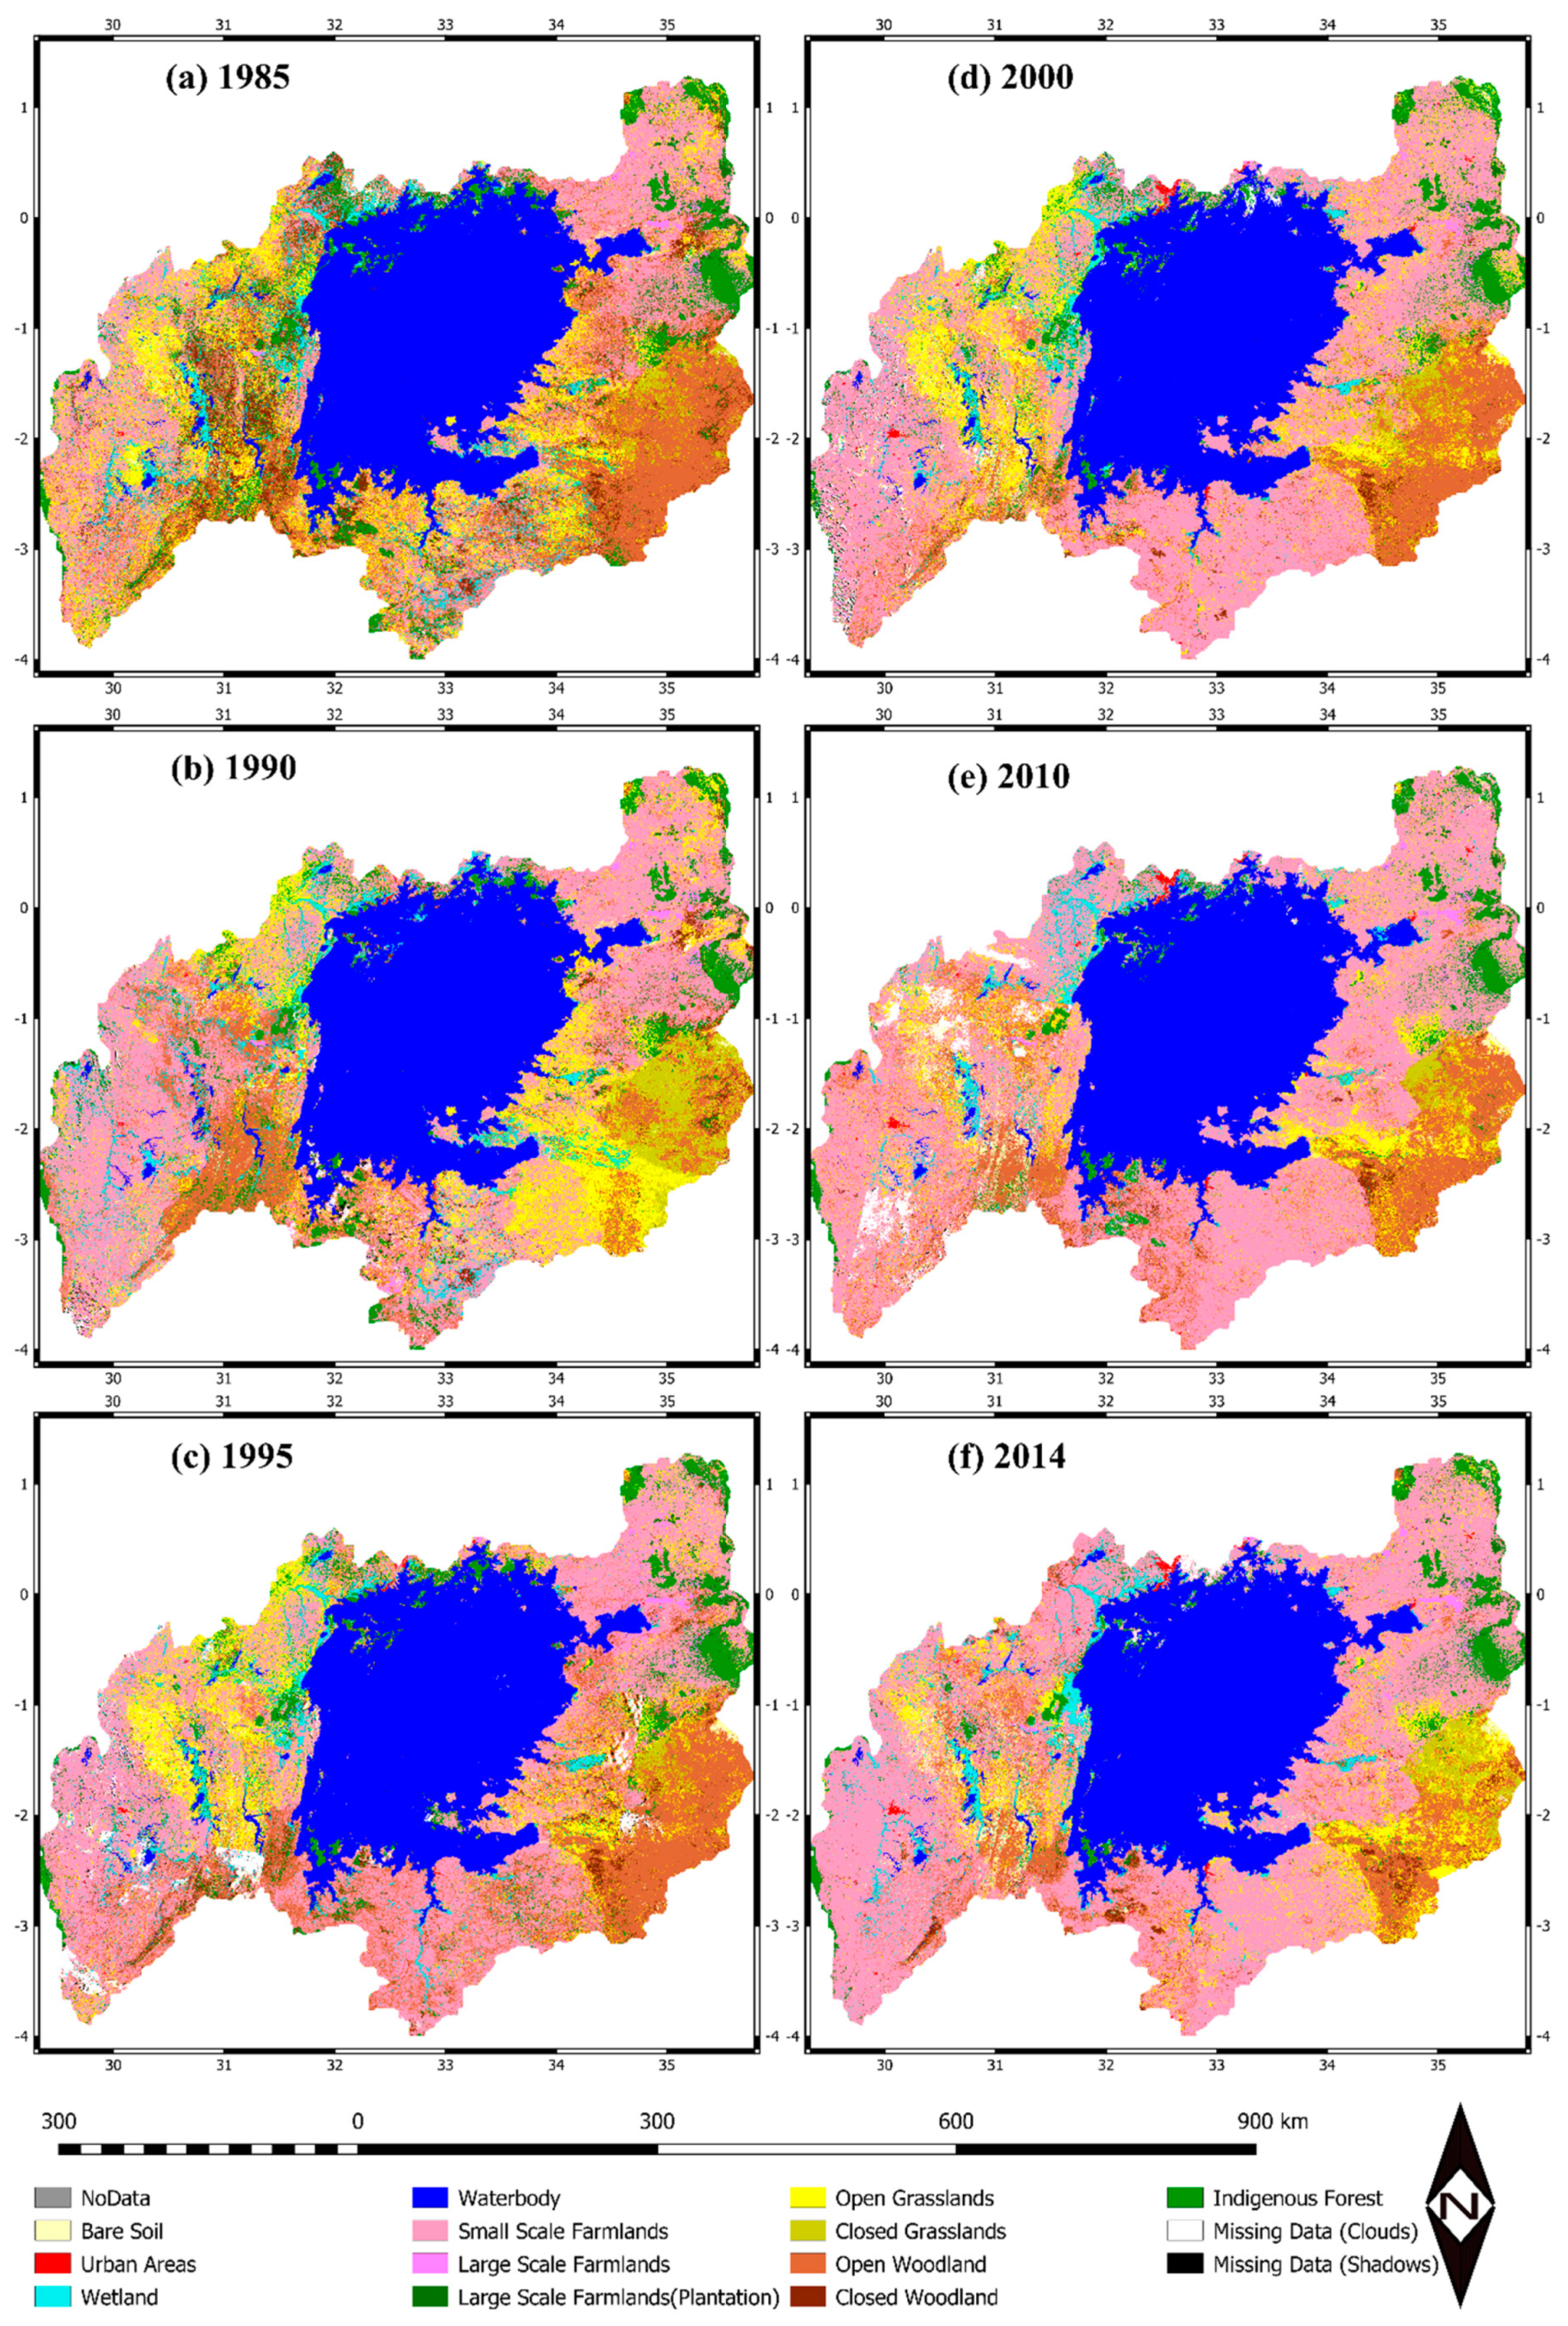
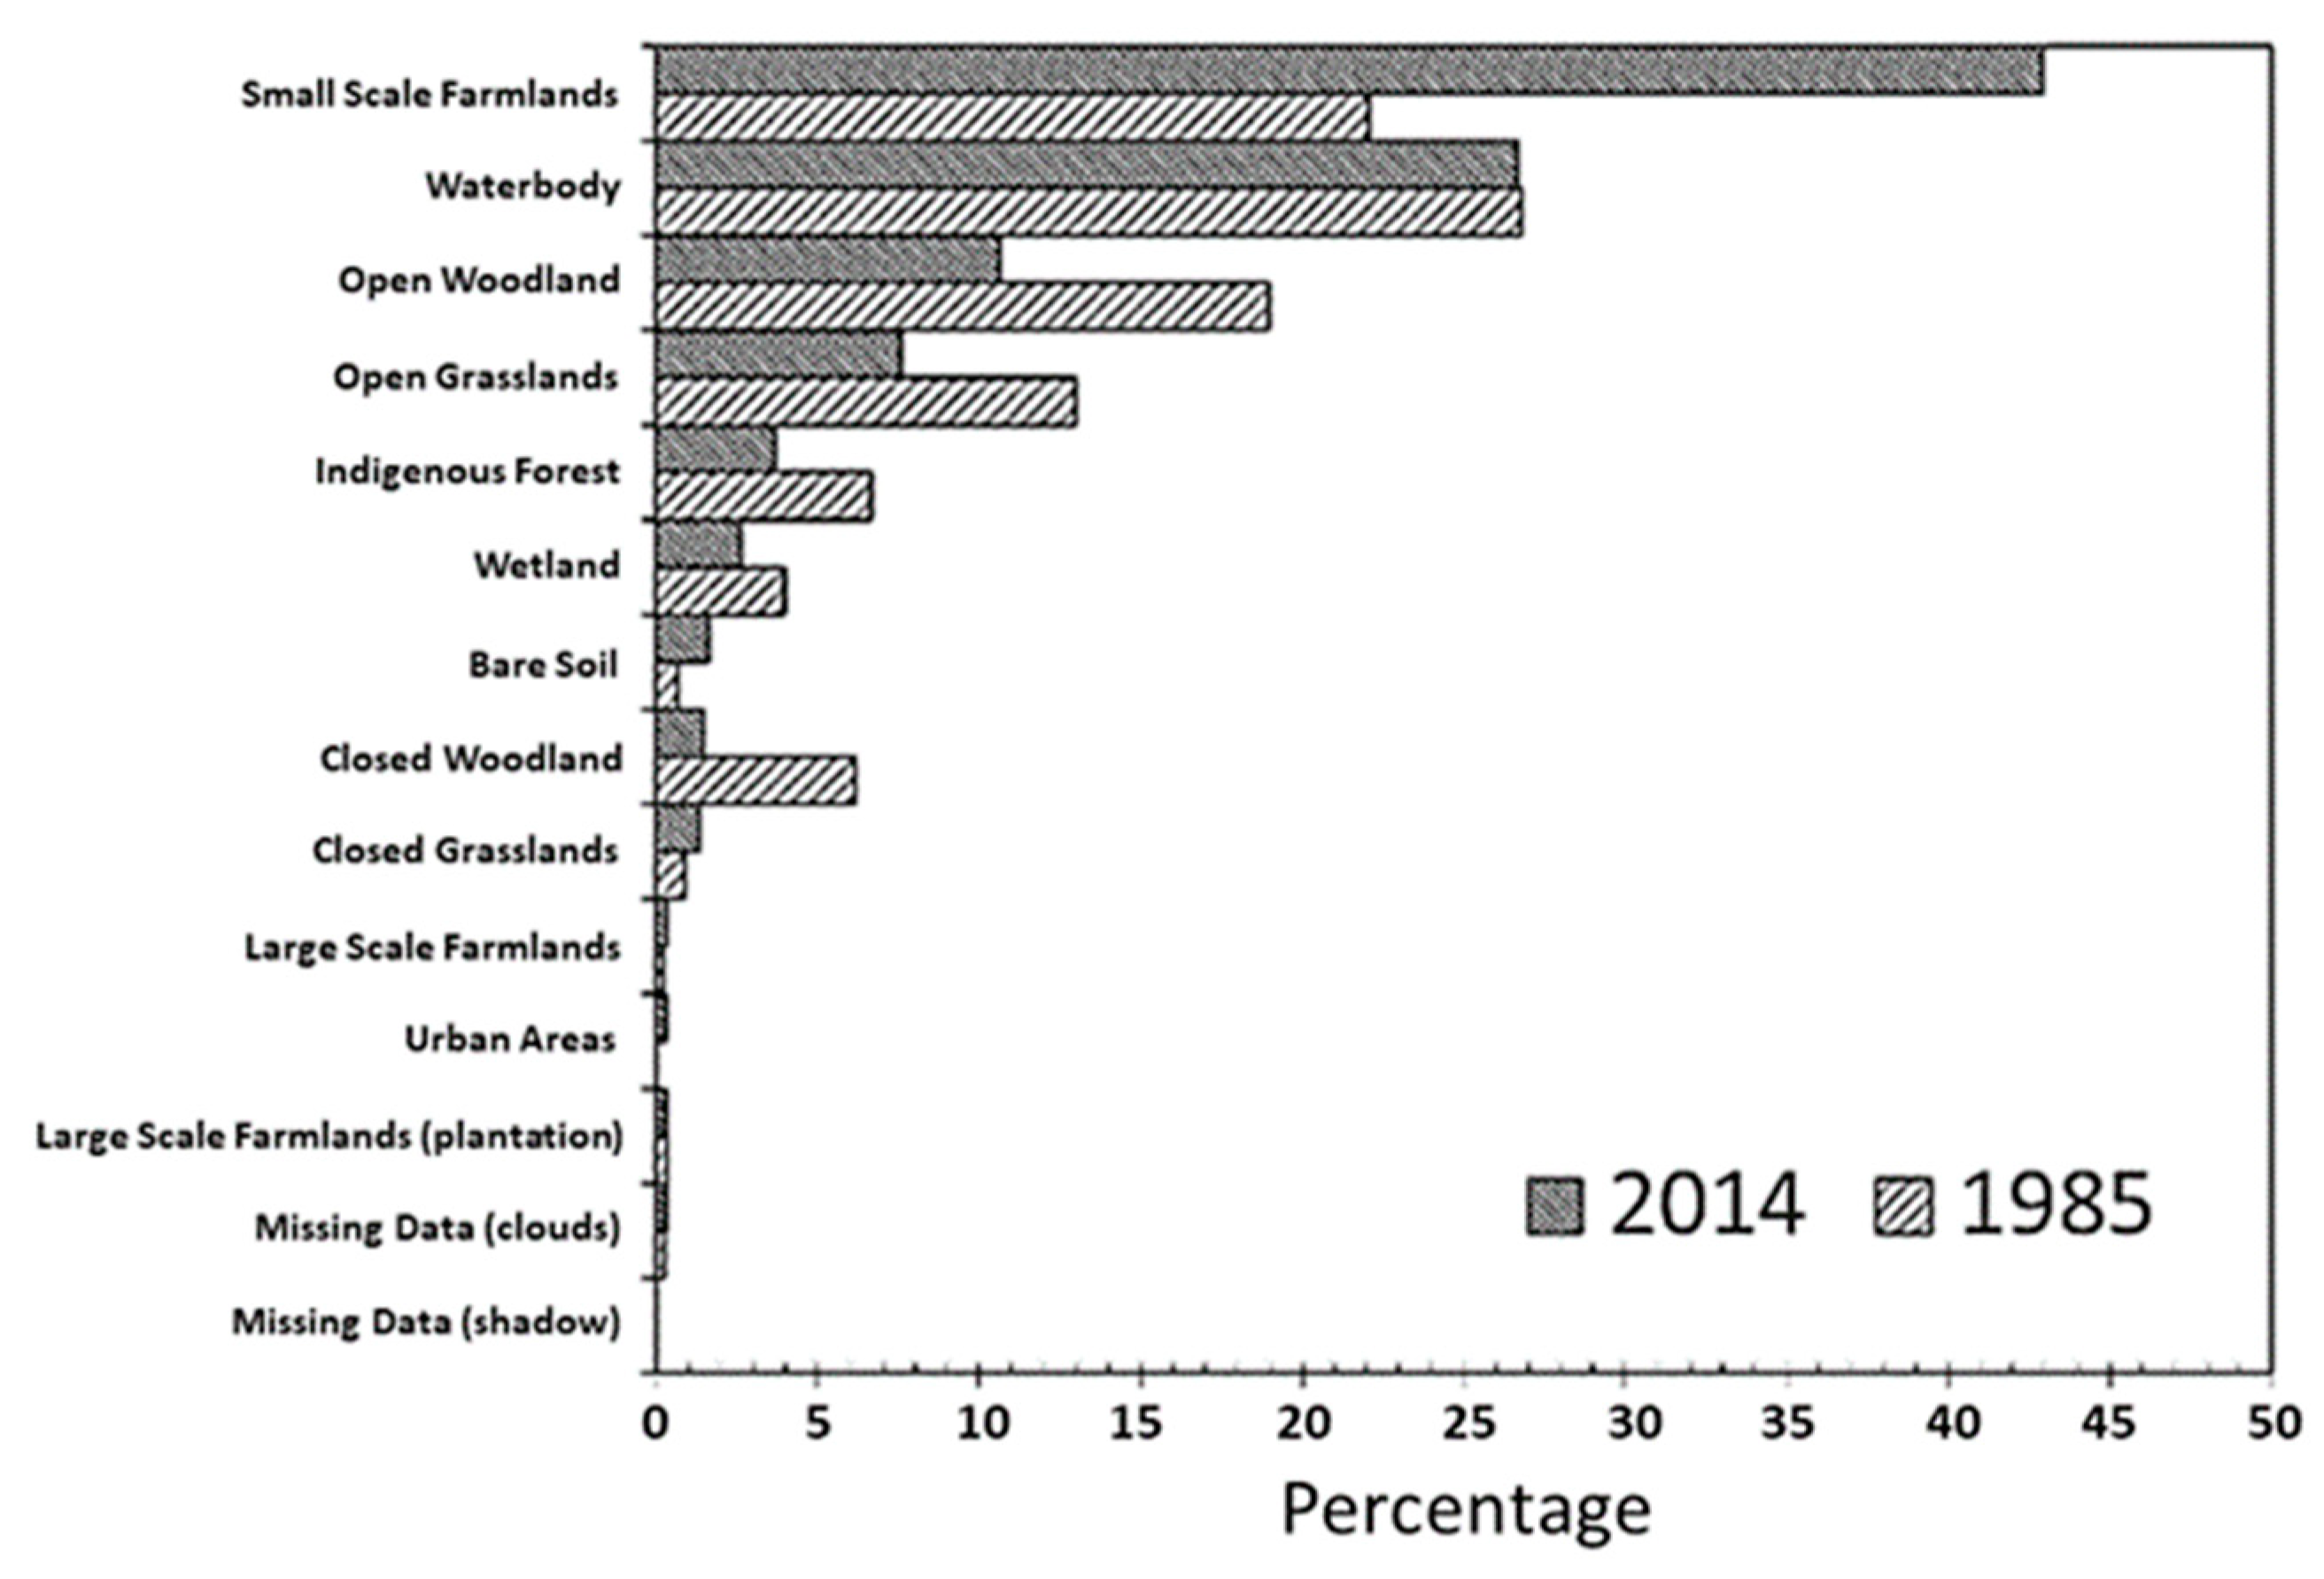
3. Results
4. Discussion
5. Conclusions
Author Contributions
Funding
Acknowledgments
Conflicts of Interest
References
- Odada, E.O.; Ochola, W.O.; Olago, D.O. Drivers of ecosystem change and their impacts on human well-being in Lake Victoria basin. Afr. J. Ecol. 2009, 47, 46–54. [Google Scholar] [CrossRef]
- Wanink, J.H.; Goudswaard, K.P.C. Effects of Nile perch (Lates niloticus) introduction into Lake Victoria, East Africa, on the diet of Pied Kingfishers (Ceryle rudis). Hydrobiologia 1994, 279, 367–376. [Google Scholar] [CrossRef]
- Muyodi, F.J.; Bugenyi, F.W.B.; Hecky, R.E. Experiences and lessons learned from interventions in the Lake Victoria Basin: The Lake Victoria Environmental Management Project: Experiences and lessons in L. Victoria. Lakes Reserv. Res. Manag. 2010, 15, 77–88. [Google Scholar] [CrossRef]
- Al-Hamdan, M.Z.; Oduor, P.; Flores, A.I.; Kotikot, S.M.; Mugo, R.; Ababu, J.; Farah, H. Evaluating land cover changes in Eastern and Southern Africa from 2000 to 2010 using validated Landsat and MODIS data. Int. J. Appl. Earth Obs. Geoinf. 2017, 62, 8–26. [Google Scholar] [CrossRef]
- Güneralp, B.; Lwasa, S.; Masundire, H.; Parnell, S.; Seto, K.C. Urbanization in Africa: Challenges and opportunities for conservation. Environ. Res. Lett. 2017, 13, 015002. [Google Scholar] [CrossRef]
- Marchant, R.; Richer, S.; Boles, O.; Capitani, C.; Courtney-Mustaphi, C.J.; Lane, P.; Prendergast, M.E.; Stump, D.; De Cort, G.; Kaplan, J.O.; et al. Drivers and trajectories of land cover change in East Africa: Human and environmental interactions from 6000 years ago to present. EarthSci. Rev. 2018, 178, 322–378. [Google Scholar] [CrossRef]
- Osinubi, S.T.; Hand, K.; Van Oijen, D.C.C.; Walther, B.A.; Barnard, P. Linking science and policy to address conservation concerns about African land use, land conversion and land grabs in the era of globalization. Afr. J. Ecol. 2016, 54, 265–267. [Google Scholar] [CrossRef]
- Midekisa, A.; Holl, F.; Savory, D.J.; Andrade-Pacheco, R.; Gething, P.W.; Bennett, A.; Sturrock, H.J.W. Mapping land cover change over continental Africa using Landsat and Google Earth Engine cloud computing. PLoS ONE 2017, 12, e0184926. [Google Scholar] [CrossRef]
- Kashaigili, J.J.; Zziwa, E.; Ernest, S.; Laswai, E.; Segatagara, B.M.; Mpairwe, D.; Kadigi, R.M.J.; Ebong, C.; Mugasi, S.K.; Laswai, G.H.; et al. Implications of Land Use Land Cover Change and Climate Variability on Future Prospects of Beef Cattle Production in the Lake Victoria Basin. Am. J. Clim. Chang. 2015, 4, 461–473. [Google Scholar] [CrossRef] [Green Version]
- Wasige, J.E.; Groen, T.A.; Smaling, E.; Jetten, V. Monitoring basin-scale land cover changes in Kagera Basin of Lake Victoria using ancillary data and remote sensing. Int. J. Appl. Earth Obs. Geoinf. 2013, 21, 32–42. [Google Scholar] [CrossRef]
- Nelson, D.M.; Verschuren, D.; Urban, M.A.; Hu, F.S. Long-term variability and rainfall control of savanna fire regimes in equatorial East Africa. Glob. Chang. Biol. 2012, 18, 3160–3170. [Google Scholar] [CrossRef] [PubMed] [Green Version]
- Berakhi, R.O.; Oyana, T.J.; Adu-Prah, S. Land use and land cover change and its implications in Kagera river basin, East Africa. Afr. Geogr. Rev. 2015, 34, 209–231. [Google Scholar] [CrossRef]
- Kiggundu, N.; Anaba, L.A.; Banadda, N.; Wanyama, J.; Kabenge, I. Assessing Land Use and Land Cover Changes in the Murchison Bay Catchment of Lake Victoria Basin in Uganda. J. Sustain. Dev. 2018, 11, 44. [Google Scholar] [CrossRef] [Green Version]
- Tatem, A.J.; Noor, A.M.; Von Hagen, C.; Di Gregorio, A.; Hay, S.I. High Resolution Population Maps for Low Income Nations: Combining Land Cover and Census in East Africa. PLoS ONE 2007, 2, e1298. [Google Scholar] [CrossRef]
- De Meyer, A.; Poesen, J.; Isabirye, M.; Deckers, J.; Raes, D. Soil erosion rates in tropical villages: A case study from Lake Victoria Basin, Uganda. CATENA 2011, 84, 89–98. [Google Scholar] [CrossRef]
- Lufafa, A.; Tenywa, M.M.; Isabirye, M.; Majaliwa, M.J.G.; Woomer, P.L. Prediction of soil erosion in a Lake Victoria basin catchment using a GIS-based Universal Soil Loss model. Agric. Syst. 2003, 76, 883–894. [Google Scholar] [CrossRef]
- Kundu, R.; Aura, C.M.; Nyamweya, C.; Agembe, S.; Sitoki, L.; Lung’ayia, H.B.O.; Ongore, C.; Ogari, Z.; Werimo, K. Changes in pollution indicators in Lake Victoria, Kenya and their implications for lake and catchment management. Lakes Reserv. Res. Manag. 2017, 22, 199–214. [Google Scholar] [CrossRef]
- Marchant, R.; Mumbi, C.; Behera, S.; Yamagata, T. The Indian Ocean dipole? The unsung driver of climatic variability in East Africa. Afr. J. Ecol. 2007, 45, 4–16. [Google Scholar] [CrossRef]
- Saji, N.H.; Goswami, B.N.; Vinayachandran, P.N.; Yamagata, T. A dipole mode in the tropical Indian Ocean. Nature 1999, 401, 360–363. [Google Scholar] [CrossRef]
- Nyamweya, C.S.; Natugonza, V.; Taabu-Munyaho, A.; Aura, C.M.; Njiru, J.M.; Ongore, C.; Mangeni-Sande, R.; Kashindye, B.B.; Odoli, C.O.; Ogari, Z.; et al. A century of drastic change: Human-induced changes of Lake Victoria fisheries and ecology. Fish. Res. 2020, 230, 105564. [Google Scholar] [CrossRef]
- Ahlqvist, O. In Search of Classification that Supports the Dynamics of Science: The FAO Land Cover Classification System and Proposed Modifications. Environ. Plan. B Plan. Des. 2008, 35, 169–186. [Google Scholar] [CrossRef] [Green Version]
- Olofsson, P.; Foody, G.M.; Herold, M.; Stehman, S.V.; Woodcock, C.E.; Wulder, M.A. Good practices for estimating area and assessing accuracy of land change. Remote Sens. Environ. 2014, 148, 42–57. [Google Scholar] [CrossRef]
- Hansen, M.C.; Potapov, P.V.; Moore, R.; Hancher, M.; Turubanova, S.A.; Tyukavina, A.; Thau, D.; Stehman, S.V.; Goetz, S.J.; Loveland, T.R.; et al. High-Resolution Global Maps of 21st-Century Forest Cover Change. Science 2013, 342, 850–853. [Google Scholar] [CrossRef] [PubMed] [Green Version]
- Treitz, P.; Rogan, J. Remote sensing for mapping and monitoring land-cover and land-use change—An introduction. Prog. Plan. 2004, 61, 269–279. [Google Scholar] [CrossRef]
- Bagstad, K.J.; Ingram, J.C.; Lange, G.; Masozera, M.; Ancona, Z.H.; Bana, M.; Kagabo, D.; Musana, B.; Nabahungu, N.L.; Rukundo, E.; et al. Towards ecosystem accounts for Rwanda: Tracking 25 years of change in flows and potential supply of ecosystem services. People Nat. 2020, 2, 163–188. [Google Scholar] [CrossRef]
- Heydari, S.S.; Mountrakis, G. Effect of classifier selection, reference sample size, reference class distribution and scene heterogeneity in per-pixel classification accuracy using 26 Landsat sites. Remote Sens. Environ. 2018, 204, 648–658. [Google Scholar] [CrossRef]
- Foody, G.M. Assessing the accuracy of land cover change with imperfect ground reference data. Remote Sens. Environ. 2010, 114, 2271–2285. [Google Scholar] [CrossRef] [Green Version]
- Foody, G.M. Status of land cover classification accuracy assessment. Remote Sens. Environ. 2002, 80, 185–201. [Google Scholar] [CrossRef]
- Ntiba, M.J.; Kudoja, W.M.; Mukasa, C.T. Management issues in the Lake Victoria watershed. Lakes Reserv. Res. Manag. 2001, 6, 211–216. [Google Scholar] [CrossRef] [Green Version]
- Virts, K.S.; Goodman, S.J. Prolific Lightning and Thunderstorm Initiation over the Lake Victoria Basin in East Africa. Mon. Weather Rev. 2020, 148, 1971–1985. [Google Scholar] [CrossRef] [Green Version]
- Kiruki, H.M.; Zanden, E.H.; Malek, Ž.; Verburg, P.H. Land Cover Change and Woodland Degradation in a Charcoal Producing Semi-Arid Area in Kenya. Land Degrad. Dev. 2017, 28, 472–481. [Google Scholar] [CrossRef] [Green Version]
- López-Carr, D.; Pricope, N.G.; Aukema, J.E.; Jankowska, M.M.; Funk, C.; Husak, G.; Michaelsen, J. A spatial analysis of population dynamics and climate change in Africa: Potential vulnerability hot spots emerge where precipitation declines and demographic pressures coincide. Popul. Environ. 2014, 35, 323–339. [Google Scholar] [CrossRef]
- Edwards, D.P.; Sloan, S.; Weng, L.; Dirks, P.; Sayer, J.; Laurance, W.F. Mining and the African Environment: Mining and Africa’s environment. Conserv. Lett. 2014, 7, 302–311. [Google Scholar] [CrossRef]
- Cobbinah, P.B.; Erdiaw-Kwasie, M.O.; Amoateng, P. Africa’s urbanisation: Implications for sustainable development. Cities 2015, 47, 62–72. [Google Scholar] [CrossRef]
- Mugiraneza, T.; Ban, Y.; Haas, J. Urban land cover dynamics and their impact on ecosystem services in Kigali, Rwanda using multi-temporal Landsat data. Remote Sens. Appl. Soc. Environ. 2019, 13, 234–246. [Google Scholar] [CrossRef]
- Stage, J.; Uwera, C. Prospects for establishing environmental satellite accounts in a developing country: The case of Rwanda. J. Clean. Prod. 2018, 200, 219–230. [Google Scholar] [CrossRef]
- Pricope, N.; Gaughan, A.; All, J.; Binford, M.; Rutina, L. Spatio-Temporal Analysis of Vegetation Dynamics in Relation to Shifting Inundation and Fire Regimes: Disentangling Environmental Variability from Land Management Decisions in a Southern African Transboundary Watershed. Land 2015, 4, 627–655. [Google Scholar] [CrossRef]
- Ruppert, J.C.; Harmoney, K.; Henkin, Z.; Snyman, H.A.; Sternberg, M.; Willms, W.; Linstädter, A. Quantifying drylands’ drought resistance and recovery: The importance of drought intensity, dominant life history and grazing regime. Glob. Chang. Biol. 2015, 21, 1258–1270. [Google Scholar] [CrossRef]
- Awange, J.; Aluoch, J.; Ogallo, L.; Omulo, M.; Omondi, P. Frequency and severity of drought in the Lake Victoria region (Kenya) and its effects on food security. Clim. Res. 2007, 33, 135–142. [Google Scholar] [CrossRef]
- Kundu, P.M.; Olang, L.O. The impact of land use change on runoff and peak flood discharges for the Nyando River in Lake Victoria drainage basin, Kenya. Water Soc. 2011, 83–94. [Google Scholar] [CrossRef] [Green Version]
- Nsengiyumva, J.; Luo, G.; Nahayo, L.; Huang, X.; Cai, P. Landslide Susceptibility Assessment Using Spatial Multi-Criteria Evaluation Model in Rwanda. Int. J. Environ. Res. Public Health 2018, 15, 243. [Google Scholar] [CrossRef] [PubMed] [Green Version]
- Rukundo, E.; Liu, S.; Dong, Y.; Rutebuka, E.; Asamoah, E.F.; Xu, J.; Wu, X. Spatio-temporal dynamics of critical ecosystem services in response to agricultural expansion in Rwanda, East Africa. Ecol. Indic. 2018, 89, 696–705. [Google Scholar] [CrossRef]


| Land Use Land Cover Class | Bare Soil | Urban Areas | Wetland | Waterbody | Small Scale Farmlands | Large Scale Farmlands | Large Scale Farmlands (Plantation) | Open Grasslands | Closed Grasslands | Open Woodland | Closed Woodland | Indigenous Forest | TOTAL | Producer’s Accuracy (%) |
|---|---|---|---|---|---|---|---|---|---|---|---|---|---|---|
| Bare Soil | 1 | 1 | 1 | 1 | 4 | 25.00 | ||||||||
| Urban Areas | 7 | 1 | 1 | 1 | 10 | 70.00 | ||||||||
| Wetland | 5 | 2 | 1 | 1 | 2 | 11 | 45.45 | |||||||
| Waterbody | 1 | 1 | 2 | 50.00 | ||||||||||
| Small Scale Farmlands | 2 | 2 | 61 | 3 | 68 | 89.71 | ||||||||
| Large Scale Farmlands | 2 | 2 | 100.00 | |||||||||||
| Large Scale Farmlands (Plantation) | 1 | 1 | 100.00 | |||||||||||
| Open Grasslands | 3 | 3 | 1 | 1 | 8 | 37.50 | ||||||||
| Closed Grasslands | 1 | 1 | 2 | 0.00 | ||||||||||
| Open Woodland | 3 | 2 | 2 | 3 | 10 | 30.00 | ||||||||
| Closed Woodland | 1 | 1 | 100.00 | |||||||||||
| Indigenous Forest | 1 | 1 | 3 | 5 | 60.00 | |||||||||
| TOTAL | 3 | 7 | 7 | 3 | 71 | 2 | 5 | 9 | 4 | 6 | 1 | 6 | 124 | |
| Consumer’s Accuracy (%) | 33.33 | 100.00 | 71.43 | 33.33 | 85.92 | 100.00 | 20.00 | 33.33 | 0.00 | 50.00 | 100.00 | 50.00 |
| 1985 | 1990 | 1995 | 2000 | 2010 | 2014 | |||||||
|---|---|---|---|---|---|---|---|---|---|---|---|---|
| Land Use Land Cover Class | Area (ha) | % cover | Area (ha) | % cover | Area (ha) | % cover | Area (ha) | % cover | Area (ha) | % cover | Area (ha) | % cover |
| Bare Soil | 172,139.58 | 100.00 | 120,516.93 | −29.99 | 225,153.99 | 30.80 | 255,524.76 | 48.44 | 417,997.26 | 142.82 | 418,171.05 | 142.93 |
| Urban Areas | 8349.93 | 100.00 | 13,017.24 | 55.90 | 25,893.45 | 210.10 | 75,763.08 | 807.35 | 82,715.67 | 890.62 | 82,715.67 | 890.62 |
| Wetland | 1,016,930.07 | 100.00 | 884,051.01 | −13.07 | 705,837.87 | −30.59 | 553,600.62 | −45.56 | 519,269.04 | −48.94 | 678,657.06 | −33.26 |
| Waterbody | 6,865,876.44 | 100.00 | 6,823,866.60 | −0.61 | 6,841,426.41 | −0.36 | 6,810,367.23 | −0.81 | 6,795,458.82 | −1.03 | 6,846,262.02 | −0.29 |
| Small Scale Farmlands | 5,656,113.81 | 100.00 | 8,056,702.80 | 42.44 | 8,160,745.05 | 44.28 | 9,750,362.85 | 72.39 | 10,565,061.03 | 86.79 | 11,016,723.51 | 94.78 |
| Large Scale Farmlands | 55,464.12 | 100.00 | 180,646.56 | 225.70 | 245,862.54 | 343.28 | 162,351.99 | 192.72 | 77,598.72 | 39.91 | 86,050.89 | 55.15 |
| Large Scale Farmlands (Plantation) | 89,364.06 | 100.00 | 62,526.87 | −30.03 | 125,390.79 | 40.31 | 156,964.68 | 75.65 | 81,023.85 | −9.33 | 80,512.11 | −9.91 |
| Open Grasslands | 3,327,540.30 | 100.00 | 3,209,778.99 | −3.54 | 2,349,974.61 | −29.38 | 2,642,632.56 | −20.58 | 1,847,900.70 | −44.47 | 1,952,168.67 | −41.33 |
| Closed Grasslands | 235,928.52 | 100.00 | 798,322.86 | 238.37 | 132,574.77 | −43.81 | 406,432.08 | 72.27 | 203,191.02 | −13.88 | 353,555.10 | 49.86 |
| Open Woodland | 4,872,046.68 | 100.00 | 3,448,280.25 | −29.22 | 4,323,433.50 | −11.26 | 2,955,998.70 | −39.33 | 3,420,505.17 | −29.79 | 2,729,238.75 | −43.98 |
| Closed Woodland | 1,583,870.58 | 100.00 | 381,222.00 | −75.93 | 546,869.79 | −65.47 | 298,554.39 | −81.15 | 198,635.76 | −87.46 | 390,230.46 | −75.36 |
| Indigenous Forest | 1,709,343.18 | 100.00 | 1,423,130.40 | −16.74 | 1,433,954.43 | −16.11 | 1,244,473.83 | −27.20 | 971,438.04 | −43.17 | 950,708.61 | −44.38 |
| Missing Data (Cloud) | 64,008.99 | 100.00 | 188,510.49 | 194.51 | 469,447.74 | 633.41 | 272,284.92 | 325.39 | 465,247.71 | 626.85 | 77,376.06 | 20.88 |
| Missing Data (Shadow) | 6534.09 | 100.00 | 72,937.35 | 1016.26 | 76,945.41 | 1077.60 | 78,198.66 | 1096.78 | 17,467.56 | 167.33 | 1140.39 | −82.55 |
| Y | X | Coefficient | Intercept | p | r | r2 | SE | n |
|---|---|---|---|---|---|---|---|---|
| Indigenous Forests | Small Scale Farmlands | −0.145 | 2,575,884.15 | 0.00 | 0.98 | 0.96 | 65,022.76 | 6 |
| Indigenous Forests | Urban Areas | −7.512 | 1,649,966.76 | 0.01 | 0.92 | 0.84 | 130,517.49 | 6 |
| Open Woodland | Small Scale Farmlands | −0.365 | 6,865,740.34 | 0.02 | 0.89 | 0.78 | 426,606.19 | 6 |
| Closed Woodland | Small Scale Farmlands | −0.220 | 2,516,496.59 | 0.03 | 0.85 | 0.73 | 297,052.03 | 6 |
| Wetlands | Urban Areas | −4.675 | 951,132.96 | 0.02 | 0.87 | 0.76 | 104,199.08 | 6 |
| Wetlands | Small Scale Farmlands | −0.084 | 1,468,604.96 | 0.03 | 0.87 | 0.75 | 107,662.44 | 6 |
| Open Grasslands | Small Scale Farmlands | −0.268 | 4,928,132.50 | 0.03 | 0.85 | 0.73 | 361,996.74 | 6 |
| Open Grasslands | Urban Areas | −14.236 | 3,239,413.48 | 0.04 | 0.82 | 0.68 | 396,317.46 | 6 |
| Open Woodland | Urban Areas | −17.859 | 4,483,514.31 | 0.07 | 0.78 | 0.61 | 570,893.38 | 6 |
| Closed Woodland | Urban Areas | −9.241 | 1,010,851.25 | 0.16 | 0.65 | 0.42 | 434,669.94 | 6 |
| Large Scale Farmlands (Plantations) | Small Scale Farmlands | 0.001 | 89,064.77 | 0.90 | 0.07 | 0.00 | 39,107.66 | 6 |
| Large Scale Farmlands | Small Scale Farmlands | −0.002 | 151,921.04 | 0.92 | 0.05 | 0.00 | 82,255.13 | 6 |
| Closed Grasslands | Small Scale Farmlands | −0.002 | 370,833.51 | 0.98 | 0.01 | 0.00 | 267,309.05 | 6 |
© 2020 by the authors. Licensee MDPI, Basel, Switzerland. This article is an open access article distributed under the terms and conditions of the Creative Commons Attribution (CC BY) license (http://creativecommons.org/licenses/by/4.0/).
Share and Cite
Mugo, R.; Waswa, R.; Nyaga, J.W.; Ndubi, A.; Adams, E.C.; Flores-Anderson, A.I. Quantifying Land Use Land Cover Changes in the Lake Victoria Basin Using Satellite Remote Sensing: The Trends and Drivers between 1985 and 2014. Remote Sens. 2020, 12, 2829. https://doi.org/10.3390/rs12172829
Mugo R, Waswa R, Nyaga JW, Ndubi A, Adams EC, Flores-Anderson AI. Quantifying Land Use Land Cover Changes in the Lake Victoria Basin Using Satellite Remote Sensing: The Trends and Drivers between 1985 and 2014. Remote Sensing. 2020; 12(17):2829. https://doi.org/10.3390/rs12172829
Chicago/Turabian StyleMugo, Robinson, Rose Waswa, James W. Nyaga, Antony Ndubi, Emily C. Adams, and Africa I. Flores-Anderson. 2020. "Quantifying Land Use Land Cover Changes in the Lake Victoria Basin Using Satellite Remote Sensing: The Trends and Drivers between 1985 and 2014" Remote Sensing 12, no. 17: 2829. https://doi.org/10.3390/rs12172829