Article

Geodetic Measurements and Numerical Models of Deformation at Coso Geothermal Field, California, USA, 2004–2016

1
Department of Geoscience at the University of Wisconsin-Madison, Madison, WI 53706, USA
2
AIR-Worldwide, Boston, MA 02116, USA
3
U.S.G.S. Earthquake Science Center, Menlo Park, CA 94025, USA
*
Author to whom correspondence should be addressed.
Current address: Los Alamos National Laboratory, Los Alamos, NM 87545, USA.
Remote Sens. 2020, 12(2), 225; https://doi.org/10.3390/rs12020225
Submission received: 5 December 2019 / Revised: 3 January 2020 / Accepted: 7 January 2020 / Published: 9 January 2020

Abstract

:
We measure transient deformation at Coso geothermal field using interferometric synthetic aperture radar (InSAR) data acquired between 2004 and 2016 and relative positions estimated from global positioning system (GPS) to quantify relationships between deformation and pumping. We parameterize the reservoir as a cuboidal sink and solve for best-fitting reservoir dimensions and locations before and after 2010 in accordance with sustainability efforts implemented in late 2009 at the site. Time-series analysis is performed on volume changes estimated from pairs of synthetic aperture radar (SAR) and daily GPS data. We identify decreasing pore-fluid pressure as the dominant mechanism driving the subsidence observed at Coso geothermal field. We also find a significant positive correlation between deformation and production rate.

Graphical Abstract

1. Introduction

The Coso geothermal field, located near China Lake, California, is the third largest geothermal field in the United States with an installed capacity to generate ∼270 MW of electrical power. It lies within an extensional step-over between dextral faults that hosts an actively developing metamorphic core complex [1,2]. Directly beneath the field lies a partially molten magma body, located below the relatively shallow (∼5 km depth) brittle–ductile transition, which heats water migrating deep into the geothermal area following precipitation in the Sierra Nevada mountain range [3]. The buoyant hot water eventually rises via faults and fractures associated with the transtensional tectonics of the region into the reservoir comprised of highly fractured plutonic and metamorphic rocks of Mesozoic age [2,4]. Fluid temperatures within the reservoir reach ∼350 C at the relatively shallow depths of ∼3 km tapped by more than 80 production wells (Figure 1). Following generation of electricity and condensation, the fluids are reinjected via more than 30 injection wells around the field. The average rates of (fluid) production and reinjection between 2004 and 2016 have been ( 24.30 ± 0.27 ) × 10 8 kg/month ( 924 ± 10 kg/s) and ( 11.72 ± 0.02 ) × 10 8 kg/month ( 446 ± 7 kg/s), respectively, which, neglecting natural recharge, corresponds to a net extraction rate of ∼ 12.58 × 10 8 kg/month (478 kg/s) [5]. In late 2009, the reservoir operators of the Coso Geothermal Plant implemented the Hay Ranch Water Project, which uses a ∼ 15 - km pipeline to recharge the existing reservoir at Coso with supplemental water, thereby increasing geothermal energy production (e.g., [6,7]).
The Coso geothermal field is well known for being one of the most seismically active regions in California. Previous studies at Coso have linked such seismicity to the motion of fluids within the geothermal system and changes in local tectonic stress (e.g., [8,9,10,11,12,13]). Geodetic studies have also observed strong subsidence signals that occur in the production region near the Coso geothermal plant (e.g., [8]), leading to the suggestion that geothermal fluids are driving both the deformation and seismicity at the site.
Similar phenomena have been observed at other geothermal fields, as recently reviewed by Majer et al. [14], Brodsky and Lajoie [15], Ellsworth [16], and Mazzoldi et al. [17]. One example is Brady Hot Springs, a geothermal field in Nevada. There, Cardiff et al. [18] found evidence relating increased microseismic activity to periods of brief cessations in pumping at the site. Such behavior is explained by the adaptation of subsurface effective (normal) stress to long-term normal operations, such that “extraction of fluids inhibits fault slip by increasing the effective [normal] stress on faults; in contrast, brief pumping cessations represent times when effective stress is decreased below its long-term average, increasing the likelihood of microseismicity” [18]. Similar phenomena have been observed at the San Emidio geothermal field in Nevada as well [19].
In this study, we explore the temporal association between pumping and deformation at Coso to determine whether there is a statistical relationship between them. We also test two competing hypotheses for the geophysical processes observed at Coso: (1) Thermal contraction and/or (2) a poroelastic response to pressure changes caused by pumping. We use an updated catalog of microseismicity, pumping records from the site, as well as interferometric synthetic aperture radar (InSAR) and global positioning system (GPS) data spanning from 2004 to 2016 for our analysis.

2. Data

2.1. Interferometric Synthetic Aperture Radar (InSAR)

We analyze 38 synthetic aperture radar (SAR) images acquired between 2004 and 2016 over Coso. Of these, 34 SAR images were acquired in ascending track 349 between 2004 and 2010 by the C-band ASAR sensor aboard the Envisat satellite [20]. An additional four SAR images were acquired after 2014 in ascending track 64 by the C-band sensor aboard the Sentinel-1A satellite [21]. We use the images to create a set of interferometric pairs using an open-source InSAR processing software (GMTSAR), which utilizes generic mapping tools (GMT) to create and visualize interferometric pairs [22,23]. The topographic contribution of each interferogram is removed using a digital elevation model with 1 arcsecond posting from the Shuttle Radar Topographic Mission [24]. Unwrapping is performed using the “statistical-cost, network-flow phase-unwrapping algorithm” (Snaphu) developed by Chen and Zebker [25] to calculate the range change rate ρ ˙ in millimeters per year.
The pairs from Environmental Satellite (Envisat) are selected using a minimum spanning tree (MST) algorithm according to orbital separation (e.g., [26]). The same data set was used in a previous deformation modeling study at Coso [27]. To summarize individual interferometric pairs, we consider the field of unwrapped range change rate ρ ˙ ( E , N ) . The mean rate between 2005 and 2010 is derived by averaging the range change rates from our 81 Envisat pairs (Figure 1), where E and N are the position coordinates easting and northing, respectively in a Universal Transverse Mercator (UTM) projection [28]. The k t h pixel of the mean rate field ρ ˙ ¯ ( E , N ) comprised of n pairs is computed as
ρ ˙ ¯ k ( E , N ) = 1 n i = 1 n ρ ˙ k ( i ) ( E , N ) .
We use the same averaging procedure to form a second stack, spanning 2014 to 2016, from the 10 pairs in the Sentinel-1A data set. The resulting data set of pairs from both satellites is shown in Figure 2 and is publicly available on the Geothermal Data Repository [29].
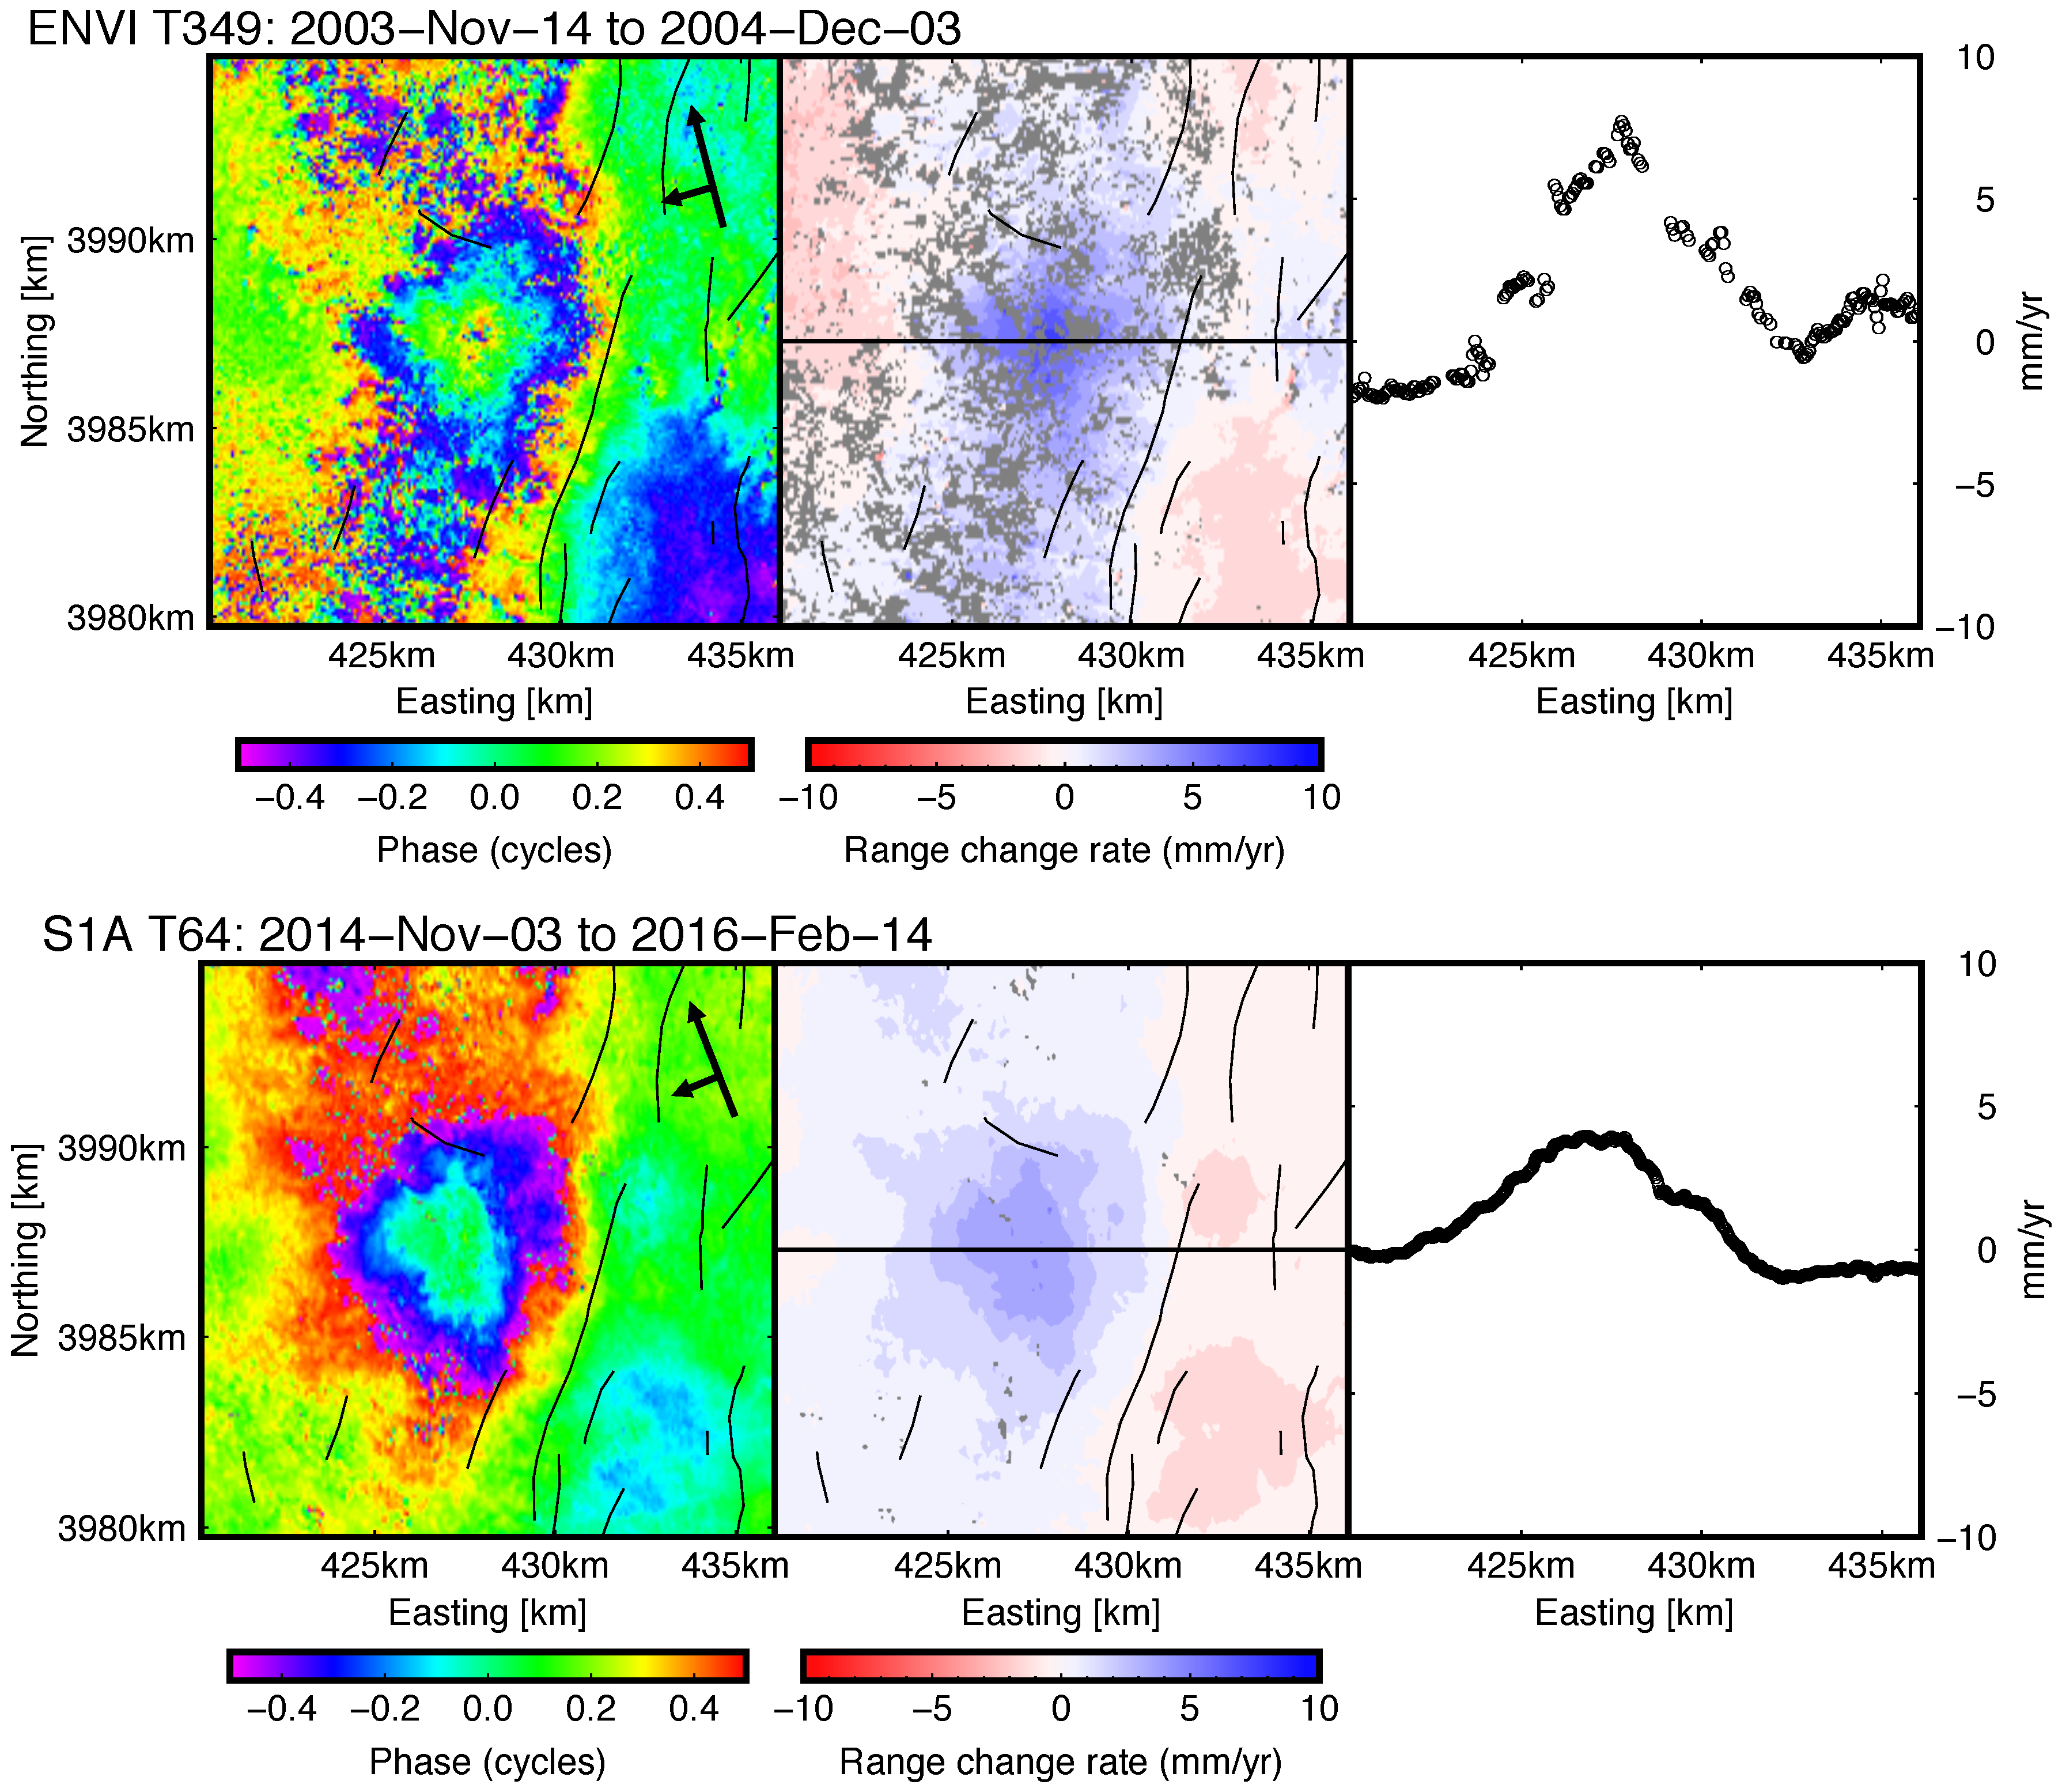
Subsidence (positive range change) as rapid as ∼30 mm/year is observed over a circular area some 3 km in radius centered on the production wells (Figure 1). This signature is consistently observed in all interferometric pairs spanning the production interval between 2004 and 2016, as shown in Figure 3. The rate and spatial extent of the deformation field are broadly consistent with InSAR data spanning 1993 to 1999 [8].

2.2. Global Positioning System (GPS)

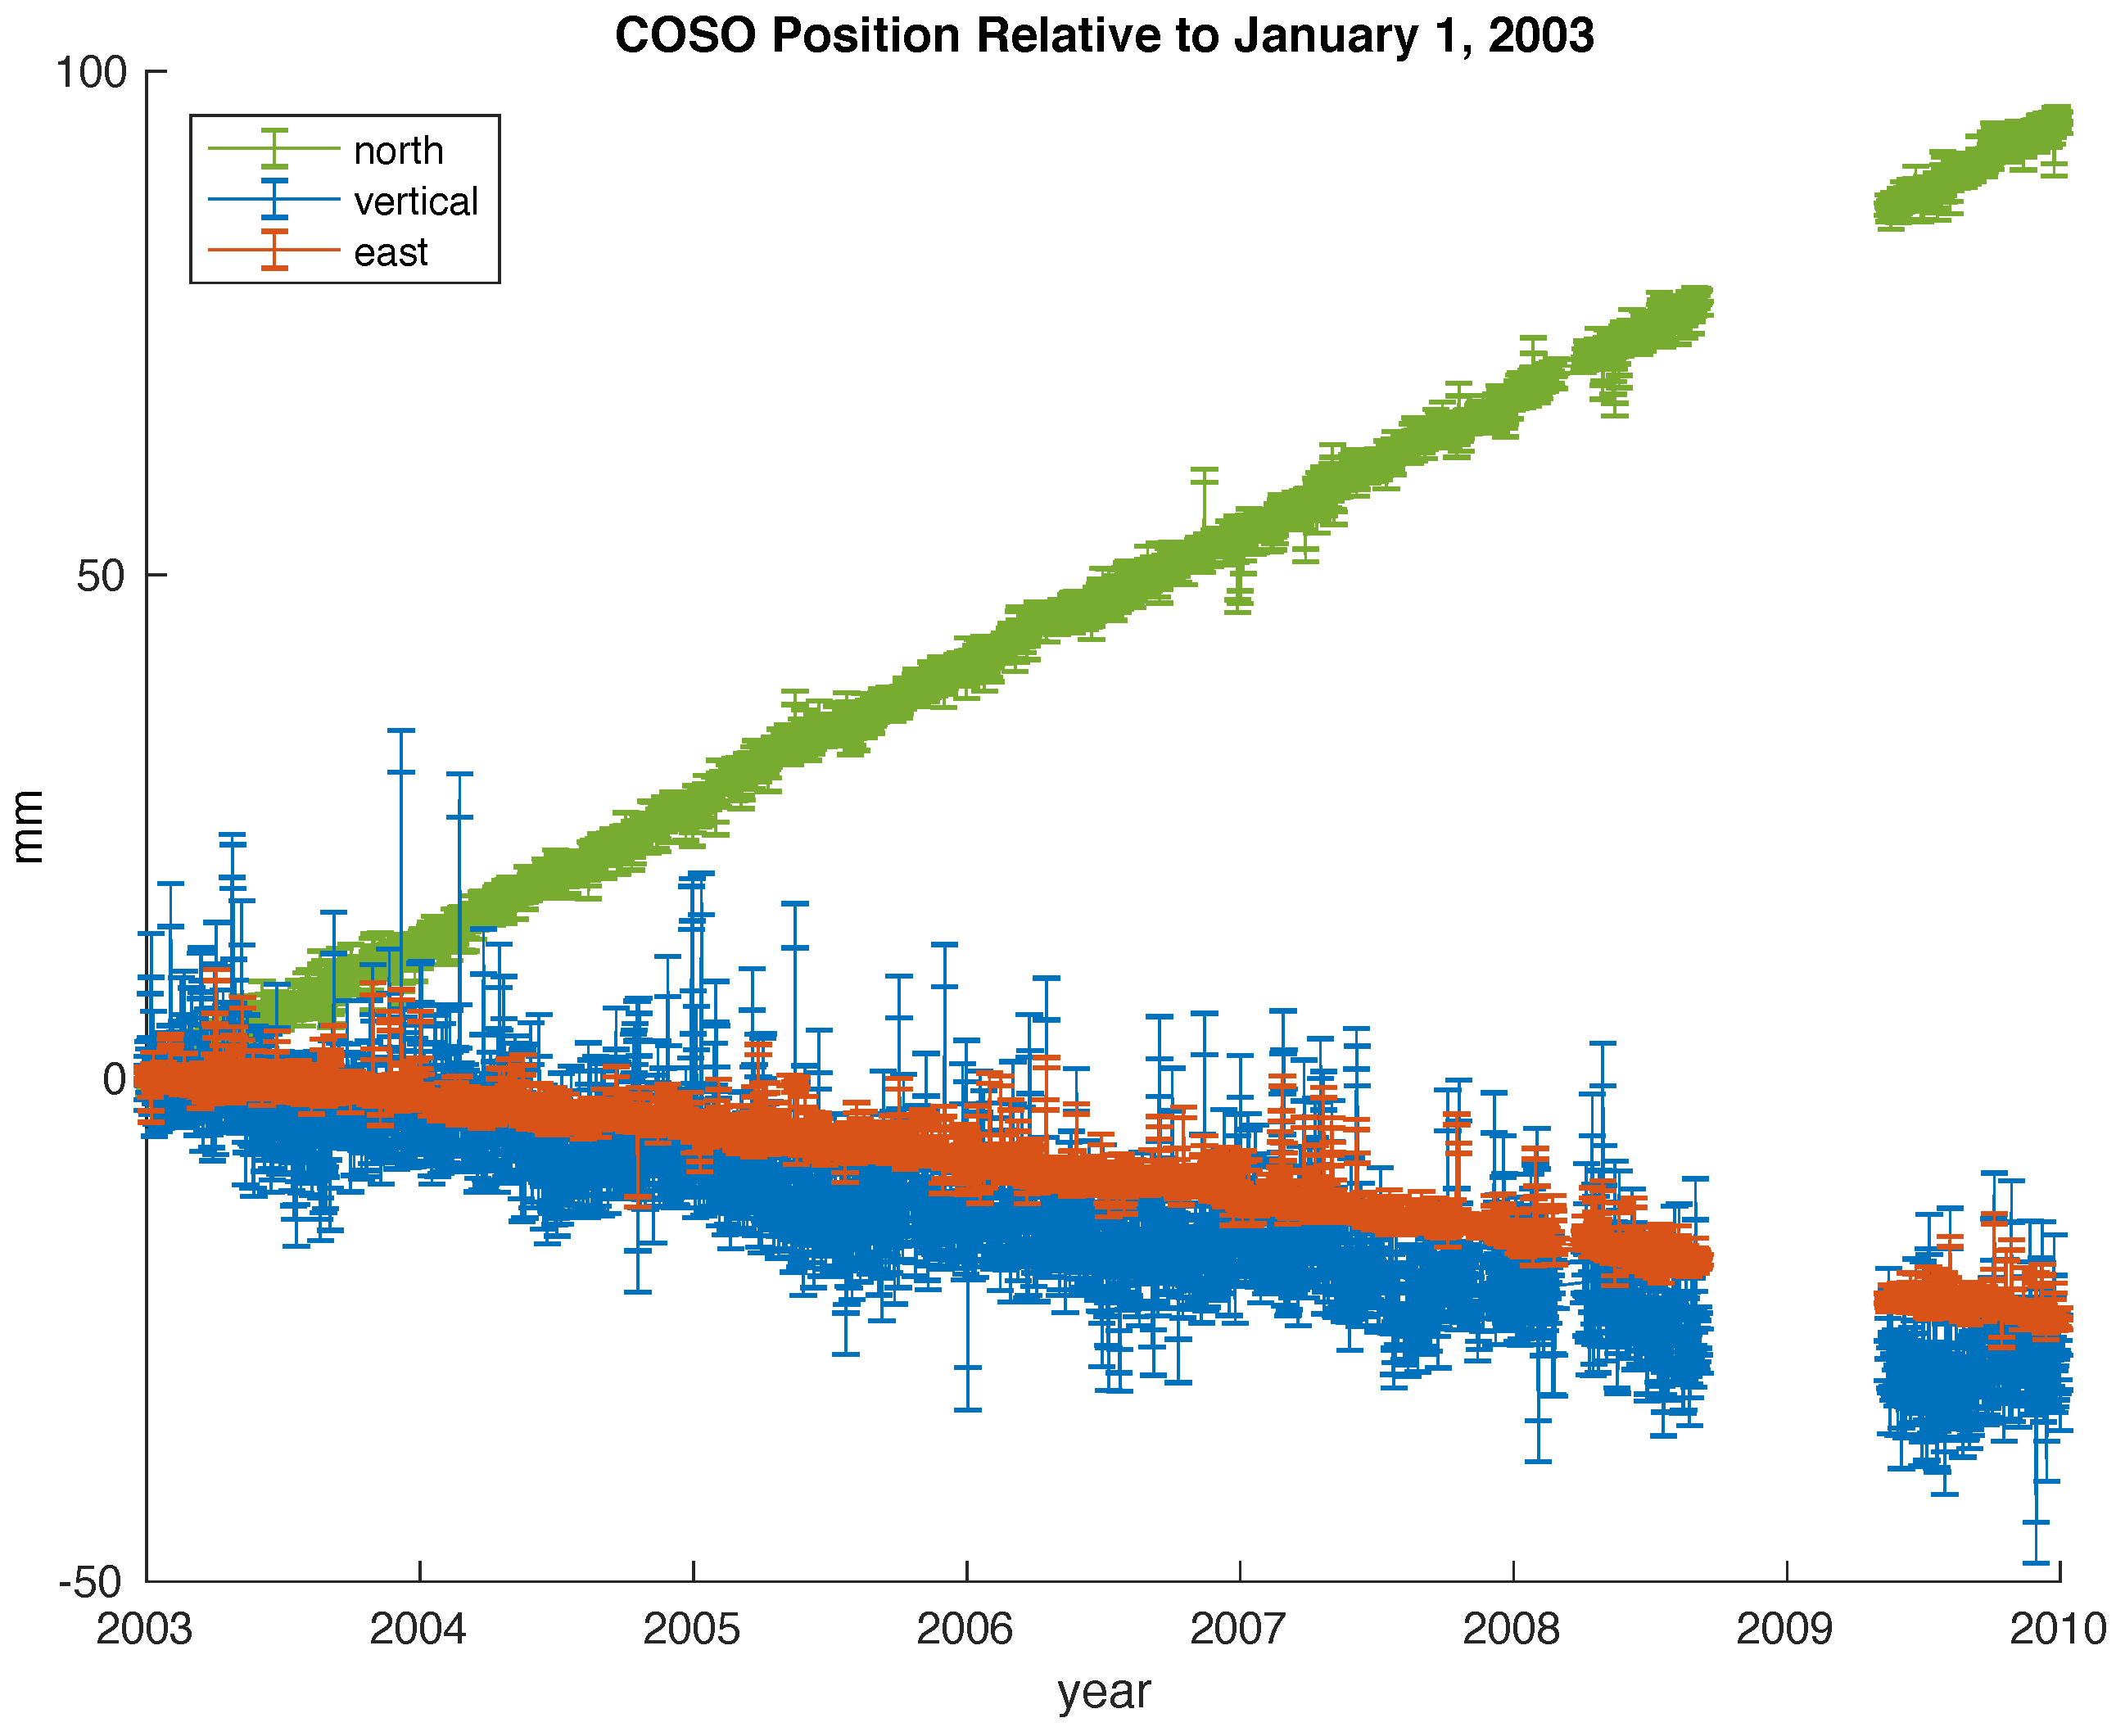
Data acquired from continuous GPS station COSO lead to daily estimates of the three components (eastward, northward, and upward) of relative position. The station is a part of the Southern California Integrated GPS Network and is located within 5 km of the center of the identified subsidence bowl. The GPS time-series data have been analyzed using methods outlined in Blewitt et al. [32] and are publicly available [33]. We use a subset of the time series from station COSO that spans from 2004 to 2015 to analyze deformation within the deforming region. We also use data from COSO to verify the accuracy of the InSAR range change rates.
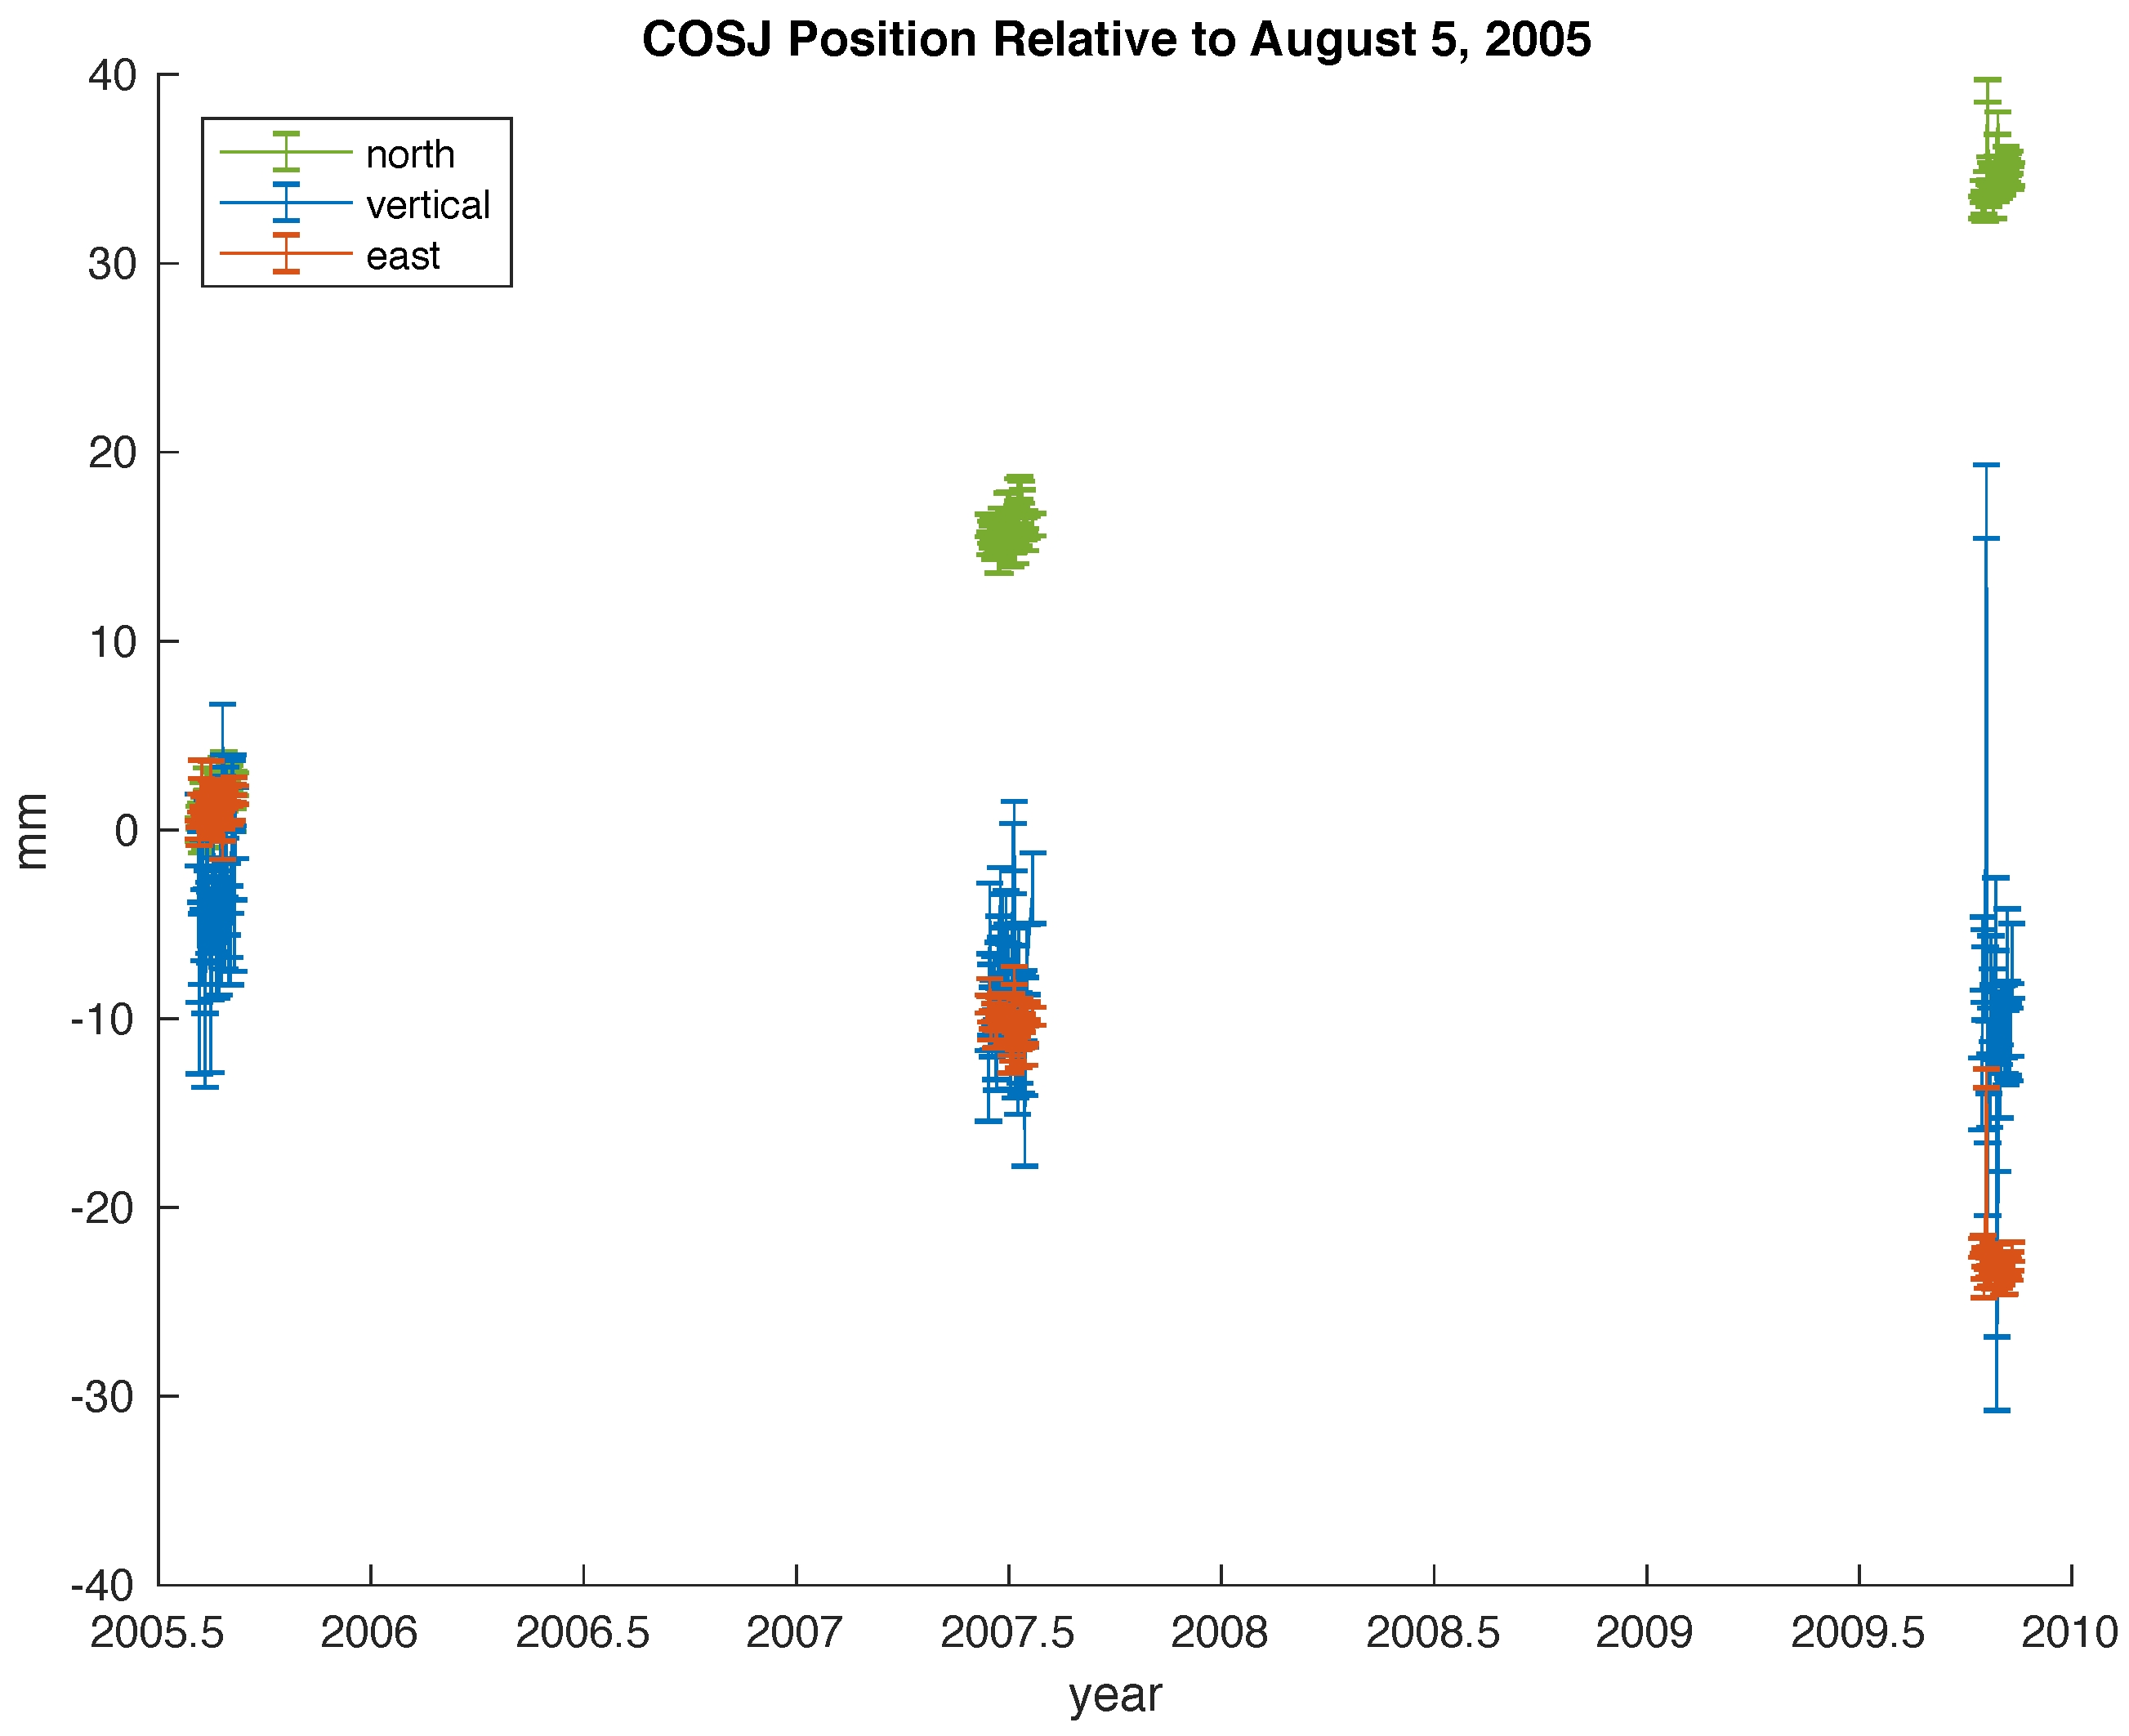
Data are also available from the campaign GPS station COSJ, located to the northwest of the deforming region. This station is a part of the MAGNET network with a publicly available time series of relative position that have been analyzed using standard procedures outlined in Blewitt et al. [32,34]. We use data from COSJ to estimate far-field deformation when verifying the accuracy of the InSAR range change rates.
Time series of relative positions from stations COSO and COSJ are shown in Figure 4 and Figure 5, respectively.

2.3. Seismic Catalog

Local and regional seismicity near the Coso geothermal field is recorded by a local borehole seismic network and analyzed by the Navy Geothermal Program Office. Kaven et al. [11] refined the initial event locations by estimating a best-fitting, one-dimensional velocity model and relocating each of the events. Resulting event hypocenters are found to have (relative) location uncertainties on the order of 300 m horizontally and 600 m vertically.
The average values of seismic velocities in this region are 5.8 and 3.5 km/s for V p and V s , respectively. We use these velocities to derive an average value of Poisson’s ratio ν = 0.21 for our deformation analysis. Given the average V p , we also estimate the density of the surrounding material to be about 2.6 g / cm 3 [35]. This is consistent with other density estimates at Coso (e.g., [2,36]).

2.4. Pumping Records

Pumping records for the monthly rates of gross injection and gross production in kilograms per month for the Coso geothermal power plant from 2005 to 2016 (Figure 6) have been published by the Division of Oil, Gas, and Geothermal Resources [5].

3. Methods

3.1. Accuracy

We start with analyzing the accuracy of unwrapped InSAR range change rates by comparison to GPS measurements. Starting with our Envisat pairs, we first convert the GPS estimates of vector position u relative to stable North America from both stations to range change Δ ρ by taking the negative scalar product with the unit vector s ^ ( E N V I ) = [ 0.41 ; 0.08 ; 0.91 ] pointing from the pixel on the ground to the radar sensor aboard the satellite.
Δ ρ ( G P S ) = s ^ ( E N V I ) · u ( G P S ) .
We then linearly interpolate and extrapolate Δ ρ ( G P S , C O S O ) and Δ ρ ( G P S , C O S J ) in time to find estimates corresponding to the start and end dates of the Envisat pairs. The GPS range values at individual points in time are then converted to pairs by first taking the difference between range estimates from COSO and COSJ to remove the far-field deformation and then by time corresponding to the time intervals of the Envisat pairs. The uncertainty for the range change estimated from GPS is derived from measurement uncertainty at each station. Differenced range changes are then converted to range change rates after dividing by the time interval for each pair. We find an estimated range change rate of 3.8 ± 3.3 mm / year at COSO with respect to COSJ. We then difference the InSAR range change measurements for pixels corresponding to COSO with measurements for pixels corresponding to COSJ from the Envisat pairs. We use the standard error of the mean as an estimate of uncertainty for the range changes observed using InSAR. The mean range change rate at COSO with respect to COSJ as measured by Envisat is 5.8 ± 10.7 mm / year . We compare the difference between the GPS and InSAR data sets for unwrapped range change rates estimated at COSO with far-field deformation effects removed using a Student’s one-sample t-test (e.g., [37]). We test the null hypothesis that the means of the two data sets are equal. We find T c a l c = 1.3 , which is less in absolute value than the critical value T α / 2 = 2.0 with 80 degrees of freedom. Thus, we conclude (with 95% confidence) that there is no significant difference between mean range change rate estimated from GPS and measured by Envisat.
We perform the same procedure for our Sentinel-1A (S1A) pairs. In this case, we use the Sentinel-1A unit pointing vector s ^ ( S 1 A ) = [ 0.63 ; 0.11 ; 0.77 ] to derive the corresponding range change rates from GPS. The estimated range change rate at COSO with respect to COSJ from GPS over the 2014–2016 time frame is 4.6 ± 2.3 mm / year . The mean range change rate at COSO with respect to COSJ as measured by Sentinel-1A is 3.3 ± 2.2 mm / year . Repeating the same test at 95% confidence, we find T c a l c = 2.1 to be less than the critical value T α / 2 = 2.3 with nine degrees of freedom. Thus, we conclude that there is no significant difference between range change rate estimated from GPS and measured by Sentinel-1A.
Figure 7 and Figure 8 show histograms of the difference in range change rates between GPS and individual InSAR pairs for both the Envisat and Sentinel-1A data sets.

3.2. Estimating Volume Change of The Reservoir

A previous modeling study by Ali et al. [27] uses a poroelastic, homogeneous model to describe the roughly circular pattern of surface deformation at Coso. Their best-fitting results are shown in Table 1.
To arrive at refined estimates of dimensional properties and volume change of the reservoir in this study, we model the deformation in each of the 91 interferometric pairs using a “cuboid” parameterization to include a single sink at a given depth in an elastic half space with uniform material properties [38]. In this model, the cuboid represents a volume element with sides of width W, length L, and height H, and an initial volume of V 0 = L W H . The cuboid is sliced into eight equal-sized octants by three rectangular patches that are mutually orthogonal. Each rectangular patch i is a dislocation with a negative value of tensile opening and has a corresponding slip vector of U = [ 0 , 0 , U i , 3 ] . The slip U i , 3 on a singular patch is proportional to the ratio of its area to the total volume change:
Δ V = 1 × ( U W , 3 L H + U L , 3 W H + U H , 3 L W ) .
We favor this parameterization over other analytical deformation models which may be used to describe circular surface deformation patterns due to its flexibility in terms of model geometry and its direct interpretability in terms of the geothermal reservoir. The model parameters, including the source location, volume change, cuboid dimensions, and InSAR-related nuisance parameters (e.g., [39,40]), along with their uncertainties, are estimated using simulated annealing methods employed by the general inversion of phase technique (GIPhT) [39,41].
The temporal distribution of our InSAR data set separates our deformation modeling into two distinct time intervals in accordance with the realization of the Hay Ranch project: 2004 to mid-2010 (corresponding to Envisat pairs and the time up to the start of the project), and 2014 to 2016 (corresponding to Sentinel-1A pairs and the time after the project was initiated). Working with the same stack of Envisat pairs as Ali et al. [27], we estimate all the model parameters starting with initial estimates based on the best-fitting results from Ali et al. [27] (Table 1). We assume the Poisson’s ratio to be ν = 0.21 , consistent with the average values of seismic velocities used to locate the seismicity. We then take the best-fitting estimates for the sink location and cuboid dimensions found from the stack inversion to be fixed and estimate the volume change for each of the 81 individual Envisat interferometric pairs. We repeat the same procedure for the Sentinel-1A pairs using their corresponding stack.

3.3. Time Series

We are interested in the temporal trend of deformation at Coso in terms of volume change of the geothermal reservoir. To analyze this trend, we perform time-series analysis using temporal adjustment on the set of volume changes Δ V i , j estimated from the individual InSAR pairs spanning the time intervals from t i to t j . This procedure converts the pair-wise volume changes Δ V i , j for individual interferometric pairs into a cumulative value of volume change at each point t i and t j in time [26]. As described previously, this approach implicitly assumes that the temporal dependence and spatial dependence of the deformation field are separable functions [26,39]. Accordingly, we write the vector displacement field u as
u ( t , x ) = f ( t ) G ( x ) ,
where f ( t ) is a function of time t only and G ( x ) is a function of spatial position coordinate x only. In our case we consider G ( x ) to be the model of a cuboidal sink contracting in a half space with uniform elastic properties. For the temporal function, we consider several parameterizations.
The first assumes a constant rate during the time interval between 2004 and 2010:
f 1 ( t i ) = a 1 ( t i t 0 ) ,
where the initial time t 0 = 2003.87 is the start date of our data set in decimal years, and a (different) constant rate a 2 during the time interval between 2010 and 2016:
f 2 ( t i ) = a 2 ( t i t 1 ) ,
where the time t 1 = 2010 refers to the date when pumping operations were altered at Coso (e.g., [6,7,42]).
To model the full data set, we use a piecewise-linear parameterization with m breaks at times t m that form ( m 1 ) segments:
f 3 ( t i ) = Σ j = 1 j = m a j D ( t i ) ,
where
D ( t i ) = 0 if t i < t j ( t j t i ) if t j t i < t j + 1 ( t j + 1 t j ) if t i t j + 1 .
We use this function with m = 2 , m = 4 , and m = 12 .
We also consider an exponentially decaying rate parameterization
f 4 ( t i ) = a e 1 e x p t i t 0 τ ,
where τ is a characteristic time scale found through nonlinear optimization. This trend would be consistent with drawdown as has been observed at Brady (e.g., [43,44]).
To increase the temporal sampling, we also analyze the volume change in the temporal dimension using the daily displacements derived from GPS data. We difference each daily record of displacement in our data set from station COSO with the previous day’s record, resulting in 3650 measurements of differential position, i.e., displacement. We then convert these displacements to range change using Equation (2) and divide by the time interval Δ t = t j t i of the paired values to arrive at the range change rate ρ ˙ . We estimate the volume change and reservoir depth in a similar manner to the InSAR data set by taking the best-fitting estimates for the source location and cuboid dimensions found from the stack inversion to be fixed. We then perform a similar time-series analysis on the resulting volume change rates.

4. Results

4.1. Deformation Modeling

The results from applying the “cuboid” parameterization to mean range change rates from both the Envisat and Sentinel-1A stacks are shown in Figure 9 and Figure 10 as well as Table 2 and Table 3, respectively. We find an estimated depth of reservoir to be 2.4 ± 0.5 km for the time period covering 2004 to 2011, consistent with the results from Ali et al. [27], while the estimated depth of the reservoir from 2014 to 2016 is 3.1 ± 0.2 km . We calculate the dimensionless misfit χ = 1.7 of the model to the Envisat data as the square root of the reduced χ 2 -test statistic ([45], p. 334). Similarly, we find the misfit of the model to the Sentinel-1A stack to be χ = 1.2 .
We similarly estimate the reservoir depth before and after 2010 using the GPS data and source location estimates from the InSAR stacks. We find that the best-fitting estimated reservoir depth for observations before 2010 is 2.6 ± 0.5 km , whereas the best-fitting estimated reservoir depth for observations after 2010 is 3.1 ± 0.6 km . For these solutions, the misfit χ is 1.4 and 1.6, respectively.

4.2. Time-Series Analysis

We start by parameterizing the volume change estimates before and after 2010 by separate, single-rate temporal functions corresponding to when well operations were varied at the site (e.g., [6,7,42]). Due to a lack of data between 2011 and 2014, we also include a break at the end of the Envisat data set (3 September 2010). Interferometric pairs included in the analysis are shown in Figure 2. For the InSAR data, we parameterize all the Envisat estimates between 2004 and 2010 using a single rate, and then similarly parameterize all the Sentinel-1A estimates between 2014 and 2016 using a single rate function. We cannot estimate any volume change for the time between 2011 and 2014, when we have no InSAR coverage. The results for this parameterization (Equation (7), m = 4 ) are shown in Figure 11. We calculate the dimensionless misfit to be χ = 0.5 . We perform a two-tailed Student’s t-test to test the null hypothesis that these two estimated rates are equal (e.g., [37]). We find a significant difference between the estimated rate before 2010 and the estimated rate after 2014 with 95% confidence (Table 4).
We also use a piecewise-linear temporal function with breaks on 1 June and 1 December of each year from 2005 to 2010 (Equation (7), m = 12 ) to further examine if any seasonal trends we see in the pumping records (Figure 6) are reflected in the InSAR data before changes in well operations. We perform an F-test for model complexity to decide whether the increased complexity of the piecewise-linear model is justified (e.g., [37], pp. 536 and 627). We test the null hypothesis that the single rate parameterization and the piecewise-linear parameterization fit the data equally well at 95% confidence. We find F c a l c = 0.94 , which is less than the critical value F α = 0.05 = 1.43 with degrees of freedom d o f 1 = 90 and d o f 2 = 79 . We conclude that the complexity of the piecewise-linear model is not justified with 95% confidence and continue with the single rate parameterization.
We use the same single-rate temporal functions for analyzing volume change estimated from GPS, treating the data before 2010 and after 2010 separately, as shown in Figure 12 (Equations (5) and (6)). We calculate the dimensionless misfit for the pre-2010 interval to be χ = 2.3 . The dimensionless misfit for the post-2010 interval is χ = 1.5 . We perform a two-tailed Student’s t-test to test the null hypothesis that the rates in the two intervals are equal (e.g., [37], p. 524). The null hypothesis is rejected with 95% confidence (Table 5) We find that the rate for the post-2010 interval is significantly smaller (slower) than the pre-2010 rate.
Table 6 compares several estimates of the subsurface volume change rate V ˙ . Rates are derived from pumping records using a range for the produced brine density of ρ p r o d [ 990 , 1250 ] kg / m 3 . The injected brine density is calculated using the thermal expansion coefficient for water, a production temperature of 350 C, and an injection temperature of 160 C [46]. Results shown in Table 6 assume a density of 1000 kg / m 3 for the produced brine and 1043 kg / m 3 for the injected brine. Net production is calculated as the difference between the rates derived from gross injection and gross production.

4.3. Correlation Test

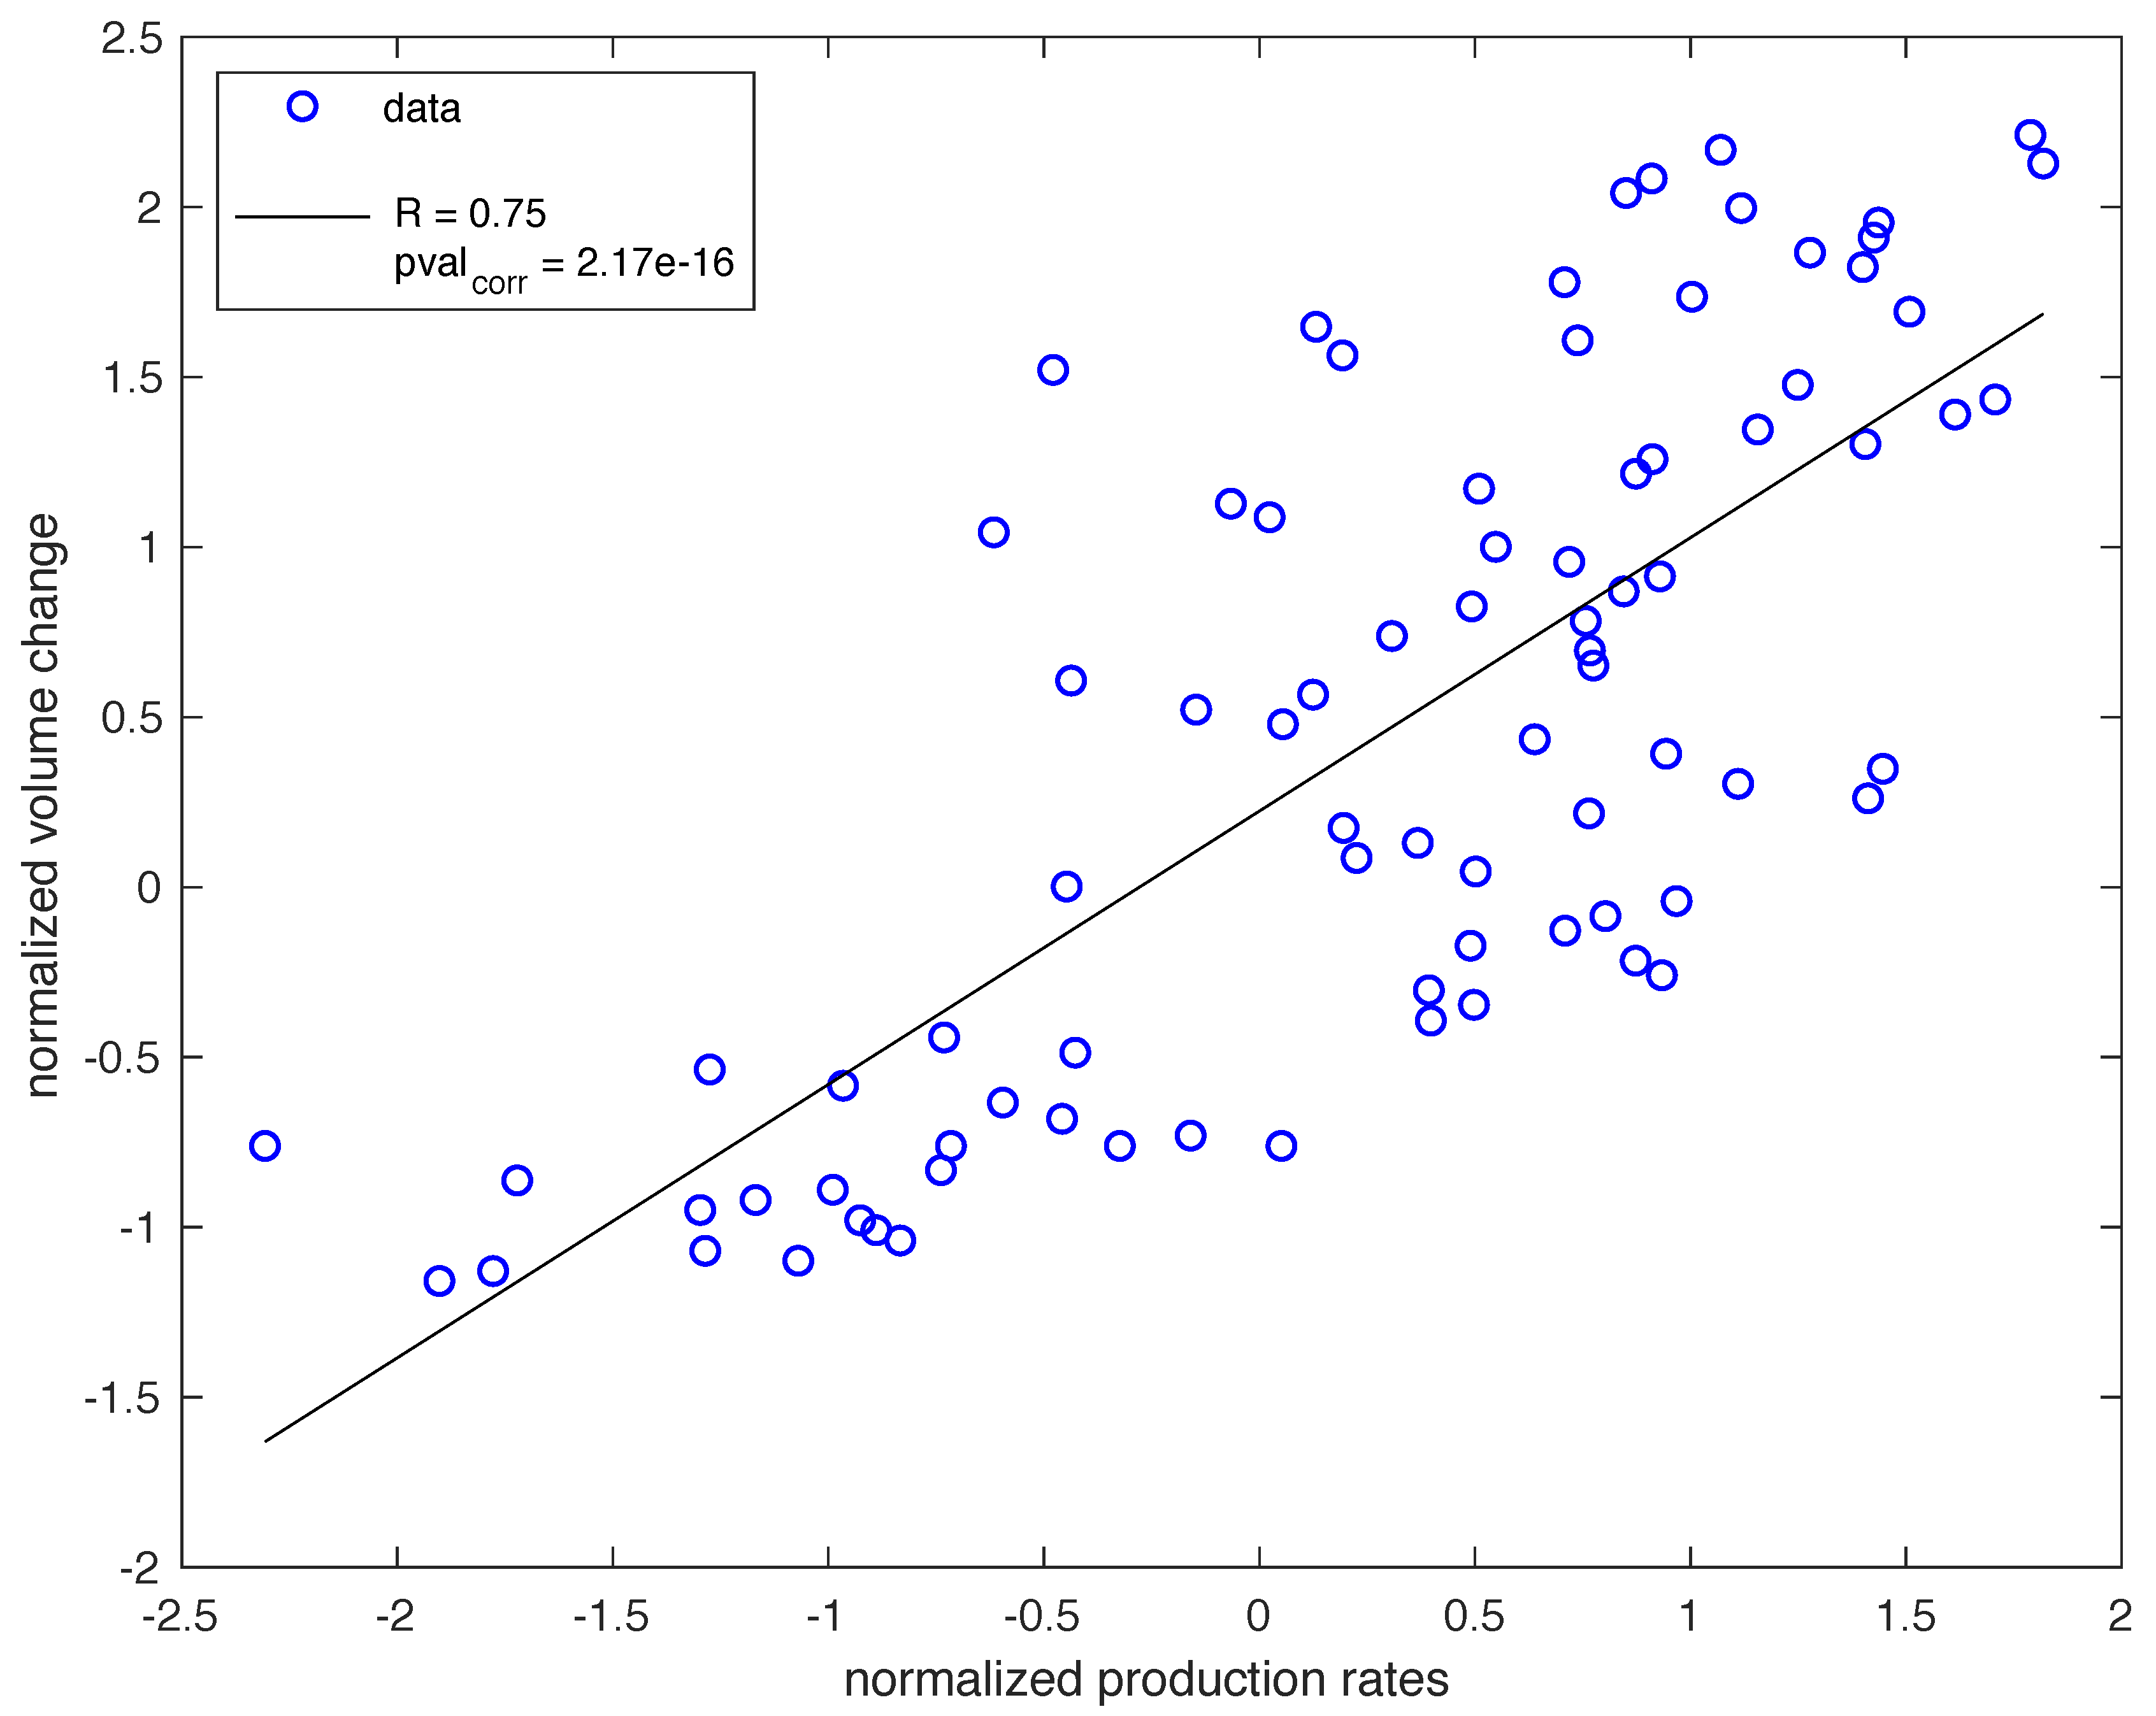
We quantify the relationship between pumping and deformation by performing correlation tests. Using the modeled values of volume change derived from temporal adjustment, we estimate the volume change at the start of each month and compare it to the monthly gross production rate. We normalize the values using a statistical Z-transform, defined as
x ^ = x x ¯ σ x
(e.g., [37], p. 181). The results are summarized in Figure 13. We first consider the monotonic relationship between volume change and gross production rate using Spearman’s test (e.g., [37], p. 786). We find a Spearman’s correlation coefficient r s = 0.75 with a corresponding p-value of p = 2.14 × 10 16 , indicating the probability of rejecting the null hypothesis of no correlation when it is actually true. This result suggests a strong monotonic relationship between volume change and gross production. We further explore the linearity of this relationship using Pearson’s test. We find a high correlation between the volume change and gross production rate, with a (Pearson’s) correlation coefficient of R = 0.75 (e.g., [37], p. 599). We test the null hypothesis of no correlation against the alternative of non-zero correlation using a Student’s t-test (e.g., [37], p. 599). We find a p-value of p = 2.2 × 10 16 Thus, we conclude that the positive correlation between the volume change each month and gross production rate is significant. Consequently, this result supports our hypothesis that deformation is causally associated with pumping at Coso. Performing the same tests with the rates of gross injection and net production yields p-values of 5.3 × 10 7 and 8.0 × 10 7 , respectively.

4.4. Identifying a Driving Mechanism for the Observed Subsidence

We convert our estimates of volume change from modeling the interferometric pairs with a “cuboid” parameterization to volumetric strain rates by dividing by the initial volume V 0 of the single cuboid and the time span Δ t . The modeling results indicate that the cuboidal sink is shrinking with an average volumetric strain rate of ϵ ˙ ¯ = Δ V ¯ / ( V 0 Δ t ) of the order of 90 microstrain/year or 3 picostrain/second in absolute value.
We consider two possible mechanisms: (1) Decreasing pore-fluid pressure and (2) thermal contraction of the rock matrix. Accordingly, we interpret our estimates of volumetric strain derived from our estimates of volume change as a result of temperature change and/or pressure change. Considering a decrease in pore fluid pressure as the cause of volume change, the observed volume change rate V ˙ in the cuboidal reservoir is related to a pressure change rate P ˙ [ Pa / year ] by:
V ˙ ( P ) = 1 H P ˙ V 0
= ϵ ˙ ( P ) V 0 ,
where 1 / H [ Pa 1 ] is the poroelastic expansion coefficient [49] and ϵ ˙ ( P ) [ year 1 ] is a poroelastic volumetric strain rate.
Alternatively, if we consider the volume change to be caused by thermal contraction, then the estimated rate of volume change rate in the cuboid is related to the rate of temperature change T ˙ [ K / year ] by
V ˙ ( T ) = ( α T T ˙ ) V 0
= ϵ ˙ ( T ) V 0 ,
where α T [ K 1 ] is the thermal expansion coefficient and ϵ ˙ ( T ) [ year 1 ] is a thermal volumetric strain rate.
We can also consider a combination of these two processes through a linear combination of Equations (12) and (14).
Following the procedure in Reinisch et al. [40], we define a priori confidence intervals for reasonable values of strain rate under each interpretation. Using results from well logs [50], we define the mean values for the rates of change in pressure P ˙ and temperature T ˙ with confidence intervals defined such that a rate of zero is two standard deviations away from the mean value.
P ˙ ( 9.4 ± 4.7 ) × 10 5 Pa / year ,
T ˙ ( 2.6 ± 1.3 ) K / year .
We similarly define confidence intervals for α T ( 1.0 ± 0.5 ) × 10 5 1 / K and 1 / H ( 5.0 ± 2.5 ) × 10 10 1 / Pa (e.g., [8,27,49,51,52,53,54]). This leads to confidence intervals for volumetric strain rate interpreted in terms of decreasing pore-fluid pressure alone, thermal contraction alone, or a combination of thermal contraction and decreasing pore-fluid pressure:
ϵ ˙ ( P ) ( 5.6 ± 4.2 ) × 10 5 year 1 ,
ϵ ˙ ( T ) ( 2.6 ± 2.0 ) × 10 5 year 1 ,
ϵ ˙ ( P + T ) ( 8.2 ± 4.6 ) × 10 5 year 1 .
We then compare the realized a posteriori 68% confidence interval for our estimates to the a priori 68% confidence intervals defined in Equation (17) to determine if any of the interpretations are unreasonable. Figure 14 shows the resulting comparisons for Envisat and Sentinel-1A pairs. In each case, we see no overlap between the realized 68% confidence interval for the volumetric strain rates and the 68% confidence interval for reasonable values of ϵ ˙ ( T ) defined a priori. We infer that the estimated values of volumetric strain rates are too high to be attributed to thermal contraction of the rock matrix alone. In contrast, we see clear overlap between the realized 68% confidence interval for volumetric strain rates and the 68% confidence interval for reasonable values of ϵ ˙ ( P ) and ϵ ˙ ( P + T ) defined a priori, with the most apparent overlap with the ϵ ˙ ( P ) interpretation. We infer that decreasing pore-fluid pressure is the dominant driving mechanism causing the subsidence observed at Coso.

5. Discussion

We find that the volumetric strain is most reasonably attributed to decreasing pore-fluid pressure during both time intervals. We also find a significant difference between the volume change rates estimated before 2010, between 2010 and 2011, and after 2014 from our InSAR data set.
The significant increase in volume change rate during the first six months following completion of the Hay Ranch project could be explained by the increased pumping activity at the site, as suggested by Eneva et al. ([42], their Figure 4) and apparent in Figure 6. The strong correlation between the amount of volume change and pumping rates (Figure 13) corroborates such an explanation.
For observations before 2010, we find the best-fitting cuboidal model for the reservoir to have a centroid depth of 2.4 ± 0.5 km, consistent with previous studies (e.g., [27,42]). The results using the Sentinel-1A stack for the time interval between 2014 and 2016, however, show that the best-fitting depth for the reservoir between 2014 and 2016 is 3.1 ± 0.2 km. The reservoir depths estimated from GPS data during both the pre-2010 and post-2010 intervals are similar to the results estimated from InSAR data. To test whether this change in depth is significant, we use a two-tailed Student’s t-test at 95% confidence. We test the null hypothesis that there is no significant difference between the centroid depth estimated for pairs before 2011 and the centroid depth estimated for pairs after 2014. We find a test statistic of | T c a l c = 4.367 | which is greater than the critical value T α / 2 = 1.99 with 89 degrees of freedom. Thus, we infer a significant difference in centroid depths before 2011 and after 2014 with 95% confidence.
The results from this geodetic modeling suggest that the depth to the center of the reservoir increased after 2010. A change in reservoir depth could be explained by reservoir depletion after 2010, when the pumping rate was increased (e.g., [42]). If the fluid level in the reservoir drops, then faults that were previously saturated by fluids within the reservoir would no longer be filled with such pressurized fluids. This Coulomb effect provides one explanation for the correlation between the monthly seismicity rates and pumping rates at Coso before 2010 and the lack of correlation thereafter as observed by Reinisch [55]. An increase in reservoir depth after 2010 could also explain the decrease in maximum deformation rates observed by InSAR after 2010 (e.g., Sentinel-1A pairs), as shown in Figure 3) and found in previous studies (e.g., [42]). The magnitude of displacement at the surface decreases as the depth of the sink increases (e.g., [38]). This reasoning explains the decrease in estimated volume change rate between pairs before 2011 and pairs after 2014.
Comparing the volume change rates in Table 6, we find that the estimates of volume change rate of the reservoir from deformation modeling are an order of magnitude less than those predicted through standard density calculations using the pumping records. Under the simple assumptions of a nearly incompressible fluid in a poroelastic half space, Segall [56] interprets Skempton’s coefficient B as the “ratio of solid volume change to change in pore fluid volume.... Thus, for example, if water is uniformly withdrawn from a rock with B = 0.8 the volumetric contraction of the rock is 80% of the volume of the extracted water.” Deng et al. [57] give the range of Skempton’s coefficient for crustal rock to be between 0.5 and 0.9 . Given the metamorphic setting of Coso with basalt and rhyolites present (e.g., [2,7]), values for B could fall below this range as well (e.g., [58]). Considering the recharge to the system, a value of B around 0.65 would explain the discrepancy between volume change rate estimates in Table 6.
Eneva et al. [42] have also suggested poroelastic effects to explain the subsidence at Coso. The model presented by Segall [56] for depleting a reservoir at constant rate and source location has been used to describe changes in subsidence at other geothermal fields (e.g., [59]). According to this model, if the rate of production (or net extraction) is constant, then the response in terms of subsidence would vary as a smooth function of time. To test this possibility, we perform temporal adjustment using a temporal function with exponentially decaying rate (Equation (9)) with a characteristic time scale of τ = 18 year found through nonlinear optimization. Our cuboidal models estimated from the InSAR and GPS data sets show different reservoir depths before and after 2010, which violates the model assumptions from Segall [56]. We use the differential (day-to-day) measurements of vertical displacement corresponding to the pairs in the GPS data set. We find a misfit of χ = 2.0 . For comparison, we perform temporal adjustment on the pair-wise vertical displacements using a piece-wise linear parameterization with a break on January 1, 2010 (Equation (7), m = 2 ), after the well operations were altered. We find a misfit of χ = 1.8 , indicating a better fit than the smooth model corresponding to a reservoir depleting at constant rate. Using an F-test, we reject the null hypothesis that the two models provide equally good fit with 95% confidence. We infer that the changes in subsidence rate, reservoir contraction, and sink depth are due to the change in injection protocol in late 2009. Apparently, the geothermal system at Coso is too complex to be explained by a model of a simple sink with constant rate of depletion and constant location.

6. Conclusions

Using methods outlined previously [40], we have advanced the characterization of the subsidence observed by InSAR at Coso geothermal field by estimating the volume change rate for each interferometric pair using a “cuboid” parameterization. Using temporal adjustment, we find a significant difference between volume change rates estimated before and after 2010 with 95% confidence. We also identify decreasing pore-fluid pressure as the dominant mechanism driving the observed deformation. We confirm a significant positive correlation between deformation and production rate.

Author Contributions

Conceptualization, E.C.R., S.T.A. and K.L.F.; Data curation, J.O.K.; Formal analysis, E.C.R.; Funding acquisition, K.L.F.; Methodology, E.C.R. and K.L.F.; Project administration, K.L.F.; Software, E.C.R. and K.L.F.; Supervision, K.L.F.; Validation, E.C.R.; Visualization, E.C.R.; Writing—original draft, E.C.R.; Writing—review & editing, E.C.R., S.T.A., M.C., J.O.K. and K.L.F. All authors have read and agreed to the published version of the manuscript.

Funding

This study was partially supported by a grant from the National Science Foundation (EAR-1237190). Elena C. Reinisch was supported by a National Science Foundation Graduate Research Fellowship (DGE-1256259) and an Advanced Opportunity Fellowship from the Graduate School at UW-Madison.

Acknowledgments

We thank Herb Wang, Martin Schoenball, Nick Davatzes, and Kelly Blake for helpful discussions. We also thank Chuck Wicks, Andy Barbour, and Jessica Murray of the USGS and Mariana Eneva of Imageair Inc. for constructive comments. Several figures were created using the Generic Mapping Tools [60]. Raw Synthetic Aperture Radar (SAR) data from the Envisat satellite mission operated by the European Space Agency (ESA) are copyrighted by ESA and were provided through the WInSAR consortium at the UNAVCO facility. Raw Synthetic Aperture Radar (SAR) data from the Sentinel-1A satellite mission operated by ESA were available free of charge through the Distributed Active Archive Center (DAAC) at the Alaska Satellite Facility (ASF) and through the Sentinels Scientific Data Hub. This material is based on data services provided by UNAVCO through the GAGE Facility with support from the National Science Foundation (NSF) and National Aeronautics and Space Administration (NASA) under NSF Cooperative Agreement No. EAR-1261833). We gratefully acknowledge support from the Weeks family to the Department of Geoscience at the University of Wisconsin–Madison. Interferometric pairs used in this analysis are publicly available on the Geothermal Data Repository [29]. Software used for this analysis is available publicly under the Coso branch of the GIPhT software suite on GitHub [61].

Conflicts of Interest

The authors declare no conflict of interest.

References

  1. Unruh, J.R.; Hauksson, E.; Monastero, F.C.; Twiss, R.J.; Lewis, J.C. Seismotectonics of the Coso Range–Indian Wells Valley region, California: Transtensional deformation along the southeastern margin of the Sierran microplate. Geol. Evol. Mojave Desert Southwest. Basin Range Geol. Soc. Am. Mem. 2002, 195, 277–294. [Google Scholar]
  2. Monastero, F.; Katzenstein, A.; Miller, J.; Unruh, J.; Adams, M.; Richards-Dinger, K. The Coso geothermal field: A nascent metamorphic core complex. Geol. Soc. Am. Bull. 2005, 117, 1534–1553. [Google Scholar] [CrossRef] [Green Version]
  3. Fournier, R.; Thompson, J.; Austin, C. Interpretation of chemical analyses of waters collected from two geothermal wells at Coso, California. J. Geophys. Res. Solid Earth 1980, 85, 2405–2410. [Google Scholar] [CrossRef]
  4. Davatzes, N.C.; Hickman, S.H. The feedback between stress, faulting, and fluid flow: Lessons from the Coso Geothermal Field, CA, USA. In Proceedings of the World Geothermal Congress 2010, Bali, Indonesia, 25–29 April 2010; pp. 1–14. [Google Scholar]
  5. Division of Oil, Gas, and Geothermal Resources. Monthly Records of Production and Injection for Geothermal Resources. Available online: ftp://ftp.consrv.ca.gov/pub/oil/geothermal/Coso.xls (accessed on 22 September 2016).
  6. TEAM Engineering & Management, Inc. Hay Ranch Project Conditional Use Permit Hydrologic Monitoring Report: Fourth Quarter 2017 Inyo County, California. Technical Report. TEAM, 2018. Available online: http://www.inyowater.org/wp-content/uploads/legacy/INDEX_DOCS/Coso%20Hay%20Ranch_FEIR_Dec_30_08.pdf (accessed on 26 January 2019).
  7. OpenEI. Coso Geothermal Area. Available online: https://openei.org/wiki/Coso_Geothermal_Area (accessed on 2 October 2018).
  8. Fialko, Y.; Simons, M. Deformation and seismicity in the Coso geothermal area, Inyo County, California: Observations and modeling using satellite radar interferometry. J. Geophys. Res. Solid Earth 2000, 105, 21781–21793. [Google Scholar] [CrossRef] [Green Version]
  9. Bhattacharyya, J.; Lees, J.M. Seismicity and seismic stress in the Coso Range, Coso geothermal field, and Indian Wells Valley region, southeast-central California. Mem. Geol. Soc. Am 2002, 195, 243–257. [Google Scholar]
  10. Kaven, J.O.; Hickman, S.H.; Davatzes, N.C. Micro-seismicity, fault structure and hydraulic compartmentalization within the Coso gethermal field, California. In Proceedings of the Thirty-Sixth Workshop on Geothermal Reservoir Engineering, Stanford, CA, USA, 31 January–2 February 2011. [Google Scholar]
  11. Kaven, J.O.; Hickman, S.H.; Davatzes, N.C. Using micro-seismicity and seismic velocities to map subsurface geologic and hydrologic structure within the Coso geothermal field, California. In Proceedings of the Thirty-Seventh Workshop on Geothermal Reservoir Engineering, Stanford, CA, USA, 30 January–1 February 2012. [Google Scholar]
  12. Kaven, J.O.; Hickman, S.H.; Davatzes, N.C. Micro-seismicity within the Coso geothermal field, California, from 1996–2012. In Proceedings of the Thirty-Eighth Workshop on Geothermal Reservoir Engineering, Stanford, CA, USA, 11–13 February 2013. [Google Scholar]
  13. Schoenball, M.; Glen, J.M.; Davatzes, N.C. Analysis and interpretation of stress indicators in deviated wells of the Coso geothermal field. In Proceedings of the Forty-First Workshop on Geothermal Reservoir Engineering, Stanford, CA, USA, 22–24 February 2016; pp. 1169–1180. [Google Scholar]
  14. Majer, E.L.; Baria, R.; Stark, M.; Oates, S.; Bommer, J.; Smith, B.; Asanuma, H. Induced seismicity associated with enhanced geothermal systems. Geothermics 2007, 36, 185–222. [Google Scholar] [CrossRef]
  15. Brodsky, E.E.; Lajoie, L.J. Anthropogenic seismicity rates and operational parameters at the Salton Sea Geothermal Field. Science 2013, 341, 543–546. [Google Scholar] [CrossRef]
  16. Ellsworth, W.L. Injection-induced earthquakes. Science 2013, 341, 142. [Google Scholar] [CrossRef]
  17. Mazzoldi, A.; Borgia, A.; Ripepe, M.; Marchetti, E.; Ulivieri, G.; della Schiava, M.; Allocca, C. Faults strengthening and seismicity induced by geothermal exploitation on a spreading volcano, Mt. Amiata, Italia. J. Volcanol. Geotherm. Res. 2015, 301, 159–168. [Google Scholar] [CrossRef]
  18. Cardiff, M.; Lim, D.D.; Akerley, J.R.P.J.; Spielman, P.; Lopeman, J.; Walsh, P.; Singh, A.; Foxall, W.; Wang, H.F.; Lord, N.E.; et al. Geothermal production and reduced seismicity: Correlation and proposed mechanism. Earth Planet. Sci. Lett. 2017, 482, 470–477. [Google Scholar] [CrossRef]
  19. Warren, I.; Gasperikova, E.; Pullammanappallil, S.; Grealy, M. Mapping Geothermal Permeability Using Passive Seismic Emission Tomography Constrained by Cooperative Inversion of Active Seismic and Electromagnetic Data. In Proceedings of the 43rd Stanford Workshop on Geothermal Reservoir Engineering, Palo Alto, CA, USA, 12–14 February 2018. [Google Scholar]
  20. McLeod, I.H.; Cumming, I.G.; Seymour, M.S. ENVISAT ASAR data reduction: Impact on SAR interferometry. IEEE Trans. Geosci. Remote Sens. 1998, 36, 589–602. [Google Scholar] [CrossRef]
  21. Geudtner, D.; Torres, R.; Snoeij, P.; Davidson, M.; Rommen, B. Sentinel-1 system capabilities and applications. In Proceedings of the 2014 IEEE Geoscience and Remote Sensing Symposium, Quebec City, QC, Canada, 13–18 July 2014; pp. 1457–1460. [Google Scholar]
  22. Sandwell, D.; Mellors, R.; Tong, X.; Wei, M.; Wessel, P. Open radar interferometry software for mapping surface deformation. Eos. Trans. Am. Geophys. Union 2011, 92, 234. [Google Scholar] [CrossRef] [Green Version]
  23. Sandwell, D.; Mellors, R.; Tong, X.; Wei, M.; Wessel, P. GMTSAR: An InSAR Processing System Based on Generic Mapping Tools; Scripps Institution of Oceanography: San Diego, CA, USA, 2011; Available online: http://escholarship.org/uc/item/8zq2c02m (accessed on 3 September 2017).
  24. Farr, T.G.; Rosen, P.A.; Caro, E.; Crippen, R.; Duren, R.; Hensley, S.; Kobrick, M.; Paller, M.; Rodriguez, E.; Roth, L.; et al. The Shuttle Radar Topography Mission. Rev. Geophys. 2007, 45, RG2004. [Google Scholar] [CrossRef] [Green Version]
  25. Chen, C.W.; Zebker, H.A. Network approaches to two-dimensional phase unwrapping: intractability and two new algorithms. JOSA A 2000, 17, 401–414. [Google Scholar] [CrossRef] [PubMed]
  26. Reinisch, E.C.; Cardiff, M.; Feigl, K.L. Graph theory for analyzing pair-wise data: Application to geophysical model parameters estimated from interferometric synthetic aperture radar data at Okmok volcano, Alaska. J. Geod. 2017, 91, 9–24. [Google Scholar] [CrossRef] [Green Version]
  27. Ali, S.T.; Akerley, J.; Baluyut, E.C.; Davatzes, N.C.; Lopeman, J.; Moore, J.; Plummer, M.; Spielman, P.; Warren, I.; Feigl, K.L. Geodetic measurements and numerical models of deformation: Examples from geothermal fields in the western United States. In Proceedings of the Forty-First Workshop on Geothermal Reservoir Engineering, Stanford, CA, USA, 22–24 February 2016. [Google Scholar]
  28. Snyder, J.P. Map Projections–A Working Manual; US Government Printing Office: Washington, DC, USA, 1987; Volume 1395. [Google Scholar]
  29. Reinisch, E.C.; Feigl, K.L. Envisat Track 349 and Sentinel-1A Track 64 Interferometric Synthetic Aperture Radar Data of Coso Geothermal Field, California, USA, 2004–2016; Technical Report, DOE Geothermal Data Repository; University of Wisconsin: Madison, WI, USA, 2019; Available online: http://gdr.openei.org/submissions/1145 (accessed on 26 June 2019).
  30. Jennings, P. Fault Map of California With Volcanoes, Thermal Springs and Thermal Wells at 1:750,000 Scale. Geological Data Map, Map No. 1. 1975. Available online: https://searchworks.stanford.edu/view/510979 (accessed on 25 September 2018).
  31. Jennings, C.; Saucedo, G.; Dart, R.; Machette, M.; Burns, D.; Faneros, G.; Little, J.; Davis, J. Digital database of faults from the fault activity map of California and adjacent areas. Calif. Div. Mines Geol. 2000, 6, 2000. Available online: https://searchworks.stanford.edu/view/4463334 (accessed on 25 September 2018).
  32. Blewitt, G.; Hammond, W.; Kreemer, C. Harnessing the GPS data explosion for interdisciplinary science. Eos 2018, 99. [Google Scholar] [CrossRef]
  33. Blewitt, G. Nevada Geodetic Laboratory Station ID: COSO. Available online: http://geodesy.unr.edu/NGLStationPages/stations/COSO.sta (accessed on 20 September 2018).
  34. Blewitt, G. Nevada Geodetic Laboratory Station ID: COSJ. Available online: http://geodesy.unr.edu/NGLStationPages/stations/COSJ.sta (accessed on 20 September 2018).
  35. Lindseth, R.O. Synthetic sonic logs—A process for stratigraphic interpretation. Geophysics 1979, 44, 3–26. [Google Scholar] [CrossRef]
  36. Feighner, M.; Goldstein, N. A gravity model for the Coso geothermal area, California. In Proceedings of the Annual Meeting of the Geothermal Resources Council and International Symposium on Geothermal Energy, Kailua-Kona, HI, USA, 20–24 August 1990. [Google Scholar]
  37. Wackerly, D.; Mendenhall, W.; Scheaffer, R. Mathematical Statistics with Applications; Cengage Learning: Boston, MA, USA, 2007; p. 944. [Google Scholar]
  38. Okada, Y. Surface deformation due to shear and tensile faults in a half-space. Bull. Seismol. Soc. Am. 1985, 75, 1135–1154. [Google Scholar]
  39. Feigl, K.L.; Thurber, C.H. A method for modelling radar interferograms without phase unwrapping: Application to the M 5 Fawnskin, California earthquake of 1992 December 4. Geophys. J. Int. 2009, 176, 491–504. [Google Scholar] [CrossRef] [Green Version]
  40. Reinisch, E.C.; Cardiff, M.; Feigl, K.L. Characterizing volumetric strain at Brady Hot Springs, Nevada, USA using geodetic data, numerical models, and prior information. Geophys. J. Int. 2018, 215, 1501–1513. [Google Scholar] [CrossRef] [Green Version]
  41. Ali, S.; Davatzes, N.; Mellors, R.; Foxall, W.; Drakos, P.; Zemach, E.; Kreemer, C.; Wang, H.; Feigl, K. InSAR measurements and numerical models of deformation at Brady Hot Springs geothermal field (Nevada), 1995–2012. In Proceedings of the Thirty-Ninth Workshop on Geothermal Reservoir Engineering, Stanford, CA, USA, 24–26 February 2014. [Google Scholar]
  42. Eneva, M.; Barbour, A.; Adams, D.; Hsiao, V.; Blake, K.; Falorni, G.; Locatelli, R. Satellite observations of surface deformation at the Coso geothermal field, California. GRC Trans. 2018, 42, 1383–1401. [Google Scholar]
  43. Patterson, J.R.; Cardiff, M.; Coleman, T.; Wang, H.; Feigl, K.L.; Akerley, J.; Spielman, P. Geothermal reservoir characterization using distributed temperature sensing at Brady Geothermal Field, Nevada. Lead. Edge 2017, 36, 1024a1–1024a7. [Google Scholar] [CrossRef] [Green Version]
  44. Patterson, J.R. Understanding Constraints on Geothermal Sustainability Through Reservoir Characterization at Brady Geothermal Field, Nevada. Master’s Thesis, University of Wisconsin, Madison, WI, USA, 2018. [Google Scholar]
  45. Strang, G.; Borre, K. Linear Algebra, Geodesy, and GPS; SIAM: Philadelphia, PA, USA, 1997; p. 624. [Google Scholar]
  46. Rose, P.E. Creation of an Enhanced Geothermal System Through Hydraulic And Thermal Stimulation; Technical Report; Energy and Geoscience Institute at the University of Utah: Salt Lake City, UT, USA, 2013. [Google Scholar]
  47. Spane Jr, F.A. Hydrogeologic Investigation of Coso Hot Springs, Inyo County, California; Technical Report; Hydro-Search Inc.: Reno, NV, USA, 1978. [Google Scholar]
  48. Austin, C.F.; Moore, J. Structural Interpretation of the Coso Geothermal Field; Technical Report; Naval Weapons Center: China Lake, CA, USA, 1987. [Google Scholar]
  49. Wang, H. Theory of Linear Poroelasticity with Applications to Geomechanics and Hydrogeology; Princeton Series in Geophysics; Princeton University Press: Princeton, NJ, USA, 2000; p. 301. [Google Scholar]
  50. Blankenship, D. West Flank Coso, CA FORGE: Well 48-11TCH Temperature, Pressure, Directional, Well History, Well Bore Schematic; Technical Report, DOE Geothermal Data Repository; Sandia National Laboratories: Albuquerque, NM, USA, 2016. [Google Scholar] [CrossRef]
  51. Mossop, A.; Segall, P. Subsidence at The Geysers geothermal field, N. California from a comparison of GPS and leveling surveys. Geophys. Res. Lett. 1997, 24, 1839–1842. [Google Scholar] [CrossRef] [Green Version]
  52. Mossop, A.; Segall, P. Volume strain within The Geysers geothermal field. J. Geophys. Res. Solid Earth 1999, 104, 29113–29131. [Google Scholar] [CrossRef]
  53. Nygren, A.J. Geomechanics Applied to Reservoir Development in the Coso Geothermal Field. Ph.D. Thesis, University of North Dakota, Grand Forks, ND, USA, 2005. [Google Scholar]
  54. Rutqvist, J.; Dobson, P.F.; Garcia, J.; Hartline, C.; Jeanne, P.; Oldenburg, C.M.; Vasco, D.W.; Walters, M. The northwest Geysers EGS demonstration project, California: Pre-stimulation modeling and interpretation of the stimulation. Math. Geosci. 2015, 47, 3–29. [Google Scholar] [CrossRef] [Green Version]
  55. Reinisch, E.C. Spatio-Temporal Characterization of Geothermal Fields by Inverse Modeling. Ph.D. Thesis, University of Wisconsin, Madison, WI, USA, 2019. [Google Scholar]
  56. Segall, P. Stress and subsidence resulting from subsurface fluid withdrawal in the epicentral region of the 1983 Coalinga earthquake. J. Geophys. Res. Solid Earth 1985, 90, 6801–6816. [Google Scholar] [CrossRef]
  57. Deng, K.; Liu, Y.; Harrington, R.M. Poroelastic stress triggering of the December 2013 Crooked Lake, Alberta, induced seismicity sequence. Geophys. Res. Lett. 2016, 43, 8482–8491. [Google Scholar] [CrossRef]
  58. Zencher, F.; Bonafede, M.; Stefansson, R. Near-lithostatic pore pressure at seismogenic depths: A thermoporoelastic model. Geophys. J. Int. 2006, 166, 1318–1334. [Google Scholar] [CrossRef] [Green Version]
  59. Barbour, A.J.; Evans, E.L.; Hickman, S.H.; Eneva, M. Subsidence rates at the southern Salton Sea consistent with reservoir depletion. J. Geophys. Res. Solid Earth 2016, 121, 5308–5327. [Google Scholar] [CrossRef] [Green Version]
  60. Wessel, P.; Smith, W.H.; Scharroo, R.; Luis, J.; Wobbe, F. Generic Mapping Tools: Improved version released. Eos. Trans. Am. Geophys. Union 2013, 94, 409–410. [Google Scholar] [CrossRef] [Green Version]
  61. Feigl, K.L.; Reinisch, E.C.; Ali, S.T.; Thurber, C.H.; Powell, L.; Sobol, P.; Masters, A. General Inversion of Phase Technique (GIPhT) Software Repository—Coso Branch; Technical Report; GitHub Inc.: San Francisco, CA, USA, 2019; Available online: https://github.com/feigl/gipht/tree/Coso (accessed on 6 June 2019).
Figure 1. Geographical location of Coso geothermal field. The inset interferogram shows the field of stacked unwrapped range change rate ρ ˙ ¯ ( E , N ) from 81 Environmental Satellite (Envisat) pairs. The pairs span from 2004 to 2010 and are selected using a minimum spanning tree algorithm according to orbital separation. Production wells are shown as upright, red triangles and injection wells are shown as inverted, blue triangles. Global positioning system (GPS) stations are labeled and denoted with black stars. Coordinates are easting and northing (km) in the Universal Transverse Mercator (UTM) projection zone 11N, WGS84 [28]. Faults from Jennings [30] and Jennings et al. [31] are shown as thin black lines. The interferogram is overlaid on a 2017 Landsat/Copernicus image from Google Earth.
Remotesensing 12 00225 g001
Figure 2. Data set of interferometric pairs included in the analysis. Pairs shown in green are the minimum spanning tree subset of 81 pairs from Envisat between 2004 and 2010 picked according to orbital separation, plotted as the perpendicular component of the “baseline” vector separating the satellite’s trajectories at the two times (“epochs”) of image acquisition. Pairs shown in red are the 10 pairs from the Sentinel-1A satellite between 2014 and 2016.
Remotesensing 12 00225 g002
Figure 3. Example interferograms from Envisat and Sentinel-1A satellites spanning the production interval. For each pair (row), the left panel shows wrapped phase in cycles, the middle panel shows range change rate in mm/year, and the right panel shows values of range change rate in mm/year taken along the profile (thick black line in the middle panel). The incidence angle (denoted as the small arrow in the northeast of the phase plot) is 21.1 and the azimuth (from North, denoted as the large arrow in the northeast corner of the phase plot) is 11.0 for Envisat pairs. The incidence angle is 33.9 and the azimuth is 13.1 for Sentinel-1A pairs. One cycle of color in wrapped phase corresponds to 28 mm of range change. Plotting conventions as in Figure 1.
Remotesensing 12 00225 g003
Figure 4. Time series of relative position in three components for continuous GPS station COSO. The northing component is shown in green, the easting component is shown in orange, and the vertical component is shown in blue. Vertical error bars denote measurement uncertainty. Measurements are shown with respect to 1 January 2003.
Remotesensing 12 00225 g004
Figure 5. Time series of relative position in three components for campaign GPS station COSJ. Measurements are shown with respect to 5 August 2005. Plotting conventions are the same as Figure 4.
Remotesensing 12 00225 g005
Figure 6. Time series showing rate of gross geothermal injection (blue), gross production (red), and net production (green) in kg/month. Data are from the Division of Oil, Gas, and Geothermal Resources [5].
Remotesensing 12 00225 g006
Figure 7. Histogram of differences between range change rate at COSO with respect to COSJ estimated from GPS using linear interpolation and extrapolation and range change rates at COSO with respect to COSJ observed by Envisat pairs.
Remotesensing 12 00225 g007
Figure 8. Histogram of differences between range change rate at COSO with respect to COSJ estimated from GPS using linear interpolation and extrapolation and range change rates at COSO with respect to COSJ observed by Sentinel-1A pairs.
Remotesensing 12 00225 g008
Figure 9. Deformation fields in terms of (unwrapped) range change rates from the minimum spanning tree (MST) Envisat stack spanning November 14, 2003 to September 3, 2010 analyzed using nonlinear inversion methods outlined in Feigl and Thurber [39]. The estimate of the parameter vector was based on finite element models by Ali et al. [27]. Inversion was performed using unwrapped range change rates. Results are shown in terms of unwrapped range change rate: (a) Observed range change rate, (b) modeled range change rate, (c) residual between observed and modeled, and (d) absolute value of residuals. We use the Universe Transverse Mercator (UTM) coordinate system as in Figure 1.
Remotesensing 12 00225 g009
Figure 10. Deformation fields in terms of (unwrapped) range change rate from the Sentinel-1A stack spanning November 3, 2014 to April 26, 2016 analyzed using nonlinear inversion methods outlined in Feigl and Thurber [39]. The estimate of the parameter vector was based on finite element models by Ali et al. [27]. Inversion was performed using unwrapped range change rates. Results are shown in terms of unwrapped range change rate: (a) Observed range change rate, (b) modeled range change rate, (c) residual between observed and modeled, (d) and absolute value of residuals. We use the UTM coordinate system as in Figure 1.
Remotesensing 12 00225 g010
Figure 11. Time series at Coso, showing cumulative volume change in the cuboidal source over time from temporal adjustment of volume change rates estimated from InSAR data spanning 2004 to 2016. Black lines show the modeled volume change with 68% confidence intervals (dashed lines) as estimated by temporal adjustment with a piecewise-linear temporal function [26]. Breaks in the parameterization are shown as green, vertically dashed lines. Red segments indicate measurements of observed volume change derived from individual interferometric pairs, with black circles indicating individual epochs in each pair. For each pair, the volume change at the mid-point of each time interval is plotted to fall on the modeled curve and the vertical blue bars denote 1 σ measurement uncertainty, after scaling by the square root of the variance scale factor.
Remotesensing 12 00225 g011
Figure 12. Time series at Coso, showing cumulative volume change over time from temporal adjustment of volume change rates estimated from GPS data spanning 2004 to 2016. Data before 2010 is shown above. Data after 2010 is shown below. Plotting conventions as in Figure 11.
Remotesensing 12 00225 g012
Figure 13. Scatter plot showing the monthly volume change estimated from temporal adjustment of InSAR data and monthly gross production rates.
Remotesensing 12 00225 g013
Figure 14. Histograms of best-fitting estimates of volumetric strain rates interpreted in terms of thermal contraction of the rock matrix (first row), a decrease in pore-fluid pressure (second row), and a linear combination of the two (third row) for Envisat pairs corresponding to the time interval from 2004 to mid-2010 (first column) and Sentinel-1A pairs corresponding to the time interval between 2014 and 2016 (second column). Overlain are 68% confidence intervals for reasonable values defined a priori (red) and realized values from deformation modeling (green). Also shown is the best fitting estimate of mean strain rate (black) found from temporal adjustment with a single rate temporal function.
Remotesensing 12 00225 g014
Table 1. Finite element modeling results from Ali et al. [27].
Parameter NameBest-Fitting EstimateUncertainty
Easting in m428,651.31000
Northing in m3,987,538.41000
Reservoir depth in m2366.6250
Reservoir half thickness in m2053.1250
Reservoir half length in m3027.2500
Young’s Modulus in GPa250
Poisson’s Ratio0.250
Pressure Change in MPa 0.3 0
Biot’s Coefficient10
Table 2. Results from nonlinear inversion with a “cuboid” parameterization on the stack of MST Envisat pairs spanning 2004 to 2011.
Parameter NameBest-Fitting EstimateUncertainty
Easting gradient δ ρ / δ x 6.78 × 10 8 2.19 × 10 7
Northing gradient δ ρ / δ y −9.93 × 10 9 1.86 × 10 7
Upwards gradient δ ρ / δ z −9.97 × 10 7 9.67 × 10 7
Offset in cycles−0.50.8
Poisson ratio ν 0.210
Volume change rate V ˙ [ m 3 / year ] −2.02 × 10 5 2.81 × 10 4
Centroid Easting E in m428,580.4531.3
Centroid Northing N in m3,987,509.0250.0
Centroid Depth in m2418.2531.3
Cuboid L in m3.07 × 10 3 3.23 × 10 2
Cuboid W in m2.28 × 10 3 2.25 × 10 2
Cuboid H in m1.95 × 10 3 2.42 × 10 2
Table 3. Results from nonlinear inversion with a “cuboid” parameterization on the stack of Sentinel-1A pairs spanning 2014 to 2016.
Parameter NameBest-Fitting EstimateUncertainty
Easting gradient δ ρ / δ x 1.64 × 10 9 6.25 × 10 8
Northing gradient δ ρ / δ y −1.39 × 10 7 9.38 × 10 8
Upwards gradient δ ρ / δ z 6.73 × 10 7 2.19 × 10 6
Offset in cycles−0.50.6
Poisson ratio ν 0.210
Volume change rate V ˙ [ m 3 / year ] −1.07 × 10 6 2.25 × 10 5
Centroid Easting E in m428,870.448.4
Centroid Northing N in m3,986,482.046.9
Centroid Depth in m3098.7195.3
Cuboid L in m3.12 × 10 3 4.84 × 10 1
Cuboid W in m2.34 × 10 3 4.84 × 10 1
Cuboid H in m1.93 × 10 3 4.84 × 10 1
Table 4. Results from two-tailed Student’s t-test with degrees of freedom d o f at the 95% confidence level (e.g., [37], p. 524) for volume change rates estimated from interferometric synthetic aperture radar (InSAR) data. H 0 : equal rates; H 1 : rates differ.
Start of
Break 1
Start of
Break 2
Rate 1
× 10 6 [m3/year]
Rate 2
× 10 6 [m3/year]
dof Test ValueCritical ValueResult
2003111420100101 ( 1.2 ± 0.04 ) ( 1.3 ± 0.29 ) 783.951.99reject H 0
2003111420141102 ( 1.2 ± 0.04 ) ( 0.80 ± 0.05 ) 76−25.161.99reject H 0
2010010120141102 ( 1.3 ± 0.29 ) ( 0.80 ± 0.05 ) 16−4.672.12reject H 0
Table 5. Results from two-tailed Student’s t-test with degrees of freedom d o f at the 95% confidence level (e.g., [37], p. 524) for volume change rates estimated from GPS data pre-2010 and post-2010. H 0 : no significant difference in rates; H 1 : signficant difference in rates.
Pre-2010 Rate
× 10 6 m3/year
Post-2010 Rate
× 10 5 m3/year
dof Test ValueCritical ValueResult
( 1.2 ± 0.02 ) ( 8.10 ± 0.09 ) 3638−843.221.96reject H 0
Table 6. Estimates of subsurface volume change from multiple data sets.
Data Source V ˙ [L/s]
Gross injection [5] 427 ± 105
Gross production [5] 924 ± 202
Net production [5] 497 ± 228
Cuboid sink estimated from InSAR data from 2005 to 2010 38 ± 1
Cuboid sink from InSAR data from 2014 to 2016 25 ± 2
Cuboid sink estimated from GPS data from 2005 to 2010 38 ± 1
Cuboid sink from GPS data from 2014 to 2016 26 ± 3
Average recharge [47,48]130