Abstract
Replacing fossil fuels with cellulosic biofuels is a valuable component of reducing the drivers of climate change. This leads to a requirement to develop more productive bioenergy crops, such as Arundo donax with the aim of increasing above-ground biomass (AGB). However, direct measurement of AGB is time consuming, destructive, and labor-intensive. Phenotyping of plant height and biomass production is a bottleneck in genomics- and phenomics-assisted breeding. Here, an unmanned aerial vehicle (UAV) for remote sensing equipped with light detection and ranging (LiDAR) was tested for remote plant height and biomass determination in A. donax. Experiments were conducted on three A. donax ecotypes grown in well-watered and moderate drought stress conditions. A novel UAV-LiDAR data collection and processing workflow produced a dense three-dimensional (3D) point cloud for crop height estimation through a normalized digital surface model (DSM) that acts as a crop height model (CHM). Manual measurements of crop height and biomass were taken in parallel and compared to LiDAR CHM estimates. Stepwise multiple regression was used to estimate biomass. Analysis of variance (ANOVA) tests and pairwise comparisons were used to determine differences between ecotypes and drought stress treatments. We found a significant relationship between the sensor readings and manually measured crop height and biomass, with determination coefficients of 0.73 and 0.71 for height and biomass, respectively. Differences in crop heights were detected more precisely from LiDAR estimates than from manual measurement. Crop biomass differences were also more evident in LiDAR estimates, suggesting differences in ecotypes’ productivity and tolerance to drought. Based on these results, application of the presented UAV-LiDAR workflow will provide new opportunities in assessing bioenergy crop morpho-physiological traits and in delivering improved genotypes for biorefining.
1. Introduction
Given the rapidly growing world population and pressure placed on availability and productivity of agricultural lands by climate change, it is imperative to explore new technologies and approaches to help increase the rate of crop improvement. These improvements aim to increase biomass of food and feed crops and that of bioenergy crops which reduce the need for fossil fuels. An important step towards this goal has been the transformation in the detail and speed of genetic information brought about by next-generation sequencing. However, there remains a bottleneck in acquiring the information on the detailed morphological and physiological characteristics of large number of crop genotypes, an activity known as phenotyping. In part, this requirement has been fulfilled by the development of phenomics platforms for fast, accurate, high-resolution, and non-destructive high-throughput phenotyping [1], which have several advantages, including flexibility, convenient operation [2,3] and the ability to provide controlled experimental treatments. There have also been useful developments in the provision of high-resolution field phenotyping systems, but these are relatively large systems deployed on fixed sites [4]. However, neither of these approaches allows the flexibility to operate directly on field crops on any site required, such as a large breeding nursery, an experimental agriculture site or a typical commercial farm where detailed crop phenotyping is required. Thus, the overall aim of this study is to investigate the application of unmanned aerial vehicle (UAV)-based high-resolution remote sensing to phenotyping ecotypes of the bioenergy crop Arundo donax under contrasting water stress levels to determine the associations between genomic and phenotypic data that will allow rapid crop improvement [1,5]. Key physical parameters that are targets for A. donax high-throughput phenotypic evaluation under the real conditions experienced by the plant include crop height and above-ground biomass (AGB) production.
Formally the phenotype is an expression of the genotype and the environment in which it grows, including structural traits (e.g., plant height, leaf area index, lodging, crop canopy cover), canopy spectral texture (spectral features), physiological traits (e.g., chlorophyll, biomass, pigment content, photosynthesis), abiotic/biotic stress indicators (e.g., stomatal conductance, canopy temperature difference, leaf water potential, and senescence index), nutrients (nitrogen concentration, protein content), and yield [1]. Many of these traits can be used as indicators of plant fitness and for biomass estimation and have been used in selective plant breeding for decades. An important feature of these measurements is they often require manual measurement or sampling. This is invariably time consuming, can result in considerable crop disturbance and for some measurements requires destructive sampling. Thus, any non-invasive and non-destructive measurements which can be used as an indicator of likely biomass that can readily be applied to a biomass crop would be advantageous. Crop height is recognized as one of the most important components of AGB and yield in biomass crops [6,7]. Height can be reduced by environmental stress and can therefore be used to separate drought sensitive from drought tolerant crops [8,9]. Traditionally, crop height and diameter are measured manually with graduated poles and measuring tapes; this is difficult to do without canopy disturbance in the central region away from plot edges of tall (3.2 to 4.2 m) A. donax plants with their typically high shoot density. In terms of the choice of sensor, light detection and ranging (LiDAR) is a promising technology to measure plant height and predict biomass [10]. LiDAR equipped UAVs have been demonstrated to work well in forestry [11,12], maize [13], and shorter annual crops such as wheat [14]. There is one study using tractor mounted LiDAR to characterize a bioenergy crop, Miscanthus giganteus, with good results (reported accuracy 92–98.2%) [15]. However, the approach is limiting in terms of field size and shape as well as crop horizontal density, thus demonstrating the advantage of UAV platforms. Prior to our study, there was no survey that has applied UAV-based LiDAR to A. donax which contrasts both in terms of crop structure and leaf reflectivity with other crops studied to date.
An important aspect of LiDAR operation for agricultural and ecological studies, where timeliness of measurements is important, is the active laser illumination which means it is routinely deployed under a wide range of illumination conditions. The LiDAR data recorded is developed into a three-dimensional (3D) georeferenced point cloud further separated into a digital terrain model (DTM) and a digital surface model (DSM). These are then subtracted to create a normalized DSM, also called crop height model (CHM) when crop positions have been identified. Further analysis of the CHM allows estimation of heights and biomass [16] to answer ecologically valuable questions related to these two variables and their associated genotypes.
A. donax is a polyploid perennial rhizomatous grass grown for bioenergy production. It was found to be the most productive biomass crop when allowed to grow for more than four years [17]. Long considered an invasive plant, A. donax is unimproved and understudied as a crop, presenting a great opportunity for breeders and researchers to explore its suitability for growth on marginal lands. Given the interest in its potential for bioenergy applications, the A. donax transcriptome was sequenced and de novo assembled [18]; thus, good genetic information but much less phenotyping data is available. Not only does A. donax have high yield compared to other biomass crops, some ecotypes have high tolerance to soil contamination by heavy metals [19], tolerance to high salinity or tolerance to water stress [20,21]. Thus, it satisfies the need for an improved bioenergy crop that can yield high biomass, grow in harsh environments, and does not compete for higher quality land suitable for food production.
Here, we report the use of drone-mounted LiDAR to determine differences in responses of A. donax ecotypes to drought stress under field conditions. We set out to answer three questions: (i) can the proposed method of processing 3D point cloud data generated from LiDAR determine A. donax crop height and estimate biomass production; (ii) can it identify differences between A. donax ecotype heights and biomass; and (iii) can it identify differences between drought-stressed and well-watered ecotypes?
2. Materials and Methods
2.1. Experimental Setup
Plant Material and Experimental Design
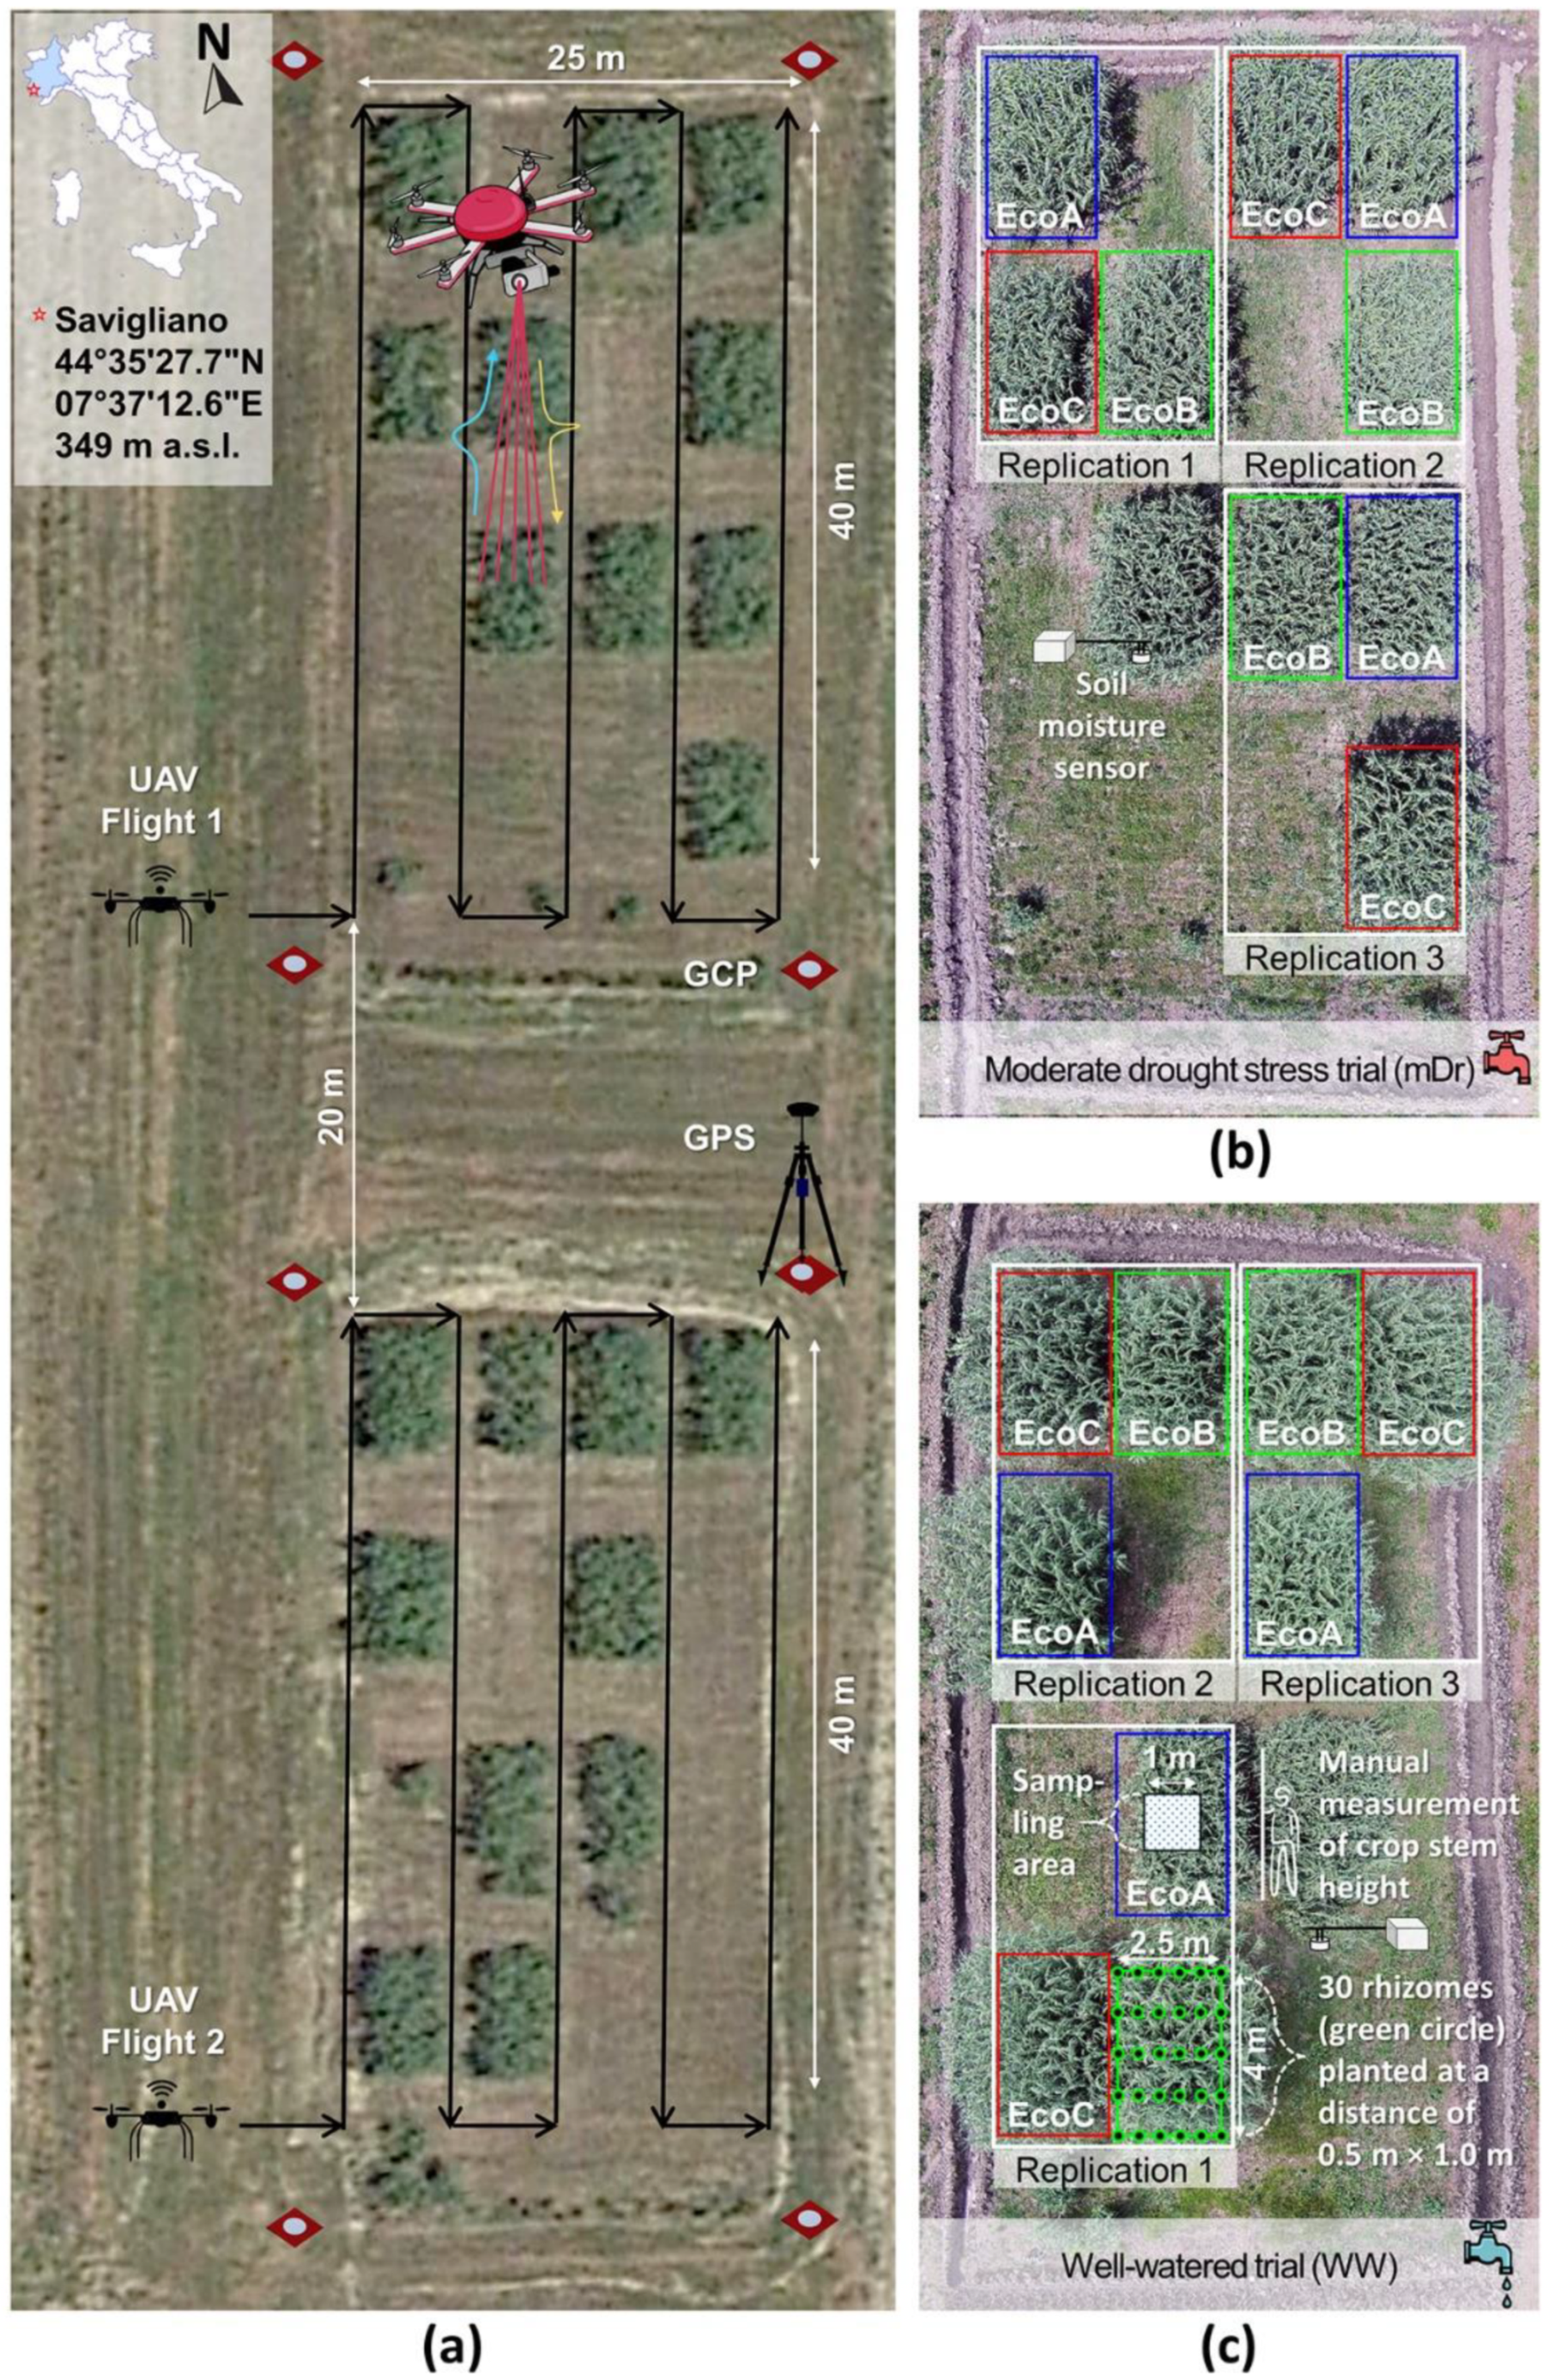
The study area was located in Savigliano, northern Italy, (44°35′ N, 07°37′ E, 349 m above sea level) (Figure 1a). Three clones of A. donax (named hereafter EcoA, EcoB, and EcoC) were selected from a set of 82 EuroMediterranean ecotypes [22] and vegetatively propagated by rhizomes. The selected ecotypes originated from three contrasting environments: EcoA was collected from the coastal habitat of Attica region (southern Greece), characterized by typical warm Mediterranean climate; EcoB originated from the coastal habitat of southern Dalmatia region (southern Croatia), characterized by temperate oceanic climate; and EcoC was collected from the hilly area of Viseu district (northern Portugal), characterized by temperate Mediterranean climate. The field experiment began in March 2014. There were three replicate plots of each ecotype grown in each of two watering regimes: the well-watered (WW, kept at 40% volumetric water content) and natural moderate drought stress (mDr, allowed to fall to 15% volumetric water content during June). Each ecotypic replicate consisted of 30 homogeneous cuttings which were planted at distances of 0.5 m × 1.0 m. The experimental design is shown in Figure 1.
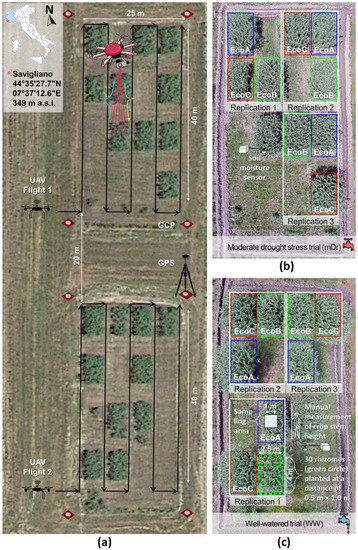
Figure 1.
(a) Aerial view of the experimental site of Arundo donax located in northern Italy, Savigliano (see inset), with image showing flight plans over the well-watered (WW) and natural moderate drought stress (mDr) treatments (identified in (b) and (c)), running parallel to plant rows to ensure complete coverage with good overlaps. Four ground control points around each plot are also shown. (b) Layout of mDr treatment with location of soil moisture sensors. (c) Layout of ecotypes and replicates in WW treatment. An example of the central area of one plot used for manual height recording is shown for replication 1 of EcoA (similar positions were used for all plants).
2.2. UAV Phenotyping Platform
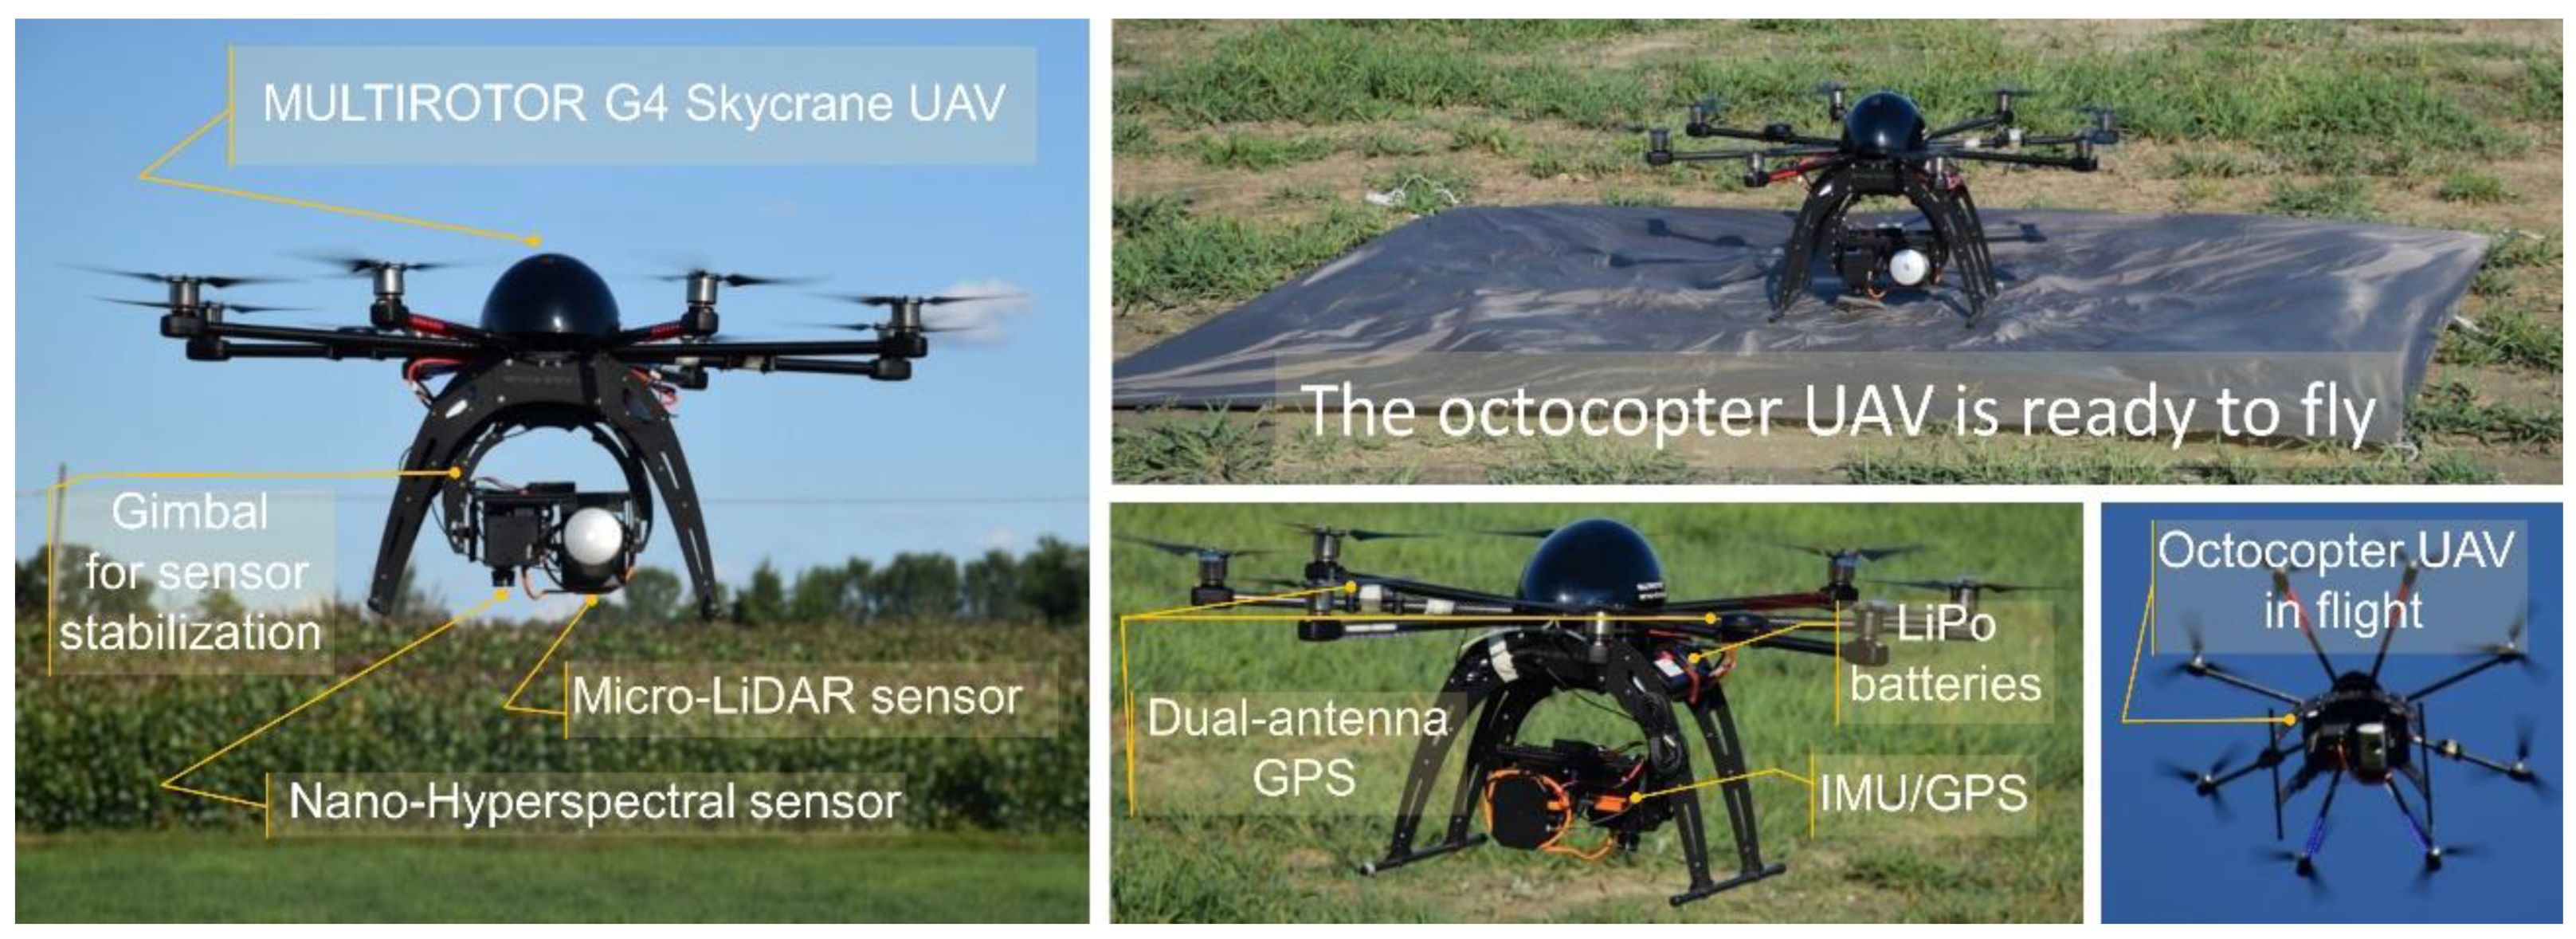
In our study, the UAV LiDAR data were acquired by an unmanned G4 SkycraneV2® octocopter (Multirotor Service-drone, Germany) equipped with micro LiDAR Velodyne HDL-32E microsensor (Velodyne, San Jose, CA, USA) (Figure 2). The hyperspectral sensor was not used in this study. The micro LiDAR sensor is small and lightweight, featuring up to ±2 cm accuracy, 40° vertical field of view and 360° horizontal field of view with 32 laser beams/scan and dual returns up to 70 m (Velodyne Acoustics, Inc., Morgan Hill, CA, USA). An inertial measurement unit is combined with a real time kinematic global positioning system (GPS) to help georeferencing the captured images, with a precision of 1.0 and 2.0 m in the horizontal and vertical directions, respectively.
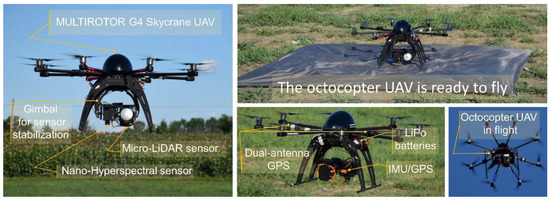
Figure 2.
The unmanned aerial vehicle (UAV) platform used for field phenotyping of Arundo donax on the ground and in flight.
2.3. Data Acquisition
2.3.1. UAV-LiDAR Campaign
The airborne campaigns were conducted on 29 June 2016, with UAV LiDAR scanning at an altitude of 25 m above ground with separate flight plans for each treatment (Figure 1a). Four ground control points were installed for each treatment (Figure 1a), and their positions established with an onboard GPS and an on-ground global navigation satellite system with an accuracy of 3 mm (Leica GS08plus, Leica Geosystems, Switzerland) operating in real-time kinematics.
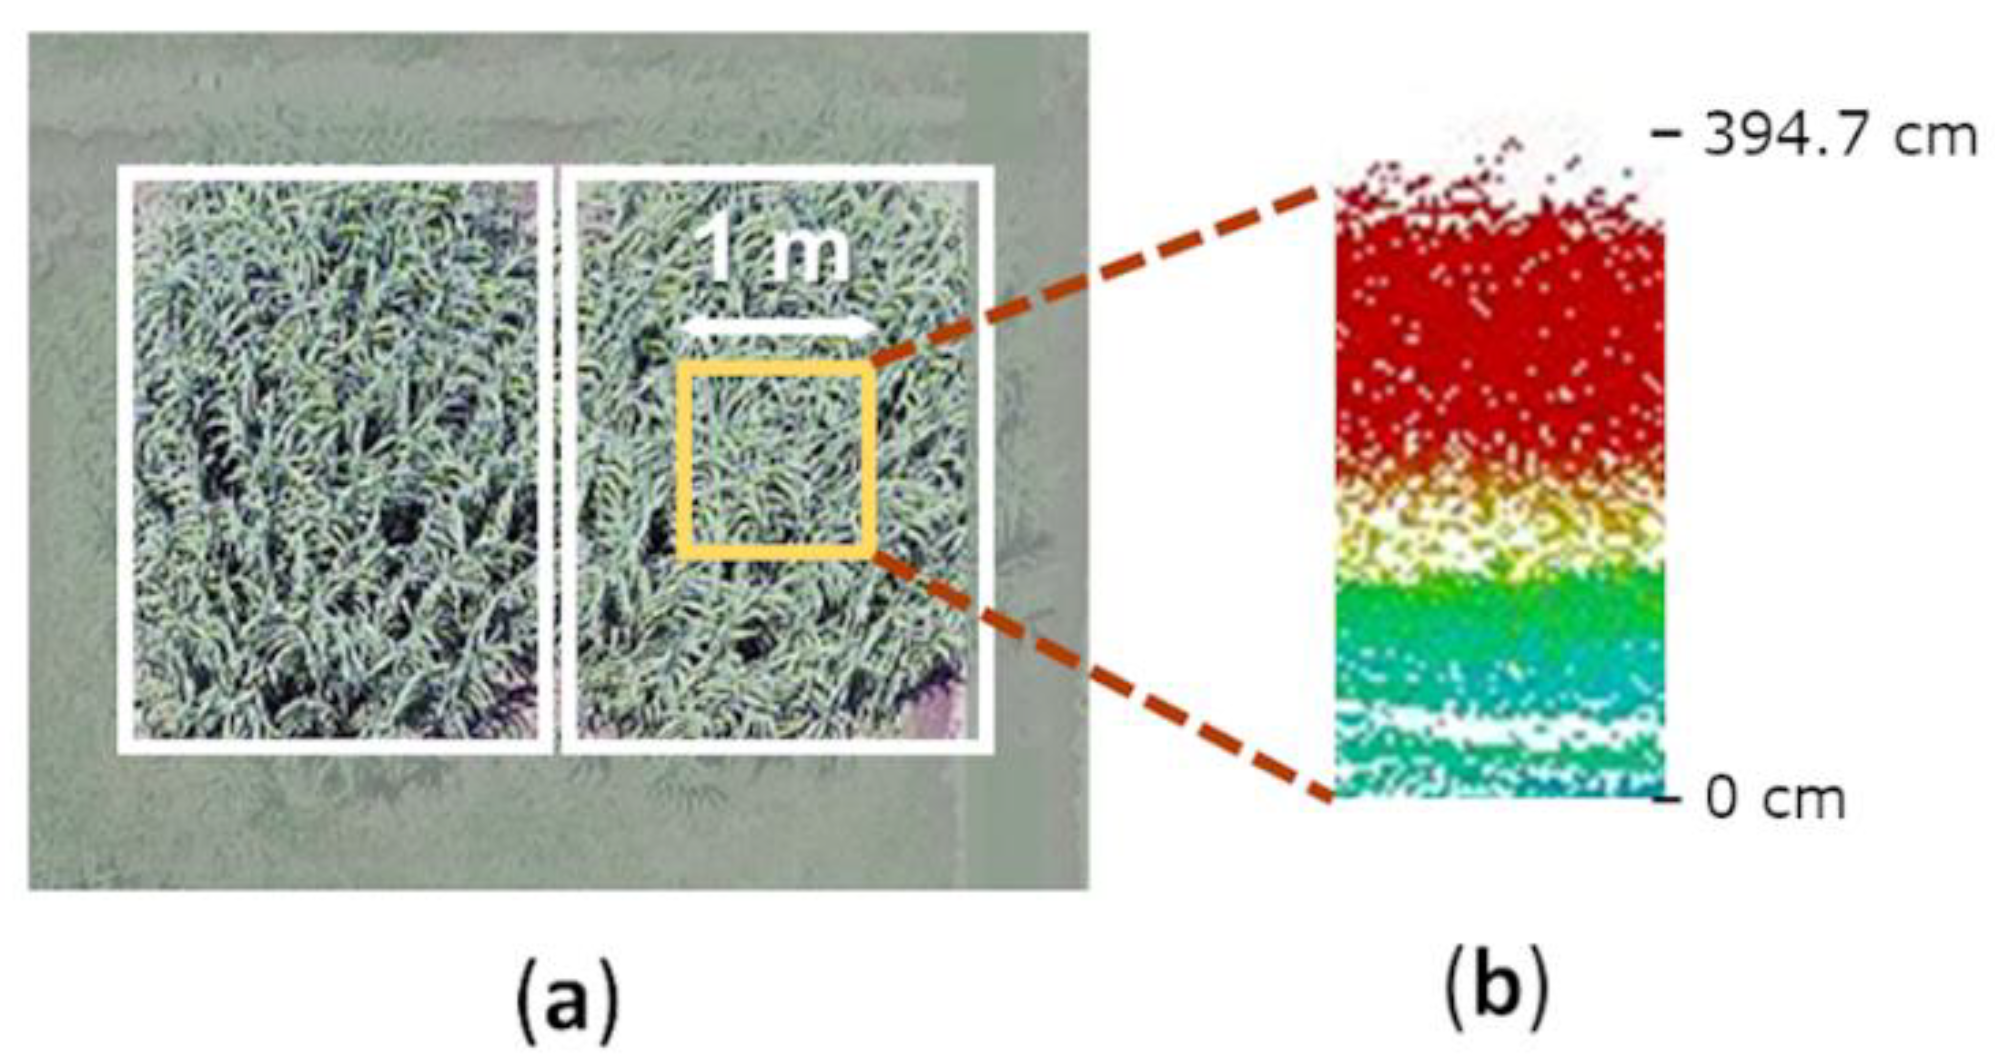
The flight mission was planned using the autopilot Ground Station v.3.2.304 (Multirotor Service-Drone, Germany). The drone was flown autonomously (GPS-waypoint navigation) at a nominal speed of 3 m/s. Experimental plots were scanned for two 9-min flights under stable cloudless and low-wind conditions. Flights were performed at 14:22 local time above the WW and at 15:29 local time above the mDr field. In order to capture each experimental plot in a single flight pass, the flight plan consisted of transects parallel to the plant rows (Figure 1a). A ground station processed the UAV safety manual control and sent telemetry data (position, attitude, and status data) through a radio link at 2.4 GHz to a field laptop. Figure 3 shows a UAV RGB image of A. donax ecotype in the field and 3D LiDAR point clouds.
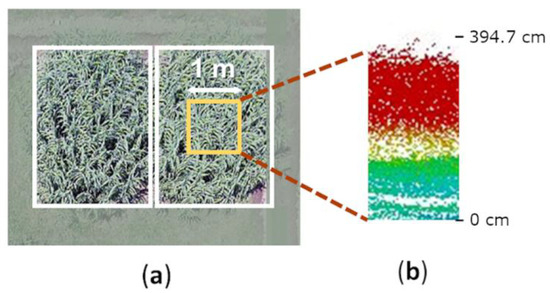
Figure 3.
Aerial drone photograph and three-dimensional (3D) light detection and ranging (LiDAR) point cloud for EcoA under moderate drought stress (mDr) conditions. (a) Aerial image of EcoA, from flying the unmanned aerial vehicle (UAV) (Figure 2) over the mDr experimental plot. Marked in yellow is the 1 m2 area of interest at the center of the plant. (b) 3D LiDAR point cloud color coded by height.
2.3.2. Plant Height and Biomass Ground Truthing
The heights of four random stems (StH [cm]), in the central 1 m2 of each plot, were manually measured to assess the significance of their relationship with the UAV-LiDAR data at the same time the UAV was flying, forming the ground-truth dataset. Heights were measured from the basal node to the top node with a graduated telescopic pole. Nodes are distinct structural components of the stem where the leaves grow out. They are easy to be recognized at a distance by the naked eye as there will be a tiny knob-like on the stem. The lowest node, which is usually just above the ground in A. donax is used as the lower reference point for our stem height measurements. For the most part of the A. donax growth, the position of the uppermost node is hidden because of overlapping leaf bases and used for the stem height measurement to avoid human bias in the selection of the tallest leaf at the top which is much harder to determine.
Finally, at the end of the growing season (November 2016), the time when A. donax is usually harvested as a bioenergy crop, above-ground biomass (total dry mass, AGB, g m−2) was estimated for all replicates. Stems were cut at 5 cm above ground level and weighed to determine fresh weight. Then, sub-samples of mixed tissues (stems, leaves, and flowers) were oven-dried at 75 °C for 72 h to determine the conversion to dry weight.
2.4. Data Processing and CHM
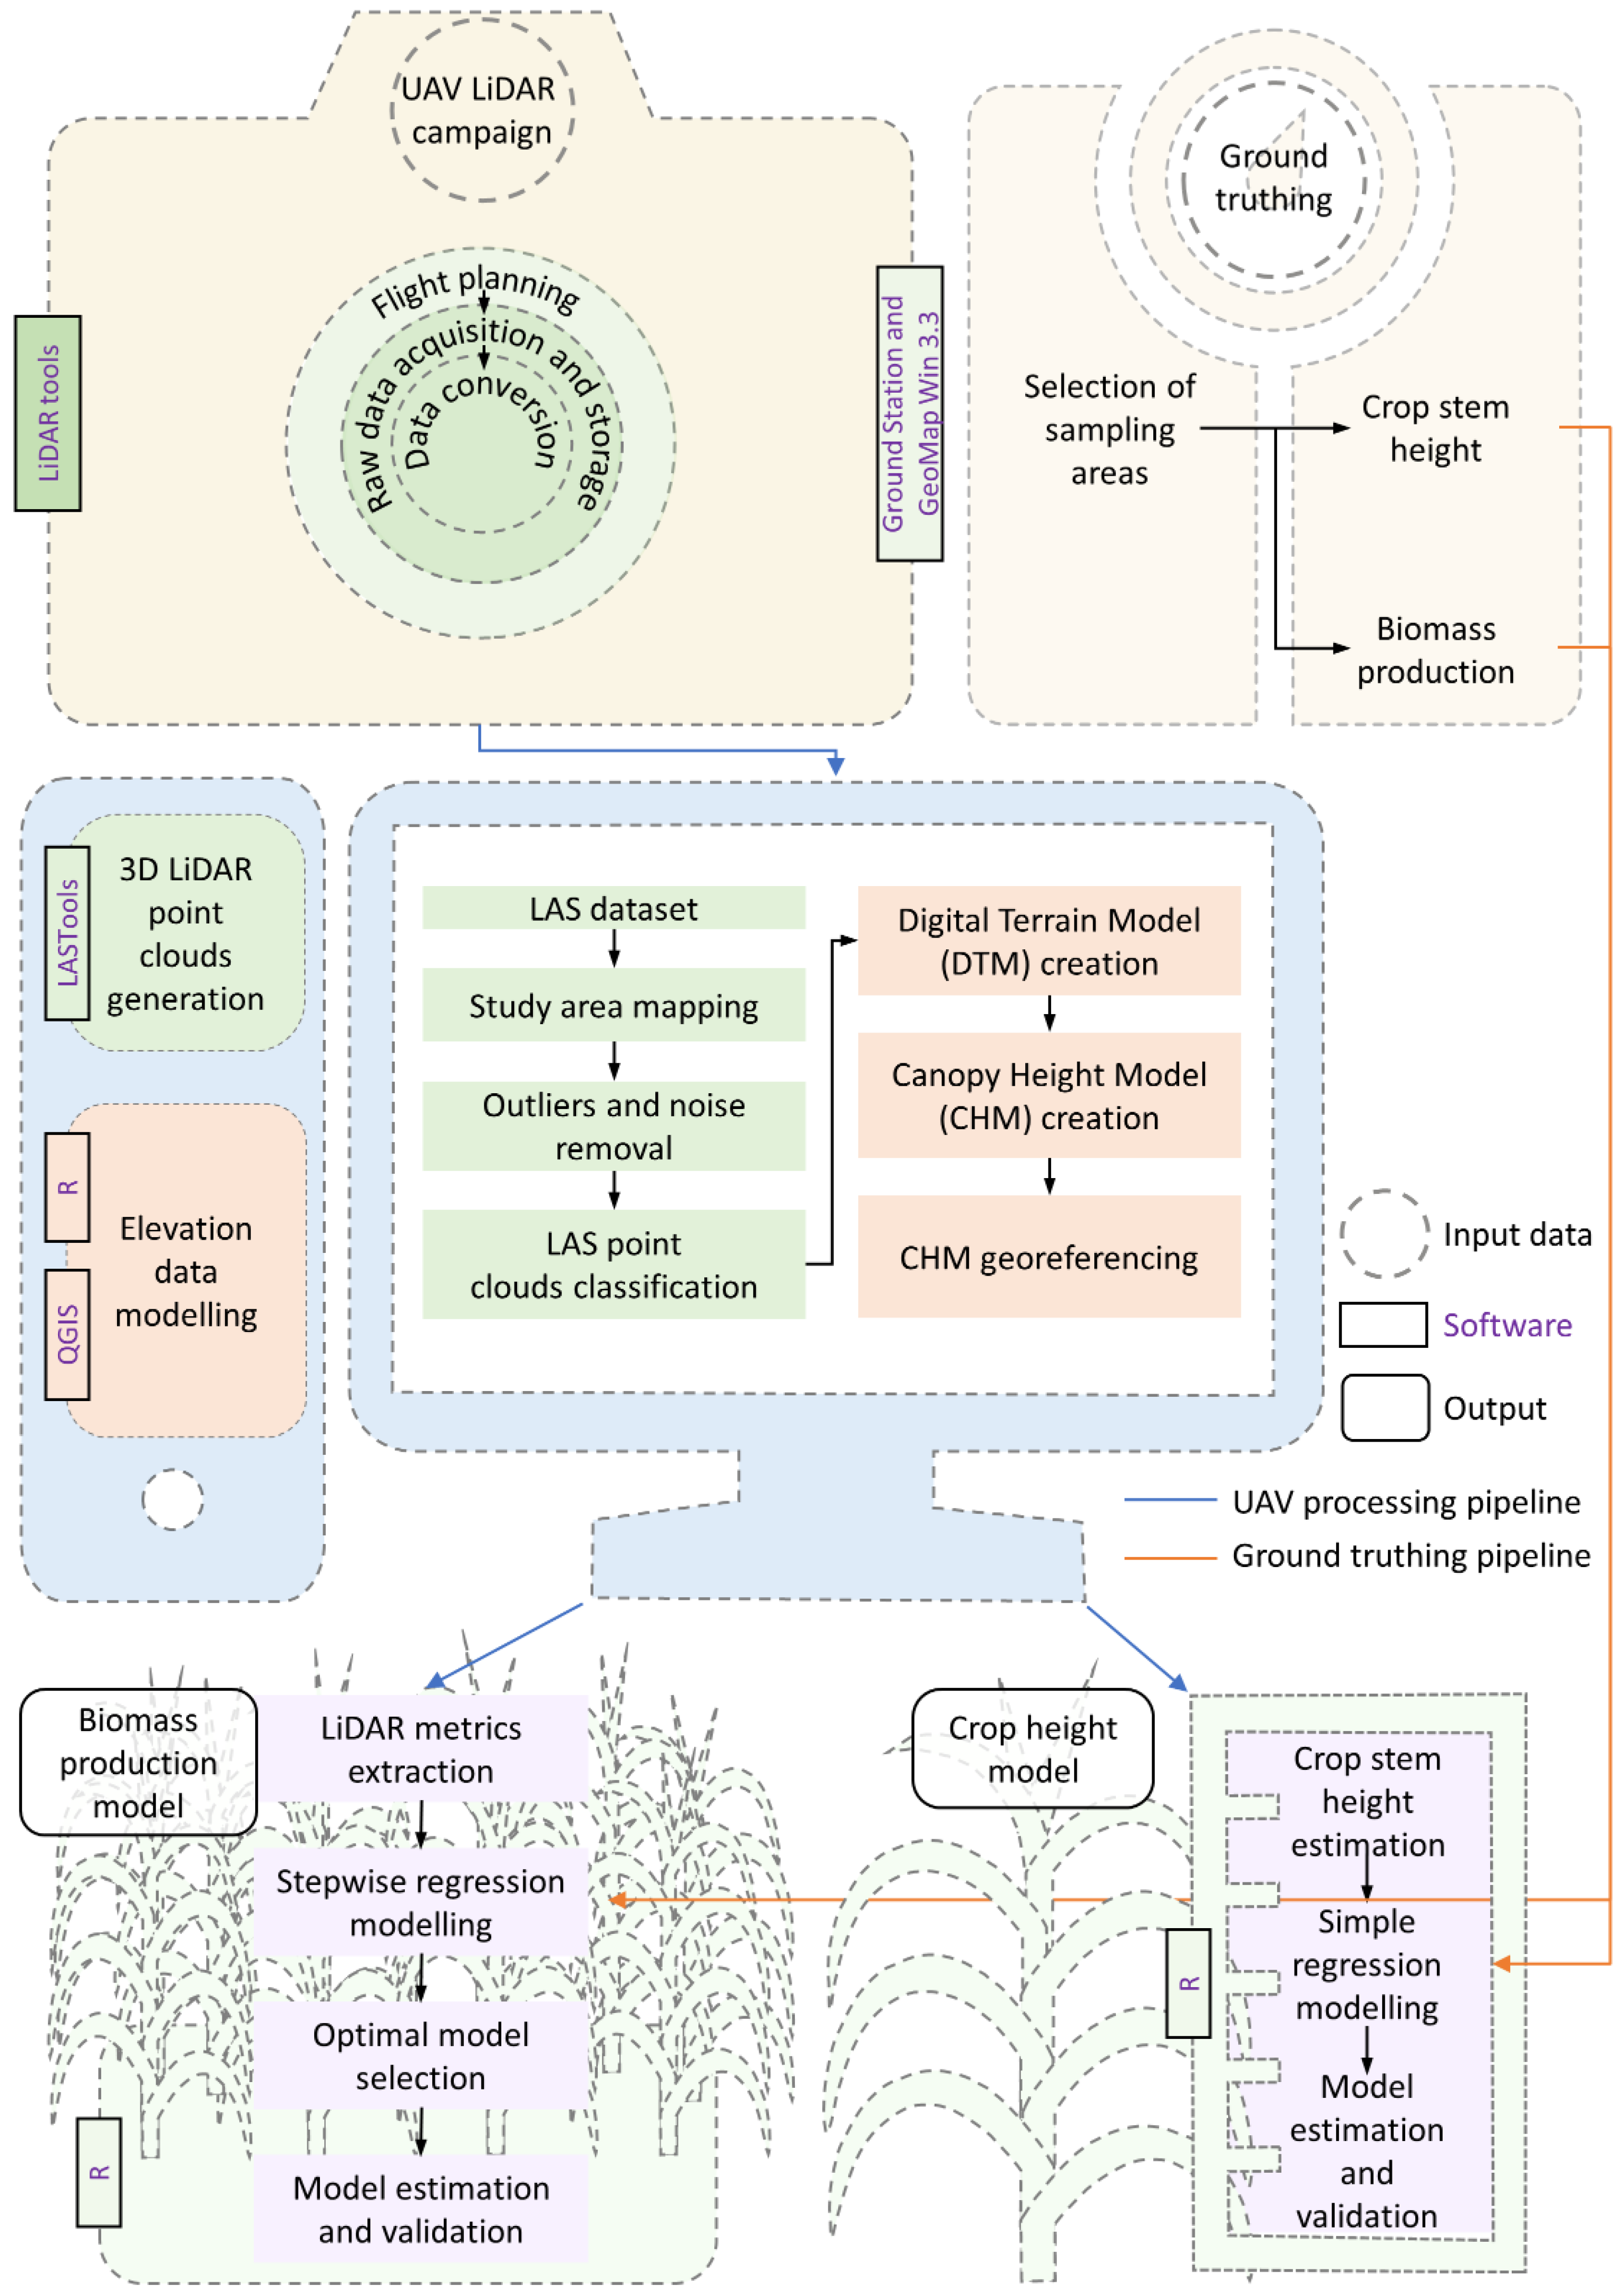
The CHM from the LiDAR data was created according to the workflow in Figure 4. The first step was the conversion of each UAV LiDAR scan from .pcap to .las format files using LidarTools (Hyperspec III, version 3.1, Headwall Photonics Inc., Boston, MA, USA). The second step was to clip the LiDAR point clouds to the study areas using LASclip algorithm in LAStools and then eliminate noise (first and last pulse) and outliers inside these point clouds using the LASnoise algorithm in LAStools [23]. LASground, from LAStools, was then used in the third step, to separate ground returns from non-ground returns. DTMs and DSMs with grid cell size of 20 cm for each field treatment were generated using the “lidR” R package [24]. In the fourth step, DTMs and DSMs were processed in the geographic information system application QGIS (QGIS Development Team, 2018) by normalizing the DSM with the DTM to obtain the CHM (that is the residual distance between the ground and the top of the crop above the ground or the DSM minus the DTM). The CHM was georeferenced by way of ground control points. Finally, an area-based approach [16] was used to generate height and biomass prediction in an area of 1 m2 around the center of each ecotypic replicate as described in detail below.
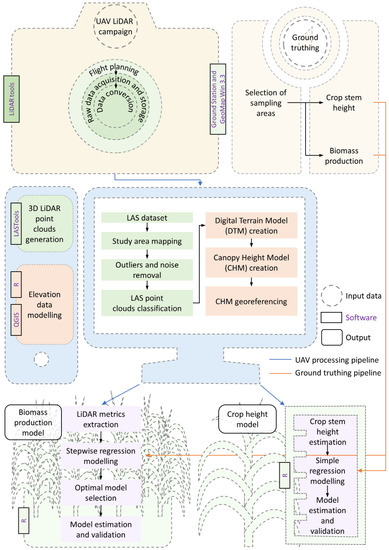
Figure 4.
Workflow of data processing for field phenotyping of Arundo donax.
2.5. CHM Validation and AGB Estimation
LiDAR heights were extracted from a 1 × 1 m region at the center of each replicate (Figure 3a) and averaged for validation against the four randomly measured stems within that central square (Figure 1c). The relationship between LiDAR-estimated and manually measured crop heights was evaluated using a linear regression analysis. The coefficient of determination (R2) was used to define the model’s predictive accuracy (considering an F-test p-value < 0.05 as significant and p-value < 0.001 as highly significant), and the root mean square error (RMSE), as a metric for accuracy. Statistical analyses were conducted using R packages such as the “leaps” and the “metrics”. While the leaps performs an exhaustive search for the best subsets of the variables in x for predicting y in linear regression [25], the metrics implements metrics for regression, time series, binary classification, multiclass classification, and information retrieval problems [26].
For the AGB estimation, eleven LiDAR CHM metrics (defined in Table 1), calculated for 1 m2 area of each plot, were assessed as potential variables for inclusion in the model. Following the area-based approach [16], these metrics were computed for the 1 m2 area of each ecotypic replicate. We used several linear regressions to study the relationship between each CHM metric variable, extracted from LiDAR data, and the manually measured AGB. Initially, LiDAR CHM metrics with Pearson correlation coefficient (R) values larger than 0.4 were selected to estimate AGB, as is usually done to reduce the number of possible AGB estimators and speed up computations (e.g., [27,28,29]). The correlation coefficients of all the LiDAR metrics and the field measured AGB are plotted in Figure S1.

Table 1.
Light detection and ranging (LiDAR) crop height model (CHM) metrics based on the 20 × 20 cm grid cells from the central 1 × 1 m portion of each plot used for estimation of Arundo donax crop biomass.
Two way-ANOVA tests and pairwise comparison with Bonferroni correction (to adjust p-values for multiple comparisons) [30] were performed on the ground data and the LiDAR estimates to determine whether differences between ecotypes and water treatments exist. Linear regressions between AGB and heights were also evaluated for manual measurements and LiDAR estimates.
3. Results
3.1. LiDAR CHM
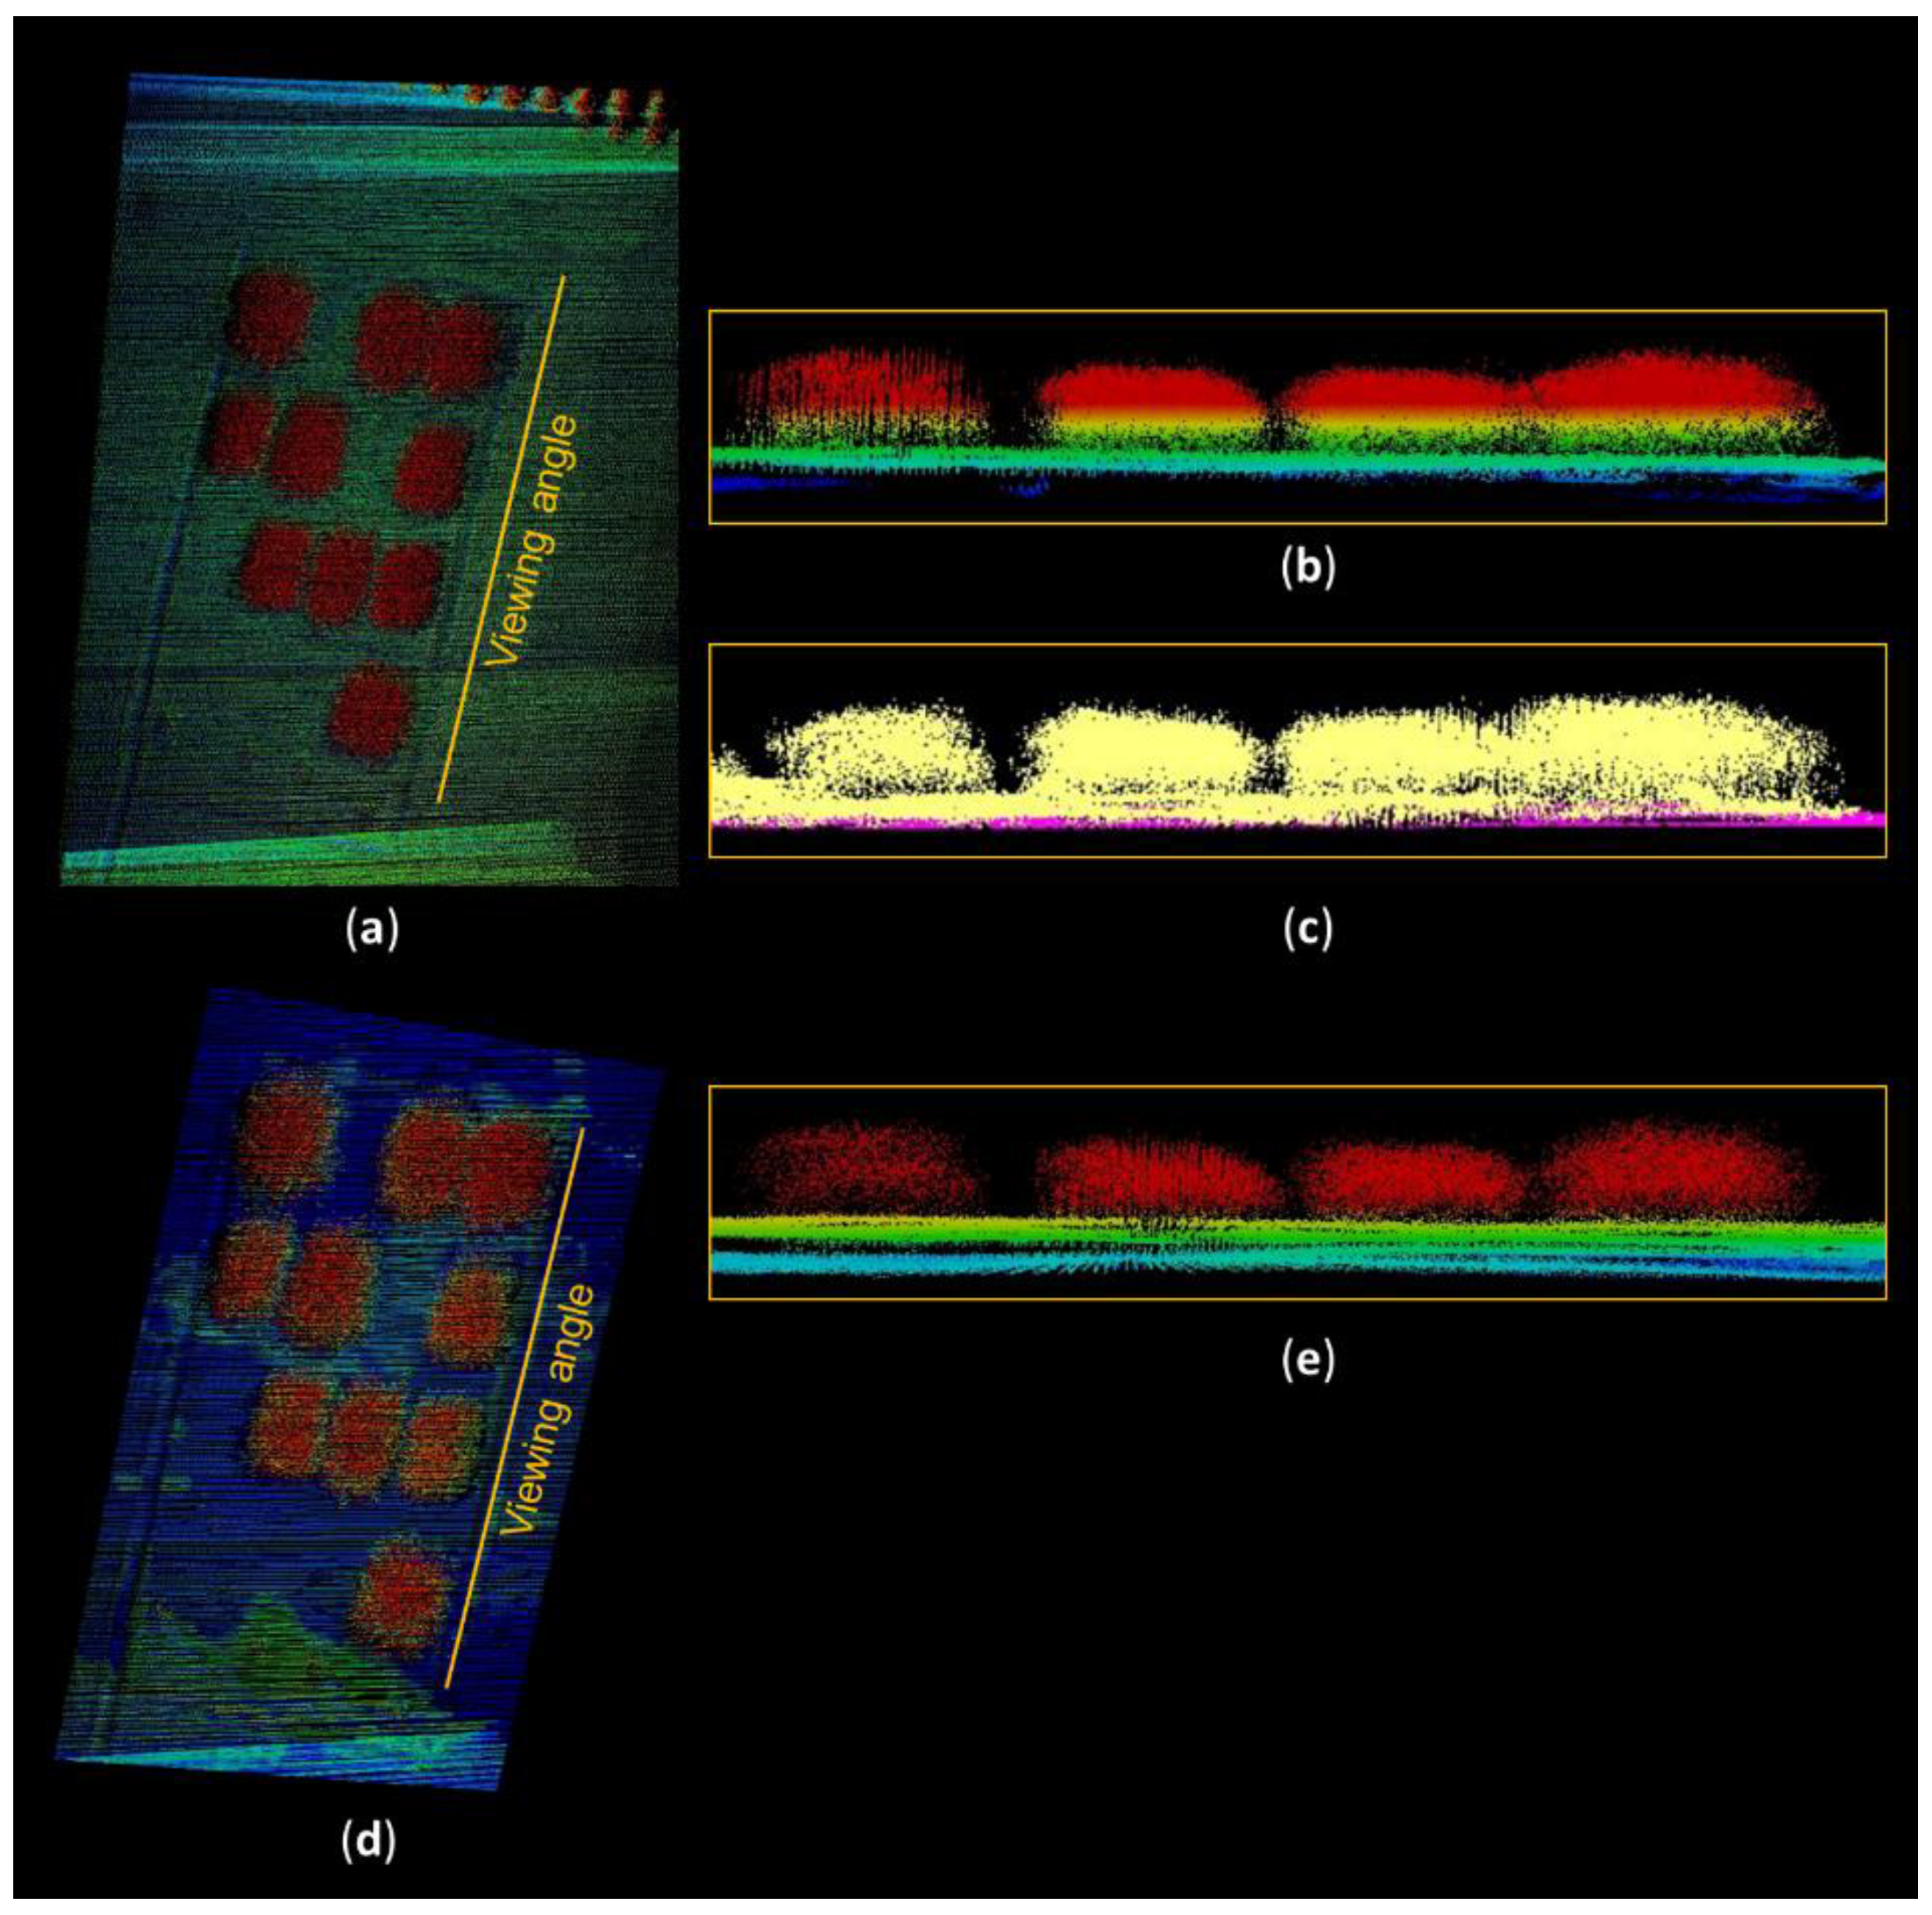
The LiDAR system generated high-density 3D data in discrete point clouds (Figure 5). The point density of the collected data was 30.1 pt m−2 in mDr and 41 pt m−2 in WW, while the point spacing was 18 and 16 cm in mDr and WW, respectively.
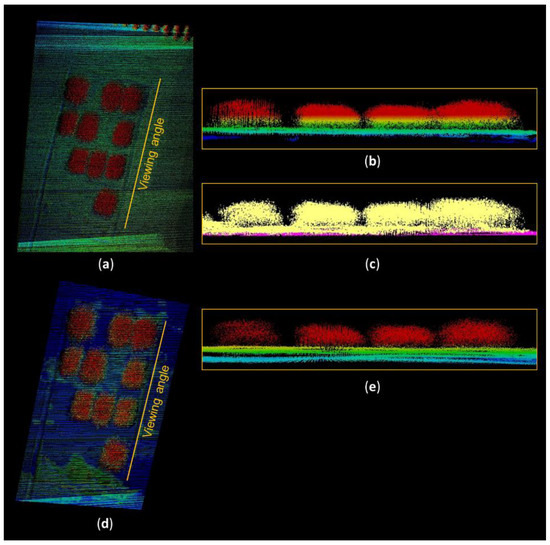
Figure 5.
Rasterized three-dimensional (3D) light detection and ranging (LiDAR) point clouds before and after they were processed according to the workflow outlined in Figure 4. 3D LiDAR point clouds before the removal of outliers from (a) orthographic and (b), frontal view (presentation in the Y-Z plane); (c) visual distinction between the ground surface and plant canopies from the frontal view: the purple indicates ground and yellow indicates plants; (d,e) 3D LiDAR point clouds after the removal of outliers from the orthographic and frontal views, respectively (presentation in the Y-Z plane).
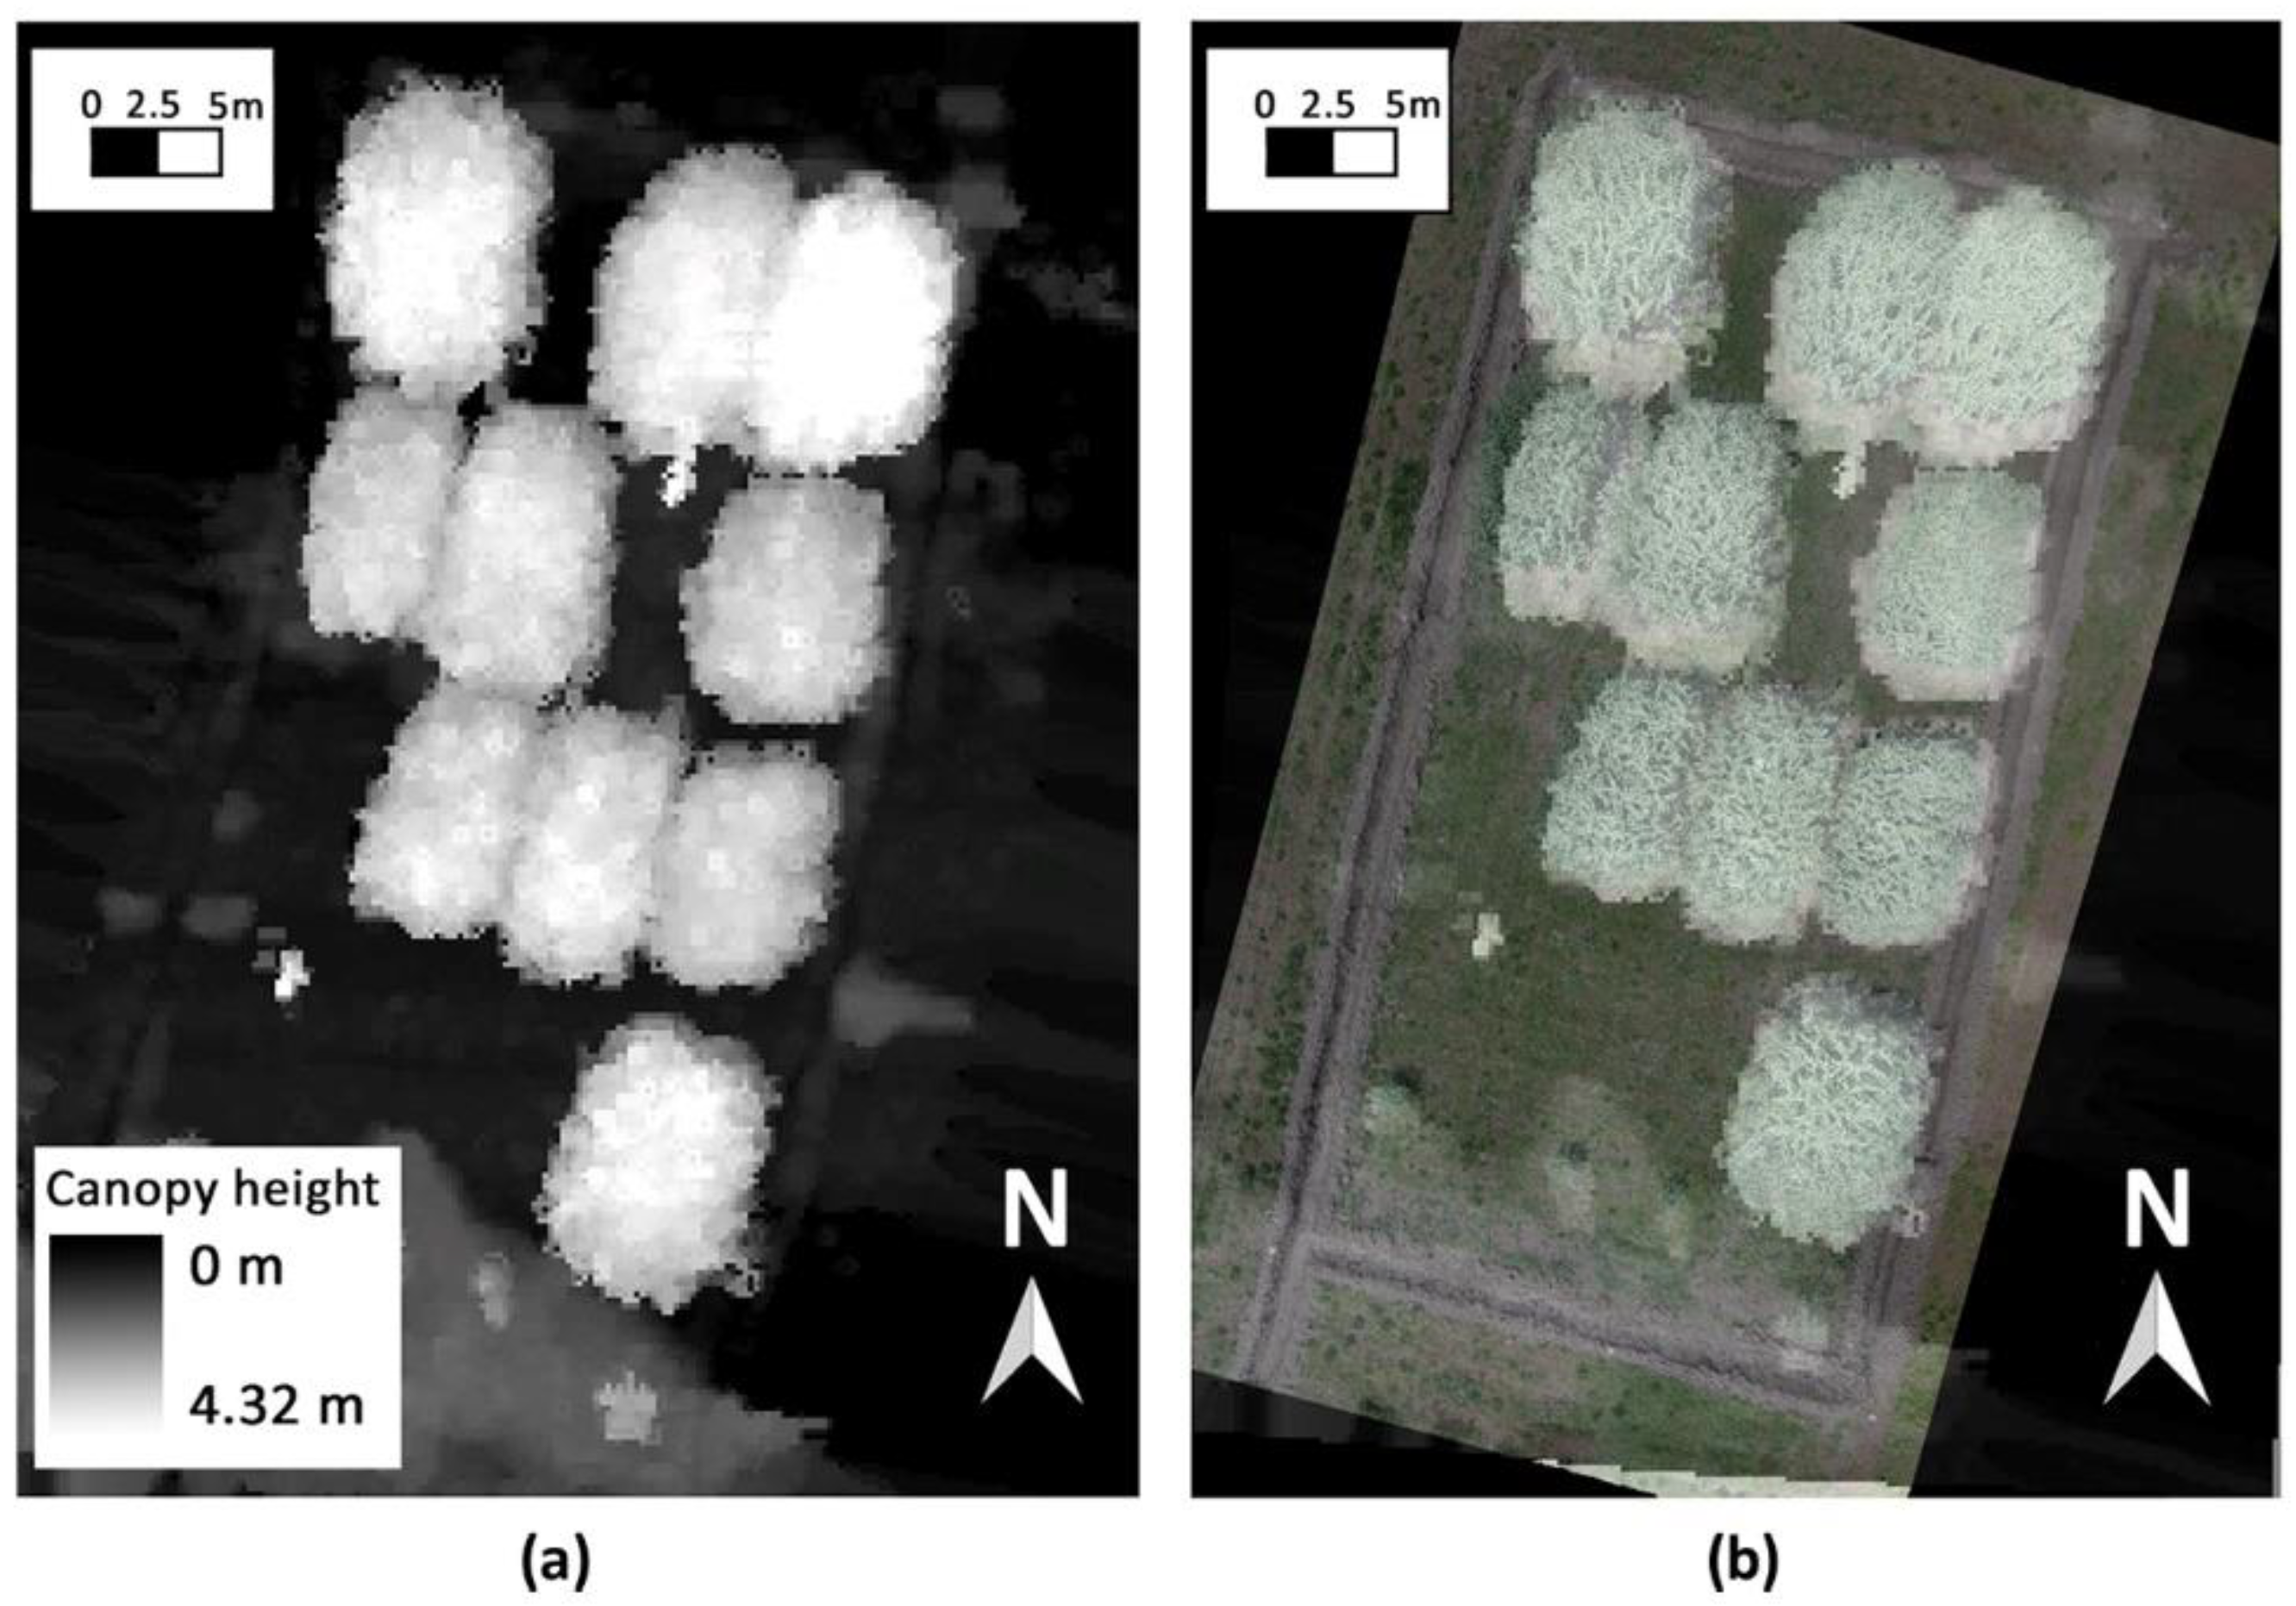
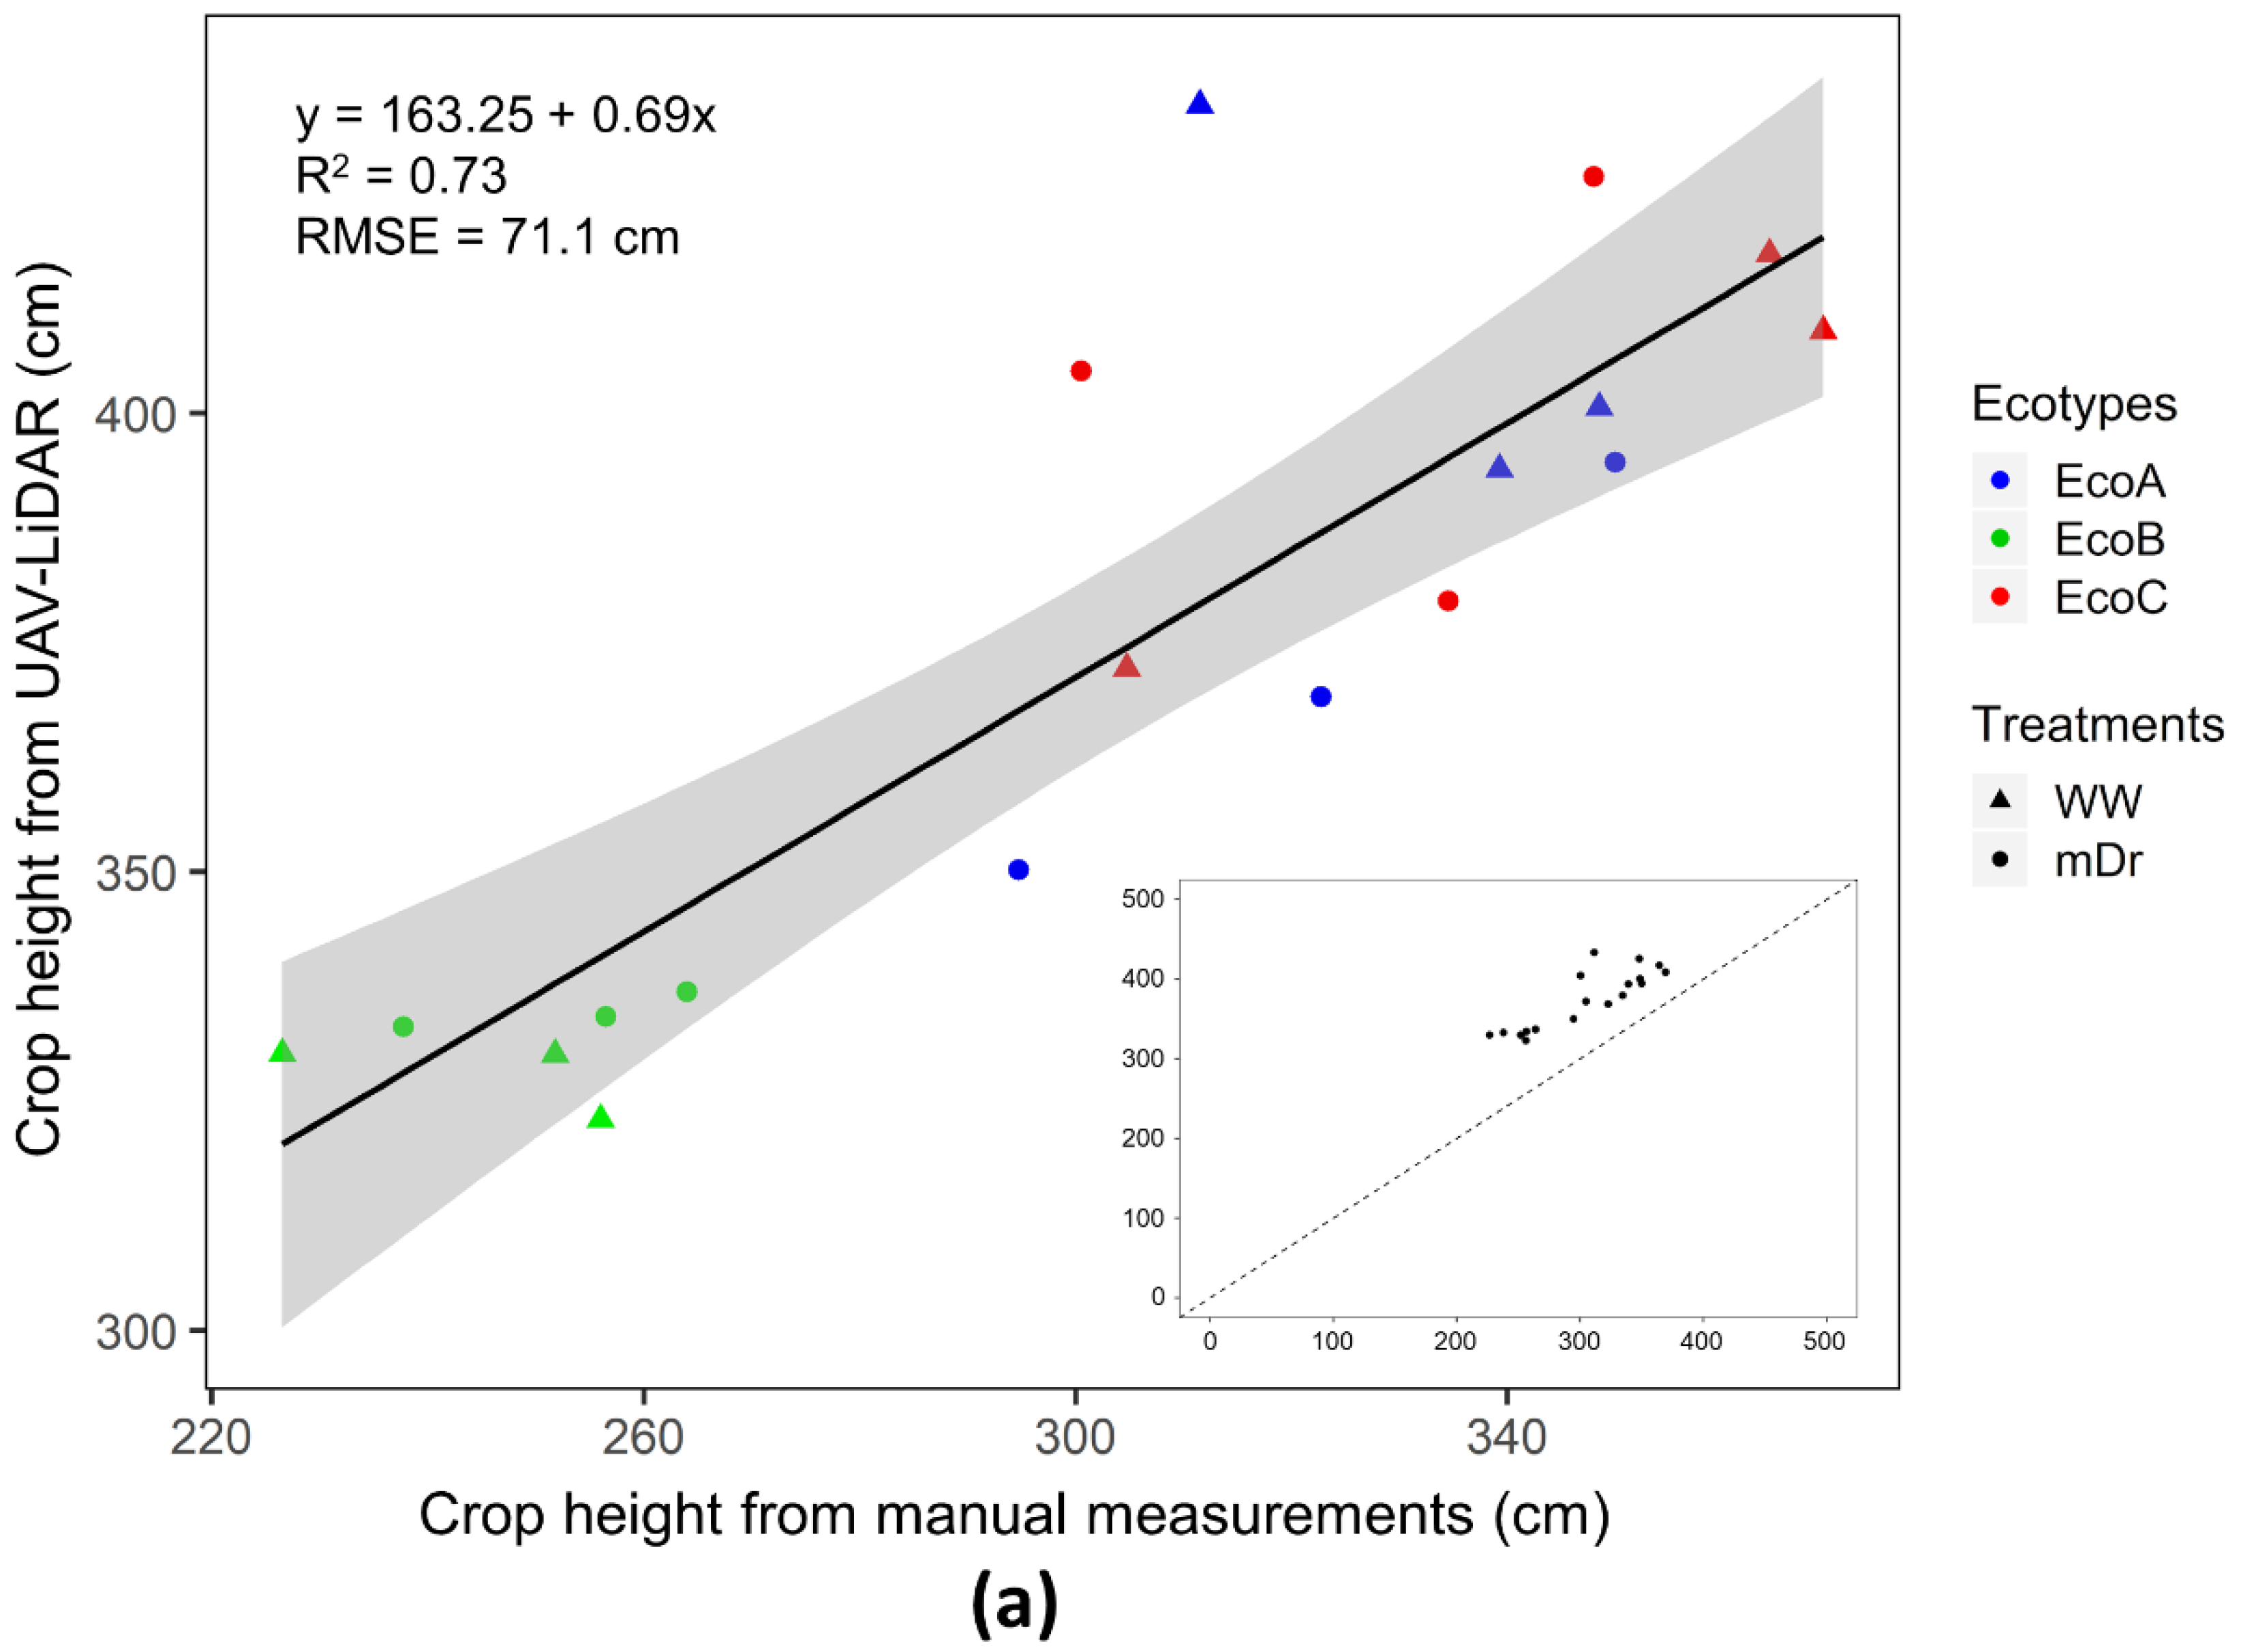
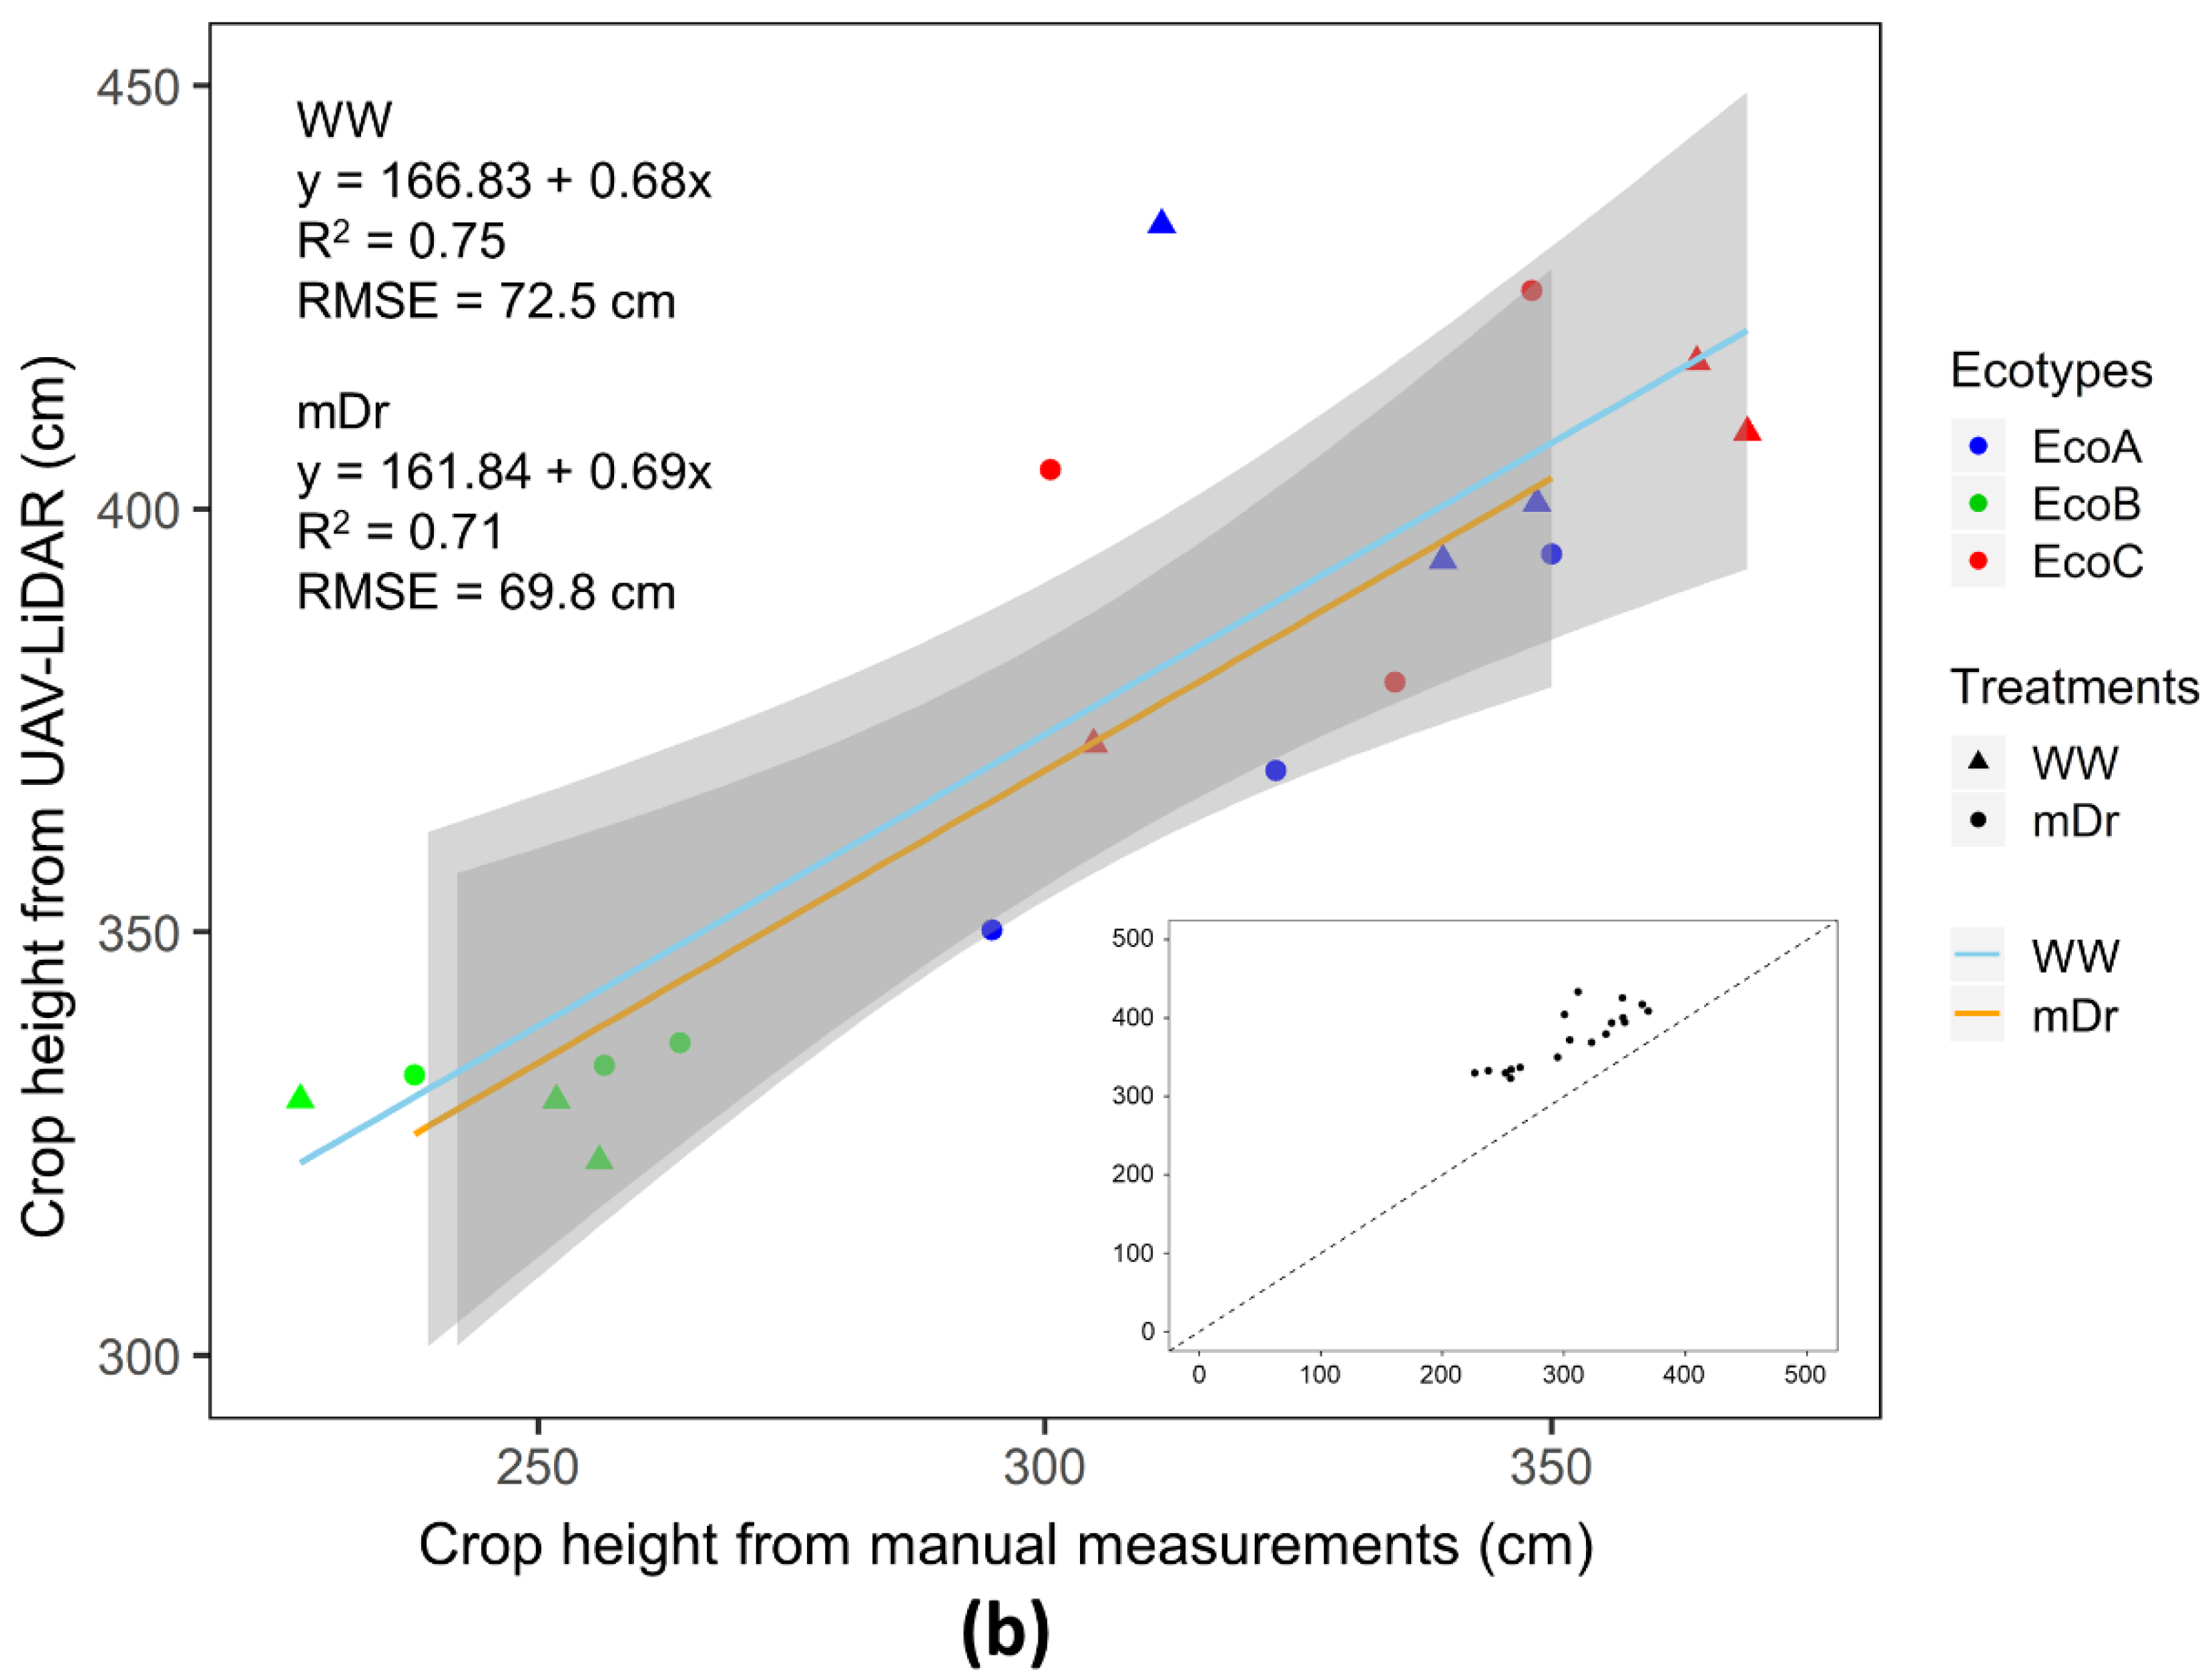
In this study, there was a highly significant positive linear relationship (R2 = 0.73, p-value < 0.001) between the estimated A. donax crop heights (LiDAR Hmean) derived from LiDAR CHM (Figure 6) and the manually measured crop heights (Figure 7a). No significant difference was found between the relationships of the two treatments (Figure 7b) indicating that the relationship between LiDAR estimated crop heights and ground measurement is stable. Although the relationships between Hmean and manual height measurements were significant, the Hmean values were consistently greater. This could be related to the greater number of points identified as stems (12–24; Figure S1) compared with the four stems measured manually. However, difference in heights is more likely to result from different detection of the top of the stem between manual and LiDAR measurements. It can be seen in Figure 3 and Figure 6 that the LiDAR returns are apparently from upper leaves in the canopy, which were not included in manual stem height measurements as mentioned in the methods Section 2.3.2.
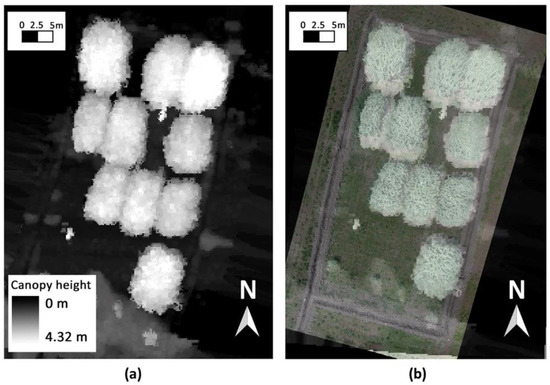
Figure 6.
Established crop height model (CHM). (a) CHM of the experimental plot in the moderate drought stress (mDr) treatment; (b) CHM overlapped with an orthophoto of the mDr treatment.
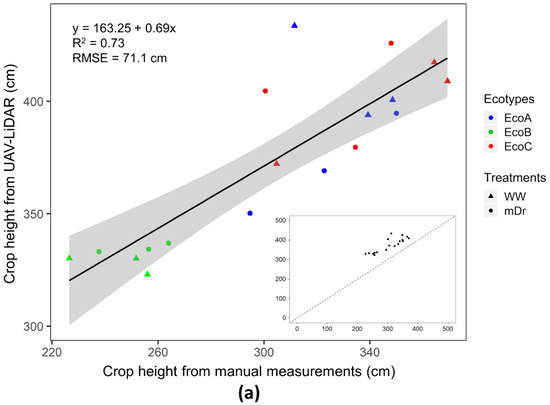
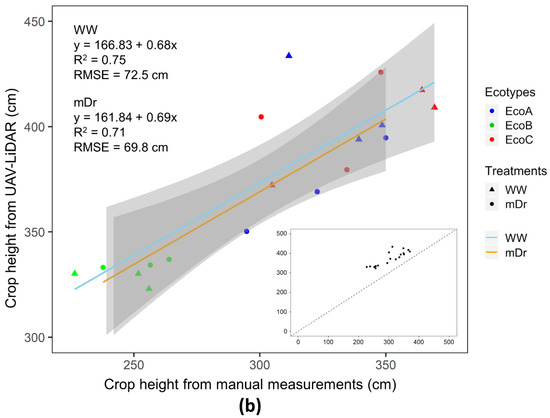
Figure 7.
The relationship between manually measured crop height and the height derived from the light detection and ranging (LiDAR) measurements with fitted lines and grey zone representing confidence intervals (95%). (a) Linear relationship for all crop ecotypes; (b) linear relationship for each of the well-watered (WW) and the natural moderate drought stress (mDr) treatments. The inserts depict all measurements, and the dashed line is the 1:1 line.
3.2. AGB Estimates Derived from 3D LiDAR Point Clouds
None of the individual LiDAR-derived metrics had a highly significant relationship with AGB (Table 2) with the highest R2 being 0.34. However, six of the eleven metrics showed a small but significant (R2 ≥ 0.22, p-value < 0.05) relationship with manually measured AGB (Table 2). Hsum, Hmin, Hrange, Hmajority, and Hvariety did not have a significant relationship (p-value > 0.05) with AGB.

Table 2.
Measuring the ability of light detection and ranging (LiDAR) metrics in estimating above-ground biomass (AGB) using simple linear regression.
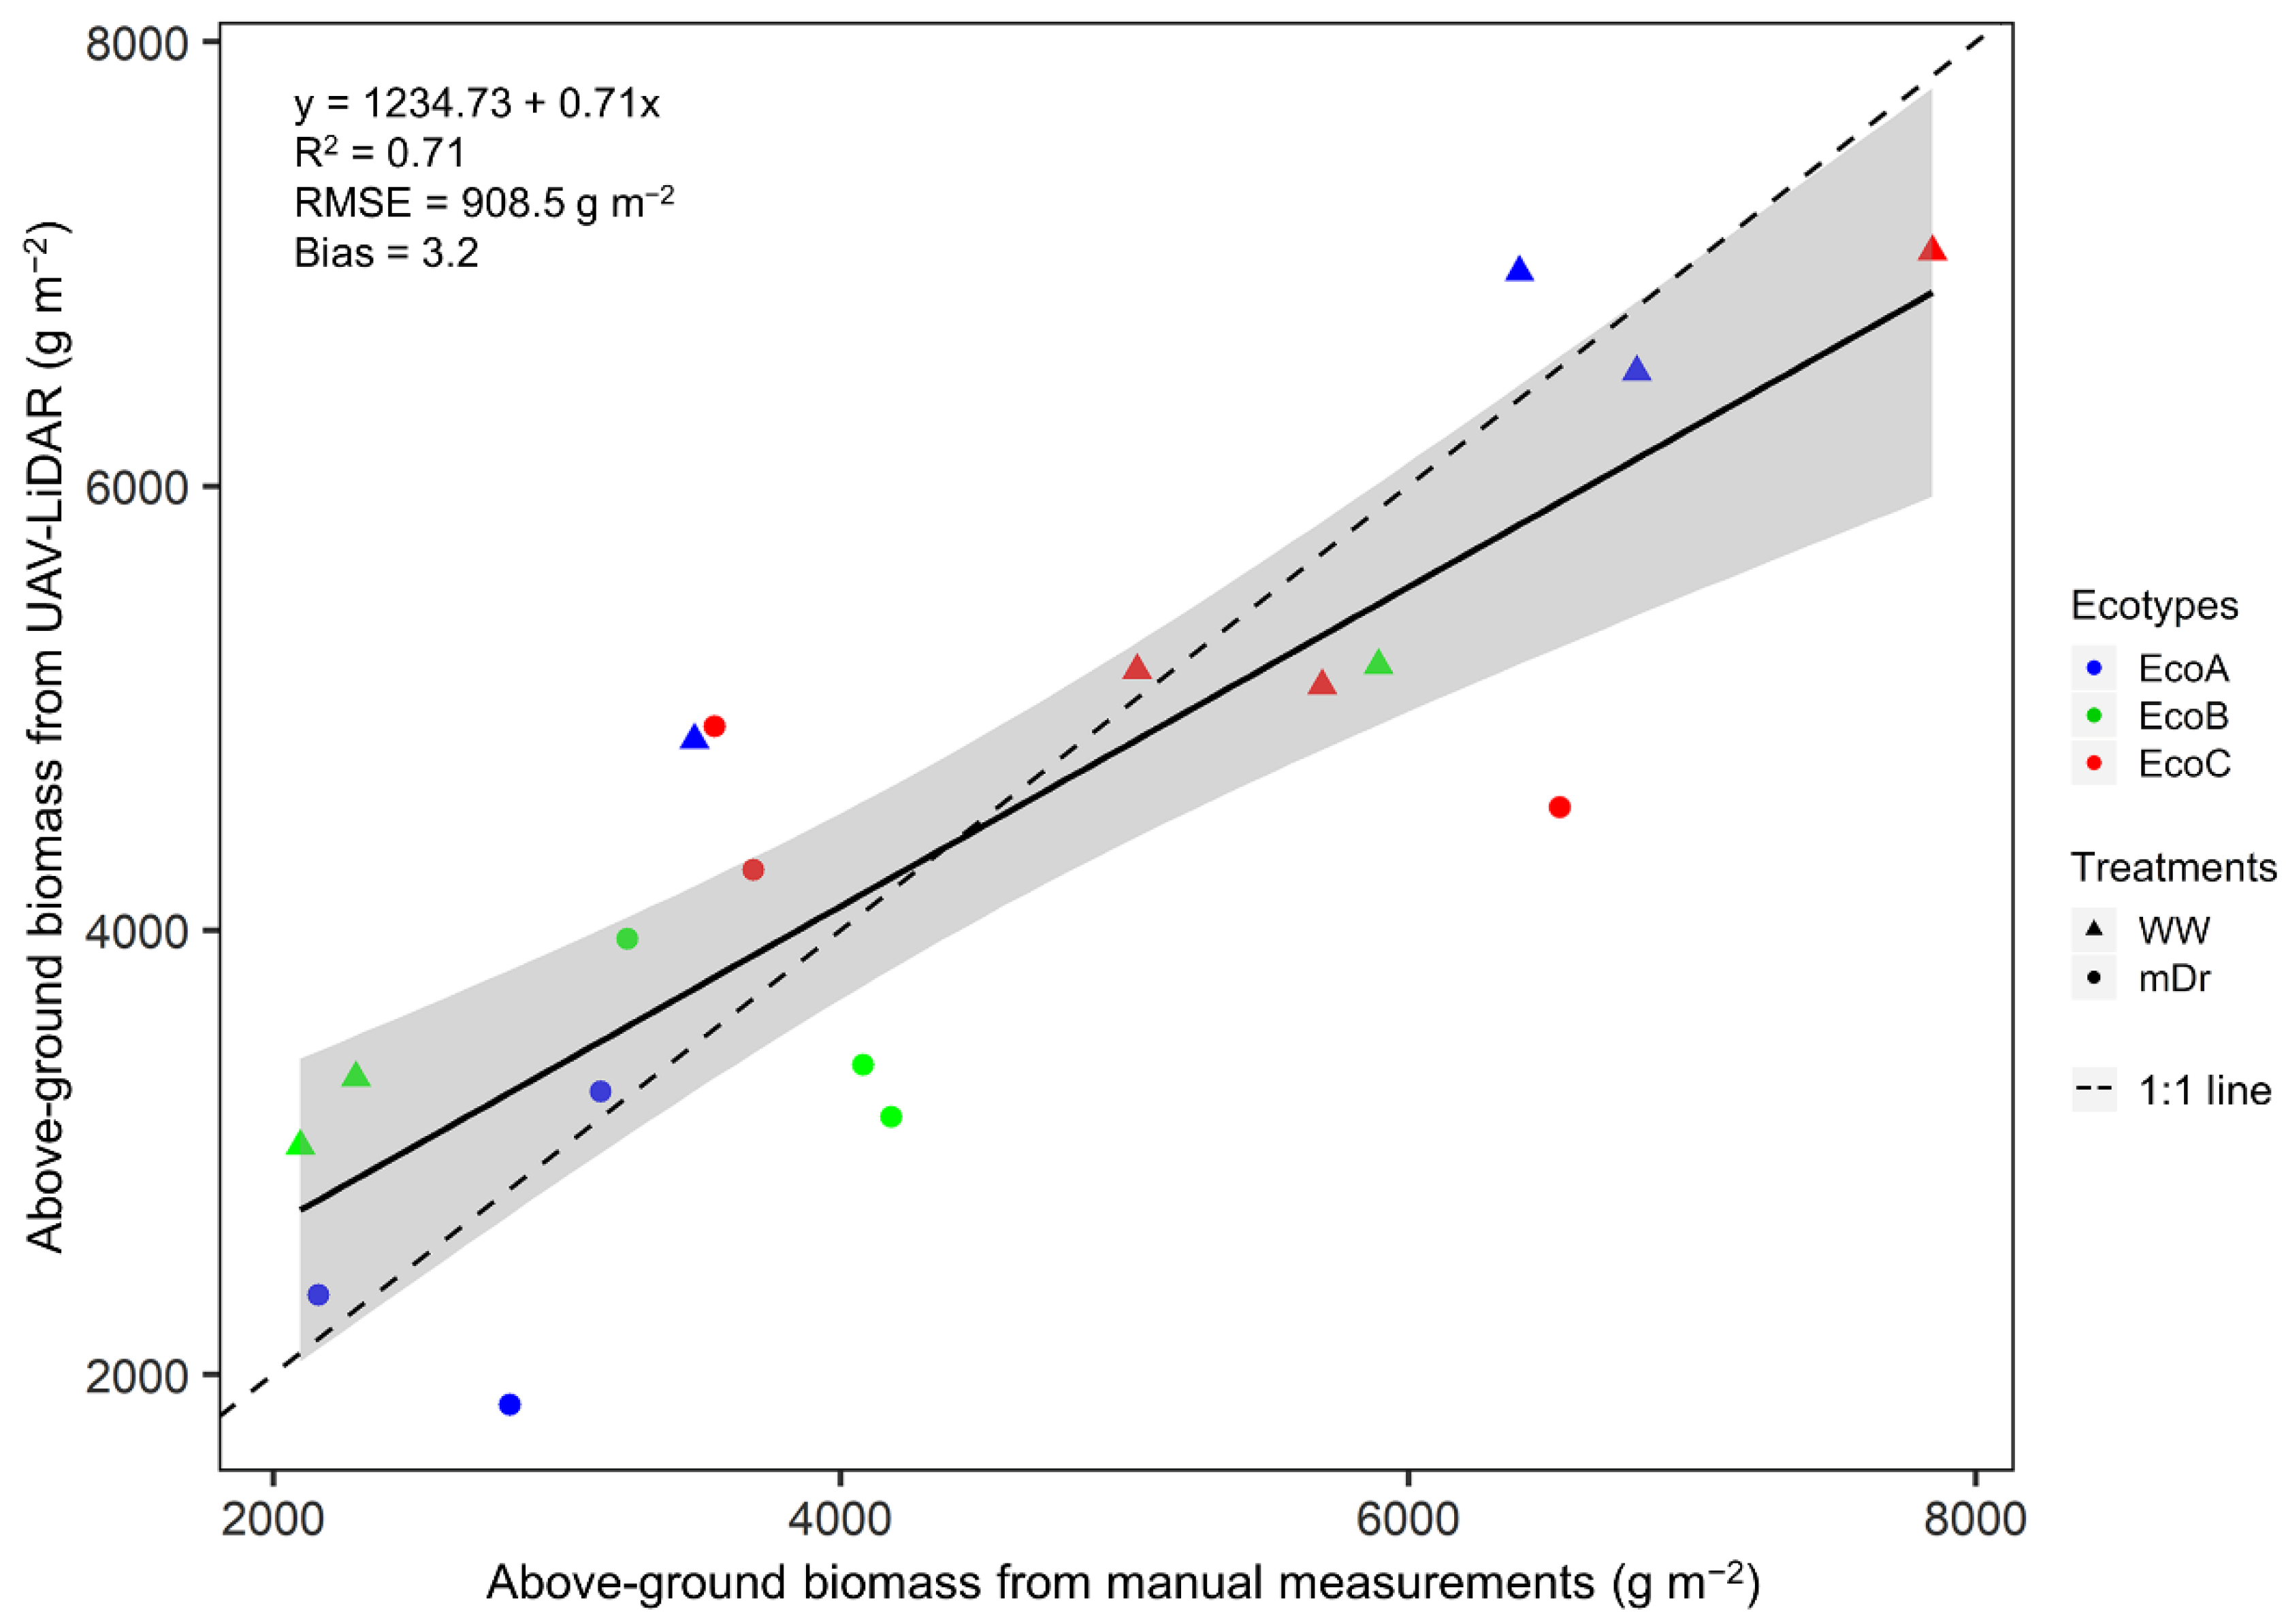
A stepwise multiple linear regression was then used to eliminate multicollinearity issues and to select the optimal regression equation. The LiDAR metrics, Hmax, Hmajority, and Hvariety, gave the best model to predict total biomass with R2 of 0.71 and RMSE of 908.5 g m−2 (Figure 8). The optimal regression equation is defined as:
where AGB is above-ground biomass (g m−2), Hmax is the maximum of stem height values in cm, Hmajority is the stem height with most occurrences in cm, and Hvariety is the count of unique stem height values.
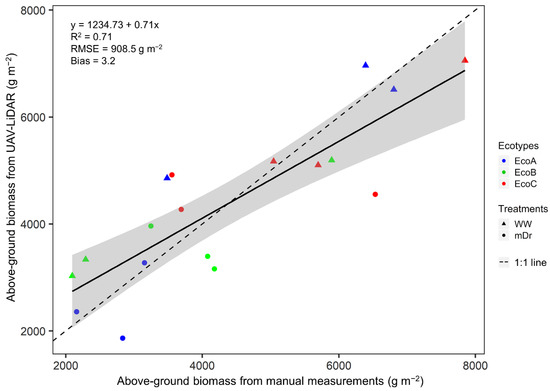
Figure 8.
The relationship between the measured above-ground biomass (AGB), and the predicted AGB using unmanned aerial vehicle (UAV)-derived light detection and ranging (LiDAR) data under two water regimes: well-watered (WW) and natural moderate drought (mDr). Grey zone represents confidence interval (95%) of the fitted line. Dashed line is the 1:1 line.
3.3. Heights and Biomass of Three A. donax Crop Ecotypes under Natural Moderate Drought
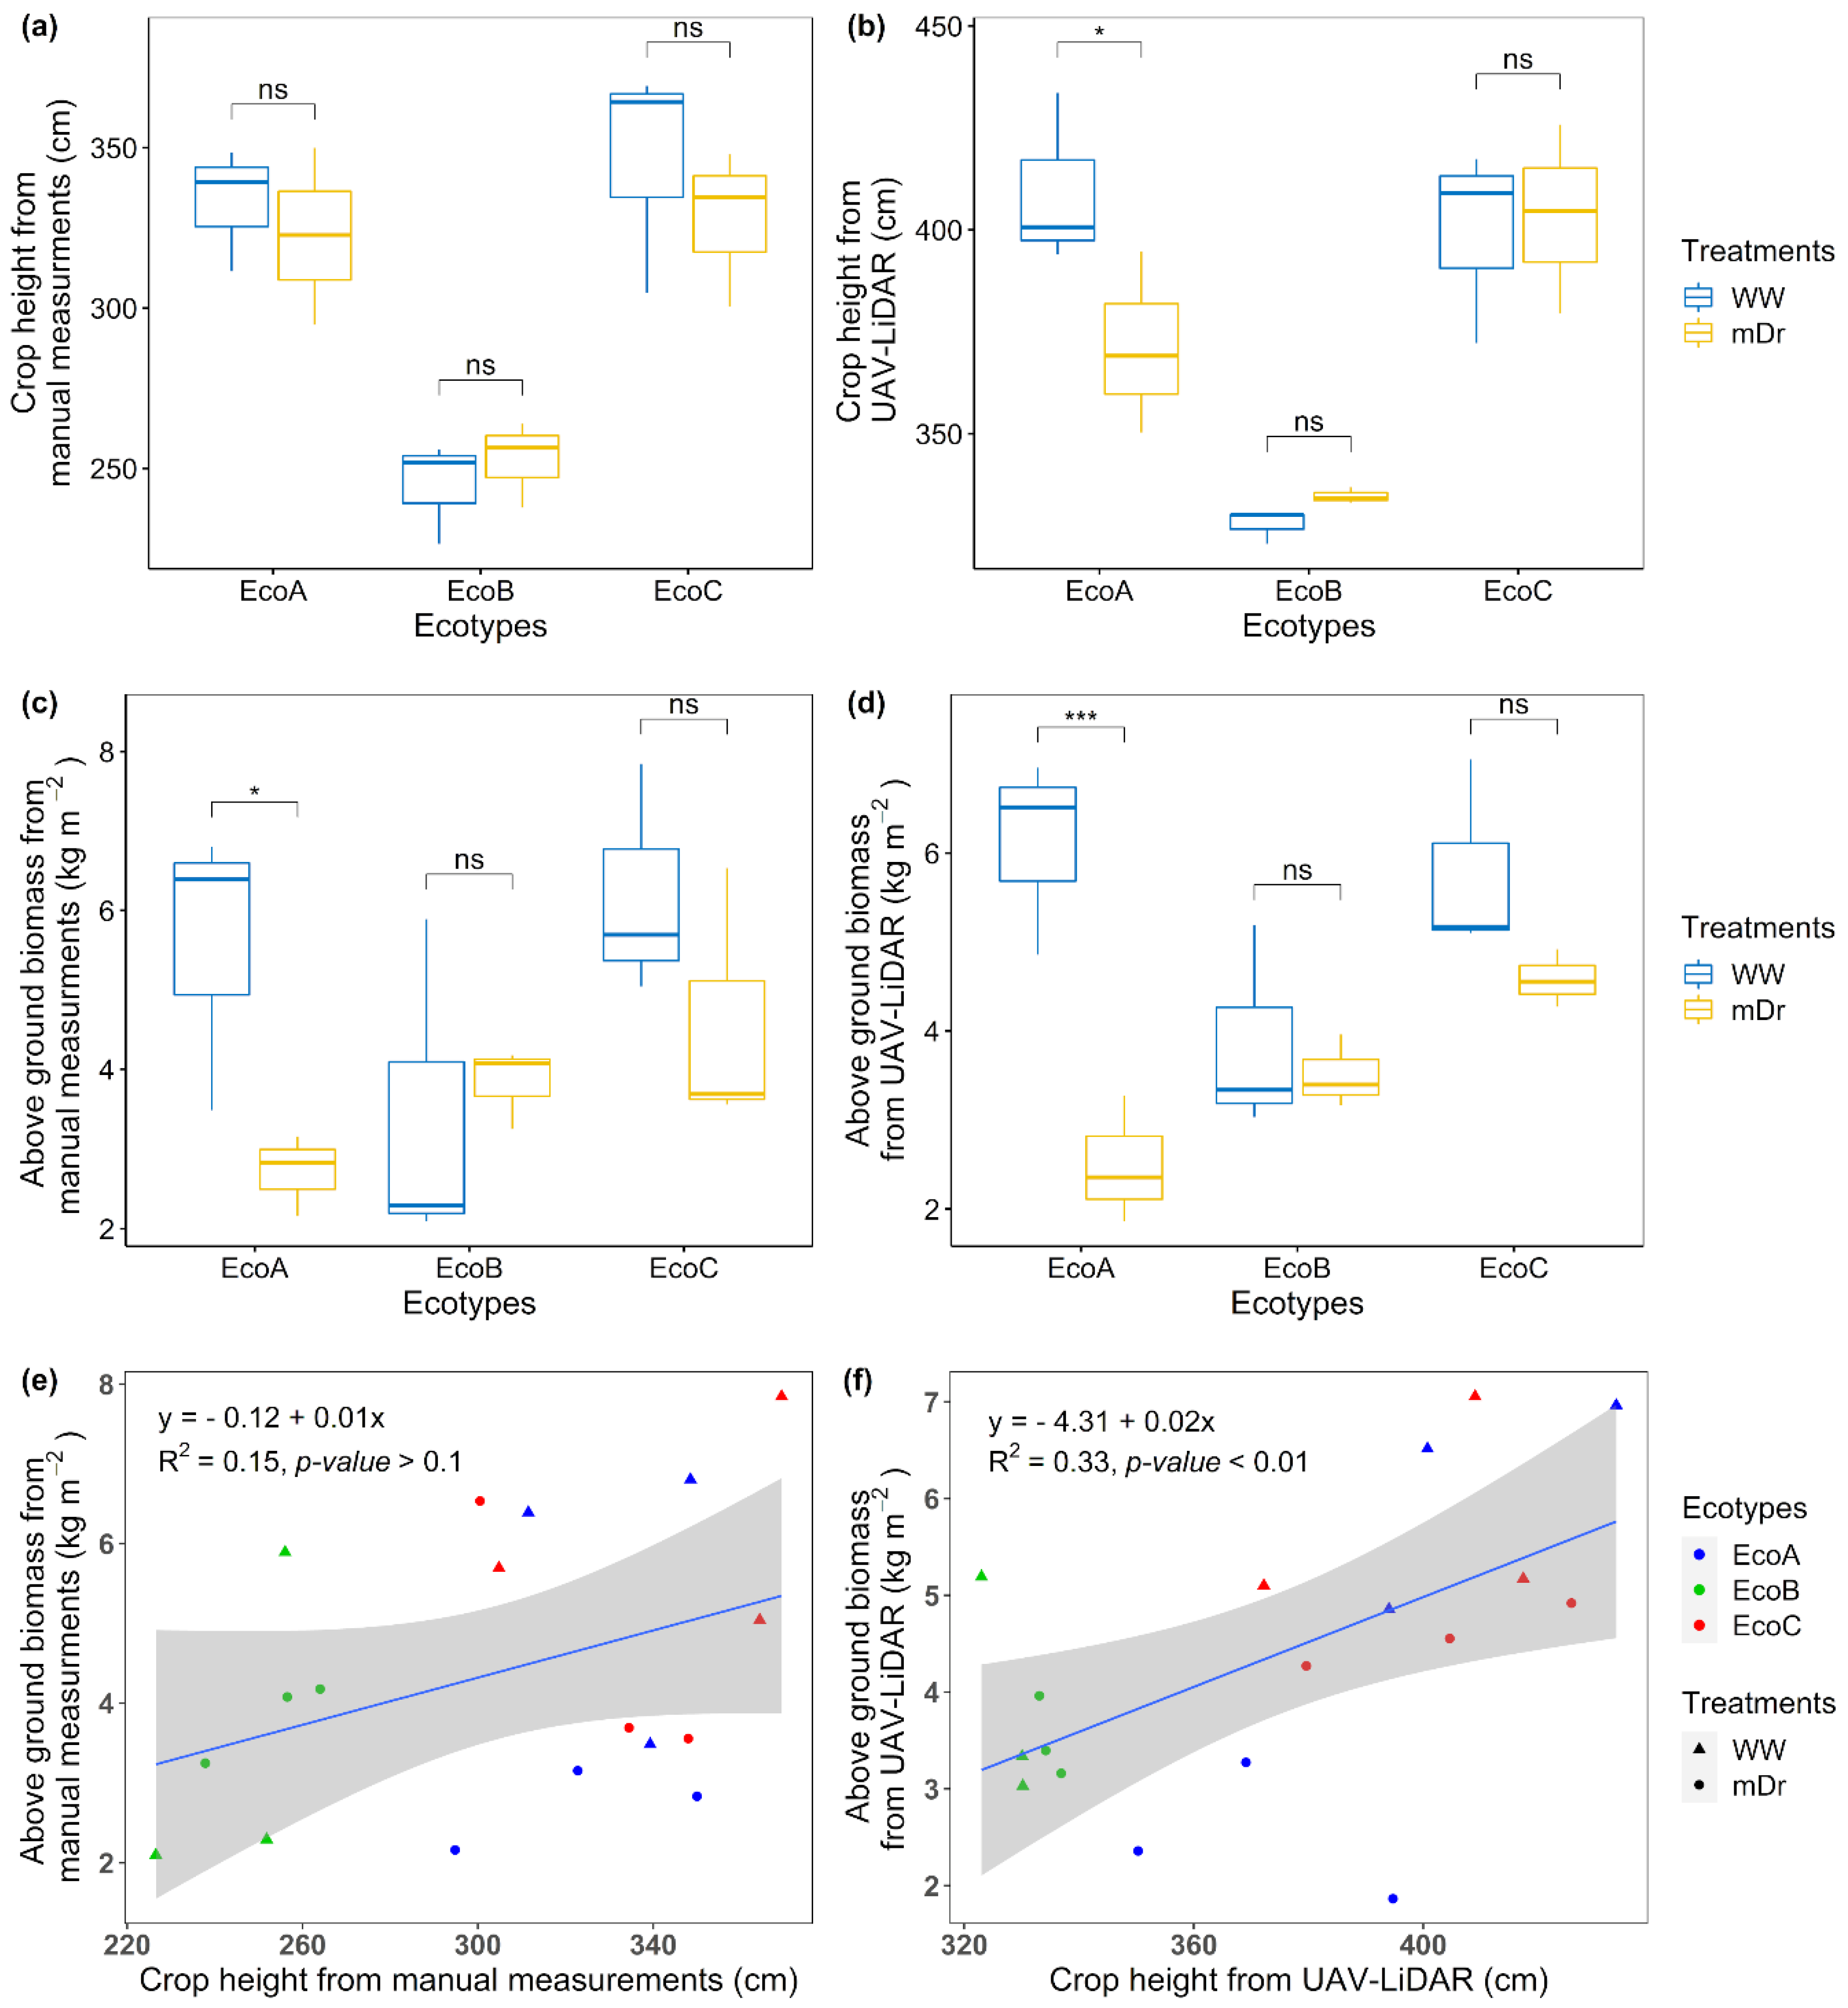
The crop height manual measurement in WW treatment ranged from 226.5 cm for EcoB to 369.3 cm in EcoA with a mean of 307.5 cm, while the mDr treatment varied from 237.8 cm in EcoB to 350 cm in EcoA with a mean of 298.2 cm (Figure 9a,b). ANOVA test showed that the differences between the ecotypes were significant, F(2,12) = 24.47, p-value < 0.001. No differences were observed across treatments, with F(1,12) = 0.38, p-value = 0.54; the interaction of ecotype with water treatment was also not significant, F(2,12) = 0.48, p-value = 0.63. Doing a pairwise comparison we found that EcoB is significantly shorter than the other two ecotypes, p-value < 0.001 (Figure 9a). For the LiDAR estimated crop height, we also found similar results, but in addition, doing the pairwise comparisons we found a significant effect of drought treatment on the height of EcoA (p-value < 0.05).
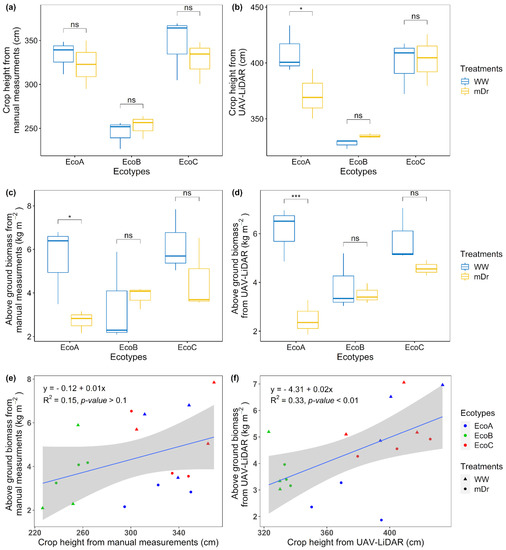
Figure 9.
Crop height and above-ground biomass (AGB) of Arundo donax as estimated form manual ground measurements and light detection and ranging (LiDAR) under two water regimes: well-watered (WW) and natural moderate drought (mDr). (a) Crop height from manual measurements for EcoA, EcoB, and EcoC. (b) Crop height estimated from LiDAR point cloud for EcoA, EcoB, and EcoC. (c) AGB estimated from manual measurements for EcoA, EcoB, and EcoC. (d) AGB estimated from LiDAR point cloud for EcoA, EcoB, and EcoC. (e) Relationship between manually measured crop heights and AGB. (f) Relationship between LiDAR estimated crop heights and AGB. Bars represent mean ± standard deviation (n = 3). * p-value ≤ 0.05, *** p-value ≤ 0.001 in analysis of variance (ANOVA). Grey zones represent confidence interval (95%) of the fitted lines.
The AGB, obtained from the harvesting of stems in each treatment, ranged from a minimum of 2096.3 g m−2 (EcoB in WW) to a maximum of 7845.9 g m−2 (EcoC in WW) with an average of 4837.6 g m−2. ANOVA tests showed mainly no significance between ecotypes, water availability treatments and their interaction. We did find, however, a significant difference in EcoA AGB between the treatments p-value < 0.05 (Figure 9c). Finally, with regards to LiDAR estimated biomass, we found significant effect of ecotype, drought treatment, and their interaction; F(2,12) = 4.43, p-value<0.05, F(1,12) = 17.28, p-value = 0.001, F(2,12) = 5.61, p-value < 0.05, respectively (Figure 9d). EcoA was again much more productive in the WW plot. Ecotypes situated in WW were on average significantly more productive than ecotypes in mDr. EcoB was found to be less productive than the other two ecotypes; however, because of the interaction between ecotype and treatment, EcoB was not showing any sign of stress in mDr, while EcoC did show some insignificant stress effect (Figure 9d).
4. Discussion
To date, LiDAR-derived metrics have been used to predict attributes such as AGB in forests and crops [7,14,16,31,32,33,34,35]. Given the lack of fast and non-destructive alternatives, the capacity to estimate AGB using UAV-derived LiDAR metrics is a critical outcome for dense bioenergy crops such as A. donax. Whilst physical sampling is the most accurate method for estimation of AGB, it is invasive, destructive, costly, and can only be used to study the time course of AGB development in large plots with extensive sampling. The UAV-mounted LiDAR sensor was developed for large field experiments and breeding trials and its deployment has clear advantages over current practice [2]. It is easily transported to any required location overcoming a major limitation of fixed phenotyping platforms. It is significantly more flexible than using airplanes where experiments are constrained by location, cloudiness, and expense [4,36]. This study has demonstrated for the first time the practicality of this approach for the bioenergy crop, A. donax.
4.1. Crop Height Estimation
Crop heights derived from the LiDAR measurements in A. donax had an R2 of 0.73 with manual height measurements (Figure 7). This result is similar to R2 for other crop height measurements estimated from LiDAR, of sugar beet (R2 = 0.70), wheat (R2 = 0.78), potato (R2 = 0.50) and sorghum (R2 = 0.63) [14]. Although these results demonstrate that LiDAR-derived height can estimate the differences in crop heights across ecotypes, a systematic difference between the manual stem height measurement and the UAV-measured height was observed (Figure 7). One possible explanation for the differing results is that the complex canopy surface makes it difficult to compute a high-quality point cloud [37]. Moreover, in practice, most LiDAR returns are likely to come from leaves rather than the denser structures containing more of the biomass such as the stems. As previously mentioned, measuring A. donax plant height on the ground by eye is challenging because of the density and height of the stems, and hence to avoid bias in measurement, we standardized the process by measuring each stem from the basal node to the top node. Another explanation is that the LiDAR ground penetration is hindered by the thickness of the canopy [35,38] or by the footprint of the LiDAR itself.
4.2. AGB Estimation
Linear relations between individual LiDAR-derived-CHM metrics and biomass had low determination coefficients and high mean square errors (Table 2). As previously mentioned, these might be related to the poor penetration of the laser within the canopy [35,38]. However, an individual metric is unlikely to adequately represent the complex canopy structure. There are also other reports of low correlations between LiDAR and manual measurements [39]. Such limitation could be reduced by using a LiDAR with a smaller footprint to better penetrate the leafy biomass. Another way to improve biomass prediction is to take into consideration several other crop cover metrics, which may represent other features of canopy structure. Here, from the eleven LiDAR-derived metrics, Hmax, Hmajority, and Hvariety were together the best variables to include in a multiple regression for biomass estimation (Equation (1)) with good coefficient of determination (R2 = 0.71) and low bias (bias = 3.2) (Figure 8). In the 1 m2 evaluated these variables represent respectively the maximum height captured, the mode of the points and the count of distinct values. As these variables greatly improved the estimate, they may be recovering other features that contribute to canopy volume. While Hmax contributed the most to prediction of biomass, Hmajority and Hvariety individually correlated negatively with the dry biomass estimation, meaning that tall stems contribute more to the yield than the height with the most occurrences in the crop, and that crops which distribute resources more uniformly across stems (smaller Hvariety) yield more biomass. The positive linear relationship obtained is higher than that found for sugar beet (R2 = 0.68), lower than that for the much denser crop of winter wheat (R2 = 0.82), better than that for potato (R2 = 0.24) [14], and similar to that obtained for different nitrogen treatments in barley (R2 = 0.71) [40].
In our study, A. donax biomass was measured in November, compared with the earlier acquisition of LiDAR data in late June. Since stem height mostly contributes to AGB, several studies have shown that A. donax reaches the height plateau around July–August [41,42,43]. In addition, to maximize biomass yield, A. donax harvesting in North Italy is usually done in November just before the crop starts to senesce [22,44]. Waiting this long to collect LiDAR data is however not an option, as the inflorescences produced in August can significantly affect crop height and make it difficult to acquire accurate data manually. Despite the difference in timing between collection of height data and harvesting, multivariate LiDAR-derived biomass estimates related well to the dry weight (Figure 8). Biologically this does not come as a surprise, as stems produced in June are the most productive in terms of yield and later stems produced are smaller. If this relationship proves robust and can be established before flowering, it may have useful predictive ability for selecting suitable material for crossing in breeding programs.
Finally, the relationship between crop biomass and height was significantly better when looking at LiDAR estimates than at manual measurements (Figure 9e,f). The difference between the measured biomass and the estimated biomass can be explained by number of stems weighed (four stems) as opposed to the number of stems present in the 1 m2 detected by the LiDAR. The difference between biomass–height relationship, on the other hand, is probably due to the inaccuracy of human judgment in measuring crop aspects as opposed to LiDAR biomass being derived from the LiDAR crop heights. This is a specific problem in this very tall (3.2 to 4.2 m) dense crop where it is difficult to see the top of the stems, making it really hard to measure their heights without introducing errors. A greater number of plants should be surveyed by LiDAR with accompanying ground truth data in future studies to improve the crop biomass-height relationship and determine whether it is linear or exponential for A. donax.
4.3. Comparison of Ecotypes
These data confirm that EcoB, originally from a temperate oceanic climate, was significantly shorter than the other two Mediterranean ecotypes of A. donax (Figure 7a). Significant differences in height and biomass were detected in EcoA between WW and mDr from LiDAR estimates (Figure 9b). While ground height measurement showed no effect of drought stress on EcoA (Figure 9a), manually measured biomass did (Figure 9c). This difference in EcoA response to drought stress was also much more significant when looking at LiDAR estimated biomass (Figure 9b,d). This suggests that LiDAR phenotyping was better at determining differences in biomass and height than manual measurements, and LiDAR is currently the only non-destructive alternative. The much higher spatial sampling possible in the LiDAR derived CHM compared with the manual sampling makes LiDAR the preferred approach. Similar height measurement inaccuracy was reported in sorghum [45], and it suggests that it is difficult without a very large investment in time and care to record accurately the distribution of height in these tall field crops.
The lack of differences in EcoB and EcoC between treatments suggests that these A. donax ecotypes are more tolerant than EcoA to moderate drought stress applied during the experiment. There are other reports of stress tolerance in A. donax [19,20,21,46], hence its suitability for growth on marginal lands. Future work will aim to increase drought intensity and duration to determine how much is A. donax growth reduced at different drought stress levels and which ecotypes are more tolerant to these stress levels.
Our findings demonstrate that UAV-LiDAR is able to capture phenotypic differences across the three A. donax ecotypes, and therefore can be applied to larger scale than currently performed experimental trials monitoring the productivity of this bioenergy crop under different environmental conditions (e.g., [47]). The differences in productivity suggest that EcoA is much more productive than EcoB and EcoC. However, given EcoA’s low tolerance to drought, it is clear that it might not be the most suitable for bioenergy crop production on marginal lands. EcoB, on the other hand, had the lowest biomass but showed no difference in performance between the two treatments, which suggest that EcoB is more adapted to water scarcity in drought-prone environments, can grow on marginal lands and might yield more biomass than EcoA under similar soil conditions. EcoC showed intermediate performance for biomass production and drought tolerance, indicating a potential for bioenergy crop production on marginal lands. More research on these ecotypes is needed to gain a deeper understanding of the contributions of phenology, physiology, morphology to biomass production in this important bioenergy crop. However, depending on whether we want to maximize biomass yield or drought tolerance, the ecotypes studied demonstrate a huge potential for each scenario.
4.4. Implications
Future work will use more ecotypes at several locations and time points to further verify the robustness of the positive linear relationship between LiDAR estimates and biomass or other biophysical traits at various growth stages in response to environmental stresses. Sensors providing hyperspectral and thermal data, for example, will also be tested for their ability to contribute to novel associations between the phenotype and genotype of A. donax that are of interest to breeders and growers. Monitoring the productivity during the growing season can also be very important to optimize the biomass yield. Although the results in crop height and biomass estimation have demonstrated the potential of the UAV-LiDAR platform, some limitations are noted and should be worked on to increase utility of the phenotyping platform. For instance, UAV-LiDAR derived height measurements systematically overestimated the height of the A. donax. This is acceptable for comparison of crop heights as used in many breeding experiments; however, for absolute height measurements and more accurate biomass estimation, developing robust calibration with ground data should be the eventual aim.
5. Conclusions
Recent efforts in A. donax crop improvement are focused on the measurement of AGB and crop height as determinants of greater biomass yield. We demonstrated that the present methodology with the UAV-mounted LiDAR sensor is particularly useful for high-throughput phenotyping of A. donax in the field; it has a high potential for advancing A. donax crop phenomics and genomics-assisted breeding.
Our findings could help biomass crop breeders and researchers to reduce the gap between phenomics and genomics by generating accurate A. donax information in an efficient, non-destructive, and inexpensive way when compared to traditional laborious approaches. The methodology described also has potential for data mining to select the most promising ecotypes, making it possible to assess specific multiple criteria for ranking ecotypes, one of the main techniques used in crop breeding. This would be a valuable extension of the crop height and AGB successfully estimated from LiDAR in A. donax. We were able to capture differences in crop heights between treatments and between ecotypes that manual measurements were unable to detect. This improvement was probably related to the unbiased sampling at 30 or more points per m2 of the crop compared with the four stems selected and measured manually. These results are the first demonstration of the suitability of this UAV-based workflow for A. donax field phenotyping. Our findings show that UAV-based LiDAR scanning can replace traditional field-based crop surveys of mean height and AGB of different ecotypes and under different environmental conditions. This methodological and technological tool could be adapted to provide technical support to promote commercially viable applications of UAVs in crop phenotyping of other bioenergy crops (e.g., miscanthus and switchgrass) for other research programs and breeding companies.
Future investigations could be focused on the development of comparative analyses of A. donax ecotypes to test their growth habits and AGB yields over multiple environments, locations, and years to select the best performing and stable ecotypes. Considering that our research study was on three A. donax ecotypes stressed at one time point, next work could focus on time-series measurements of a large ecotypic panel, since breeders may need to study a large pool of plant materials and produce ecotypes that are also suitable for use in multiple cropping systems.
Supplementary Materials
The following will be available online at https://www.mdpi.com/2072-4292/12/20/3464/s1, Figure S1. Correlation matrix plot with significance levels between the different light detection and ranging (LiDAR) metrics and the field measured above-ground biomass (AGB) production in Arundo donax. The lower triangular matrix is composed of the bivariate scatter plots with fitted smooth red lines. The upper triangular matrix shows the Pearson correlation significance level (as red asterisks or red squares). Each significance level is associated to a symbol: p-values 0.001 (***), 0.05 (*), 0.1 (▪).
Author Contributions
Conceptualization, A.H.; methodology, M.M., F.N., A.F., and S.K.; data analysis, M.M., F.N., A.F., and S.K.; resources and funding acquisition, A.H.; writing—original draft preparation, M.M., A.F., S.K., and A.H.; writing—review and editing, A.G., F.N., F.T., and A.H.; supervision, A.H. All authors have read and agreed to the published version of the manuscript.
Funding
The authors acknowledge financial support provided by the European Commission’s Seventh Framework Programme (FP7/2012-2017) project WATBIO (Grant Agreement Number FP7-311929), the Regione Lazio/Lazio Innova project AgroEnVision (FILAS-RU-2014-1191), and by the Brain Gain Program (Rientro dei cervelli) of the Italian Ministry of Education, University and Research (A.H.).
Acknowledgments
We would like to thank the reviewers for the insightful comments and suggestions that significantly help to improve the quality of the paper. The authors are grateful to Riccardo Salvati and Matteo de Horatis for their help with UAV campaign and assistance in data collection, to Alasia Franco Vivai for providing plant materials and for their valuable field support, to Headwall Photonics for their fruitful collaboration and support for the implementation and utilization of LiDAR imaging, and to Manfred Greve for the UAV training.
Conflicts of Interest
The authors declare no conflict of interest.
References
- Yang, G.; Liu, J.; Zhao, C.; Li, Z.; Huang, Y.; Yu, H.; Xu, B.; Yang, X.; Zhu, D.; Zhang, X.; et al. Unmanned aerial vehicle remote sensing for field-based crop phenotyping: Current status and perspectives. Front. Plant Sci. 2017, 8, 1111. [Google Scholar] [CrossRef]
- Harfouche, A.L.; Jacobson, D.A.; Kainer, D.; Romero, J.C.; Harfouche, A.H.; Scarascia Mugnozza, G.; Moshelion, M.; Tuskan, G.A.; Keurentjes, J.J.B.; Altman, A. Accelerating climate resilient plant breeding by applying next-generation artificial intelligence. Trends Biotechnol. 2019, 37, 1217–1235. [Google Scholar] [CrossRef]
- Ludovisi, R.; Tauro, F.; Salvati, R.; Khoury, S.; Mugnozza, G.S.; Harfouche, A. UAV-based thermal imaging for high-throughput field phenotyping of black poplar response to drought. Front. Plant Sci. 2017, 8, 1681. [Google Scholar] [CrossRef]
- Virlet, N.; Sabermanesh, K.; Sadeghi-Tehran, P.; Hawkesford, M.J. Field scanalyzer: An automated robotic field phenotyping platform for detailed crop monitoring. Funct. Plant Biol. 2017, 44, 153. [Google Scholar] [CrossRef]
- Tardieu, F.; Cabrera-Bosquet, L.; Pridmore, T.; Bennett, M. Plant phenomics, from sensors to knowledge. Curr. Biol. 2017, 27, 770–783. [Google Scholar] [CrossRef]
- Tilly, N.; Aasen, H.; Bareth, G. Fusion of plant height and vegetation indices for the estimation of barley biomass. Remote Sens. 2015, 7, 11449–11480. [Google Scholar] [CrossRef]
- Madec, S.; Baret, F.; De Solan, B.; Thomas, S.; Dutartre, D.; Jezequel, S.; Hemmerlé, M.; Colombeau, G.; Comar, A. High-throughput phenotyping of plant height: Comparing unmanned aerial vehicles and ground LiDAR estimates. Front. Plant Sci. 2017, 8, 2002. [Google Scholar] [CrossRef]
- Su, Y.; Wu, F.; Ao, Z.; Jin, S.; Qin, F.; Liu, B.; Pang, S.; Liu, L.; Guo, Q. Evaluating maize phenotype dynamics under drought stress using terrestrial LiDAR. Plant Methods 2019, 15, 11. [Google Scholar] [CrossRef]
- Kerby, T.A.; Plant, R.E.; Johnson-Hake, S.; Horrocks, R.D. Environmental and cultivar effects on height-to-node ratio and growth rate in Acala cotton. J. Prod. Agric. 2013, 11, 427. [Google Scholar] [CrossRef]
- Hollaus, M.; Wagner, W.; Eberhöfer, C.; Karel, W. Accuracy of large-scale canopy heights derived from LiDAR data under operational constraints in a complex alpine environment. ISPRS J. Photogramm. Remote Sens. 2006, 60, 323–338. [Google Scholar] [CrossRef]
- Dalla Corte, A.P.; Rex, F.E.; De Almeida, D.R.A.; Sanquetta, C.R.; Silva, C.A.; Moura, M.M.; Wilkinson, B.; Zambrano, A.M.A.; Neto, E.M.D.C.; Veras, H.F.P.; et al. Measuring individual tree diameter and height using GatorEye high-density UAV-LiDAR in an integrated crop-livestock-forest system. Remote Sens. 2020, 12, 863. [Google Scholar] [CrossRef]
- Picos, J.; Bastos, G.; Míguez, D.; Alonso, L.; Armesto, J. Individual tree detection in a Eucalyptus plantation using unmanned aerial vehicle (UAV)-LiDAR. Remote Sens. 2020, 12, 885. [Google Scholar] [CrossRef]
- Zhu, W.; Sun, Z.; Peng, J.; Huang, Y.; Li, J.; Zhang, J.; Yang, B.; Liao, X. Estimating maize above-ground biomass using 3D point clouds of multi-source unmanned aerial vehicle data at multi-spatial scales. Remote Sens. 2019, 11, 2678. [Google Scholar] [CrossRef]
- Ten Harkel, J.; Bartholomeus, H.; Kooistra, L. Biomass and crop height estimation of different crops using UAV-based LiDAR. Remote Sens. 2020, 12, 17. [Google Scholar] [CrossRef]
- Zhang, L.; Grift, T.E. A LiDAR-based crop height measurement system for Miscanthus giganteus. Comput. Electron. Agric. 2012, 85, 70–76. [Google Scholar] [CrossRef]
- Coomes, D.A.; Dalponte, M.; Jucker, T.; Asner, G.P.; Banin, L.F.; Burslem, D.F.R.P.; Lewis, S.L.; Nilus, R.; Phillips, O.L.; Phua, M.H.; et al. Area-based vs tree-centric approaches to mapping forest carbon in Southeast Asian forests from airborne laser scanning data. Remote Sens. Environ. 2017, 194, 77–88. [Google Scholar] [CrossRef]
- Laurent, A.; Pelzer, E.; Loyce, C.; Makowski, D. Ranking yields of energy crops: A meta-analysis using direct and indirect comparisons. Renew. Sustain. Energy Rev. 2015, 46, 41–50. [Google Scholar] [CrossRef]
- Evangelistella, C.; Valentini, A.; Ludovisi, R.; Firrincieli, A.; Fabbrini, F.; Scalabrin, S.; Cattonaro, F.; Morgante, M.; Mugnozza, G.S.; Keurentjes, J.J.B.; et al. De novo assembly, functional annotation, and analysis of the giant reed (Arundo donax L.) leaf transcriptome provide tools for the development of a biofuel feedstock. Biotechnol. Biofuels 2017, 10, 138. [Google Scholar] [CrossRef]
- Cano-Ruiz, J.; Ruiz Galea, M.; Amorós, M.C.; Alonso, J.; Mauri, P.V.; Lobo, M.C. Assessing Arundo donax L. in vitro-tolerance for phytoremediation purposes. Chemosphere 2020, 252, 126576. [Google Scholar] [CrossRef]
- Sánchez, E.; Scordia, D.; Lino, G.; Arias, C.; Cosentino, S.L.; Nogués, S. Salinity and water stress effects on biomass production in different Arundo donax L. clones. Bioenergy Res. 2015, 8, 1461–1479. [Google Scholar] [CrossRef]
- Pompeiano, A.; Remorini, D.; Vita, F.; Guglielminetti, L.; Miele, S.; Morini, S. Growth and physiological response of Arundo donax L. to controlled drought stress and recovery. Plant Biosyst. 2017, 151, 906–914. [Google Scholar] [CrossRef]
- Fabbrini, F.; Ludovisi, R.; Alasia, O.; Flexas, J.; Douthe, C.; Ribas Carbó, M.; Robson, P.; Taylor, G.; Scarascia-Mugnozza, G.; Keurentjes, J.J.B.; et al. Characterization of phenology, physiology, morphology and biomass traits across a broad Euro-Mediterranean ecotypic panel of the lignocellulosic feedstock Arundo donax. GCB Bioenergy 2019, 11, 152–170. [Google Scholar] [CrossRef]
- Isenburg, M. LAStools. Available online: http://lastools.org/ (accessed on 17 May 2020).
- Roussel, J.-R.; Auty, D. LidR: Airborne LiDAR Data Manipulation and Visualization for Forestry Applications. Available online: https://cran.r-project.org/web/packages/lidR/index.html (accessed on 17 May 2020).
- Lumley, T. Leaps: Regression Subset Selection Version 3.1. Available online: https://rdrr.io/cran/leaps/ (accessed on 17 May 2020).
- Hamner, B.; Frasco, M.; LeDell, E. Metrics: Evaluation Metrics for Machine Learning Version 0.1.4. Available online: https://rdrr.io/cran/Metrics/ (accessed on 17 May 2020).
- Qin, H.; Wang, C.; Xi, X.; Tian, J.; Zhou, G. Estimation of coniferous forest aboveground biomass with aggregated airborne small-footprint LiDAR full-waveforms. Opt. Express 2017, 25, A851. [Google Scholar] [CrossRef]
- Zhang, Z.; Cao, L.; She, G. Estimating forest structural parameters using canopy metrics derived from airborne LiDAR data in subtropical forests. Remote Sens. 2017, 9, 940. [Google Scholar] [CrossRef]
- Wan-Mohd-Jaafar, W.S.; Woodhouse, I.; Silva, C.A.; Omar, H.; Hudak, A. Modelling individual tree aboveground biomass using discrete return LiDAR in lowland dipterocarp forest of Malaysia. J. Trop. For. Sci. 2017, 29, 465–484. [Google Scholar] [CrossRef]
- Abdi, H. The Bonferonni and Šidák Corrections for Multiple Comparisons; Salkind, N.J., Ed.; SAGE Publications Inc.: Los Angeles, CA, USA, 2007; ISBN 9781412916110. [Google Scholar]
- Shao, G.; Shao, G.; Gallion, J.; Saunders, M.R.; Frankenberger, J.R.; Fei, S. Improving LiDAR-based aboveground biomass estimation of temperate hardwood forests with varying site productivity. Remote Sens. Environ. 2018, 204, 872–882. [Google Scholar] [CrossRef]
- Nunes, M.; Ewers, R.; Turner, E.; Coomes, D. Mapping aboveground carbon in oil palm plantations using LiDAR: A comparison of tree-centric versus area-based approaches. Remote Sens. 2017, 9, 816. [Google Scholar] [CrossRef]
- Knapp, N.; Fischer, R.; Huth, A. Linking LiDAR and forest modeling to assess biomass estimation across scales and disturbance states. Remote Sens. Environ. 2018, 205, 199–209. [Google Scholar] [CrossRef]
- Wang, C.; Nie, S.; Xi, X.; Luo, S.; Sun, X. Estimating the biomass of Maize with hyperspectral and LiDAR data. Remote Sens. 2016, 9, 11. [Google Scholar] [CrossRef]
- Walter, J.D.C.; Edwards, J.; McDonald, G.; Kuchel, H. Estimating biomass and canopy height with LiDAR for field crop breeding. Front. Plant Sci. 2019, 10, 1145. [Google Scholar] [CrossRef]
- Kirchgessner, N.; Liebisch, F.; Yu, K.; Pfeifer, J.; Friedli, M.; Hund, A.; Walter, A. The ETH field phenotyping platform FIP: A cable-suspended multi-sensor system. Funct. Plant Biol. 2017, 44, 168. [Google Scholar] [CrossRef] [PubMed]
- Thapa, S.; Zhu, F.; Walia, H.; Yu, H.; Ge, Y. A novel LiDAR-based instrument for high-throughput, 3D measurement of morphological traits in maize and sorghum. Sensors 2018, 18, 1187. [Google Scholar] [CrossRef]
- Donoghue, D.N.M.; Watt, P.J.; Cox, N.J.; Wilson, J. Remote sensing of species mixtures in conifer plantations using LiDAR height and intensity data. Remote Sens. Environ. 2007, 110, 509–522. [Google Scholar] [CrossRef]
- Jimenez-Berni, J.A.; Deery, D.M.; Rozas-Larraondo, P.; Condon, A.G.; Rebetzke, G.J.; James, R.A.; Bovill, W.D.; Furbank, R.T.; Sirault, X.R.R. High throughput determination of plant height, ground cover, and above-ground biomass in Wheat with LiDAR. Front. Plant Sci. 2018, 9, 237. [Google Scholar] [CrossRef]
- Bendig, J.; Yu, K.; Aasen, H.; Bolten, A.; Bennertz, S.; Broscheit, J.; Gnyp, M.L.; Bareth, G. Combining UAV-based plant height from crop surface models, visible, and near infrared vegetation indices for biomass monitoring in barley. Int. J. Appl. Earth Obs. Geoinf. 2015, 39, 79–87. [Google Scholar] [CrossRef]
- Cosentino, S.L.; Scordia, D.; Sanzone, E.; Testa, G.; Copani, V. Response of giant reed (Arundo donax L.) to nitrogen fertilization and soil water availability in semi-arid Mediterranean environment. Eur. J. Agron. 2014, 60, 22–32. [Google Scholar] [CrossRef]
- Haworth, M.; Marino, G.; Riggi, E.; Avola, G.; Brunetti, C.; Scordia, D.; Testa, G.; Gomes, M.T.G.; Loreto, F.; Cosentino, S.L.; et al. The effect of summer drought on the yield of Arundo donax is reduced by the retention of photosynthetic capacity and leaf growth later in the growing season. Ann. Bot. 2019, 124, 567–579. [Google Scholar] [CrossRef]
- Acharya, M.; Burner, D.M.; Ashworth, A.J.; Fritschi, F.B.; Adams, T.C. Growth rates of giant miscanthus (Miscanthus × giganteus) and giant reed (Arundo donax) in a low-input system in Arkansas, USA. Am. J. Plant Sci. 2018, 9, 2371–2384. [Google Scholar] [CrossRef]
- Corno, L.; Pilu, R.; Adani, F. Arundo donax L.: A non-food crop for bioenergy and bio-compound production. Biotechnol. Adv. 2014, 32, 1535–1549. [Google Scholar] [CrossRef]
- Waliman, M.; Zakhor, A. Height estimation of biomass sorghum in the field using LiDAR. In Proceedings of the IS and T International Symposium on Electronic Imaging Science and Technology, San Francisco, CA, USA, 13–17 January 2019; Society for Imaging Science and Technology: Springfield, VA, USA, 2019; Volume 2019, pp. 137–138. [Google Scholar]
- Ahrar, M.; Doneva, D.; Tattini, M.; Brunetti, C.; Gori, A.; Rodeghiero, M.; Wohlfahrt, G.; Biasiolo, F.; Varotto, C.; Loreto, F.; et al. Phenotypic differences determine drought stress responses in ecotypes of Arundo donax adapted to different environments. Exp. Bot. 2017, 68, 2439–2451. [Google Scholar] [CrossRef]
- Andreu-Rodríguez, J.; Pérez-Espinosa, A.; Pérez-Murcia, M.D.; Moral, R.; Agulló, E.; Ferrández-Villena, M.; Ferrández-García, M.T.; Bustamante, M.A. Near infrared reflectance spectroscopy (NIRS) for the assessment of biomass production and C sequestration by Arundo donax L. in salt-affected environments. Agric. Water Manag. 2017, 183, 94–100. [Google Scholar] [CrossRef]
Publisher’s Note: MDPI stays neutral with regard to jurisdictional claims in published maps and institutional affiliations. |
© 2020 by the authors. Licensee MDPI, Basel, Switzerland. This article is an open access article distributed under the terms and conditions of the Creative Commons Attribution (CC BY) license (http://creativecommons.org/licenses/by/4.0/).

