Abstract
The China–Russia crude oil pipeline (CRCOP) traverses rivers, forests, and mountains over permafrost regions in northeastern China. Water accumulates beside the pipe embankment, which disturbs the hydrothermal balance of permafrost underlying the pipeline. Ground surface flows along the pipeline erode the pipe embankment, which threatens the CRCOP’s operational safety. Additionally, frost heave and thaw settlement can induce differential deformation of the pipes. Therefore, it is necessary to acquire the spatial distribution of water features along the CRCOP, and analyze the various hazard probabilities and their controlling factors. In this paper, information regarding the permafrost type, buried depth of the pipe, soil type, landforms, and vegetation were collected along the CRCOP every 2 km. Ponding and erosive damage caused by surface flows were measured via field investigations and remote sensing images. Two hundred and sixty-four pond sites were extracted from Landsat 8 images, in which the areas of 46.8% of the ponds were larger than 500 m2. Several influential factors related to freeze–thaw hazards and erosive damage were selected and put into a logistic regression model to determine their corresponding risk probabilities. The results reflected the distributions, and forecasted the occurrences, of freeze–thaw hazards and erosive damage. The sections of pipe with the highest risks of freeze–thaw and erosive damage accounted for 2.4% and 6.7%, respectively, of the pipeline. Permafrost type and the position where runoff encounters the pipeline were the dominant influences on the freeze–thaw hazards, while the runoff–pipe position, buried depth of the pipe, and landform types played a dominant role in erosive damage along the CRCOP. Combined with the geographic information system (GIS), field surveys, image interpretation and model calculations are effective methods for assessing the various hazards along the CRCOP in permafrost regions.
1. Introduction
The China–Russia crude oil pipeline (CRCOP) begins in Skovorodino, Russia, enters China in Xing’an, Mohe County, and terminates in Daqing, Heilongjiang Province. The pipeline traverses a total of 441 km over permafrost regions [1]. The first line began operations in 2011, and the second line started operating in 2018. Along the pipeline, due to the complex topography, high forest coverage, and dense vegetation, stream flows have developed owing to the large amounts of precipitation and fertile soil in these regions. The process of pavement used when constructing the CRCOP changed local landforms and the flow paths of runoff, which resulted in the appearance of ponds and water erosion on both sides of the pipe embankment. These hazards increase the risk of frost heave and thaw settlement along the pipeline [2]. Due to interactions between the pipeline and the underlying permafrost, the thermal condition of the foundation soil varies markedly in different terrains. Freeze–thaw processes increase the maximum thawing depth under the pipe, which results in significant settlement [3]. The main freeze–thaw hazards along the CRCOP route are frost heave, thawing settlement, the formation of frost mounds, and damage caused by the use of ice pitons [4]. Frost heave caused by water migration and its subsequent freezing can cause pipe deformation. Seasonal frost mounds 1–1.5-m tall have appeared in regions with developed groundwater and ice-rich permafrost. Lateral extrusion and uplifting caused by frost mounds increase the risk of frost damage [5]. Ice pitons were found on gentle slopes of mountain fronts containing springs or rivers. Landslides can also occur on a permafrost slope due to rainfall and freeze–thaw cycles, which may generate tensile forces on the pipeline [3,5].
The permafrost in eastern China is known as Xing’an-Baikal permafrost. At altitudes lower than 800 m along the pipeline, the permafrost is thermally unstable and ecologically sensitive to climate change [6]. With the development of global warming and anthropogenic activities, permafrost in eastern China has been degraded 50–150 km northward of the Xing’anling Mountains over the past 50 years [7]. Previous literature regarding buried pipes in permafrost regions mainly focused on the thermal effects, calculations, and forecasts of freeze–thaw processes in the context of oil transportation at above-freezing temperatures. In such scenarios, it was shown that thaw bulbs can develop and expand in regions under pipelines. A coupled hydrothermal model was adopted by [8] to precisely calculate the development of thaw bulbs and the cooling effect of insulating layers on pipes. It was shown that heating from oil flows at an average oil temperature of 7.7 °C, accelerated the development of the thaw bulbs. Additionally, it has been demonstrated that coupled hydrothermal–mechanical models can reflect the deformation and stress–strain characteristics of pipes [9,10]. Additionally, a two-dimensional thaw consolidation model was devised by [11] to describe the deformation of pipes.
In addition to theoretical analyses and calculations, field monitoring is a necessary method to reveal the mechanisms of pipe deformation and interactions between pipes and permafrost. Previous investigations measured pipe strain, oil temperature, pore water pressure and ground temperature of permafrost during pipeline operation [12,13]. The hydrothermal condition of the active layer and the permafrost layer can also be used to reflect the operational stability of pipes during freezing and thawing processes [14,15]. The mean annual temperature along the CRCOP increases in past years, while frost heave and thaw settlement commonly appear along its route [16]. Therefore, a series of monitoring systems were built along the CRCOP to obtain geological data and the ground temperature field. The cooling effect of engineering measures, such as thermosyphons and ventiducts, was observed and validated in a monitoring field [3,17].
Frost heave and thaw settlement in permafrost regions along a pipeline are related to the ice content, the amount of moisture in the active layer, and the quantity of ground surface water. The infiltration of ground surface flow increases the water content in the active layer and accelerates the development of frost heave. Apart from frost heave and thaw settlement, water erosion from surface flow is the main cause of damage to pipe embankments, which can aggravate pipe settlement [18]. Along the CRCOP, there are massive and dense seasonal runoffs, where some accumulate on both sides of the embankment, while others flow across the embankment. Previous studies focused on the results of field investigations and provided qualitative descriptions of frost-thawing hazards (e.g., frost heave and thawing settlement) and their control factors. However, due to a lack of detailed data related to the basic geological and geophysical properties along the CRCOP, there has been little work on obtaining quantitative relationships, and providing forecasts of hazard occurrence along the route. Moreover, ponding and runoff erosion along the pipeline have not been considered in any assessment model to date.
In this paper, based on geological field survey data, ponds and erosive damage sites along the CRCOP were found. The distribution of water bodies was extracted by the normalized difference water index (NDWI) from Landsat 8 images. The main influential factors were selected, and their attributes were considered in a logistic regression model that was used to regress the weight of each factor and calculate the probability of freeze–thaw hazards and erosive damage to the CRCOP. Combined with the field survey, remote sensing image interpretation was conducted to identify water bodies in areas that were inaccessible via the field survey along the CRCOP route. The spatial distribution of water bodies was systematically extracted and analyzed based on their source, development, and thermal impact on the CRCOP. The results of this study may provide a scientific basis and reference for the hazard treatment and operation management of pipes in permafrost regions.
2. Methods and materials
2.1. Test Case and Data
The study region is a 400 km length along the CRCOP in permafrost regions of northeastern China (Figure 1). The field survey focused on both sides of the pipeline within an average distance of 50 m from the pipeline. The extraction range of water features from the Landsat 8 remote sensing images was 300 m on both sides of the pipeline. Rugged terrain, marsh, and surface flows are present along the pipeline. There is also a high groundwater level, as well as complex permafrost environments and engineered geological conditions surrounding the CRCOP. The pipeline traverses a dense distribution of rivers in permafrost regions [1,19]. The field survey, which was conducted in August, 2018, identified 102 pond sites and 223 water erosion sites next to the pipeline.
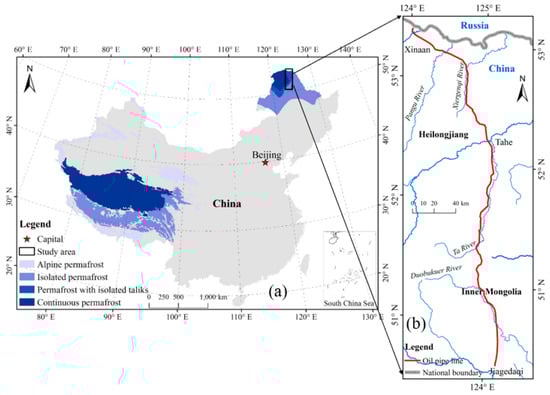
Figure 1.
Location of the study region (from [19], the reference system is Krasovsky 1940 Albers), (a) permafrost distribution in China, (b) pipeline location from Xing’an to Jiagedaqi.
The normalized difference water index (NDWI) was calculated based on Landsat 8 images from May, 2018. The images were provided by the geospatial data cloud site, which is part of the Computer Network Information Center, Chinese Academy of Sciences (http://www.gscloud.cn). The images adopted in this paper were Level-1 terrain-corrected (L1T) products, which were typically compressed, 950 MB GeoTiff files [20]. The band information of the Landsat 8 images is shown in Table 1.

Table 1.
Band information of the Landsat 8 Operational Land Imager (OLI) images.
During our field survey, the position (latitude, longitude, and altitude), size (length and width), formation, and relation of the ponds relative to the pipe embankment were measured. The buried depths of the pipe, landform types, vegetation types, soil types, and ice content were collected from a 400 km length along the pipeline (Figure 2) before the pipe was encased in pavement. The data were obtained from drillhole information, the data of which were tabulated in Excel. The ice content was visual judged as ice poor (0~5%), ice soil (5%~15%), ice rich (15%~25%), and ice saturated (25%~45%). The buried depths (depth from ground surface to the top of the pipe) were measured with a depth detection instrument (RD8100), at depths from 1.5 to 3.0 m. The data were collected every 2 km during the survey; this spacing was determined by considering the feasibility and cost of designing and constructing the pipeline. According to our field survey along the pipeline, the data obtained with the 2 km sampling interval were able to effectively represent the attributes of each influential factor. The altitude spanned a range of 130 to 680 m, where the section from Ta River to Jiagedaqi had the highest altitude. Approximately 210 km of the CRCOP exists in continuous permafrost regions, of which 70 km is located within ice-rich permafrost. The soil along the pipeline was divided into four categories: gravel, humus (soil which consists of dead plants that have begun to decay), mool (cultivated soil), and silty clay. The vegetation is mainly forest and grass along the pipeline.
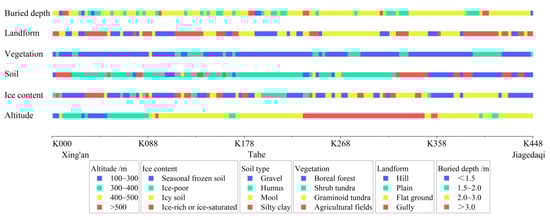
Figure 2.
Distribution of the geological and geographic factors along the pipeline (from Xing’an to Jiagedaqi, by Origin 2015).
2.2. Methods
Ponds on both sides of the pipeline in the range of 300 m were identified and extracted from the NDWI. The NDWI was proposed by Mcfeeters in 1996 [21], and can be obtained from visible and near-infrared spectra based on the reflectivity of water in different bands. After image segmentation, the positions and areas of water bodies in the study region were extracted from the remote sensing images. The equation of the NDWI is shown in Equation (1):
where Green is the green band and NIR is the near-infrared band. The NDWI results were not used in our regression model, but they were used to ascertain the distribution of water bodies along the pipeline that were unreachable during the field survey.
Before calculating the probabilities, Moran’s index, which is a product-moment coefficient analogous to Pearson’s correlation coefficient, was selected as an indicator when analyzing the spatial autocorrelation of the selected influential factors. Moran’s index reflects the spatial clustering and distributional correlation of the considered influential factor attributes, which were used evaluate the data quality and the accuracy of the factor selection. The local Moran’s index can be expressed in Equations (2) and (3):
where zi is the deviation of factor attribute i from its average value , wi,j is the combined spatial weight of i and j, n is the number of elements, and S0 is the sum of all the spatial weights. The average value, , was calculated by Equation (4):
The statistical results of zI were calculated by Equations (5)–(7):
In this paper, a hazard is defined as a relevant danger or risk that may cause potential damage to the pipeline. For example, the probability of a freeze–thaw hazard is higher in permafrost regions with lots of ice, in which damage can arise due to frost heave and thaw settlement.
To obtain a precise regression and subsequent predictions, a logistic regression model was constructed to analyze the various influential factors. The attribute of each factor was extracted and put into the logistic regression model to calculate the probabilities of the corresponding hazards. Logistic regression is a multivariate analysis model, which is useful for predicting the presence or absence of a given outcome. The advantage of logistic regression models is their ability to overcome the limits of linear regression due to dependent and independent variables. Quantitatively, the relationship between an occurrence and its dependency on the independent variable(s) can be expressed in Equations (8) and (9):
where p is the probability of occurrence, which varies from 0 to 1 in an S-shaped curve, z is the linear combination of all occurrences, b0 is the intercept, and bi are the coefficients of the independent variables xi.
According to our previous research [22], the surface flow trend along the CRCOP mainly focuses occurs east–west (0°). In general, when a pipe transects a surface flow, the risk of erosive damage is higher than in other sections that do not encounter a flow. The permafrost types in the study region were categorized in the model based on their ice content: 0% (seasonal frozen soil), 5% (ice poor), 15% (icy), 25% (ice rich), and 45% (ice saturated). The field investigation results of the ponding and water erosive sites were set as a categorical binary variable (where 1 represents yes, and 0 represents no), which were included in the regression model as a dependent variable. The attribute of each influential factor was set as an independent variable. After the regression, the weight of each influential factor was obtained from the coefficient of the independent variable(s). The probabilities of freeze–thaw hazards and water erosion were then calculated with the derived logistic regression model, which provided support for the intuitive understanding and proper treatment of threats along the pipeline. The analysis procedure for the water features and hazard probabilities is shown in Figure 3.
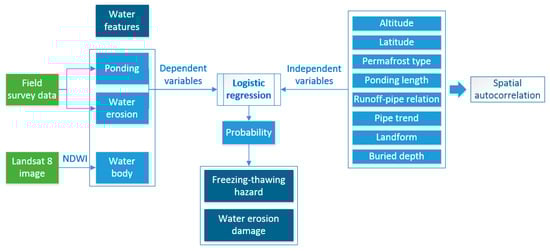
Figure 3.
Flowchart of the acquisition of water features and the calculation of hazard probabilities along the China–Russia crude oil pipeline (CRCOP) route.
3. Results
3.1. Distribution of Ponds and Water Erosion along the CRCOP
Frost heave and thaw settlement are mainly related to permafrost conditions (i.e., ice content and the ground temperature) and water infiltration into the active layer. The main water features, which are the likely sources of water infiltration and runoff seen along the CRCOP were ponds, thermokarst lakes, and runoff/drainage along the pipeline.
Along the pipeline, the geological conditions are complex, which include dense vegetation and forest coverage with large amounts of precipitation. Generally, runoff develops in rugged terrain, which flows downward to any flat terrain and hence may occasionally traverse the pipeline. Due to the low density of the backfilling material and disturbances caused during the pavement process, depressions were created in the ground surface beside the pipe embankment, and water subsequently accumulated on one or both sides, forming ponds. According to the field investigation, we discovered 102 pond sites along the pipeline in permafrost regions [19]. The percentage of ponds with areas smaller than 50 m2 was 20%, the percentage with areas between 50 and 100 m2 was 27%, and the percentage of ponds with areas from 100 to 500 m2 was 30%. To accurately acquire the water features along the pipeline within a limited range, images from Landsat 8 were selected to be interpreted, and the NDWIs were subsequently calculated. Water features have positive NDWI values, while vegetation and soil have zero or negative values. Then the image was segmented by the threshold of zero. As stated previously, water information within 300 m of the pipeline was extracted based on the NDWIs (Figure 4).
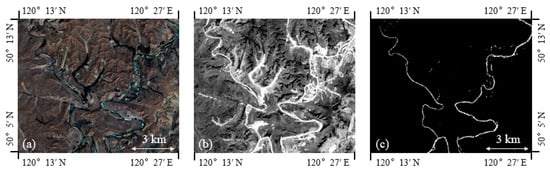
Figure 4.
Image processing of Landsat 8 data: (a) an original image, (b) normalized difference water index (NDWI) results, and (c) the extracted waterbody distribution.
The ponds identified by the field survey are shown in Figure 5a, while the 264 ponds extracted from the remote sensing images are shown in Figure 5b. More ponding was present north of the pipeline relative to the south. The percentage of ponds with areas smaller than 500 m2 was 46.8%, and the largest pond had an area of almost 104 m2. Due to seasonal surface flows, the pipe embankment has been eroded, which has resulted in embankment damage and pipe exposure, causing a potential threat to the CRCOP’s safe operation. The amount of water erosion by surface flows is more than that caused by just ponding. Depending on the water source, water erosion can be divided into two categories: erosion by surface flow on slopes, and by streams on flat ground (Figure 6). We identified 25 sites of erosive damage on slopes, and 198 sites of damage on flat ground, which are shown in Figure 5c.
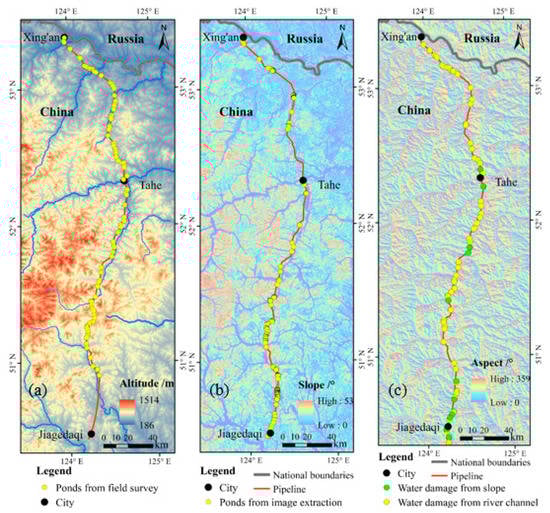
Figure 5.
(a) Distribution of ponds from the field survey, (b) image extraction, and (c) water erosion along the CRCOP (the reference system is WGS-1984).
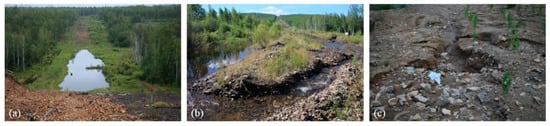
Figure 6.
(a) Ponding, (b) erosive damage from streams on flat ground, and (c) and surface flow on a slope.
3.2. The Spatial Autocorrelation of Influential Factors
Moran’s indices (Moran’s I) of the altitude, permafrost type, pond length, pipe orientation, landform type, and buried pipe depth are shown in Figure 7. Moran’s I of each factor is greater than zero, which means the above six factors present a spatially positive correlation, which increases with an increase in the index value. According to the Moran’s I scatterplots, the spatial distributions of all attributes are dispersive. There is no obvious clustering among the six selected factors, which means the factors can be appropriately used to calculate the probability of freeze–thaw hazards and erosive damage.
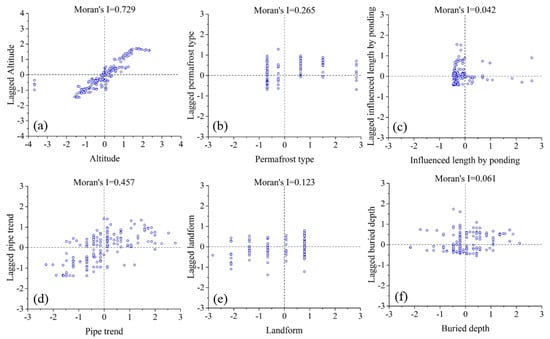
Figure 7.
Scatterplots of Moran’s index (Moran’s I) of altitude (a), permafrost type (b), pond length (c), pipe orientation (d), landform type (e), and buried pipe depth (f).
The distributions of the local indicators of spatial association (LISA) of the six above factors are shown in Figure 8. The LISA aggregations were divided into four categories: High–High (HH), High–Low (HL), Low–Low (LL), and Low–High (LH). HH and LL represent the aggregation of attributes with high values or low values, while HL and LH represent heterogeneous attribute distributions. Along the pipeline, the attributes of altitude, ice content, and pipe orientation have long sections with continuously homogeneous aggregations. The attributes of pond length, landform type, and buried pipe depth show discrete distributions. Except for pond length, the LISA aggregation of the other five factors is mainly distributed in the HH and LL quadrants, which account for 74.8% of the whole pipeline.
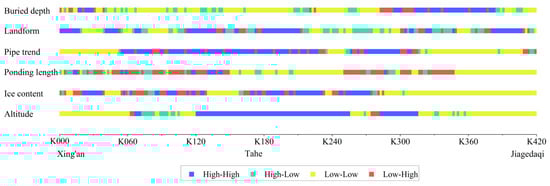
Figure 8.
Distributions of the local indicators of spatial association (LISA) aggregations for the six factors (altitude, permafrost type, pond length, pipe orientation, landform type, and buried pipe depth).
3.3. Probability of Frost Heave and Thawing Settlement along the CRCOP
To quantitatively evaluate the hazard occurrence probability of frost heave and thawing settlement along the pipeline, we selected five influential factors based on the field survey and a literature review [22,23]: altitude, latitude, permafrost type, pond length, and runoff–pipe position. The mean annual ground temperature decreases with an increase in altitude and latitude, which will reduce the occurrence of frost heave and thawing settlement in the active layer. Indeed, regions along the pipeline that are thickly covered with ice and located near large ponds have a greater risk than other regions. Moreover, when a ground surface flow intersects the pipeline, the freeze–thaw risk becomes greater than for other positional relationships. Based on the obtained geological data and buried pipe depths, the logistic regression model was implemented with the attributes of the five aforementioned influential factors to evaluate the occurrence probability of freeze–thaw hazards. The positional relationship between runoff and the pipeline was defined as the categorical binary variable, where 0 implies no intersection and 1 implies intersection. Data from 79 investigated sites were used as validation data. After the regression, the accuracy, as shown in Table 2, was 71.1%, which demonstrates the effectiveness of the model in terms of frost heave and thawing settlement hazard evaluation.
Table 2.
Goodness-of-fit results for damage caused by frost heave and thawing settlement.
The variable coefficients of the best-fitting results are shown in Table 3, in which “B” is the coefficient of each corresponding variable, “S.E.” is the standard error, “Wald” is the Wald test result, “df” is the degrees of freedom, and “Sig.” is the level of statistical significance.
Table 3.
Variables in the regression equation for damage caused by frost heave and thawing settlement.
The clustered robust standard errors of the regression results are shown in Table 4. Under the condition of different clusters being influenced by different factors, the “no cluster errors” and “clustered standard errors” differ from each other. Except for the permafrost type, the errors of the other factors are small, which satisfies the required accuracy of the model calculations. The permafrost type was set based on the ice content (as described previously), and their attributes were not continuous; therefore, they had larger errors.
Table 4.
Clustered robust standard errors of the regressed freeze–thaw hazards.
The probability calculation for frost heave and thawing settlement is shown in Equations (10) and (11):
where
in which X1, X2, X3, X4, and X5 are the altitude, permafrost type, pond length, positional relation between runoff and the pipeline, and the latitude, respectively. Among these influential factors, the weights of the permafrost type and the positional relation between runoff and the pipeline were larger than those of other factors. The risk assessment along the pipeline is shown in Figure 9a.
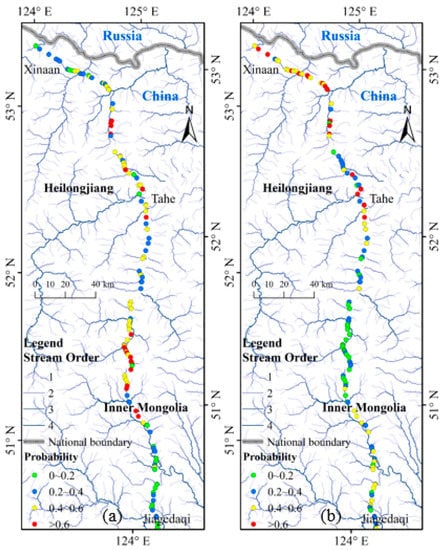
Figure 9.
Risk assessment of frost heave and thawing settlement (a) and water erosion by surface flows (b) along the CRCOP.
Along the pipeline, regions near rivers have higher probabilities of frost heave and thawing settlement along the pipeline than other locations. In regions south of the Jialabaqi River (K270), the probabilities are generally smaller than in places north of the river. The length of pipeline with frost heave and thawing settlement probabilities higher than 50% was 109 km, which accounted for 24.3% of the total length of the CRCOP. The length of pipe with probabilities higher than 80% was 11 km, or 2.4% of the total length. The sections of pipeline with the high probabilities of frost heave and thawing settlement were distributed in ice-rich permafrost regions.
3.4. Probability of Erosive Damage by Surface Flows
Erosive damage can be caused by ground surface runoff into backfilled portions of the pipe embankment. According to our field investigation, the type of backfilling material is gravel soil, which is very similar to the shallow bedrock that runs along the pipeline. We selected six variables as evaluation factors to estimate the probability of erosive damage caused by surface flows: altitude, pipe orientation, pond length, positional relationship between runoff and the pipeline, landform type, and the buried depth of the pipe. It was found that regions with high altitudes and few ponds had lower risks than other regions. When the pipe was intersected by a ground surface flow in complex terrain, the risk was higher than in other regions. Among the five landforms present along the pipeline, the risk of erosive damage from high to low was gullies, flat ground at the base of mountains, plains, and hills, successively. Deep-buried pipes had lower risks than shallow-buried pipes. The erosive damage had little correlation with the soil type in natural ground. Therefore, the soil type was not considered as a controlling factor in our model. The collected data of each influential factor from 131 field survey sites were put into the logistic regression model, which were used as validation data. The model accuracy, as shown in Table 5, was 68.4%, which is reasonably accurate for the hazard assessment of erosive damage caused by surface flows.
Table 5.
Goodness-of-fit results for erosive damage caused by surface flows.
The variable coefficients of the best-fitting results are shown in Table 6.
Table 6.
Variables in the regression equation for erosive damage caused by surface flows.
The clustered robust standard errors of the erosive damage regression are shown in Table 7, which satisfies the required accuracy of the model calculations. The errors of the relation between the surface flow and the pipeline were larger than the errors of the other factors. The attribute “relation between surface flow and the pipeline” was categorical, and its distribution was discrete.
Table 7.
Clustered robust standard errors of the regressed erosive damages.
The probability calculation of erosive damage caused by surface flows is shown in Equations (12) and (13):
where
in which X6, X7, X8, X9, X10, and X11 are the altitude, pipe orientation, pond length, positional relation between runoff and the pipeline, landform type, and buried depth of the pipe, respectively. Among the six influential factors, the positional relation between runoff and the pipeline, the buried depth, and the landform type had the largest weights. The assessment results of water erosion along the CRCOP route are shown in Figure 9b.
Along the whole pipeline, the occurrence of water erosion had a negative correlation with altitude. The regions along the pipeline with low risks of erosive damage were located from the Walagan River to the Dabadai River (K150–K360). The length of pipe with a hazard probability higher than 50% was 154 km, which accounted for 34.3% of the total length. The length of pipeline with a hazard probability higher than 80% was 30 km, which accounted for 6.7% of the total length, which was distributed near rivers and in valleys with lower altitudes. Whenever a dense ground surface flow developed beside the pipeline, the risk of erosive damage affecting the operation of the pipeline increased.
4. Discussion
Northeastern China has a complex topography, receives large amounts of precipitation and contains dense forest vegetation. Due to the water-proofing property of the permafrost layer, there is little exchange between surface flows and groundwater. Surface flow erodes the pipe embankment, which reduces the operational stability of the pipeline. During the pavement process, trees surrounding the pipeline were removed, which altered the local terrain and water flow paths. When traversing some large-scale rivers, the pipeline was buried below the riverbed. When traversing some small-scale rivers, gabions were placed above the pipeline to prevent water erosion. However, surface flow still accumulates beside the embankment and erodes the backfilling. Moreover, ponding changes the hydrothermal boundary condition surrounding the pipeline and disturbs the thermal balance of the permafrost environment. The erosive damage produced by surface flows destroys the structure of the embankment, which threatens the operational safety of the pipeline.
The results of the field investigation of ponding were different from the water bodies identified via the remote sensing image interpretation, where the areas of the water bodies along the CRCOP identified via the latter process were generally larger than the observed ponds, which were mainly distributed in flat regions. The ponds along the pipeline were also distributed in rugged terrain with large elevation differences and developed runoff. The water bodies found in the remote sensing images are larger, and hence likely to persist longer than the small ponds found via the field survey. The field survey focused on small-scale ponding within a 50 m (on average) range either side of the pipeline, while the image interpretation occurred within a range of 300 m either side of the pipeline. The average spatial resolution of the multispectral bands in Landsat 8 is approximately 30 m, which is suitable for the analysis of water bodies with large areas [24]. The small-scale ponds next to the pipe reflected the influence of the pipe construction process on the regional landforms, while the evolution of large-scale water bodies reflected the effects of climate warming and permafrost degradation.
Regions containing large-scale rivers had higher risks of freeze–thaw hazards than other regions. Generally, talik exists below the riverbed in permafrost regions, and the ice content of permafrost near rivers is usually higher than in other regions. As a heat source, oil transportation occurs at an average temperature of 7.7 °C, which conducts considerable amounts of heat into the permafrost surrounding the pipeline [25]. Water produced by thawing permafrost accumulates in the ground surface and increases the amount of ponding, which in turn accelerates permafrost thawing and pipe settlement. For operational maintenance and hazard treatment, engineering measures should be adopted to control and eliminate the effects of water features present along the CRCOP route. Local terrain beside the pipeline should be flattened by backfilling to prevent water accumulation. The buried depth of the pipeline should be increased, and gabions constructed with advanced materials should be adopted to prevent water erosion. Drainage or proofing measures in pipe ditches and on the ground surface can also help eliminate frost heave. In addition, there are some effective measures that can be taken to control any thaw settlement of the pipeline, such as thermal insulation, thermosyphoning, thickening of the pipe wall, vegetation recovery, and soil replacement [16].
5. Conclusions
In this paper, ponds and water features along the CRCOP were observed during a field survey, and identified in remote sensing images. The risk assessment of freeze–thaw hazards and erosive damage along the pipe was calculated using a logistic regression model. The main findings are as follows:
(1) According to the geological information obtained during the survey, it is mainly humus and forest that are distributed along the pipeline. The pipeline traverses 70 km of ice-rich permafrost regions. From the field survey, 102 pond sites and 223 water erosion sites were identified along a 400 km long stretch of the CRCOP. From the results of the remote sensing image interpretation, 264 water bodies within 300 m either side of the pipeline were found, and most of them had an area larger than 500 m2.
(2) The amount pipeline with a high risk (probability > 80%) of frost heave and thaw settlement accounted for 2.4%, or 11 km, of the total length, which was distributed in ice-rich permafrost regions. Among the five influential factors, permafrost type and the runoff–pipe position had the largest weights. The pipeline with the highest risk (probability > 80%) of water erosion accounted for 6.7%, or 30 km, of the total length, which was located in valleys containing surface flows. The positional relation between runoff and the pipeline, the buried depth of the pipeline, and the landform type had the largest weights of the considered influential factors.
(3) From the survey results, it was found that the whole pipeline traverses many different rivers. Moreover, there are some seasonal surface flows surrounding the pipeline. Water accumulates beside the embankment, which in turn is eroded by the seasonal flow. More water erosion sites were found relative to the amount of identified ponding sites. If proper engineering measures are adopted to drain or remove the water in a timely manner, the risk of erosion and any subsequent damage to the embankment can be limited or prevented.
(4) Remote sensing and a geographical information system (GIS) are effective methods to quickly identify water features, and intuitively express the distribution of hazards in permafrost regions. Combined with field surveys, a logistic regression model can precisely regress the weights of different control factors and calculate hazard probabilities along the pipeline. Finally, comprehensive and innovative technologies should be adopted when assessing the hazards related to permafrost engineering.
Author Contributions
Conceptualization, M.C. and G.L.; methodology, M.C.; software, M.C.; validation, Y.C. and Z.Z.; formal analysis, M.C.; investigation, G.W., Y.M., D.C., J.Z., Y.Z. and Q.D.; resources, G.L.; data curation, Z.Z.; writing—original draft preparation, M.C.; writing—review and editing, G.L.; visualization, M.C.; supervision, G.L. and W.M.; project administration, G.L. and W.M.; funding acquisition, G.L. and W.M. All authors have read and agreed to the published version of the manuscript.
Funding
This research was funded by the Strategic Priority Research Program of the Chinese Academy of Sciences, grant number XDA2003020102, the China Second Tibetan Plateau Scientific Expedition and Research, grant number 2019QZKK0905, the China Postdoctoral Science Foundation, grant number 2019M653797, and the National Natural Science Foundation of China, grant number 41672310.
Acknowledgments
We thank the anonymous reviewers for their insightful and constructive comments on this manuscript. We also thank the editor and the associate editor for their invaluable help on our manuscript.
Conflicts of Interest
The authors declare no conflict of interest.
References
- Jin, H.J.; Hao, J.Q.; Chang, X.L.; Zhang, J.M.; Qi, J.L.; Lü, L.Z.; Wang, S.L. Zonation and assessment of frozen-ground conditions for engineering geology along the China–Russia crude oil pipeline route from Mo’he to Daqing, Northeastern China. Cold Reg. Sci. Technol. 2010, 64, 213–225. [Google Scholar]
- Yang, Y.; Ding, L.; Liu, H.P. Study on permafrost thermal stability due to geohazards of China-Russia Crude Oil Pipeline. J. Eng. Res. 2020, 8, 89–106. [Google Scholar]
- Wang, Y.P.; Jin, H.J.; Li, G.Y. Investigation of the freeze–thaw states of foundation soils in permafrost areas along the China–Russia Crude Oil Pipeline (CRCOP) route using ground-penetrating radar (GPR). Cold Reg. Sci. Technol. 2016, 126, 10–21. [Google Scholar] [CrossRef]
- Li, G.Y.; Ma, W.; Wang, X.L.; Jin, H.J.; Wang, Y.P.; Zhao, Y.B.; Cai, Y.J.; Zhang, P. Frost hazards and mitigative measures following operation of Mohe-Daqing line of China-Russia crude oil pipeline. Rock Soil Mech. 2015, 36, 2963–2973. (In Chinese) [Google Scholar]
- Wang, F.; Li, G.Y.; Ma, W.; Wu, Q.; Serban, M.; Vera, S.; Alexandr, F.; Jiang, N.; Wang, B. Pipeline–permafrost interaction monitoring system along the China–Russia crude oil pipeline. Eng. Geol. 2019, 254, 113–125. [Google Scholar]
- Wei, Z.; Jin, H.J.; Zhang, J.M.; Yu, S.P.; Han, X.J.; Ji, Y.J.; He, R.X.; Chang, X.L. Prediction of permafrost changes in Northeastern China under a changing climate. Sci. China Earth Sci. 2011, 54, 924–935. [Google Scholar]
- Jin, H.J.; Yu, Q.H.; Lü, L.Z.; Guo, D.X.; He, R.X.; Yu, S.P.; Sun, G.Y.; Li, Y.W. Degradation of permafrost in the Xing’anling Mountains, Northeastern China. Permafr. Periglac. Process. 2007, 18, 245–258. [Google Scholar]
- Yu, W.B.; Liu, W.B.; Lai, Y.M.; Chen, L.; Yi, X. Nonlinear analysis of coupled temperature-seepage problem of warm oil pipe in permafrost regions of Northeast China. Appl. Therm. Eng. 2014, 70, 988–995. [Google Scholar] [CrossRef]
- Wen, Z.; Sheng, Y.; Jin, H.J.; Li, S.; Li, G.; Niu, Y. Thermal elasto-plastic computation model for a buried oil pipeline in frozen ground. Cold Reg. Sci. Technol. 2010, 64, 248–255. [Google Scholar] [CrossRef]
- Wu, Y.P.; Sheng, Y.; Wang, Y.; Jin, H.J.; Chen, W. Stresses and deformations in a buried oil pipeline subject to differential frost heave in permafrost regions. Cold Reg. Sci. Technol. 2010, 64, 256–261. [Google Scholar] [CrossRef]
- Sykes, J.F.; Lennon, W.C.; Unny, T.E. Two-dimensional heated pipeline in permafrost. J. Geotech. Geoenviron. Eng. 1974, 100, 10956. [Google Scholar]
- Osterkamp, T.E. Establishing long-term permafrost observatories for active-layer and permafrost investigations in Alaska: 1977–2002. Permafr. Periglac. Process. 2003, 14, 331–342. [Google Scholar] [CrossRef]
- Oswell, J.M. Pipelines in permafrost: Geotechnical issues and lessons. Can. Geotech. J. 2011, 48, 1412–1431. [Google Scholar] [CrossRef]
- Burgess, M.M.; Wilkie, S.; Doblanko, R.; Konuk, I. Field observations of cyclical pipe-soil interactions in permafrost terrain, KP 5, Norman Wells Pipeline, Canada. In Proceedings of the 2000 3rd International Pipeline Conference, Calgary, AB, Canada, 1–5 October 2000. [Google Scholar]
- Slusarchuk, W.A.; Watson, G.H.; Speer, T.L. Instrumentation around a warm oil pipeline buried in permafrost. Can. Geotech. J. 1973, 10, 227–245. [Google Scholar] [CrossRef]
- Li, G.Y.; Sheng, Y.; Jin, H.J.; Ma, W.; Qi, J.L.; Wen, Z.; Zhang, B.; Mu, Y.H.; Bi, G.Q. Development of freezing–thawing processes of foundation soils surrounding the China–Russia Crude Oil Pipeline in the permafrost areas under a warming climate. Cold Reg. Sci. Technol. 2010, 64, 226–234. [Google Scholar] [CrossRef]
- Li, G.Y.; Wang, F.; Ma, W.; Fortier, R.; Mu, Y.H.; Zhou, Z.W.; Mao, Y.C.; Cai, Y.J. Field observations of cooling performance of thermosyphons on permafrost under the China-Russia Crude Oil Pipeline. Appl. Therm. Eng. 2018, 141, 688–696. [Google Scholar] [CrossRef]
- Burgess, M.M.; Harry, D.G. Norman Wells pipeline permafrost and terrain monitoring: Geothermal and geomorphic observations, 1984–1987. Can. Geotech. J. 1990, 27, 233–244. [Google Scholar] [CrossRef]
- Chai, M.T.; Mu, Y.H.; Li, G.Y.; Ma, W.; Wang, F. Relationship between ponding and topographic factors along the China-Russia Crude Oil Pipeline in permafrost regions. Sci. Cold Arid Reg. 2020, 11, 419–427. [Google Scholar]
- Roy, D.P.; Wulder, M.A.; Loveland, T.R.; Woodcock, C.E.; Allen, R.G.; Anderson, M.C.; Helder, D.; Irons, J.R.; Johnson, D.M.; Kennedy, R.; et al. Landsat-8: Science and Product Vision for Terrestrial Global Change Research. Remote Sens. Environ. 2014, 145, 154–172. [Google Scholar] [CrossRef]
- McFeeters, S.K. The use of the Normalized Difference Water Index (NDWI) in the delineation of open water features. Int. J. Remote Sens. 1996, 17, 1425–1432. [Google Scholar] [CrossRef]
- Hong, E.; Perkins, R.; Trainor, S. Thaw Settlement Hazard of Permafrost Related to Climate Warming in Alaska. Arctic 2014, 67, 93–103. [Google Scholar] [CrossRef]
- Zhang, Z.Q.; Wu, Q.B. Thermal hazards zonation and permafrost change over the Qinghai–Tibet Plateau. Nat. Hazards 2012, 61, 403–423. [Google Scholar] [CrossRef]
- Du, Z.Q.; Li, W.B.; Zhou, D.B.; Tian, L.; Ling, F.; Wang, H.; Gui, Y.; Sun, B. Analysis of Landsat-8 OLI imagery for land surface water mapping. Remote Sens. Lett. 2014, 5, 672–681. [Google Scholar] [CrossRef]
- Wang, F.; Li, G.Y.; Ma, W.; Mao, Y.C.; Mu, Y.H.; Serban, M.; Cai, Y.J. Permafrost warming along the Mo’he-Jiagedaqi section of the China-Russia crude oil pipeline. J. Mt. Sci. 2019, 16, 285–295. [Google Scholar] [CrossRef]


Publisher’s Note: MDPI stays neutral with regard to jurisdictional claims in published maps and institutional affiliations. |
© 2020 by the authors. Licensee MDPI, Basel, Switzerland. This article is an open access article distributed under the terms and conditions of the Creative Commons Attribution (CC BY) license (http://creativecommons.org/licenses/by/4.0/).