Article

Aerosol Characterization during the Summer 2017 Huge Fire Event on Mount Vesuvius (Italy) by Remote Sensing and In Situ Observations

1
Istituto di Metodologie per l’Analisi Ambientale (IMAA)—CNR, 85050 Tito Scalo, Italy
2
Dipartimento di Fisica “E. Pancini”, Università degli Studi di Napoli Federico II, 80138 Napoli, Italy
3
Istituto Superconduttori, Materiali innovativi e Dispositivi (SPIN)—CNR, 80126 Napoli, Italy
4
School of Remote Sensing and Information Engineering, Wuhan University, Wuhan 430072, China
*
Author to whom correspondence should be addressed.
Remote Sens. 2021, 13(10), 2001; https://doi.org/10.3390/rs13102001
Submission received: 31 March 2021 / Revised: 1 May 2021 / Accepted: 13 May 2021 / Published: 20 May 2021

Abstract

:
During the summer of 2017, multiple huge fires occurred on Mount Vesuvius (Italy), dispersing a large quantity of ash in the surrounding area ensuing the burning of tens of hectares of Mediterranean scrub. The fires affected a very large area of the Vesuvius National Park and the smoke was driven by winds towards the city of Naples, causing daily peak values of particulate matter (PM) concentrations at ground level higher than the limit of the EU air quality directive. The smoke plume spreading over the area of Naples in this period was characterized by active (lidar) and passive (sun photometer) remote sensing as well as near-surface (optical particle counter) observational techniques. The measurements allowed us to follow both the PM variation at ground level and the vertical profile of fresh biomass burning aerosol as well as to analyze the optical and microphysical properties. The results evidenced the presence of a layer of fine mode aerosol with large mean values of optical depth (AOD > 0.25) and Ångstrom exponent (γ > 1.5) above the observational site. Moreover, the lidar ratio and aerosol linear depolarization obtained from the lidar observations were about 40 sr and 4%, respectively, consistent with the presence of biomass burning aerosol in the atmosphere.

Graphical Abstract

1. Introduction

Atmospheric aerosol content and composition are of particular interest, playing an important role in several areas, such as Earth’s radiative budget, air quality, human health, etc. [1,2,3]. Biomass burning injects smoke particles into the atmosphere whose properties change with time according to combustion phase, mixing phenomena and atmospheric conditions. For this reason, biomass burning is considered one of the main aerosol emission sources.
Biomass burning generates fine mode particles that are mainly composed of organic carbon, black carbon and inorganic particles [4,5] and whose chemical composition and optical properties depend on both the type of forest burned and environmental combustion conditions [6]. Aging processes lead to an evolution of the emitted particles that change their chemical, optical and microphysical properties.
In the last decade, biomass burning has been extensively studied, both at regional and global scales, with the aim of investigating the spatial and temporal variability of chemical, optical and microphysical properties of the particles injected into the atmosphere and the associated transport mechanisms [7,8,9,10,11,12]. Measurement campaigns for the characterization of biomass burning aerosols have been carried out worldwide by using different observational techniques and retrieval methods [13,14,15]. Previous studies have provided important information on optical and microphysical properties of aged and long-range transported smoke particles, whose features and vertical distribution are highly variable, changing with the aging process [5,16]. Instead, local real-time observations of fresh smoke aerosol are still scarce despite their importance [17,18,19,20].
The characterization of biomass burning aerosol optical and microphysical properties is particularly relevant in regions affected by numerous forest fires and biomass burning episodes, being very important sources of atmospheric pollution. This kind of analysis is critical in areas like the Mediterranean region where many events occur on an annual basis [21,22].
During the year 2017, multiple wildfire events affected several Mediterranean countries. In the Vesuvius National Park, in July 2017, a huge fire burned 88% of Mediterranean forest [23]. Following this event, large quantities of ash were injected into the environment and also dispersed in the atmosphere towards the metropolitan city of Naples. The experimental characterization of the produced fresh biomass burning aerosol was carried out at a short distance from the fire source by means of remote sensing and near-surface characterization methods. Model results were also used to visualize the aerosol spatial distribution and to define the source and transport path of the observed plume.

2. Materials and Methods

The present investigation was carried out at the Aerosol, Clouds and Trace Gases Research Infrastructure (ACTRIS) [24] National Facility (NF) located at the University of Naples “Federico II”.
Since 2000, in the European Aerosol Lidar Network (EARLINET) [25], the Naples observation station has included both passive and active remote sensing systems and near-surface instruments for the study of natural and anthropogenic aerosols related to local and long-range transport phenomena.
The station is equipped with a multiwavelength elastic/Raman lidar device—the Multi-wavelength Aerosol Lidar Apparatus (MALIA)—based on a pulsed Nd:YAG laser source emitting light pulses at wavelengths of 1064 nm, 532 nm and 355 nm, with a maximum pulse energy at each wavelength of 0.65 J, 0.15 J and 0.1 J, respectively, at a repetition rate of 20 Hz. The lidar receiver is a 30 cm Newtonian telescope with a focal length of 120 cm and allows for detecting both elastic signals and Raman echoes at 386 nm (N2), 607 nm (N2) and 407 nm (H2O) and aerosol depolarization measurements at 532 nm. MALIA is periodically calibrated for depolarization measurements through the technique proposed by Freudenthaler [26]. Data were acquired with a 1 min temporal resolution and 15 m vertical resolution.
Vertical profiles of the aerosol backscattering coefficient (βa(z)) at 355, 532 and 1064 nm were obtained from lidar observations both in the daytime and nighttime through retrieval by the Klett–Fernald algorithm [27,28] and Raman method [29], respectively.
The spectral dependence of the aerosol backscatter coefficient (the so-called backscatter-related Ångström exponent) [30] was also analyzed in order to obtain information on the variability of aerosol characteristics across the vertical profile, since such a parameter is size dependent (the larger its value, the smaller the particles).
Extinction coefficient profiles (αa(z)) at 386 nm measured during the night were retrieved following the procedure introduced by Ansmann [31]. The extinction to backscatter ratio, that is, the lidar ratio (LR), was obtained from simultaneous aerosol backscatter and extinction data. Moreover, calibrated particle linear depolarization profiles (δa(z)) were derived at 532 nm from the backscattered light components polarized along the direction perpendicular and parallel to the laser beam polarization, following the inversion procedure reported by Biele [32] and Freudenthaler. The LR and δa are both key parameters for the classification of the aerosol type as they depend on aerosol microphysical properties and geometry [33]. Besides these aerosol properties, a recently published method can also be used for aerosol typing [34].
Columnar aerosol properties were measured by a dual polarization and triple mode (sun, sky, lunar) photometer (CIMEL CE318TS-M), operative since April 2016 in the Aerosol Robotic Network (AERONET) [35]. The sun photometer provides direct solar irradiance measurements at 8 different wavelengths from UV to near IR (340, 380, 440, 500, 675, 870, 1020 and 1640 nm). Collected data are transferred to the AERONET processing system and successively calibrated and processed with inversion algorithms [36,37,38,39]. Level 2.0 cloud screened and quality assured data of aerosol optical depth (AOD) at the different wavelengths, inversion products and precipitable water are directly accessible to users on the AERONET website (aeronet.gsfc.nasa.gov (accessed on 1 February 2021)), after field calibration at the calibration facility.
Level 2.0 data of columnar AOD at 440 nm, Ångström exponent (γ) at 870/440 nm, volume particle size distribution dV(r)/dln(r) (µm3 µm−2) and single scattering albedo (SSA) were analyzed with the aim of studying possible changes in the aerosol optical and microphysical properties in the atmosphere in the period 10–17 July 2017. The relationship between AOD and γ parameters allowed us to discriminate different aerosol typologies along the atmospheric column on the basis of their different optical properties [40]. Moreover, aerosol coarse and fine mode fractions obtained from the AERONET spectral deconvolution algorithm [41] and their relative influence were also analyzed for a more reliable characterization.
Particulate matter (PM) at ground level was measured with an optical particle counter (OPC—dust monitor EDM164 Grimm). The device measures the PM10, PM2.5, PM1 mass concentrations at the surface in continuous mode, with the time resolution varying from 1 minute to 1 day, with an instrument accuracy of ±5% over the entire measurement range. PM data from the air quality monitoring network of the Campania region (ARPAC), readily accessible on the ARPAC website (www.arpacampania.it (accessed on 1 February 2021)), were also analyzed to study the correlation between data registered at different points around the measurement area. In particular, 7 sampling sites of the network located at key points of the city of Naples and around the Vesuvius volcano were selected for such an analysis. Moreover, PM collected at ground level when the fire was near the lidar station was analyzed by scanning electron microscopy with energy dispersive X-ray analysis (SEM-EDX) to gain information about particle morphology and atomic composition.
To take into account the air mass paths close to the surface as well as at higher altitudes, air mass back-trajectories were calculated at different altitude levels. Moreover, in order to identify the source region and spatial distribution of the observed aerosol plumes, Navy Aerosol Analysis and Prediction System (NAAPS) model results and satellite images were also exploited. The back-trajectory analysis was based on the HYSPLIT dispersion model developed by the NOAA Air Resources Laboratory (ARL) and is available on the AERONET website (https://aeronet.gsfc.nasa.gov (accessed on 1 February 2021)). Back-trajectory analysis was also supported by the NMMB/BSC-Dust daily forecasts of dust concentration profiles provided by the Barcelona Supercomputing Center (http://www.bsc.es/ess/bsc-dust-daily forecast/ (accessed on 1 February 2021)) to assess possible influences of Saharan dust contributions in the atmospheric column. In the examined period, we also considered wind speed and direction measured at Capodichino Airport by the meteorological station of the Italian Air Navigation Service Provider (ENAV).
Finally, active fire derived from satellite observations by the MODIS and VIIRS instruments and reported by the NASA Fire Information for Resource Management System (FIRMS) (https://firms.modaps.eosdis.nasa.gov (accessed on 1 February 2021)) allowed us to identify the location, extent and intensity of wildfire activity.

3. Results and Discussion

3.1. The Measurement Aera

The Naples NF is located in the west part of the city of Naples (40.838°N, 14.183°E, 118 m a.s.l.) in the center of the Mediterranean basin. Mount Vesuvius is located about 18 km away in the east direction and the Astroni Natural WWF Reserve is just 2.5 km away in the northwest direction from the Naples NF (Figure 1).
The city of Naples overlooks the sea and is affected by the circulation of the sea breeze that develops during the day, favored by the surrounding area orography. The measurement area is characterized by a very high aerosol content of both natural (desert dust, sea salt) and anthropogenic (combustion, industrial activity, vehicular traffic) origin. In particular, Saharan sand transport events are very frequent in Naples, whereas biomass burning aerosol coming from fires is generally related to isolated events occurring mainly in summer.
Due to the complexity of the aerosol content in this area, its characterization during particularly high turbidity episodes is very useful. In this respect, co-location of remote sensing and near-surface instruments provides a promising approach for the study of the optical and microphysical properties of the aerosol layers that develop in the atmosphere and to follow their evolution in space and time.

3.2. The Period 10–19 July 2017

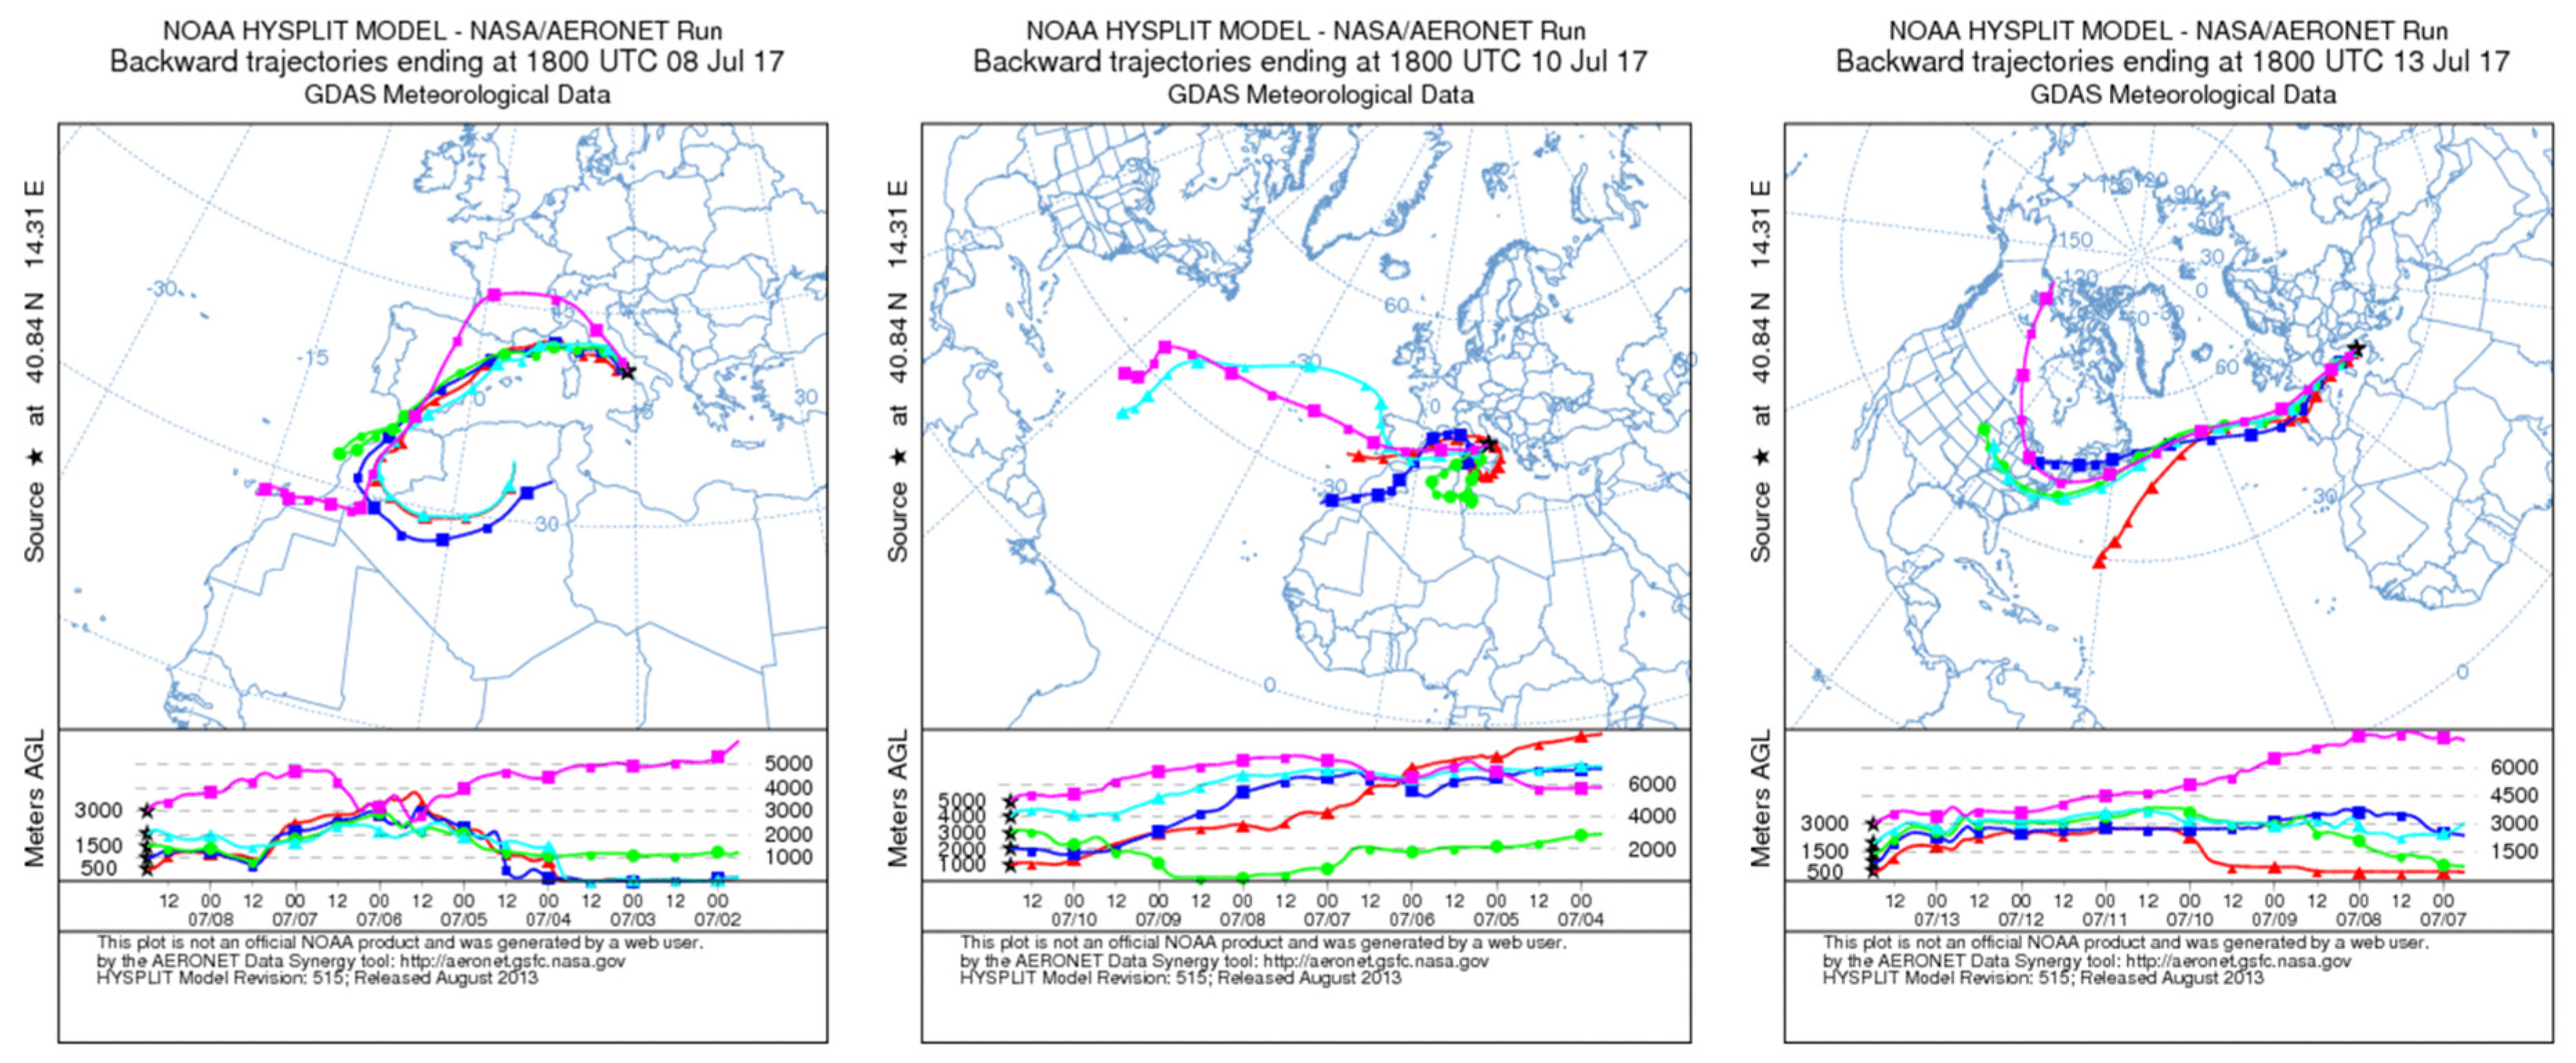
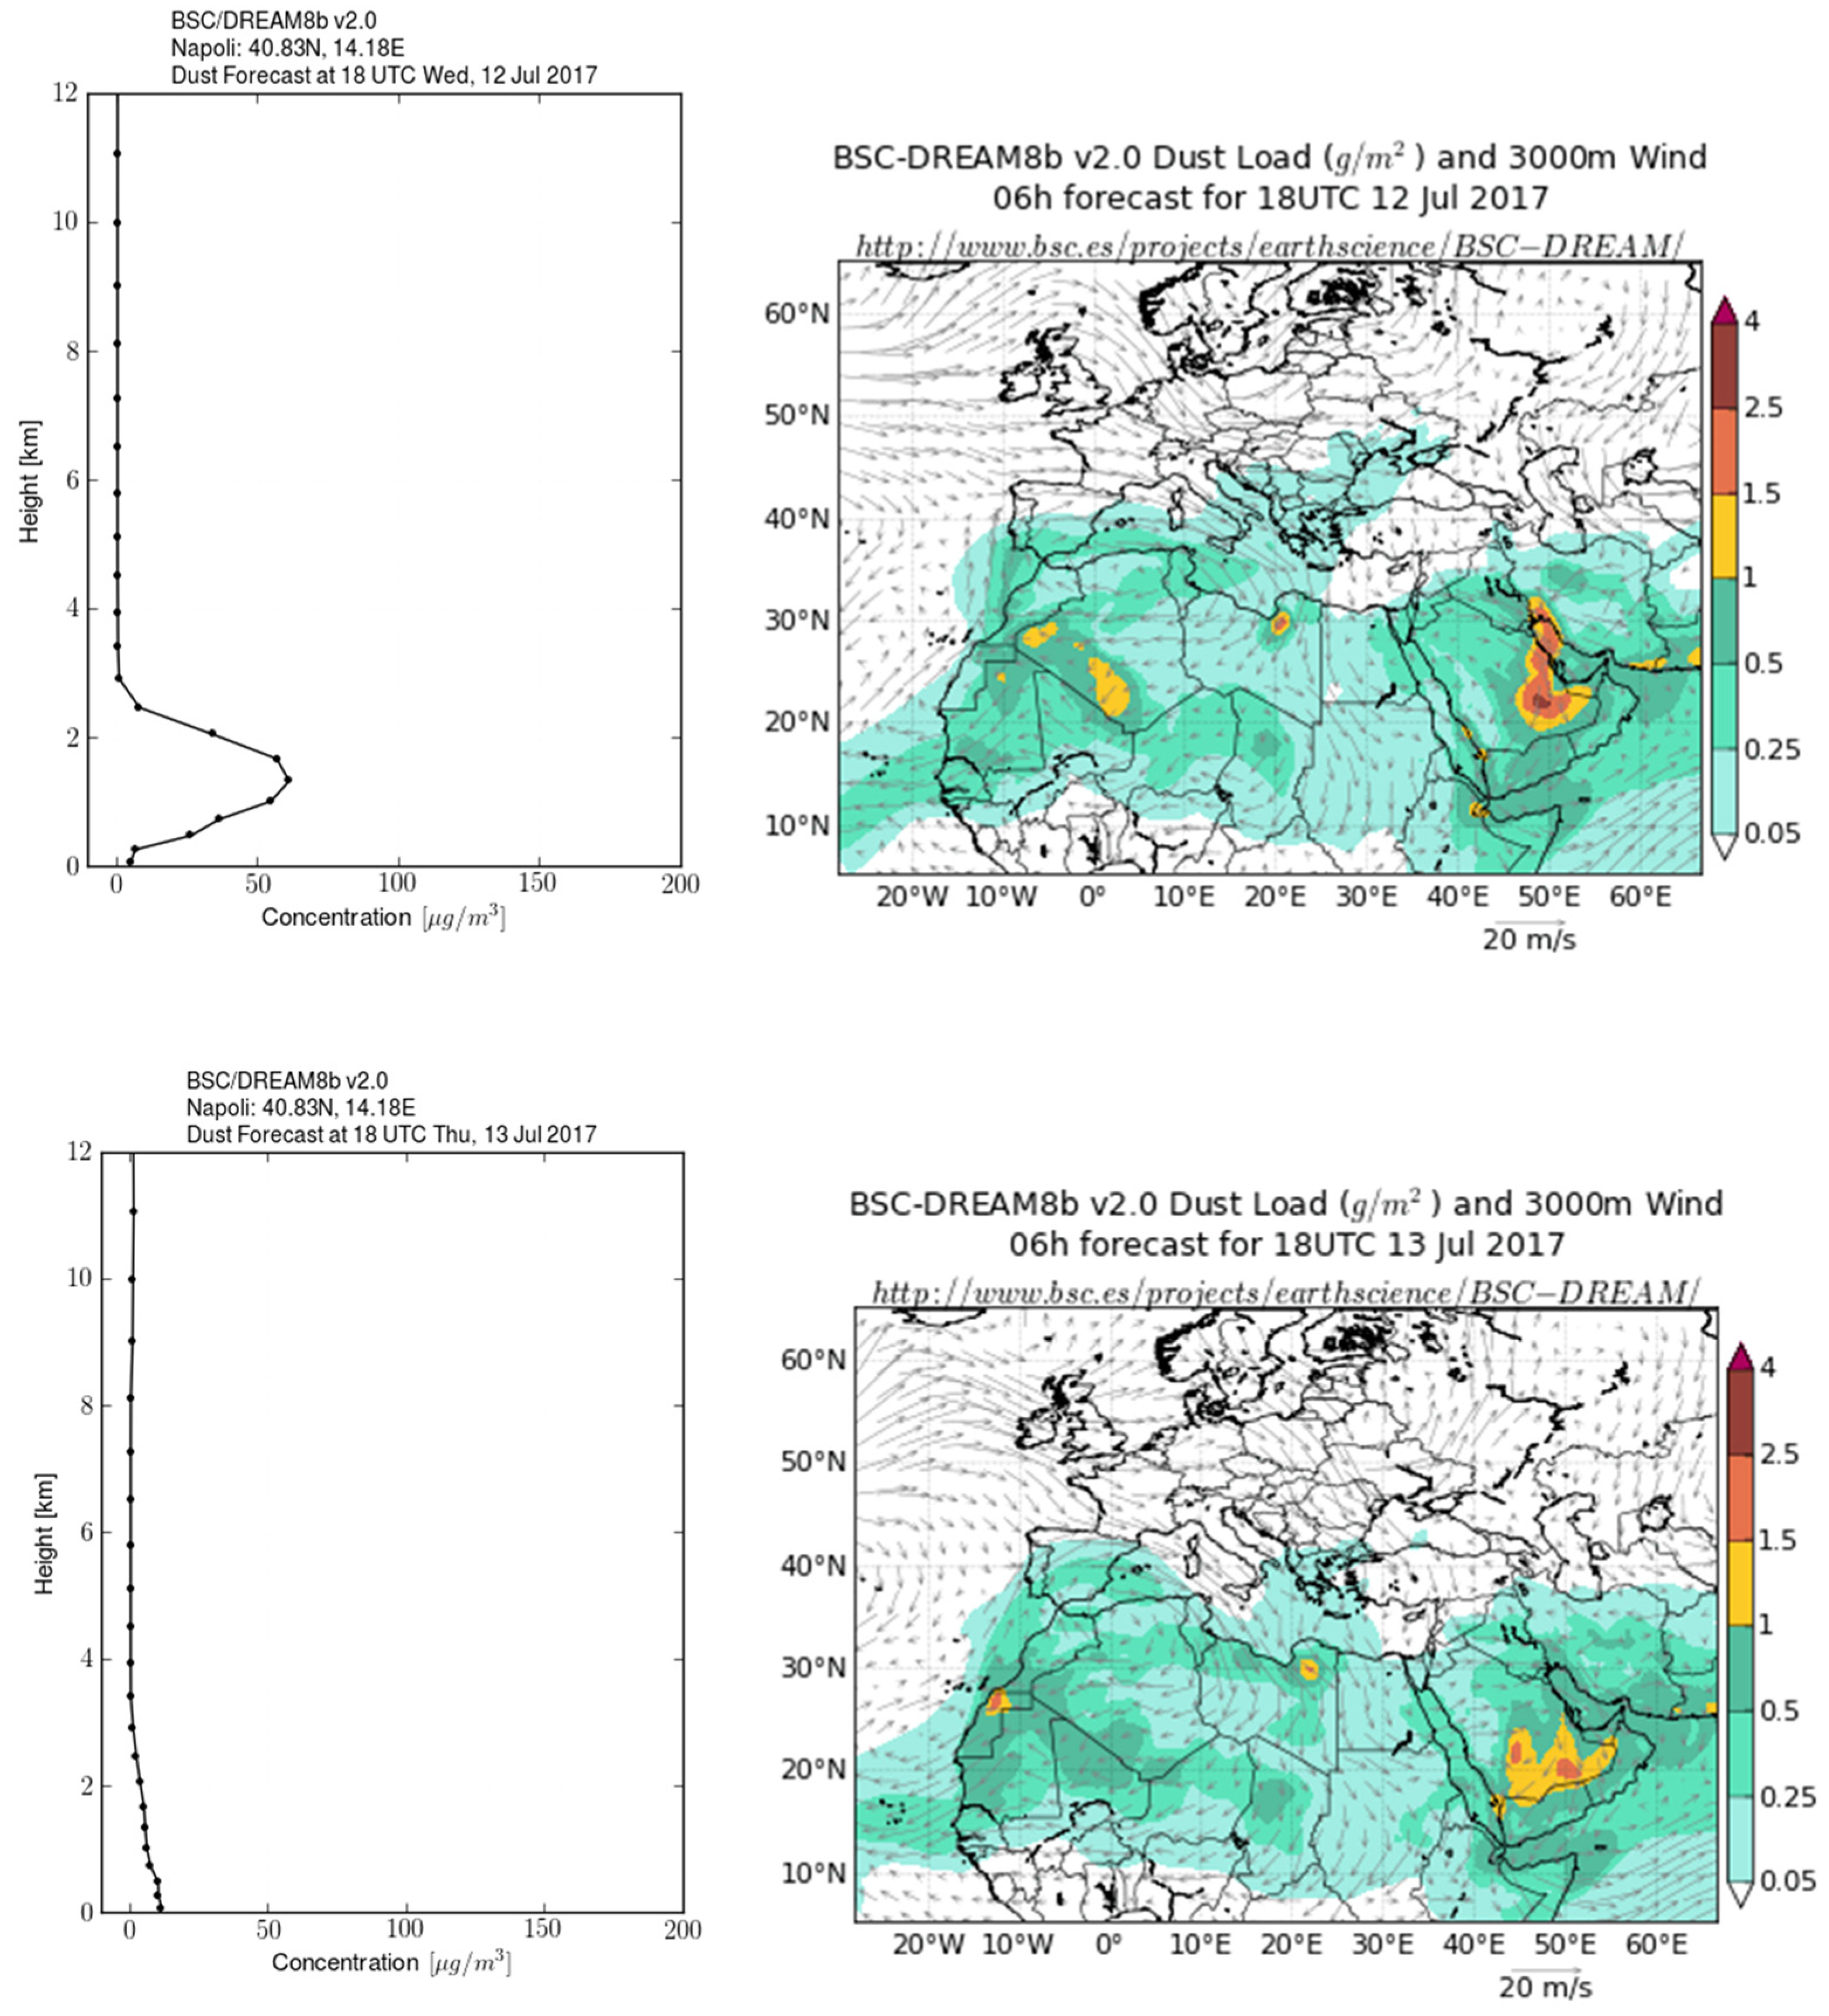
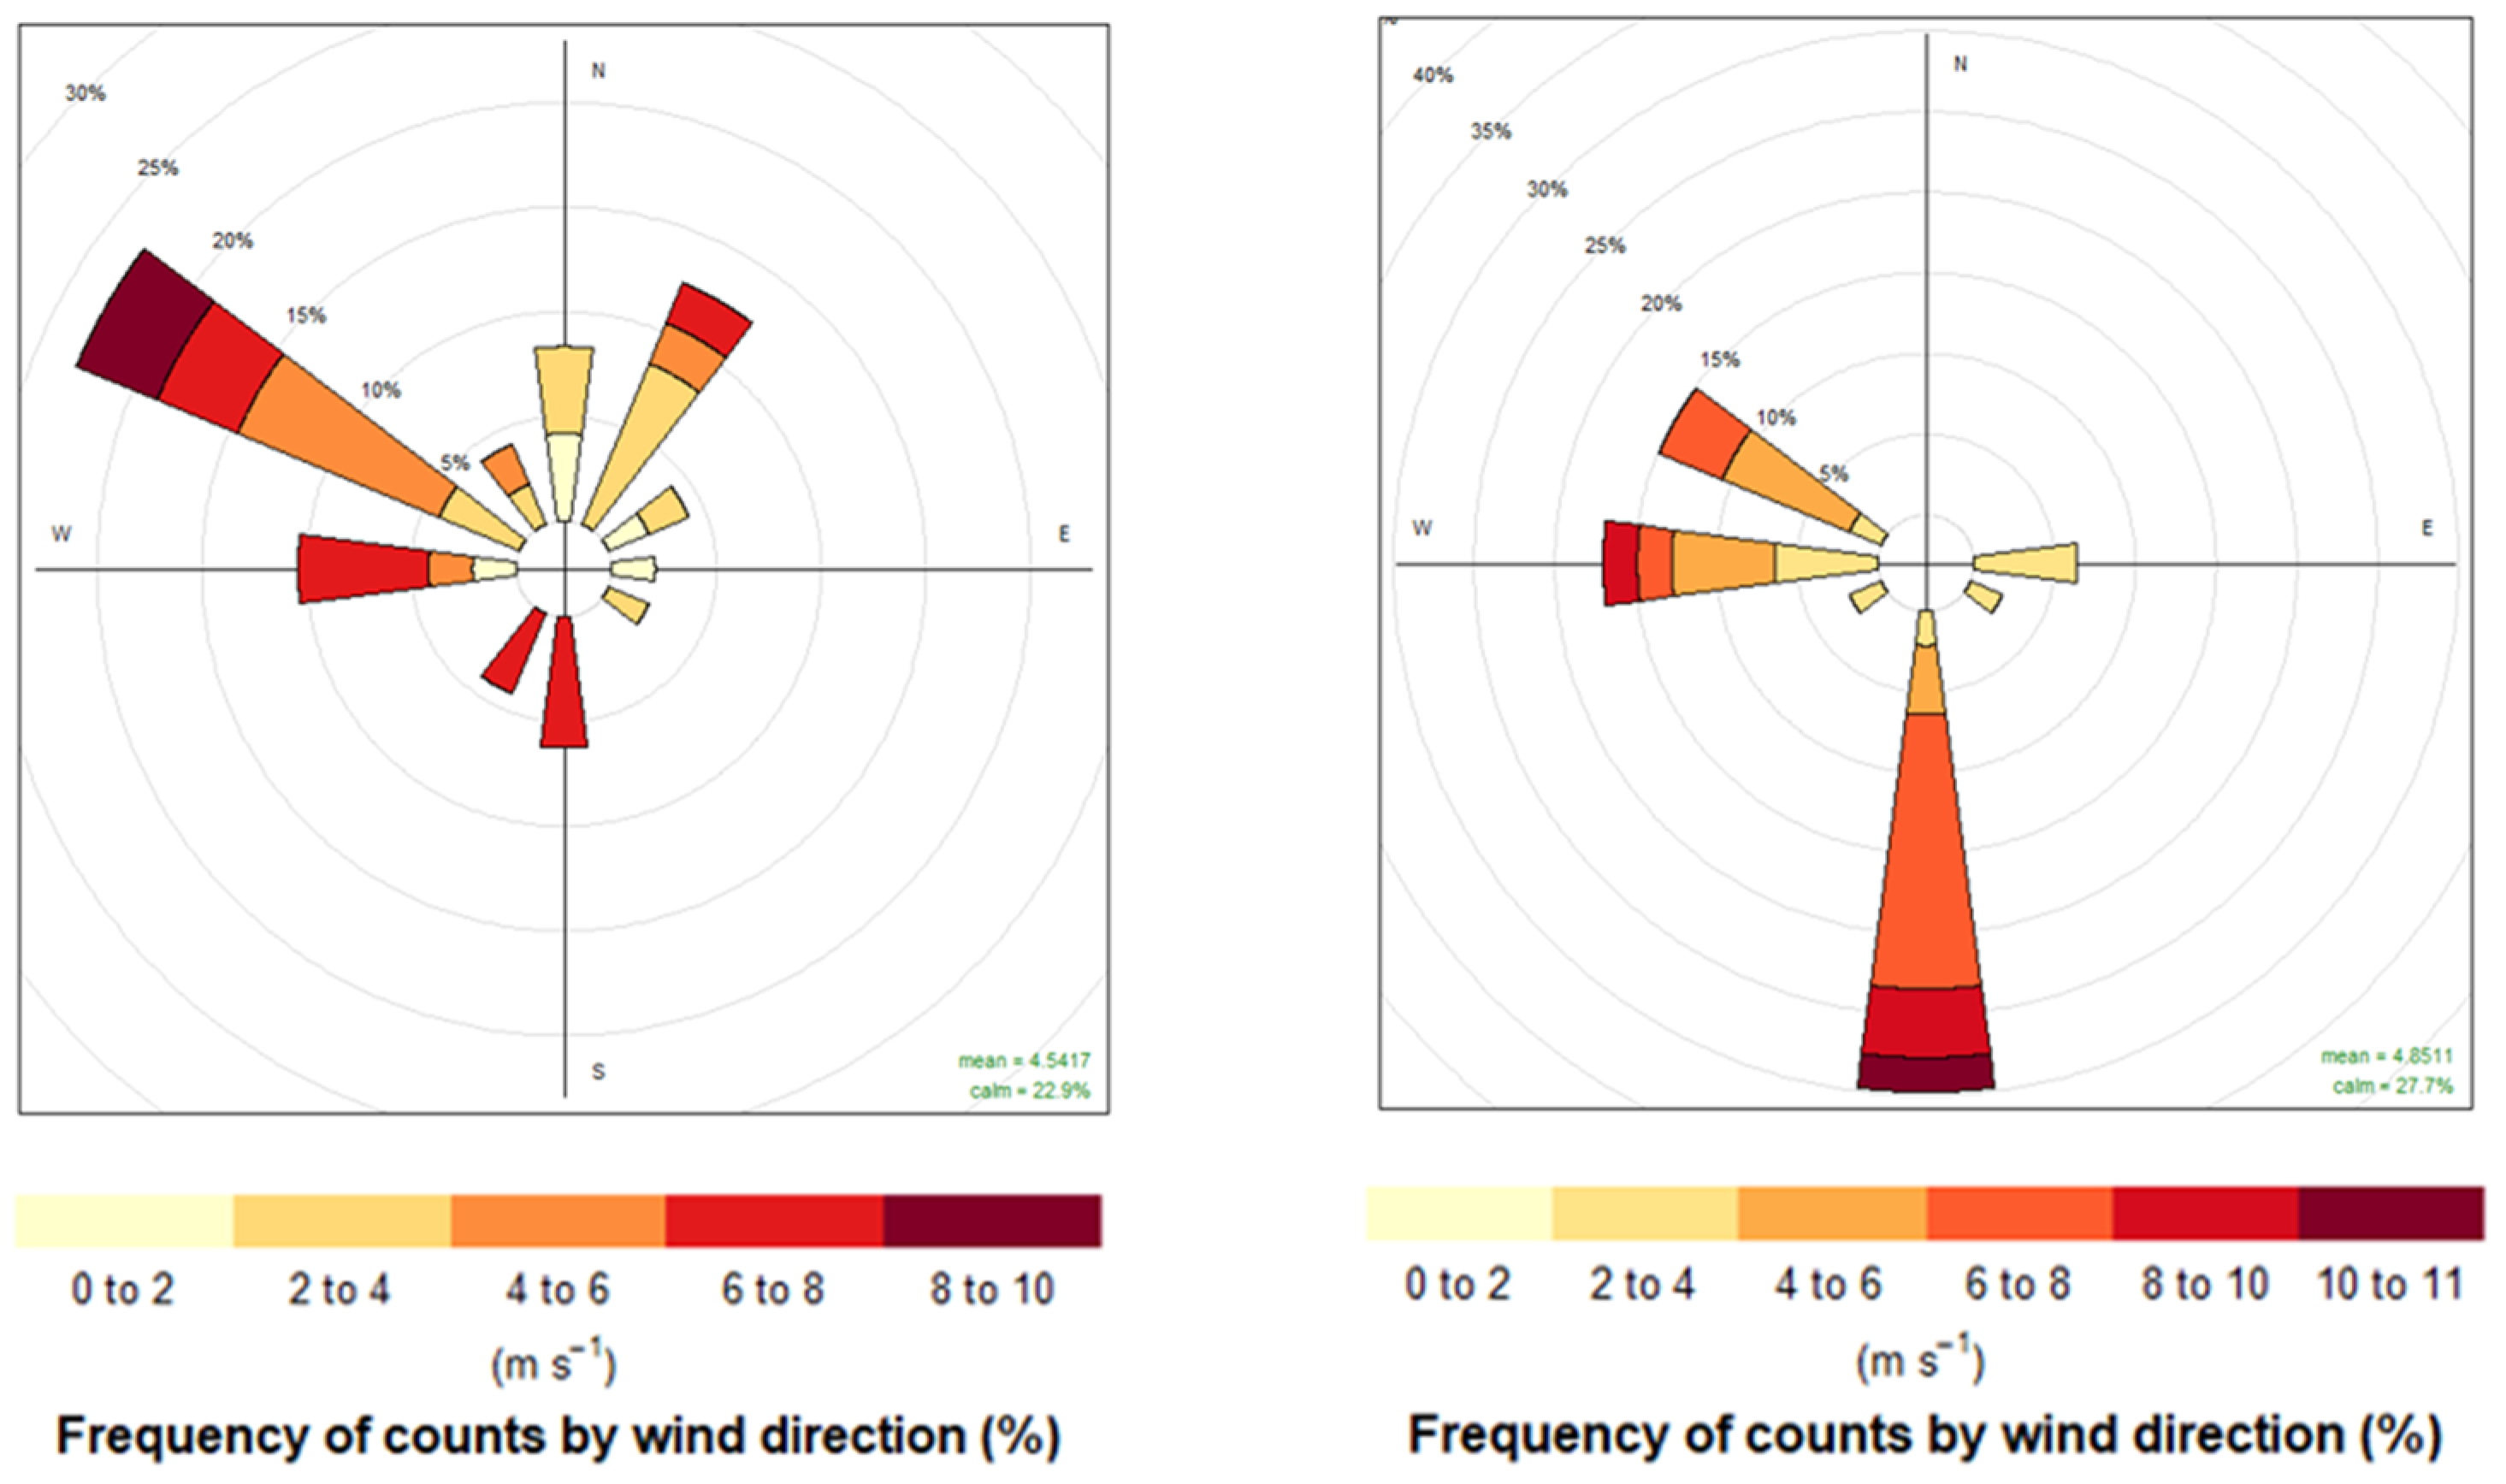
During the period 10–19 July 2017, the area surrounding the city of Naples was affected by a strong Saharan dust event characterized by dust plume intrusion in the planetary boundary layer (PBL) that influenced the local atmospheric aerosol distribution and its properties. According to air mass back-trajectories, based on the HYSPLIT dispersion model (Figure 2) and NMMB/BSC-Dust daily forecast outcomes (Figure 3), the dust event lasted from 8 to 12 July. In the last day of the dust event, the area of the Vesuvius National Park was affected by a very large fire that caused significant damage to the forest on all sides of the volcano. The biomass burning aerosols were blown by wind toward the northwest direction, especially on 12–13 July and (Figure 4) when the wind speed reached values as high as 10 m/s.
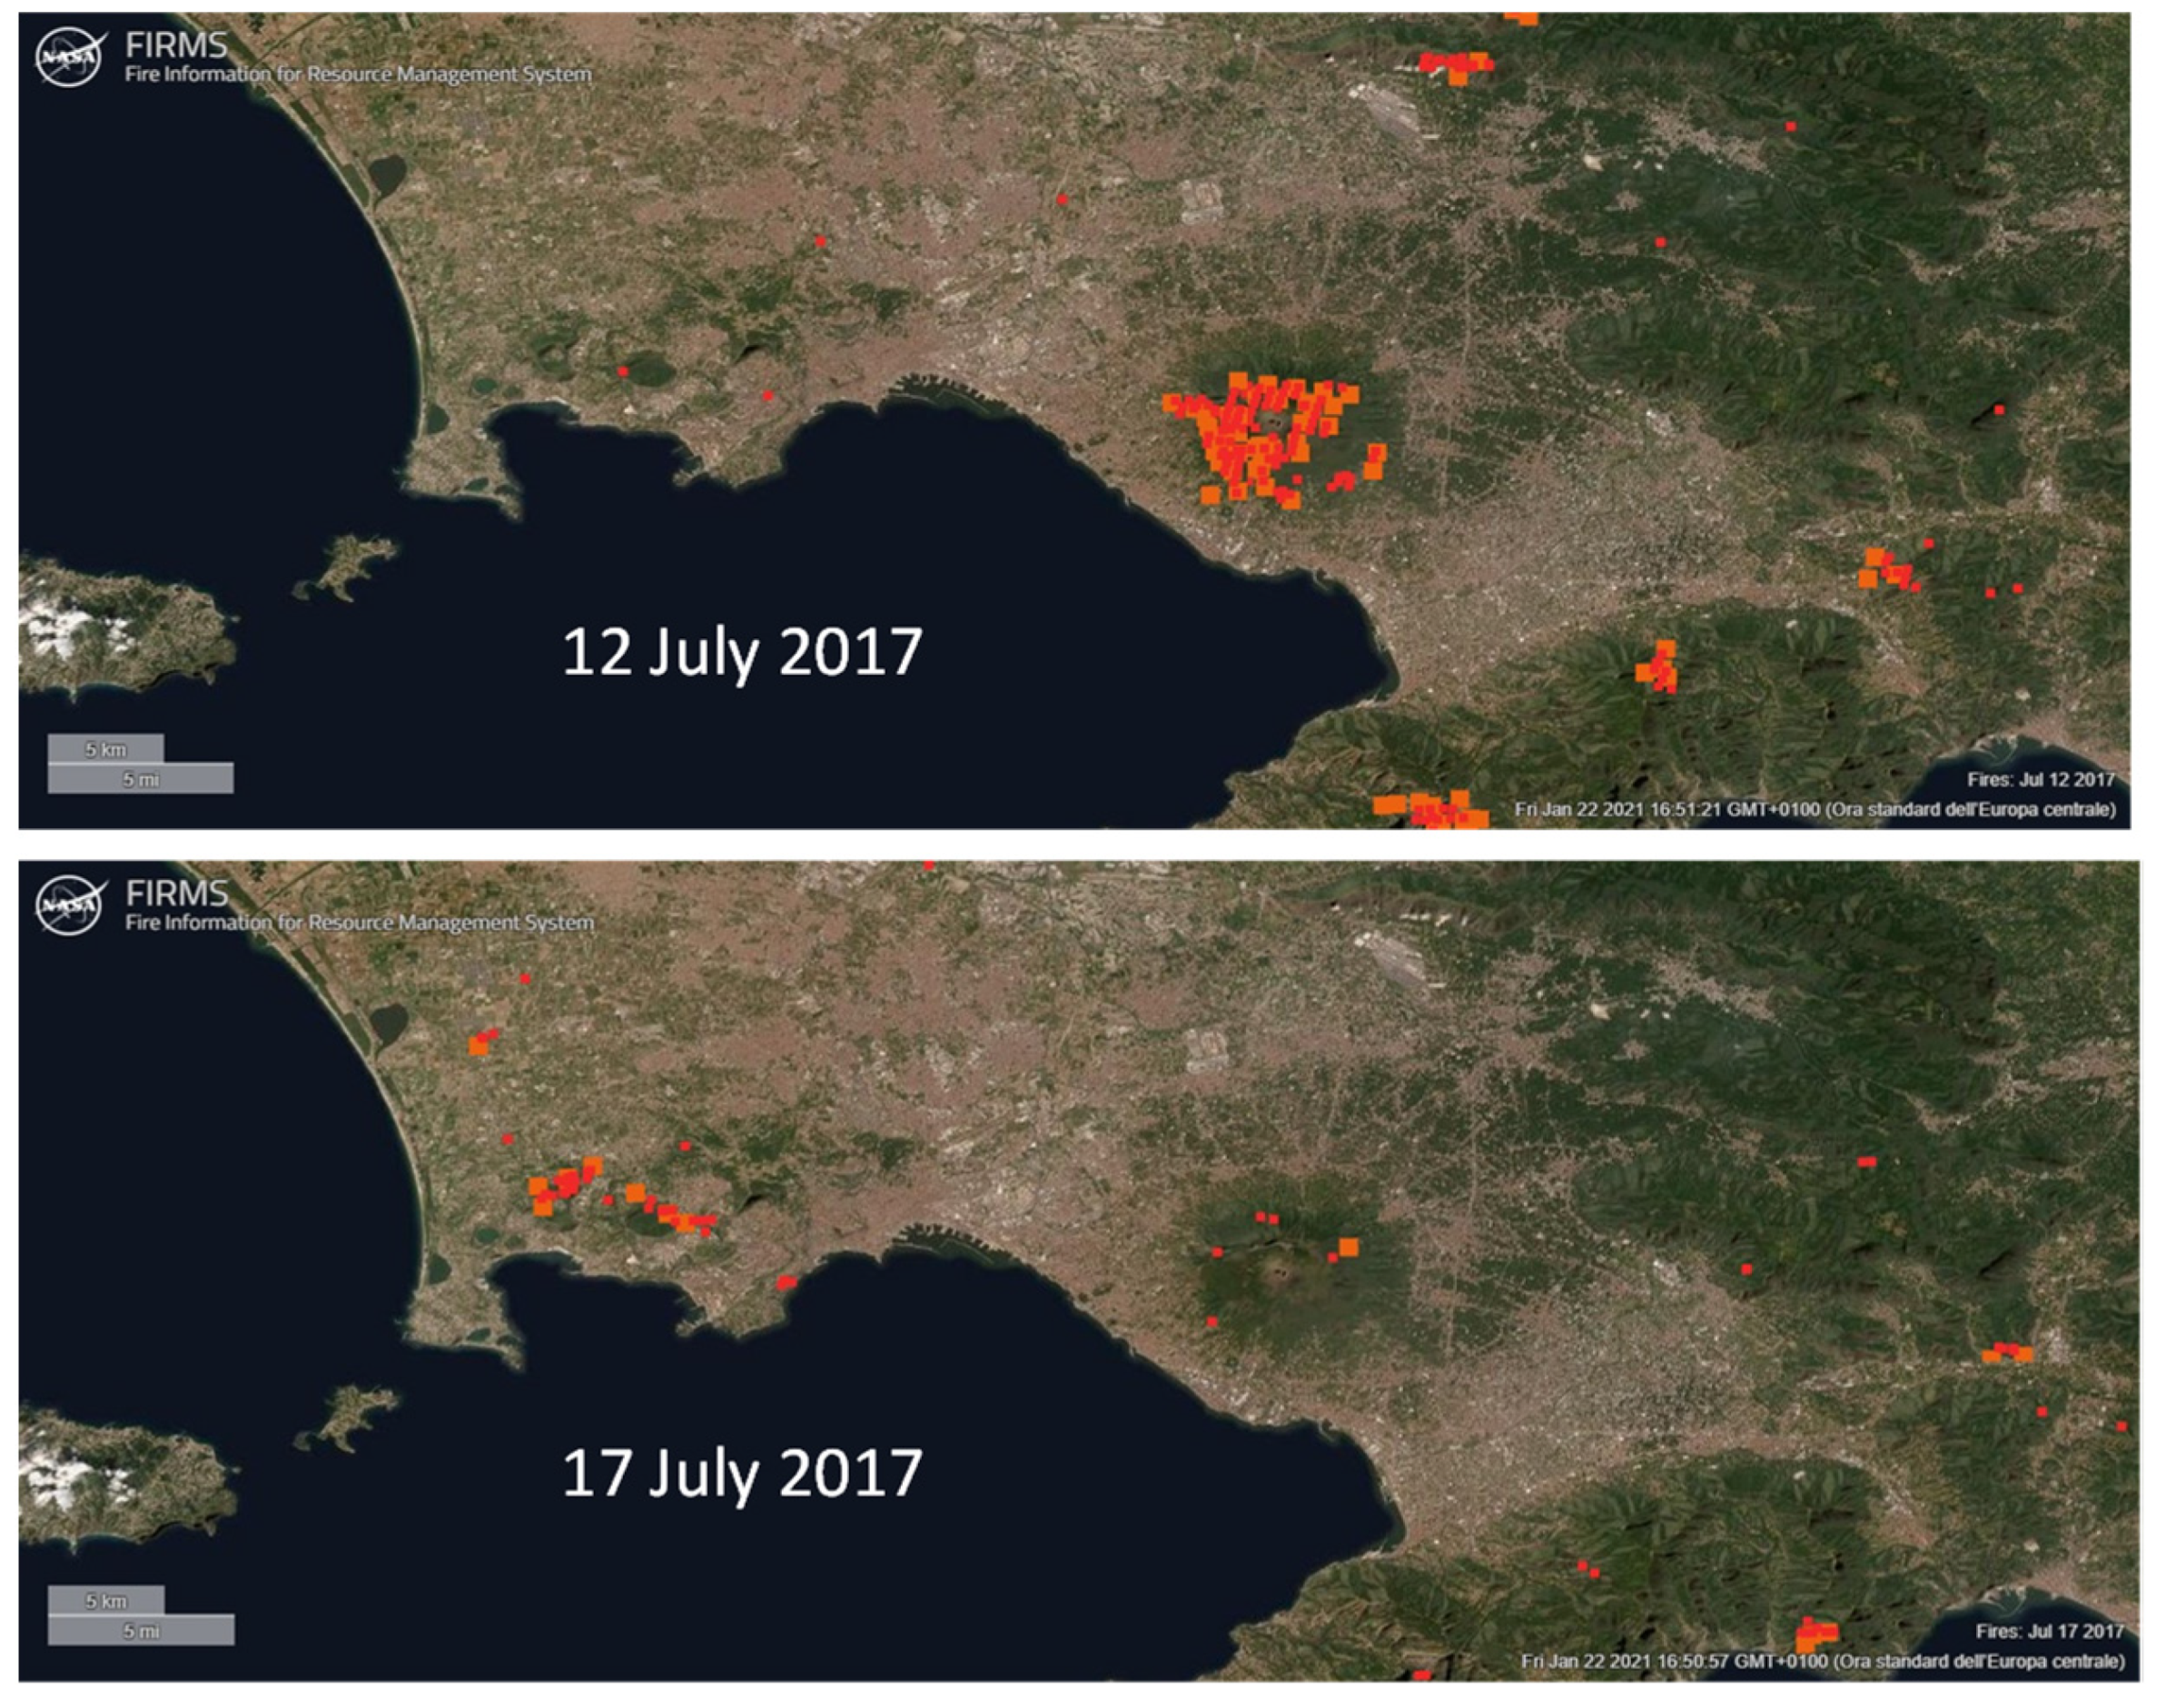
In the same period, on 17 July, the fire also affected the Astroni Natural WWF Reserve located very close to the measurement area. The images of the active fire derived from satellite observations corresponding to 12 July and 17 July 2017 are reported in Figure 5. These local episodes were characterized by high atmospheric turbidity and a strong impact on PM at ground level that reached daily peak values above the limit established by the European Directive (2008/EC/50), which for PM10 sets two limiting values for human health protection: the daily mean value should not exceed 50 µg m−3 more than 35 times per year and the annual mean value should not exceed 40 µg m−3 (http://data.europa.eu/eli/dir/2008/50/2015-09-18 (accessed on 1 February 2021)).

3.2.1. PM Mass Surface Concentrations

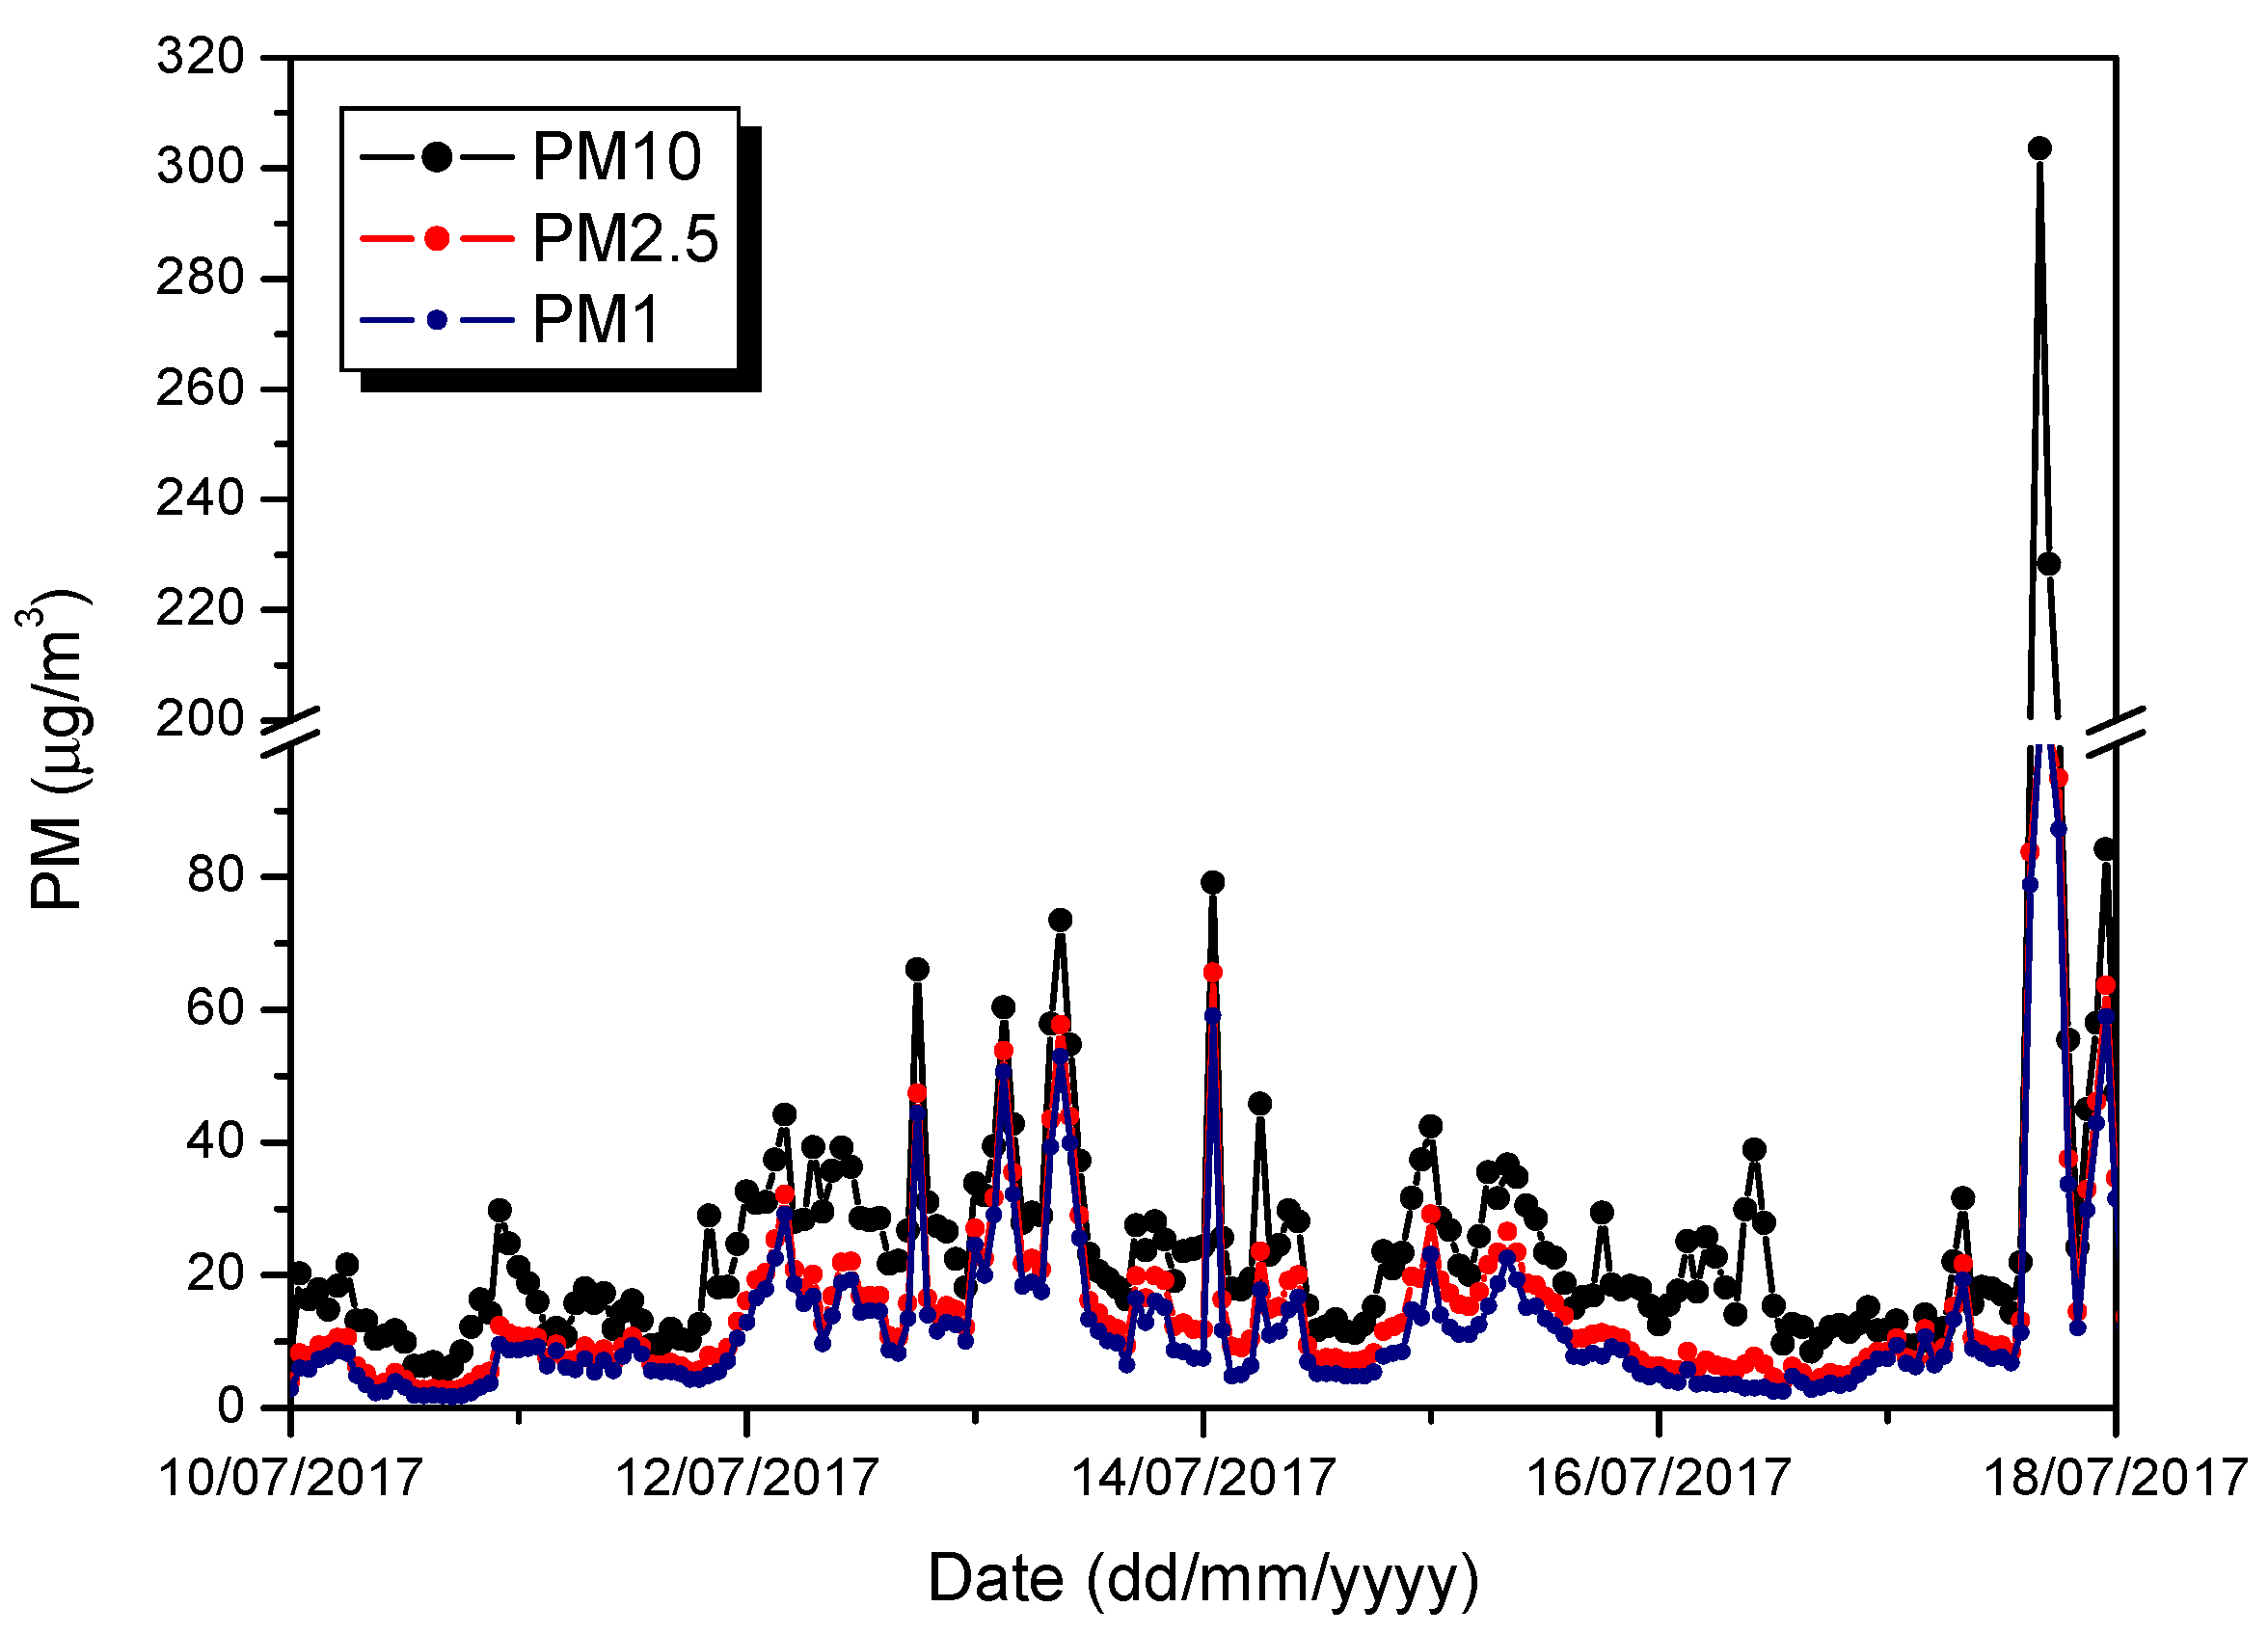
The mass concentration of PM10, PM2.5, PM1 fractions was measured in Naples at ground level with a 1-minute temporal resolution. Figure 6 reports the temporal variation of daily average PM mass concentration, evidencing an increase in its value in the period 12–15 of July related to the Vesuvius forest fires as well as a very high peak value on 17 July due to the fire at the Astroni Natural WWF Reserve.
In the observational period, daily mean values of the mass concentration in the range 5–303 µg m−3 for PM10, 3–194 µg m−3 for PM2.5 and 2–181 µg m−3 for PM1 were registered; larger values were measured on 13 July and 17 July when the smoke events were more intense. During these two days, a PM2.5/PM10 ratio of about 0.7 highlighted a larger contribution of fine particles at the source. Table 1 summarizes the values of daily mass concentration for the different PM fractions as well as the PM2.5/PM10 ratio. In the table, the mean standard deviation is reported as data uncertainty.
The high concentration measured by the OPC evidences an interesting phenomenon concerning the whole area over Naples, as highlighted by PM10 and PM2.5 data collected by the ARPAC air quality monitoring network. In particular, we focused on seven sampling sites of the network (Acerra Caporale, Acerra Industriale, Casoria, Pozzuoli, Osservatorio Astronomico, Pellegrini, Portici) located at key points of the metropolitan area of Naples and around the Vesuvius volcano. All the ARPAC monitoring sites are equipped with instruments for continuous and automatic measurements of PM10 and PM2.5 concentrations on a daily or hourly basis, except for the Pellegrini sampling site that is equipped for monitoring only PM10. We examined the data measured during July 2017. We noted that for all the sampling stations and for both PM10 and PM2.5, the higher concentration values were measured in the period 10–19 July 2017. In particular, we calculated a concentration percentage increase that varied from 82% to 158% for PM10 and from 99% to 308% for PM2.5. This indicated a large presence of particulate matter at ground level in the examined period and a prevalence of the finer matter. At the Pozzuoli sampling station, which was the furthest station from the Vesuvius fires but the closest to the Astroni fires, concentration peaks were measured in the days of greatest activity of the Astroni fire.
A comparative analysis between PM10 and PM2.5 concentrations measured by ARPAC sampling stations and OPC was carried out by means of a bivariate statistical procedure [42]. This analysis evidences the following statistical correlation between the measured data: for the Astronomico sampling station ρ(PM10 − OPC) = 0.5, with N = 10 and p = 14%; for the Portici sampling station ρ(PM2.5 − OPC) = 0.8, with N = 10 and p = 0.5%, where N is the number of samples, ρ the Pearson correlation coefficient and p the statistical significance. The higher correlation with the Portici sampling station located close the Vesuvius area highlights the wide extension of the observed phenomenon that affected the whole Naples area.

3.2.2. Columnar Aerosol Properties

Further useful information on the atmospheric particle characteristics is gained from columnar properties of the aerosol optical depth (AOD) and Ångstrom exponent (γ) provided by sun photometer data. AERONET’s highest quality data (level 2.0—cloud screened and quality assured) of AOD at 440 nm, also expressed in total, fine and coarse modes fractions [41], and γ for the 440/870 nm range were considered. Figure 7 reports the daily variation in the AOD at 440 nm, for total, fine and coarse modes fractions, derived from AERONET spectral deconvolution algorithm (SDA) retrieval. From Figure 7, a larger contribution of particles in the fine fraction is observed during the examined period. Conversely, according to Saharan dust transport events over the measurement area, a greater content of coarse mode particulates in the atmospheric column was observed only on 10 July. It is worth underlining that the photometer is located at the Center for Metrological and Technological Services of the University of Naples “Federico II” (CeSMA—40.837°N, 14.307°E, 50 m a.s.l.) in the east side of the city; for this reason, it did not immediately measure an increment in the columnar AOD on 17 July during the Astroni fire event but only in the following days (not shown) when the wind blew from west to east.
In the analyzed period, AOD values ranged from 0.07 to 0.78 while γ values varied from 0.45 to 1.95. Larger daily mean values of AOD (>0.25) were measured from 12 July, during the Vesuvius fire events. Moreover, in the days affected by the fires the 440/870 γ exponent showed values larger than 1.5 that are suggestive of the presence of fine mode aerosol throughout the atmospheric column and typical for particles arising from smoke and fires. AOD daily values were perfectly consistent with Navy Aerosol Analysis and Prediction System (NAAPS) Global Aerosol Model results (not shown) that highlight AOD values in the range 0.1–0.4 in the same period.
Moreover, we also considered the AOD and γ parameters in order to characterize biomass burning aerosol. In fact, such an analysis allowed for distinguishing between different aerosol types since the AOD is proportional to the total column loading of absorbing and scattering particles, whereas γ is directly linked to aerosol size, increasing as the particle size decreases [43].
Figure 8 reports the data corresponding to the fire events as warm-colored circles (12–15 July), meanwhile, data corresponding to the remaining days of the examined period are displayed as cool-colored circles (July 10th, 11th, 16th and 17th). The data of Figure 8 clearly illustrate the larger AOD and γ exponent values corresponding to days affected by biomass burning aerosol. The values are in good agreement with the findings of Burgos et al. (2018) [44], who reported AOD and γ threshold values of 0.18 and 1.5, respectively, during biomass burning episodes in the Mediterranean area.
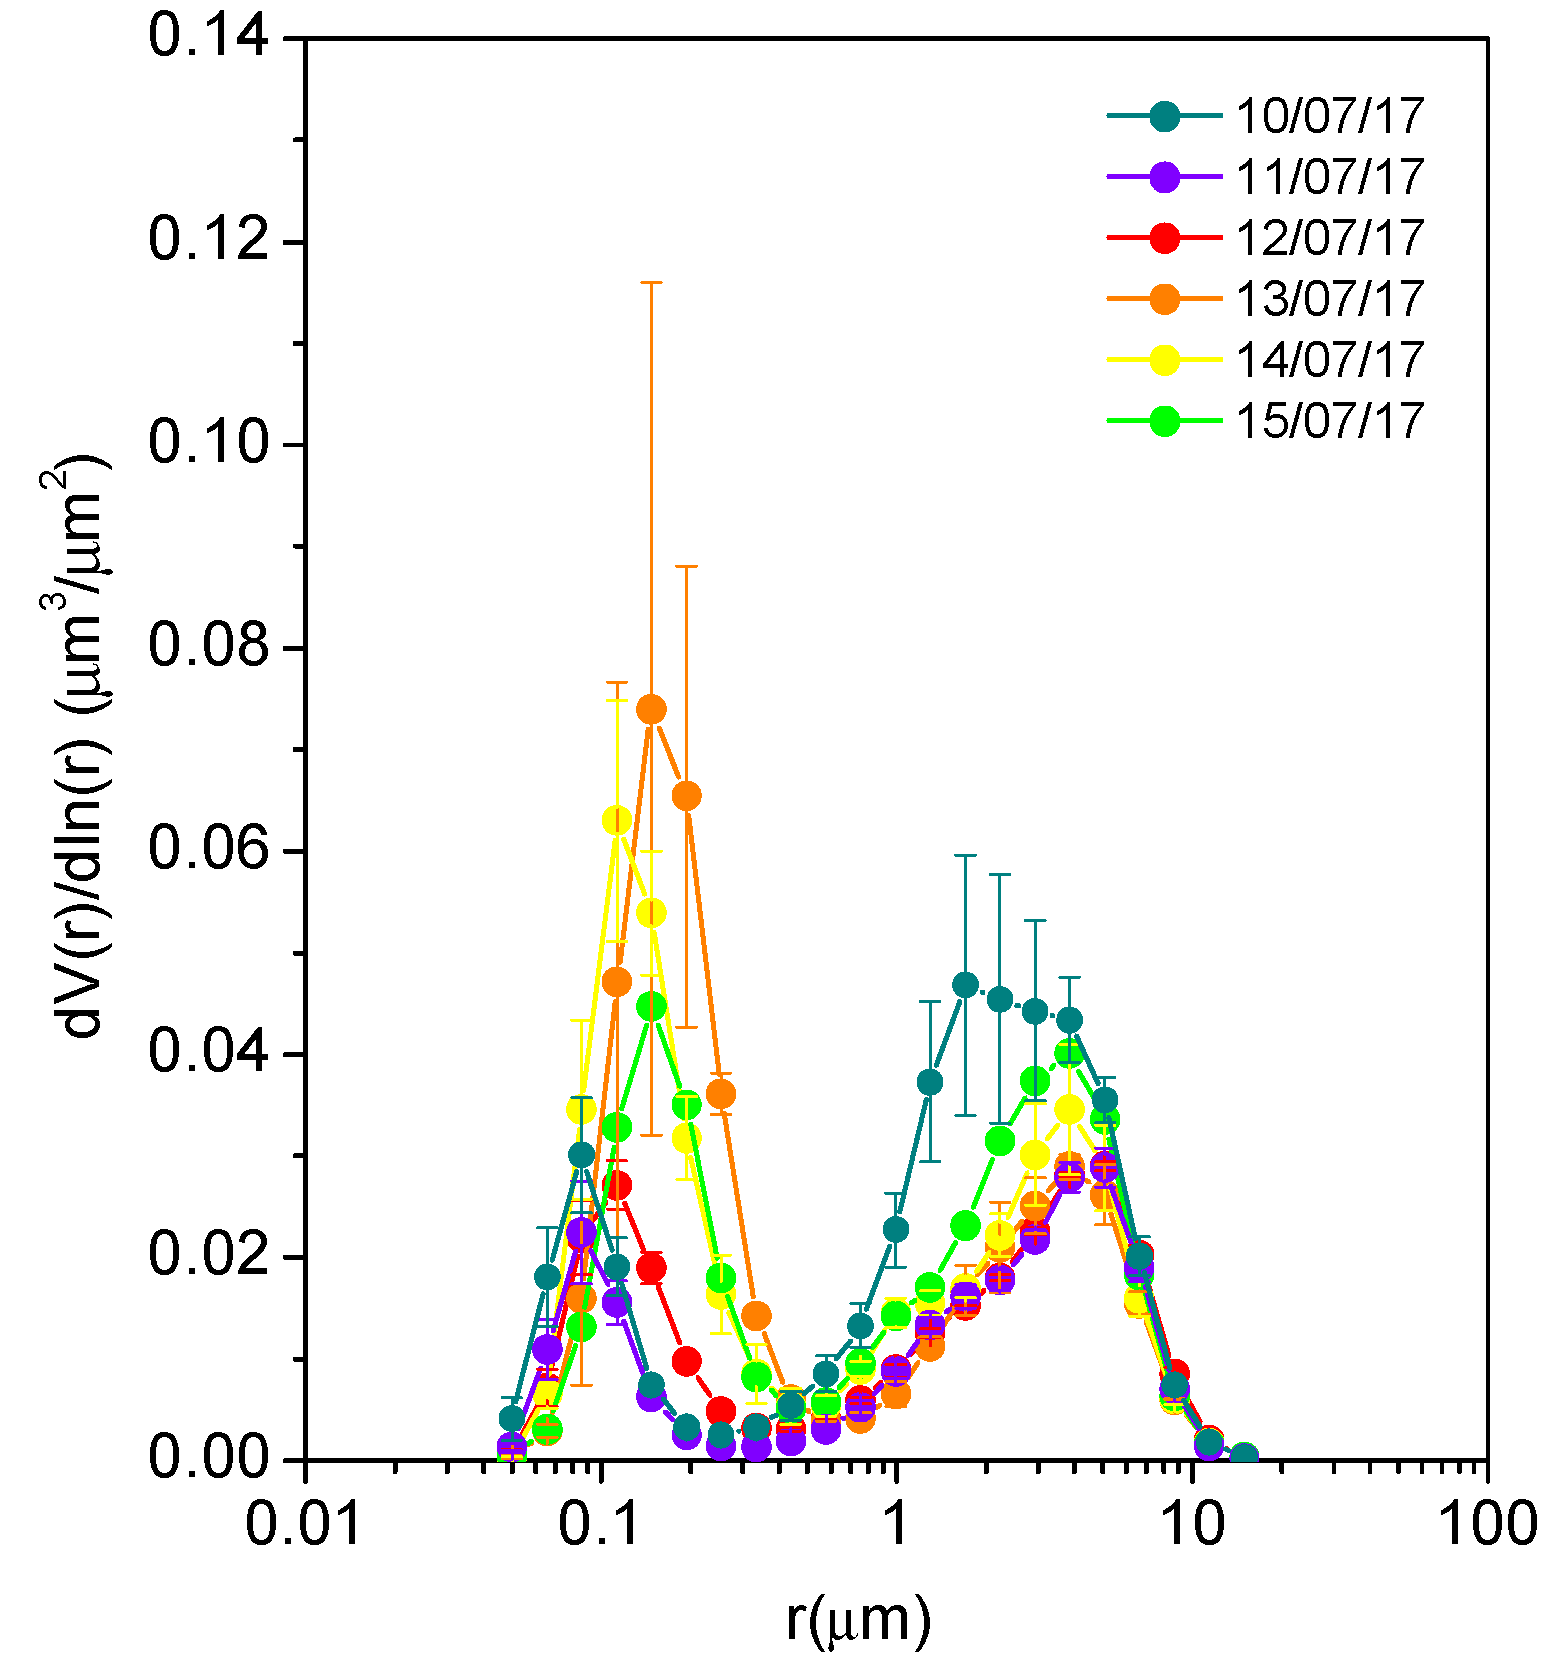
Volume particle size distribution dV(r)/dln(r) derived from the AERONET hybrid inversion data procedure were also analyzed to highlight any difference in the aerosol composition. A representative particle size distribution was obtained by averaging over 24 hours the different size distributions obtained during the day. Figure 9 reports the columnar size distributions dV(r)/dln(r) for the period 10–15 of July; data for 16 and 17 of July are missing. The error bars of the data points in Figure 9 represent the uncertainty calculated as the mean standard deviation. This analysis highlights an interesting variation of the atmospheric aerosol composition during the days affected by fire events, showing a reduction in coarse mode aerosol components together with a larger predominance of fine particulates. According to Saharan dust transport events, a larger contribution of coarse mode fraction aerosol was present on 10 July, whereas on 12 July, a fine aerosol contribution was added to a similar content of coarse mode aerosol due to Saharan dust mixing with biomass burning aerosol. It is worth noticing the shift and increase in the peak value of the fine mode components for 13–15 July as a consequence of the arrival of biomass burning aerosols in the measurement area.
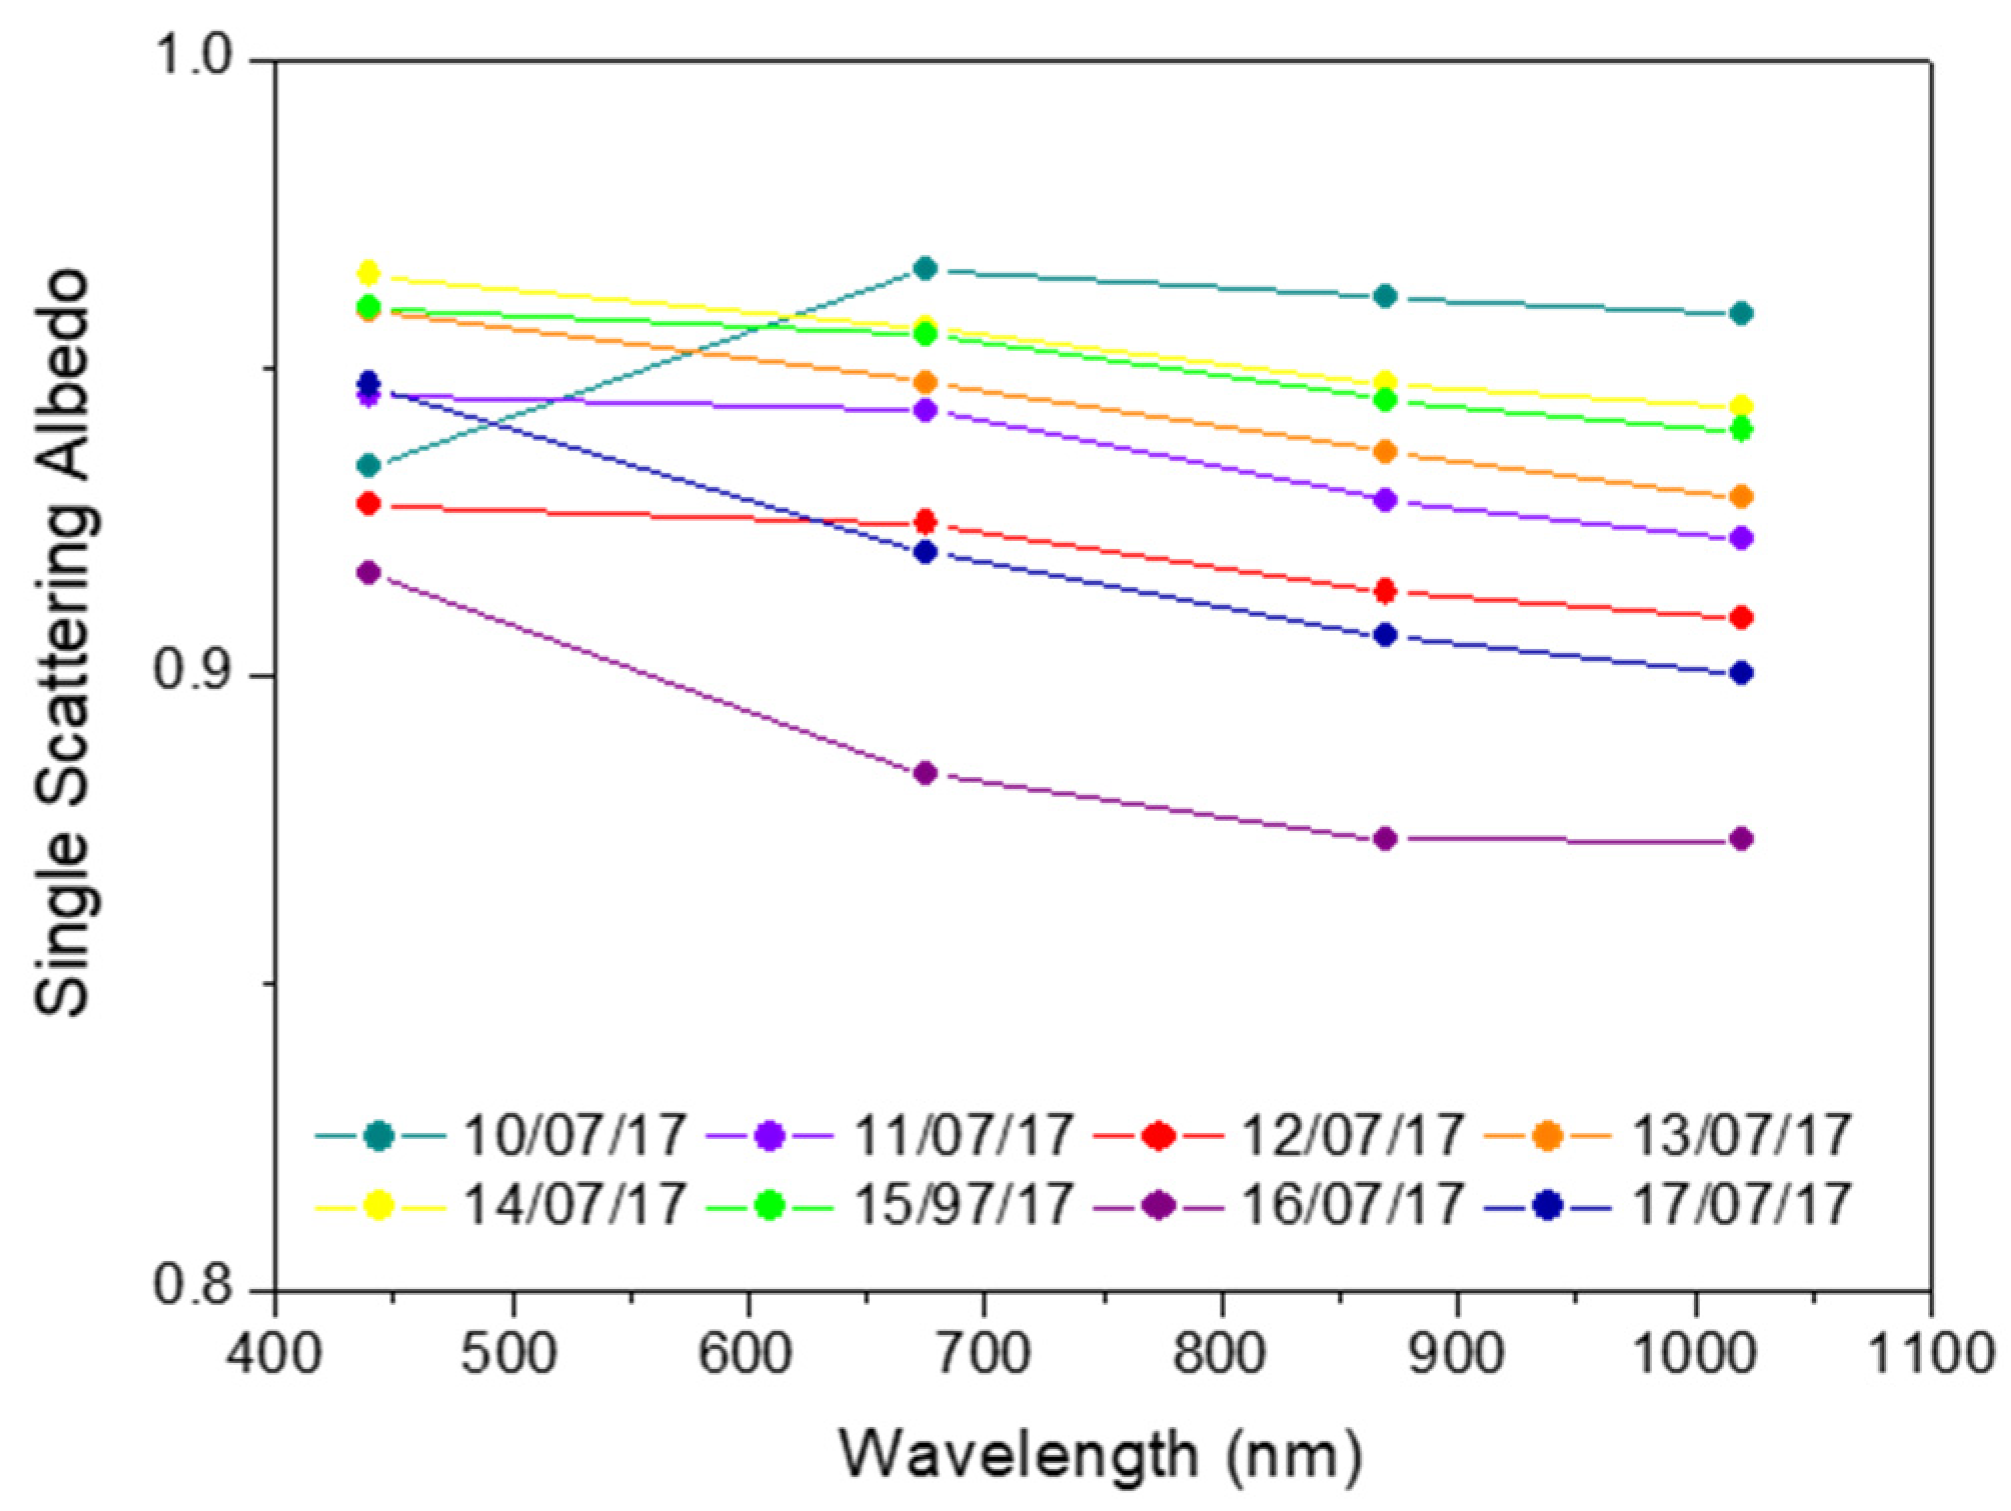
SSA derived by AERONET hybrid inversion data allows for studying aerosol absorption properties, which for biomass burning aerosol depend on fire intensity and different combustion phases [37]. Moreover, differences in absorption can be also correlated to ambient temperature and relative humidity as well as to particle composition and aging [45]. Figure 10 reports the SSA spectral variation in the observational period 10–17 July 2017. Due to desert dust contributions throughout the atmospheric column, an increment in the SSA value is observed, going from 440 nm to 670 nm on 10th of July (from 0.93± 0.03 to 0.97 ± 0.01), whereas a constant behavior occurs on 11th and 12th of July (SSA ~ 0.94 and 092, respectively). Conversely, a decreasing spectral dependence of the SSA is observed from the 13 of July, in agreement with a prevalence of fine particles due to fire episodes.
Moreover, data show that the SSA value varies with time and, for fine particles related to fire, the SSA increases with time according to age and less absorbing smoke aerosol in the atmosphere. Finally, the highest absorption of urban–industrial aerosol in the atmosphere (lower SSA) was observed on 16 July, when the fire was extinguished and the wind blew in the direction away from the measurement area.
The daily mean values of the AOD, γ and SSA corresponding to the analyzed period are reported in Table 2.

3.2.3. Lidar Remote Sensing Measurements

Vertically resolved lidar measurements carried out at Naples NF allowed for studying and characterizing the aerosol dispersed in the atmosphere just after the beginning of the fires as well as following its spatial and temporal evolution. Vertical profiles of the aerosol optical properties also allowed for discriminating dust from biomass burning aerosol layers.
We report the results of measurements performed on 10 and 13 of July, comparing properties of the aerosol layer due to dust (10 July) and fire events (13 July). We also report measurements carried out on 17 of July when the fire event damaged the Astroni Natural WWF Reserve, at a distance of only 2.5 km from the NF.
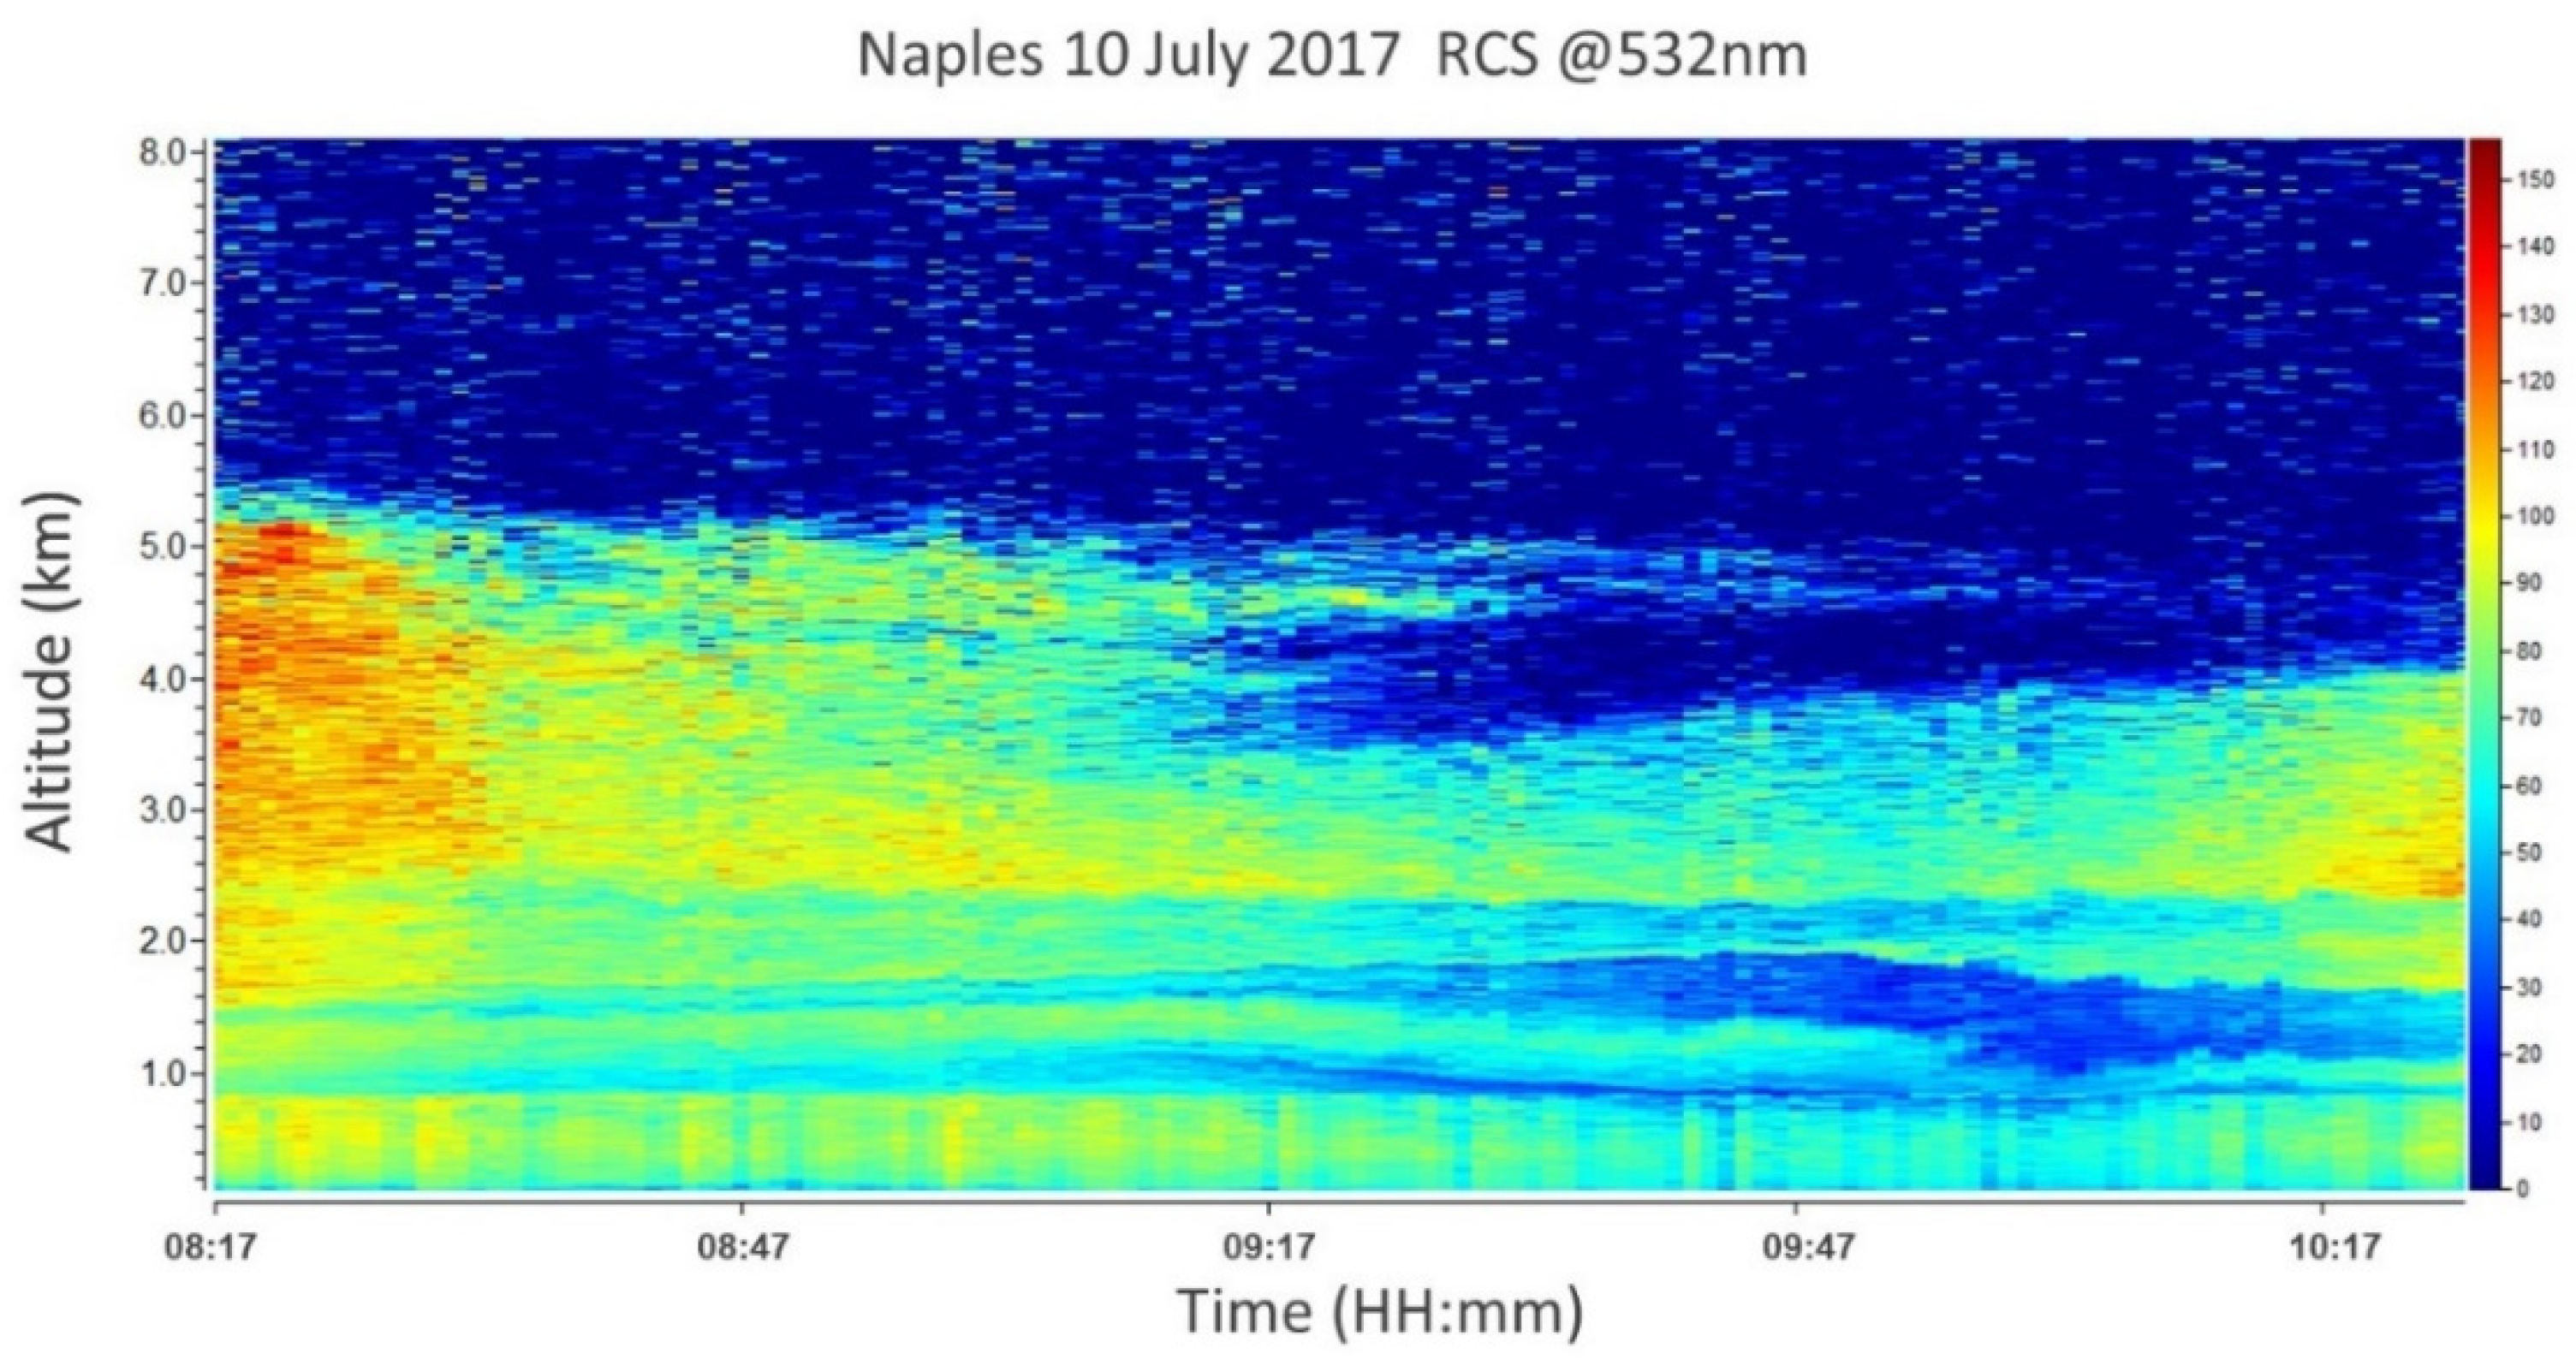
On 10 July 2017 the city of Naples was affected by a Saharan dust transport event that carried aerosol at altitudes between 2 and 5 km. Diurnal lidar observations were performed from 08:17 to 10:26 UTC, while Raman measurements were carried out from 17:10 UTC. Figure 11 shows the time variability of the range-corrected lidar signal (RCS) measured at 532 nm; data refer to diurnal observations and are reported with a spatial and temporal resolution of 15 m and 60 s, respectively. Figure 11 highlights an aerosol stratification in the atmosphere due to Saharan dust according to air mass back-trajectories and dust daily forecasts. The dust layer progressively declines with time, reaching a stable condition and extending between 2 and 4 km of altitude at a later time. The optical properties of such an aerosol layer were characterized by the elastic/Raman measurements described hereafter.
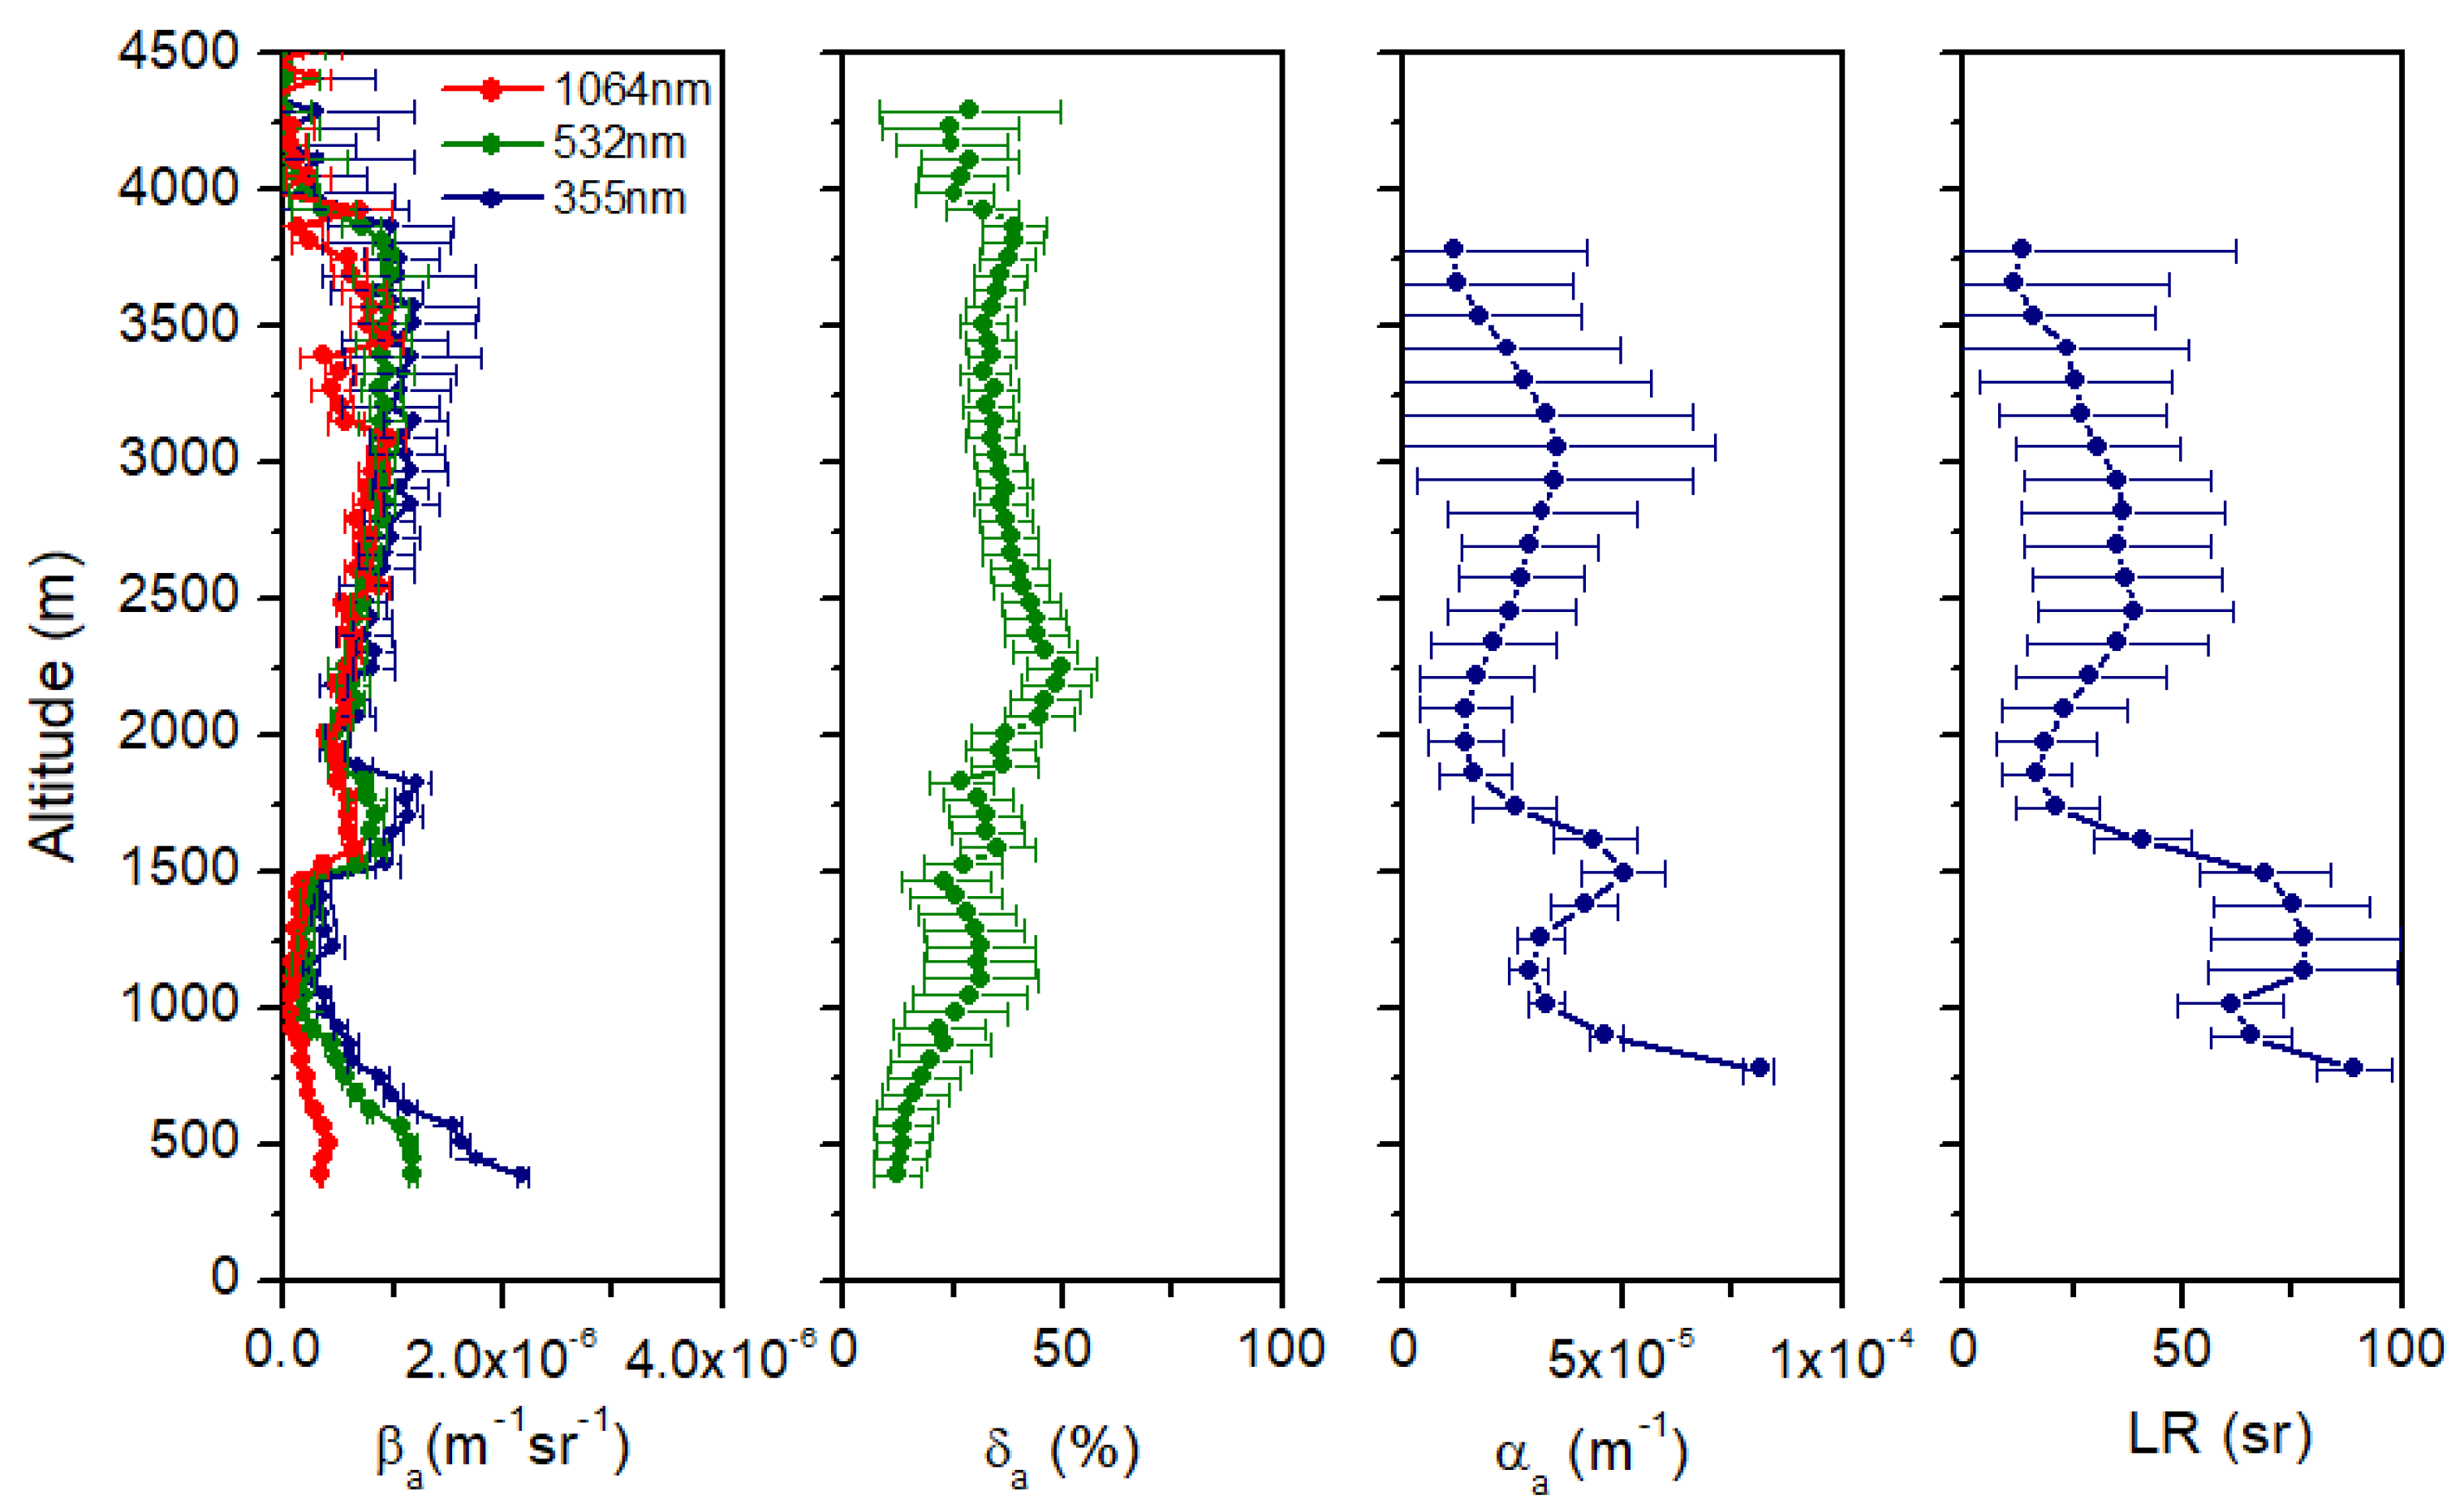
Elastic/Raman lidar observations were carried out on 10 July from 17:10 to 17:40 UTC, allowing a measurement of the βa, αa, δa and LR vertical profiles, as reported in Figure 12. The spatial resolution is 60 m for βa and δa and 120 m for αa and LR.
Lidar profiles show local anthropogenic aerosol below 1.5 kilometers, characterized by a calibrated δa mean value at 532 nm of (22 ± 7)% and an LR of (73 ± 9) sr at 355 nm. Moreover, at altitudes between 2 and 4 km, a more depolarizing layer is present, showing δa = (37 ± 7)% and LR = (28 ± 9) sr. According to the air mass back-trajectories reported in Figure 2, this layer contains dust-derived aspherical particles.
In conjunction with the Saharan dust event, on 12 July 2017, the Naples measurement area was affected by a huge fire on Mount Vesuvius. Large quantities of ash were injected into the atmosphere and successively dispersed toward the city of Naples. Biomass burning aerosol was mixed in the atmosphere with Saharan dust, generating a complex atmospheric stratification.
Figure 13 displays the time variability of the RCS measured at 532 nm that highlights a complex layering below 3 km of altitude related to both forest fire and Saharan dust aerosols. Vertical lidar profiles of βa and δa allowed us to discriminate the two aerosol components. The βa and δa profiles derived from diurnal observations carried out from 13:16 to 13:46 UTC are reported in Figure 14. The spatial resolution is 60 m. The calibrated δa mean value at 532 nm was (8 ± 1)% in the layer below 1.1 km and (16 ± 2)% at altitudes ranging from 1.1 to about 2.8 km. Moreover, averaged values of the backscatter-related Ångstrom exponent (wavelength pair 532/1064 nm) inside each layer were (1.18 ± 0.03) and (0.92 ± 0.05), respectively. These values suggest a predominance of fine mode biomass burning aerosol located below 1.1 km, whereas larger and more depolarizing aerosols related to dust transport are mainly confined between 1.1 km and 3.0 km, in agreement with model predictions (see Figure 3).
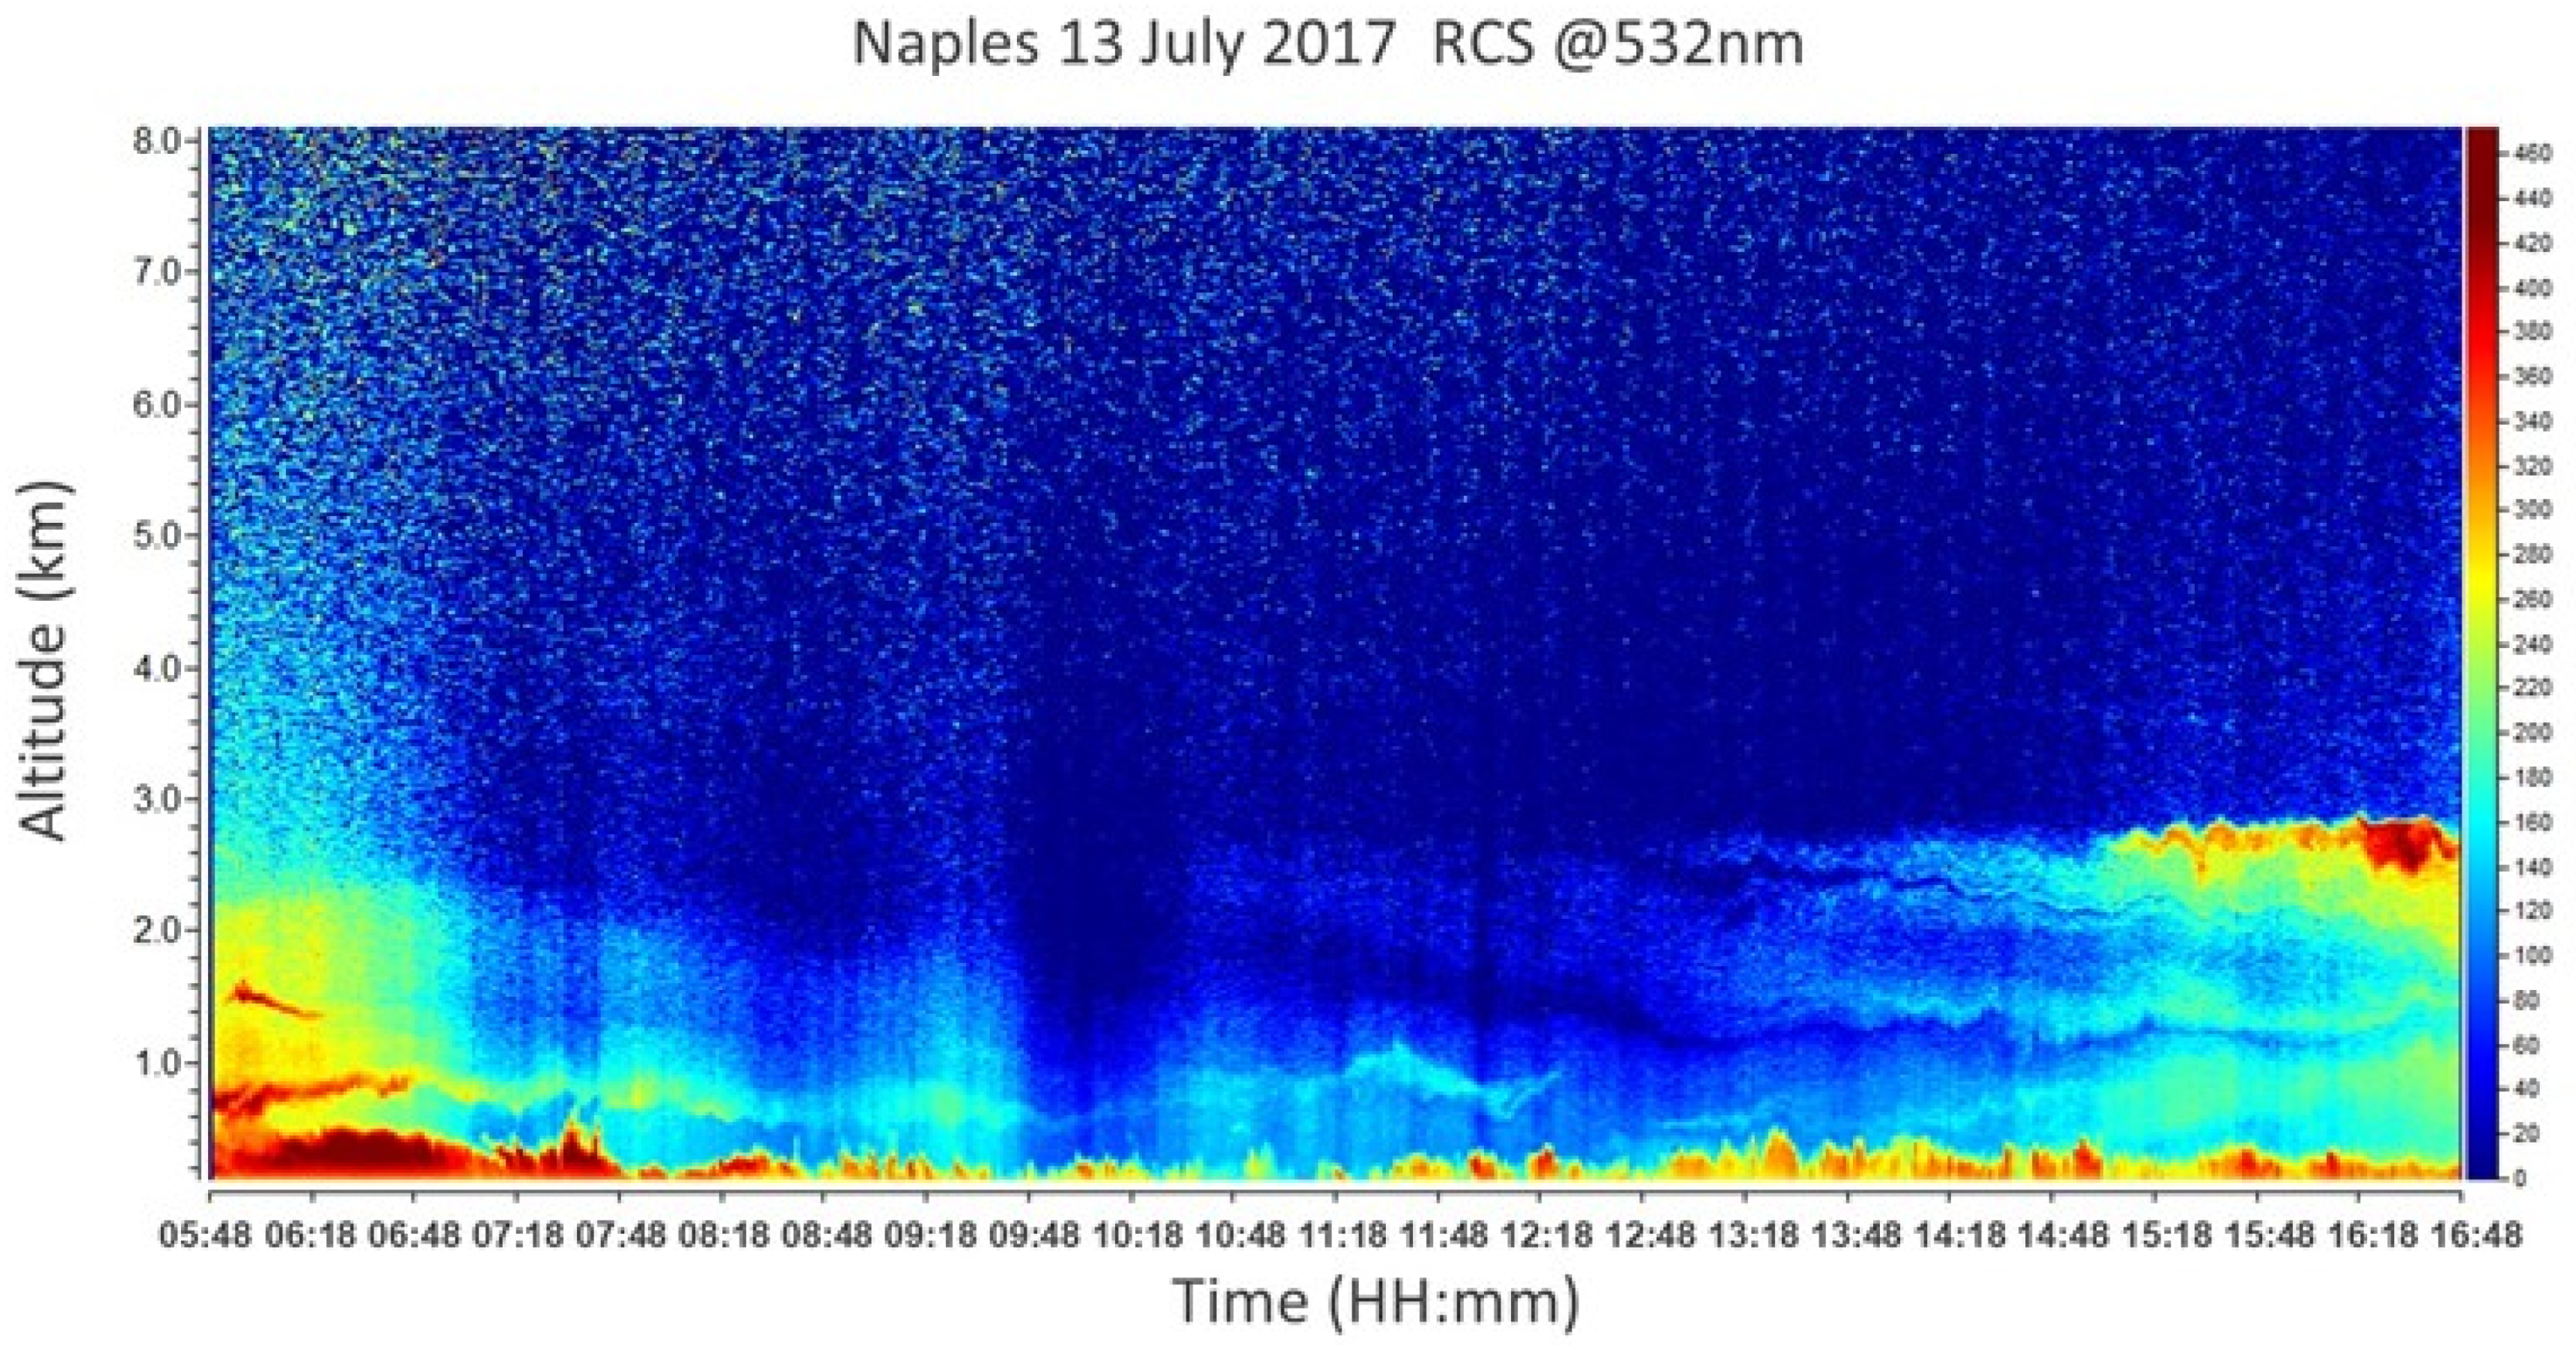
On 13 July 2017, no signature of Saharan dust was observed above the measurement area, as confirmed by model outcomes (Figure 2 and Figure 3). Lidar observations were carried out from 05:48 to 17:30 UTC, as shown in Figure 15. This allows for characterizing the fresh biomass burning aerosol produced by the Vesuvius fire dispersed across a short distance and following its temporal evolution. Figure 15 displays the time variability of the RCS measured continuously from 05:48 to 16:48 UTC. The figure highlights a diffuse atmospheric layering related to the forest fire aerosol.
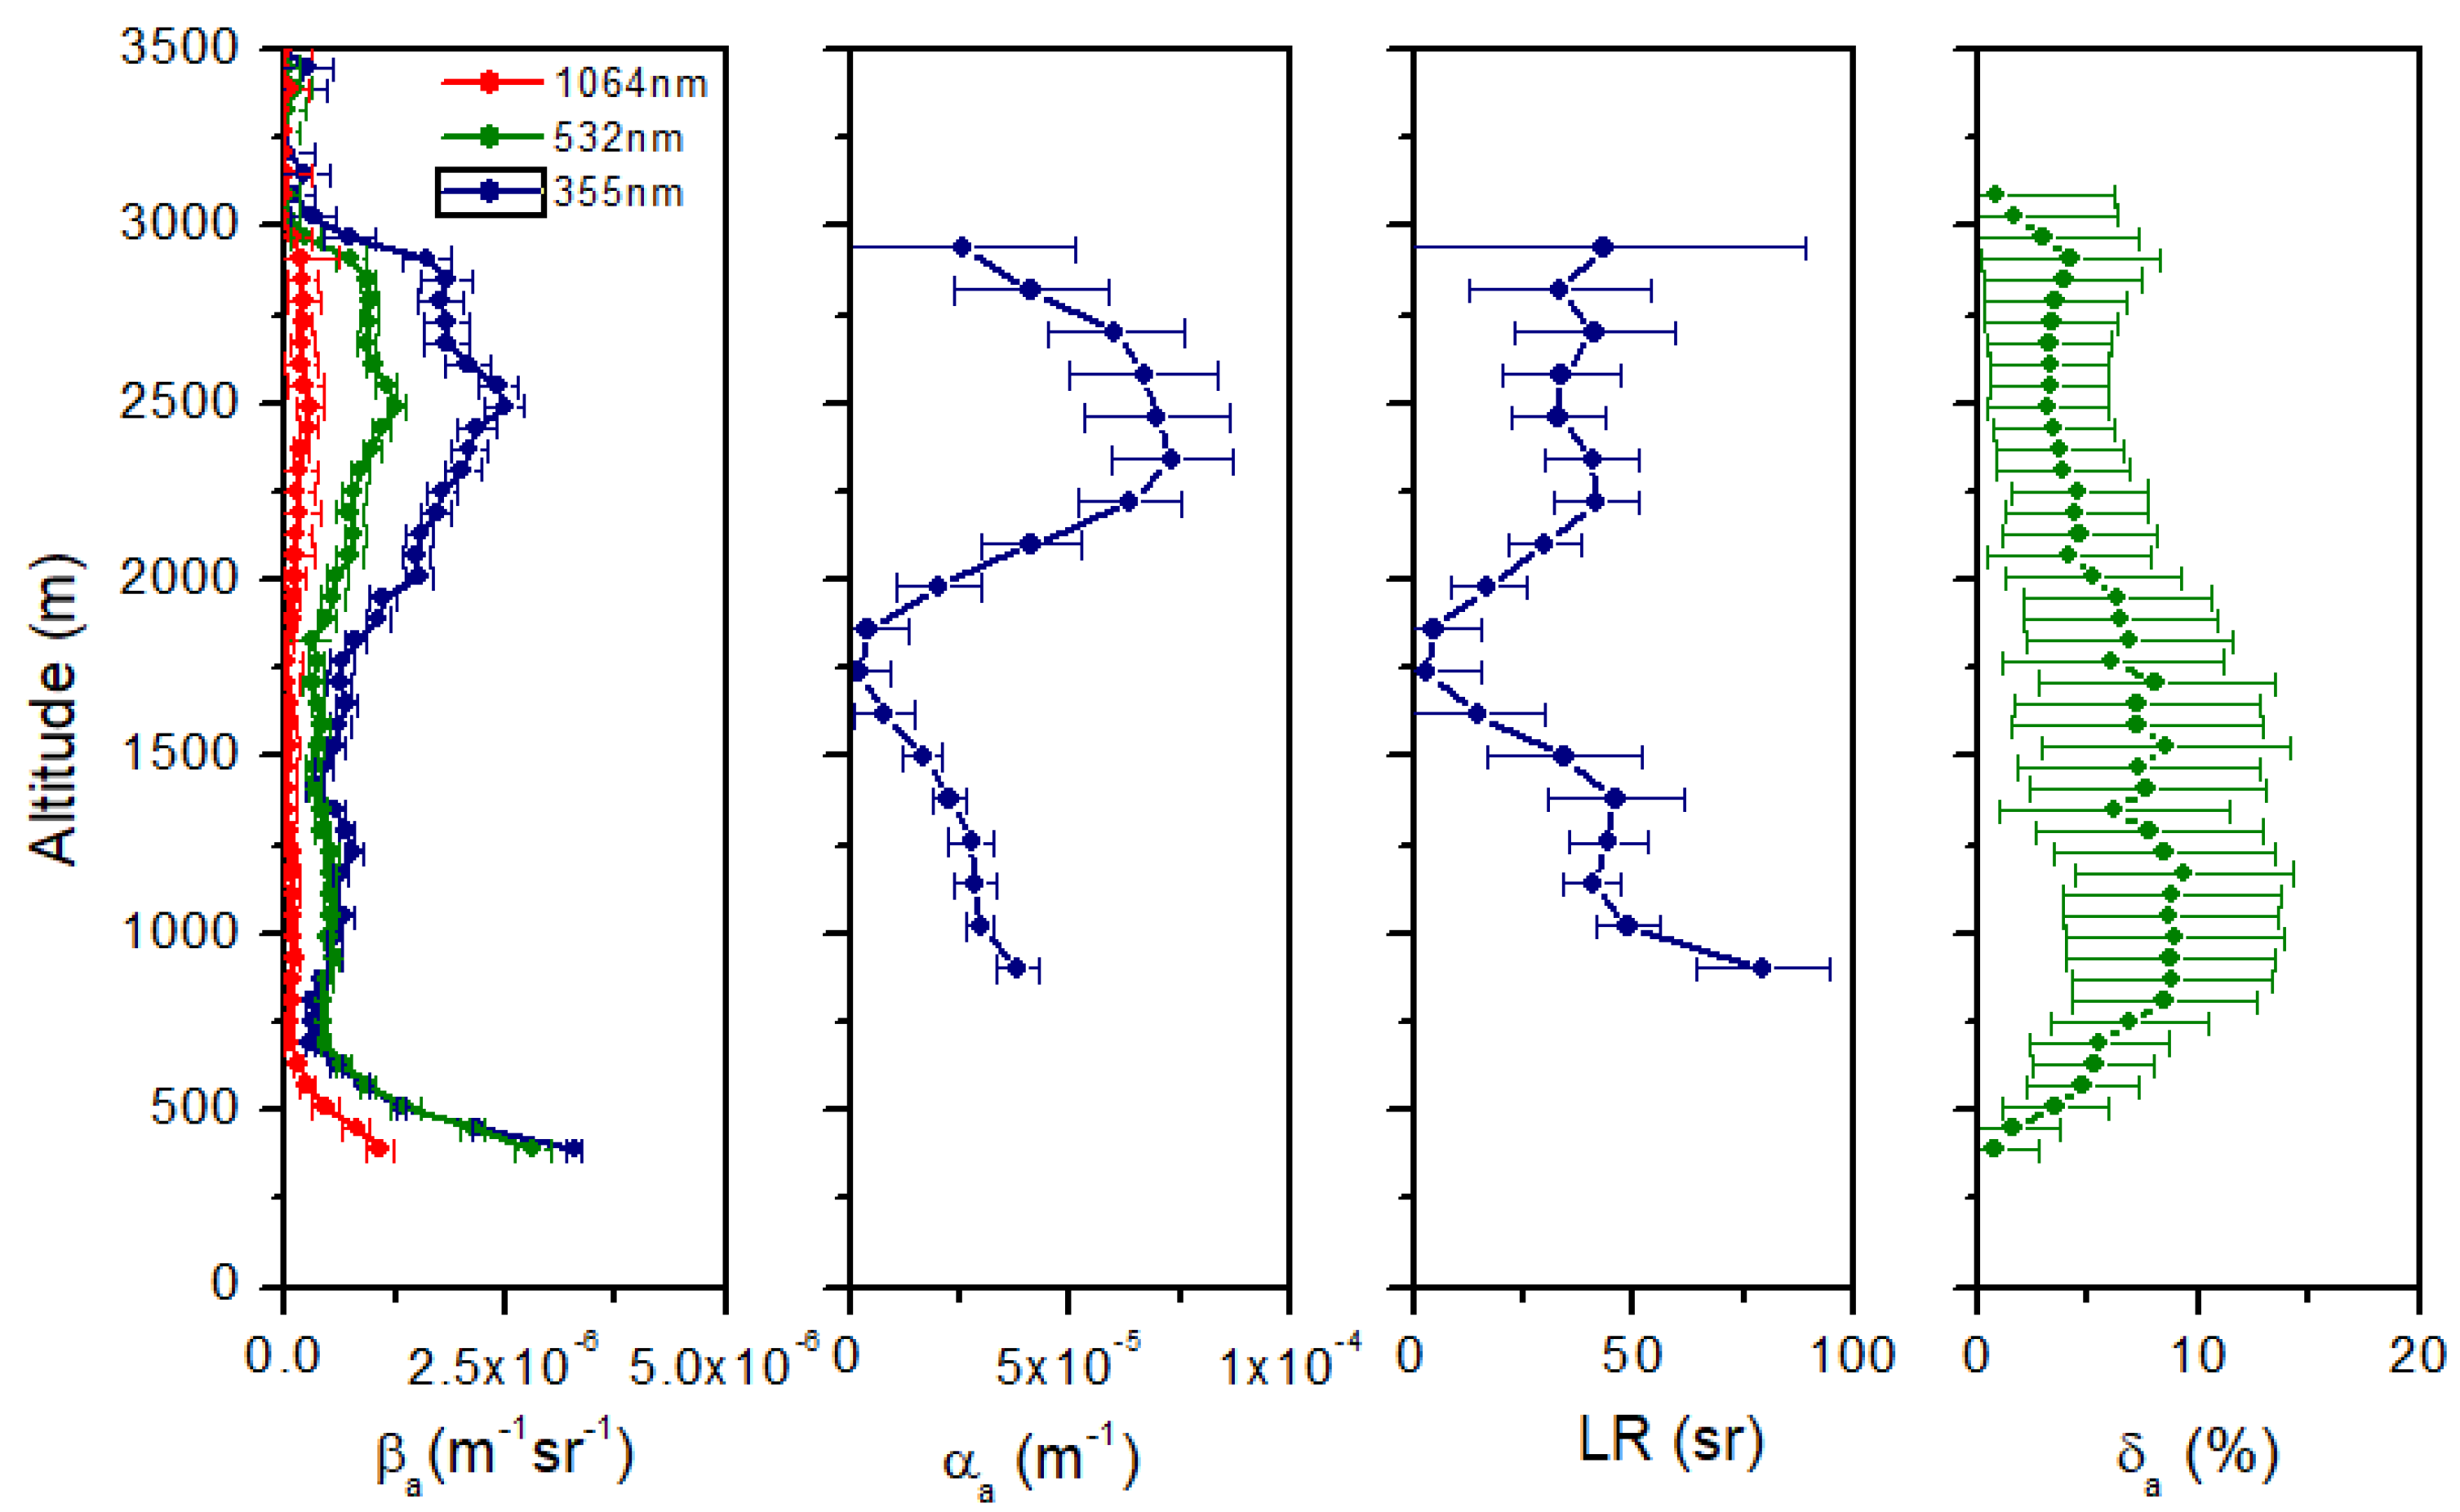
The lidar vertical profiles of βa, αa, δa and LR derived from Raman lidar observations carried out from 17:00 to 17:30 UTC are reported in Figure 16. The spatial resolution is 60 m for βa and δa and 120 m for αa and LR.
In the aerosol layer above 1750 m, the LR mean value obtained at 355 nm was (37 ± 5) sr and the calibrated δa mean value at 532 nm was (3.9 ± 0.6)%. Moreover, larger values (LR = (49 ± 14) sr and δa = (7.6 ± 1.3)%) were measured at lower altitudes, suggestive of a mixing with local anthropogenic aerosol. The mean values of LR and δa agree with those reported in the literature for fresh biomass burning aerosols [40].
On 17 July, the fire damaged the Astroni Natural WWF Reserve, located only 2.5 km from the Naples NF. Figure 17 shows the time variability of the RCS measured in Naples continuously from 09:33 to 10:58 UTC. The figure highlights spots of aerosol in the atmosphere. At about 10:50 UTC, a layer of more absorbing aerosol related to biomass burning (red circle in the figure) can be discerned. Around 11:00 UTC, the fire also affected the measurement area and lidar measurements were stopped because of the presence of black haze in the surroundings of the lidar station.
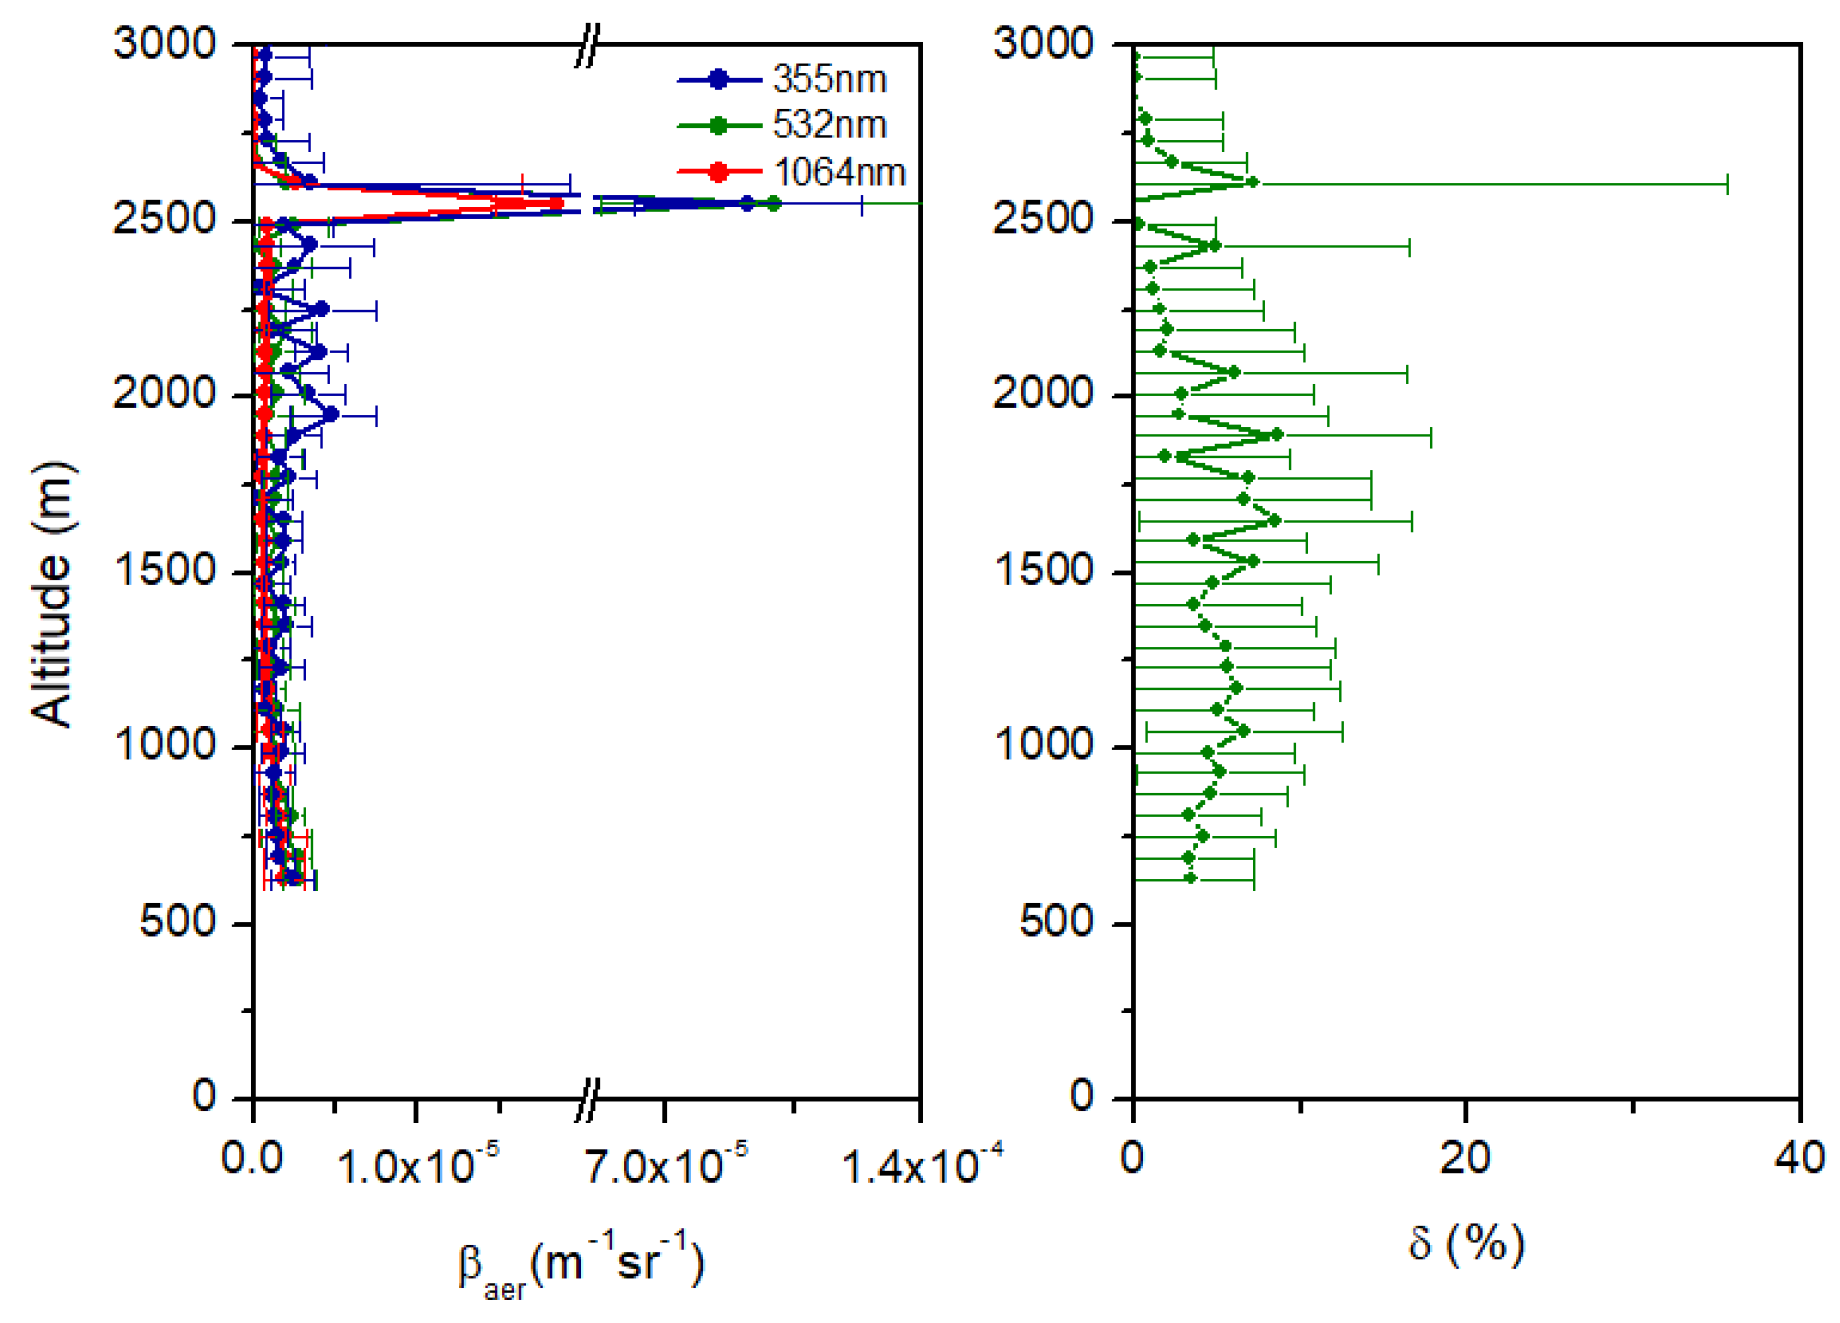
The lidar profiles of βa and δa derived from diurnal lidar observations carried out from 10:39 to 10:58 UTC are reported in Figure 18. The spatial resolution is 60 m. βa profiles show a peak around 2500 m above the lidar station at all wavelengths with mean value as high as 1 × 10⁻⁴ m−1 sr−1. The peak corresponds to a visible plume of smoke in the atmosphere. An almost homogeneous layer is observed at lower altitudes with βa around 2 × 10⁻⁶ m−1 sr−1. A calibrated δa mean value at 532 nm of (4.1 ± 1.6)% is observed across the whole profile, evidencing a diffuse layer of particles with a spherical shape resulting from biomass burning. Averaged values of the backscatter-related Ångstrom exponent (wavelength pair 532/1064 nm) were (1.8 ± 0.4) according to fine mode fresh biomass burning aerosols over the measurement area [46].
Table 3 summarizes the values of the parameters obtained by lidar averaged over the observed layers. The LR mean values for SD and fire smoke aerosols are comparable within uncertainties, confirming that only in combination with other parameters can the LR be used to reliably distinguish between different aerosol typologies. Moreover, the obtained results show that δa declines with time, according to a higher content of smoke aerosol in the atmosphere, and reaches very small depolarization values (about 4%) for both the fire events analyzed.
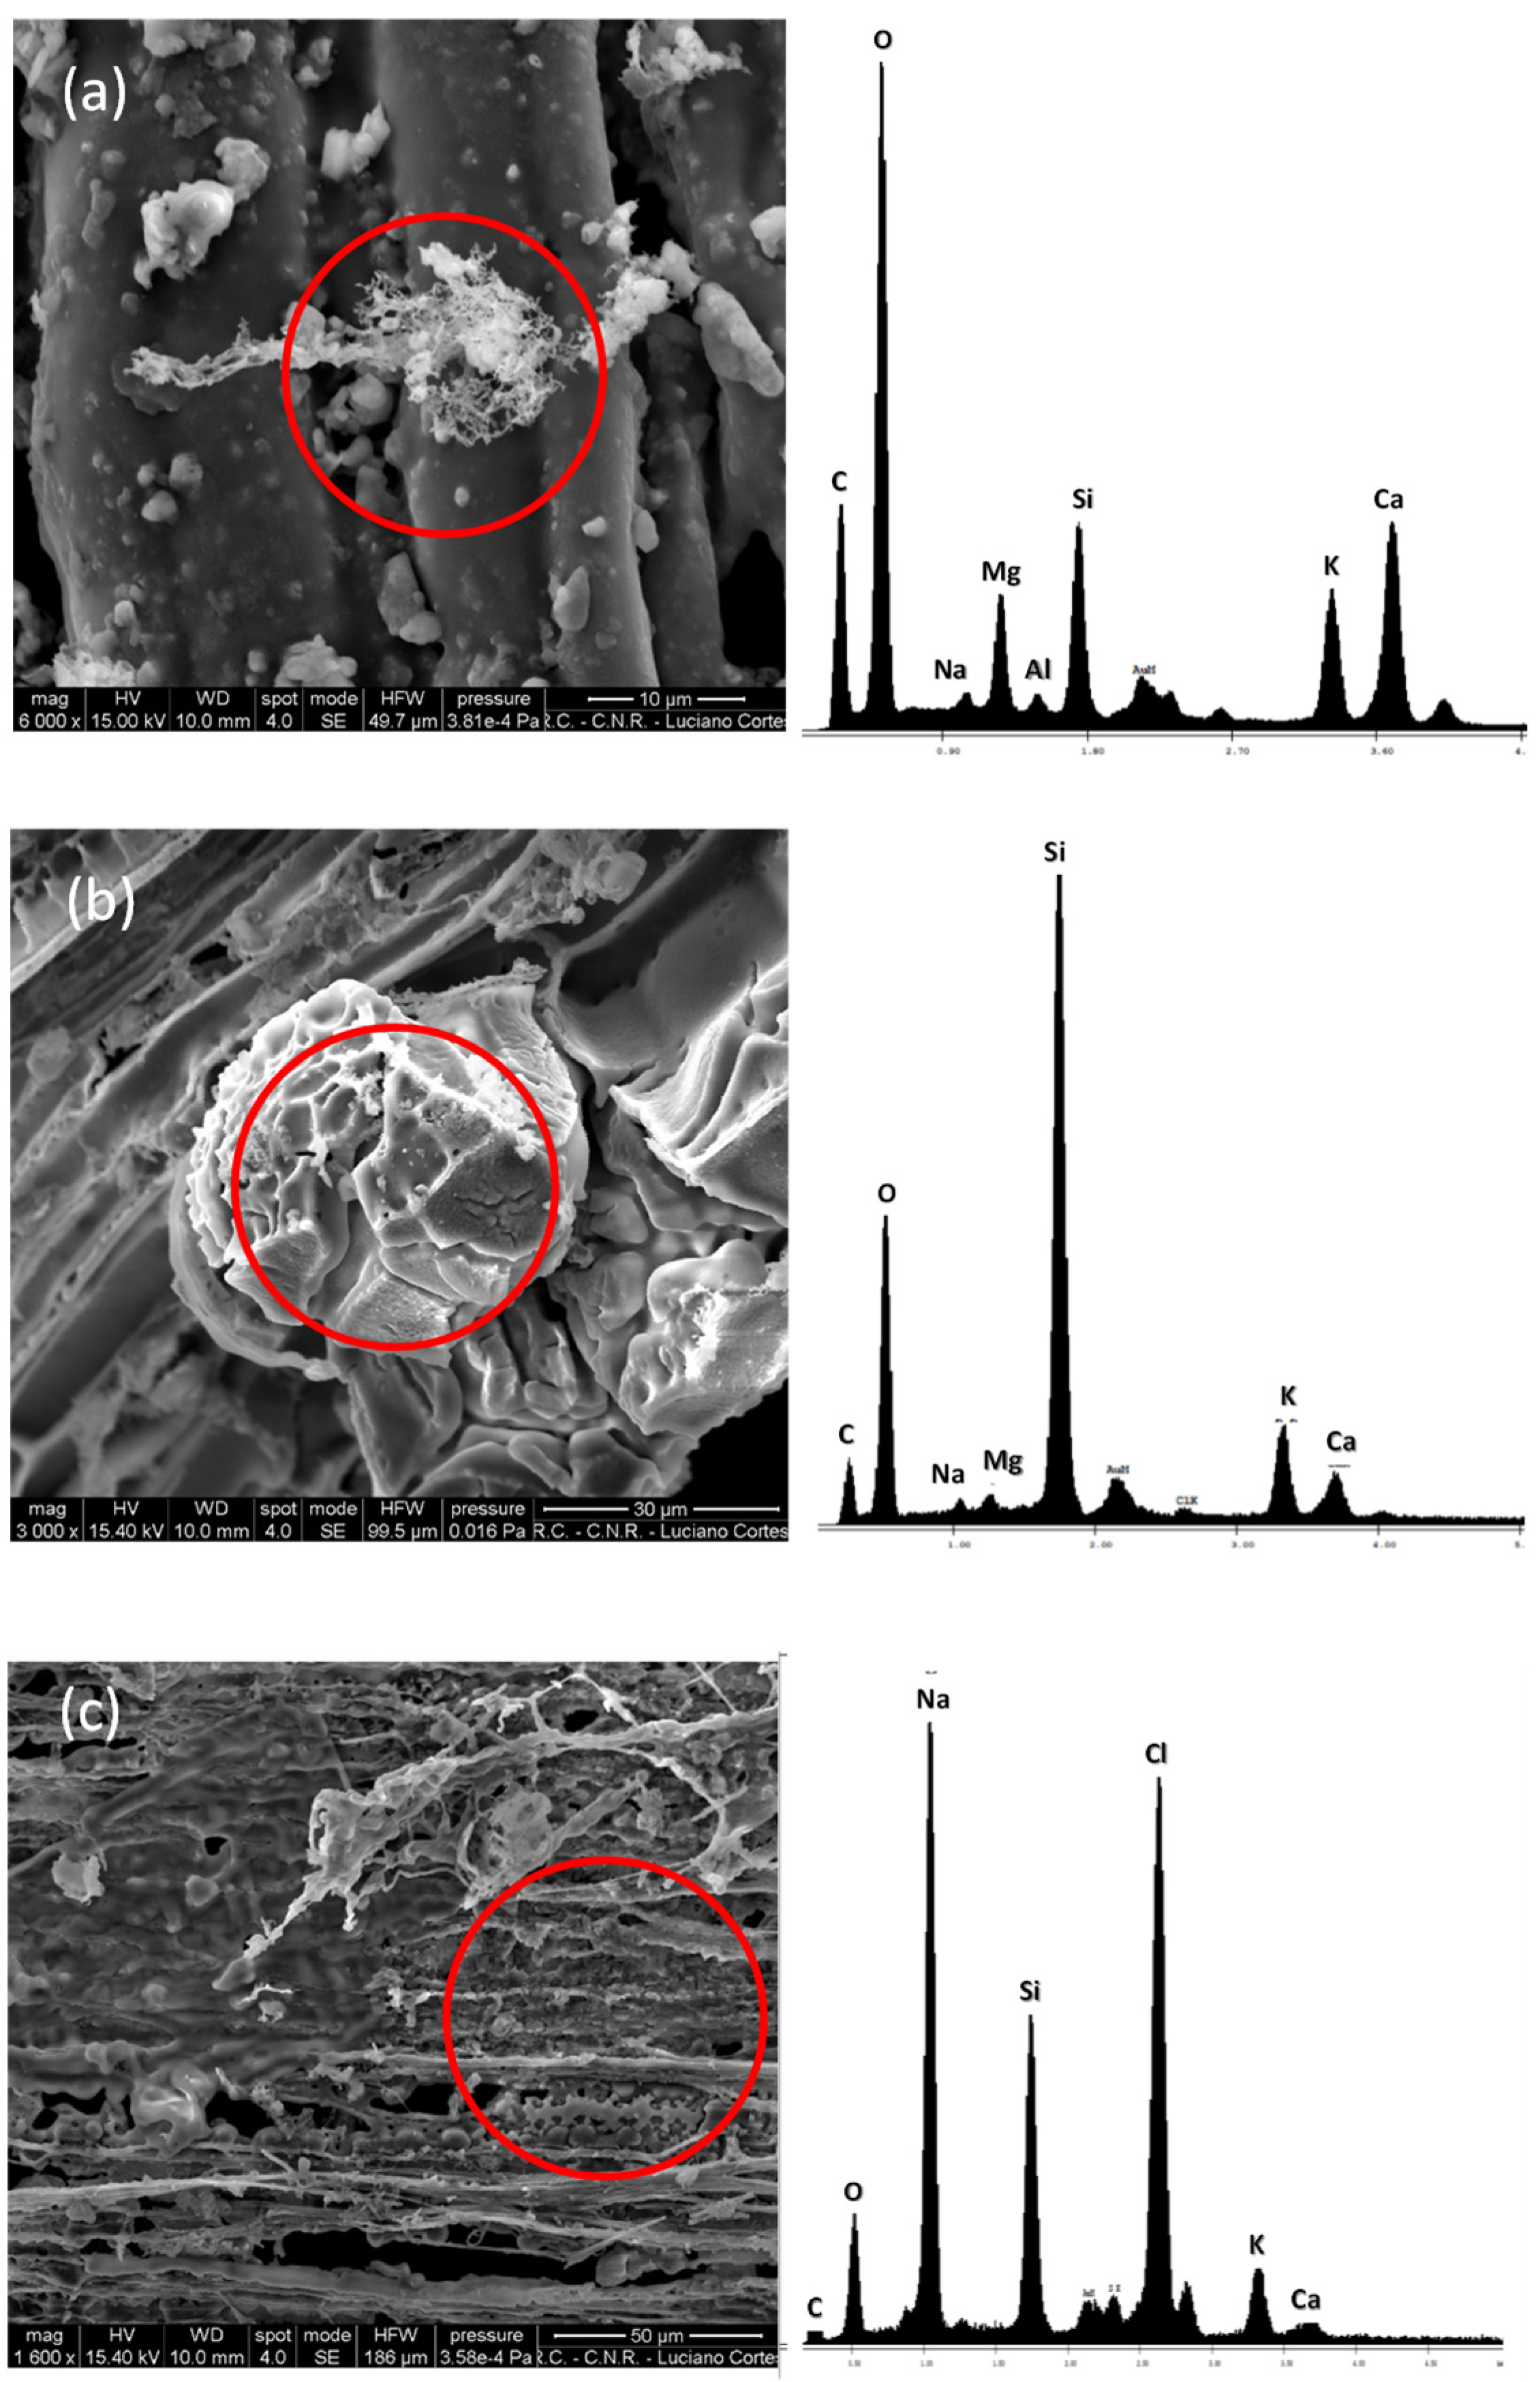
Finally, on 17 of July, samples deposited on the ground were collected and analyzed by SEM-EDX analysis. The SEM images reported in Figure 19 illustrate the morphology of the collected material, highlighting the characteristics of the substance.
SEM-EDX analysis of the samples (Figure 19, right panels) highlights a prevalence of carbon material deriving from a biomass combustion process and of Si, K and Ca (a, b) deriving from the inorganic fraction of the biomass. Moreover, a small contribution of marine aerosol (Na and Cl) (c) due to the sea breeze circulation that develops during the day can be also identified.

4. Summary

The present work reports the results of a study carried out during a huge fire event that occurred on Mount Vesuvius (Italy) in July 2017. A synergetic approach, based on the simultaneous use of both in situ and passive and active remote sensing instruments, allows for monitoring and characterizing the optical and microphysical properties of the aerosol produced by the Vesuvius fire that was subsequently dispersed in the atmosphere across a short distance over the city of Naples, in the period from 10 to 17 of July 2017.
A long time series of vertically resolved lidar measurements allowed for studying and characterizing fresh biomass burning aerosol, following its temporal evolution as well. The lidar observations show the presence above the measurement area of a layer characterized by values of LR ≈ 40 sr and δa ≈ 4%. Columnar aerosol properties derived from sun photometer measurements add useful information on the atmospheric particles, allowing us to examine aerosol microphysical and absorption properties. The measured columnar AOD reaches values as high as 0.78 with mean values ≈0.3–0.4 and γ values up to 1.95 with mean values ≈1.6–1.7, both typical of biomass burning aerosol. Size distribution analysis shows an increase in the peak value of fine mode components as biomass burning aerosols reach the measurement area, while the SSA increases with time according to age and less absorbing smoke aerosol in the atmosphere. SEM-EDX analysis of the samples deposited on the ground, when the fire affected the measurement area, highlights the presence of carbon derived from a biomass combustion process and of Si, K and Ca derived from the inorganic fraction of biomass, together with Na and Cl due to the closeness of the sea. Besides the characterization of the physical properties of biomass burning aerosol generated by forest fires, the present study shows how the simultaneous use of different, complementary methods can provide interesting information on atmospheric aerosols.

Author Contributions

Conceptualization and work coordination, A.B.; methodology, A.B., X.W., S.A.; photometer processing and analysis, A.B., A.S.; lidar data acquisition, A.S.; lidar data processing, A.B., S.A., X.W., A.S.; near-surface measurement and data analysis, M.D.; writing—original draft preparation, A.B., A.S., S.A.; review and editing, all authors; visualization, M.D., A.S., A.B. All authors have read and agreed to the published version of the manuscript.

Funding

The authors acknowledge support through the ACTRIS-2 research and innovation program under grant agreement No. 654109.

Data Availability Statement

Publicly available datasets were analyzed in this study. This data can be found here: https://aeronet.gsfc.nasa.gov/ (accessed on 1 February 2021). All data presented in this study are available on request from the corresponding author.

Acknowledgments

The authors thank Luciano Cortese of the Institute for Research on Combustion (IRC) of the National Research Council (CNR) for providing SEM-EDX analysis. The authors gratefully acknowledge the NOAA Air Resource Laboratory (ARL) for provision of the HYSPLIT transport and dispersion model and/or the READY website used in this publication. Data from the Dust Regional Atmospheric Model (BSC-DREAM8b) were provided by the Barcelona Supercomputing Center (http://www.bsc.es/ess/bsc-dust-daily forecast/ (accessed on 1 February 2021)). This research was funded by the I-AMICA Project (Italian National Operation Program “Ricerca e Competitività” (Research and Competitiveness) 2007–2013 (PON “R&C”).

Conflicts of Interest

The authors declare no conflict of interest. The funders had no role in the design of the study; in the collection, analyses, or interpretation of data; in the writing of the manuscript, or in the decision to publish the results.

References

  1. Ghan, S.J.; Liu, X.; Easter, R.C., Jr.; Zaveri, R.A.; Rasch, P.J.; Yoon, J.H.; Eaton, B. Toward a minimal representation of aerosols in climate models: Comparative decomposition of aerosol direct, semidirect, and indirect radiative forcing. J. Clim. 2012, 25, 6461–6476. [Google Scholar] [CrossRef]
  2. Jacobson, M.Z. Effects of biomass burning on climate, accounting for heat and moisture fluxes, black and brown carbon, and cloud absorption effects. J. Geophys. Res. Atmos. 2014, 119, 8980–9002. [Google Scholar] [CrossRef]
  3. Shi, S.; Chenga, T.; Gua, X.; Guoa, H.; Wua, Y.; Wanga, Y. Biomass burning aerosol characteristics for different vegetation types in different aging periods. Environ. Int. 2019, 126, 504–511. [Google Scholar] [CrossRef] [PubMed]
  4. Samaras, S.; Nicolae, D.; Böckmann, C.; Vasilescu, C.; Binietoglou, I.; Labzovskii, L.; Toanca, F.; Papayannis, A. Using Raman-lidar-based regularized microphysical retrievals and Aerosol Mass Spectrometer measurements for the characterization of biomass burning aerosols. J. Comput. Phys. 2015, 299, 156–174. [Google Scholar] [CrossRef]
  5. Alonso-Blanco, E.; Calvo, A.I.; Pont, V.; Mallet, M.; Fraile, R.; Castro, A. Impact of Biomass Burning on Aerosol Size Distribution, Aerosol Optical Properties and Associated Radiative Forcing. Aerosol Air Qual. Res. 2014, 14, 708–724. [Google Scholar] [CrossRef] [Green Version]
  6. Sigsgaard, T.; Forsberg, B.; Annesi-Maesano, I.; Blomberg, A.; Bølling, A.; Boman, C.; Bønløkke, J.; Brauer, M.; Bruce, N.; Héroux, M.E.; et al. Health impacts of anthropogenic biomass burning in the developed world. Eur. Respir. J. 2015, 46, 1577–1588. [Google Scholar] [CrossRef] [Green Version]
  7. Veselovskii, I.; Whiteman, D.N.; Korenskiy, M.; Suvorina, A.; Kolgotin, A.; Lyapustin, A.; Wang, Y.; Chin, M.; Bian, H.; Kucsera, T.L.; et al. Characterization of forest fire smoke event near Washington, DC in summer 2013 with multi-wavelength lidar. Atmos. Chem. Phys. 2015, 15, 1647–1660. [Google Scholar] [CrossRef] [Green Version]
  8. Vaughan, G.; Draude, A.P.; Ricketts, H.M.A.; Schultz, D.M.; Adam, M.; Sugier, J.; Wareing, D.P. Transport of Canadian forest fire smoke over the UK as observed by lidar. Atmos. Chem. Phys. 2018, 18, 11375–11388. [Google Scholar] [CrossRef] [Green Version]
  9. Ansmann, A.; Baars, H.; Tesche, M.; Muller, D.; Althausen, D.; Engelmann, R.; Pauliquevis, T.; Artaxo, P. Dust and smoke transport from Africa to South America: Lidar profiling over Cape Verde and the Amazon rainforest. Geophys. Res. Lett. 2009, 36, L11802. [Google Scholar] [CrossRef]
  10. Baars, H.; Ansmann, A.; Ohneiser, K.; Haarig, M.; Engelmann, R.; Althausen, D.; Hanssen, I.; Gausa, M.; Pietruczuk, A.; Szkop, A.; et al. The unprecedented 2017–2018 stratospheric smoke event: Decay phase and aerosol properties observed with the EARLINET. Atmos. Chem. Phys. 2019, 19, 15183–15198. [Google Scholar] [CrossRef] [Green Version]
  11. Ortiz-Amezcua, P.; Guerrero-Rascado, J.L.; Granados-Muñoz, M.J.; Benavent-Oltra, J.A.; Böckmann, C.; Samaras, S.; Stachlewska, I.S.; Janicka, Ł.; Baars, H.; Bohlmann, S. Microphysical characterization of long-range transported biomass burning particles from North America at three EARLINET stations. Atmos. Chem. Phys. 2017, 17, 5931–5946. [Google Scholar] [CrossRef] [Green Version]
  12. Groß, S.; Freudenthaler, V.; Wirth, M.; Weinzierl, B. Towards an aerosol classification scheme for future EarthCARE lidar observations and implications for research needs. Atmos. Sci. Lett. 2015, 16, 77–82. [Google Scholar] [CrossRef] [Green Version]
  13. Haywood, J.M.; Pelon, J.; Formenti, P.; Bharmal, N.; Brooks, M.; Capes, G.; Chazette, P.; Chou, C.; Christopher, S.; Coe, H.; et al. Overview of the Dust and Biomass-burning Experiment and African Monsoon Multidisciplinary Analysis Special Observing Period-0. J. Geophys. Res. 2008, 113, D00C17. [Google Scholar] [CrossRef] [Green Version]
  14. Miller, D.; Sun, K.; Zondlo, M.A.; Kanter, D.; Dubovik, O.; Welton, E.J.; Winker, D.M.; Ginoux, P. Assessing boreal forest fire smoke aerosol impacts on U.S. air quality: A case study using multiple data sets. J. Geophys. Res. 2011, 116, D22209. [Google Scholar] [CrossRef] [Green Version]
  15. Zielinski, T.; Bolzacchini, E.; Cataldi, M.; Ferrero, L.; Graßl, S.; Hansen, G.; Mateos, D.; Mazzola, M.; Neuber, R.; Pakszys, P.; et al. Study of Chemical and Optical Properties of Biomass Burning Aerosols during Long-Range Transport Events toward the Arctic in Summer 2017. Atmosphere 2020, 11, 84. [Google Scholar] [CrossRef] [Green Version]
  16. Johnson, B.T.; Haywood, J.M.; Langridge, J.M.; Darbyshire, E.; Morgan, W.T.; Szpek, K.; Brooke, J.K.; Marenco, F.; Coe, H.; Artaxo, P.; et al. Evaluation of biomass burning aerosols in the HadGEM3 climate model with observations from the SAMBBA field campaign. Atmos. Chem. Phys. 2016, 16, 14657–14685. [Google Scholar] [CrossRef] [Green Version]
  17. Nicolae, D.; Nemuc, A.; Müller, D.; Talianu, C.; Vasilescu, J.; Belegante, L.; Kolgotin, A. Characterization of fresh and aged biomass burning events using multi-wavelength Raman lidar and mass spectrometry. J. Geophys. Res. 2013, 118, 2956–2965. [Google Scholar] [CrossRef]
  18. Janicka, L.; Stachlewska, I.S. Properties of biomass burning aerosol mixtures derived at fine temporal and spatial scales from Raman lidar measurements: Part I optical properties. Atmos. Chem. Phys. Discuss. 2019. [Google Scholar] [CrossRef] [Green Version]
  19. Saarnio, K.; Aurela, M.; Timonen, H.; Saarikoski, S.; Teinilä, K.; Mäkelä, T.; Sofiev, M.; Koskinen, J.; Aalto, P.P.; Kulmala, M.; et al. Chemical composition of fine particles in fresh smoke plumes from boreal wild-land fires in Europe. Sci. Total Environ. 2010, 408, 2527–2542. [Google Scholar] [CrossRef]
  20. Saulino, L.; Rita, A.; Migliozzi, A.; Maffei, C.; Allevato, E.; Garonna, A.P.; Saracino, A. Detecting Burn Severity across Mediterranean Forest Types by Coupling Medium-Spatial Resolution Satellite Imagery and Field Data. Remote Sens. 2020, 12, 741. [Google Scholar] [CrossRef] [Green Version]
  21. Pace, G.; Meloni, D.; Di Sarra, A. Forest fire aerosol over the Mediterranean basin during summer 2003. J. Geophys. Res. 2005, 110, D21202. [Google Scholar] [CrossRef] [Green Version]
  22. Majdi, M.; Kim, Y.; Turquety, S.; Sartelet, K. Impact of mixing state on aerosol optical properties during severe wildfires over the Euro-Mediterranean region. Atmos. Environ. 2020, 220, 117042. [Google Scholar] [CrossRef]
  23. Amiridis, V.; Zerefos, C.; Kazadzis, S.; Gerasopoulos, E.; Eleftheratos, K.; Vrekoussis, M.; Stohl, A.; Mamouri, R.E.; Kokkalis, P.; Papayannis, A.; et al. Impact of the 2009 Attica wild fires on the air quality in urban Athens. Atmos. Environ. 2012, 46, 536–544. [Google Scholar] [CrossRef]
  24. Pappalardo, G. ACTRIS Aerosol, Clouds and Trace Gases Research Infrastructure. EPJ Web Conf. 2018, 176, 09004. [Google Scholar] [CrossRef]
  25. Pappalardo, G.; Amodeo, A.; Apituley, A.; Comeron, A.; Freudenthaler, V.; Linné, H.; Ansmann, A.; Bösenberg, J.; D’Amico, G.; Mattis, I.; et al. EARLINET: Towards an advanced sustainable European aerosol lidar network. Atmos. Meas. Tech. 2014, 7, 2389–2409. [Google Scholar] [CrossRef] [Green Version]
  26. Freudenthaler, V.; Esselborn, M.; Wiegner, M.; Heese, B.; Tesche, M.; Ansmann, A.; Müller, D.; Althausen, D.; Wirth, M.; Fix, A.; et al. Depolarization ratio profiling at several wavelengths in pure Saharan dust during SAMUM 2006. Tellus B 2009, 61, 165–179. [Google Scholar] [CrossRef] [Green Version]
  27. Klett, J.D. Stable analytical inversion solution for processing lidar returns. Appl. Opt. 1981, 20, 211–220. [Google Scholar] [CrossRef] [Green Version]
  28. Fernald, F.G. Analysis of the atmospheric lidar observations; some comments. Appl. Opt. 1984, 23, 652–653. [Google Scholar] [CrossRef]
  29. Ansmann, A.; Riebesell, M.; Wandinger, U.; Weitkamp, C.; Voss, E.; Lahmann, W.; Michaelis, W. Combined raman elastic-backscatter LIDAR for vertical profiling of moisture, aerosol extinction, backscatter, and LIDAR ratio. Appl. Phys. B. 1992, 55, 18. [Google Scholar] [CrossRef]
  30. Liua, L.; Mishchenko, M.I. Constraints on PSC particle microphysics derived from lidar observations. J. Quant. Spectrosc. Radiat. Transf. 2001, 70, 817–831. [Google Scholar] [CrossRef] [Green Version]
  31. Ansmann, A.; Riebesell, M.; Weitkamp, C. Measurement of atmospheric aerosol extinction profiles with a Raman lidar. Opt. Lett. 1990, 15, 746–748. [Google Scholar] [CrossRef]
  32. Biele, J.; Beyerle, G.; Baumgarten, G. Polarization lidar: Corrections of instrumental effects. Opt. Express 2000, 7, 427–435. [Google Scholar] [CrossRef]
  33. Mylonaki, M.; Giannakaki, E.; Papayannis, A.; Papanikolaou, C.A.; Komppula, M.; Nicolae, D.; Papagiannopoulos, N.; Amodeo, A.; Baars, H.; Soupiona, O. Aerosol type classification analysis using EARLINET multiwavelength and depolarization lidar observations. Atmos. Chem. Phys. 2021, 21, 2211–2227. [Google Scholar] [CrossRef]
  34. Groß, S.; Esselborn, M.; Weinzierl, B.; Wirth, M.; Fix, A.; Petzold, A. Aerosol classification by airborne high spectral resolution lidar observations. Atmos. Chem. Phys. 2013, 13, 2487–2505. [Google Scholar] [CrossRef] [Green Version]
  35. Holben, B.N.; Eck, T.F.; Slutsker, I.; Tanré, D.; Buis, J.P.; Setzer, A.; Vermote, E.; Reagan, J.A.; Kaufman, Y.J.; Nakajima, T.; et al. AERONET—A federated instrument network and data archive for aerosol characterization. Remote Sens. Environ. 1998, 66, 1–16. [Google Scholar] [CrossRef]
  36. Holben, B.N.; Tanré, D.; Smirnov, A.; Eck, T.F.; Slutsker, I.; Abuhassan, N.; Newcomb, W.W.; Schafer, J.; Chatenet, B.; Lavenue, F.; et al. An emerging ground-based aerosol climatology: Aerosol optical depth from AERONET. J. Geophys. Res. 2001, 106, 12067–12097. [Google Scholar] [CrossRef]
  37. Dubovik, O.; King, M.D. A flexible inversion algorithm for the retrievalof aerosol optical properties from sun and sky radiance measurements. J. Geophys. Res. 2000, 105, 20673–20696. [Google Scholar] [CrossRef] [Green Version]
  38. Giles, D.M.; Sinyuk, A.; Sorokin, M.G.; Schafer, J.S.; Smirnov, A.; Slutsker, I.; Eck, T.F.; Holben, B.N.; Lewis, J.R.; Campbell, J.R.; et al. Advancements in the Aerosol Robotic Network (AERONET) Version 3 database-automated near-real-time quality control algorithm with improved cloud screening for Sun photometer aerosol optical depth (AOD) measurements. Atmos. Meas. Tech. 2019, 12, 169–209. [Google Scholar] [CrossRef] [Green Version]
  39. Reid, J.S.; Eck, T.F.; Christopher, S.A.; Hobbs, P.V.; Holben, B.N. Use of the Ångström exponent to estimate the variability of optical and physical properties of aging smoke particles in Brazil. J. Geophys. Res. 1999, 104, 27473–27489. [Google Scholar] [CrossRef]
  40. Sicard, M.; Mallet, M.; García-Vizcaíno, D.; Comerón, A.; Rocadenbosch, F.; Dubuisson, P.; Muñoz-Porcar, C. Intense dust and extremely fresh biomass burning outbreak in Barcelona, Spain: Characterization of their optical properties and estimation of their direct radiative forcing. Environ. Res. Lett. 2012, 7, 034016. [Google Scholar] [CrossRef] [Green Version]
  41. O’Neill, N.T.; Eck, T.F.; Smirnov, A.; Holben, B.N.; Thulasiraman, S. Spectral discrimination of coarse and fine mode optical depth. J. Geophys. Res. 2003, 108, 4559. [Google Scholar] [CrossRef]
  42. D’Emilio, M.; Macchiato, M.; Ragosta, M.; Simoniello, T. A method for the integration of satellite vegetation activities observations and magnetic susceptibility measurements for monitoring heavy metals in soil et al. J. Hazard. Mater. 2012, 241–242, 118–126. [Google Scholar] [CrossRef] [PubMed]
  43. Valenzuela, A.; Olmo, F.J.; Lyamani, H.; Granados-Muñoz, M.J.; Antón, M.; Guerrero-Rascado, J.L.; Quirantes, A.; Toledano, C.; Perez-Ramírez, D.; Alados-Arboledas, L. Aerosol transport over the western Mediterranean basin: Evidence of the contribution of fine particles to desert dust plumes over Alborán Island. J. Geophys. Res. Atmos. 2014, 119, 14028–14044. [Google Scholar] [CrossRef] [Green Version]
  44. Burgos, M.A.; Mateos, D.; Cachorro, V.E.; Toledano, C.; de Frutos, A.M.; Calle, A.; Herguedas, A.; Marcos, J.L. An analysis of high fine aerosol loading episodes in north-central Spain in the summer 2013—Impact of Canadian biomass burning episode and local emissions. Atmos. Environ. 2018, 184, 191–202. [Google Scholar] [CrossRef]
  45. Reid, J.S.; Hobbs, P.V. Physical and optical properties of young smoke from individual biomass fires in Brazil. J. Geophys. Res. 1998, 103, 32013–32030. [Google Scholar] [CrossRef]
  46. Alados-Arboledas, L.; Muller, D.; Guerrero-Rascado, J.L.; Navas-Guzman, F.; Perez-Ramırez, D.; Olmo, F.J. Optical and microphysical properties of fresh biomass burning aerosol retrieved by Raman lidar, and star-and sun-photometry. Geophys. Res. Lett. 2011, 38, L01807. [Google Scholar] [CrossRef]
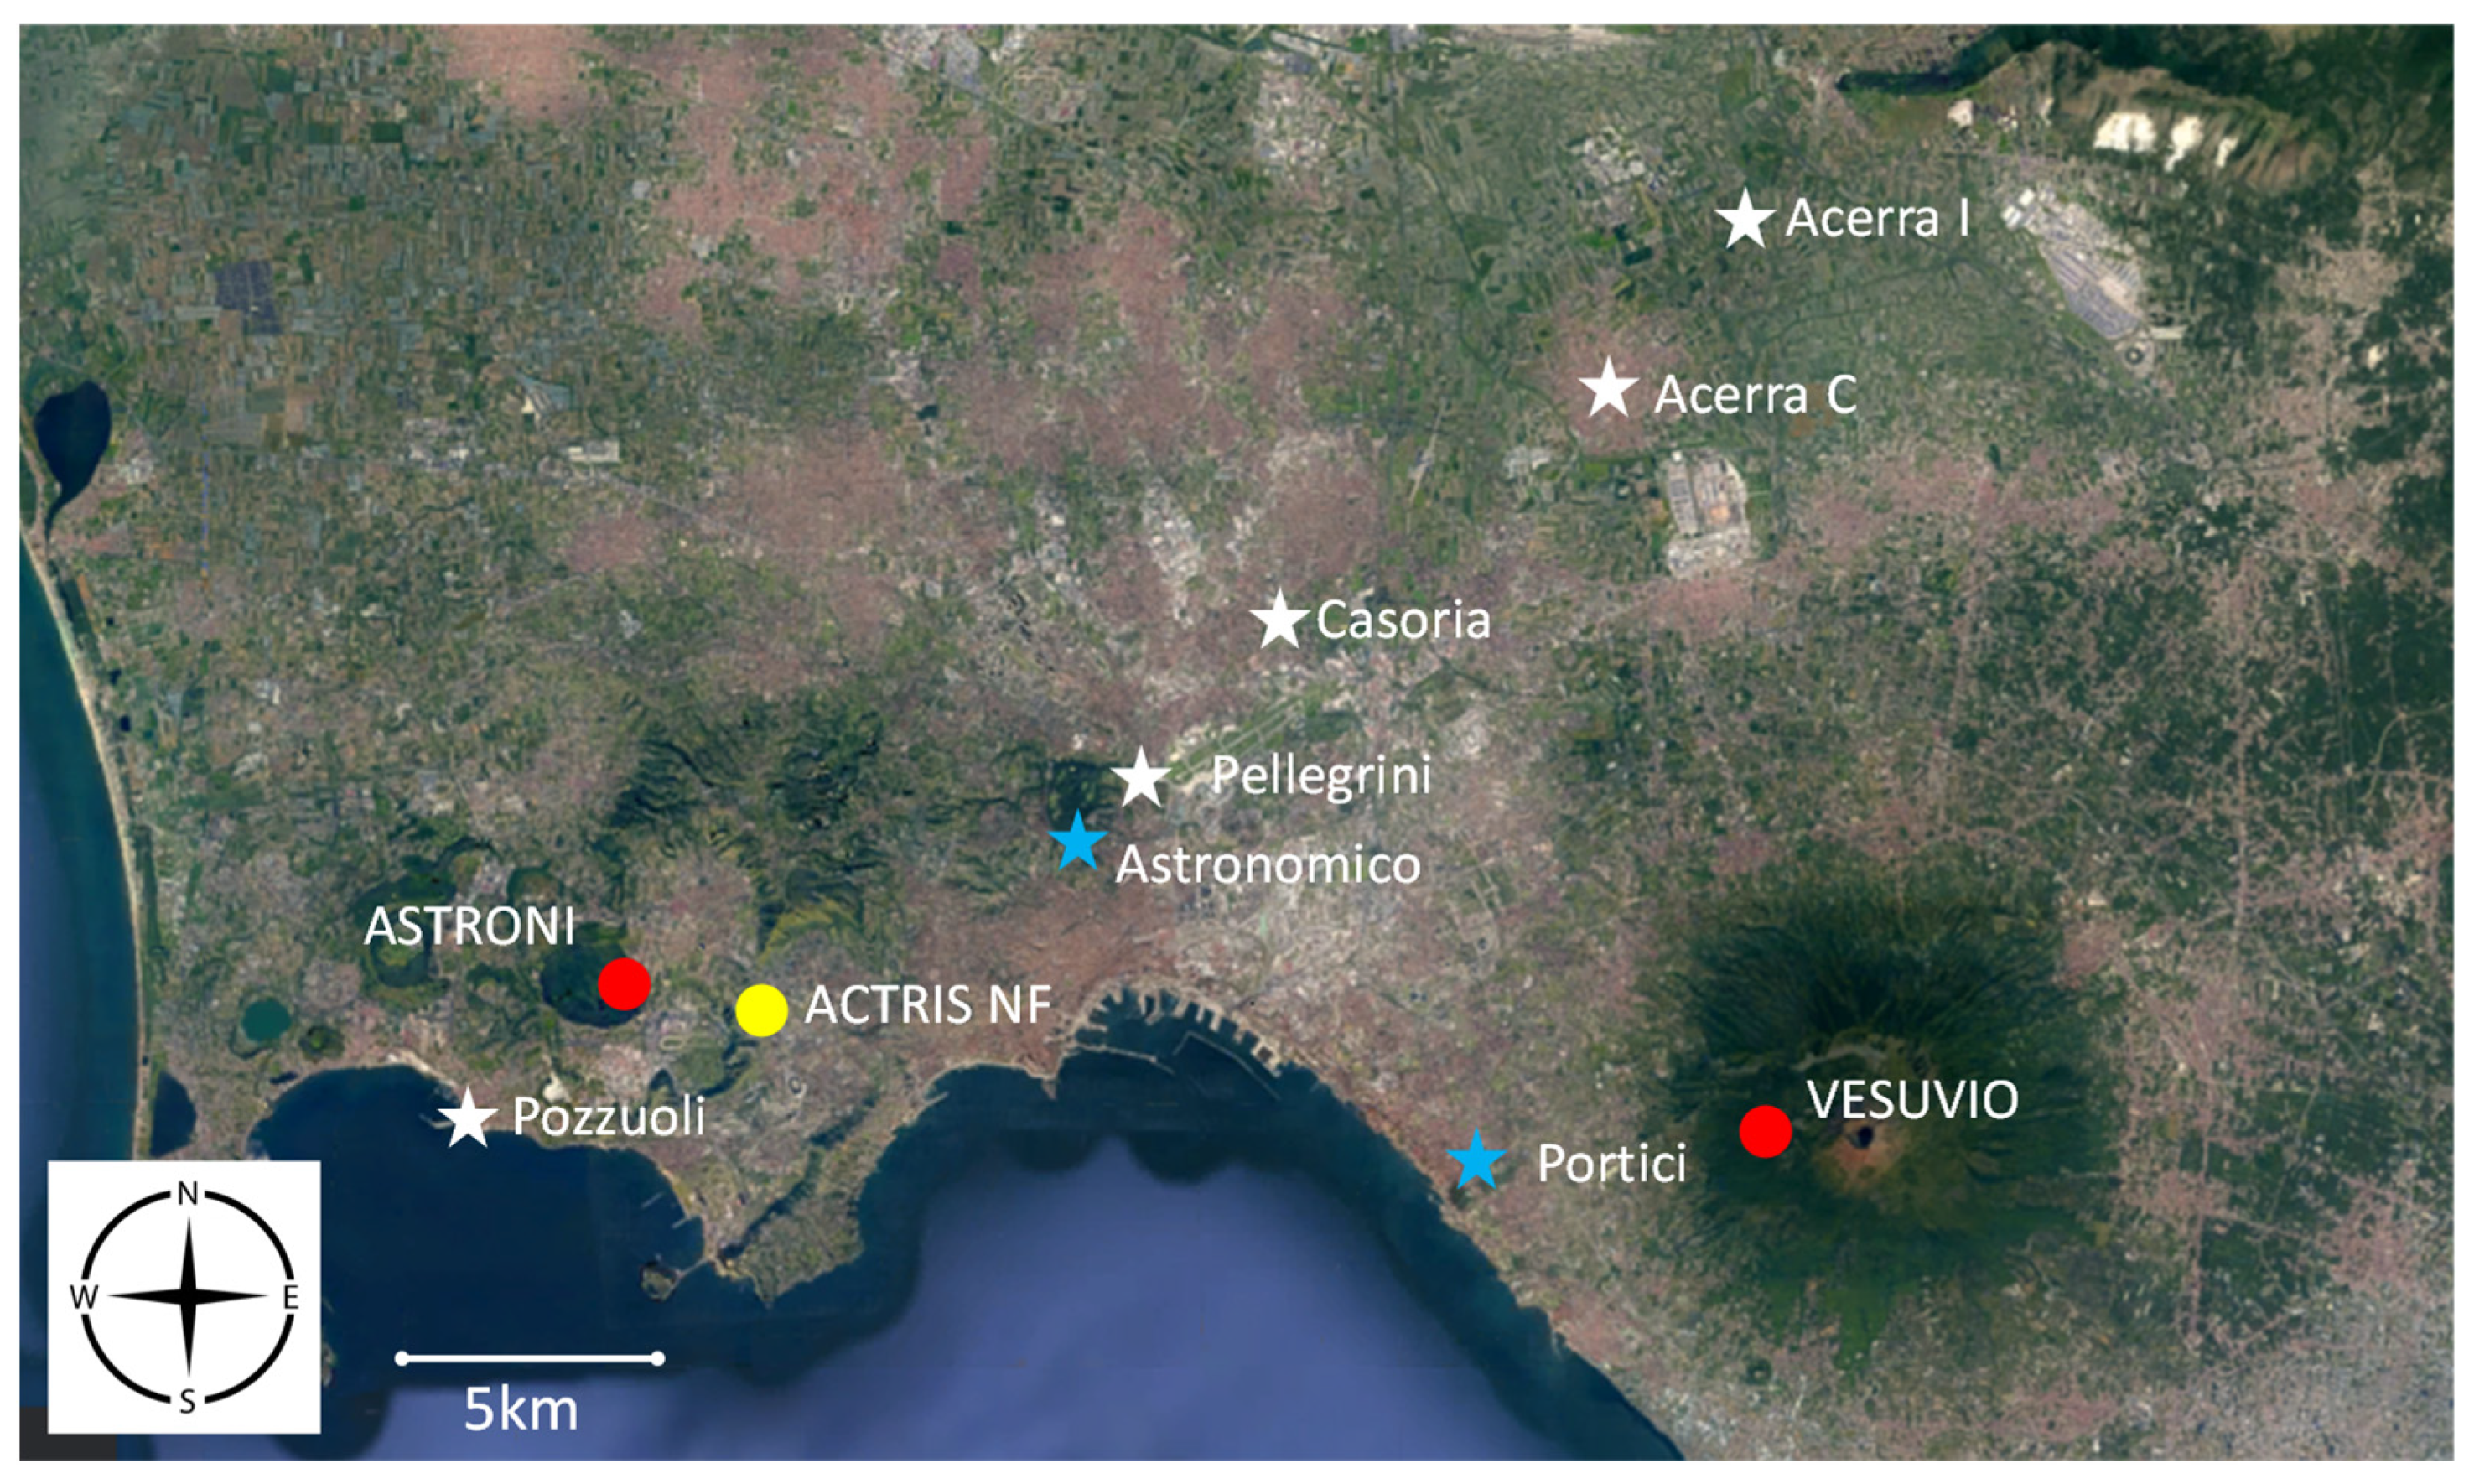
Figure 1. Map of the city of Naples with the location of the Actris National Facility (Actris NF), the Astroni Natural WWF Reserve (Astroni) and the National Park of Vesuvius (Vesuvio). Stars refer to the 7 sampling sites of the ARPAC air quality monitoring network equipped with instruments for continuous measurements of PM concentration.
Remotesensing 13 02001 g001
Figure 2. HYSPLIT NOAA model outcomes showing three-day air mass back-trajectories over the measurement area between 500 and 3000 m of altitude. Model results refer to 18.00 UTC of the 8, 10 and 13 of July 2017.
Remotesensing 13 02001 g002
Figure 3. BSC-Dream dust forecast model results corresponding to low-level dust concentration (µg m−3) (on the left) and dust load (g m−2) (on the right) for 12 and 13 of July 2017.
Remotesensing 13 02001 g003
Figure 4. The wind speed and direction and the frequency of counts by wind direction on 12–13 July 2017.
Remotesensing 13 02001 g004
Figure 5. FIRMS maps reporting active fire data (red and orange points) in the measurement area on 12 and 17 of July 2017.
Remotesensing 13 02001 g005
Figure 6. Daily averaged values of the different PM fractions (in µg m−3) monitored continuously by the OPC from 10 to 17 of July 2017.
Remotesensing 13 02001 g006
Figure 7. July 2017 fine and coarse mode AOD derived from AERONET spectral deconvolution algorithm (SDA) retrieval.
Remotesensing 13 02001 g007
Figure 8. AOD vs. γ derived from AERONET data corresponding to 10–17 July 2017 period.
Remotesensing 13 02001 g008
Figure 9. Daily columnar volume particle size distributions dV(r)/dln(r) obtained from sun photometer measurements carried out in Naples from 10 to 15 of July 2017. The mean standard deviation was chosen as uncertainty for the data.
Remotesensing 13 02001 g009
Figure 10. Spectral dependence of the single scattering albedo (SSA) for biomass burning and desert dust episodes that occurred in the period 10–17 of July in Naples.
Remotesensing 13 02001 g010
Figure 11. Time variability of the range-corrected lidar signal (RCS) retrieved on 10 July 2017 from 08:17 to 10:26 UTC, with a spatial resolution of 15 m and a temporal resolution of 60 s.
Remotesensing 13 02001 g011
Figure 12. Lidar profiles of aerosol backscattering (backscattering (βa), extinction (αa), linear depolarization (δa) and lidar ratio (LR)) derived from Raman lidar observations carried out on 10 July 2017 in Naples.
Remotesensing 13 02001 g012
Figure 13. Time variability of the RCS lidar signal at 532 nm retrieved on 12 July 2017 from 07:00 to 13:48 UTC, with a spatial resolution of 15 m and a temporal resolution of 60 s.
Remotesensing 13 02001 g013
Figure 14. Lidar profiles of aerosol backscattering (βa) and linear depolarization (δa) derived from diurnal lidar observations carried out on 12 July 2017 in Naples.
Remotesensing 13 02001 g014
Figure 15. Time variability of the RCS lidar signal retrieved at 532 nm on 13 July 2017 from 05:48 to 16:48 UTC. The data have a spatial resolution of 15 m and a temporal resolution of 60 s.
Remotesensing 13 02001 g015
Figure 16. Lidar profiles of aerosol backscattering (βa), extinction (αa), lidar ratio (LR) and linear depolarization (δa) derived from Raman lidar observations carried out on 13 July 2017 in Naples.
Remotesensing 13 02001 g016
Figure 17. Time variability of the RCS lidar signal retrieved at 532 nm on 17 July 2017 from 09:33 to 11:03 UTC. Reported data have a spatial resolution of 15 m and a temporal resolution of 60 s.
Remotesensing 13 02001 g017
Figure 18. Lidar profiles of aerosol backscattering (βa), and linear depolarization (δa) derived from lidar observations carried out on 17 July 2017 in Naples.
Remotesensing 13 02001 g018
Figure 19. SEM-EDX analysis of the samples deposited on the ground at the Naples NF on 17 July 2017.
Remotesensing 13 02001 g019
Table 1. Daily mean values of PM mass concentration (µg m−3) measured by the OPC in the time period 10–17 July 2017 and corresponding PM2.5/PM10 ratio.
July 20171011121314151617
PM1013 ± 515 ± 532 ± 1033 ± 1524 ± 1424 ± 817 ± 855 ± 74
PM2.56 ± 38 ± 219 ± 824 ± 1315 ± 1215 ± 66 ± 137 ± 47
PM14 ± 37 ± 216 ± 721 ± 1311 ± 1111 ± 54 ± 134 ± 44
PM2.5/PM100.4 ± 0.10.6 ± 0.10.6 ± 0.10.7 ± 0.10.6 ± 0.10.6 ± 0.10.4 ± 0.10.7 ± 0.1
Table 2. Daily mean values of AOD, γ and SSA for period 10–17 July 2017.
July 201710th11th12th13th
AOD@440 nm0.21 ± 0.040.12 ± 0.010.29 ± 0.080.30 ± 0.14
γ (440/870)0.66 ± 0.151.08 ± 0.151.47 ± 0.171.68 ± 0.14
SSA@440 nm0.93 ± 0.030.94 ± 0.030.93 ± 0.030.96 ± 0.02
July 201714th15th16th17th
AOD@440 nm0.38 ± 0.130.44 ± 0.100.11 ± 0.030.17 ± 0.02
γ (440/870)1.63 ± 0.101.61 ± 0.051.05 ± 0.231.49 ± 0.13
SSA@440 nm0.96 ± 0.010.96 ± 0.030.92 ± 0.050.95 ± 0.03
Table 3. Mean values of AOD, LR and δa derived from lidar observations and measured in the layers observed in the time period 10–17 July 2017.
July 2017AltitudeLRδa
10 (SD)2000–4000 m28 ± 9 sr37 ± 7%
12 (Mixed)600–2800 m 13 ± 4%
13 (Fire)1750–3000 m37 ± 5sr3.9 ± 0.6%
17 (Fire)600–3000 m 4.1 ± 1.6%
Publisher’s Note: MDPI stays neutral with regard to jurisdictional claims in published maps and institutional affiliations.