Article

A Strong Kuroshio Intrusion into the South China Sea and Its Accompanying Cold-Core Anticyclonic Eddy in Winter 2020–2021

1
State Key Laboratory of Marine and Environmental Science, College of Ocean and Earth Sciences, Xiamen University, Xiamen 361102, China
2
Southern Marine Science and Engineering Guangdong Laboratory (Zhuhai), Zhuhai 519000, China
*
Author to whom correspondence should be addressed.
Remote Sens. 2021, 13(14), 2645; https://doi.org/10.3390/rs13142645
Submission received: 24 May 2021 / Revised: 23 June 2021 / Accepted: 2 July 2021 / Published: 6 July 2021
(This article belongs to the Special Issue Remote Sensing Applications in Ocean Observation)

Abstract

:
Multiple remote sensing datasets, combined with in-situ drifter observations, were used to analyze the Kuroshio intrusion through the Luzon Strait (LS). The results showed that a strong Kuroshio Current Loop (KCL) and accompanying anticyclonic eddy (ACE) existed in winter 2020–2021. As quantitatively demonstrated by the Double Index (DI), the Kuroshio Warm Eddy Index (KWI) had low values during a long sustained period compared to those in all other years in the available historical records. Remarkable kinematic properties (i.e., amplitude, diameter, propagated distance, lifespan and propagating speed) of the accompanying ACE were extracted by automatic eddy detection algorithms, showing that the ACE had a maximum diameter of 381 km and a peak amplitude of 50 cm, which significantly exceeded the previous statistics in winter. The orographic negative wind stress curl southwest of Taiwan Island and the westward Ekman transport through the LS during the winter half year of 2020–2021 both had large values beyond their historical maxima. Hence wind forcing is regarded as the primary forcing mechanism during this event. Alternating cyclonic eddies (CEs) and ACEs approaching on the east of the LS were identified, indicating that the interaction between the Kuroshio and the impinging CEs at proper locations made extra contributions to enhancing the KCL. The accompanying ACE had a distinctive feature of a cold-core structure at the surface layer, so as to be categorized as a cold core ACE (CC-ACE), and the temperature difference between the cold core and outer warm ring was maintained for three months. The generation and long duration of the CC-ACE may be due to the sustaining entrainment supported by the warm water from Kuroshio intrusion and the Northwest Luzon Coastal Current (NWLCC) successively.

Graphical Abstract

1. Introduction

The Luzon Strait (LS; Figure 1) is a primary channel for the mass and energy exchange between the Western Pacific (WP) and the South China Sea (SCS). The Kuroshio intrusion from the WP, with warm and high-salinity water, has a significant influence on the circulation and stratification of the SCS [1,2]. The seasonal variability shows a stronger intrusion in winter than in summer [3], and the surface water can reach the interior SCS especially in winter [4].
The Kuroshio intrusion is reported to have different spatial patterns. Qiu et al. [5] illustrated the SCS Branch of Kuroshio (SCSBK) as a west-flowing current with relatively high speed and steady direction on the continental slope in the northern SCS. Li and Wu [6] suggested that the Kuroshio often intrudes into the SCS by forming an anticyclonic loop and raised the concept of the Kuroshio Current Loop (KCL). Caruso et al. [7] depicted five different types of Kuroshio intrusion paths into the SCS, including a small anticyclonic bend, the SCSBK, the KCL, a detached anticyclonic eddy (ACE), and a cyclonic loop.
To quantitatively identify different paths of the Kuroshio intrusion, the Kuroshio SCS Index (KSI) was developed by Nan et al. [8]. Their results showed that the Kuroshio bending and the net inflow through the LS decrease from the looping path to the leaking path, and then to the leaping path. More recently, the Double Index (DI), which consists of the Kuroshio Warm Eddy Index (KWI) and the Kuroshio Cold Eddy Index (KCI), was proposed by Huang et al. [9], to identify the spatial patterns of the Kuroshio Warm Eddy Path (KWEP) and the Kuroshio Cold Eddy Path (KCEP), respectively. This DI can overcome the cancelling problem between the positive and negative geostrophic vorticities, so as to reduce the missing and misjudged Kuroshio path events.
The ACE accompanied by or shed from the KCL has also been extensively studied. The eddy kinetic energy (EKE) by satellite altimeter indicated that the region southwest of Taiwan Island has a high probability of eddy occurrences [10,11]. In-situ hydrographic observations have revealed that the ACE could be originated from the Kuroshio [12,13]. Systematic censuses on the ACE [11,14,15,16,17] have been made by means of automatic eddy detection algorithms, to extract the ACE’s features including location, diameter, amplitude, lifespan, propagation speed and distance. The statistics showed that more ACE shedding occurs in winter than in other seasons, and most of the shed ACEs propagate to the west with speeds similar to the first-mode baroclinic Rossby wave.
Mechanisms for the occurrence of the KCL and ACE and their properties (location, amplitude, sustaining period, etc.) still remain debatable. Metzger and Hurlburt [18] showed the nondeterministic nature of eddy shedding from the KCL, and no significant correlation could be found between the yearly Kuroshio intrusion and the oceanic and atmospheric environments. Yuan et al. [19] suggested that the anticyclonic intrusion of the Kuroshio is a transient phenomenon rather than a persistent circulation pattern. As a western boundary current flowing by the gap of the LS, multiple steady states of the Kuroshio and nonlinear hysteresis of the intrusion have also been demonstrated [20,21].
Wind stress (WS) and wind stress curl (WSC) are regarded as important mechanisms to generate meso-scale eddies in the SCS [22,23]. Wang et al. [24] suggested that the orographic wind jets during the wintertime monsoon and the gaps in the mountainous island chain along the eastern boundary of the SCS can spin up cyclonic eddies (CEs) and ACEs, and the region southwest of Taiwan is one of the regions with the coexistence of negative WSC and ACE occurrences. Jia et al. [15] demonstrated the linkage between ACE shedding and the wintertime monsoon, indicating the ACE shedding occurs within one month after the integrated Ekman transport through the LS exceeds the volume roughly corresponding to a mesoscale eddy. Wu et al. [25] concluded that the northwestward Ekman drift, due to northeasterly wind in winter, intensifies the Kuroshio intrusion into the SCS, and the WSC off southwest Taiwan is chiefly responsible for the Kuroshio intrusion.
Satellite observations have shown the abundance of generally westward-propagating eddies in the subtropical regions in the WP, and their effects on the Kuroshio and the SCS have received substantial attention [26,27,28]. Nonlinear Rossby eddies have been evidenced to penetrate through the LS into the SCS by cruise observation [29] and altimeter data [30], but the penetration has to take the form of coupling with the Kuroshio, instead of freely westward propagation. The approaching CEs and ACEs may reduce or enhance the Kuroshio transport [26,27], or lead to convergence and divergence upstream and downstream [31]. These effects further change the Kuroshio intrusion pathway in the LS. However, the correlation between the Kuroshio intrusion path and eddy activities in the WP is not statistically significant [32], and strong impinging eddies do not always have strong effects on the Kuroshio looping path [33].
ACE (CE) is usually associated with a warm (cold) core caused by eddy-induced convergence (divergence) motion. However, there are also some abnormal ACEs (CEs) with surface cold (warm) cores in the global ocean, hereby named cold-core ACEs (warm-core CEs). The surface cold (warm) core does not change the dynamic nature of the anticyclonic (cyclonic) spinning of the ACE (CE), because the spinning is mostly supported by the stratification at the subsurface layer. Such abnormal eddies are observed in different regions in the Pacific, and the Kuroshio Extension region is the most active area for cold-core ACEs (CC-ACEs) and warm-core CEs (WC-CEs) [34,35,36]. However, the ACEs shed from the KCL have rarely been reported to have a cold-core structure in previous studies. As summarized by Sun et al. [36], two possible mechanisms for generating the abnormal eddies are: (1) instability during the decay stage and (2) eddy-eddy interaction and horizontal entrainment. An alternative mechanism is the local generation by eddy–wind interaction as demonstrated by McGillicuddy [37].
The present paper provides a case study on a strong Kuroshio intrusion and its accompanying CC-ACE in winter 2020–2021. By a batch of surface drifters deployed in the LS, we captured notable surface intrusion of Kuroshio into the SCS, as well as a cold-core structure of the accompanying ACE. We used multiple remote sensing data to analyze the strong amplitude and other distinctive features of this event. The occurrence of strong KCL and ACE in winter 2020–2021 further demonstrated the energetic inter-annual variability of the Kuroshio intrusion, and we took this opportunity to verify the mechanisms responsible for these events, including the wind forcing and mesoscale eddy activities mentioned above.

2. Materials and Methods

Multiple remote sensing datasets were used in the present study, including sea surface height (SSH), sea surface temperature (SST) and sea surface wind (SSW), with the available time span from 1993 to 2021. Reprocessed datasets were preferably selected for better quality, while near real-time ones were used as alternative for the most recent months.
The level-4 product of daily global gridded SSH is processed by the DUACS multi-mission altimeter data processing system, incorporating data sources from all altimeter missions: Jason-3, Sentinel-3A, HY-2A, Saral/AltiKa, Cryosat-2, Jason-2, Jason-1, T/P, ENVISAT, GFO and ERS1/2. The SSH maps are presented in the forms of both sea level anomaly (SLA) and absolute dynamic topography (ADT), with a spatial resolution of 0.25° × 0.25°. The geostrophic currents derived from ADT are also provided.
The SST data used here were the Foundation SST by the Operational Sea Surface Temperature and Ice Analysis (OSTIA) system [38]. In-situ and satellite observations from both infrared and microwave radiometers were combined to produce the daily maps of the SST for the global ocean, with a high resolution of 0.05° (approximately 6 km).
For SSW data, the IFREMER CERSAT Global Blended Mean Wind Fields include wind components (meridional and zonal), wind module, WS, and WSC. The wind fields are six-hourly with a 0.25° × 0.25° spatial resolution over global oceans.
During a cruise expedition through the LS en-route to the WP in December 2020, we deployed a batch of self-developed satellite-tracked surface drifters, named Surface Current Experiment (SUCE) drifters. These drifters were of identical design and configuration as the standard Global Drifter Program (GDP) drifters [39], with a surface floating sphere and a holey-sock drogue. Horizontal surface current velocities were derived based on the drifter trajectories, and SST samplings were acquired based on the integrated temperature sensor. In this study, we used observation data of eight drifters (Table 1) in the LS and surrounding area. The data records were reprocessed to a sampling interval of 1 h, in accordance with the data quality control procedures of GDP [40].

3. Results

3.1. DI Performance

According to Huang et al. [9], the DI is calculated by Equations (1) and (2), as the integral of positive part and negative part of the surface geostrophic vorticity in the area of 119°E–121°E and 20°N–22°N (BOX1 in Figure 1), respectively:
K C I = s i g n ( v x u y ) ( v x u y ) d A
K W I = s i g n ( ( v x u y ) ) ( v x u y ) d A
where u and v are the zonal and meridional components of the geostrophic currents derived from ADT, A is the integral area, and sign(x) is the sign function defined as follows:
s i g n ( x ) = { 1 ,     x 0 0 ,     x < 0  
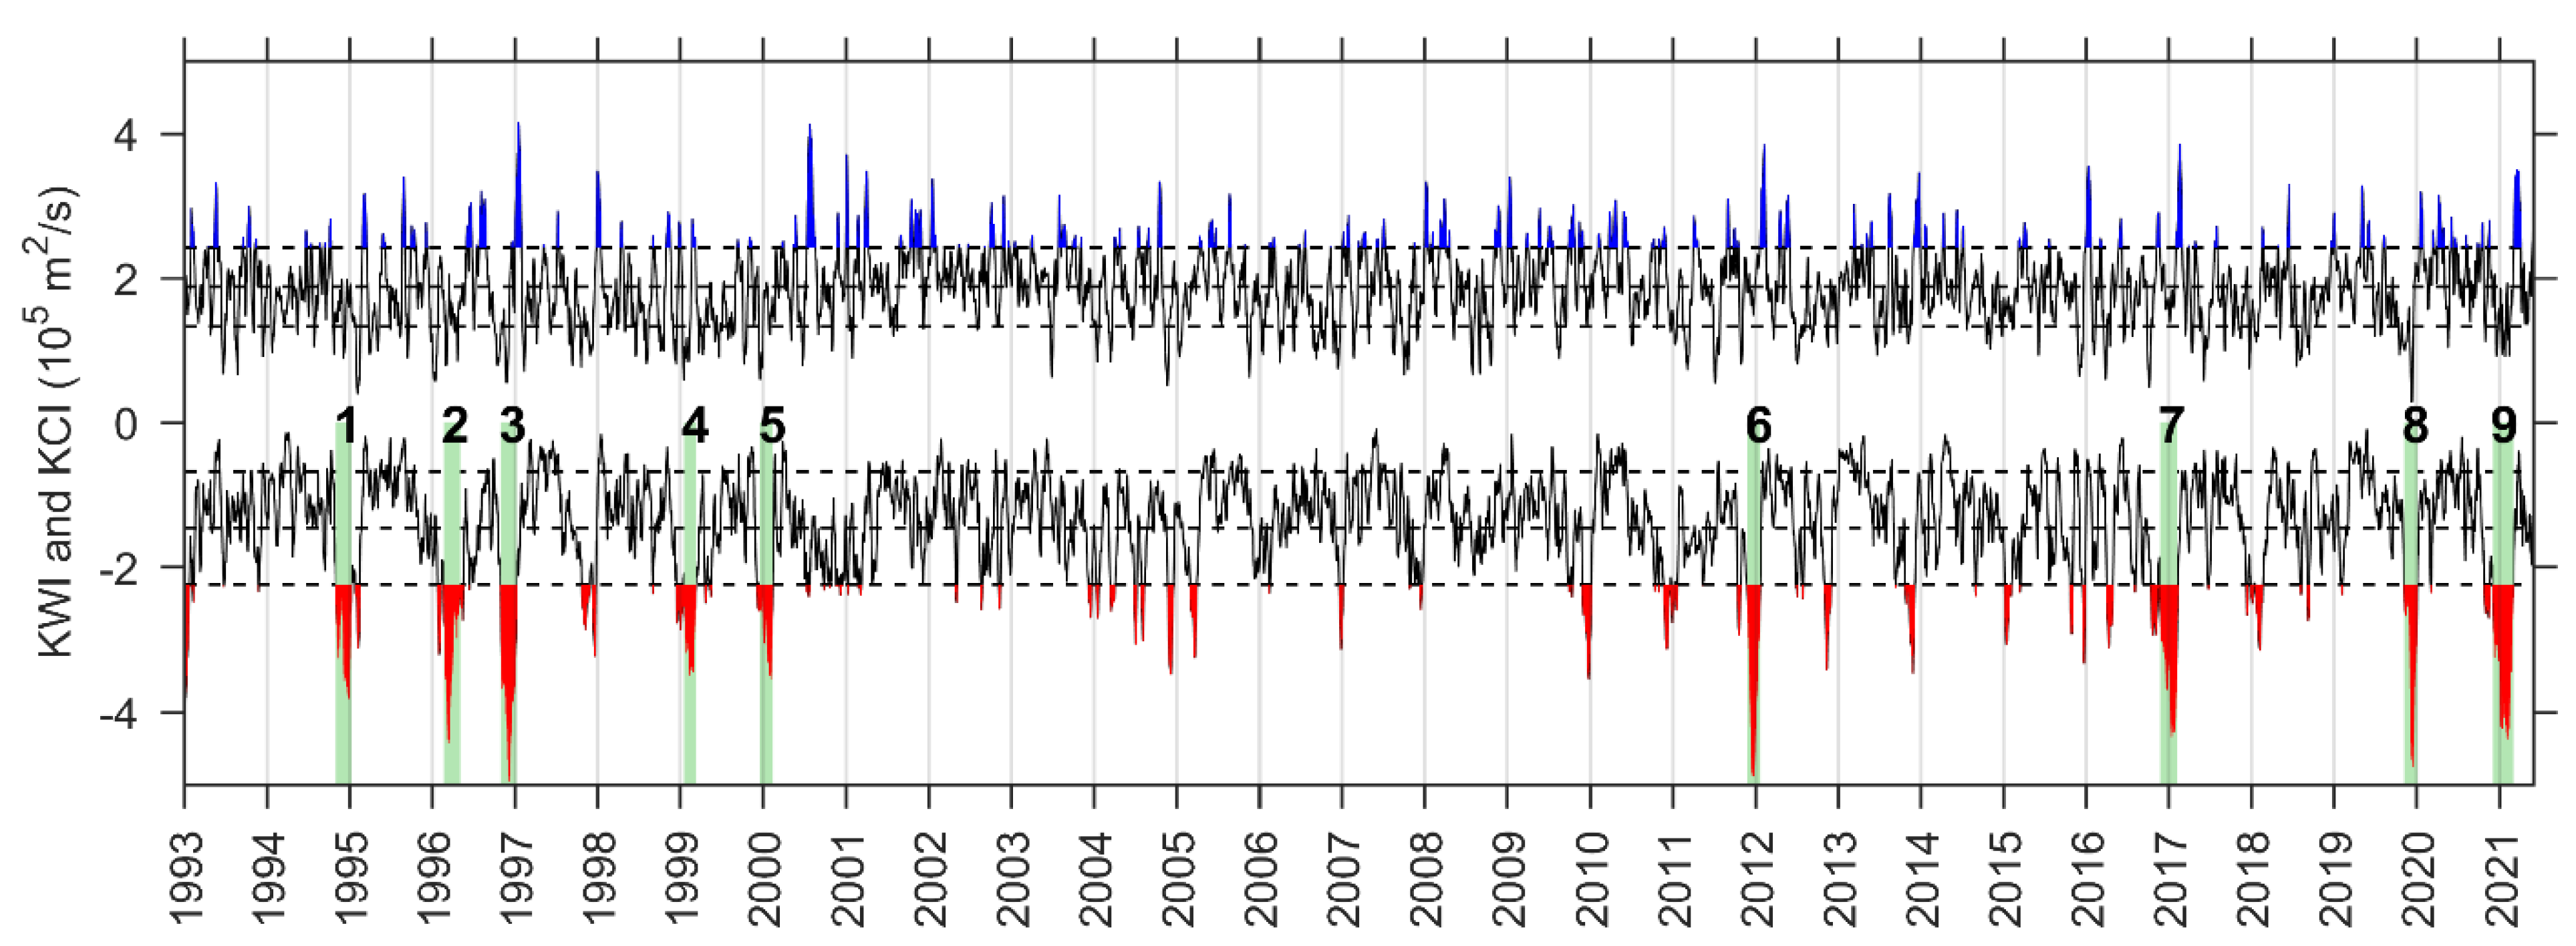
The time-series of the daily KCI and KWI from 1993 to 2021 are shown in Figure 2. The winter 2020–2021 had a very strong KWEP event (KWI going lower than its standard deviation from its mean). During a typical KWEP, the main Kuroshio enters the SCS in the middle part and outflows in the northern part of the LS in an anticyclonic pattern with a warm eddy southwest of Taiwan Island [9]. From the whole 28-year time series, we choose nine strong KWEP events which met the criterion of having sustained periods longer than 40 consecutive days, and listed in Table 2 are their main features including sustained period, minimum KWI value and integral KWI value. Although the 2020–2021 event had a minimum KWI value of −4.38 × 10⁵ m2/s, slightly weaker than that of the 1996–1997 event, the sustained period (as long as 90 days) and integral value (–316.0 × 10⁵ m2/s day) both significantly exceeded all other events. Such KWI performance indicated a remarkable KCL in the LS, as well as a prolonged ACE southwest of Taiwan Island. The detailed evolution of the DI in winter 2020–2021 will be discussed in the following sections.

3.2. Detailed Evolution

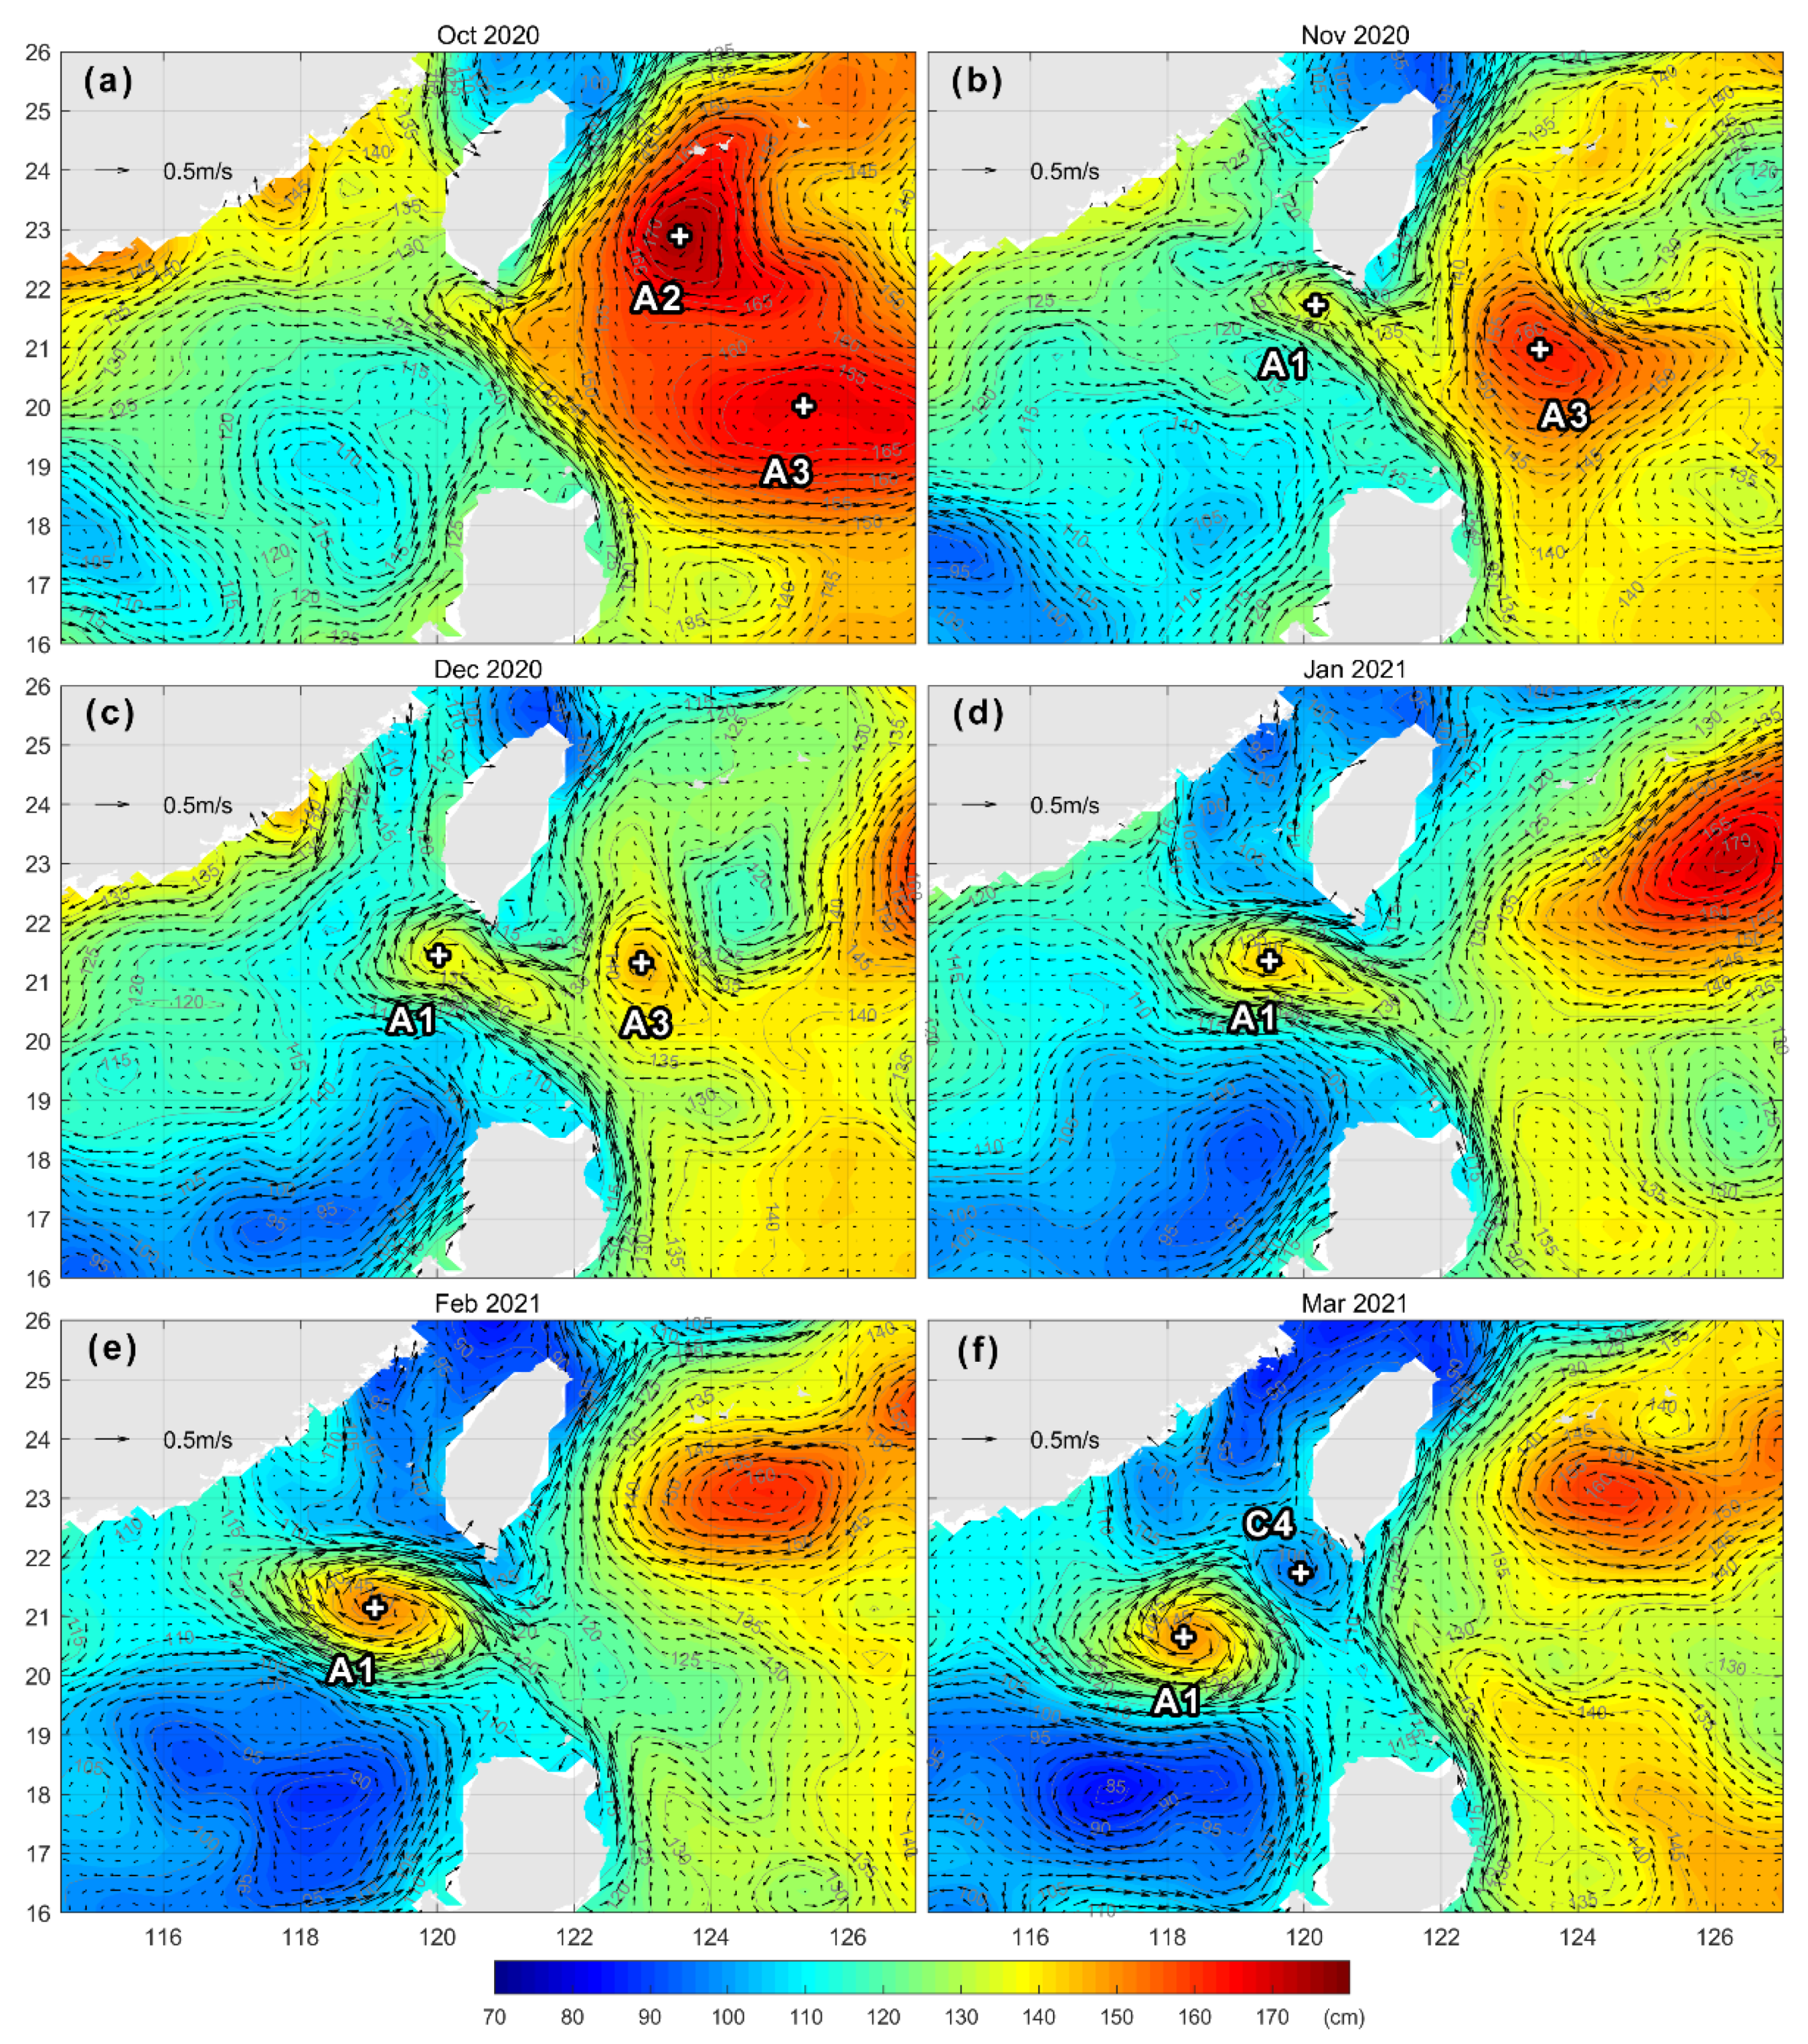
To further investigate the evolution of the KCL and its accompanying ACE, we present the time series of monthly averaged ADT and the derivative surface geostrophic current from October 2020 to March 2021 in Figure 3. In October 2020, the Kuroshio had strong currents with a speed up to 1.0 m/s across the LS and along the east coast of Taiwan Island. The main axis of the current slightly bent towards the west in the northern LS, and a current loop pattern (i.e., KCL) started to form. From November 2020 to January 2021, the KCL was fully established. The intrusion current in the middle of the LS gradually turned from northwestward to westward, and reached a maximum speed of 1.0 m/s in December, making a strong inflow jet toward the SCS. Closed ADT contours were gradually developed to make an ACE (denoted as A1 in Figure 3) accompanying the KCL, and it kept intensifying with rising ADT at the eddy core.
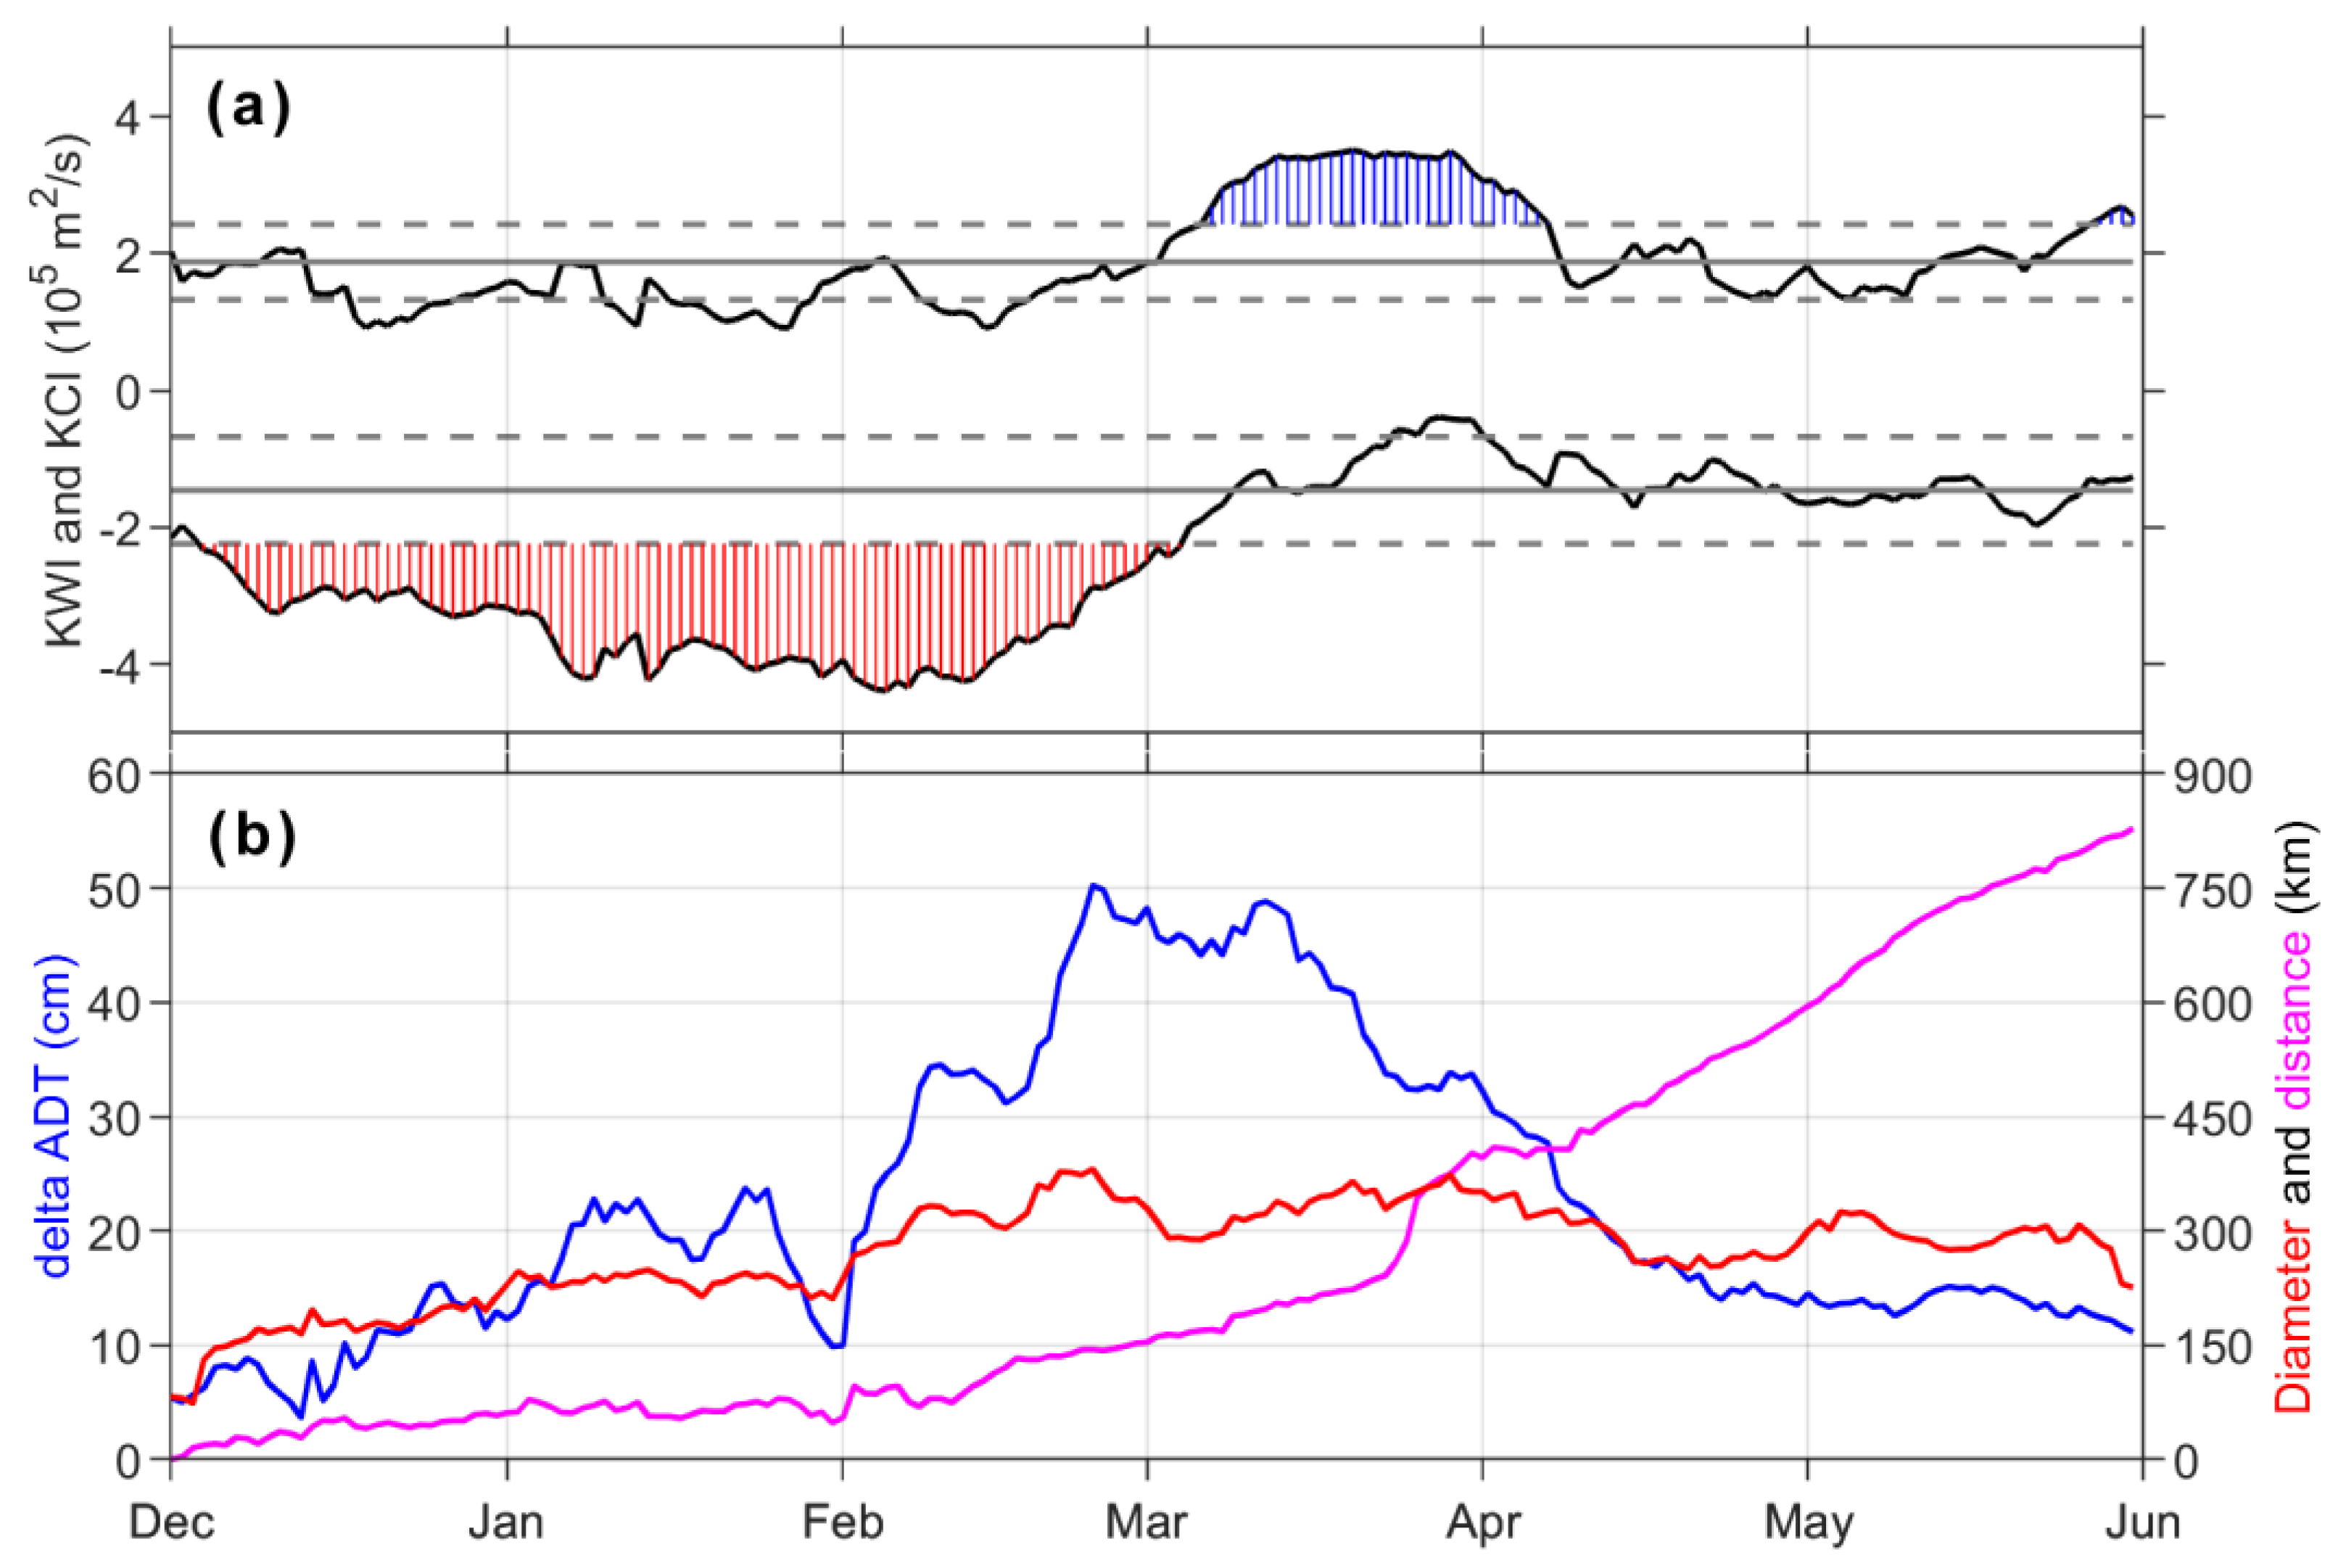
In February 2021, the ACE reached its peak state, with a maximum ADT of 150 cm at the center, and a maximum current speed of 1.2 m/s at the edge. As slowly propagating to the southwest, the eddy started to detach from the KCL, and the Kuroshio current became significantly weaker in the LS area. In March 2021, the ACE was completely detached from the KCL, and continued to propagate southwestward, maintaining its high ADT amplitude and current speed. A CE (C4 in Figure 3f) formed immediately on the east, which was once the original position of the ACE. The Kuroshio path finished converting from the KWEP to the KCEP, with a minimal bending of its main axis in the middle of the LS, which can also be verified by the detailed evolution of the KWI and KCI from February to March 2021 in Figure 4b.
Accordingly, the detailed evolution of DI is shown in Figure 4a. As indicated by the KWI and KCI, the Kuroshio maintained the KWEP for the whole three months from December 2020 to February 2021, and immediately converted to a KCEP in March 2021.
The automatic eddy detection algorithm by geometric criterion [41,42] was adopted to extract the ACE and its kinematic properties. The eddy identification process was performed in each daily ADT map, through two stages: (1) The identification of the local ADT maximum corresponding to the eddy center and (2) the selection of closed ADT contours associated with each eddy. The outermost contour embedding only one eddy center was considered as the eddy edge. The eddy amplitude is defined as the difference between the ADT at the center and that along the edge, while the eddy diameter D is defined as the diameter of a circle with the same area as the eddy area (AE) enclosed by the eddy edge:
D = 4 A E / π ,
The evolution of the above kinematic properties (i.e., amplitude, diameter and propagated distance from the starting position) of the ACE is shown in Figure 4b. We also summarized the statistics of the eddy properties (i.e., amplitude, diameter, propagated distance, lifespan and propagating speed) provided by five previous studies [11,14,15,16,17] about the wintertime ACE shed from the KCL in Table 3, together with the estimates in the present study to make a comparison in the following paragraphs.
The amplitude of the ACE in winter 2020–2021 exhibited a sustained but undulating increase, from as low as 5 cm at the beginning of December, all the way to the peak stage of 50 cm at the end of February, and started to decrease in March. Meanwhile, the eddy diameter had a similar increasing trend matched with the growth of amplitude, reaching a maximum value of 381 km in the peak stage, and basically maintained this scale afterwards. The peak amplitude and diameter in the present study are remarkably higher and larger than the average amplitudes ranging from 11 to 12 cm and the average diameters from 128 to 244 km by all listed previous studies. More importantly, they also exceeded the maximum amplitude of 47 cm and the maximum diameter of 320 km based on the most recent statistics by Wang et al. [17], becoming the strongest ACE shed from the KCL in winter in the available historical records.
By the end of May 2021, this ACE had propagated 820 km from its original position southwestward during a time span of 182 days, hence the average propagating speed being 5.2 cm/s, which is a moderate speed among the average speeds in the listed statistics. The current lifespan and propagated distance had already exceeded the average lifespan from 29 to 108 days and the average distance from 195 to 433 km in Table 3, but remained less than the maximum lifespan of 273 days and the maximum distance of 1879 km by Nan et al. [16]. The time series in the present study stops here, but with the remaining scale and amplitude, a considerable long lifespan and propagating distance in the future months can be expected.

3.3. Surface Cold-Core Structure

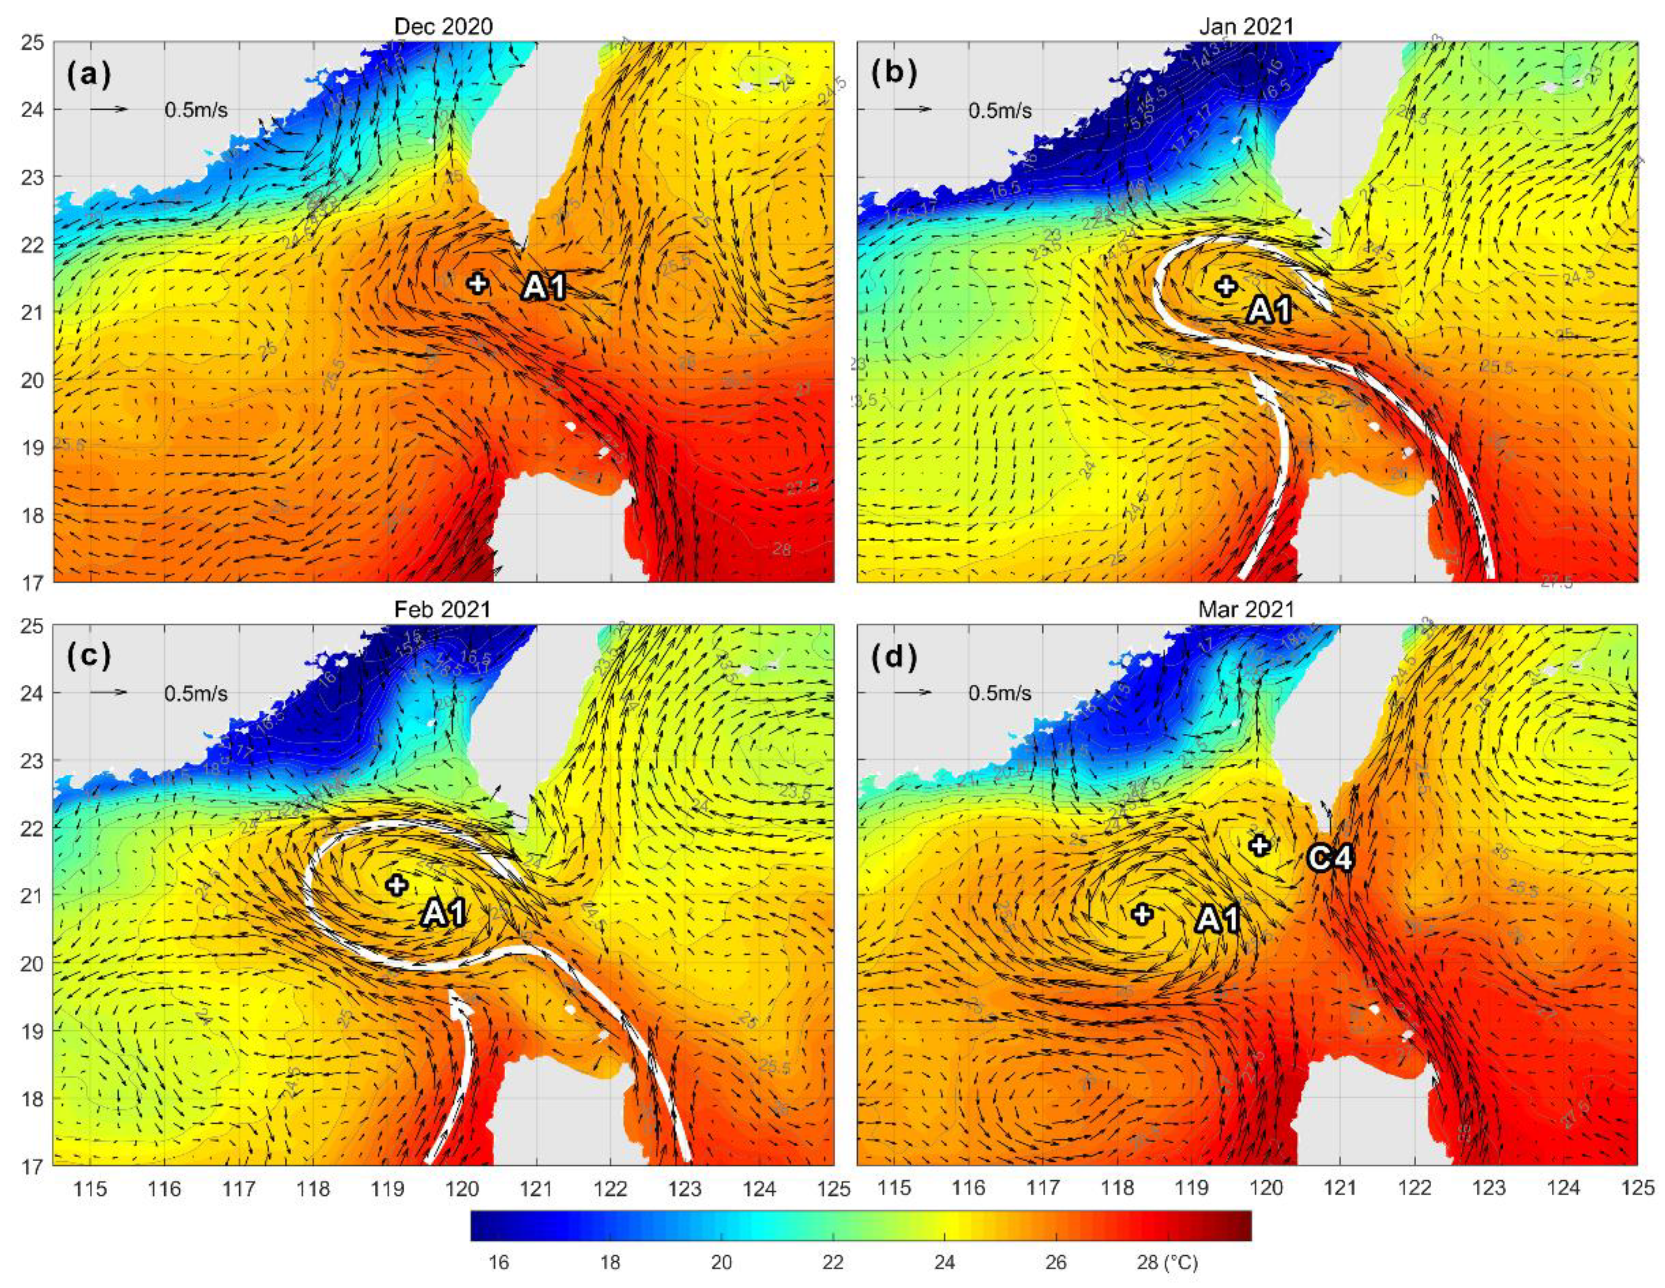
Another distinctive feature of the ACE in winter 2020–2021 is the cold-core structure at the surface layer, as revealed by the time series of monthly averaged SST shown in Figure 5. Hence, this eddy can be categorized as a CC-ACE, which is uncommon since it is apparently against the convergence and downwelling nature of ACEs.
In December 2020, the overall SST gradient from north to south in the study area had already been established, so the Kuroshio water and the SCS water at the same latitude could be directly distinguished by the SST distribution. The warm tongue injected by the Kuroshio current into the SCS had an SST higher than 26.0 °C and bent to the right on the southwest of Taiwan corresponding to the current loop pattern (i.e., KCL). However, the SST contours were not closed at the eddy center.
In January 2021, the structure of a cold core enclosed by a warm ring was clearly formed. The cold core had an SST of 24.7 °C, significantly lower than that along the outer ring of approximately 25.5 °C. The warm water was mainly supplied by the westward jet of the Kuroshio (i.e., KCL) through the LS between 20°N and 21°N. The cold-core structure was maintained until February, with a center SST of 24.2 °C. However, the outer ring of warm water expanded to a larger scale. The Northwest Luzon Coastal Current (NWLCC) [43] had also joined with the Kuroshio intrusion to supply warm water.
In March 2021, the warm ring pattern started to collapse, leaving a faint cold core at the eddy center. Moreover, another core with an even lower SST induced by the CE C4 on the east emerged.

3.4. Verification by Drifters

We used the in-situ SST and surface current by drifter observations to verify the features of the Kuroshio path and the accompanying ACE. Figure 1 shows the overall trajectories of the eight drifters deployed in December 2020. Among them, seven drifters were entrained by the strong westward intrusion jet between 20°N and 21°N through the LS into the SCS, and only one drifter stayed in the WP. In particular, Drifter 1485504 (orange line in Figure 1) was tightly trapped by the ACE, and stayed at the eddy core with anticyclonic spinning for the rest of the eddy lifespan, indicating a strong surface convergence.
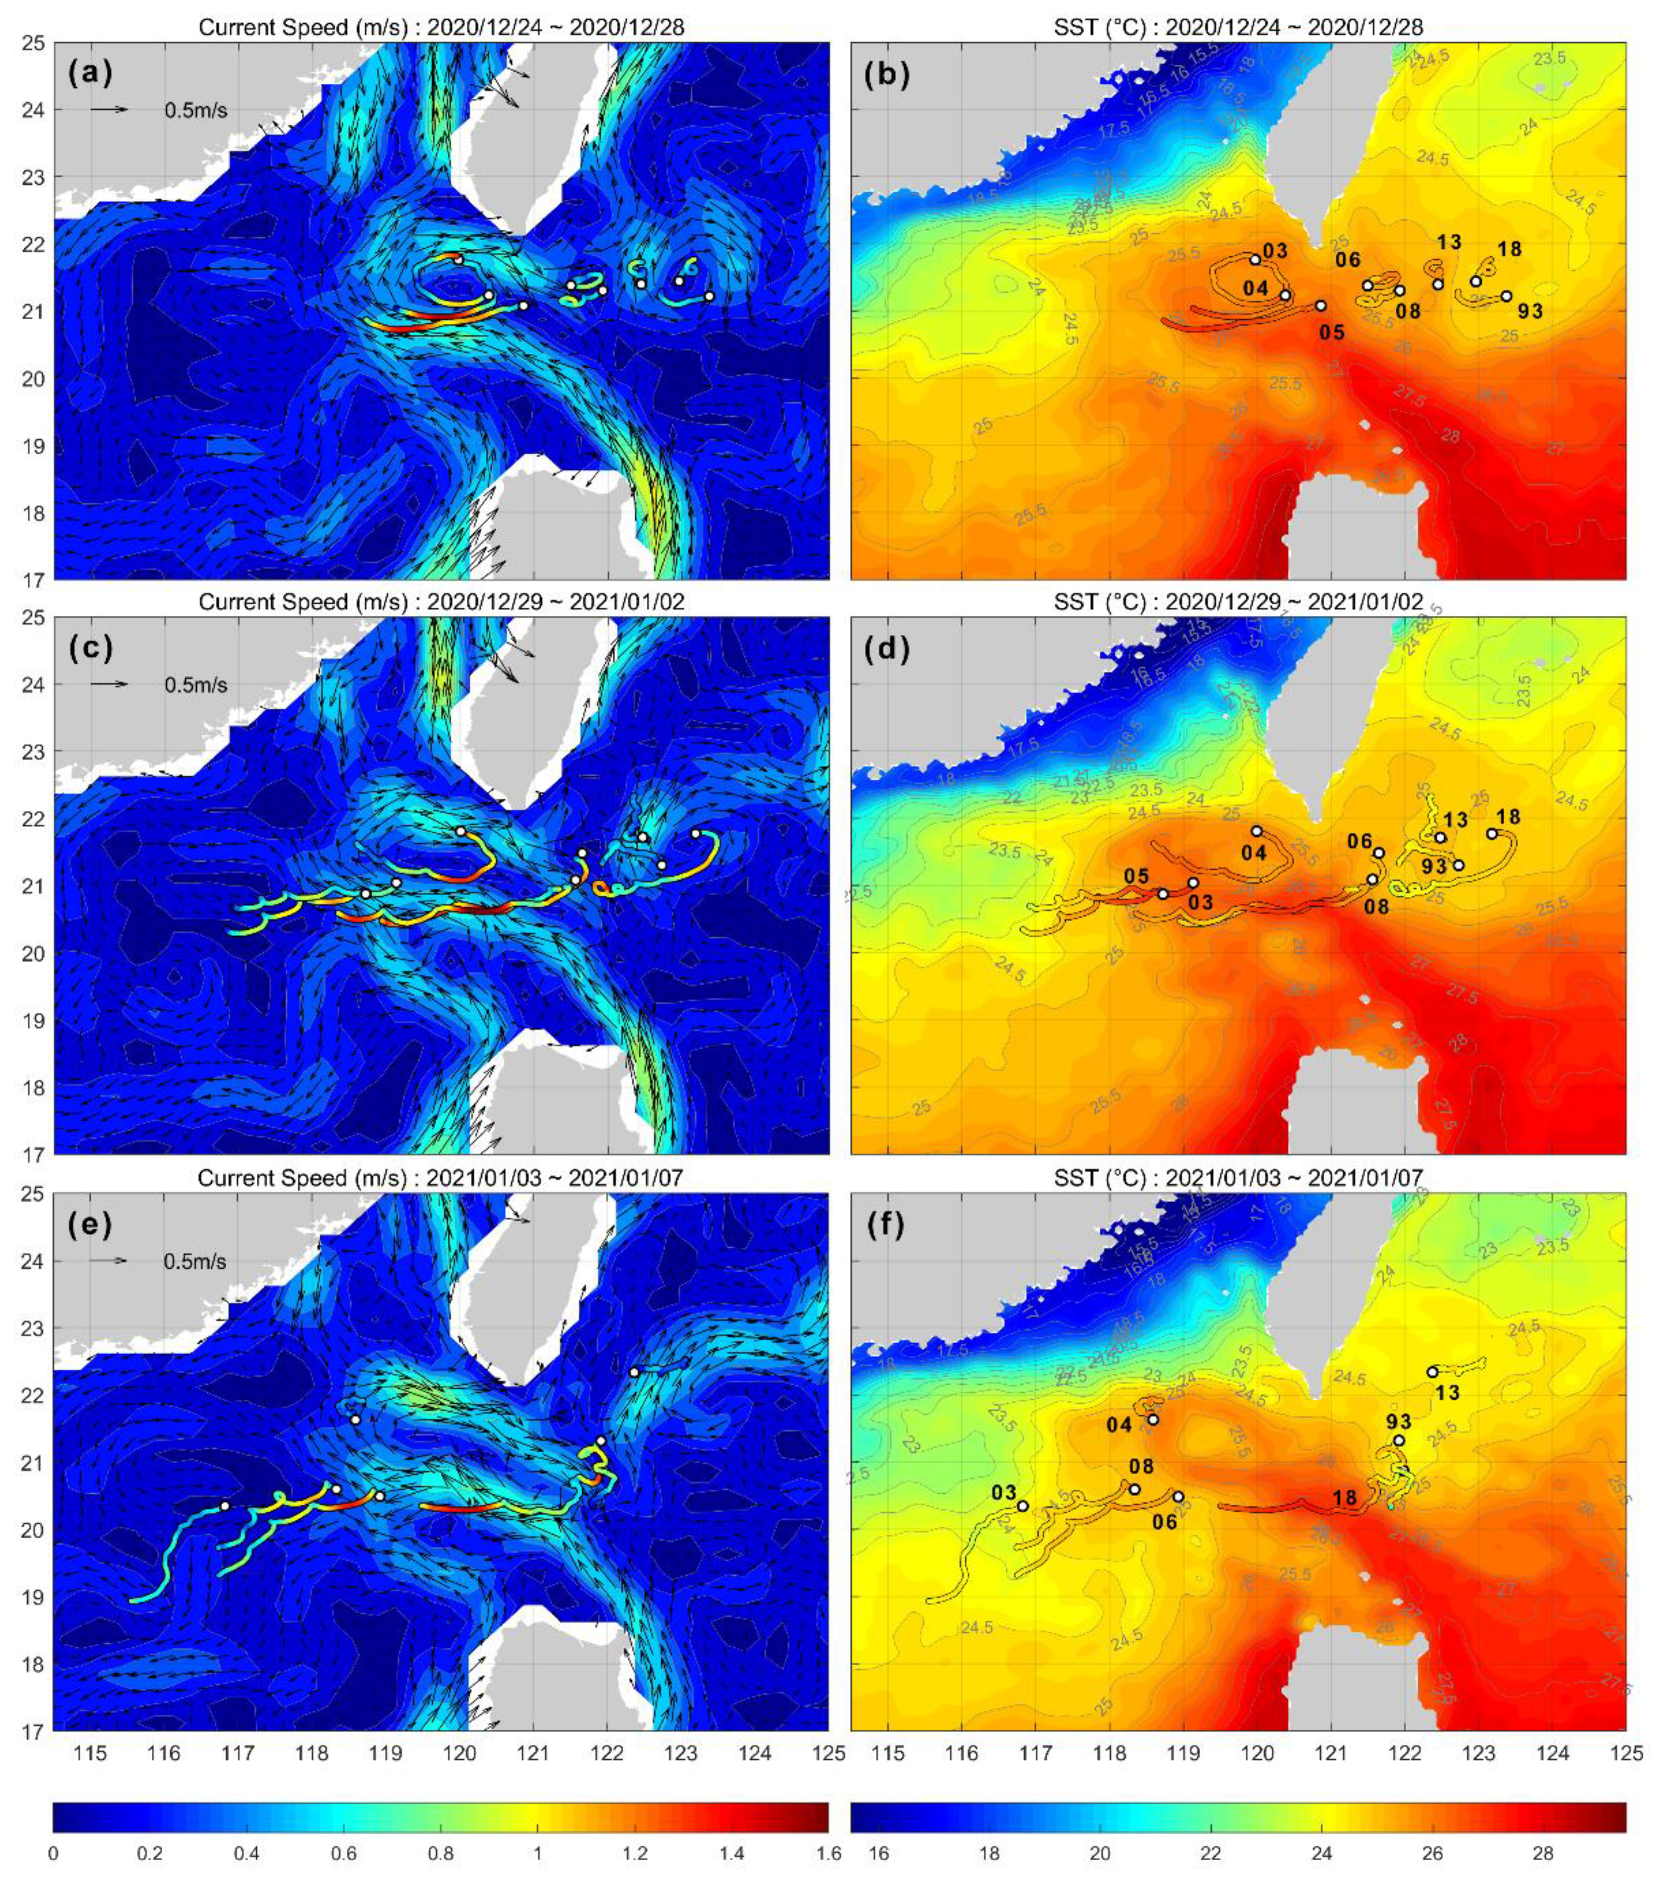
The drifter observation during the beginning days from 24 December 2020 to 7 January 2021 is shown in Figure 6. Strong westward currents along the trajectories were observed in the middle of the LS between 20°N and 21°N, with a maximum current speed of 1.6 m/s. The geostrophic current by ADT at the corresponding period showed the same pattern of intrusion flow in the LS, but the maximum speed was only 0.7 m/s. Note that the current observation by drifters is the total surface current, including the components of geostrophic current, Ekman current, tidal current, etc. Given that the tidal current in the middle of the LS is not strong (less than 0.2 m/s; e.g., [44]), the Ekman component in the strong intrusion took an important part.
The high SST of the intruding warm tongue and the outer warm ring of the ACE were also observed by drifters. The maximum in-situ SST in the middle of the LS was 27.4 °C, even higher than the counterpart by remote sensing, which is probably due to the smoothing effect in the gridded SST product.
Similar to the eddy center indicated by ADT, the daily position of the cold core was also identified at the point with minimum SST around the eddy area. The migration of the eddy center and the cold core center from December 2020 to March 2021 are compared in Figure 7a, together with the floating position of Drifter 1485504 trapped in the ACE. Along with the southwestward propagation of the ACE, the cold core center kept following the eddy center for the entire time span, within a maximum deviation of approximately 50 km. Around 20 days after the deployment of Drifter 1485504, it was tightly trapped around the eddy center and the cold core center, with a spinning radius of approximately 50 km. The floating trajectory was closer to the cold core center than to the ADT center. Due to the relatively coarse resolution of the ADT product and the wide interval between satellite tracks, the cold core by remote-sensing SST provided a better way for tracing the ACE’s migration.
The SST at the cold core center and along the outer warm ring are compared in Figure 7b, together with the in-situ SST by Drifter 1485504. The temperature difference between the cold core and the outer warm ring was established and maintained since late December 2020, and reached a maximum value of 1.7 °C in late January 2021. The drifter SST closely followed that at the core center since mid-January 2021, as a result of the tight trapping by the ACE.

4. Discussion

The above results demonstrated the strong KCL intrusion and accompanying ACE in winter 2020–2021. We analyze the contributing factors for this event, in the aspects of local wind forcing and approaching eddies from the WP.

4.1. Wind Forcing

Figure 8 shows the monthly averaged SSW and WSC from September 2020 to February 2021. Under the control of the wintertime northeast monsoon, the WSC around the LS exhibited a strong dipole on the southwest of Taiwan Island, due to the orographic effect [24]. Intensive positive and negative WSCs were established and maintained from September 2020 to January 2021, and started to decrease in February 2021. The pattern and location of the dipole were basically the same as the monthly climatology, but the negative WSC reached a minimum value of −6 × 10⁻⁷ N/m3 in December 2020, largely exceeding the climatology minimum value of −2 × 10⁻⁷ N/m3. The location of the negative WSC basically covered the BOX1 area in Figure 1, and was also consistent with the locations of the KCL and ACE in the generation and rising phases. The spin-up effect by the negative WSC was in favor of the negative surface current vorticity in this region.
In analogy to the KCI and KWI based on geostrophic current, we can also define the KCIWS and KWIWS as the integral of the positive and negative parts of WSC in the same area of 119°E–121°E and 20°N–22°N (BOX1 in Figure 1 and Figure 8):
K C I W S =   s i g n ( C )   C   d A
K W I W S =   s i g n ( C )   C   d A
where C is the sea surface WSC. The time-series of the daily KCIWS and KWIWS from 1993 to 2021 is shown in Figure 9a. Low KWIWS values beyond the standard deviation only occurred in the winter half of the year from October to March in most of the years. Although winter 2020–2021 did not have the lowest daily KWIWS value across the whole time series, its averaged value over the winter half of the year reached as low as −1.2 × 10⁴ N/m, significantly exceeding those of all other years. Since wind forcing could be an important generation mechanism for the eddy activity in the SCS [22,23,24], it is evident that the strong and sustaining negative WSC southwest of Taiwan made unusual contributions to the generation and maintenance of the KCL and ACE in winter 2020–2021.
It has been suggested by Farris and Wimbush [45] that local winds have a direct effect on the Kuroshio intrusion, and the expansion of the KCL is largely determined by the time-integrated WS in the LS. Jia et al. [15] further demonstrated that the ACE shedding from the KCL occurs within one month after the integrated Ekman transport through the LS exceeds a volume of approximately 2 × 10¹² m3. The Ekman transport through the LS (across the meridional section at 121°E) was calculated based on the WS data and is presented in Figure 9b. Similar to the orographic WSC, the Ekman transport in 2020–2021 also had strong and sustaining inflow in the winter half of the year. The averaged Ekman transport over the winter half of the year reached –1.0 × 10⁶ m3/s, rated as the strongest Ekman transport inter-annually based on the available WS observation. Such strong transport will easily accumulate the volume beyond 2 × 10¹² m3 in less than one month, so as to expand the KCL and induce the ACE shedding in winter 2020–2021.

4.2. Impinging Mesoscale Eddies

Eddy activities in the WP east of the LS during autumn and winter 2020 were examined to discern their influence on the Kuroshio. In general, CEs may reduce the Kuroshio transport by affecting the zonal gradient of the SSH [26,27] or by the resulting upstream convergence and downstream divergence [31]. The reduced Kuroshio transport further provides a favorable condition for its intrusion into the SCS according to the nonlinear hysteresis theory [20,21], and thus induces a westward extension of the Kuroshio pathway into the SCS to form the KCL. Meanwhile, ACEs have the opposite effect, decreasing the looping path.
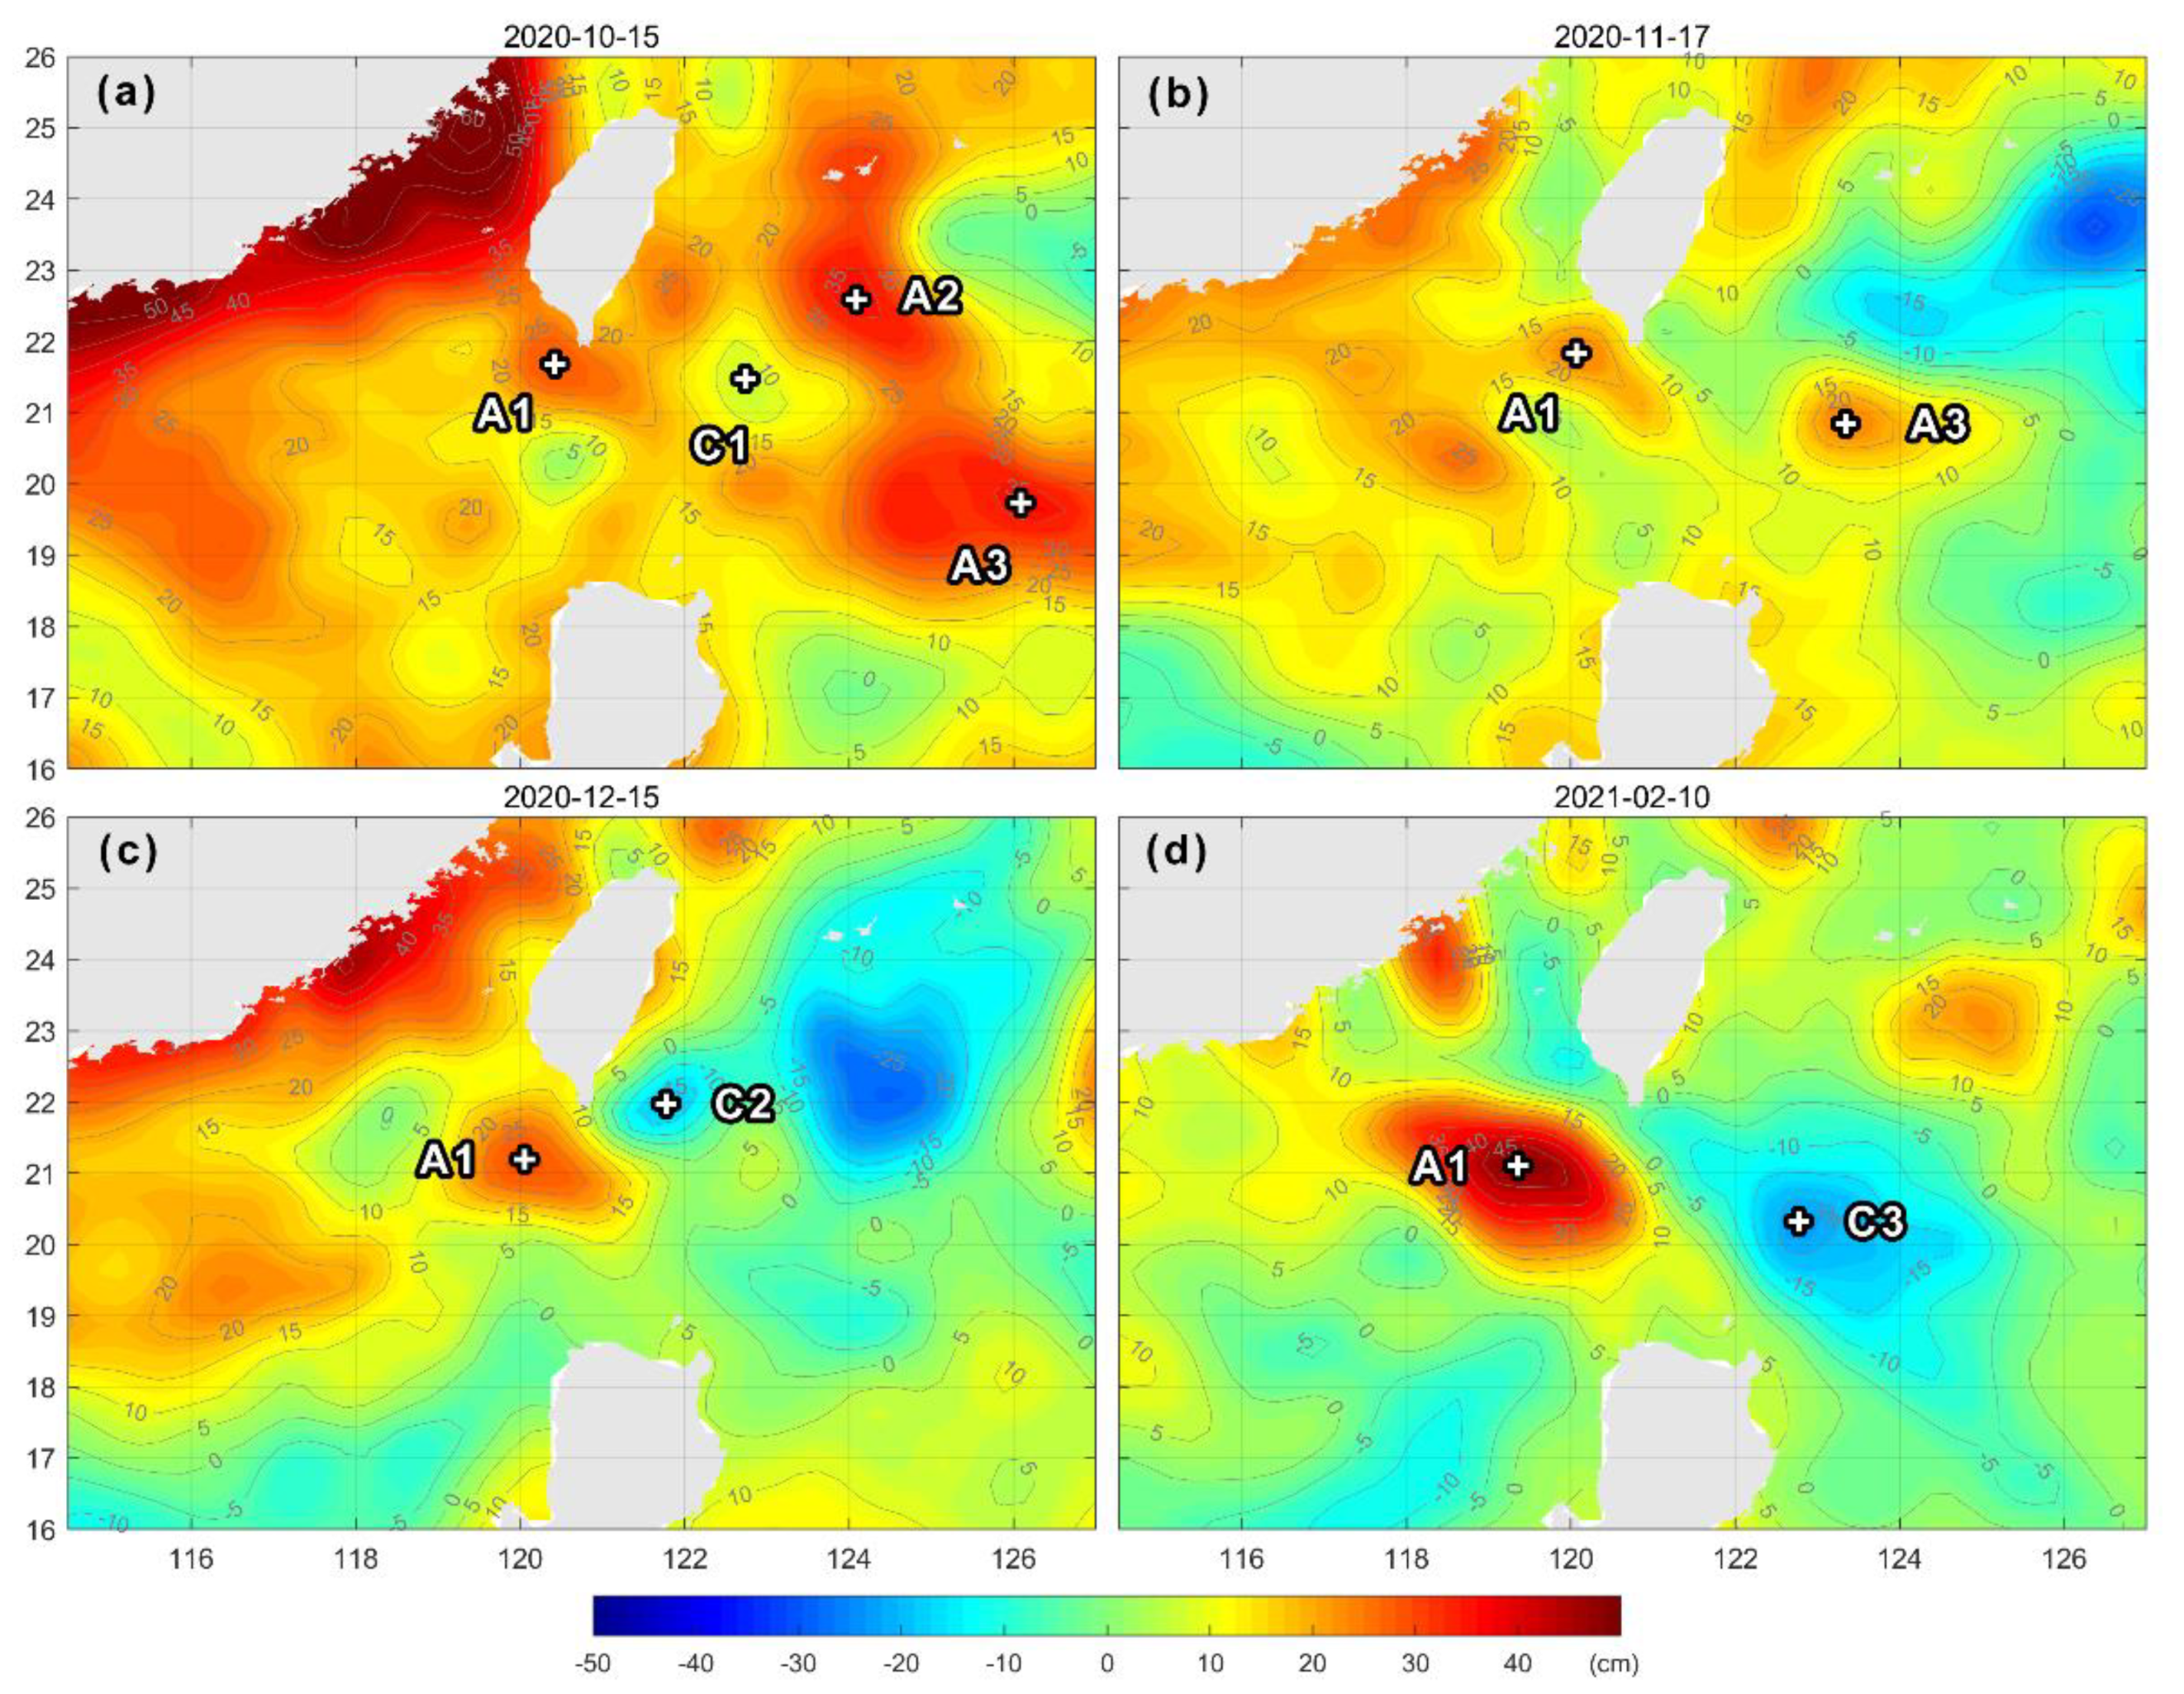
Since the KCL and ACE event in this study was sustained for approximately four months from November 2020 to February 2021, there were quite a few CEs and ACEs impinging into the Kuroshio at the segment across the LS. As shown in Figure 10, three CEs (C1~C3) and one ACE (A3) propagated westward and finally approached on the east of the LS in different months. Hence, C1~C3 tended to enhance the KCL at their respective time, while A3 tended to decrease the KCL. According to composite analysis by previous studies [33,46], a typical strong KCL corresponds to an impinging CE at a key interaction region around 20°N and 123°E, and the KCL reaches its maximum when the CE arrives at the interaction region after westward propagation. The C3 in February 2021 in our study was apparently such a case, and the looping path accompanied by ACE A1 at the corresponding time was also approximately at the maximum state, which agrees well with the composite pattern. However, C1 and C2 were not so typical, given their location and relatively small scale.
The alternating CEs and ACEs in this region had evolution periods of approximately one month, and the enhancing/decreasing effects of the eddies also faded away within one month according to the composite analysis. While the KCL event in our study exhibited a stable evolution and a rather long period of approximately four months. Thus, the contribution by the eddy activities should not be regarded as the dominant factor for the KCL and ACE event in winter 2020–2021.
Besides the mechanisms discussed above, there are some other factors influencing the performance of the KCL and ACE, such as the intensity of the upstream Kuroshio east of Luzon Island and the North Equatorial Current bifurcation latitude. However, no significant correlation could be found between the inter-annual Kuroshio intrusion and these oceanic and atmospheric environments [18]. It is also beyond this study’s scope to provide a clear relationship to link the KCL and ACE events in the 28-year historical records with the aforementioned influencing factors.
As for the case in winter 2020–2021, because the forcing indicators (KWIWS and Ekman transport) and the resultant index performance (integral KWI and sustained period) had values lower than their respective historical extremes in the same year, we suggest that the overwhelming wind forcing was the primary mechanism during this event, with or without the contribution of other factors. A similar case can be found for the KWEP event in winter 2019–2020 (Event 8 in Table 2), when the average KWIWS was −0.92 × 10⁴ N/m, and the Ekman transport was −0.76 × 10⁶ m3/s, both were the second lowest values in the available records. However, when wind forcing was not overwhelming enough in other years, such as the case in winter 2007–2008, there may have been no KCL and ACE occurrences due to the balancing between favorable and unfavorable mechanisms.

4.3. Mechanism for the Surface Cold-Core Structure

The cold-core structure of the ACE shed from the KCL in this study was not common in previous events. As demonstrated by McGillicuddy [37], such a cold-core structure at the surface layer can be generated by local cyclonic wind forcing upon ACEs. Since the CC-ACE in winter 2020–2021 was mainly covered by the negative orographic WSC southeast of Taiwan, it was not a case of such eddy–wind interaction formation mechanism. Given the strong surface flow by drifter observation and Ekman transport in the LS, this CC-ACE event was attributed to the horizontal entrainment [36] of local cold water by the warm KCL water.
In general, most abnormal eddies (CC-ACEs and WC-CEs) cannot survive longer than two weeks [35]. Although it was under the unfavorable condition of strong anticyclonic wind forcing, the CC-ACE in winter 2020–2021 lasted for as long as three months. The long duration of entrainment was stably supported by the warm water from the Kuroshio intrusion and the NWLCC successively, making it a rare case. The continuous surface warm water supply demonstrated the intensity and stability of the Kuroshio intrusion from another aspect.

5. Conclusions

Multiple remote sensing datasets including SSH, SST and SSW, combined with in-situ drifter observations, were used to analyze the Kuroshio intrusion through the LS. The results showed a strong KCL and accompanying ACE in winter 2020–2021.
As quantitatively demonstrated by the DI, the KWI had an integral value of −316.0 × 10⁵ m2/s·day during the sustained period as long as 90 days, depressed lower than the values in all other years, making it the strongest and longest KCL event in the available historical records.
The KCL started to form in October 2020, and was fully established and maintained from November 2020 to January 2021, and finally converted to a KCEP from February to March 2021 along with the accompanying ACE’s detachment.
Remarkable kinematic properties (i.e., amplitude, diameter, propagated distance, lifespan and propagating speed) of the shed ACE were extracted by the automatic eddy detection algorithm. It had a maximum diameter of 381 km and a peak amplitude of 50 cm, which significantly exceeded the maximum values of 320 km and 47 cm by previous statistics, rated as the strongest ACE shed from the KCL in winter.
The contributing mechanisms for the KCL and ACE event were analyzed. The orographic negative WSC southwest of Taiwan and the westward Ekman transport through the LS during the winter half of the year of 2020–2021 both had large values beyond their historical maxima. Hence wind forcing is regarded as the primary mechanism during this event. Alternating CEs and ACEs approaching on the east of the LS were identified, so the interaction between the Kuroshio and the impinging CEs at the proper locations made additional contributions to the enhancement of the KCL.
The accompanying ACE had a distinctive feature of a cold-core structure at the surface layer, so as to be categorized as a CC-ACE, which has rarely been reported in relation to the KCL previously. The temperature difference between the cold core and outer warm ring was maintained for three months and reached a maximum value of 1.7 °C in late January 2021. Given the unfavorable condition of strong anticyclonic wind forcing, the generation and long duration of the CC-ACE was due to the sustained horizontal entrainment supported by the warm water from both the Kuroshio intrusion and the NWLCC successively.

Author Contributions

Conceptualization, J.H.; methodology, Z.S.; software, J.Z.; validation, Z.C.; formal analysis, L.Y.; investigation, X.C. and X.W.; writing—original draft preparation, Z.S.; writing—review and editing, J.H.; visualization, Z.S. All authors have read and agreed to the published version of the manuscript.

Funding

This study was jointly supported by the National Natural Science Foundation of China (41776027, 91958203 and 92058205).

Data Availability Statement

The remote sensing datasets for this research are publicly available, and downloaded from ftp://my.cmems-du.eu and ftp://nrt.cmems-du.eu. The SSH data are at the subdirectory of/Core/SEALEVEL_GLO_PHY_L4_NRT_OBSERVATIONS_008_046; the SST data are at the subdirectory of/Core/SST_GLO_SST_L4_NRT_OBSERVATIONS_010_001; the SSW data are at the subdirectory of/Core/WIND_GLO_WIND_L4_NRT_OBSERVATIONS_012_004. We appreciate the provision of these publicly available datasets.

Acknowledgments

We thank three anonymous reviewers and the Editor for insightful comments that help to improve an earlier version of this manuscript.

Conflicts of Interest

The authors declare no conflict of interest. The funders had no role in the design of the study; in the collection, analyses, or interpretation of data; in the writing of the manuscript, or in the decision to publish the results.

References

  1. Metzger, E.J.; Hurlburt, H.E. Coupled dynamics of the South China Sea, the Sulu Sea, and the Pacific Ocean. J. Geophys. Res. Space Phys. 1996, 101, 12331–12352. [Google Scholar] [CrossRef]
  2. Qu, T. Upper-Layer circulation in the South China Sea. J. Phys. Oceanogr. 2000, 30, 1450–1460. [Google Scholar] [CrossRef]
  3. Shaw, P.-T. The seasonal variation of the intrusion of the Philippine sea water into the South China Sea. J. Geophys. Res. Space Phys. 1991, 96, 821–827. [Google Scholar] [CrossRef]
  4. Centurioni, L.R.; Niiler, P.P.; Lee, D.-K. Observations of Inflow of Philippine Sea Surface Water into the South China Sea through the Luzon Strait. J. Phys. Oceanogr. 2004, 34, 113–121. [Google Scholar] [CrossRef]
  5. Qiu, D.; Yang, T.; Guo, Z. A west-flowing current in the northern part of the South China Sea in summer. J. Trop. Oceanogr. 1984, 3, 65–73. [Google Scholar]
  6. Li, L.; Wu, B. A Kuroshio loop in South China Sea?—On circulations of the northeastern South China Sea. J. Oceanogr. Taiwan Strait 1989, 8, 89–95. [Google Scholar]
  7. Caruso, M.J.; Gawarkiewicz, G.G.; Beardsley, R.C. Interannual variability of the Kuroshio intrusion in the South China Sea. J. Oceanogr. 2006, 62, 559–575. [Google Scholar] [CrossRef]
  8. Nan, F.; Xue, H.; Chai, F.; Shi, L.; Shi, M.; Guo, P. Identification of different types of Kuroshio intrusion into the South China Sea. Ocean Dyn. 2011, 61, 1291–1304. [Google Scholar] [CrossRef]
  9. Huang, Z.; Liu, H.; Hu, J.; Lin, P. A double-index method to classify Kuroshio intrusion paths in the Luzon Strait. Adv. Atmos. Sci. 2016, 33, 715–729. [Google Scholar] [CrossRef]
  10. Hwang, C.; Chen, S.-A. Circulations and eddies over the South China Sea derived from TOPEX/Poseidon altimetry. J. Geophys. Res. Space Phys. 2000, 105, 23943–23965. [Google Scholar] [CrossRef]
  11. Wang, G.; Su, J.; Chu, P. Mesoscale eddies in the South China Sea observed with altimeter data. Geophys. Res. Lett. 2003, 30, 2121. [Google Scholar] [CrossRef] [Green Version]
  12. Li, L.; Nowlin, W.D.; Jilan, S. Anticyclonic rings from the Kuroshio in the South China Sea. Deep Sea Res. Part I Oceanogr. Res. Pap. 1998, 45, 1469–1482. [Google Scholar] [CrossRef]
  13. Wang, D.; Xu, H.; Lin, J.; Hu, J. Anticyclonic eddies in the northeastern South China Sea during winter 2003/2004. J. Oceanogr. 2008, 64, 925–935. [Google Scholar] [CrossRef]
  14. Guo, J.; Yuan, Y.; Xiong, X.; Guo, B. Statistics of the mesoscale eddies on both sides of the Luzon Strait. Adv. Mar. Sci. 2007, 25, 139–148. [Google Scholar]
  15. Jia, Y.; Chassignet, E.P. Seasonal variation of eddy shedding from the Kuroshio intrusion in the Luzon Strait. J. Oceanogr. 2011, 67, 601–611. [Google Scholar] [CrossRef]
  16. Nan, F.; Xue, H.; Xiu, P.; Chai, F.; Shi, M.; Guo, P. Oceanic eddy formation and propagation southwest of Taiwan. J. Geophys. Res. Space Phys. 2011, 116, 12045. [Google Scholar] [CrossRef] [Green Version]
  17. Wang, D.; Fang, G.; Qiu, T. The characteristics of eddies shedding from Kuroshio in the Luzon Strait. Oceanol. Limnol. Sin. 2017, 48, 673–681. [Google Scholar]
  18. Metzger, E.J.; Hurlburt, H.E. The Nondeterministic Nature of Kuroshio Penetration and Eddy Shedding in the South China Sea. J. Phys. Oceanogr. 2001, 31, 1712–1732. [Google Scholar] [CrossRef]
  19. Yuan, D.; Han, W.; Hu, D. Surface Kuroshio path in the Luzon Strait area derived from satellite remote sensing data. J. Geophys. Res. Space Phys. 2006, 111. [Google Scholar] [CrossRef] [Green Version]
  20. Sheremet, V.A. Hysteresis of a Western Boundary Current Leaping across a Gap. J. Phys. Oceanogr. 2001, 31, 1247–1259. [Google Scholar] [CrossRef]
  21. Yuan, D.; Wang, Z. Hysteresis and Dynamics of a Western Boundary Current Flowing by a Gap Forced by Impingement of Mesoscale Eddies. J. Phys. Oceanogr. 2011, 41, 878–888. [Google Scholar] [CrossRef]
  22. Gan, J.; Qu, T. Coastal jet separation and associated flow variability in the southwest South China Sea. Deep Sea Res. Part I Oceanogr. Res. Pap. 2008, 55, 1–19. [Google Scholar] [CrossRef]
  23. Xiu, P.; Chai, F.; Shi, L.; Xue, H.; Chao, Y. A census of eddy activities in the South China Sea during 1993–2007. J. Geophys. Res. Space Phys. 2010, 115, 03012. [Google Scholar] [CrossRef] [Green Version]
  24. Wang, G.; Chen, D.; Su, J. Winter Eddy Genesis in the Eastern South China Sea due to Orographic Wind Jets. J. Phys. Oceanogr. 2008, 38, 726–732. [Google Scholar] [CrossRef]
  25. Wu, C.-R.; Hsin, Y.-C. The forcing mechanism leading to the Kuroshio intrusion into the South China Sea. J. Geophys. Res. Space Phys. 2012, 117. [Google Scholar] [CrossRef] [Green Version]
  26. Jie, Z.; De-Hai, L. Response of the Kuroshio Current to Eddies in the Luzon Strait. Atmos. Ocean. Sci. Lett. 2010, 3, 160–164. [Google Scholar] [CrossRef]
  27. Lien, R.-C.; Ma, B.; Cheng, Y.-H.; Ho, C.-R.; Qiu, B.; Lee, C.M.; Chang, M.-H. Modulation of Kuroshio transport by mesoscale eddies at the Luzon Strait entrance. J. Geophys. Res. Oceans 2014, 119, 2129–2142. [Google Scholar] [CrossRef]
  28. Zhong, L.; Hua, L.; Luo, D. The Eddy–Mean Flow Interaction and the Intrusion of Western Boundary Current into the South China Sea–Type Basin in an Idealized Model. J. Phys. Oceanogr. 2016, 46, 2493–2527. [Google Scholar] [CrossRef]
  29. Hu, J.; Zheng, Q.; Sun, Z.; Tai, C.-K. Penetration of nonlinear Rossby eddies into South China Sea evidenced by cruise data. J. Geophys. Res. Space Phys. 2012, 117. [Google Scholar] [CrossRef]
  30. Zheng, Q.; Tai, C.-K.; Hu, J.; Lin, H.; Zhang, R.-H.; Su, F.-C.; Yang, X. Satellite altimeter observations of nonlinear Rossby eddy–Kuroshio interaction at the Luzon Strait. J. Oceanogr. 2011, 67, 365–376. [Google Scholar] [CrossRef]
  31. Chang, Y.-L.; Miyazawa, Y.; Guo, X. Effects of the STCC eddies on the Kuroshio based on the 20-year JCOPE2 reanalysis results. Prog. Oceanogr. 2015, 135, 64–76. [Google Scholar] [CrossRef]
  32. Nan, F.; Xue, H.; Chai, F.; Wang, D.; Yu, F.; Shi, M.; Guo, P.; Xiu, P. Weakening of the Kuroshio Intrusion into the South China Sea over the Past Two Decades. J. Clim. 2013, 26, 8097–8110. [Google Scholar] [CrossRef] [Green Version]
  33. Yang, Q.; Liu, H.; Lin, P. The effect of oceanic mesoscale eddies on the looping path of the Kuroshio intrusion in the Luzon Strait. Sci. Rep. 2020, 10, 636. [Google Scholar] [CrossRef]
  34. Yasuda, I.; Ito, S.-I.; Shimizu, Y.; Ichikawa, K.; Ueda, K.-I.; Honma, T.; Uchiyama, M.; Watanabe, K.; Sunou, N.; Tanaka, K.; et al. Cold-Core Anticyclonic Eddies South of the Bussol’ Strait in the Northwestern Subarctic Pacific. J. Phys. Oceanogr. 2000, 30, 1137–1157. [Google Scholar] [CrossRef]
  35. Ji, J.; Dong, C.; Zhang, B.; Liu, Y. An oceanic eddy statistical comparison using multiple observational data in the Kuroshio Extension region. Acta Oceanol. Sin. 2017, 36, 1–7. [Google Scholar] [CrossRef]
  36. Sun, W.; Dong, C.; Tan, W.; He, Y. Statistical Characteristics of Cyclonic Warm-Core Eddies and Anticyclonic Cold-Core Eddies in the North Pacific Based on Remote Sensing Data. Remote Sens. 2019, 11, 208. [Google Scholar] [CrossRef] [Green Version]
  37. McGillicuddy, D. Formation of Intrathermocline Lenses by Eddy–Wind Interaction. J. Phys. Oceanogr. 2015, 45, 606–612. [Google Scholar] [CrossRef] [Green Version]
  38. Good, S.; Fiedler, E.; Mao, C.; Martin, M.J.; Maycock, A.; Reid, R.; Roberts-Jones, J.; Searle, T.; Waters, J.; While, J.; et al. The Current Configuration of the OSTIA System for Operational Production of Foundation Sea Surface Temperature and Ice Concentration Analyses. Remote Sens. 2020, 12, 720. [Google Scholar] [CrossRef] [Green Version]
  39. Lumpkin, R.; Özgökmen, T.; Centurioni, L. Advances in the Application of Surface Drifters. Annu. Rev. Mar. Sci. 2017, 9, 59–81. [Google Scholar] [CrossRef] [Green Version]
  40. Elipot, S.; Lumpkin, R.; Perez, R.C.; Lilly, J.M.; Early, J.J.; Sykulski, A. A global surface drifter data set at hourly resolution. J. Geophys. Res. Oceans 2016, 121, 2937–2966. [Google Scholar] [CrossRef]
  41. Chaigneau, A.; Eldin, G.; Dewitte, B. Eddy activity in the four major upwelling systems from satellite altimetry (1992–2007). Prog. Oceanogr. 2009, 83, 117–123. [Google Scholar] [CrossRef]
  42. Chelton, D.B.; Schlax, M.G.; Samelson, R.M. Global observations of nonlinear mesoscale eddies. Prog. Oceanogr. 2011, 91, 167–216. [Google Scholar] [CrossRef]
  43. Hu, J.; Kawamura, H.; Hong, H.; Qi, Y. A Review on the Currents in the South China Sea: Seasonal Circulation, South China Sea Warm Current and Kuroshio Intrusion. J. Oceanogr. 2000, 56, 607–624. [Google Scholar] [CrossRef]
  44. Zu, T.; Gan, J.; Erofeeva, S.Y. Numerical study of the tide and tidal dynamics in the South China Sea. Deep Sea Res. Part I Oceanogr. Res. Pap. 2008, 55, 137–154. [Google Scholar] [CrossRef]
  45. Farris, A.; Wimbush, M. Wind-induced Kuroshio intrusion into the South China Sea. J. Oceanogr. 1996, 52, 771–784. [Google Scholar] [CrossRef]
  46. Zhang, Z.; Zhao, W.; Qiu, B.; Tian, J. Anticyclonic Eddy Sheddings from Kuroshio Loop and the Accompanying Cyclonic Eddy in the Northeastern South China Sea. J. Phys. Oceanogr. 2017, 47, 1243–1259. [Google Scholar] [CrossRef] [Green Version]
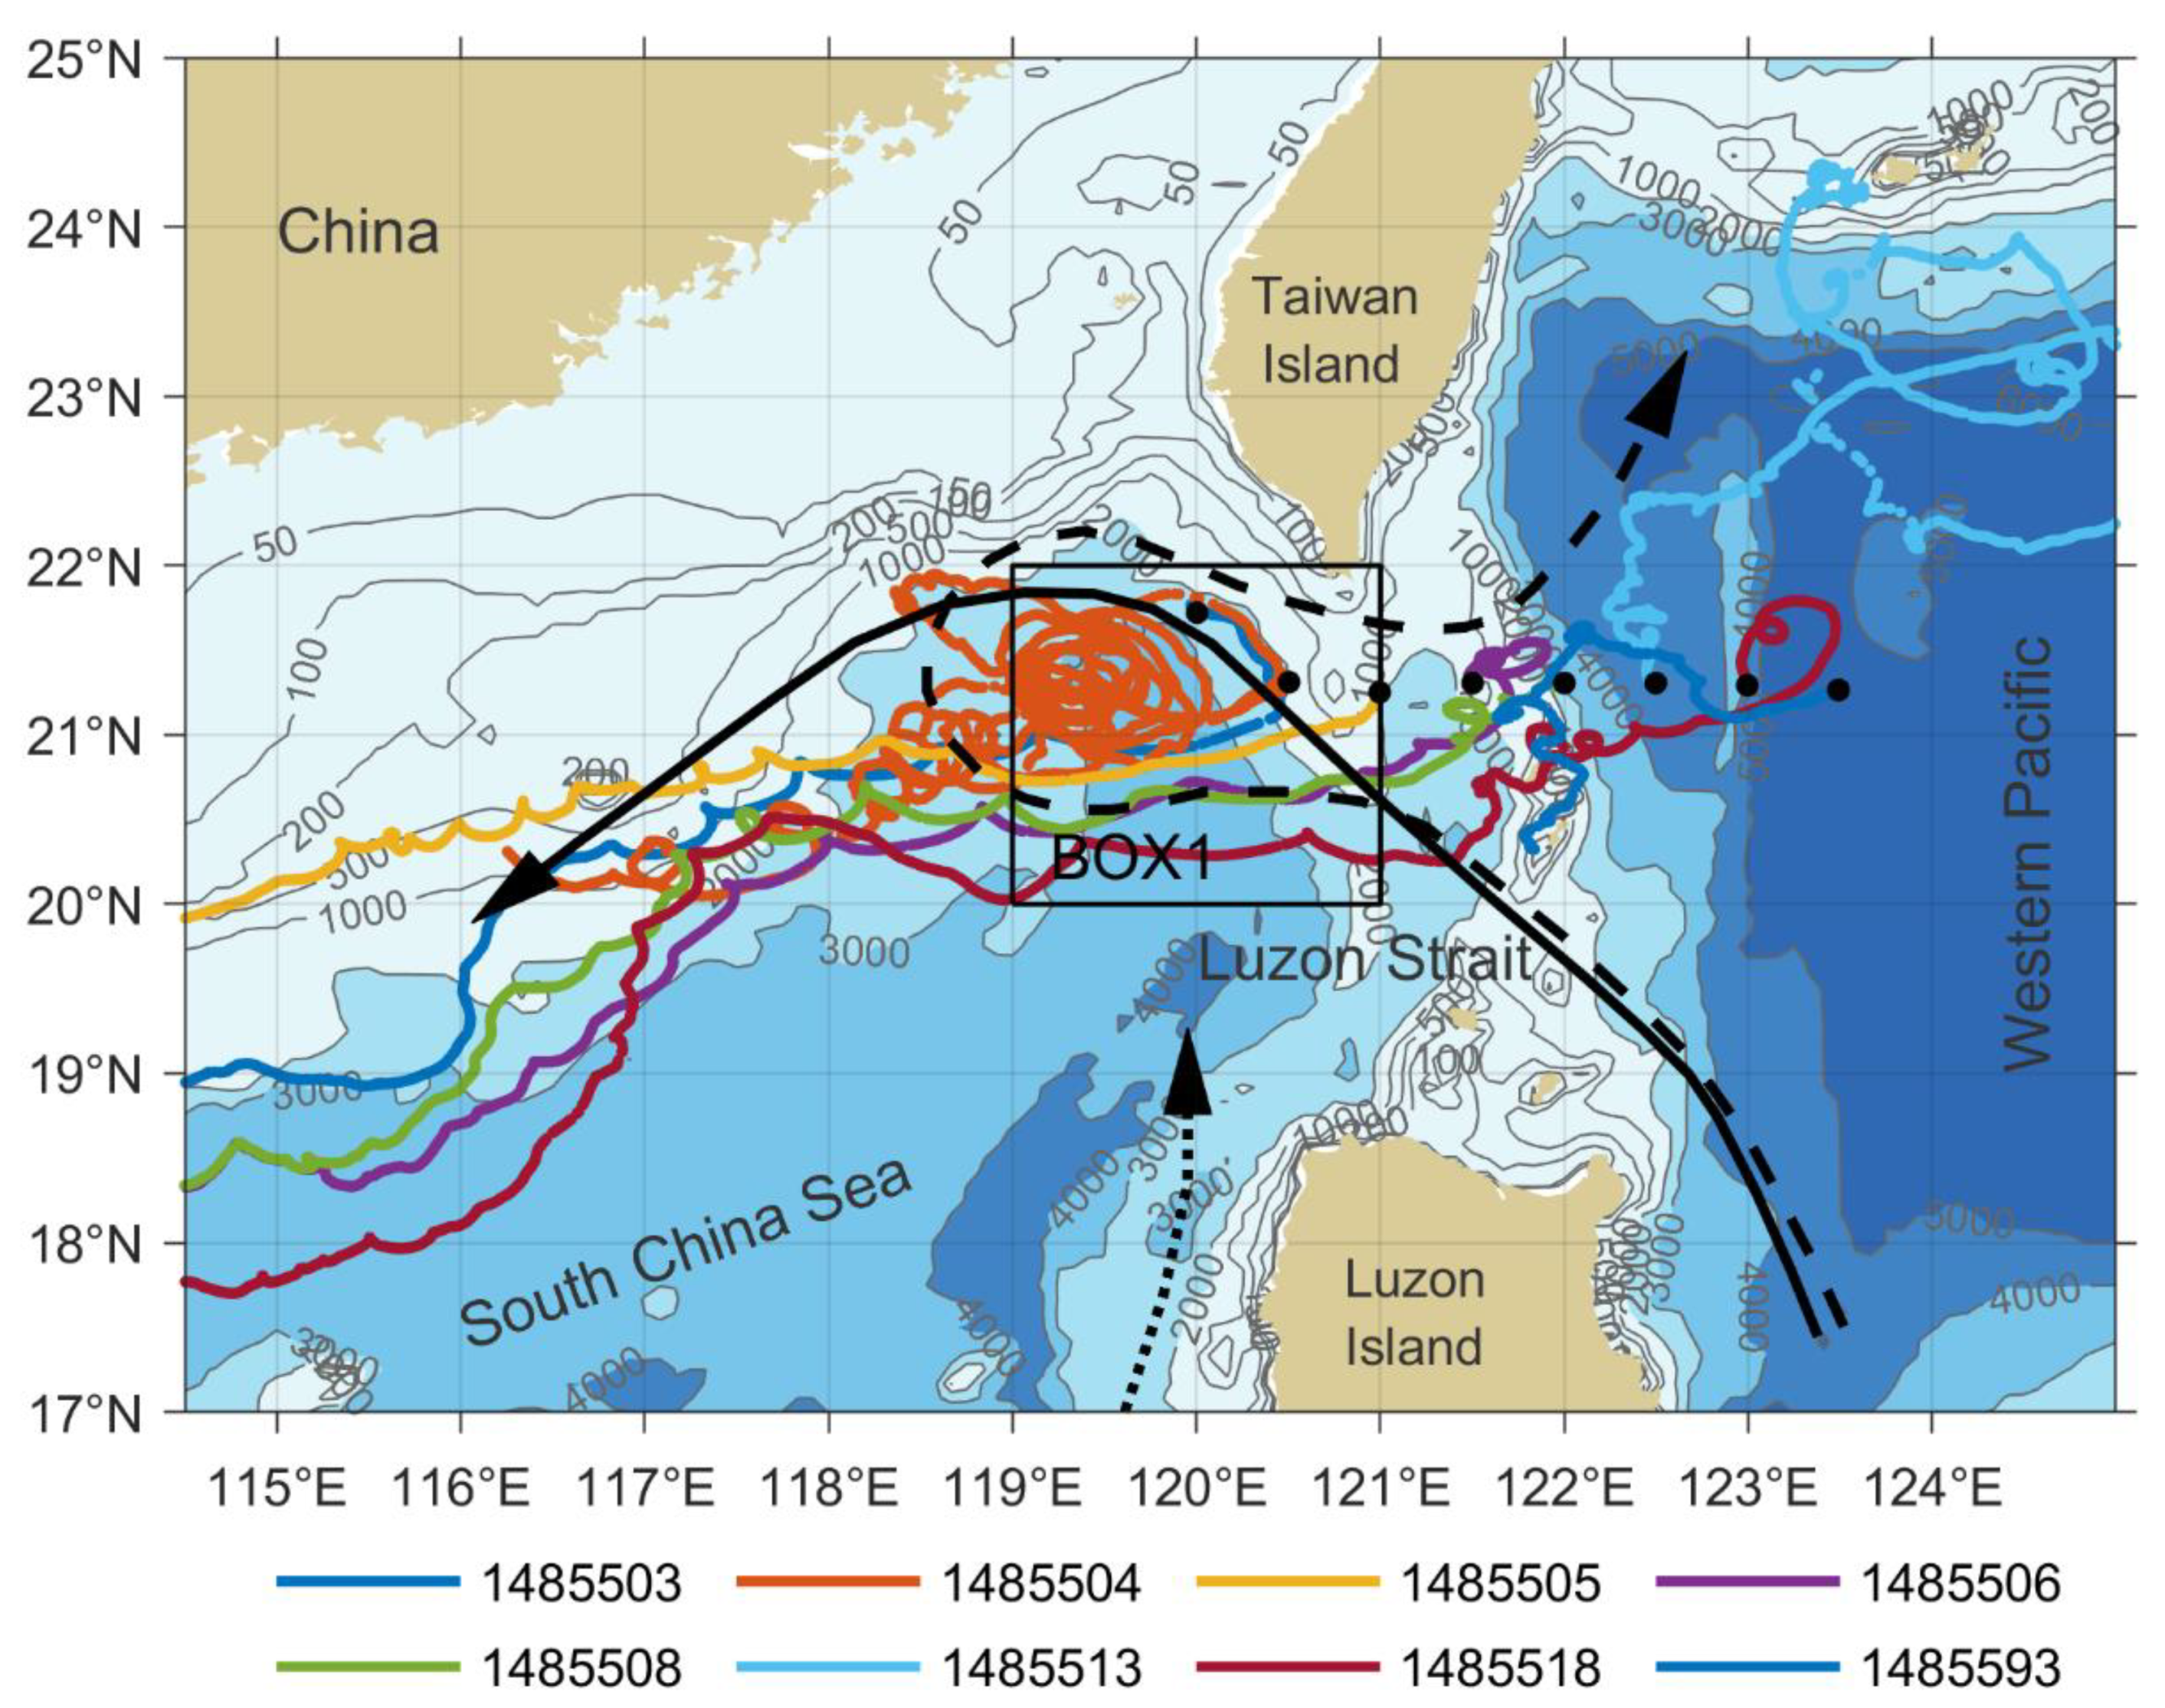
Figure 1. Topography (filled contours) in the LS and its surrounding area. The rectangle of BOX1 is the integral areas for the DI. Colored lines are the trajectories of the eight drifters deployed in December 2020. The SCSBK, KCL and NWLCC are denoted as black solid arrow, dashed arrow and dotted arrow, respectively.
Remotesensing 13 02645 g001
Figure 2. Time series of daily KCI and KWI from 1993 to 2021. The ticks on the time axis stand for the beginning of the year denoted by corresponding labels. Horizontal dash lines stand for the mean value (μ) and standard deviation span ( μ ± σ ) of the two indices. KCI values larger than μ + σ are shaded in blue, and KWI values less than μ σ are shaded in red. Nine strong KWEP events are numbered from 1 to 9, and their time spans are shaded in green.
Remotesensing 13 02645 g002
Figure 3. Time series of monthly averaged ADT (filled contours) and the derivative surface geostrophic current (black vectors) in the LS and the surrounding area. The panels of (af) are sequentially for the months from October 2020 to March 2021. A1~A3 are three ACEs, and C4 is a CE.
Remotesensing 13 02645 g003
Figure 4. Time series of daily the KCI and KWI (a) and properties of the ACE (b) from December 2020 to May 2021. The ticks on the time axis stand for the beginning of the month denoted by corresponding labels. Horizontal solid lines in panel (a) stand for the mean value (μ), and horizontal dash lines stand for standard deviation span ( μ ± σ ) of the two indices. KCI values larger than μ + σ are shaded in blue, and KWI values less than μ σ are shaded in red. In panel (b), ADT difference (delta ADT) between the eddy center and edge, diameter of the eddy and distance propagated from the start position are denoted as blue line, red line and magenta line, respectively.
Remotesensing 13 02645 g004
Figure 5. Time series of monthly averaged geostrophic current (vectors) superimposed on monthly averaged SST (filled contours) in the LS and the surrounding area. The panels of (ad) are sequentially for the months from December 2020 to March 2021. The locations of ACE A1 and CE C4 are denoted. The KCL and NWLCC are marked as thick white arrows in (b,c).
Remotesensing 13 02645 g005
Figure 6. (a,c,e) Floating speed along the drifter trajectories from 24 December 2020 to 7 January 2021, being divided into three 5-day segments and superimposed on the corresponding 5-day averaged geostrophic current speed (colored shading) and geostrophic current vector derived from ADT; (b,d,f) In-situ SST by drifters along the trajectories during the same segments, superimposed on the corresponding 5-day averaged SST (colored shading) by remote sensing. Black circles are the starting points of drifters at each segment, and the last two digits of the drifter number (i.e., 04 is for Drifter 1485504) are used to label drifters at each segment.
Remotesensing 13 02645 g006
Figure 7. (a) Time series of the eddy center position indicated by ADT (blue and red lines), and cold core center by remote-sensing SST (dark blue and dark red lines), and the floating position of Drifter 1485504 (light blue and light red lines); (b) Time series of SST at the cold core center (blue line) and outer ring (black line) by remote sensing, and the in-situ SST by Drifter 1485504 (light blue line). The ticks on the time axis stand for the beginning of the month denoted by corresponding labels.
Remotesensing 13 02645 g007
Figure 8. Time series of monthly averaged SSW (black vectors, m/s) and WSC (filled contours, 10−7 N/m3) in the LS and surrounding area. The panels of (af) are sequentially for the months from September 2020 to February 2021. The black rectangle is the same as BOX1 in Figure 1.
Remotesensing 13 02645 g008
Figure 9. (a) Time series of daily KCIWS and KWIWS (black lines) from 1993 to 2021. Horizontal dash lines stand for the mean value (μ) and standard deviation span ( μ ± σ ) of the two indices. KCIWS larger than μ + σ are shaded in blue, and KWIWS lower than μ σ are shaded in red. The green dot line is the averaged KWIWS in the winter half of the year over October to March; (b) Time-series of daily Ekman transport (black line) through the LS from 1993 to 2021. Negative value means westward transport into the SCS. The red dot line is the averaged Ekman transport in the winter half of the year over October to March. The ticks on the time axis stand for the beginning of the year denoted by corresponding labels.
Remotesensing 13 02645 g009
Figure 10. SLA distribution and eddy activities during winter 2020–2021. (ad) are sequentially for 15 October, 17 November, 15 December 2020 and 10 February 2021. A1~A3 are ACEs, and C1~C3 are CEs.
Remotesensing 13 02645 g010
Table 1. SUCE drifters deployed in the LS in December 2020.
Drifter No.Deployment DateDeployment LongitudeDeployment LatitudeEnd Date 1
148550324 December 2020120.0°E21.8°N30 January 2021
148550424 December 2020120.5°E21.3°N31 March 2021
148550526 December 2020121.0°E21.3°N15 February 2021
148550626 December 2020121.5°E21.3°N30 January 2021
148550826 December 2020122.0°E21.3°N30 January 2021
148551326 December 2020122.5°E21.3°N31 March 2021
148551826 December 2020123.0°E21.3°N30 January 2021
148559326 December 2020123.5°E21.3°N8 January 2021
1 End date of data used in Figure 1.
Table 2. Strong KWEP events from 1993 to 2021 and their characteristics.
Event No.Start DateEnd DatePeriod (day)Minimum KWI 1Integral KWI 2
12 November 199410 January 199569−3.82−212.6
222 February 19964 May 199672−4.43−230.8
330 October 19968 January 199770−4.96−269.2
418 January 199912 March 199953−3.49−164.3
520 December 199914 February 200056−3.55−165.1
627 November 201124 January 201258−4.89−217.8
724 November 201610 February 201778−4.35−274.5
88 November 20195 January 202058−4.76−190.7
94 December 20204 March 202190−4.38−316.0
1 minimum KWI in 105 m2/s, 2 Integral of KWI during the event in 105 m2/s day.
Table 3. Kinematic properties of the ACEs shed from the KCL in winter, estimated by previous and the present studies.
Wang et al. [11]Guo et al. [14]Jia et al. [15]Nan et al. [16]Wang et al. [17]Present Study
Diameter 1A: 244A: 225A: 160A: 128A: 166381
-M: 300M: 200M: 162M: 320
Amplitude 2A: 12--A: 12A: 1150
M: 32--M: 20M: 47
Distance 3A: 195--A: 433A: 218>820
---M: 1879M: 1020
Lifespan 4A: 108--A: 75A: 29>182
-M: 57-M: 273M: 135
Speed 5A: 2.1A: 4.5A: 10.0A: 6.4A: 8.35.2
-M: 9.0M: 16.0M: 11.0M: 35.0
1 maximum diameter in km; 2 maximum amplitude in cm; 3 maximum distance propagated in km; 4 lifespan in day; 5 average propagating speed in cm/s; A stands for average value, and M stands for maximum value.
Publisher’s Note: MDPI stays neutral with regard to jurisdictional claims in published maps and institutional affiliations.